Diversity Monitoring and Pay Gaps Report 2024/25
We collect data for analysis and reporting each year. This is to ensure our policies and working practices are meeting our aims for an inclusive workplace and a diverse workforce.
Diversity Monitoring and Pay Gaps Report 2024/25
Introduction
Introduction
Data tables available for download here (87 KB Excel document)
Welcome to the Diversity Monitoring and Pay Gaps Report 2025, where we share our progress and commitments in building a more inclusive and representative workplace. This year, we’ve seen meaningful improvements across several key areas of diversity and inclusion, including reductions in our Gender, Ethnicity, and LGB+ (sexual orientation) Pay Gaps, and increased representation of Minority Ethnic and disabled colleagues.
The median Gender Pay Gap for 2025 is minus 9.7%, the Ethnicity Pay Gap and the LGB+ Pay Gap have both decreased from the previous year to 13.2%. The Disability Pay Gap has increased to 19.5%. The representation of Minority Ethnic staff has increased to 4% and staff declaring a disability has increased to 11.9%.
Our data collection has been enhanced through a new diversity declaration system and targeted engagement efforts, resulting in more robust and representative insights.
Our focus on the Positive Wellbeing and Mental Health of our staff progressed further this year with a programme of events to engage staff in understanding about their and others mental health. It is our aim to cultivate a workplace where we can end the stigma around mental health and effectively support one another.
These improvements support our strategic goals under the Session 6 People and Culture Strategy, particularly our priority to create a diverse, respectful, and inclusive working environment.
We remain committed to transparency and continuous improvement. This report not only meets our statutory duties under the Equality Act 2010 but also serves as a foundation for future action. It reflects our belief that everyone should feel safe, valued, and heard at work—and that our organisation should mirror the diversity of Scottish society.
As we move forward, we will continue to review our practices in light of legal developments, including the Supreme Court judgment in For Women Scotland v Scottish Ministers, and any updates to statutory guidance from the Equality and Human Rights Commission.
Together, we are working to foster a culture of inclusion, wellbeing, and equity—where diversity is celebrated and everyone has the opportunity to thrive.
Session 6 People and Culture Strategy Priority
Creating a diverse, respectful and inclusive working environment
We want working life to be a positive experience for everyone. Where all colleagues feel safe and able to raise concerns and potential risks, knowing that they will be supported and heard. We will speak out against injustices even when it doesn’t feel easy and keep focus on those affected. We will continue to work towards our goal of building a diverse organisation. One that reflects wider Scottish society.
Our aims are for:
- An inclusive, welcoming, and vibrant culture in which we all feel valued, respected, and engaged
- Increased diversity at all levels
- Colleagues feel they have a voice which is heard
Our actions to achieve this will be underpinned by our Values and Behaviours Framework.
Aithisg air Dearcnachadh Iomadachd agus Beàrnan Pàighidh 2025
Fàilte chun na h-Aithisg air Dearcnachadh Iomadachd agus Beàrnan Pàighidh 2025, far a bheil sinn a’ co-phàirteachadh ar n-adhartais agus gealltanasan a thaobh àite-obrach a thogail a tha nas in-ghabhalaiche agus nas riochdachaile. Am-bliadhna, tha sinn air leasachaidhean brìoghmhor fhaicinn tarsainn grunn phrìomh raointean de dh’iomadachd agus in-ghabhalachd, a’ gabhail a-steach lùghdachaidhean ann am Beàrnan Pàighidh a thaobh Gnè, Cinneadh agus LGB+ (aidmheil fheiseil), agus riochdachadh meudaichte am measg ar co-luchd-obrach a tha bho Mhion-shluaghan no a tha ciorramach.
Ann an 2025, tha a’ Bheàrn-Pàighidh meadhain a thaobh Gnè aig –9.7%, tha an dà chuid a’ Bheàrn-Pàighidh a thaobh Cinneadh agus a’ Bheàrn-Pàighidh a thaobh LGB+ air lùghdachadh bho an-uiridh gu 13.2%. Tha a’ Bheàrn-Pàighidh a thaobh Ciorram air a dhol am meud gu 19.5%. Tha riochdachadh luchd-obrach bho Mhion-shluaghan air a dhol am meud gu 4% agus tha luchd-obrach a tha ag ràdh gu bheil ciorram orra air a dhol am meud gu 11.9% rè ùine na h-aithisge.
Fhuaireadh piseach air an dàta a tha sinn a’ tional tron t-siostam ùr againn airson foirghill iomadachd agus tro oidhirpean conaltraidh targaidichte, agus mar thoradh air sin tha geur-bheachdan nas treasa agus nas riochdachaile againn.
Tha sinn a’ cur fòcas air Sunnd Deimhinneach agus Slàinte-inntinn ar luchd-obrach agus rinn sinn tuilleadh adhartais air seo am-bliadhna le prògram de thachartasan gus barrachd tuigse a bhrosnachadh am measg luchd-obrach mu an slàinte-inntinn-san agus slàinte-inntinn chàich. Tha sinn ag amas air àite-obrach a bhrosnachadh far am faod sinn crìoch a chur air an stiogma mu shlàinte-inntinn agus taic a thoirt gu h-èifeachdach do chàch a chèile.
Tha na leasachaidhean seo a’ toirt taic do na h-amasan ro-innleachdail againn fon Ro-innleachd Seisean 6 airson Daoine agus Cultar, gu h-àraid am prìomhachas a thathar a’ toirt do chruthachadh àrainneachd obrach a tha eadar-mheasgte, spèiseil agus in-ghabhalach.
Tha sinn a’ cumail oirnn a bhith an geall air trìd-shoilleireachd agus leasachadh leantainneach. Chan ann a-mhàin gum bi an aithisg seo a’ coileanadh ar dleastanasan reachdail fo Achd na Co-ionannachd 2010 ach gum bi i mar bhun-stèidh airson ghnìomhan san àm ri teachd. Tha an aithisg seo a’ nochdadh mar a tha sinn a’ creidsinn gum bu chòir don h-uile duine a bhith a’ faireachdainn sàbhailte, gu bheilear a’ cur meas orra agus gu bheilear gan cluinntinn san àite-obrach — agus gum bu chòir don bhuidhinn againn a bhith a’ taisbeanadh iomadachd comann-sòisealta na h-Alba.
Fhad ’s a tha sinn a’ gluasad air adhart, leanaidh sinn oirnn a bhith a’ dèanamh lèirmheas air na cleachdaidhean againn mar thoradh air leasachaidhean laghail, nam measg breith Àrd-chùirt na Rìoghachd Aonaichte sa chùis For Women Scotland v Scottish Ministers, agus ath-ùrachadh sam bith do stiùireadh reachdail bho Chomisean na Co-ionannachd is Chòraichean Daonna.
Còmhla, tha sinn ag obair air cultar altramadh de in-ghabhalachd, sunnd agus cothromas — far a bheilear a’ toirt cliù air iomadachd agus far a bheil cothrom aig a h-uile a bhith a’ soirbheachadh.
How did we do this year?
How did we do this year?
Our people and Diversity Pay Gaps - annual change summary
This provides a brief summary of the changes in our staff group and diversity pay gaps at 31 March 2024 and 31 March 2025. Analysis of the results can be found in the Our People and Diversity Pay Gaps sections of this report.
| 2024 | 2025 | Change | |
|---|---|---|---|
| Staff number | 610 | 632 | Increase |
| Full time equivalent (FTE) | 569 | 582.2 | Increase |
Staff group
| 2024 % of staff (where applicable) | 2025 % of staff (where applicable) | Change (as proportion of staff group where applicable) | |
|---|---|---|---|
| Age (16-24) | 1.6% | 1.3% | Decrease |
| Median age of staff group | 47 years | 46 years | Decrease |
| Disability (yes) | 11.5% | 11.9% | Increase |
| Gender reassign - trans (yes) | 0.5% | 0.5% | No change |
| Race (Minority Ethnic) | 3.1%* | 4% | Increase |
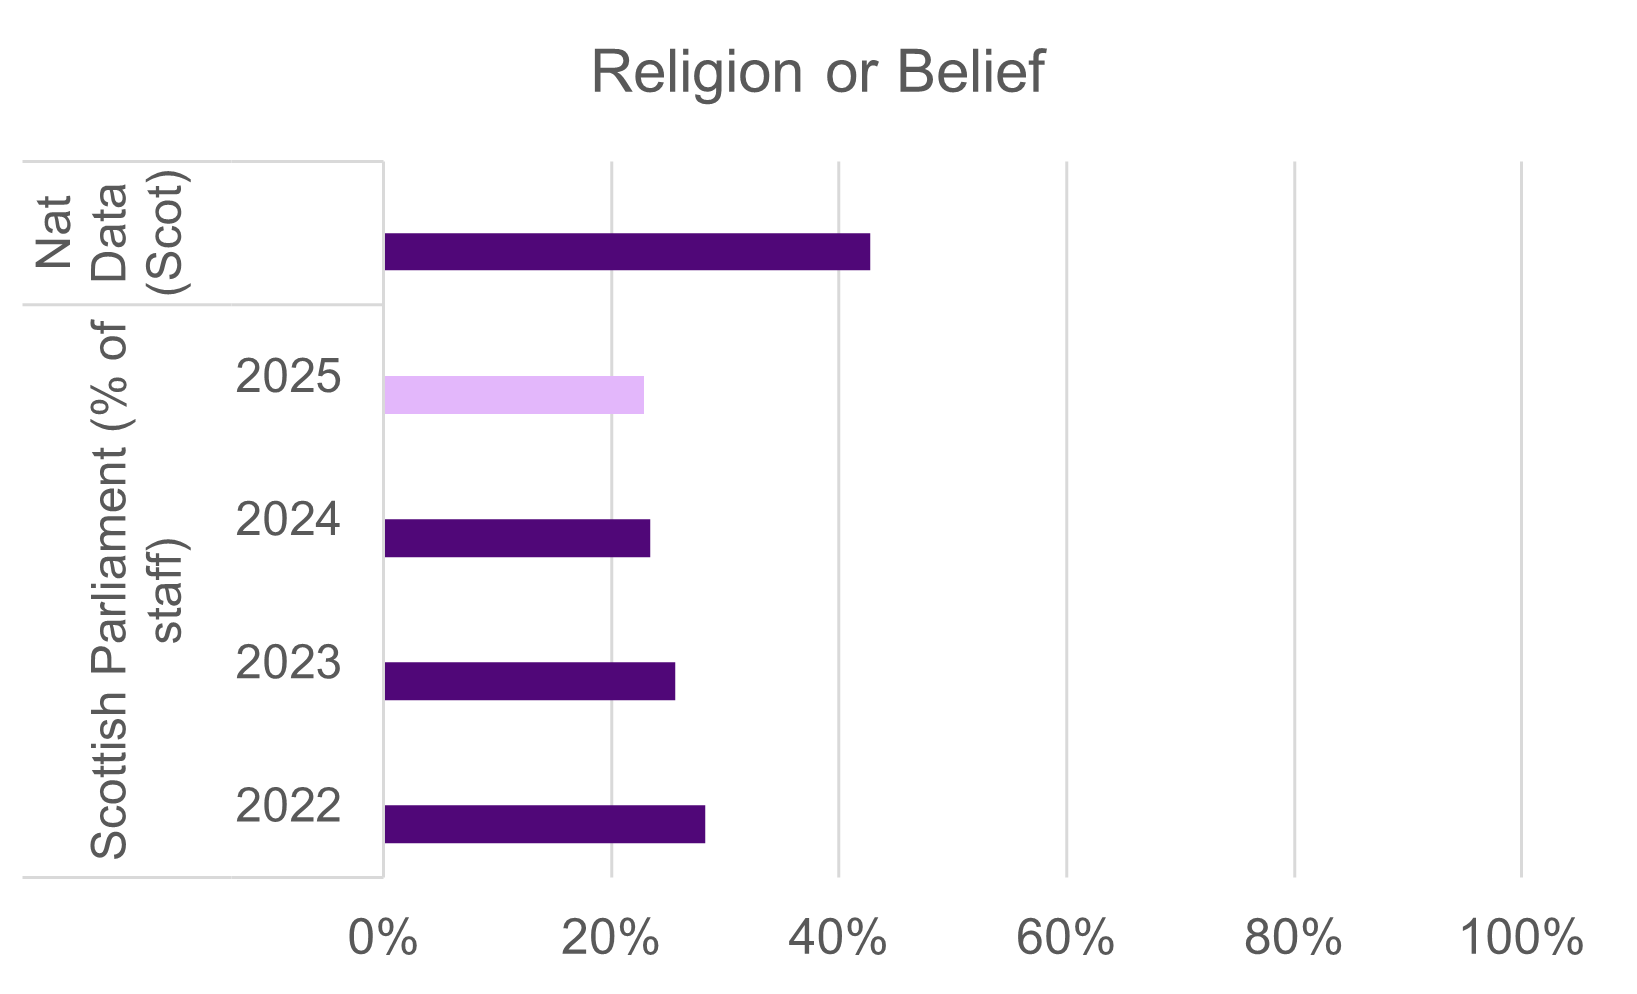
| Religion (yes) | 23.4% | 22.9% | Decrease |
| Sex (male) | 43% | 43% | No change |
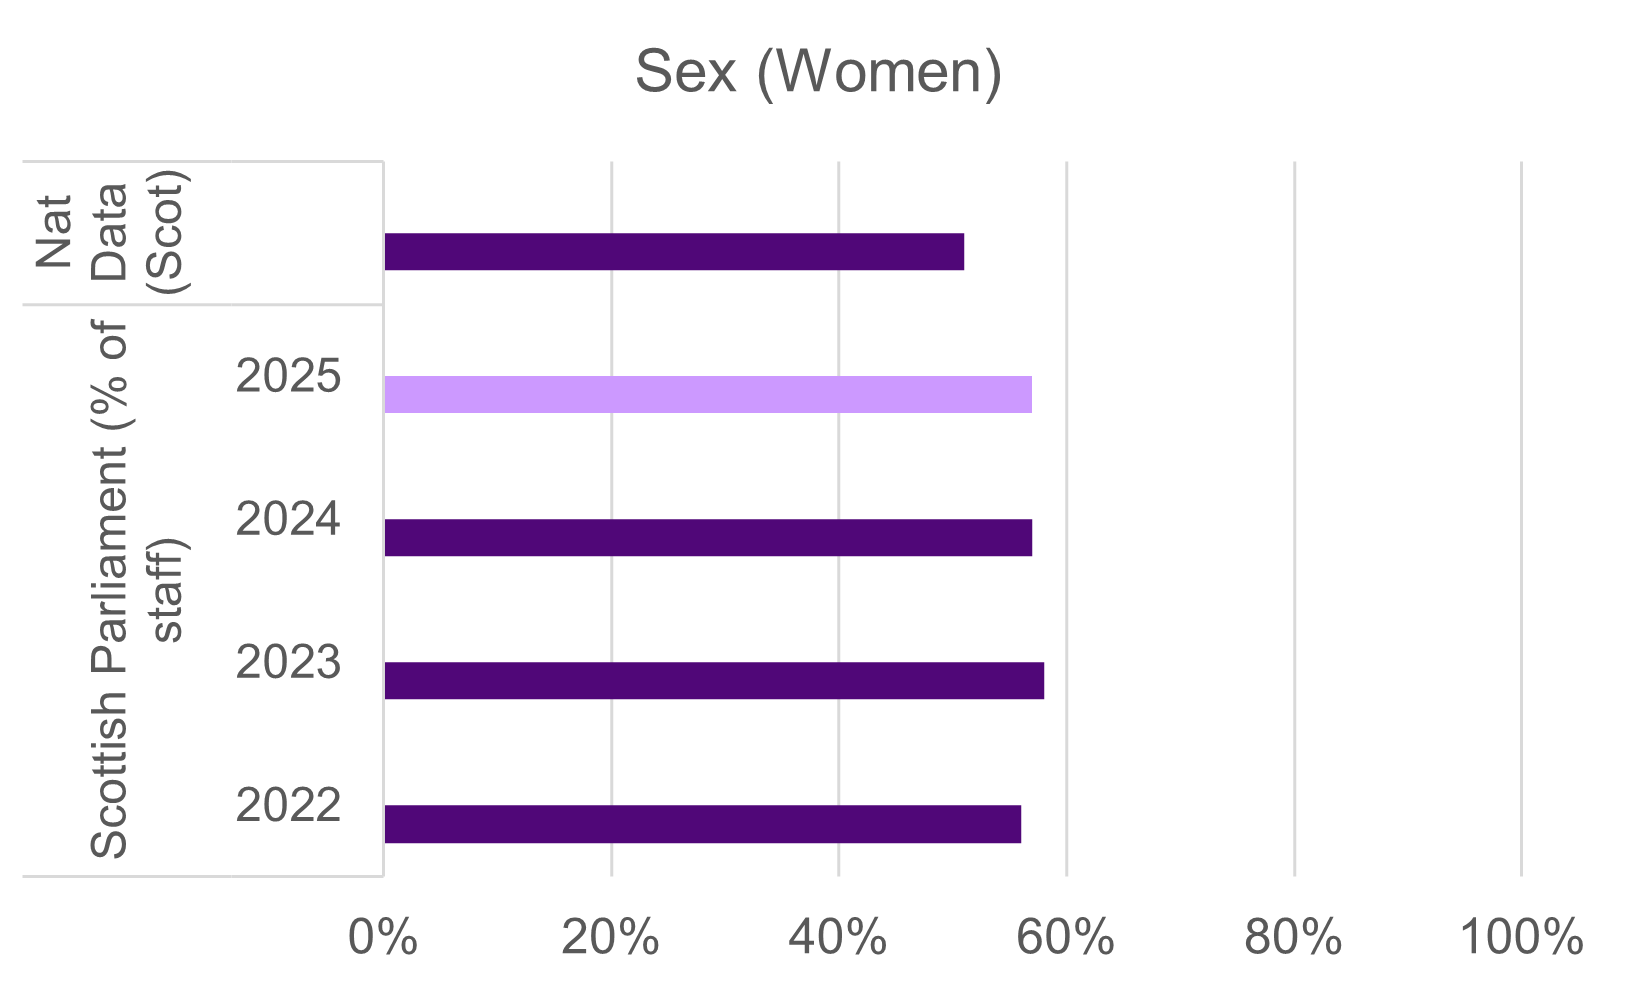
| Sex (female) | 57% | 57% | No change |
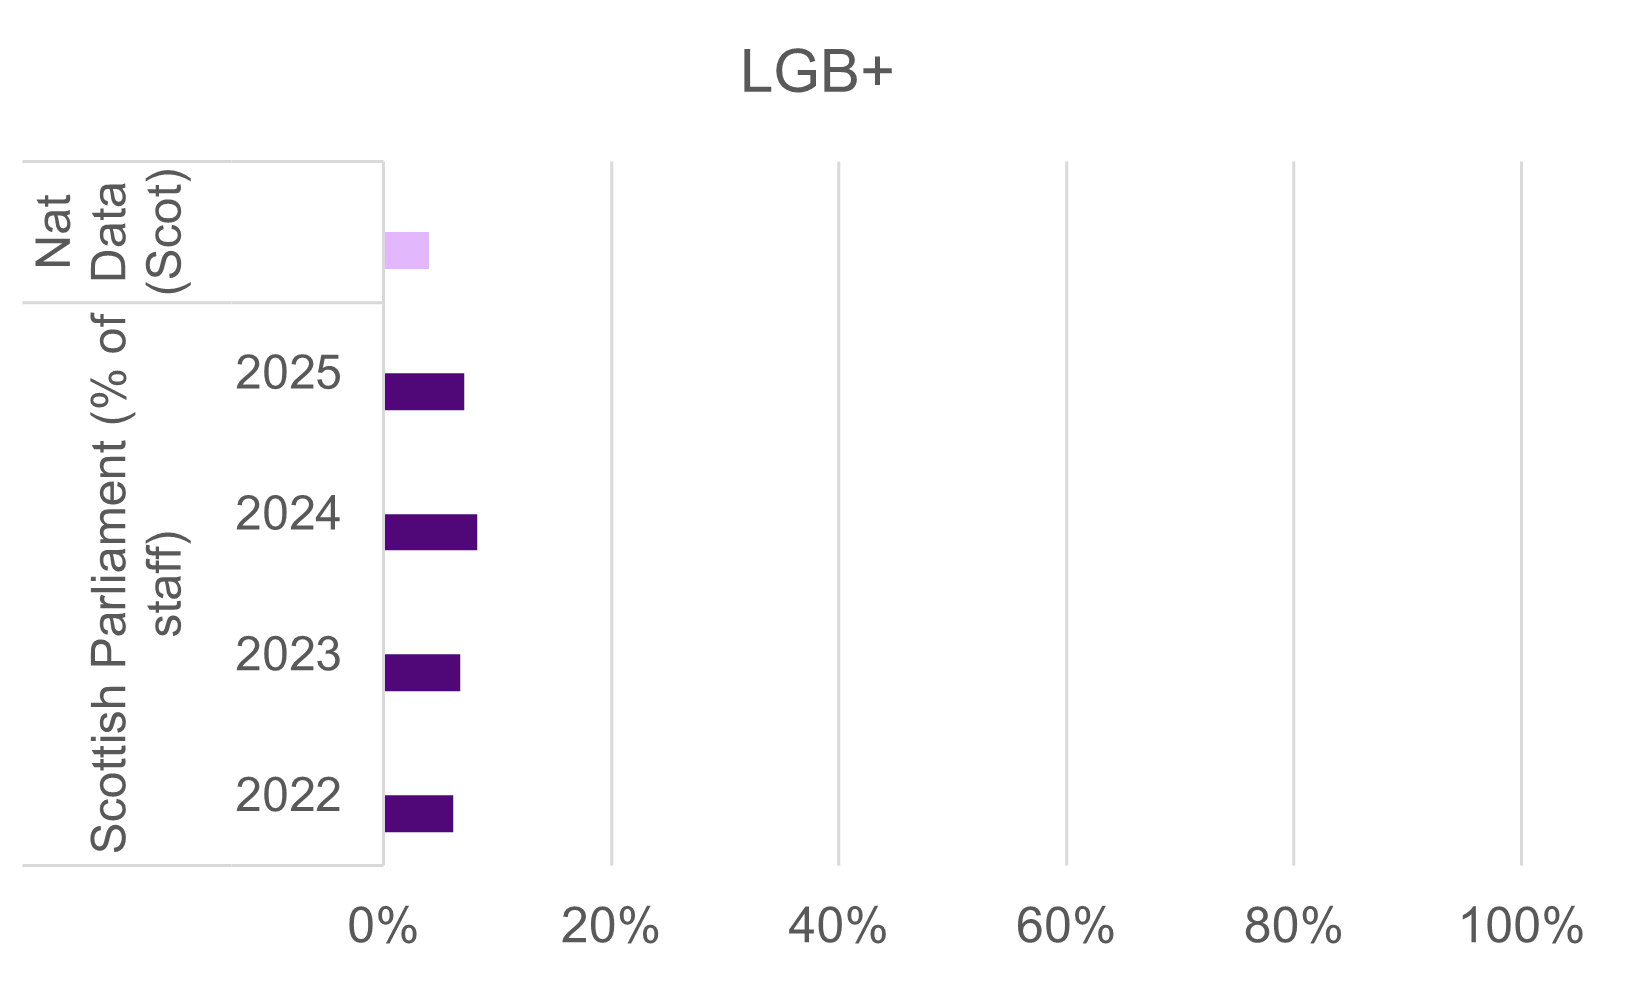
| Sexual orientation (LGB+) | 8.2% | 7.1% | Decrease |
Diversity pay gaps
| 2024 | 2025 | Change | |
|---|---|---|---|
| Gender Pay Gap | 0% | -9.7% | Decrease |
| Ethnicity Pay Gap | 17.3%* | 13.2% | Decrease |
| Disability Pay Gap | 13.2% | 19.5% | Increase |
| LGB+ Pay Gap | 20.1% | 13.2% | Decrease |
*In the 2024 reporting year there was a reduction in the data available about the ethnicity of our staff group. This is improved for the 2025 reporting year.
Our Activities
Our activities over the past year (1 April 2024 to 31 March 2025) in delivering on the diversity aims of the Session 6 People and Culture Strategy have included:
Developing future workforce and leaders
We developed a new Learning Framework – As a values-driven organisation, we’re committed to fostering a culture where learning and development (L&D) are not just encouraged but embedded into everything we do. By investing strategically in L&D, we’re unlocking greater returns and driving high-impact performance across the organisation. It is our aim to create an exceptional colleague experience that attracts, grows, and retains diverse talent.
Creating a diverse, respectful, and inclusive working environment
The Scottish Parliamentary Corporate Body was re-accredited as a Disability Confident Leader in 2025. We continue to join with other Leader organisations to share best practice and commit to supporting other organisations with their aim to attract and develop disabled people in the workplace.
We conducted a review of our recruitment processes using intersectional analysis to assess whether there are any barriers preventing specific groups of people from succeeding. The results have been used in the development of the Inclusive Recruitment tool for hiring managers and form part of our Management Essentials development.
Engaging and sustainable reward and recognition arrangements
We implemented a progressive pay award for 2024/25 and 2025/26 which ensured that staff on the lowest grades received a higher percentage pay increase.
We implemented changes to our job evaluation process to increase transparency, ensuring that the job evaluation and grading process was understandable, open and visible to all.
Feeling informed, involved, engaged, and supported
We have set up Staff Engagement Networks for our colleagues to provide improved opportunity for involvement in decision making and being better informed about why decisions are made.
As part of our commitment to enable a supportive workplace for colleagues experiencing perimenopause and menopause we have provided workshops and peer support opportunities for colleagues to learn about and share experiences of the perimenopause and menopause. Our managers are provided with guidance in making adjustments for colleagues.
We conducted an engagement campaign with our staff about the importance of providing their information to support our planning to meet our diversity and inclusion aims. The campaign resulted in improvements in the declaration rates from our staff group from a lowest response rate of 56.7% to a range of 69.1% to 73.1% for different questions. This has also allowed us to expand the categories of diversity monitoring data available for analysis and reporting to include socio-economic.
The organisational commitment to a workplace where we are Positive About Mental Health and Wellbeing has been progressed by the Wellbeing Project team over the past year. Staff have been provided with opportunity and encouraged to increase their knowledge and confidence about mental health and supporting one another. The aim for our communications and engagement has been to destigmatize conversations about mental health and wellbeing. This is embedded into the regular conversations managers have with their staff as part of our Performance Management approach.
Our approach to collecting the data
Our approach to collecting the data
To ensure our policies and working practices are meeting our aims for an inclusive workplace and a diverse workforce we collect data about our staff group for analysis. Our approach to how we collect the data is aligned to our values rooted in respect and inclusion.
This report aims to comply with the Equality Act 2010 (Specific Duties and Public Authorities) Regulations 2017. It responds to the requirement to:
- publish information to demonstrate its compliance with the duty imposed by section 149(1) of the (Equality) Act
- publish gender pay gap information
The data about our staff group was collected from the payroll and people management system. Information about Age, Sex, Maternity/Paternity is provided by staff on a mandatory basis for payroll requirements. Other diversity information is provided by staff on a self-declaration basis. The diversity monitoring questions that people have responded to, and that have been used in this report, are; Disability, Ethnicity, Religion or Belief, Sexual Orientation, Trans status, Gender Identification, Non-binary identification and social mobility.
In addition, questions about caring responsibilities and marital status are asked. They have not been included in this report.
Information about the Protected Characteristics of the Equality Act 2010 is available from the Equality and Human Rights Commission.
Protected characteristics information from EHRC
We encourage our colleagues to update their information on a regular basis and we make clear why it is important and how the data is used. All our monitoring questions have the option to say, ‘prefer not to say’. It is not mandatory for our colleagues to provide diversity data. For this reason, we have varying rates of completion by business area and diversity question.
Whilst it is a mandatory requirement for people to provide data during our recruitment process, as with staff monitoring the option to answer ‘prefer not to say’ is available for all questions.
Our data collection and reporting will be kept under review to ensure they provide the required support of our data informed decision making, inclusive language and meeting our current and any future legislative duties.
We will be reviewing our diversity monitoring questions and making any required changes to our monitoring and reporting as a result of updates to Equality and Human Rights Commission statutory guidance following approval from UK Ministers.
Our people
Our people
Data tables available for download here (87KB Excel document)
The data used in this report to analyse our pay gaps and staff diversity was collected at 31 March 2025.
The recruitment reporting data is for the period 1 April 2024 to 31 March 2025.
The response rate to our optional monitoring questions when including prefer not to say responses is between the range of 69.1% to 73.1% by question.
| Optional monitoring questions | Response rate (including prefer not to say) | Declaration rate (excluding prefer not to say) |
|---|---|---|
| Disability | 72.8% | 68.1% |
| Ethnicity | 69.1% | 69.1% |
| Gender reassignment | 70.9% | 66.8% |
| Gender identity | 73.1% | 69.6% |
| Non-binary | 70.9% |
66.3% |
| Religion or belief | 72.6% | 65.8% |
| Sexual orientation | 72.9% | 65.7% |
| Socio-economic |
69.8% |
60.4% |
All staff group
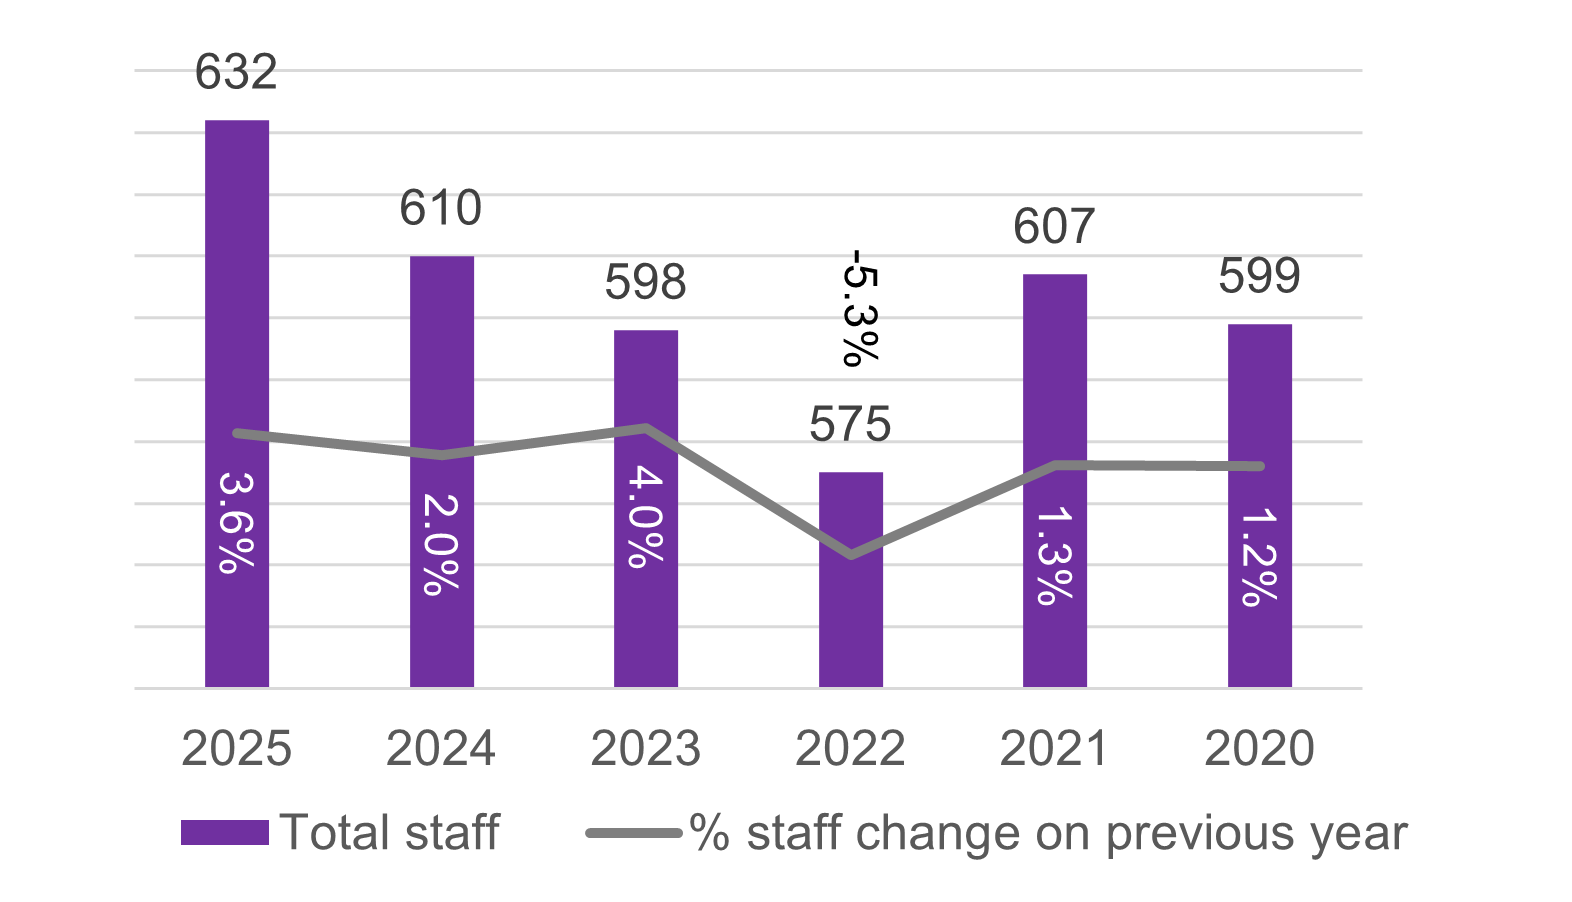
There was a 3.6% increase in the size of the staff group from the previous year (from 610 to 632 people). The full-time equivalent (FTE) increase was 3.3%. In this year, 62% (previously 74%) of new starts were employed to permanent rather than temporary roles.
Working pattern (full time/part time)
| Staff group | 2024 | 2025 | Change amount | Percentage change |
|---|---|---|---|---|
| Men part-time | 23 | 26 | increased by 3 | +13.0% |
| Men full-time | 242 | 248 | increased by 6 | +2.8% |
| Men all staff | 265 | 274 | increased by 9 | +3.4% |
| Women part-time | 78 |
86 | increased by 8 | +10.3% |
| Women full-time | 267 | 272 | increased by 5 | +1.9% |
| Women all staff | 345 | 358 | increased by 13 | +3.8% |
| All part-time staff |
101 |
112 | increased by 11 | +10.9% |
| All full-time staff | 509 | 520 | increased by 11 | +2.2% |
| All staff | 610 | 632 | increased by 22 | +3.6% |
Part-time staff account for 17.7% of all staff. This is as an increase of 1.7% from the previous year (16.6%)
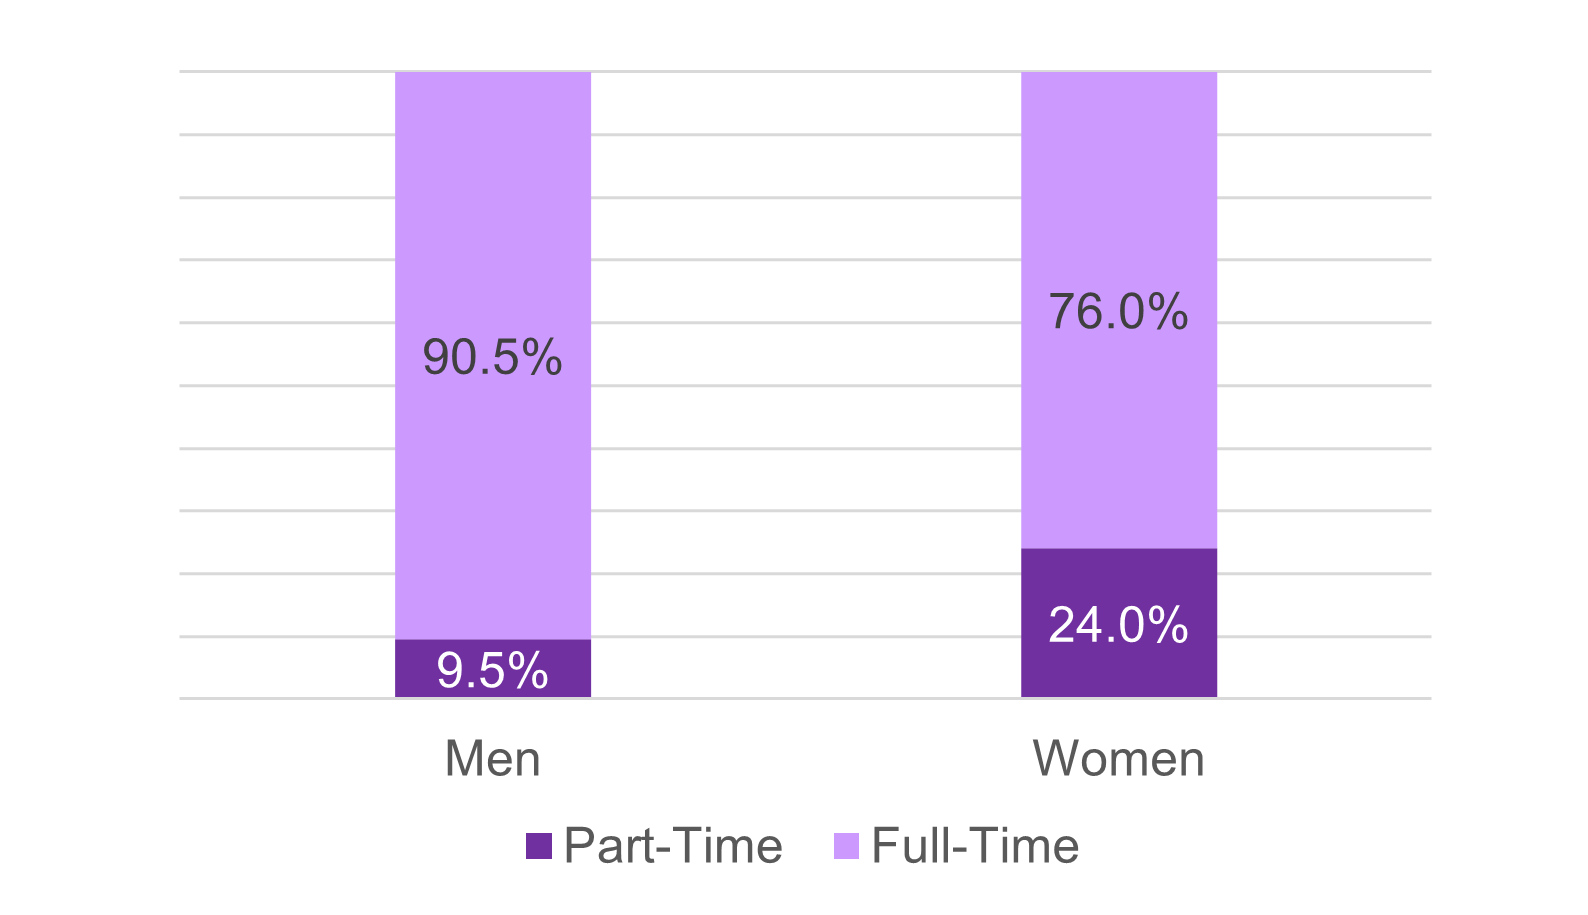
The proportion of men working part-time hours has increased to 9.5% from 8.7% in the previous year. The proportion of men working part time in Scotland is 14.0%.
The proportion of women working part-time hours has increased by 1.4% to 24% from 22.6%. In Scotland 37.4% of women in employment work part time. Difference of 13.4% compared to our staff group.
Men account for a slightly greater proportion of all part-time staff this year (23.2% of all part-time staff compared to 22.8% in the previous year). The equivalent rates for women are 76.8% this year and 77.2% in the previous year.
The percentage increase in the number of all men (3.4%) and all women (3.8%) was similar.
In Scotland, from April 2024 to March 2025, a higher proportion of men were in full-time employment than women (an estimated 86.0% of men compared to 62.6% of women (Source: Scotland's Labour Market Insights: July 2025)
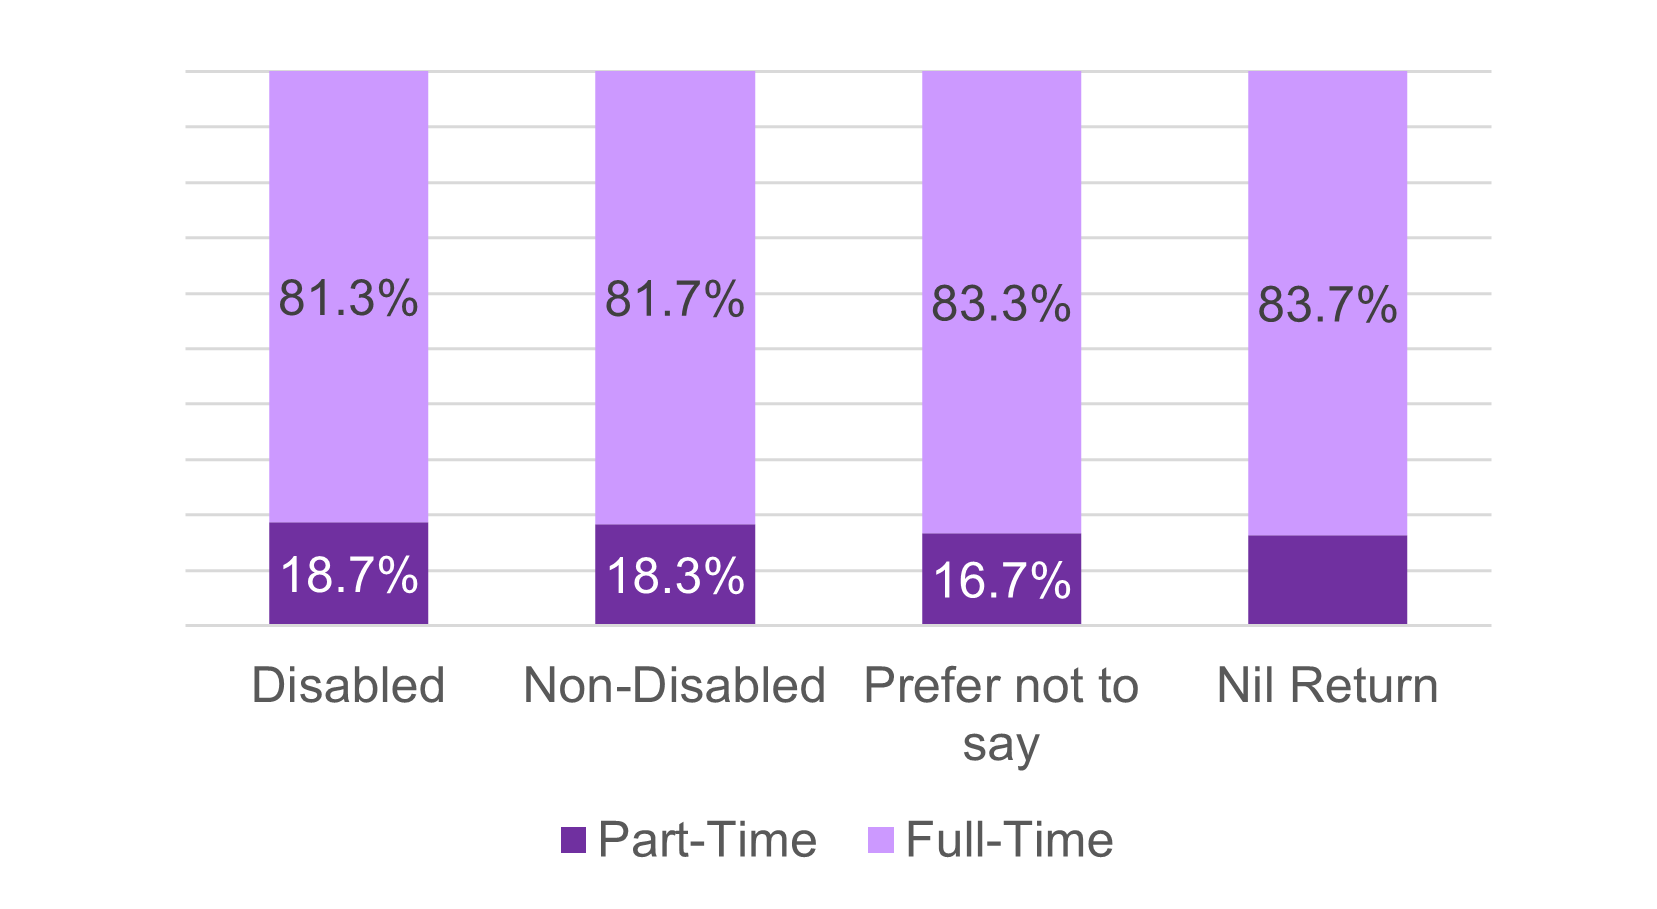
Disabled staff are more likely to work part- time than the whole staff group (18.7% compared to 17.7%) this year. Disabled staff account for 11.7% of all full-time staff and 12.5% of all part-time staff.
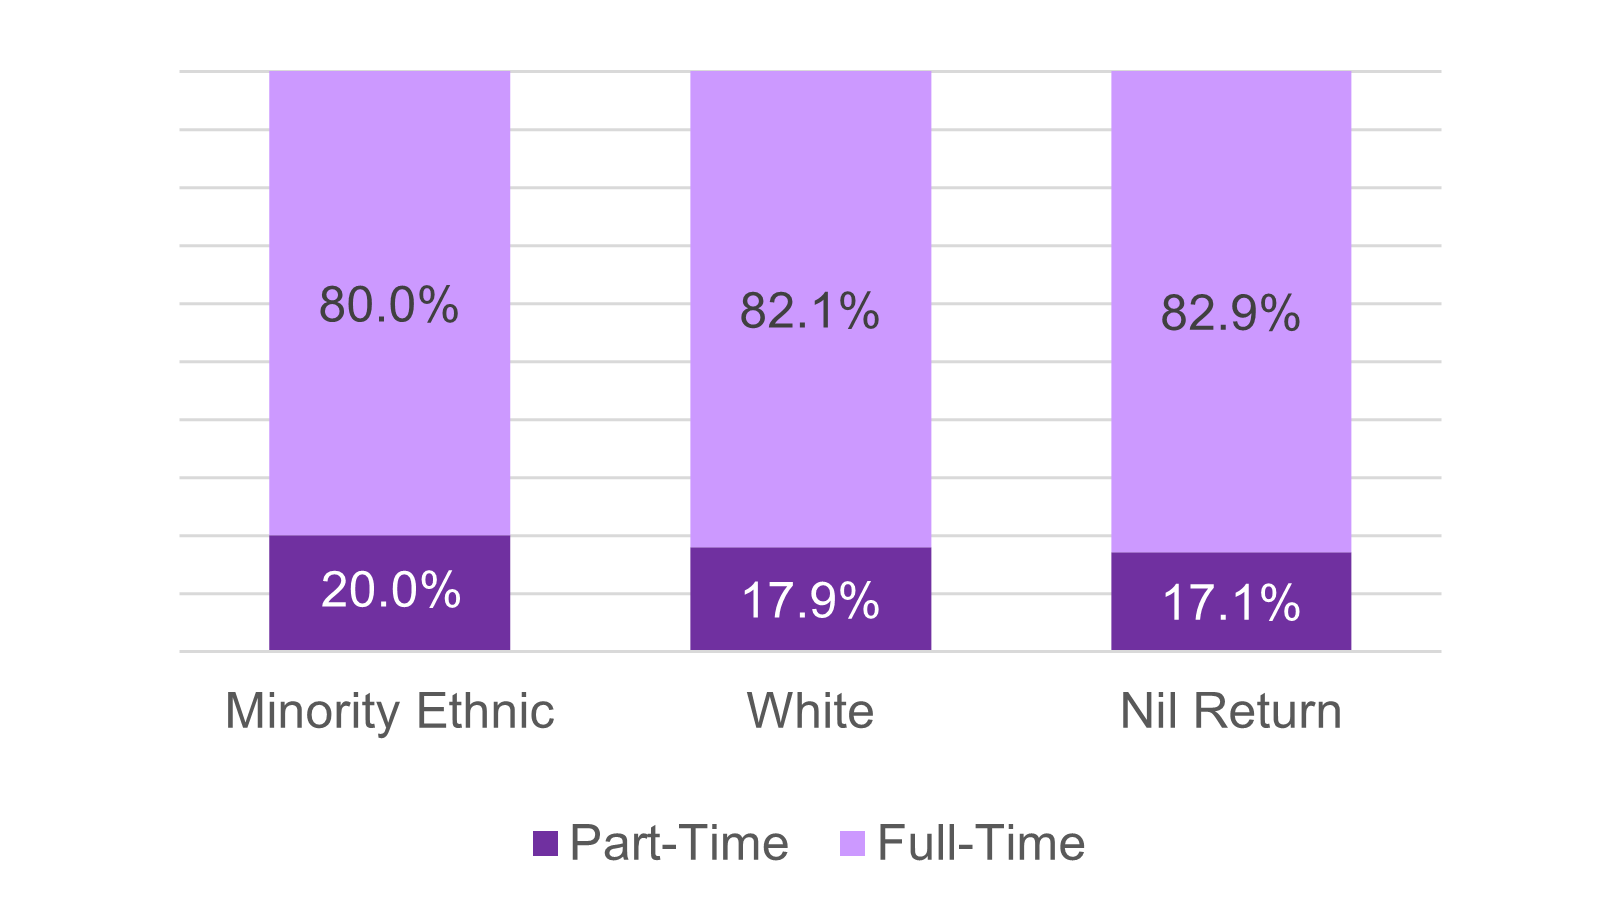
Minority Ethnic (ME) staff are slightly more likely to work part-time (20%) than White colleagues (17.9%). Minority Ethnic staff account for 3.8% of all full-time staff and 4.5% of all part-time staff.
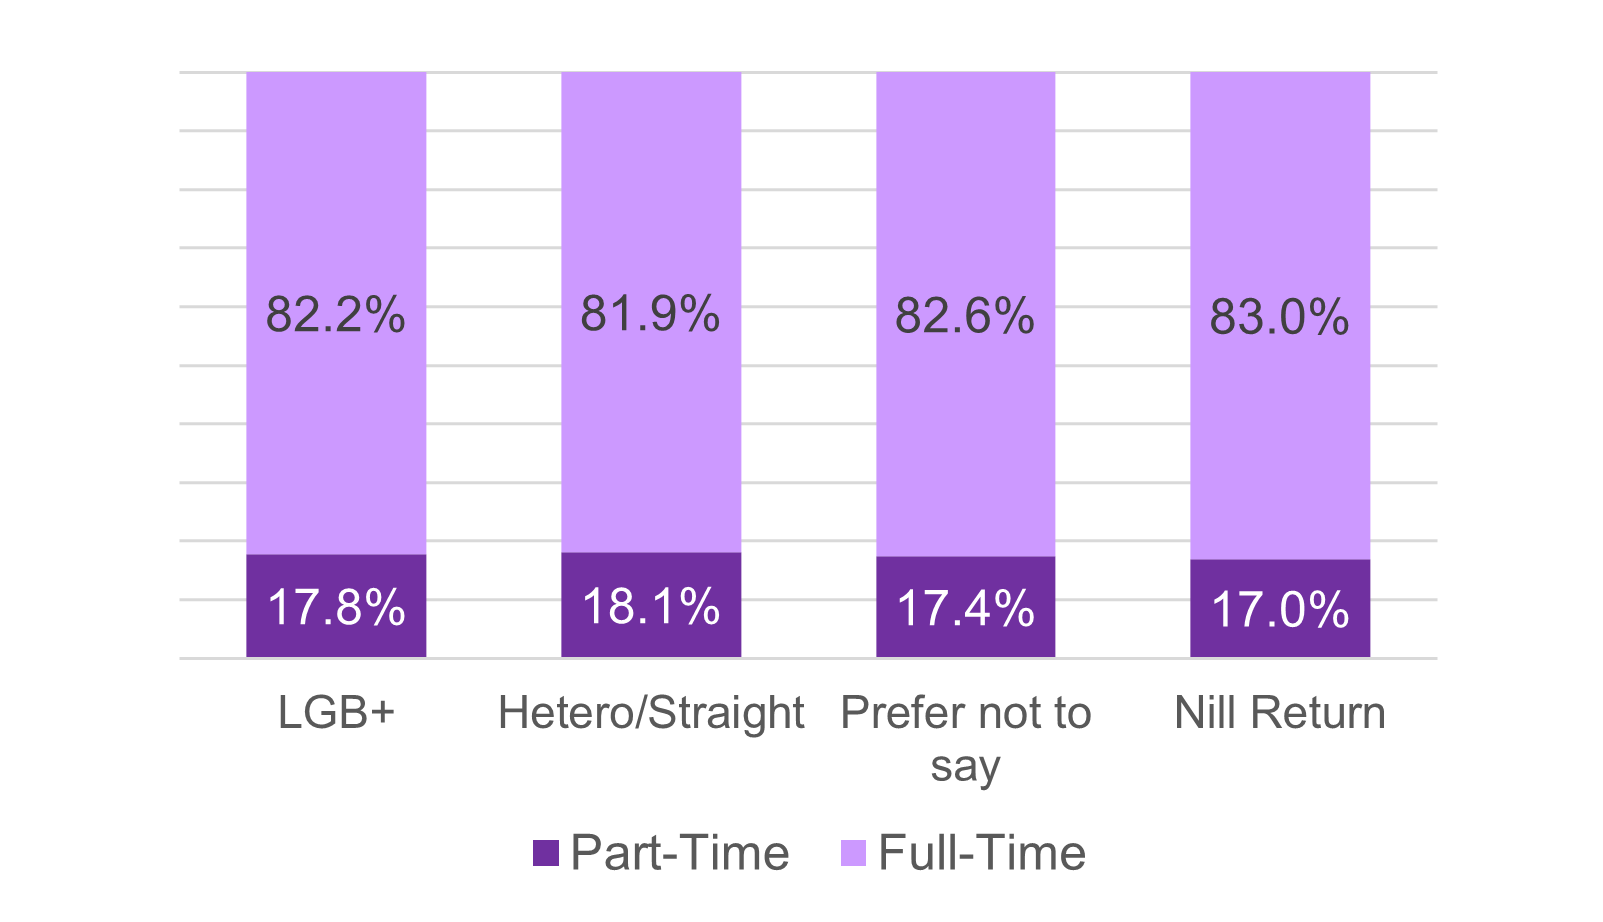
LGB+ staff –The proportion of LGB+ staff who work part-time contracts (17.8%), is in line with the proportion from the whole staff group (17.7%). Heterosexual colleagues are very slightly more likely to work part-time (18.1%).
At Senior Executive Team level, no-one works part time hours under the Office for National Statistics (ONS) definition. Part-time working is defined as working 30 hours or fewer per week.
Over the period there has been an overall headcount increase of 3.6%. There was a significant year on year increase for part-time workers of 10.9% when compared to the 2.2% increase for full-time workers and the whole staff group increase.
Sex
Disability
Ethnicity
(% staff by ethnicity)
Sexual orientation (LGB+)
Sex
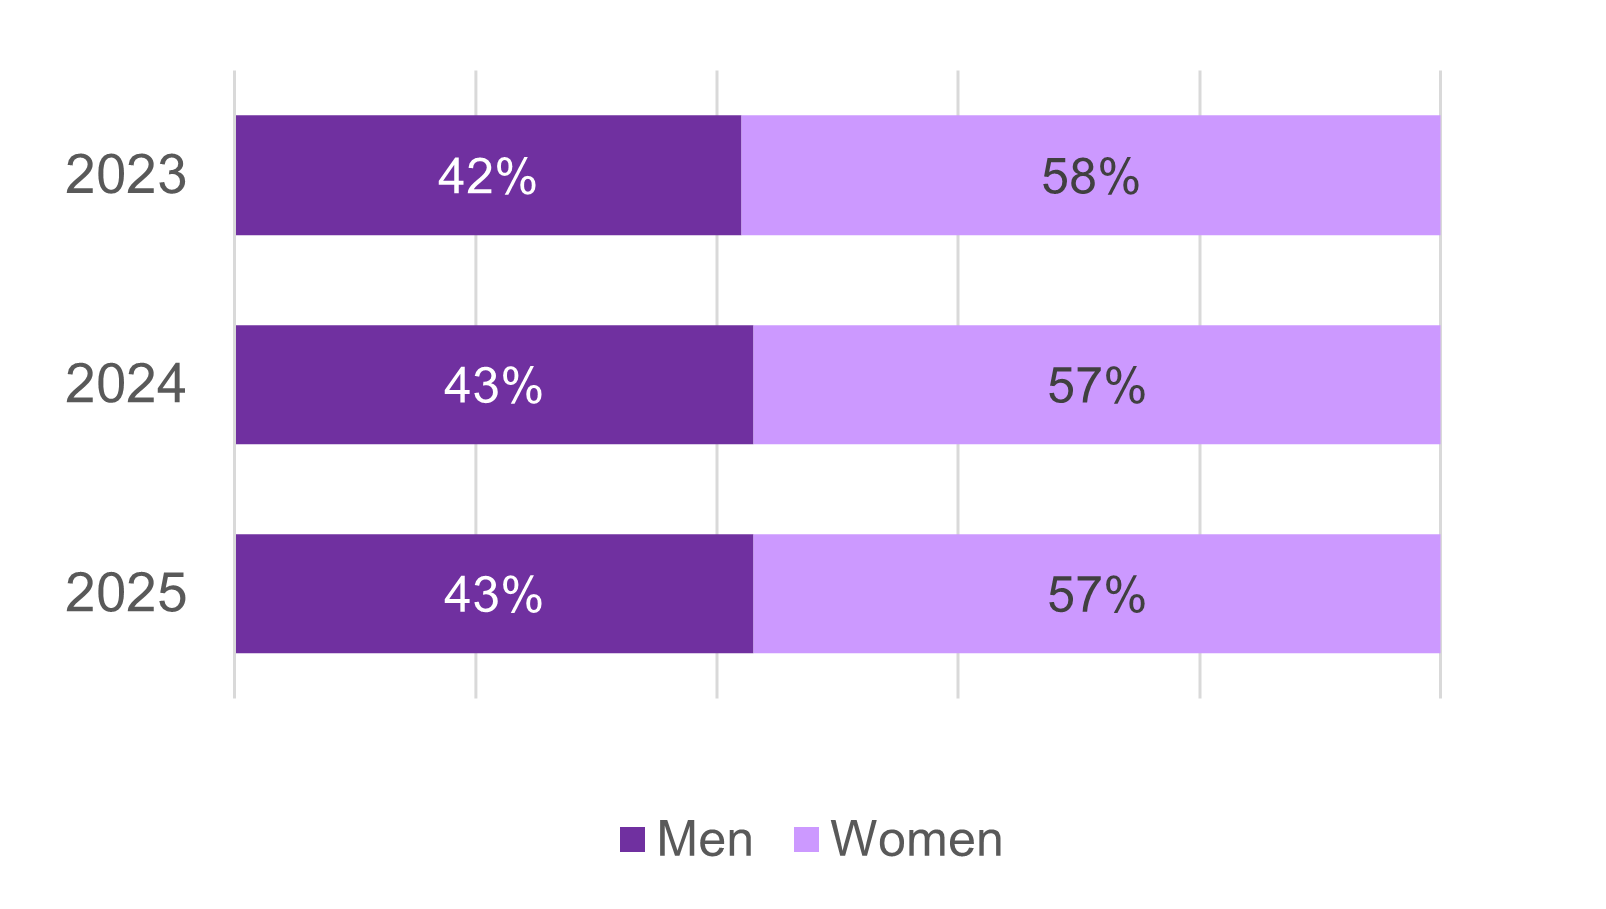
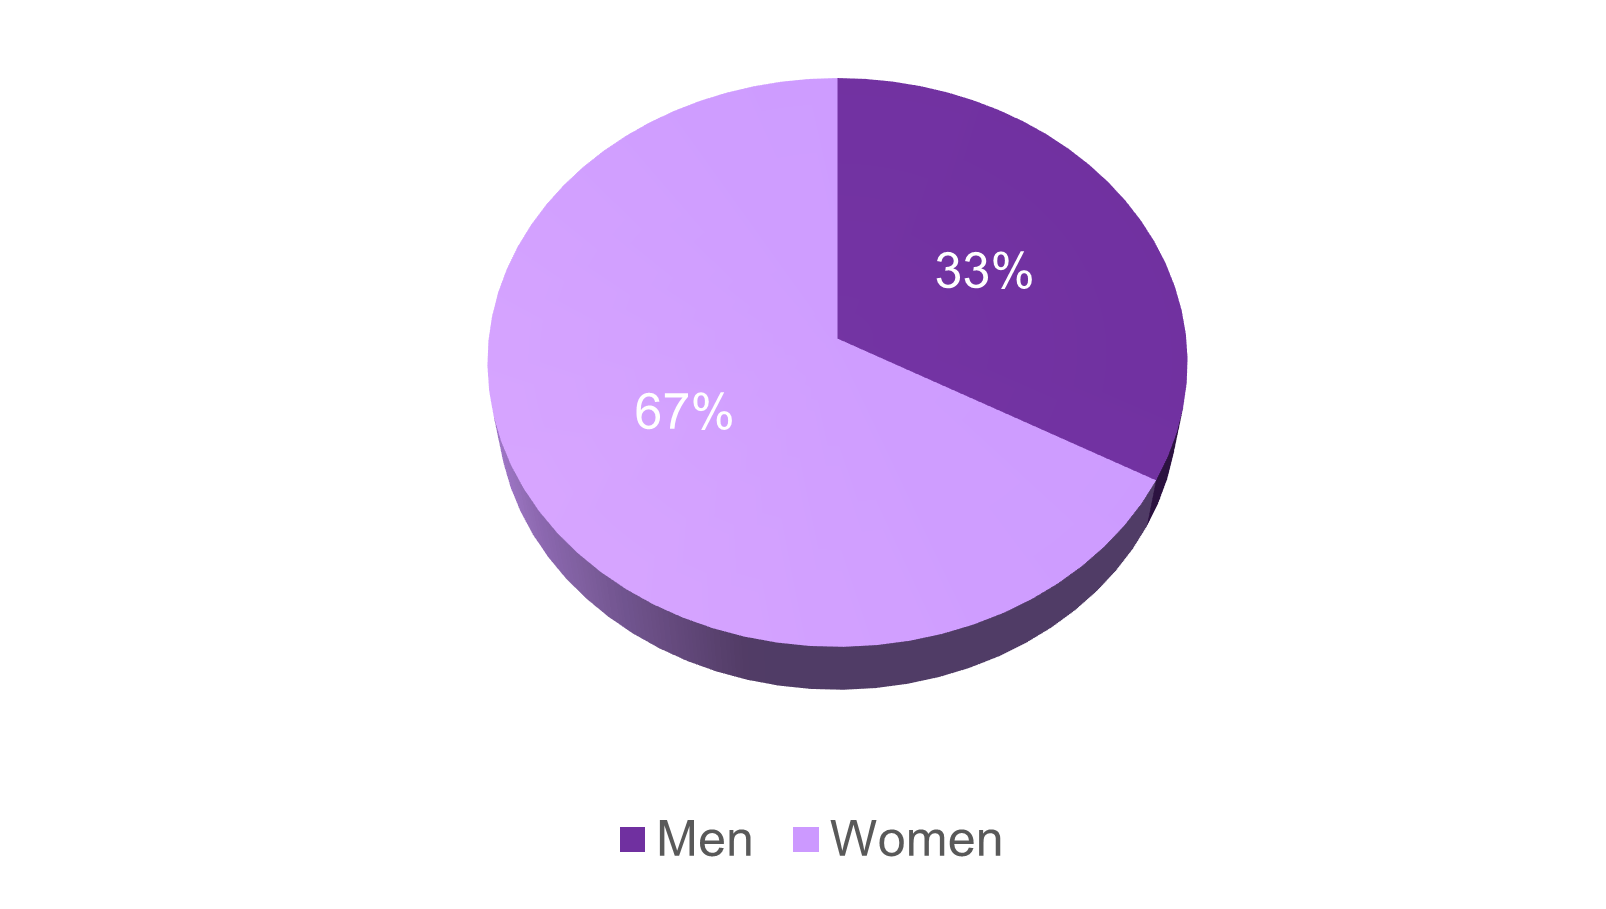
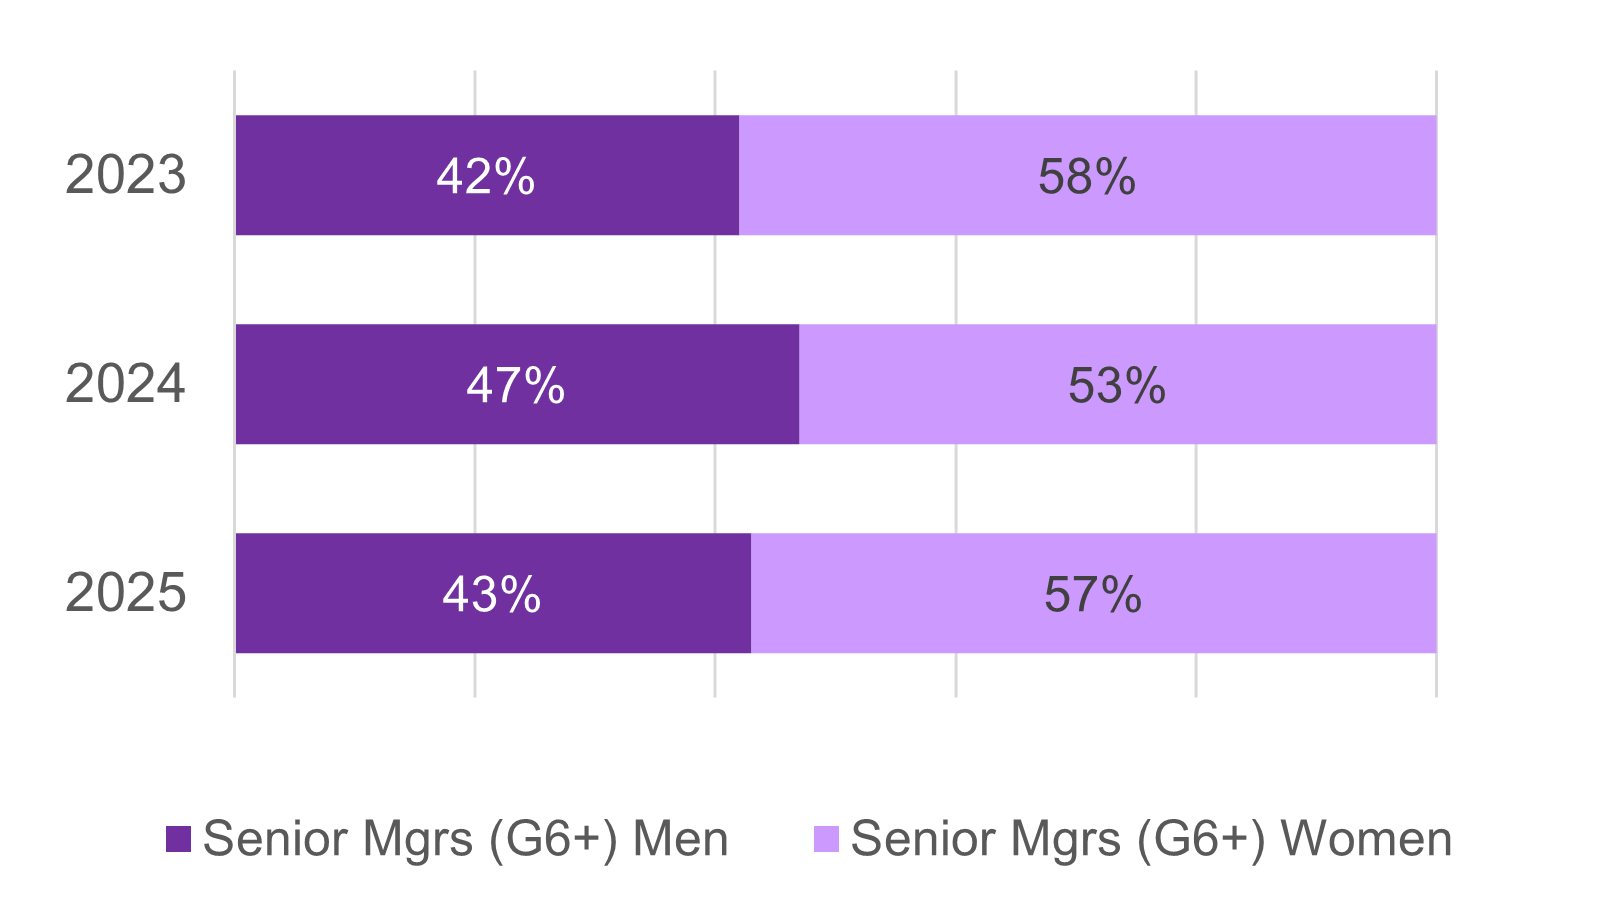
The number of women in our staff group increased by 3.8% from 345 to 358. The proportion of women in our staff group remained the same as last year at 57%. When compared to Scottish population data this is an over-representation of 6% within the 16 to 64 years age group. The proportion of women in our Senior Executive team is unchanged from last year at 67% The proportion of men in our senior management teams (grade 6 and above) has decreased from 47% last year to 43% this year.
Senior Executive Team (Grade 8 and above)
Senior Managers (Grade 6 and above)
Gender identification
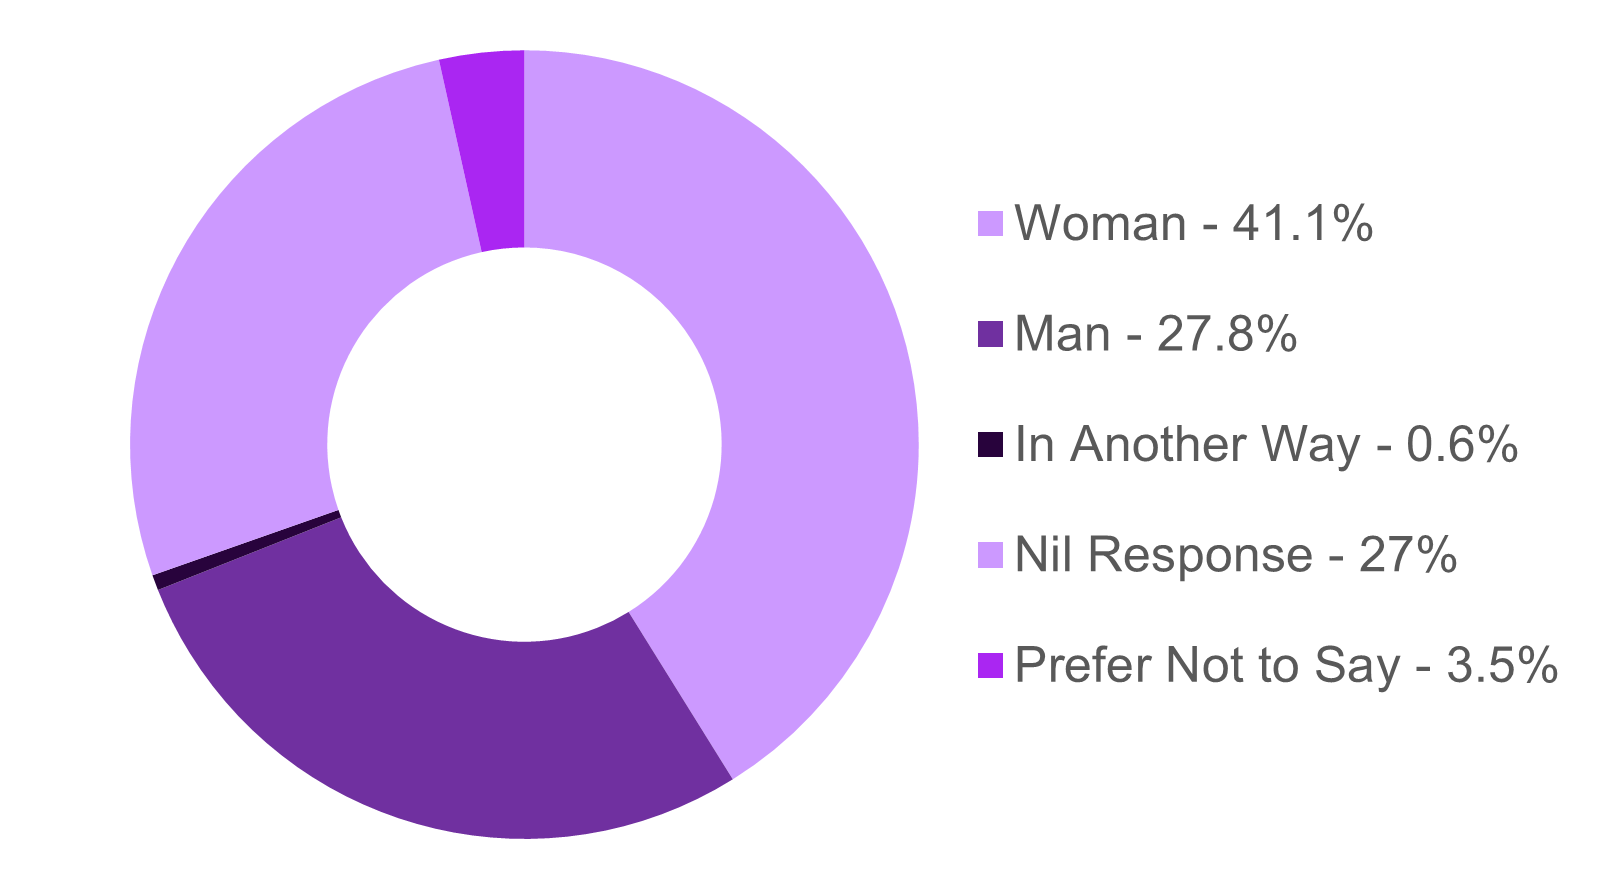
In this reporting year there have been responses where staff members have described their gender identification as ‘in another way’ to either man or woman or identified as non-binary.
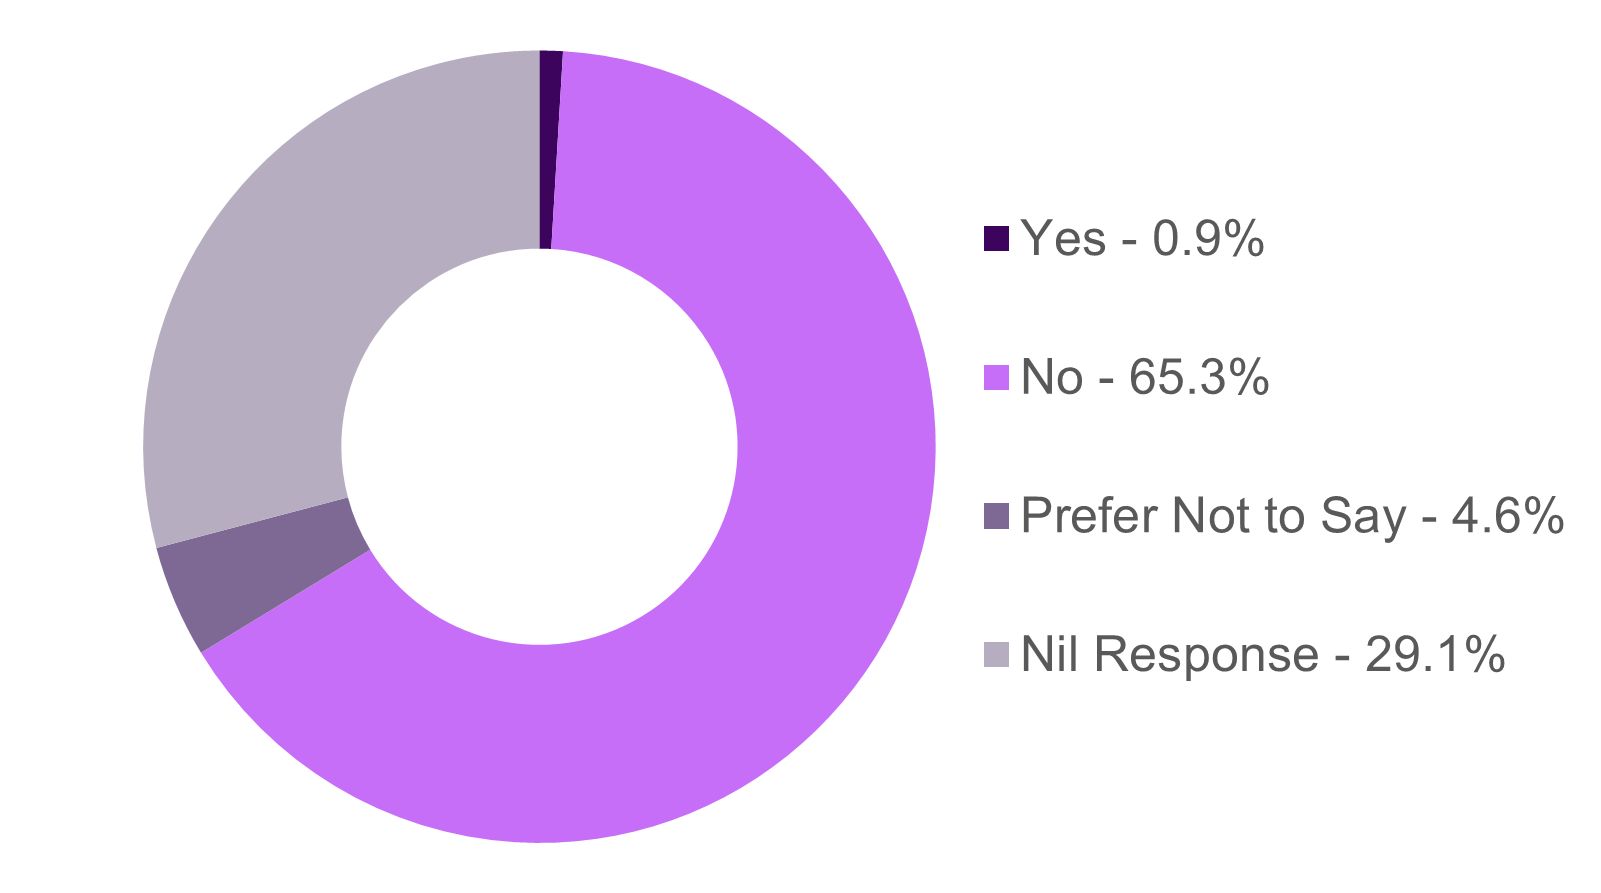
Non-binary
Trans
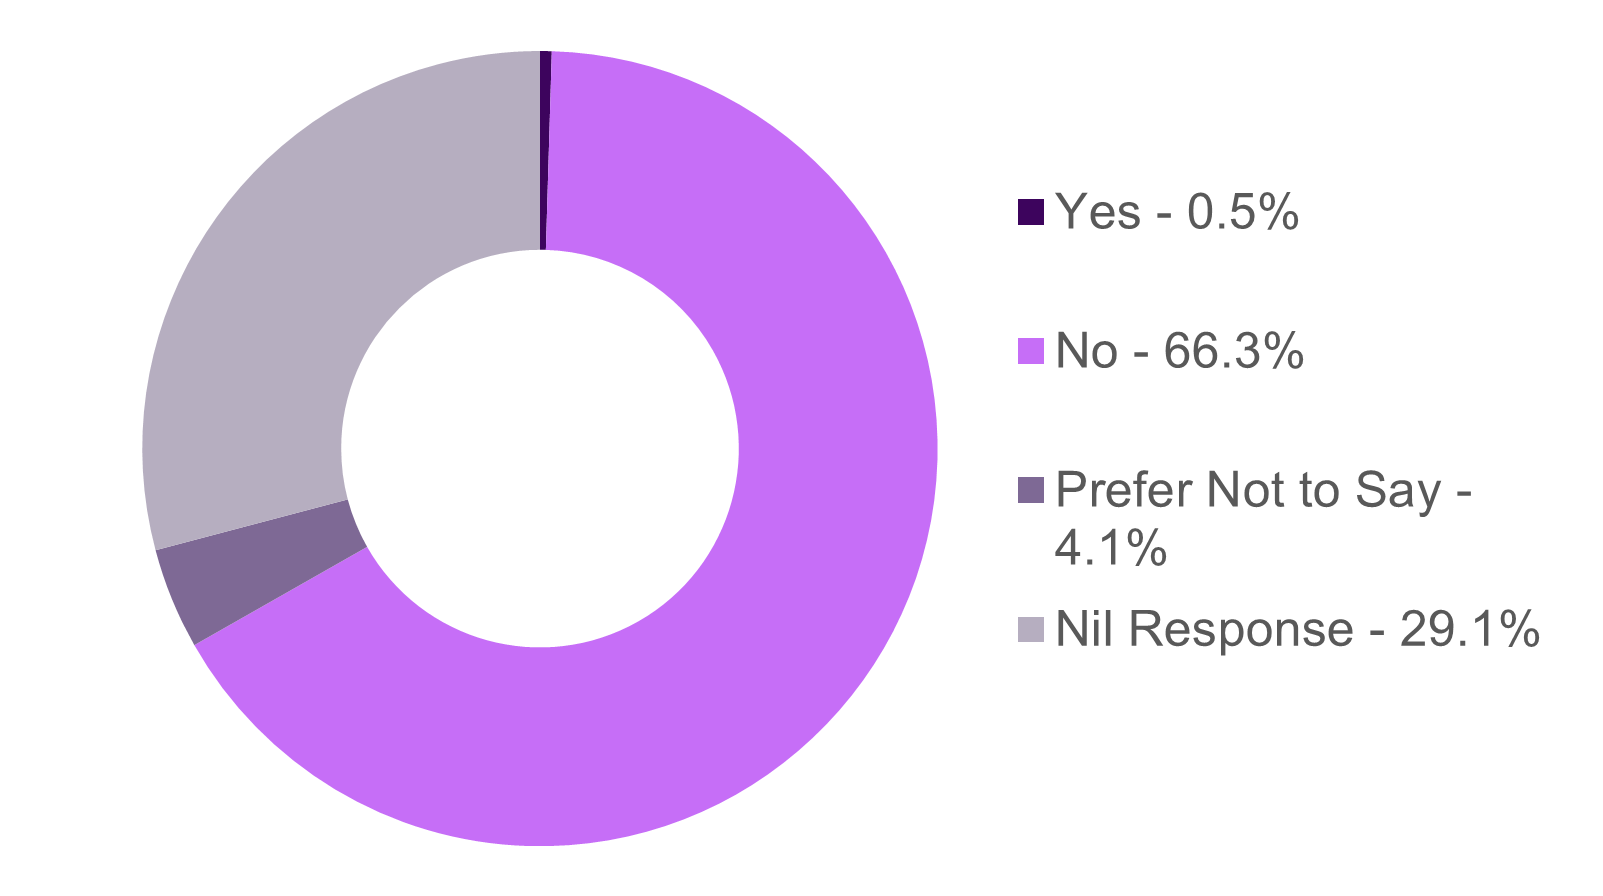
Trans status (gender reassignment)- The representation of trans people in our staff group remains the same at 0.5%. The Scottish Census indicated that 0.44% of the Scottish population aged 16 and over were trans or had a trans history.
Sexual orientation
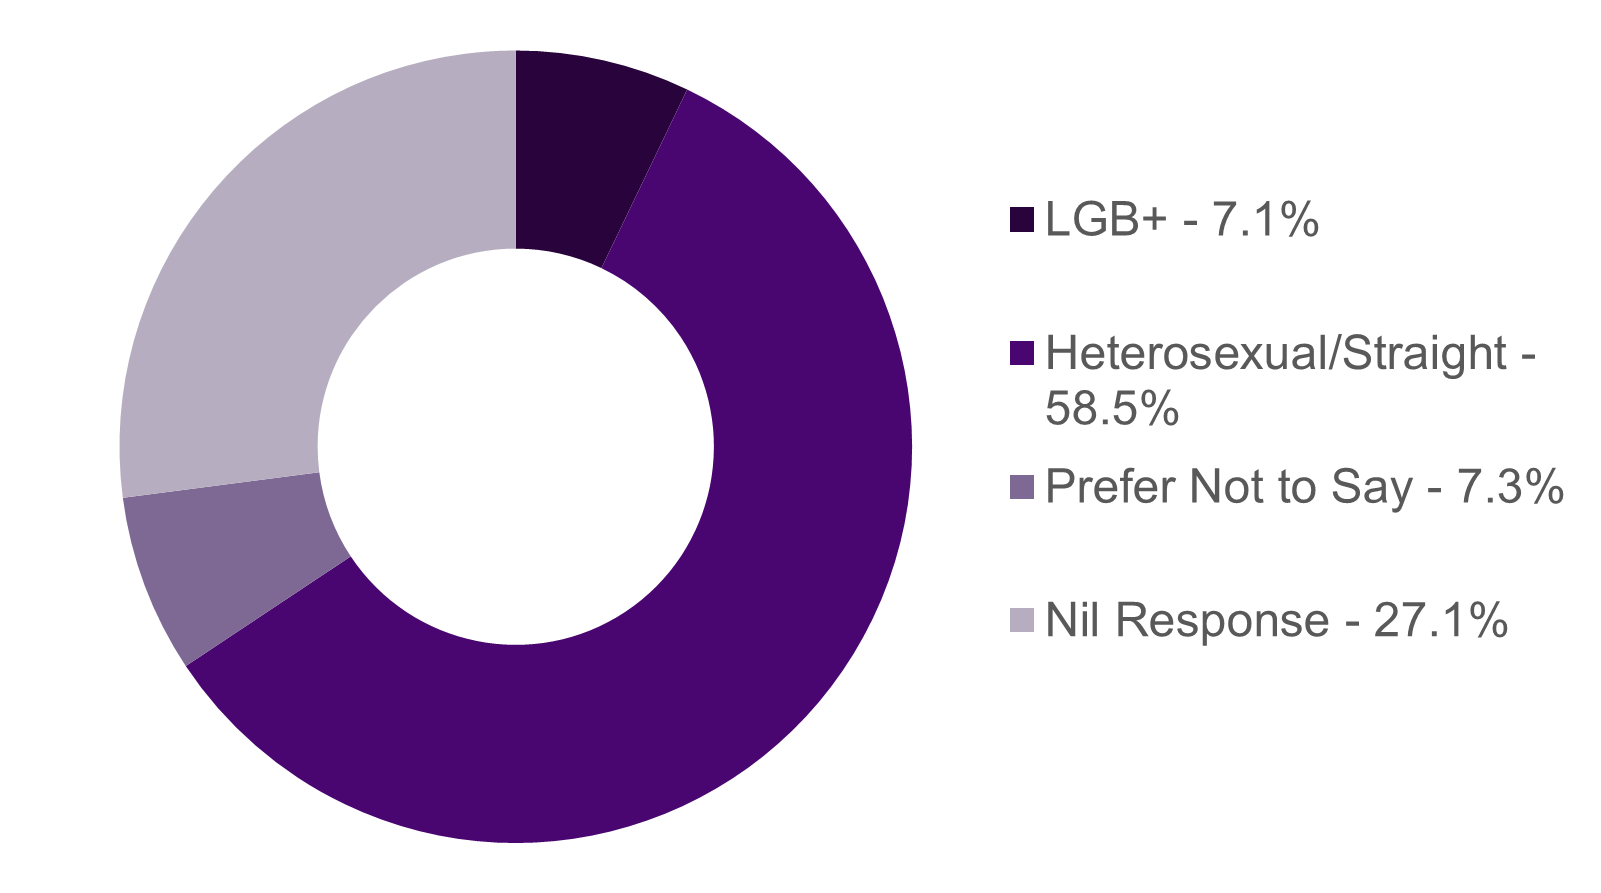
The number of people declaring as Lesbian, Gay, Bisexual, + (LGB+) decreased this year from 50 to 45 people. Alongside the overall increase in the staff number this changed the representation of LGB+ people in our staff group from 8.2% to 7.1%. In the Scottish Census 2022, found that 4.0% of people aged 16 years and over identified as LGB+ (Lesbian, Gay, Bisexual, Other) and that 87.8% of people aged 16 years and over identified as straight or heterosexual.
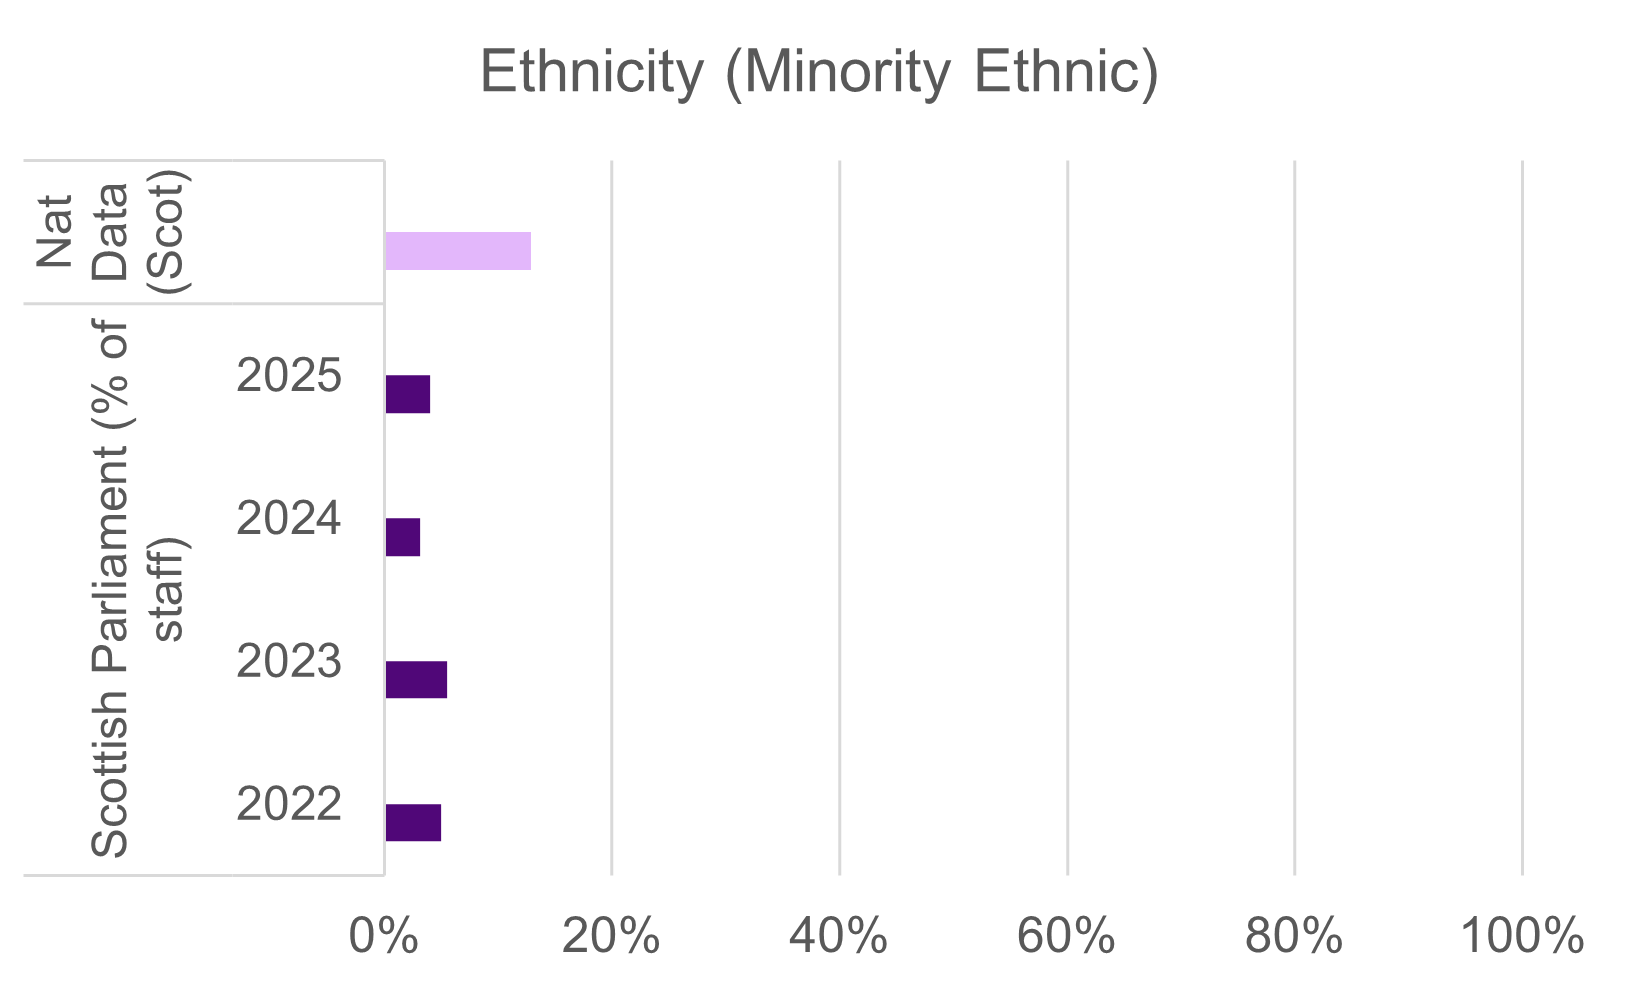
Ethnicity
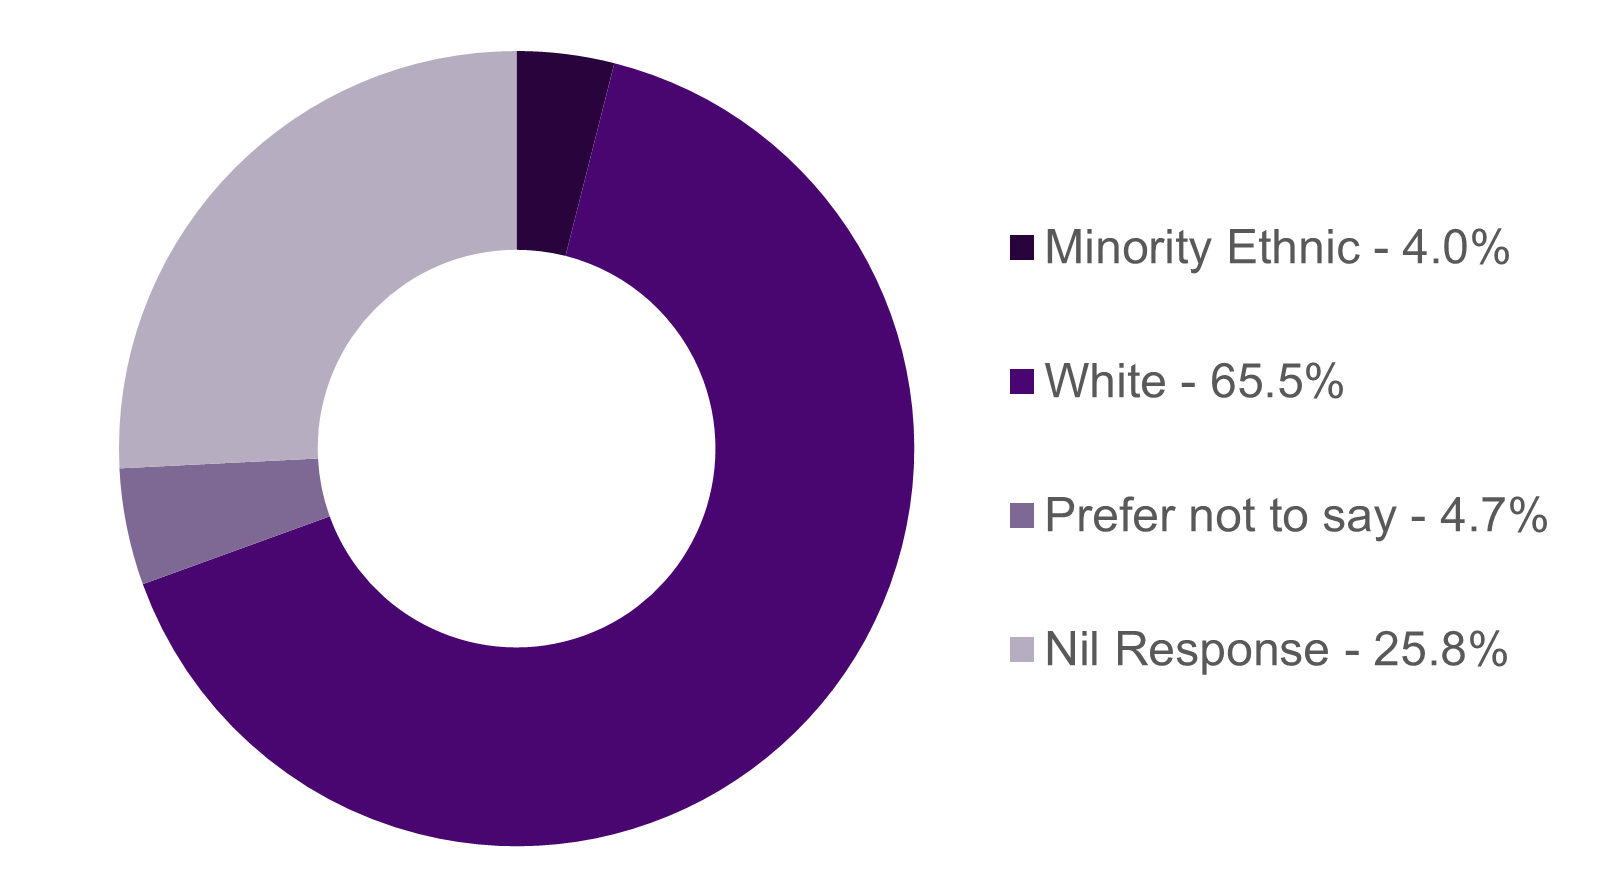
The number of people describing themselves as of a Minority Ethnic (ME) ethnic group increased from 19 to 25. The representation in the staff group increased from 3.1% to 4%. The implementation of a new system used in the collection of staff monitoring data and the associated communications and engagement with our staff group has improved the diversity monitoring data set. This now demonstrates a more accurate (although not complete) representation of the ethnicity of people in our staff group this year. We will continue to work on engaging with our staff about the importance of providing information about themselves. The percentage of people in Scotland with a minority ethnic background at time of Scottish Census 2022 was 12.9%.
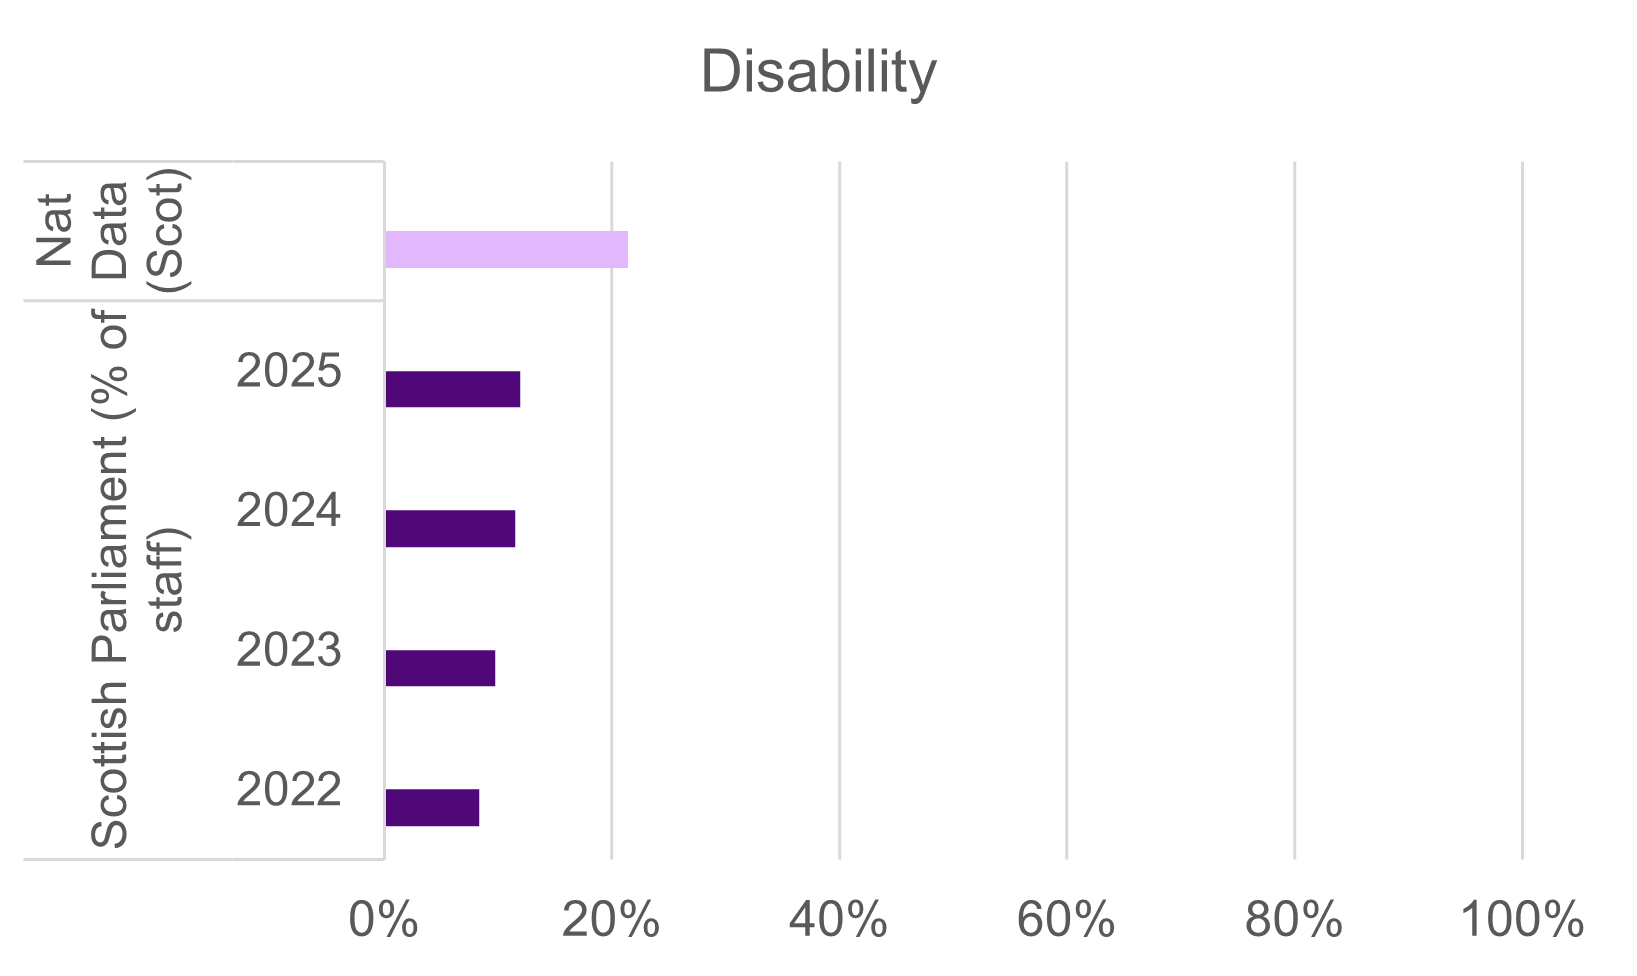
Disability
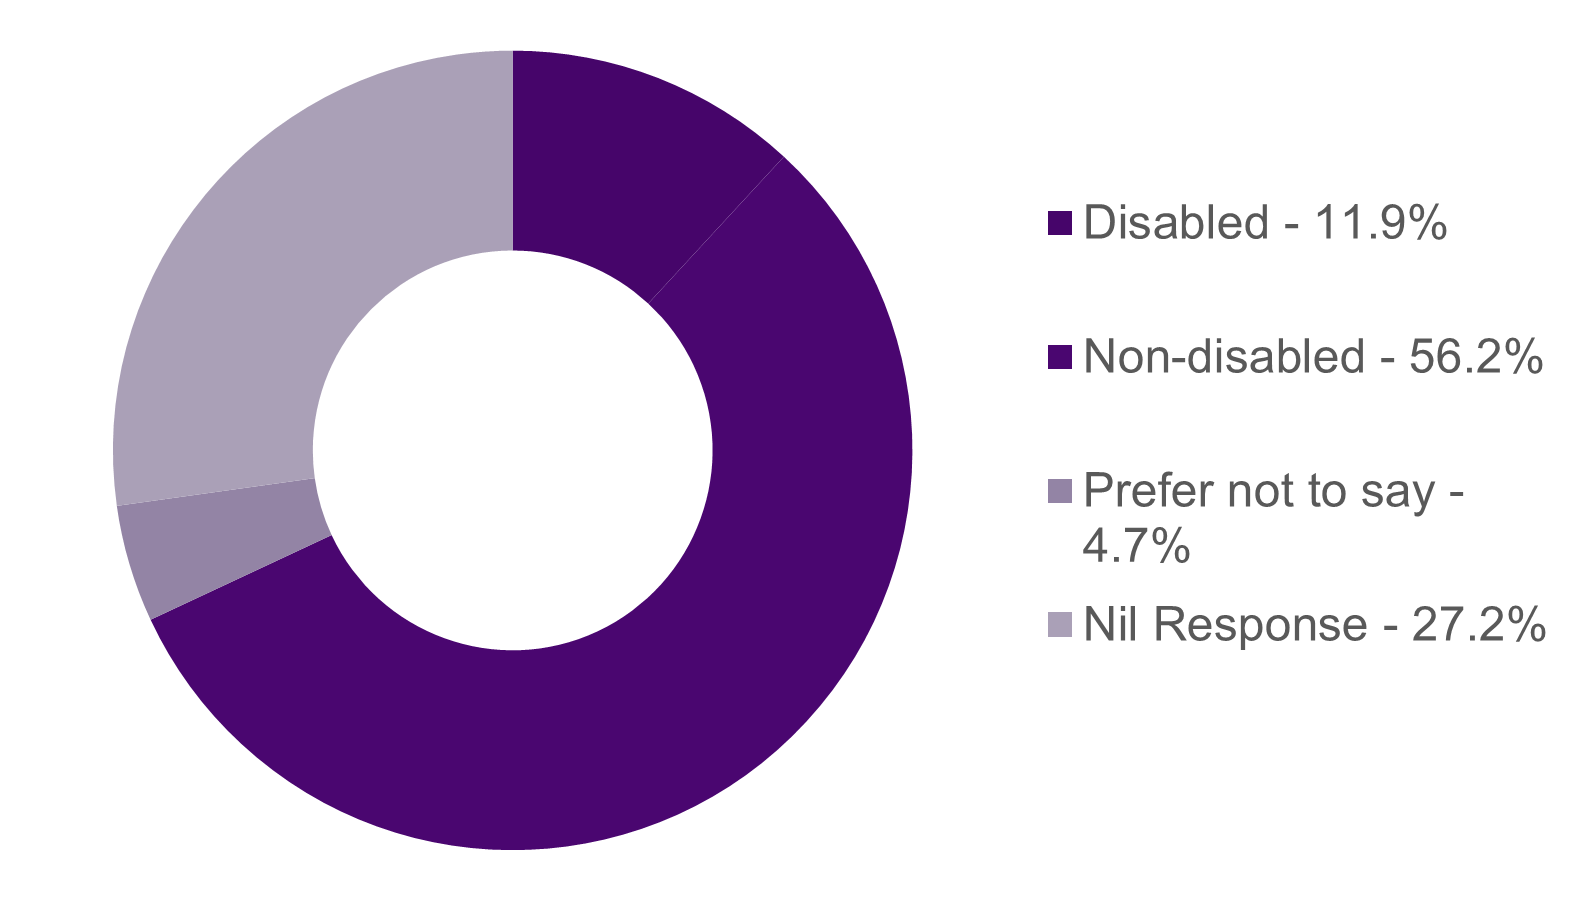
The number of people declaring a disability increased from 70 to 75. The representation in the staff group increased from 11.5% to 11.9%. Data from the Scottish Census 2022 indicates the percentage of people reporting a long-term illness, disease or condition was 21.4% in 2022.
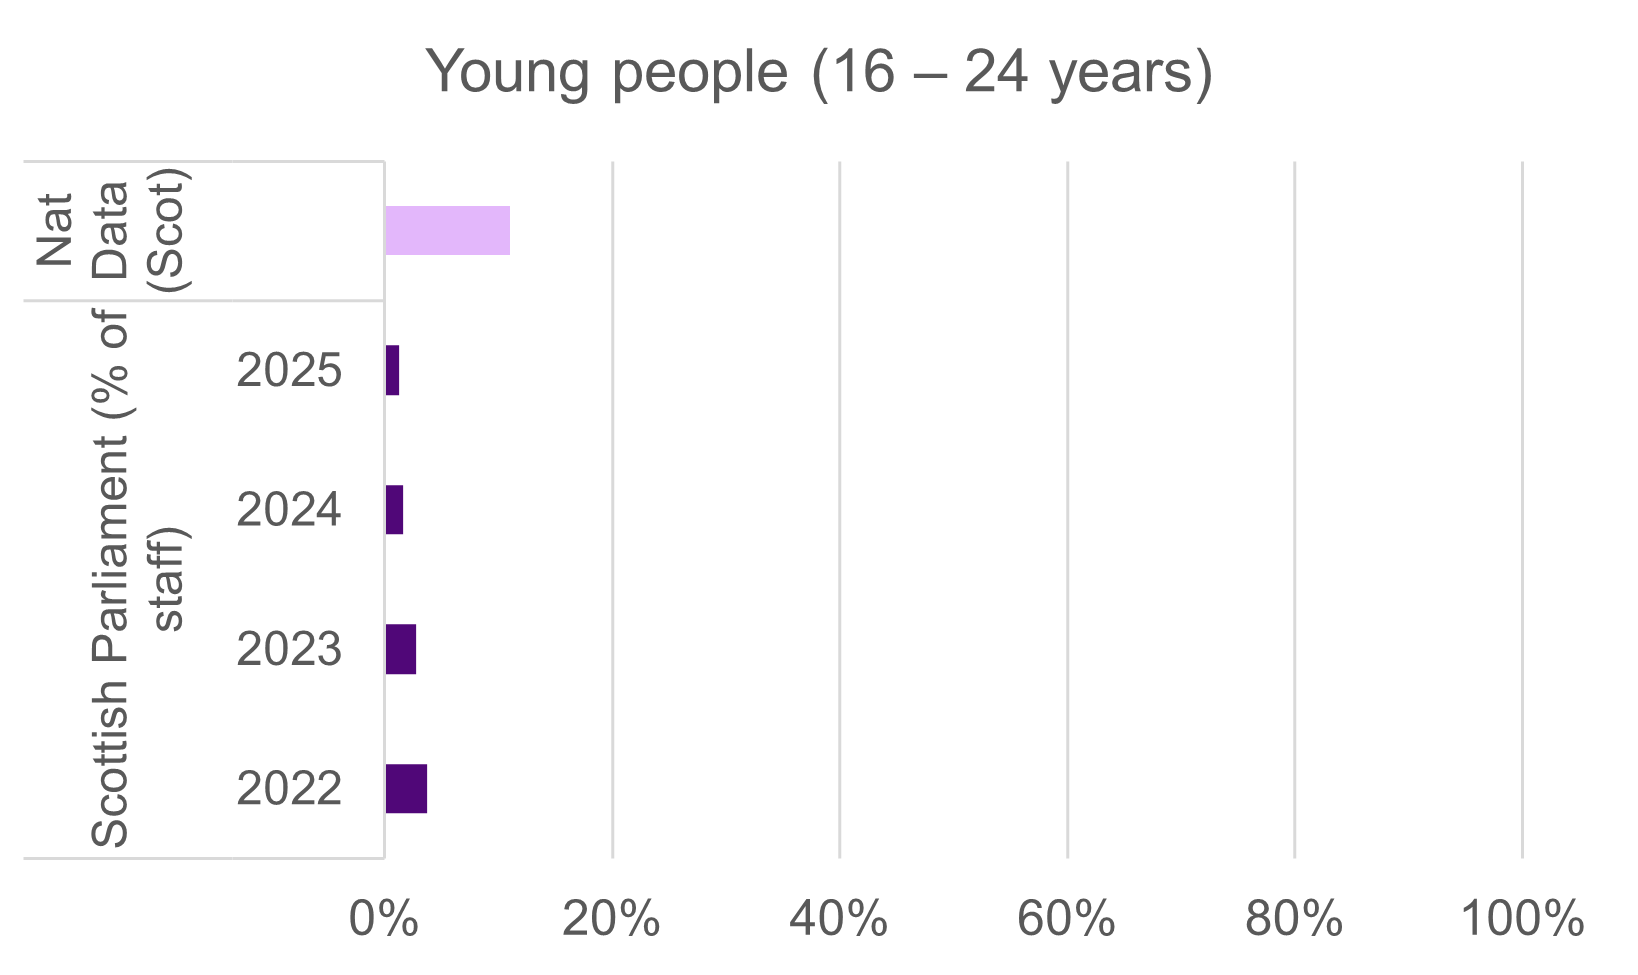
Age
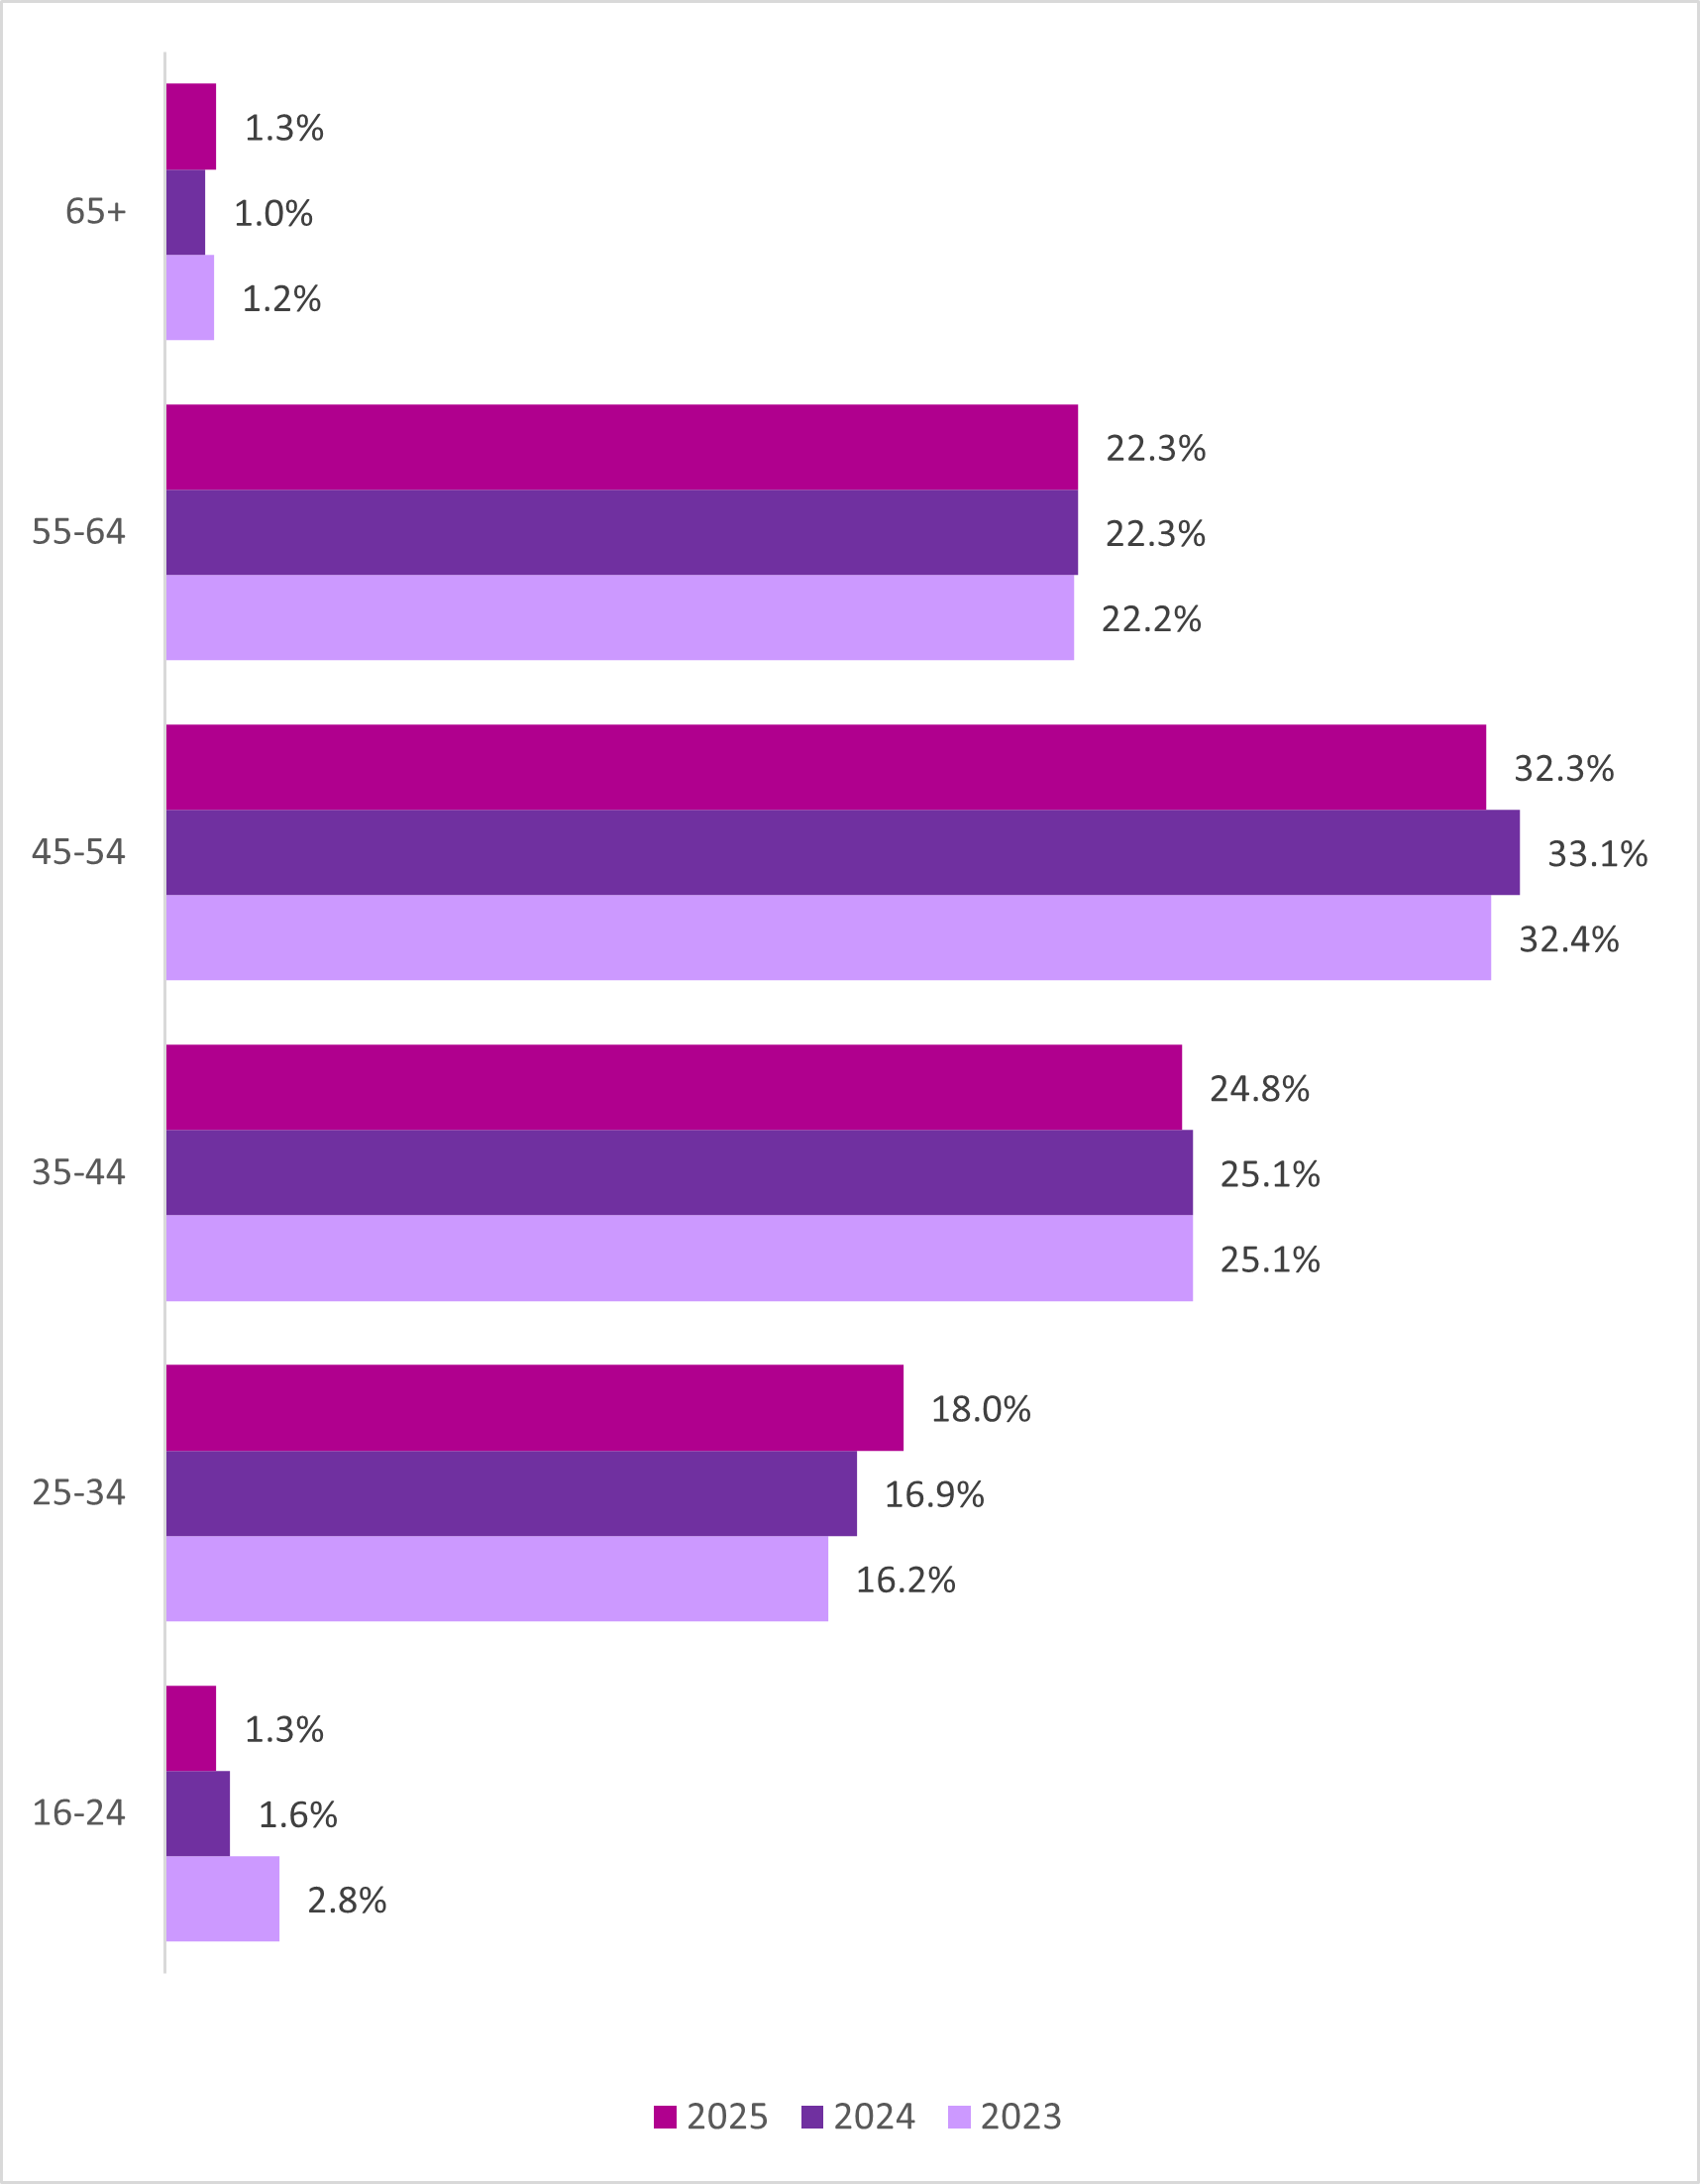
The median age this year decreased from 47 years to 46 years . The number of young people (16 to 24 years old) in our staff group decreased by 20% from 10 to 8 people. This group accounts for 1% of our staff group. The majority (32%) of our staff are in the 45 to 54 year old age group. The greatest percentage change for any age group was the 65 year and over group with a change of 33% (increase from 6 to 8 people).
Religion or belief
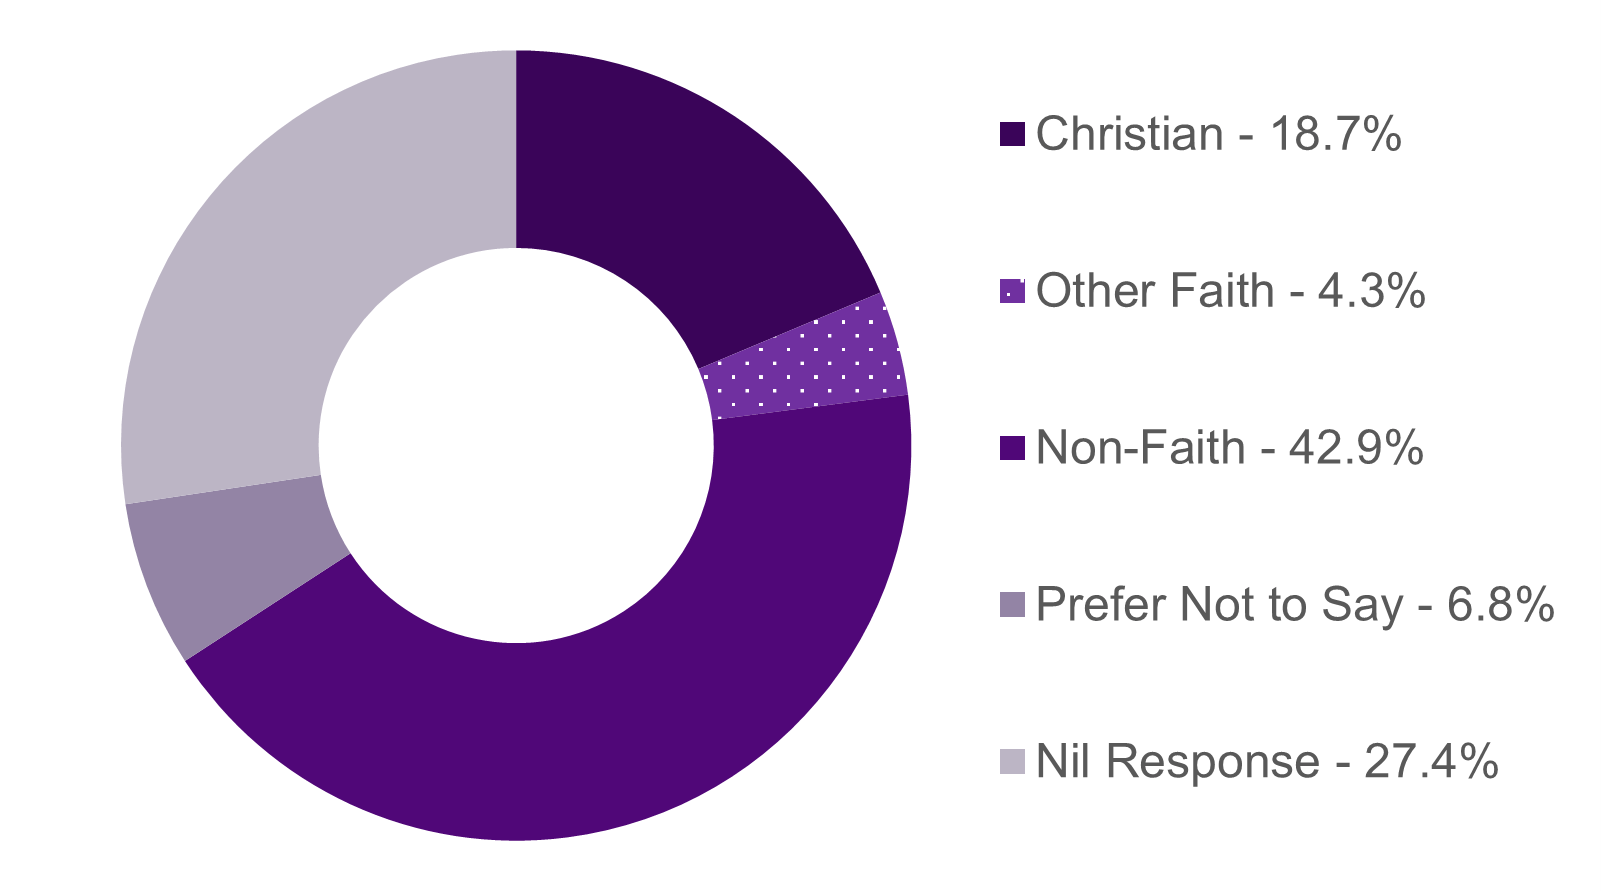
The response rate for this question improved this year from 61.1% to 72.6%. The number of people in our staff group declaring they do not have a faith increased from 229 to 271. This group represents 42.9% of the staff group. The number of people declaring a religion slightly increased from 143 to 145. Proportion of people declaring a Christian faith decreased from 19.3% to 18.7% of staff and Other Faith from 6.7% to 5.9%. The proportion of the whole staff group declaring a religion decreased from 23.4% to 22.9%. In response to the Scottish Census 2022, 51.1% of people responded they had no religion and 42.7% responded they had a religion.
Pregnancy and maternity
| No of women | No. of women on maternity leave | %age of women on maternity leave |
|---|---|---|
| 358 | 15 | 4.2% |
Return to work and working pattern
| No of maternity returners | Change in working pattern | Reduced hours | Unchanged pattern |
|---|---|---|---|
| 5 | 2 | 2 | 3 |
Paternity leave
| No of men | No. of men on paternity leave | %age of men on paternity leave |
|---|---|---|
| 274 | 3 | 1.1% |
Shared parental leave (SPL)
| Total no. of staff | No. of staff on SPL | %age of staff on SPL | |
|---|---|---|---|
| Women | 358 | 1 | 0.3% |
| Men | 274 | 2 | 0.7% |
Family care leave (FCL)
| No. of staff | No. of staff on FCL | %age of staff on FCL | |
|---|---|---|---|
| Women | 358 | 6 | 1.7% |
| Men | 274 | 2 | 0.7% |
Socio-economic
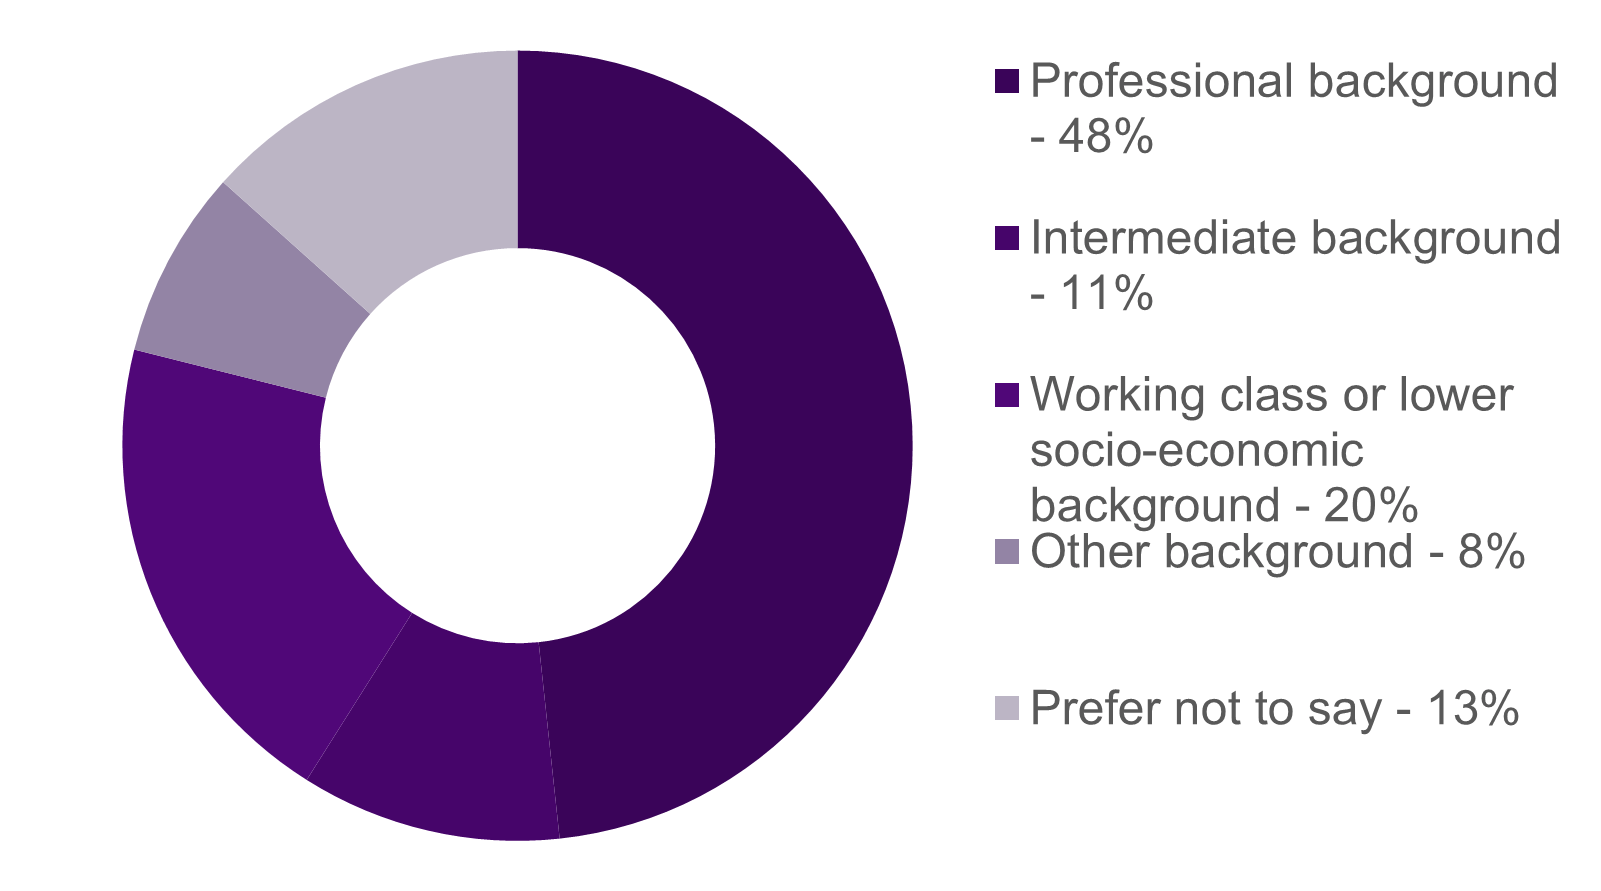
This is the first year that we have asked staff to respond to the question about ‘the occupation of your main household earner when you were about aged 14’. This question is considered to be the best measure to assess someone’s socio-economic background, as defined by the Social Mobility Commission. This question will assist us with understanding the socio-economic diversity and inclusion in our organisation. The initial results tell us that our staff group is disproportionately made up from the highest socio-economic backgrounds and is not reflective of wider society. We will be conducting further analysis to understand where we may want to take actions.
How do we compare?
For comparative purposes we have used the data released from the Scottish Census 2022
We include the following White groups as minority ethnic groups: Polish, Gypsy/Traveller, Roma and Showman/Showwoman.
Recruiting a diverse workforce
Recruiting a diverse workforce
Data tables available for download here (87KB Excel document)
Our aim is to have a staff group that is representative of the people of Scotland. We use positive action to help us attract candidates from groups that are under-represented in our workforce. We analyse our recruitment data to review the effectiveness of the actions we have taken and to understand where there may be barriers.
- During the period, there were 98 appointments made. This is an increase of 42% on the previous year (69 appointments)
- Overall, there were 2418 applications for posts during the period. This is a 117.6% increase from the previous reporting year (1111 applications). There was an average of 24.7 applications per post compared to 16.1 applications per post in the previous year. An increase of 53.4% per post.
- In the reporting year there was a 2.5% decrease in the proportion of roles advertised externally (from 64% to 61.5%). These are roles to which internal and external applicants can both apply.
Annual changes
| 2024/25 | 2023/24 | 2022/23 | 2021/22 | |
|---|---|---|---|---|
| Total number of applications for posts advertised | 2418 | 1111 | 1370 | 490 |
| Average number of applications per post | 24.7 | 16.1 | 12.2 | 7.9 |
| Number of appointments made | 98 | 69 | 107 | 62 |
| % of appointments to men | 46.9% | 43.5% | 39% | 31% |
| % of appointments to women | 41.8% | 53.6% | 59% | 66% |
| % of appointments to in another way candidates | 0.0% | 1.4% | 1% | 0% |
| % of appointments to minority ethnic candidates | 17.4% | 14.5% | 14% | 11% |
| % of appointments to white candidates | 75.5% | 84.1% | 84% | 84% |
| % of appointments to disabled candidates | 9.2% | 8.7% | 8% | 11% |
| % of appointments to non-disabled candidates | 74.5% | 89.9% | 88% | 87% |
| % of appointments to LGB+ candidates | 13.3% | 13.0% | 17% | 19% |
| % of appointments to heterosexual candidates | 75.5% | 84.1% | 76% | 69% |
Sex and Gender Identification
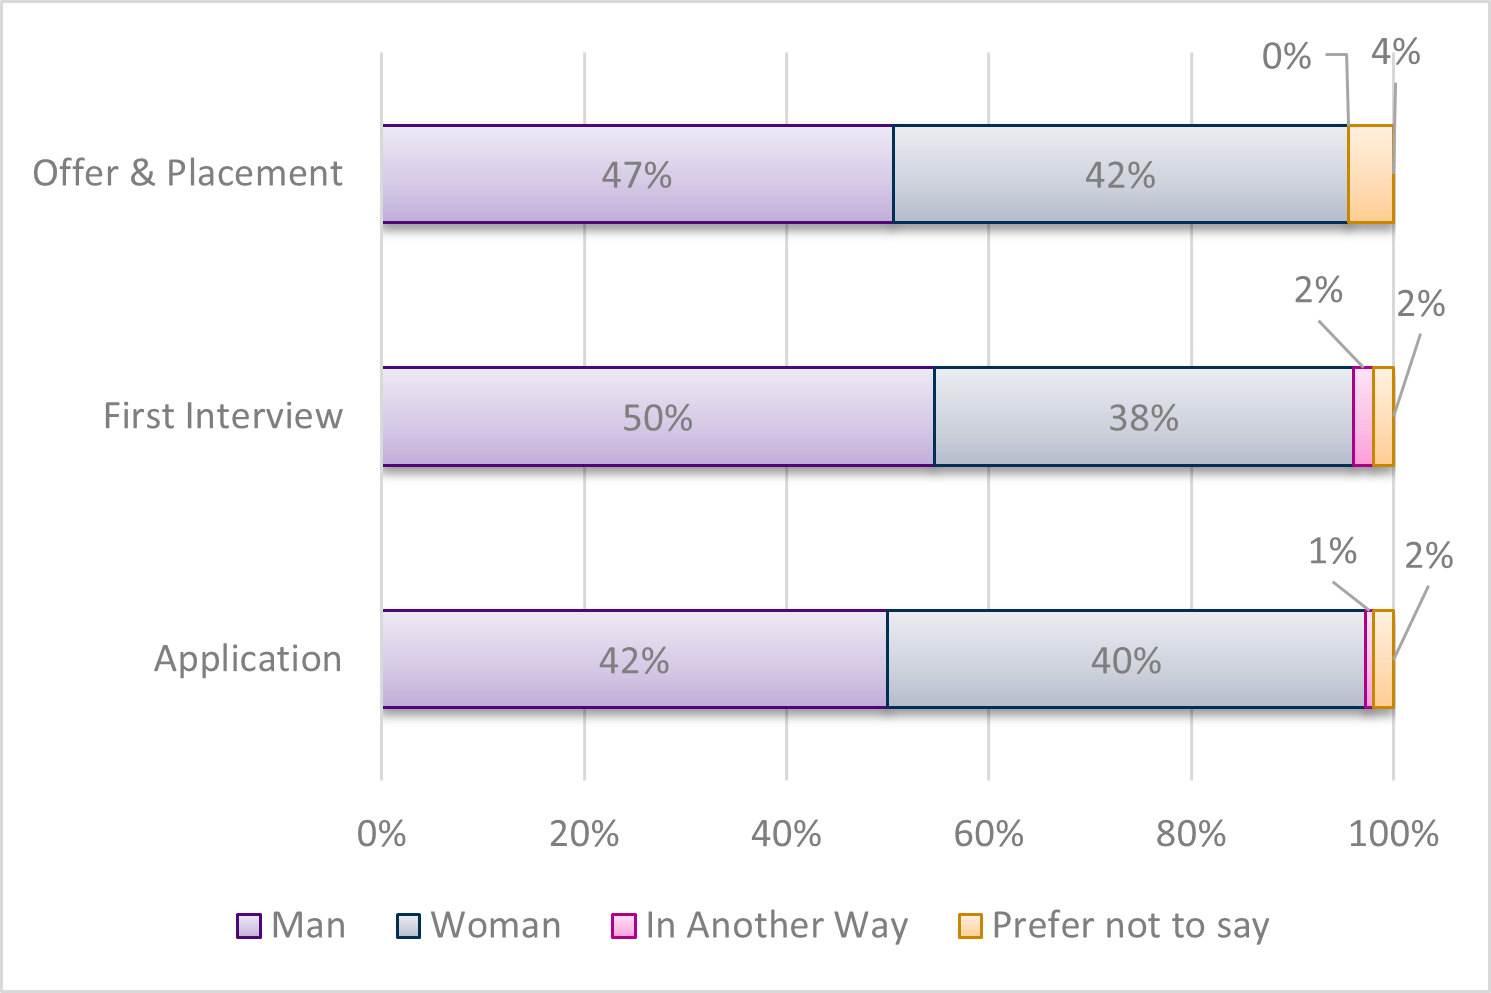
- The proportion of applications submitted from women this year (40.1%) is stable compared to last year (41.0%).
- Less than 1% of applications were from people who described their gender as In Another Way. A large proportion of people (15.2%) did not provide a response to this question.
- This year saw a reversal of last year’s proportion of appointments between men and women. Men are a greater proportion of appointments (46.9%) than women (41.8%) this year. Last year men were appointed to 44% of posts and women to 54%.
- For men the success rate at appointment is 4.5%, a slight decrease on the previous year (5%). The success rate at appointment for women is 4.2% compared to 8% last year.
- The highest comparative success rate at appointment was from those who had responded ‘prefer not to say’ (9.8%).
- We did not have ‘not indicated’ responses in the previous year, there is therefore no annual comparative data.
Disability
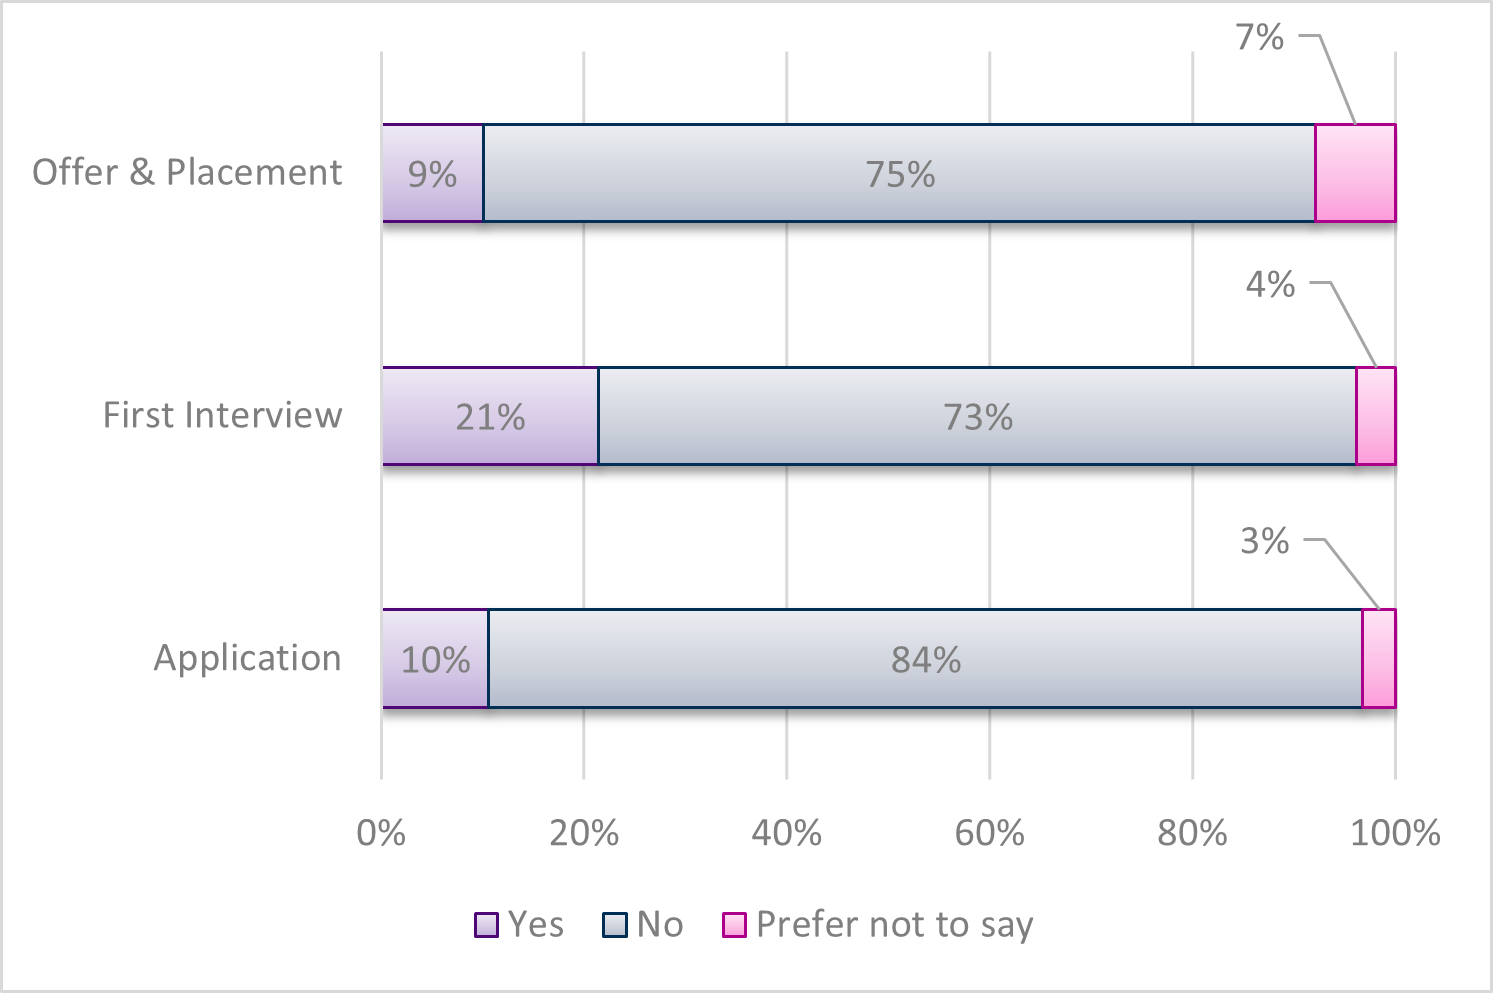
- The proportion of applications from disabled candidates slightly decreased from 11% last year to 10.3%.
- The success rate at appointment for disabled candidates is 3.6%, The same as for candidates not declaring a disability. This is a decrease for both groups, previously 5% for disabled candidates and 6.5% for candidates not declaring disability.
- The success rate for candidates who preferred not to declare whether they had a disability is 9.2% (3% in the previous year). The highest success rate is 12.7%. This is from people who had not provided any response to the question about disability.
- We did not have ‘not indicated’ responses in the previous year, there is therefore no annual comparative data
Sexual Orientation
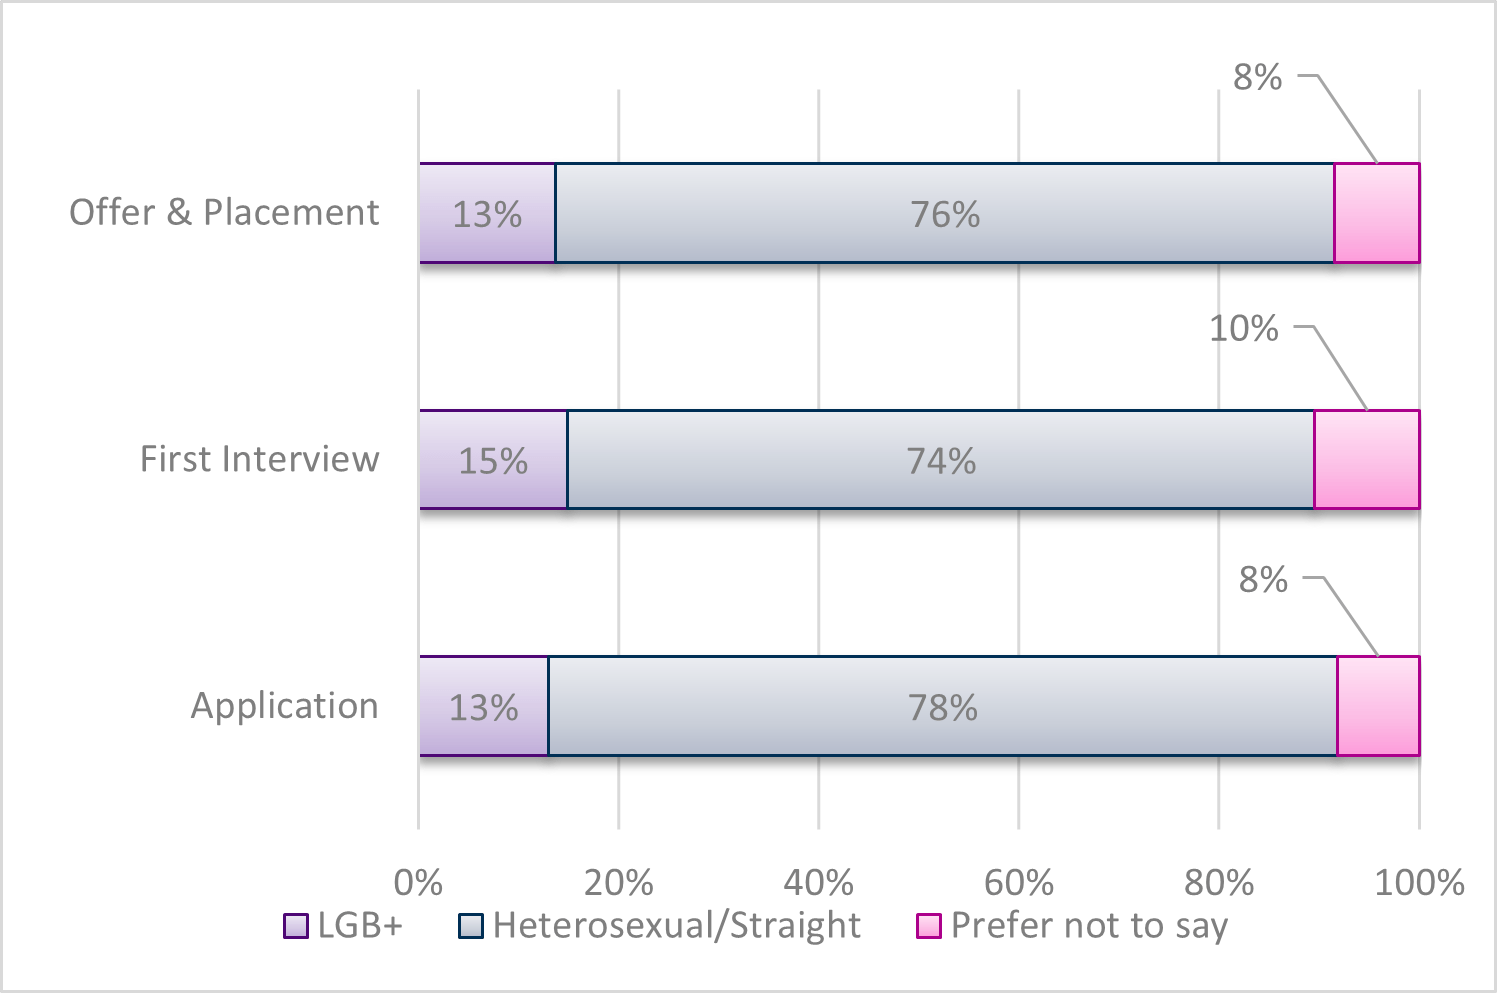
- The proportion of applications from Lesbian, Gay, Bisexual, + (LGB+) people slightly increased from the previous year (up to 12.8% from 12.2%)
- The success rate at appointment for LGB+ candidates is 4.2%, and for heterosexual candidates the success rate is lower at 3.9%. In the previous year both groups had a 6.6% success rate.
- The proportion of appointments to LGB+ people is stable compared with the previous year (from 13% to 13.3%)
- In the previous year 9% of applicants responded ‘Prefer not to say’ when asked about sexual orientation, this has decreased to 8.1% this year. The proportion of appointment with his response is 8.2% (was 9%) and success rate at appointment has changed from 2.1% to 4.1%.
- We did not have ‘not indicated’ responses in the previous year, there is therefore no annual comparative data.
Ethnicity
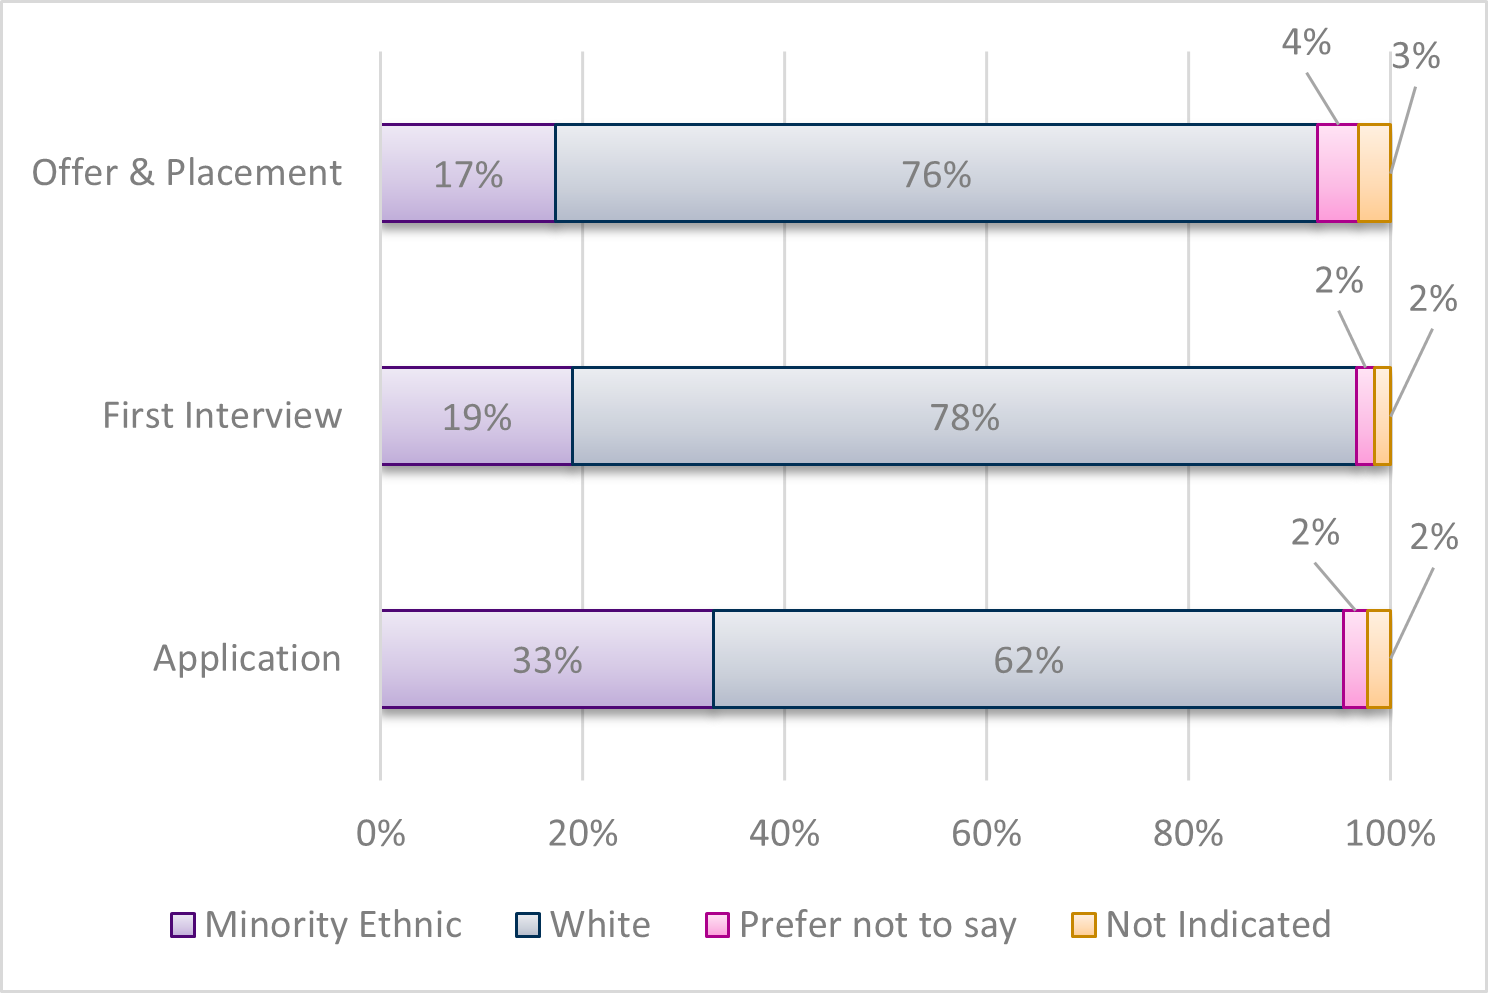
- The proportion of applications from Minority Ethnic (ME) candidates slightly decreased this year (33% compared to 37%, in the previous year. The proportion of applications from White candidates this year was 62.4%
- White candidates have a greater success rate at moving to interview (14.0%) than ME candidates (6.5%).
- At the appointment stage there is a 2.8% greater success rate for White candidates (4.9%) when compared to ME candidates (2.1%). The success rate at appointment for ME candidates is stable compared to the previous year (2%).
- The proportion of all appointments to ME candidates increased to 17.3% compared to 14.5% in the previous year and the corresponding proportion of appointments to White candidates is 75.5% (previously 84%). The proportion of appointments to candidates who have not indicated their ethnicity has increased by 2.1% to 3.1%.
- The success rate at appointment for candidates who did not provide any response to the question about their ethnicity is 5.8%, an increase from 2.6%, in the previous year
Intersectional analysis
| Application | % apps | Stage 3 - First interview | % | Success rate | Stage 4 - Offer and placement | % | Success rate | |
|---|---|---|---|---|---|---|---|---|
| Minority ethnic/female | 281 | 11.6% | 12 | 4.4% | 4.3% | 8 | 8.2% | 3.0% |
| Minority ethnic/male | 335 | 13.9% | 29 | 10.6% | 8.7% | 9 | 9.2% | 3.0% |
| Minority ethnic/in another way | 2 | 0.1% | 0 | 0.0% | 0.0% | 0 | 0.0% | 0.0% |
| White/female | 672 | 27.8% | 89 | 32.6% | 13.2% | 32 | 32.7% | 5.0% |
| White/male | 668 | 27.6% | 108 | 39.6% | 16.2% | 37 | 37.8% | 6.0% |
| White/in another way | 11 | 0.5% | 5 | 1.8% | 45.5% | 0 | 0.0% | 0.0% |
| White/prefer not to say | 18 | 0.7% | 3 | 1.1% | 16.7% | 1 | 1.0% | 6.0% |
| White/not indicated | 141 | 5.8% | 7 | 2.6% | 5.0% | 4 | 4.1% | 3.0% |
| Minority ethnic/prefer not to say | 4 | 0.2% | 0 | 0.0% | 0.0% | 0 | 0.0% | 0.0% |
| Minority ethnic/not indicated | 175 | 7.2% | 11 | 4.0% | 6.3% | 0 | 0.0% | 0.0% |
| Prefer not to say | 59 | 2.4% | 5 | 1.8% | 0.0% | 4 | 4.1% | 0.0% |
| Not indicated | 52 | 2.2% | 4 | 1.5% | 7.7% | 3 | 3.1% | 6.0% |
| Totals | 2418 | 99.0% | 273 | 100% | 98 | 100% |
- Minority ethnic women, have significantly lower success rates at both interview (4.4%) and appointment stages (3%) compared to White women with success rate at interview of 13.2% and at appointment of 5%. White men had the highest overall success rate at appointment (6%)
- While White men and White women progress through the recruitment stages at higher rates, minority ethnic groups—despite making up a substantial portion of applications—are not advancing proportionally.
- The census rate for minority ethnic groups is 12.9%, the proportion of applications from ME men and ME women is significantly above this rate and yet it is demonstrated that their hiring success rates is lower than that of White candidates.
- The findings from the intersectional recruitment data analysis demonstrate disparities in progression from application to hire for candidates on the basis of sex and ethnicity. This suggests there are potential barriers for candidates on the basis of their intersectional identities.
- A notable percentage of applicants chose “Prefer not to say” or did not indicate their ethnicity/sex this year.
Diversity pay gaps
Diversity pay gaps
This year, we have reported on the following pay gaps information:
- gender
- ethnicity
- disability
- sexual orientation (LGB+)
Reporting on our diversity pay gaps is important to us in allowing us to identify where we need to improve and to plan accordingly.
Measuring the Ethnicity, Disability and LGB+ pay gaps is limited by the declaration rates from the staff group.
Method of Calculation
For the measures in this report the median and mean hourly rates of pay were calculated. The median pay is the middle point of the population, and the mean pay is the arithmetic average of a population.
Quartiles
This measures the proportion of different groups in each quartile when divided into four groups ordered from lowest to highest pay. This demonstrates whether there is an overrepresentation of one group within lower or higher paid jobs.
This report details the summary findings for the Diversity Pay Gaps 2025 (at milestone date 31 March 2025).
Our current payscales (55KB, pdf) posted 09 May 2025
Gender Pay Gap
Gender Pay Gap (GPG)
Data tables available for download here (87KB Excel document)
The Gender Pay Gap is the difference between average hourly earnings (excluding overtime) of men and women as a proportion of average hourly earnings (excluding overtime) of men's earnings. A negative gender pay gap means that on average women in a staff group are paid more than men.
How do we compare?
The table below provides comparison datasets for UK and Scotland derived from the Office for National Statistics (ONS) annual survey of hours and earnings (ASHE) median pay gap series.
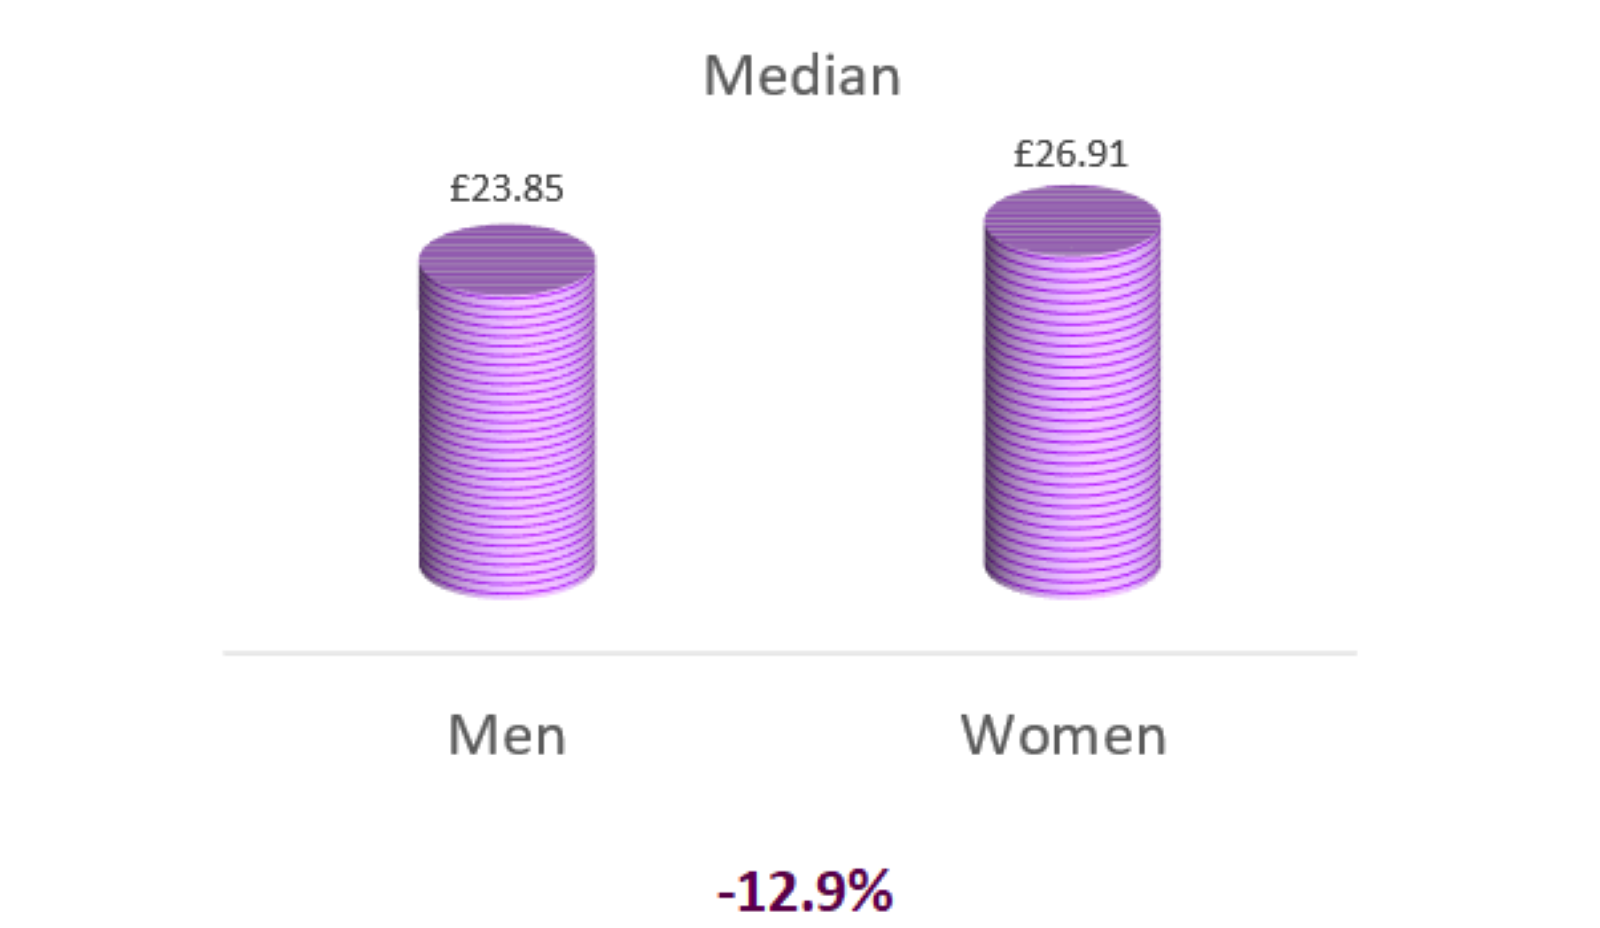
Median Gender Pay Gaps
| UK (2025) | Scotland (2025) | Scottish Public Sector (2025) | Scottish Parliament (2025) | |
|---|---|---|---|---|
| GPG - all staff | 12.8% | 9.4% | 8.6% | -9.7% |
| GPG - full-time staff | 6.9% | 3.5% | 3.3% | -12.9% |
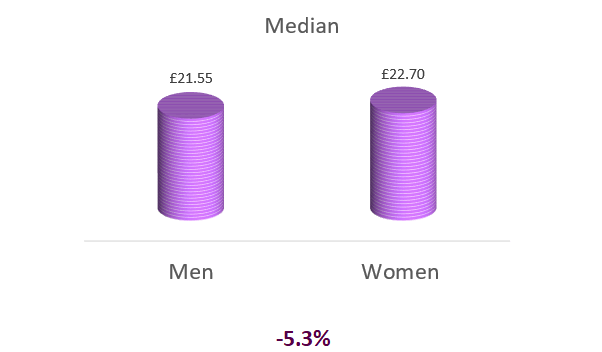
| GPG - part-time staff | -2.9% | -8.4% | 4.3% | -5.3% |
Annual changes in Median GPG (All staff)
| 2025 | 2024 | 2023 | 2022 | 2021 | 2020 |
|---|---|---|---|---|---|
| -9.7% | 0% | 0% |
11.2% | 7.6% | 2.4% |
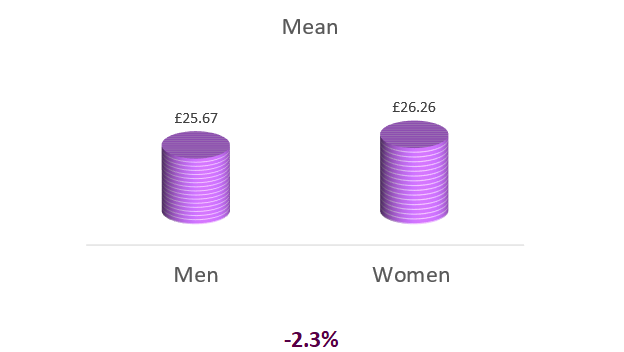
Median and mean GPG in hourly pay (All staff)
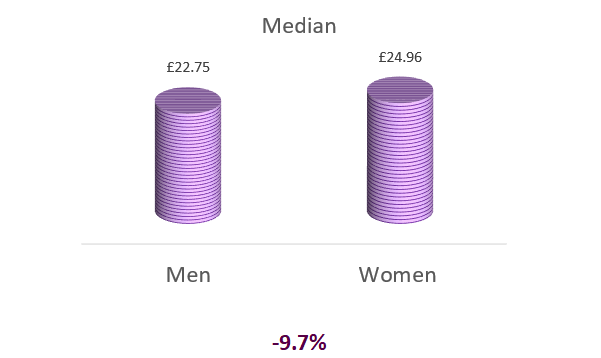
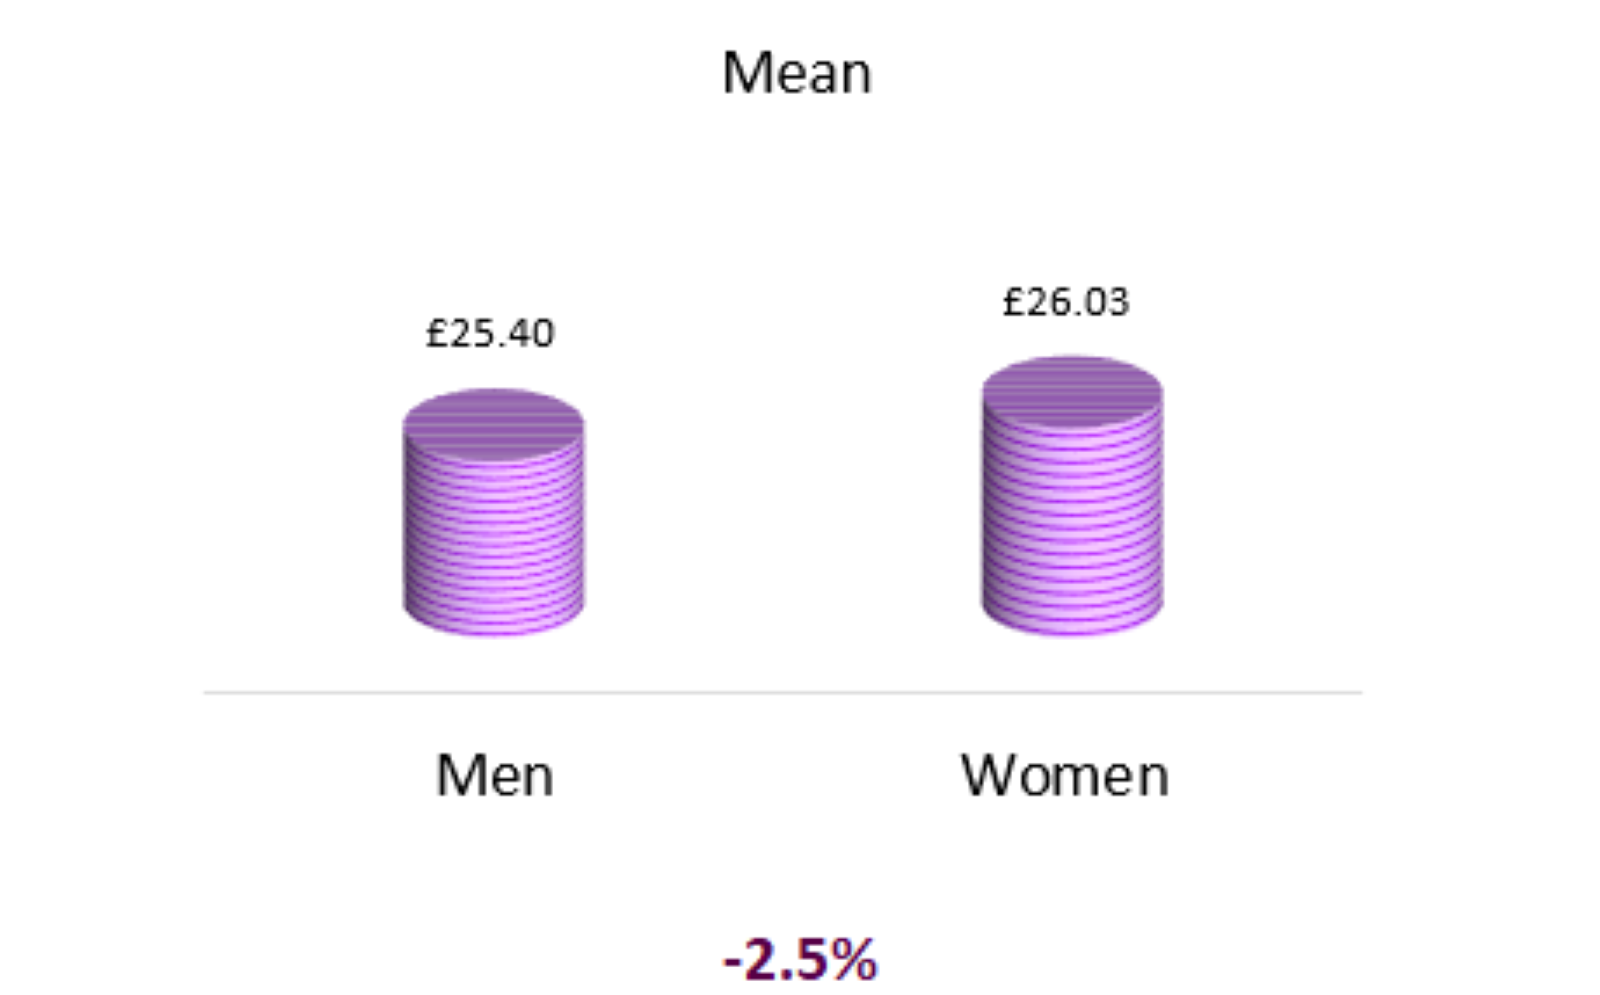
High level gender pay gap (median single figure for gross pay excluding overtime and other additional payments) has this year decreased on prior year rate, moving from 0% to -4.8%., and thus a negative gender pay gap is reflected for 2024/25.
The median spine point for female staff remains the mid-point of Grade 4 (point 8 on the pay scale), with a reduction in median spine point for male staff to just below the lower point of Grade 4 (midway between points 5 and 6 on the pay scale).
Gender, grade and working pattern
| Grade | Men F/T | Men P/T | Women F/T | Women P/T | Total |
|---|---|---|---|---|---|
| 2 | 78 | 8 | 71 | 23 | 180 |
| 3 | 41 | 8 | 57 | 19 | 125 |
| 4 | 60 | 8 | 61 | 24 | 153 |
| 5 | 44 |
2 | 48 | 12 | 106 |
| 6 | 17 | 0 | 16 | 3 | 36 |
| 7 and above | 4 | 0 | 7 | 0 | 11 |
| Solicitors Office |
4 | 0 | 12 | 5 | 21 |
| 248 | 26 | 272 | 86 | 632 |
Gross pay for full time staff by gender
Gross pay for part time staff by gender
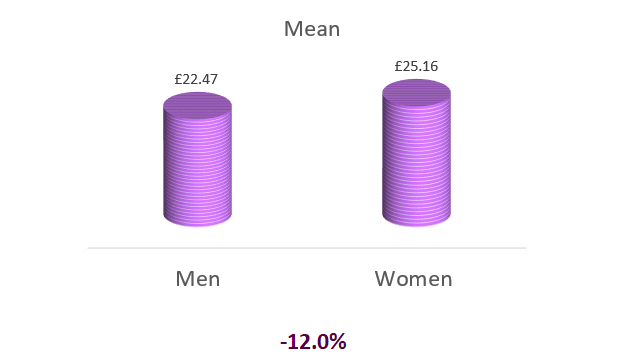
Median and Mean exceptional contribution award (ECA) pay gap
Proportion of staff receiving ECA by gender
| Gender | Staff receiving ECA | % of ECA | % in gender | % all staff | Total Staff |
|---|---|---|---|---|---|
| Men | 16 | 32.0% | 5.8% | 2.5% | 274 |
| Women | 34 | 68.0% | 9.5% | 5.4% | 358 |
| Total | 50 | 7.9% | 632 |
Proportion of men and women in each pay quartile
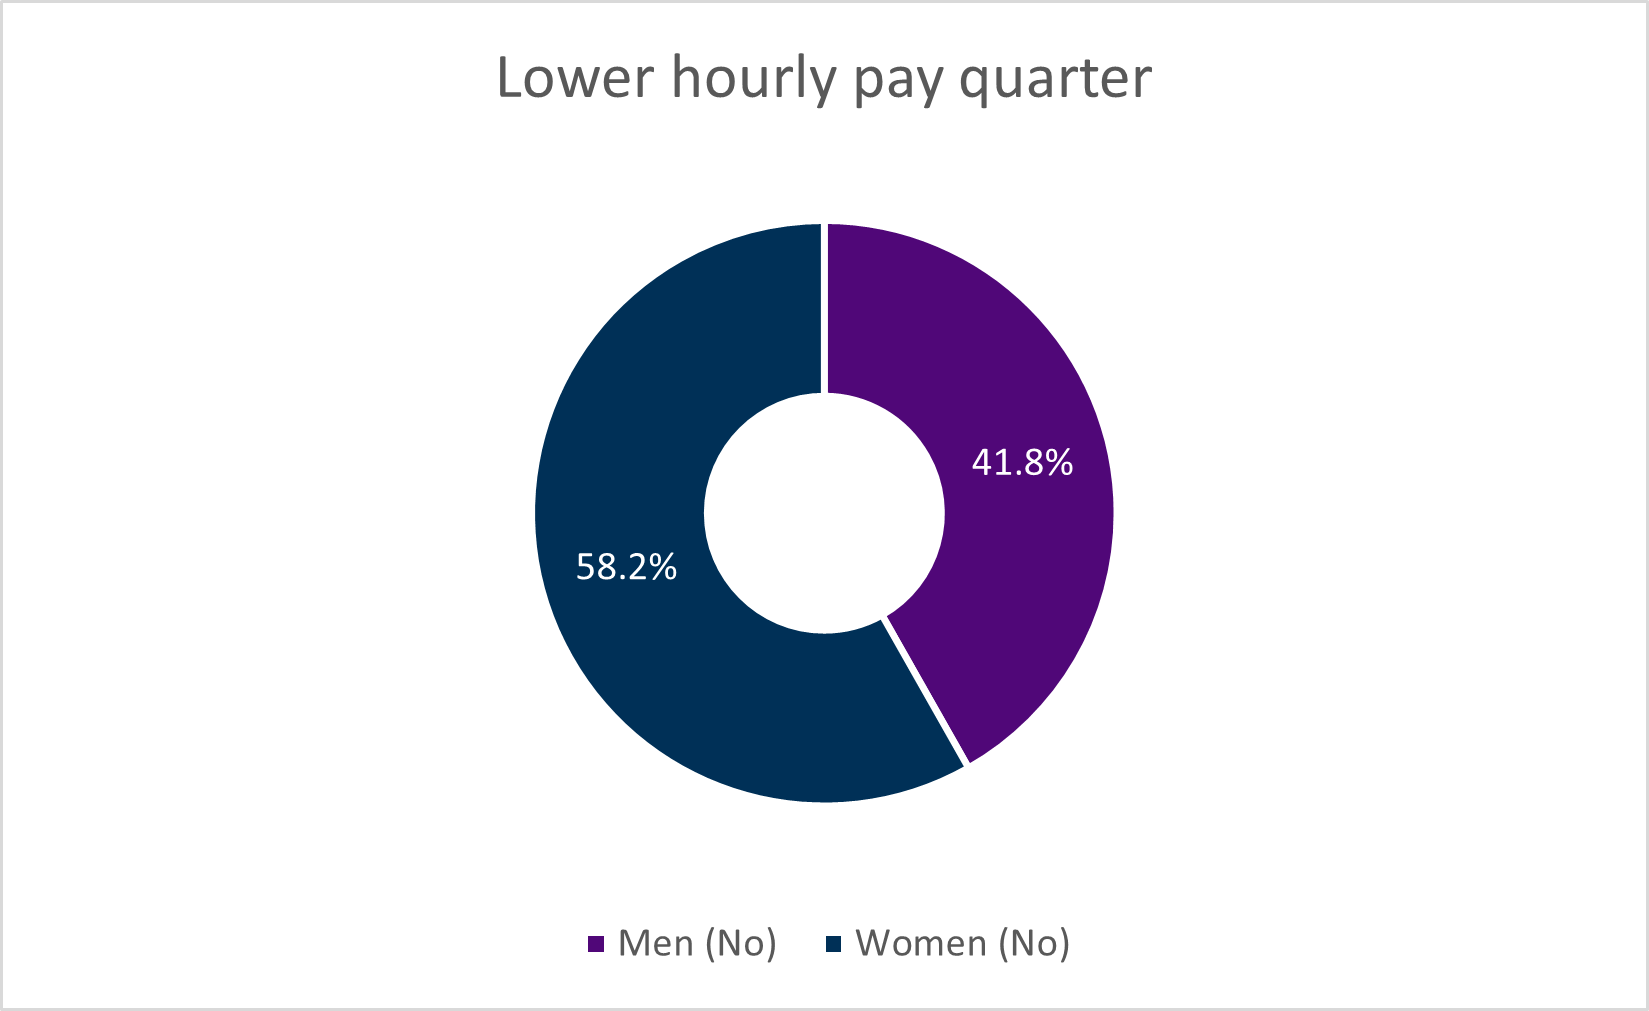
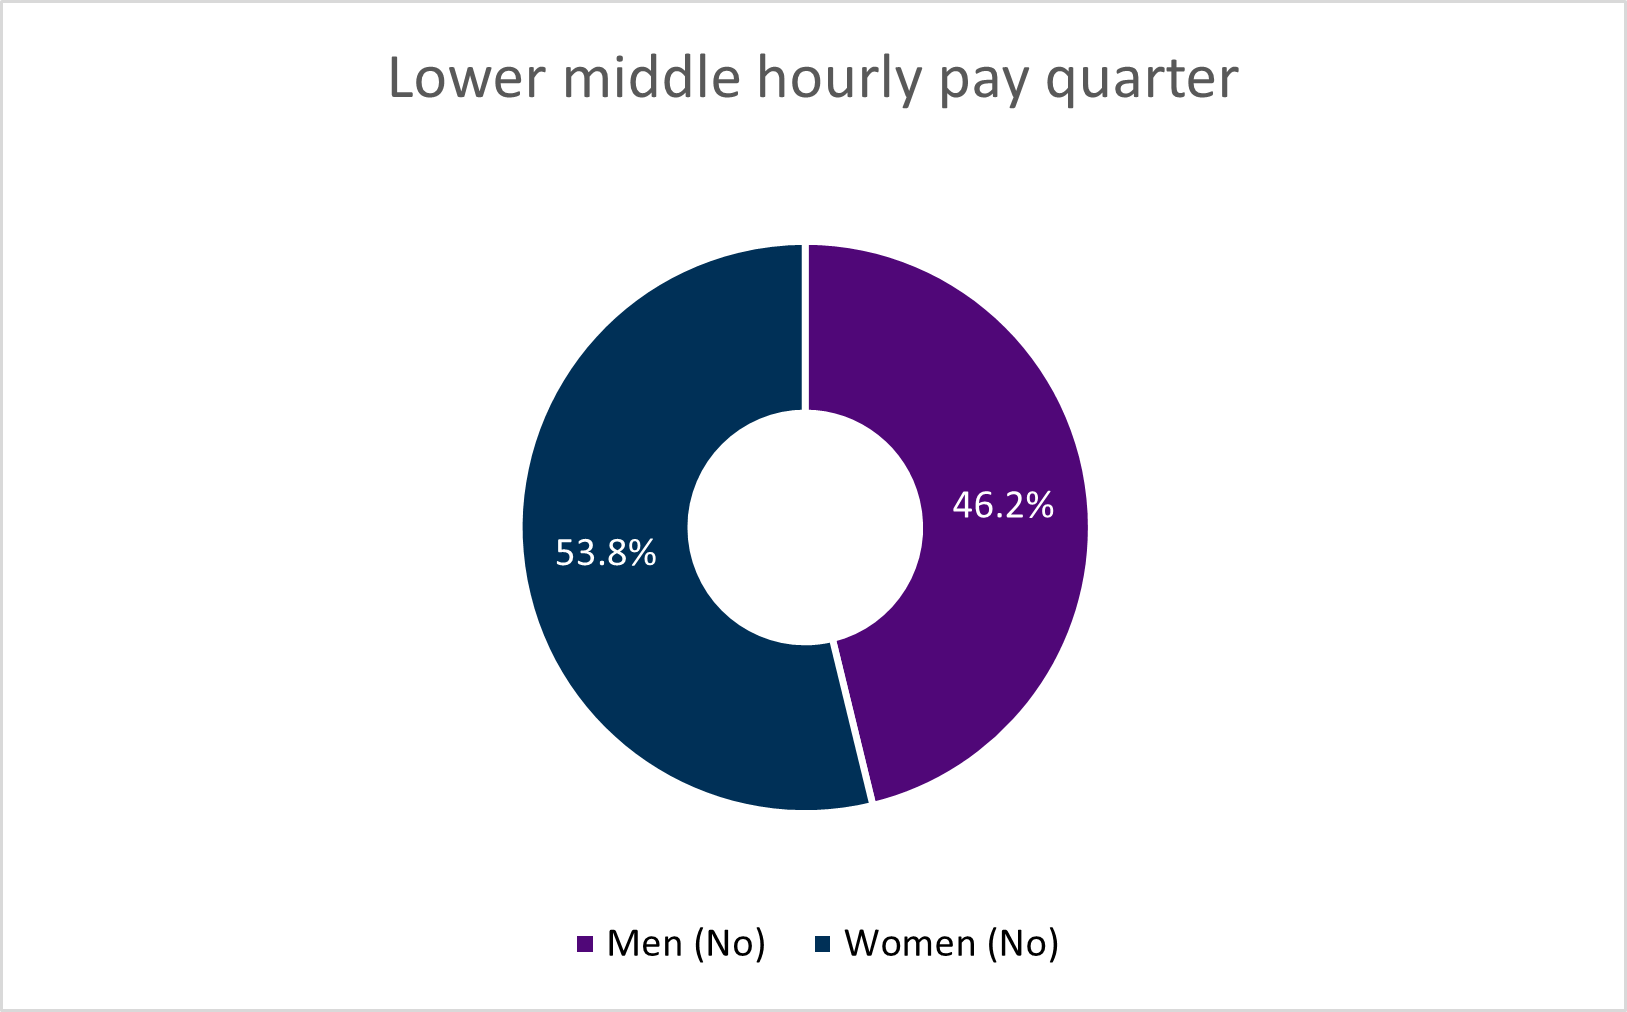
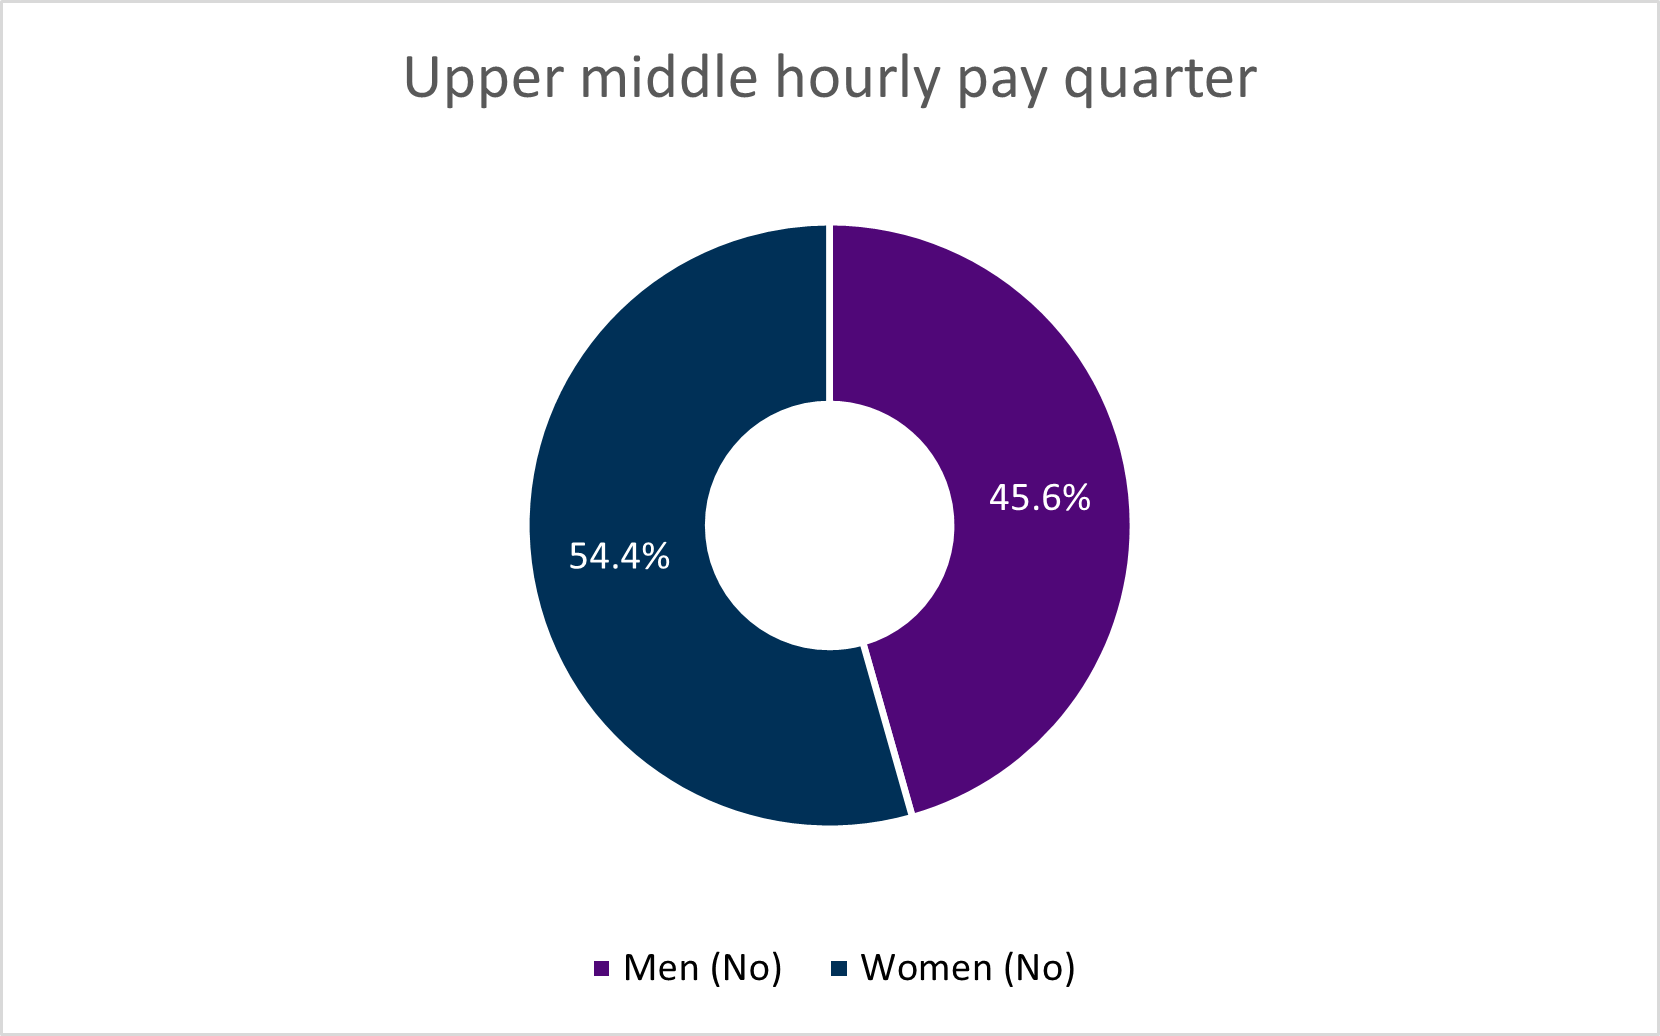
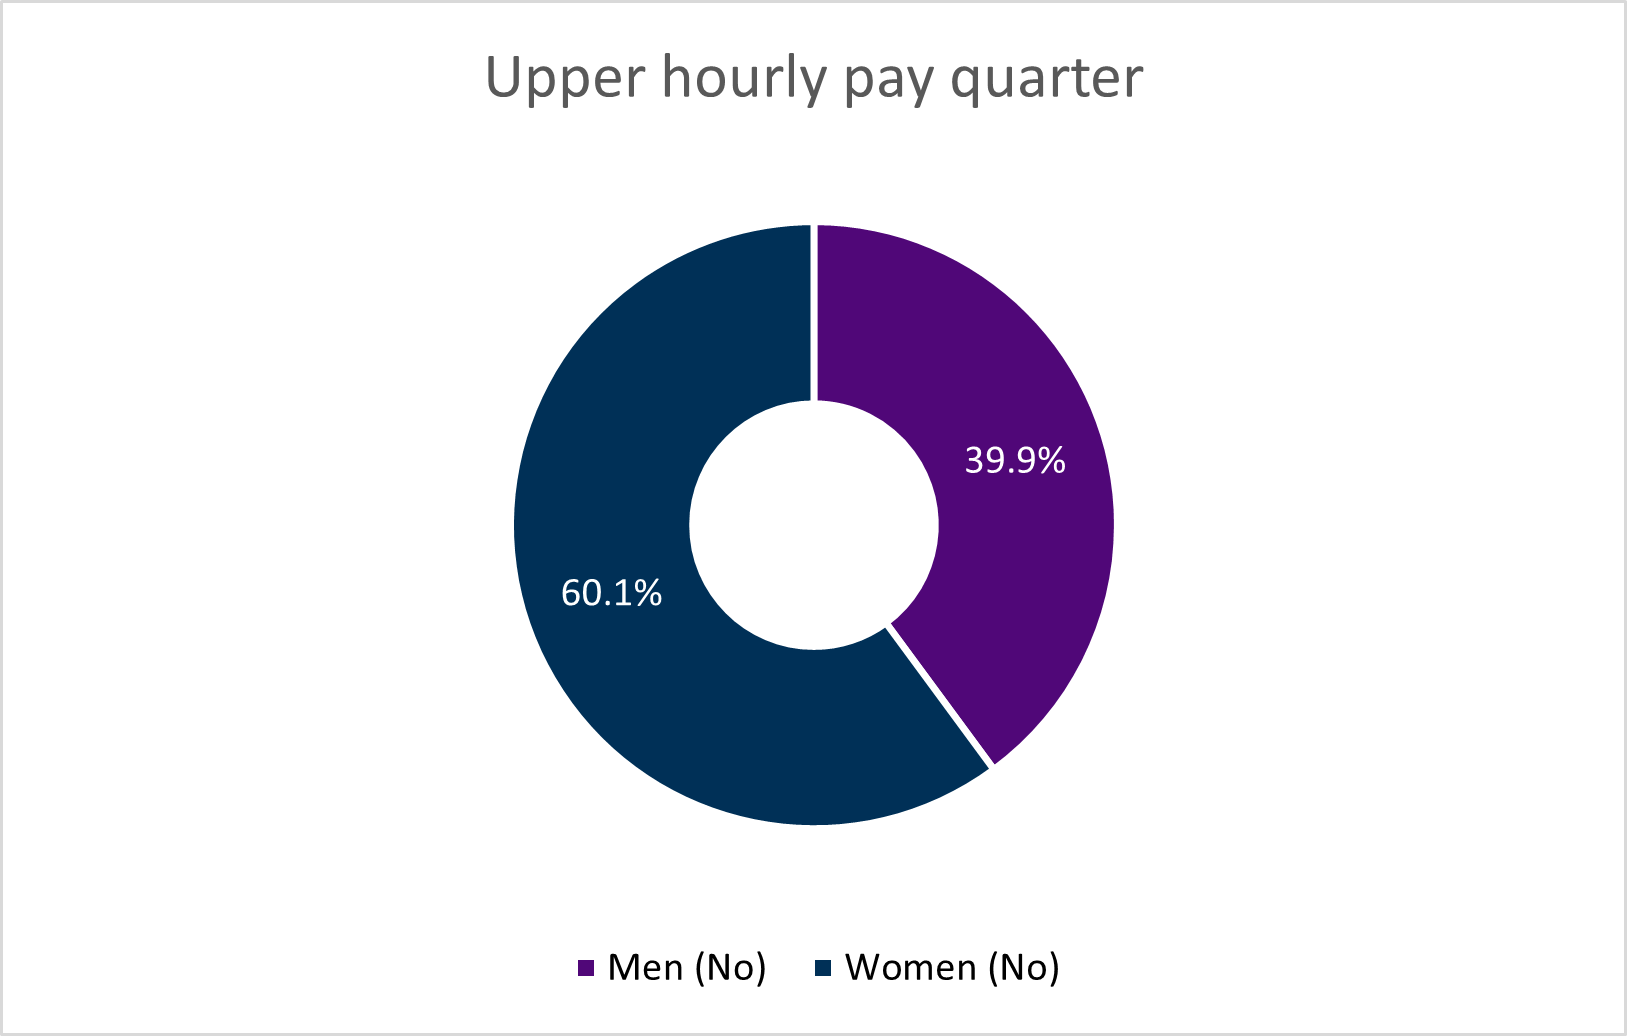
The quartile test on gender pay for all employees shows an overall split broadly in line with the ratio of the staffing compliment 57:43 female to male. Notably, there is a slightly higher representation of females than the ratio for the full organisation within the top and bottom quartiles (both at circa 60%). The top quartile which reflects a headcount proportion rate for females of almost 3% above the organisational complement ratio, suggesting a greater increase in this cohort than others.
Ethnicity Pay Gap
Ethnicity Pay Gap
Data tables available for download here (87KB Excel document)
Our Ethnicity Pay Gap (EPG) measures the average difference in pay between all staff who have identified as Minority Ethnic and those who have identified as a White ethnic group. We have placed our staff into two cohorts due to the relatively small dataset size.
In reporting on the Ethnicity Pay Gap we have considered the previous UK Government calculating advice and have aligned with this where we have sufficient data to do so. We will keep the calculation method under review for any new advice and legislative requirements from the current UK government and for opportunities to make calculations on a more granular level.
The median ethnicity pay gap for all staff has seen a further decrease of 4.1% this year, to a rate of 13.2%. This is the lowest rate since we first reported on ethnicity pay gap in 2019/20.
Annual changes in median EPG
| 2024/25 | 2023/24 | 2022/23 | 2021/22 | 2020/21 | 2019/20 |
|---|---|---|---|---|---|
| 13.2% | 17.3% | 20.1% |
30.1% | 27.6% | 21.3% |
Median and mean EPG in hourly pay (for all staff)
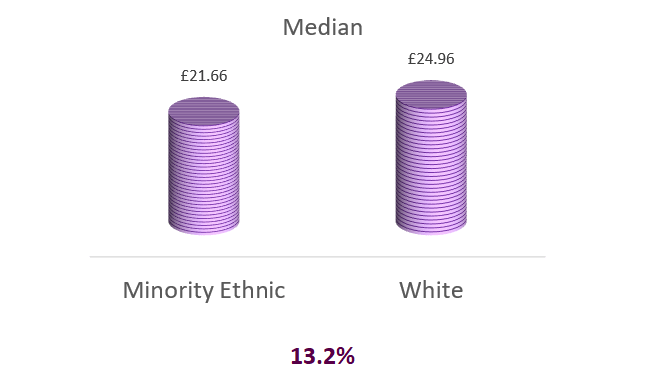
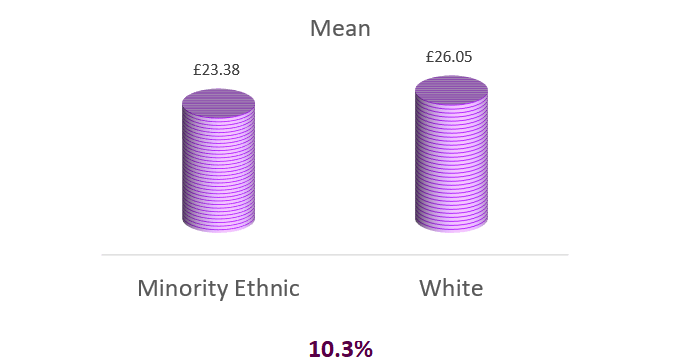
This figure looks at the hourly rate of pay for all staff (full-time and part-time) by ethnicity, it is the high-level indicator of earning power. The ethnicity pay gap has seen a significant decrease, from 17.3% last year to 13.2% this year, a fall of more than 4 percentage points.
The median point salary point for Minority Ethnic staff is at the top of the Grade 3 scale. This is an increase on 2023/24 when the median point was midway between points 4 and 5 of the scale. The median point for White staff in 2024 was Grade 4, point 7 – the middle of the Grade 4 scale, this year the median point for White staff remains broadly consistent with last year seeing a marginal increase to slightly above the bottom of Grade 4 on pay scale. This analysis is based on an ethnicity declaration rate of 69.1% (an increase in declaration of 15.1% on last year’s rate).
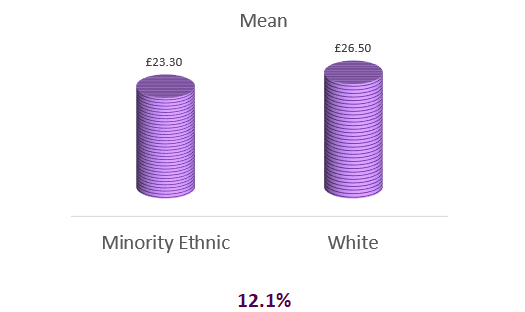
Analysis suggests that the primary reason for the reduction in pay gap this year is related to the increase in declaration rate from the previous year- an increase of 12.1% in declaration across the staffing group is visible.
Further, though there has been an increase in Minority Ethnic representation following recruitment, this has been at the lower end of the pay scale.
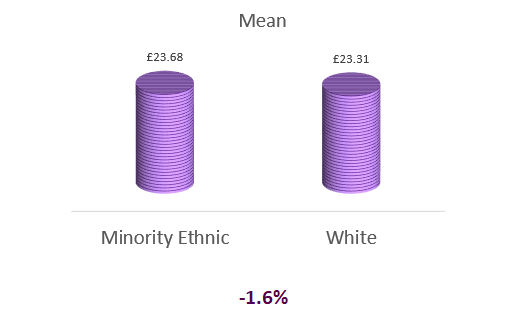
Median and mean EPG in hourly pay (for full-time staff)
.png?h=311&w=505)
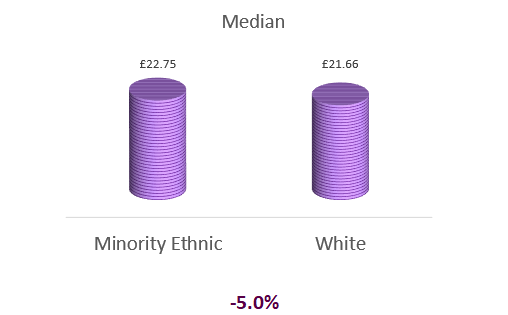
Median and mean EPG in hourly pay (for part-time staff)
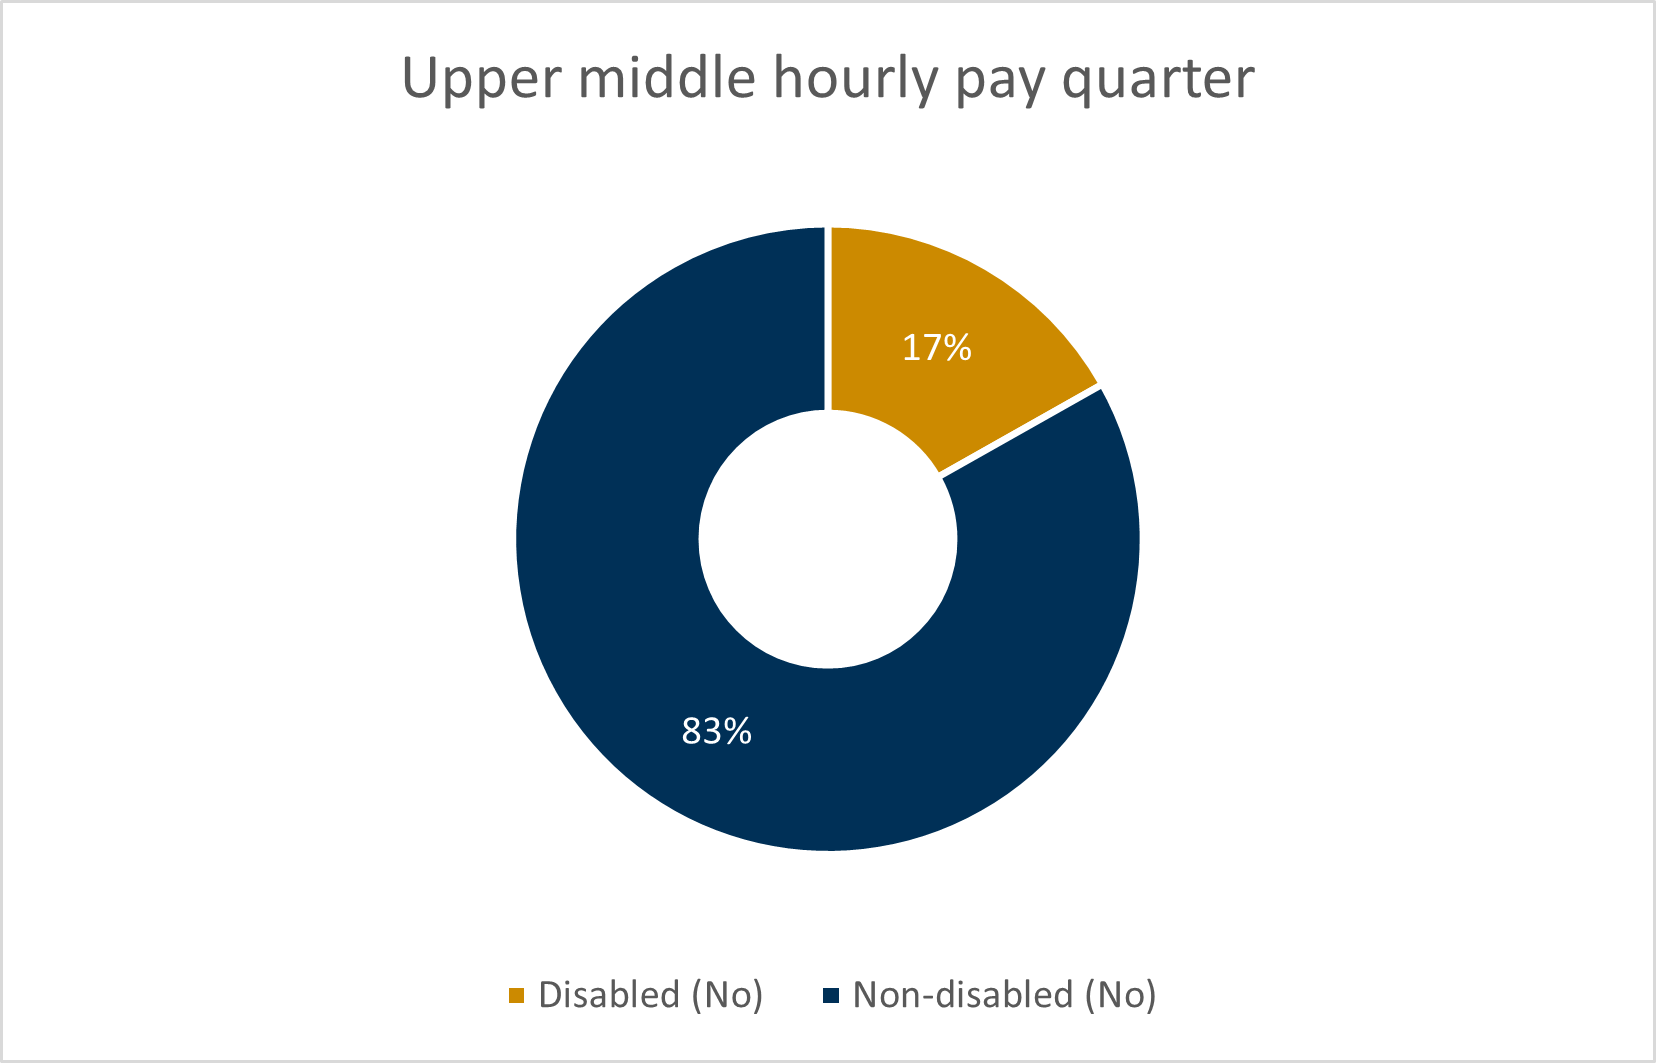
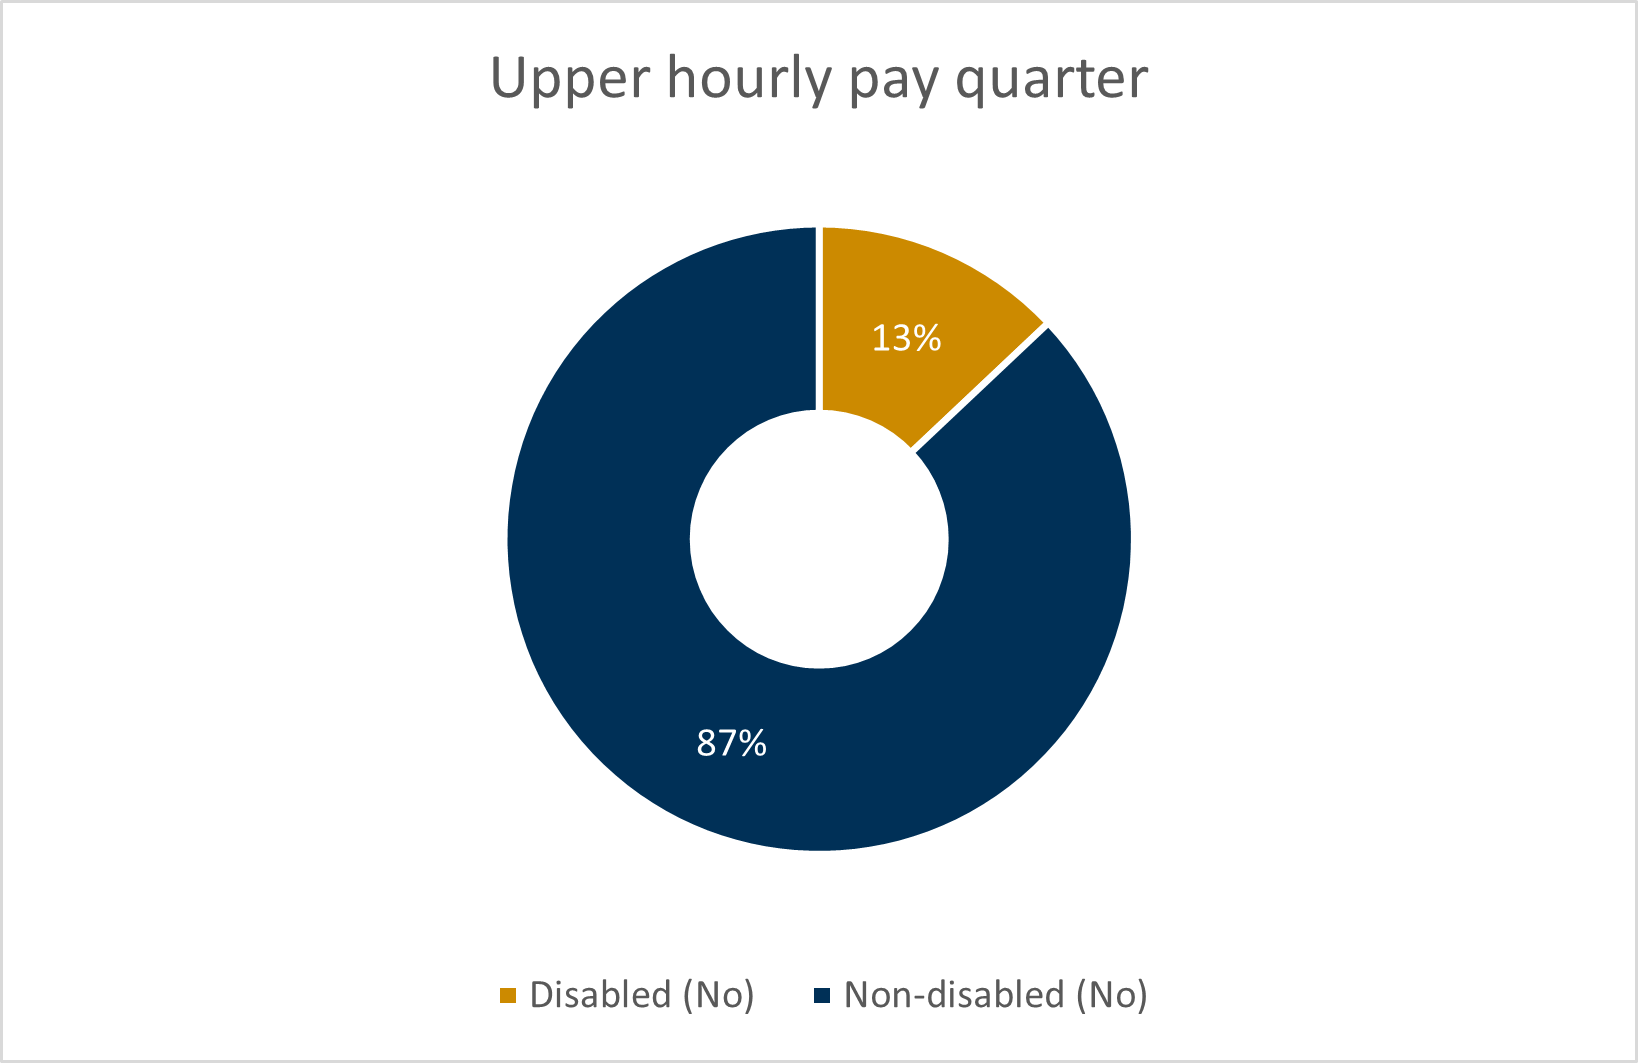
Ethnicity and pay quartiles
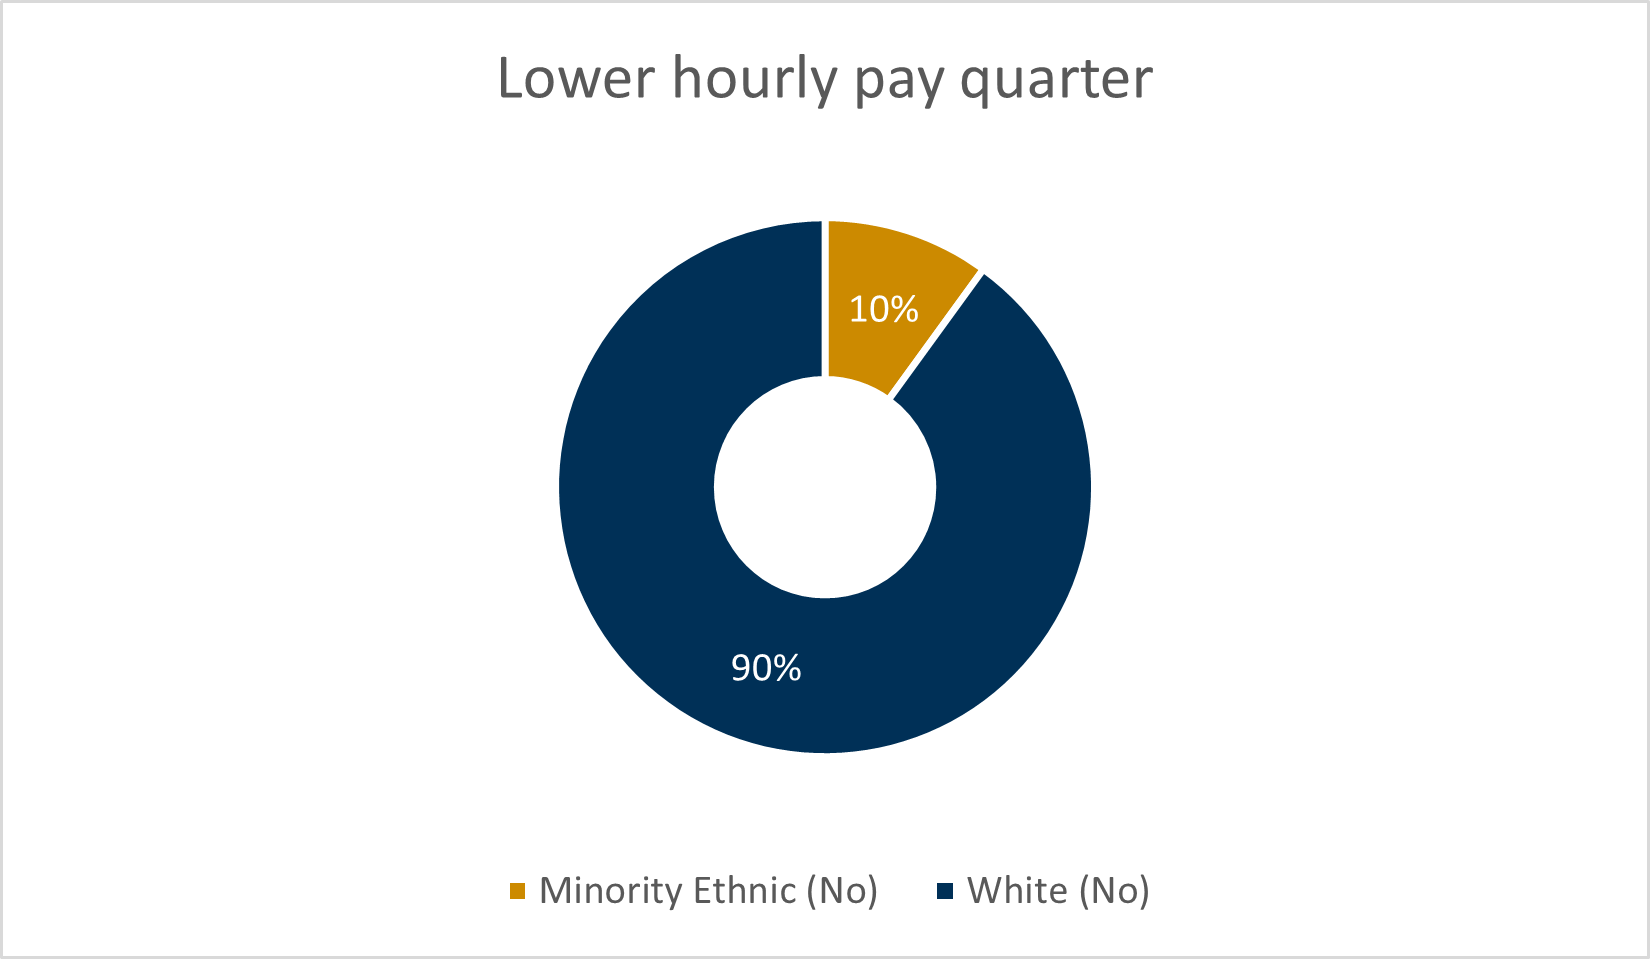
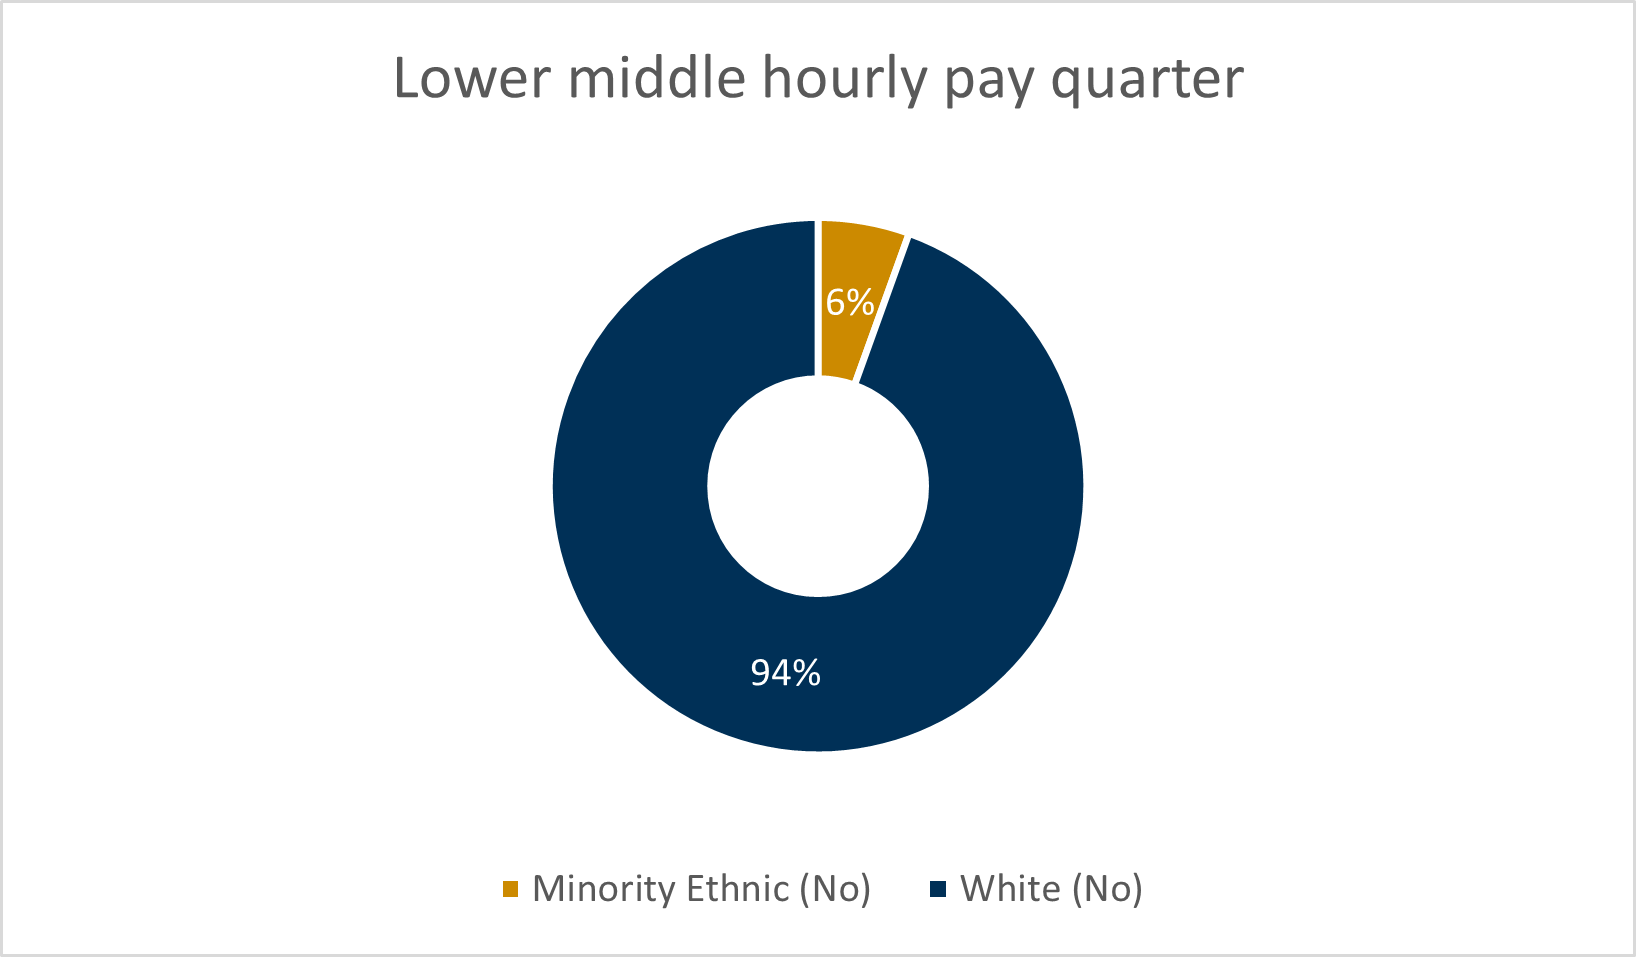
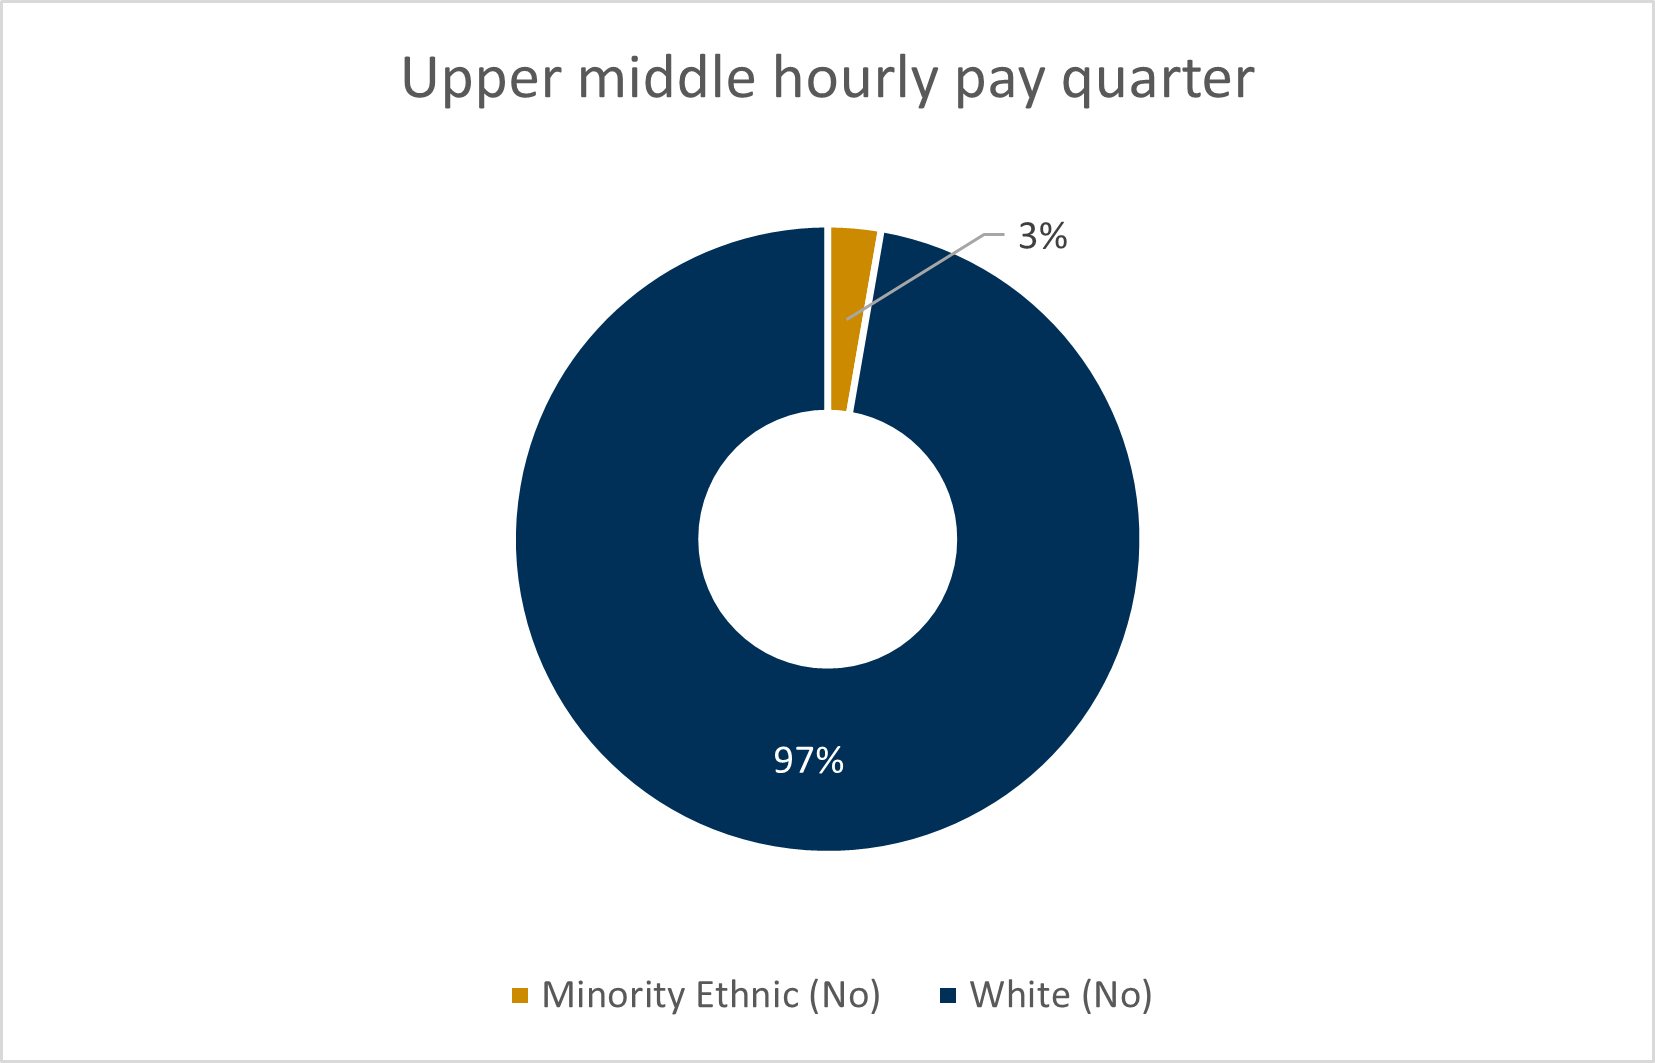
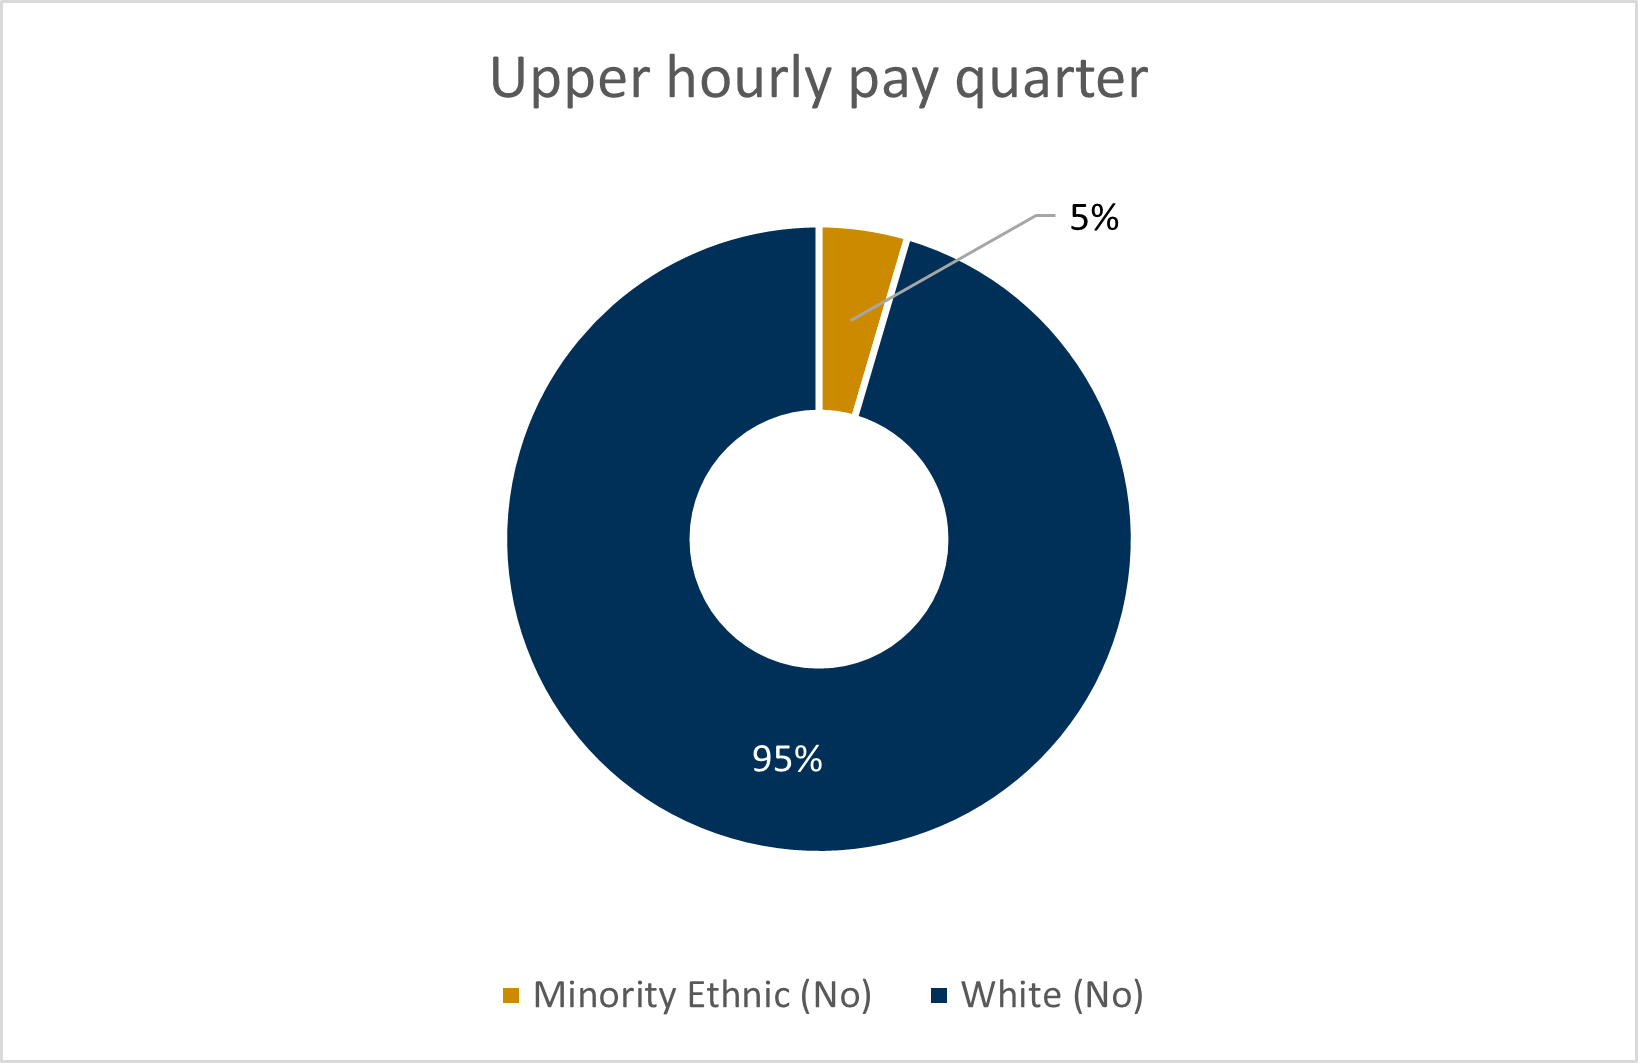
This measures the proportion of staff by ethnicity in each quartile when divided into four groups ordered from lowest to highest pay. This demonstrates whether there is an overrepresentation of one group within lower or higher paid jobs.
Based on the available data, there is an over representation of Minority Ethnic staff in the lower hourly pay quartile (10.0%) when considered against a 4% representation of Minority Ethnic staff in the whole staff group. This is consistent with 60% of Minority Ethnic staff being employed in grades 1-3 in our pay structure. There has, however, been a relatively significant increase in representation at the upper middle hourly pay quarter.
Disability Pay Gap
Disability Pay Gap
Data tables available for download here (87KB Excel document)
The Disability Pay Gap (DPG) measures the difference in pay between all staff who have declared a disability, and those staff who have not declared a disability.
There is not an agreed format for disability pay gap reporting at this time, we have therefore made the decision to align with some of the measures required for Gender Pay Gap reporting.
For comparison the most recently available UK median disability pay gap reported by the Office for National Statistics (ONS) is 12.7%.
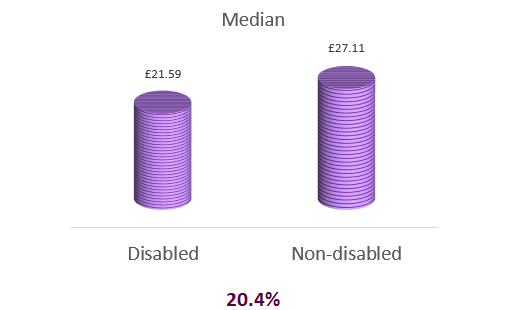
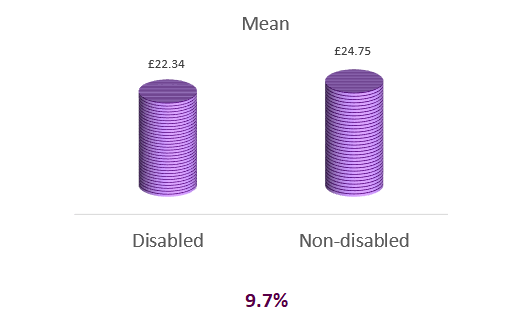
This year the high-level median Disability Pay Gap for SPCB staff has seen an increase on the prior year at 19.5%. The pay gap is 20.4% for full-time staff and 1% for part-time staff. There has been a notable decrease in response rate this year which may account for the change in reported pay gap this year.
Annual changes in median DPG
| 2024/25 | 2023/24 | 2022/23 | 2021/22 | 2020/21 | 2019/20 |
|---|---|---|---|---|---|
| 19.5% | 13.2% | 4.8% |
13.4% | 7.6% | 2.4% |
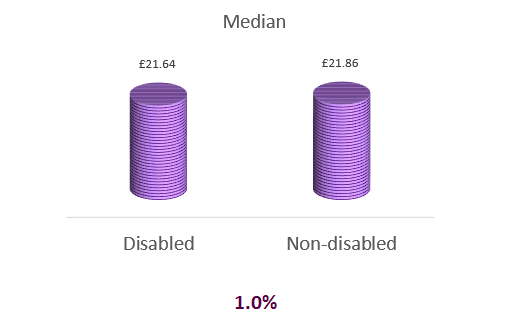
Median and mean DPG in hourly pay (for all staff)
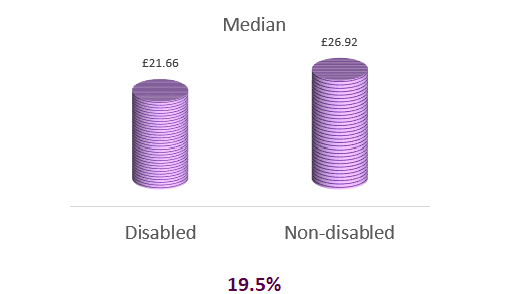
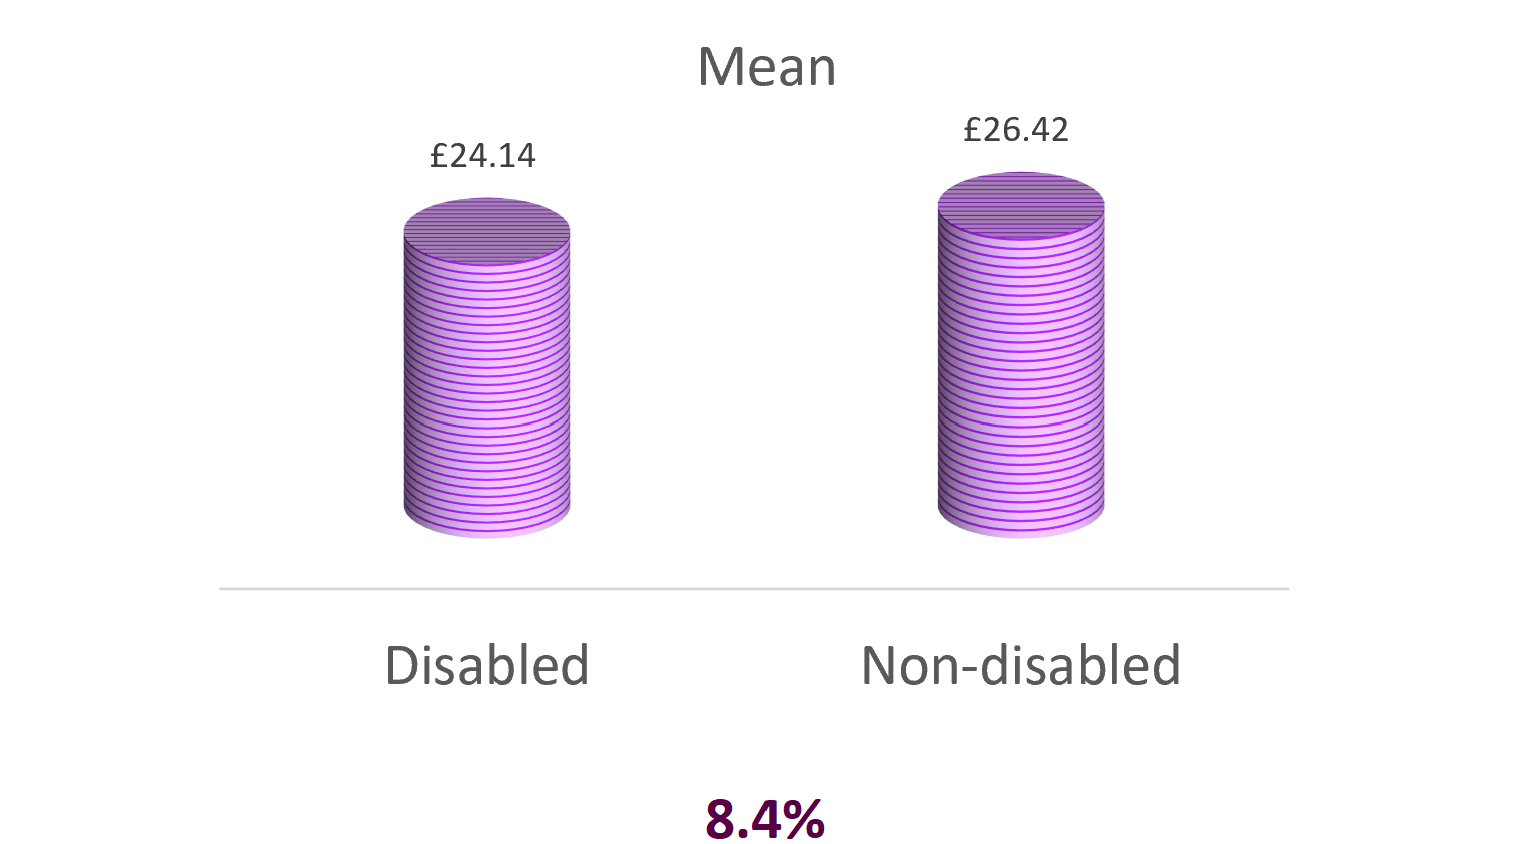
The median salary point for staff who have declared a disability is the top of Grade 3 of our salary scale The equivalent figure for staff who have declared they don’t have a disability is in the middle of Grade 4.
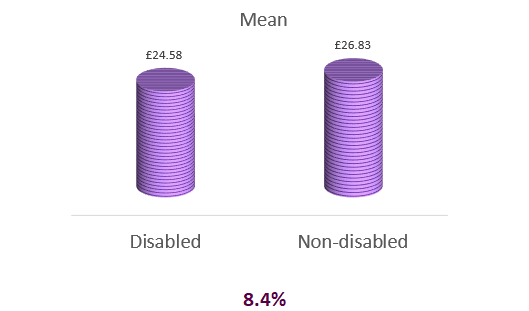
Median and mean DPG in hourly pay (for full-time staff)
Median and mean DPG in hourly pay (for part-time staff)
Disability and pay quartiles
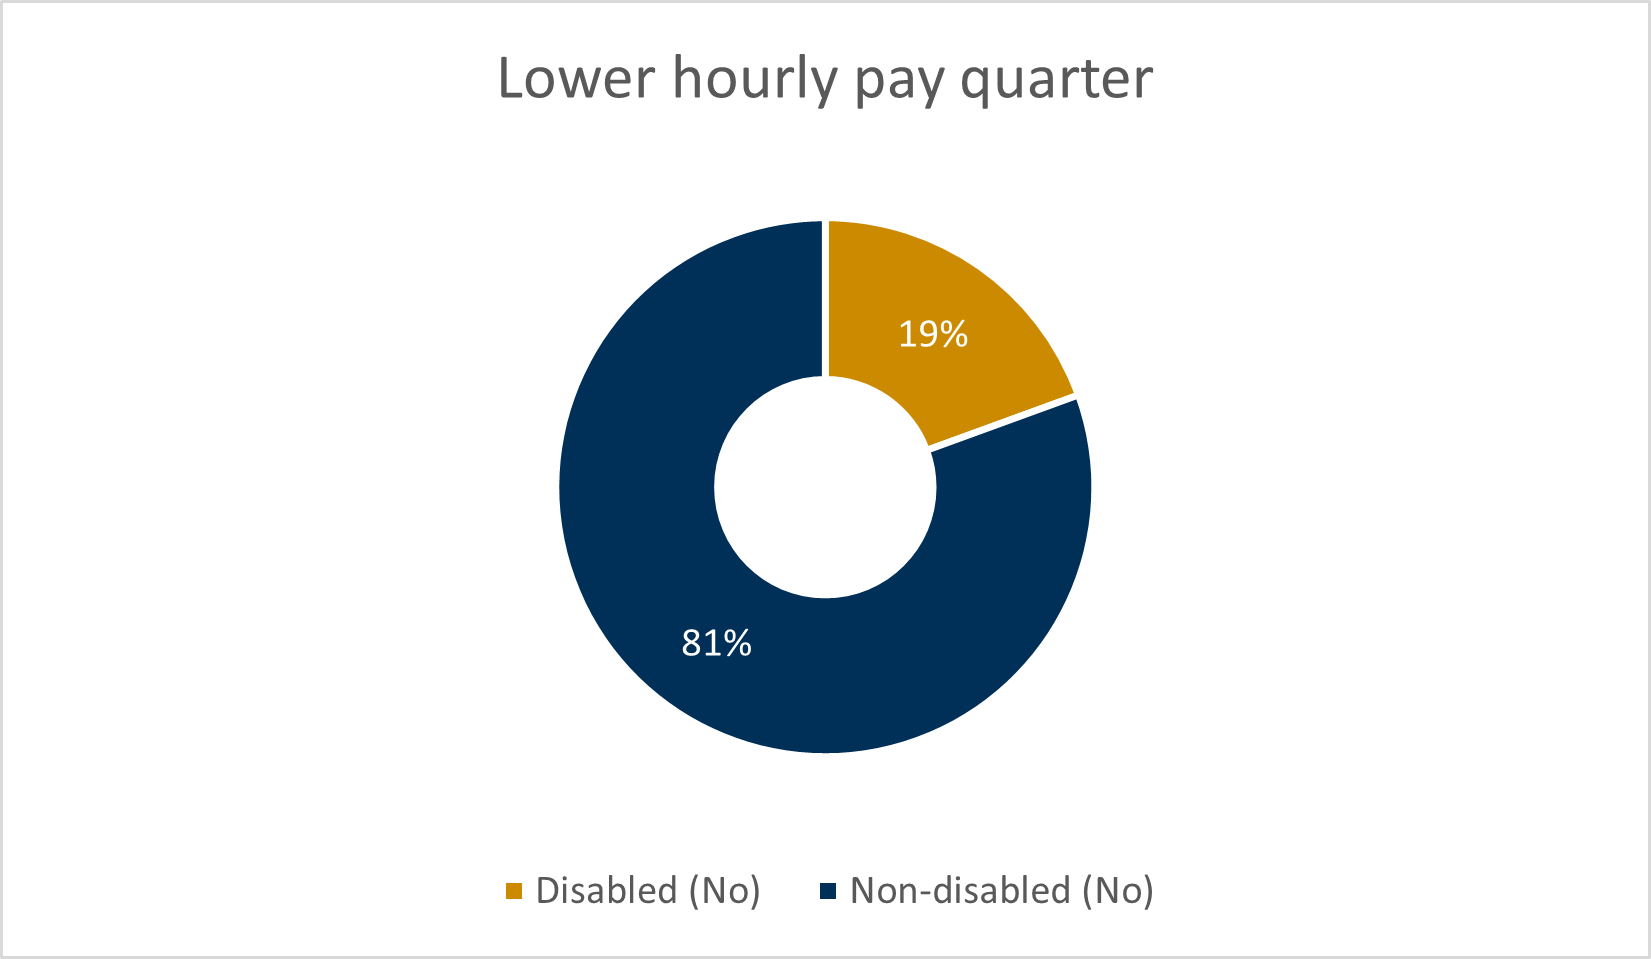
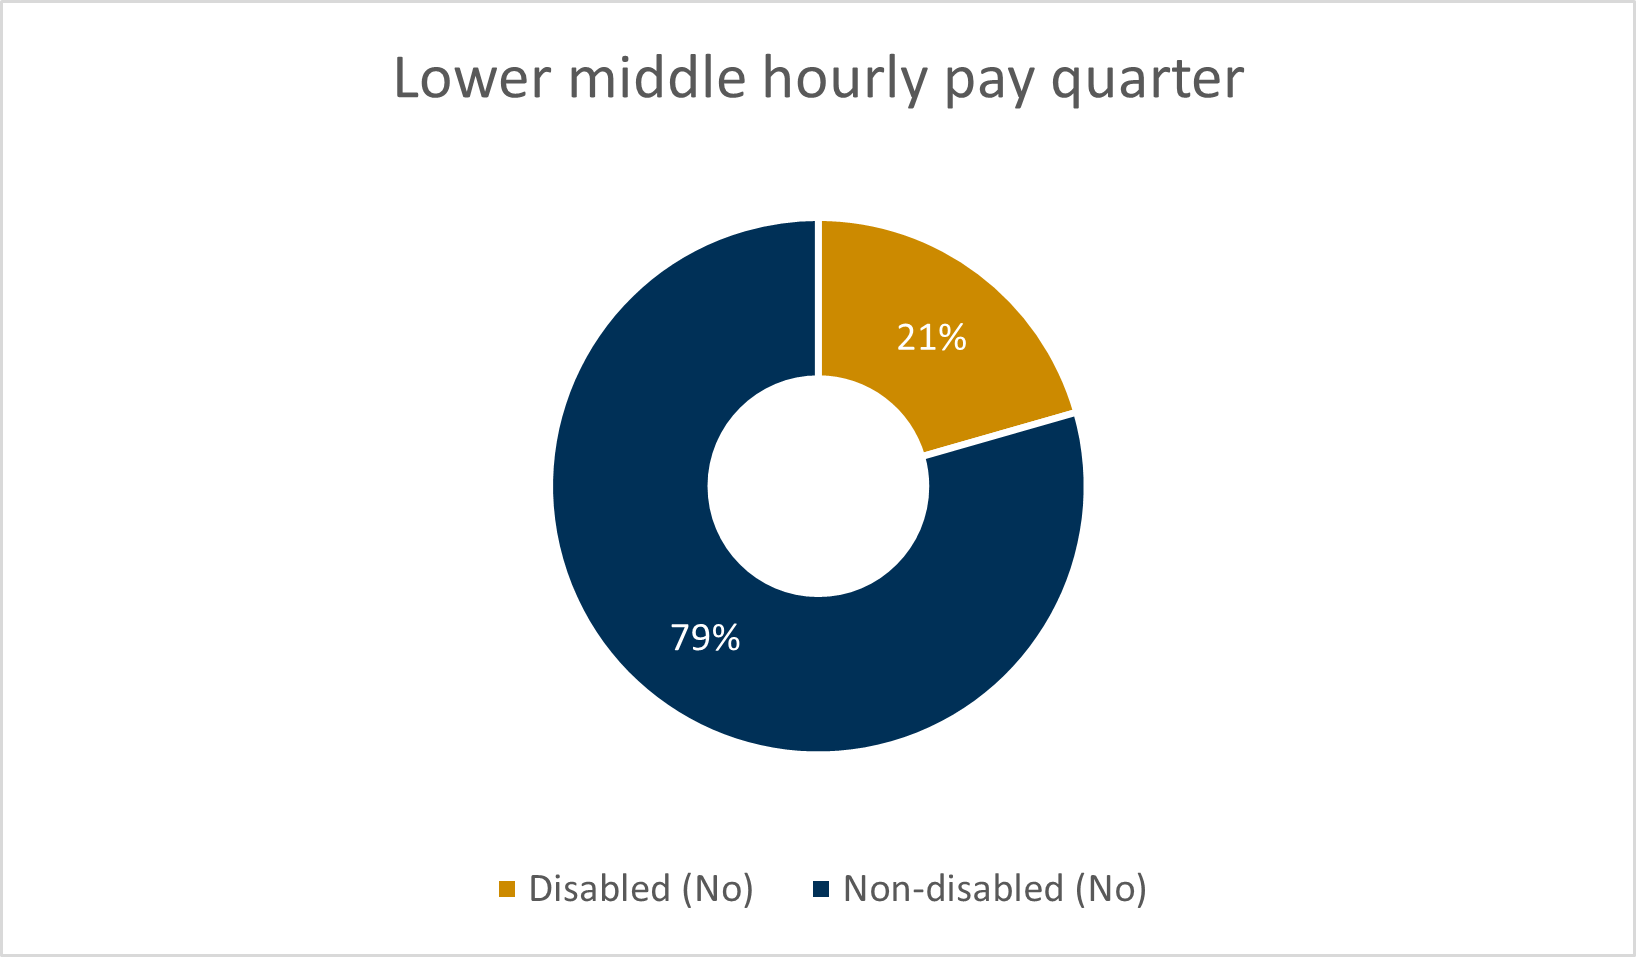
The proportion of disabled staff in our whole staff group is 11.9%. When staff are placed into pay quartiles, we can see that disabled staff are significantly overrepresented in the lower middle hourly pay quarter. This representation of disabled people in this quartile has seen a significant increase (circa 4 percentage points) when compared to the previous year, from 16% to 21%. Close to 60% of all staff who have declared a disability are represented in the lower two quartiles. This is, however, less than the previous year.
The proportion of staff declaring a disability in both of the upper middle and upper hourly pay quarters has, however, increased by 4 percentage points.
LGB+ Pay Gap
LGB+ Pay Gap
Data tables available for download here (87KB Excel document)
There is not an agreed format for Lesbian, Gay, Bisexual, + (LGB+) pay gap reporting at this time, we have therefore made the decision to align the measures to those required for Gender Pay Gap reporting.
The data is limited by the sexual orientation declaration rate from the staff group. At 31 March 2025 the declaration rate was 65.7%. As with the Ethnicity Pay Gap, we have placed our staff into two cohorts due to the relatively small dataset size.
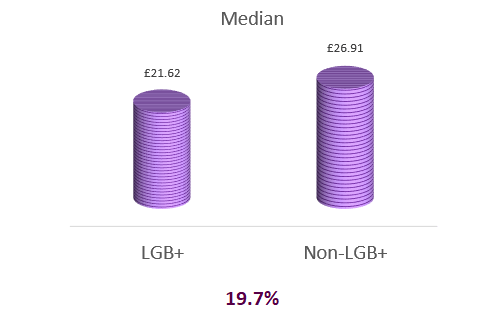
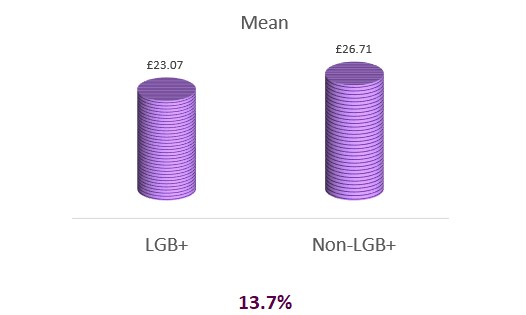
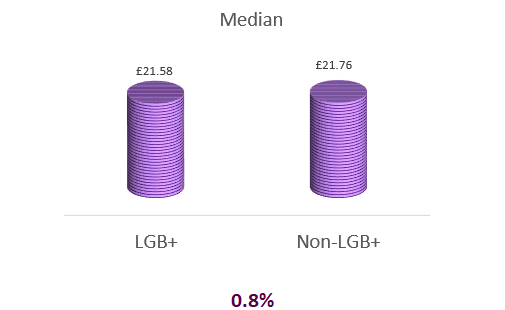
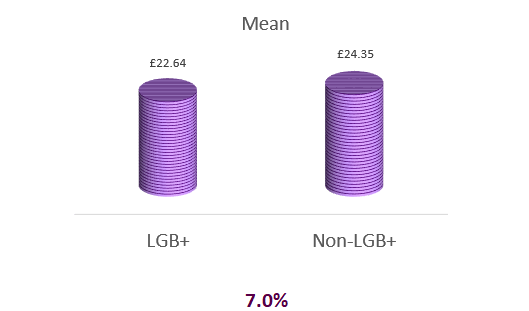
This year the high-level median LGB+ Pay Gap for all staff is 13.2% (down from 20.1% in 2024). The median pay gap is 19.7% for full-time staff, and 0.8% for part-time staff.
Annual changes in Median LGB+ Pay Gap
| 2024/25 | 2023/24 | 2022/23 | 2021/22 |
|---|---|---|---|
| 13.2% | 20.1% | 16.1% |
9.8% |
Median and Mean LGB+ pay gap in hourly pay (for all staff)
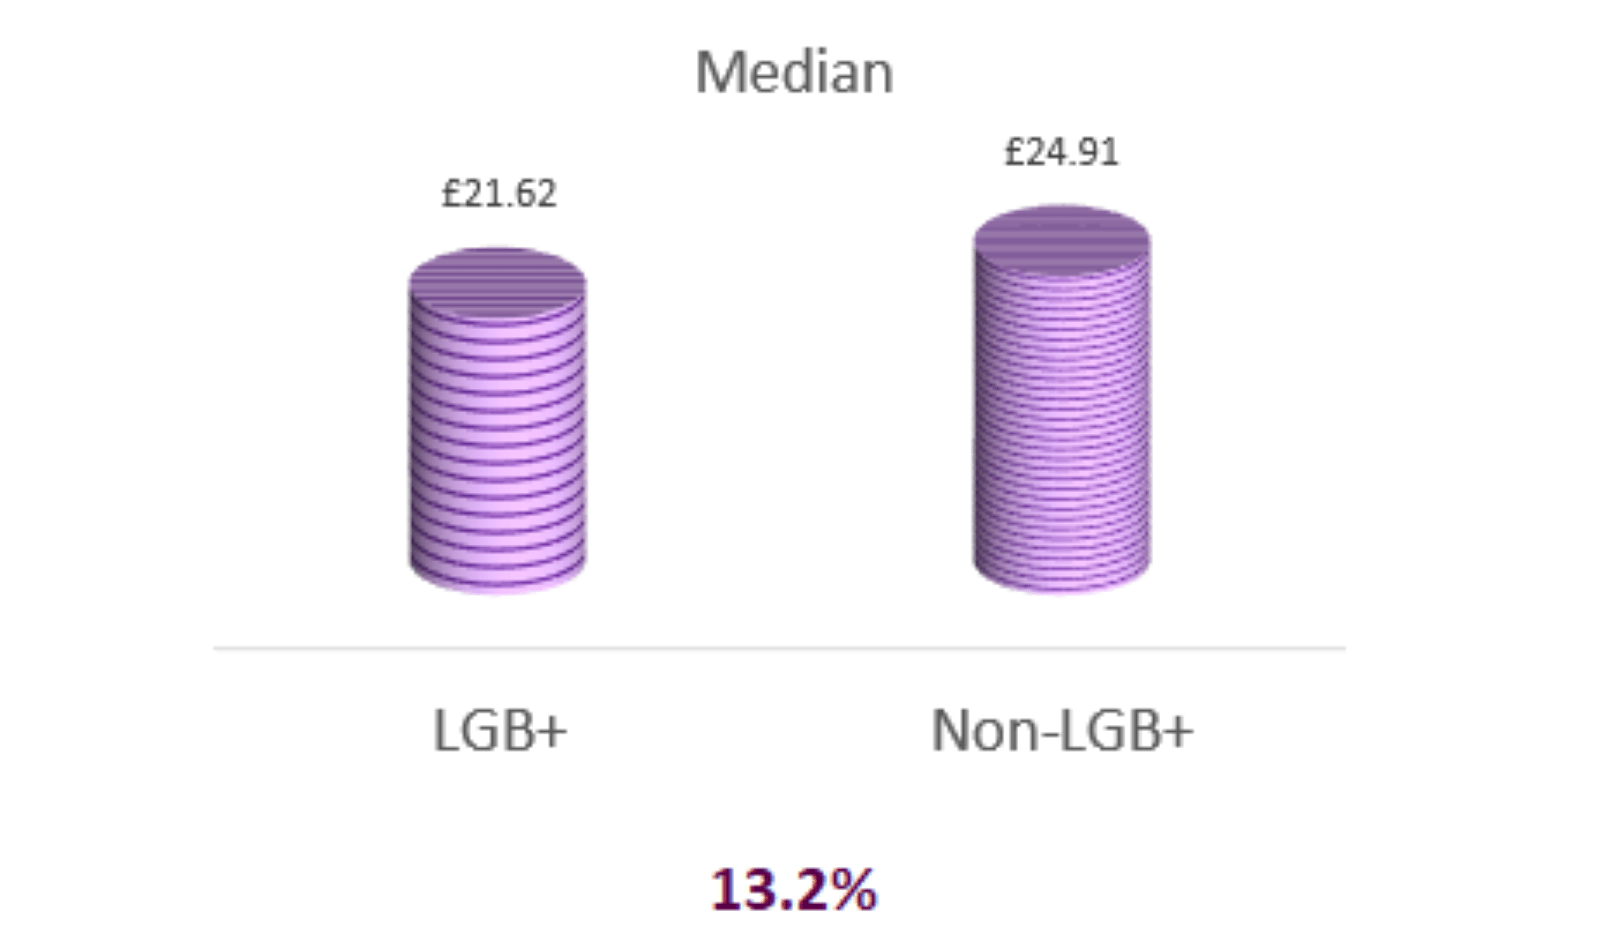
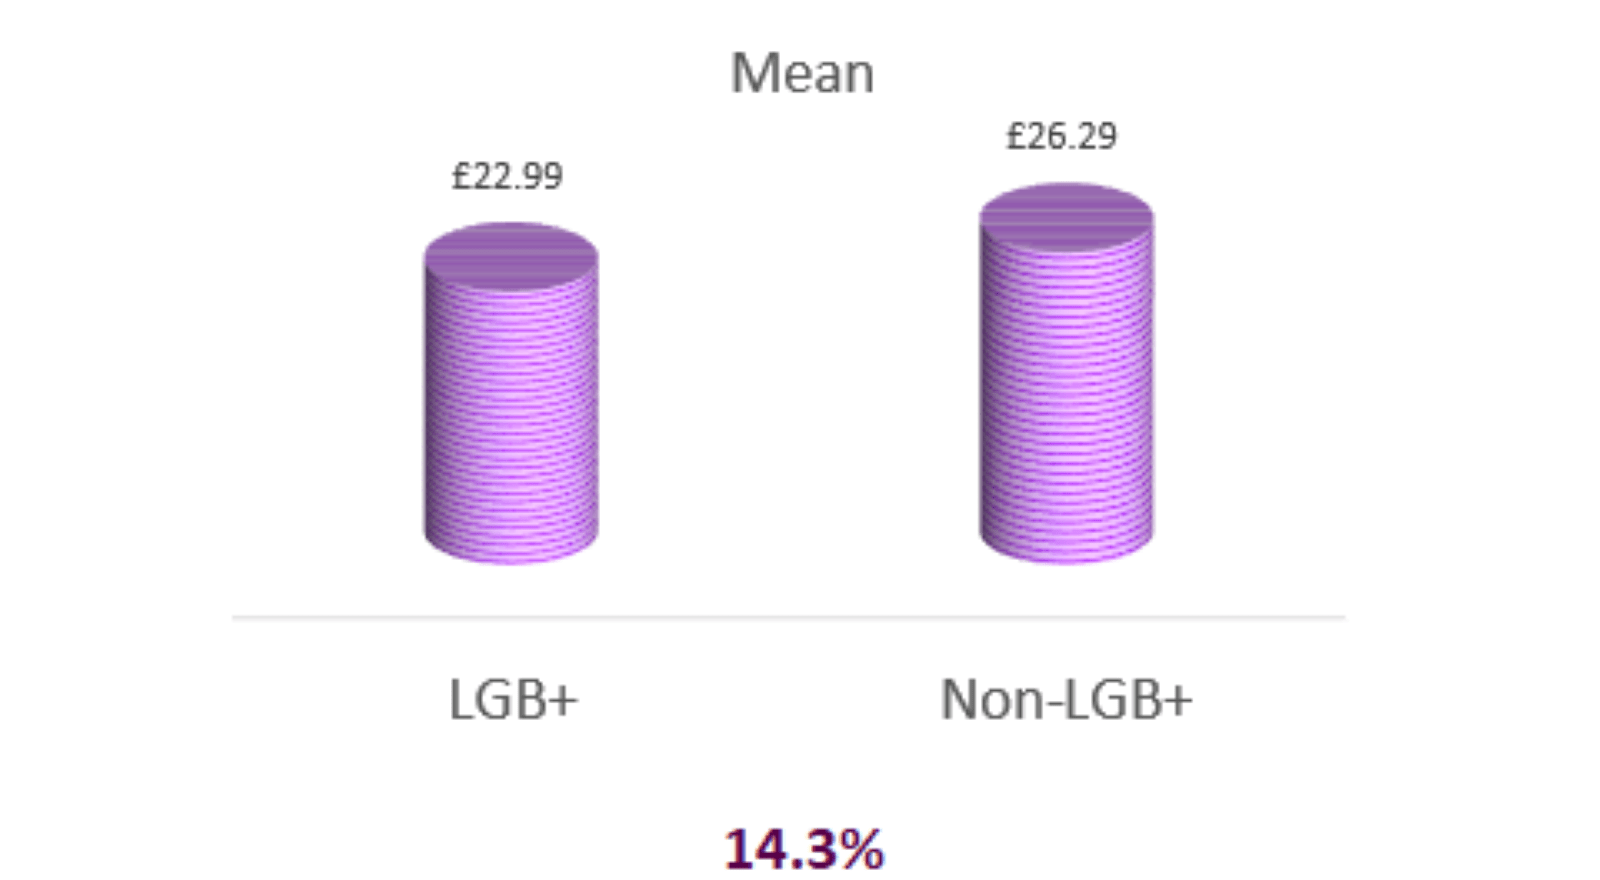
The median salary point for LGB+ staff is at the top of Grade 3 (the same as last year) on our salary scale. The equivalent figure for heterosexual staff is at a salary point in the mid-range of Grade 4, in the previous year this salary point was at the top of grade 4.
Median and Mean LGB+ pay gap in hourly pay (for full-time staff)
Median and Mean LGB+ pay gap in hourly pay (for part-time staff)
LGB+ and pay quartiles
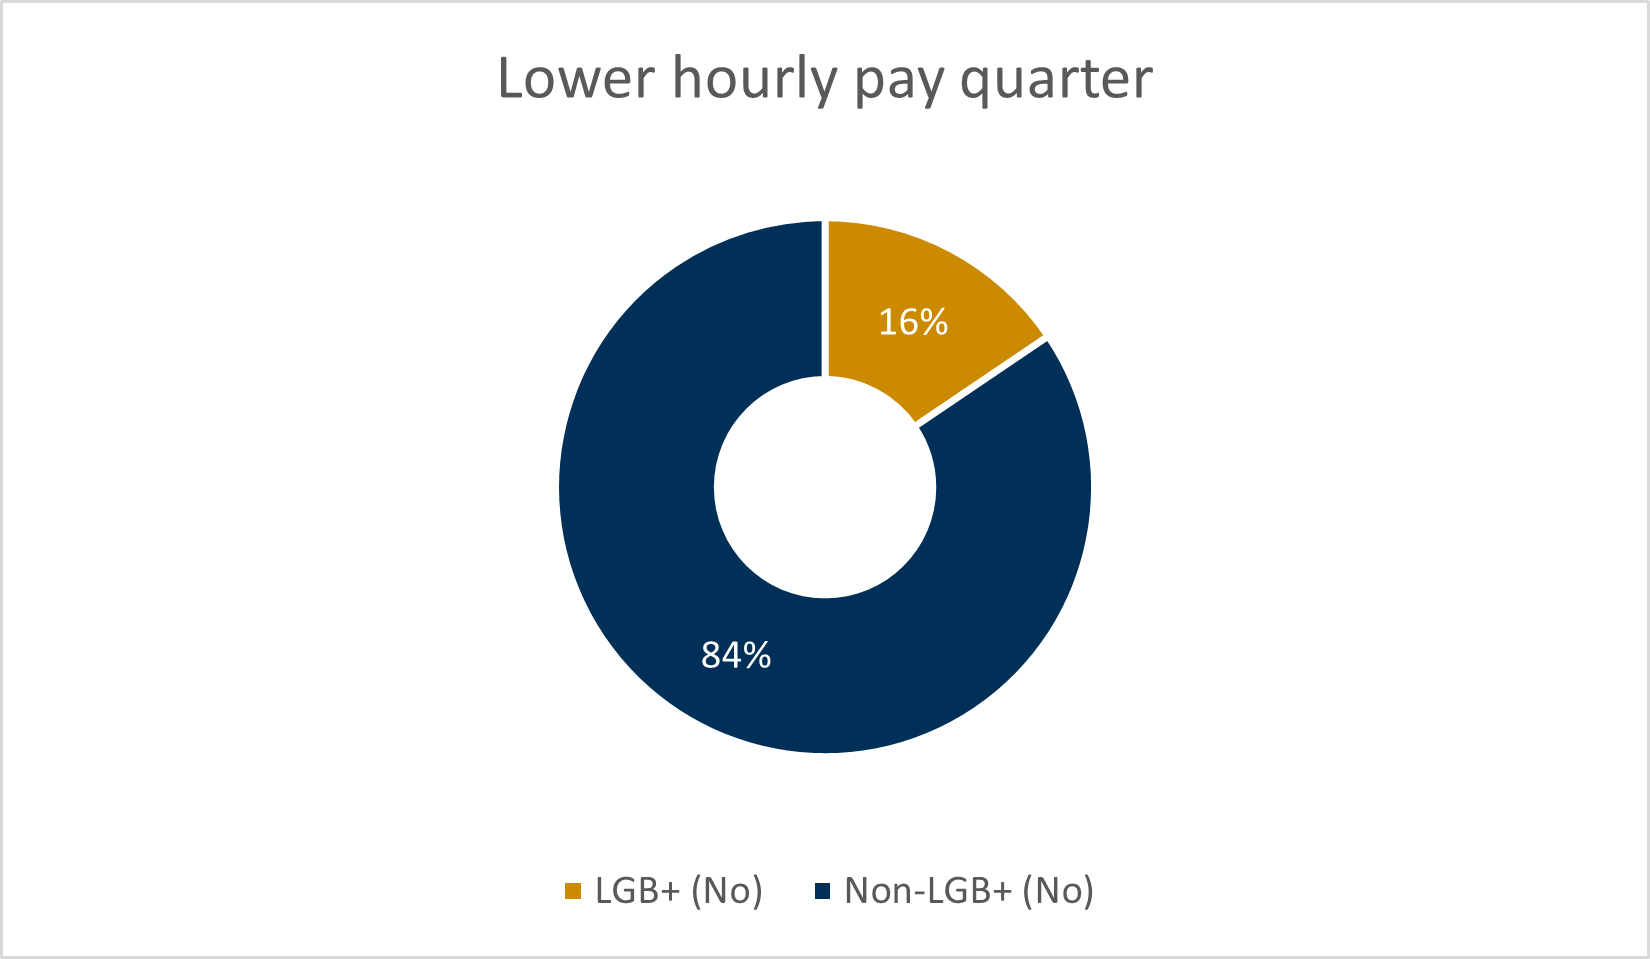

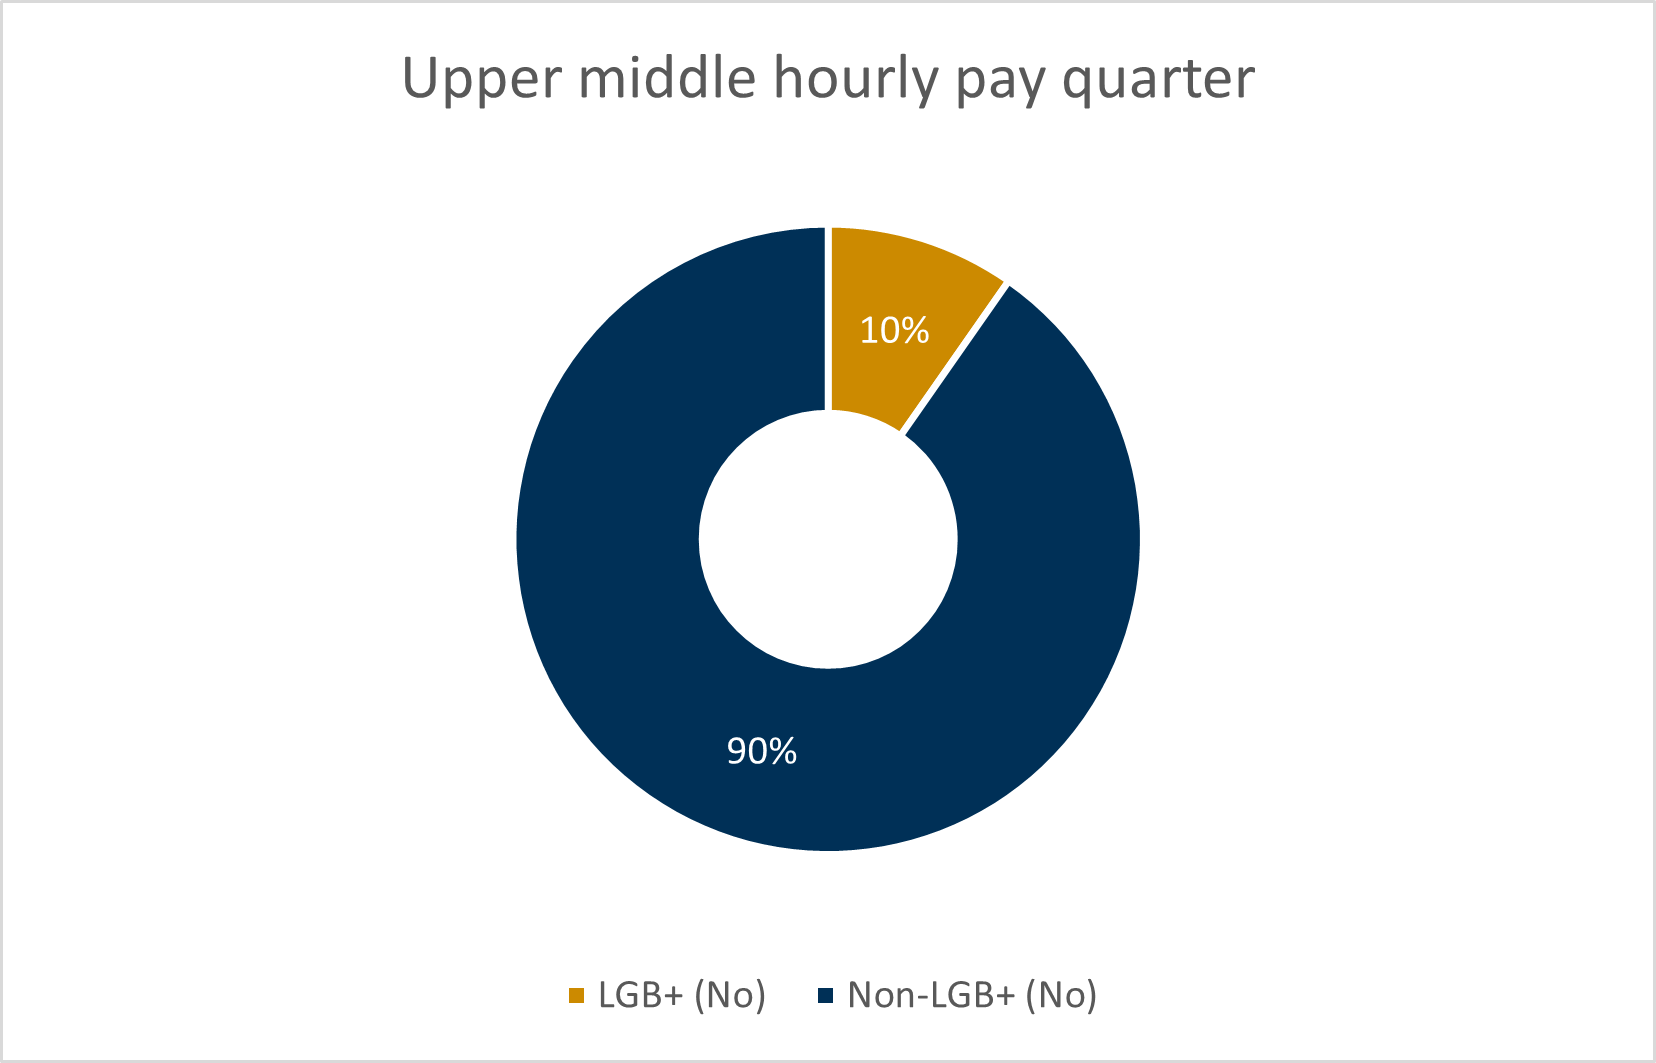
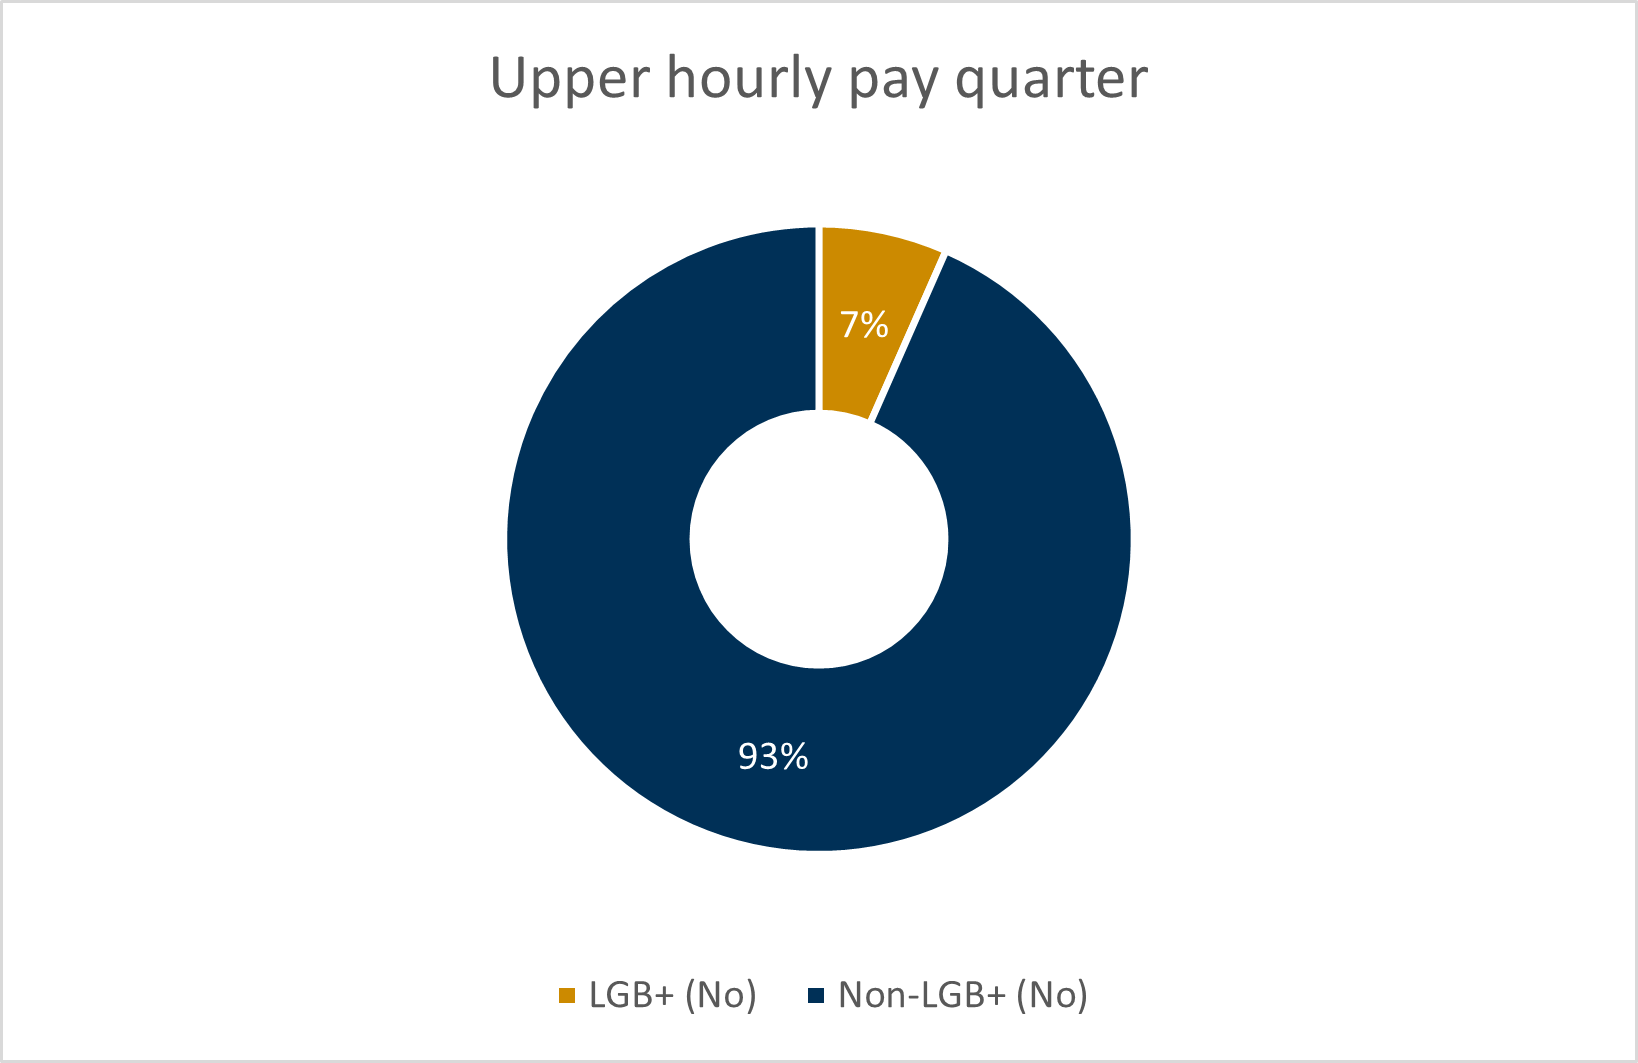
The representation of LGB+ colleagues in our staff group is 7.1%. LGB+ colleagues are over represented by 8.4% in the lower hourly pay quartile. 62.2% of all staff who have declared as LGB+ are represented in the lower two quartiles. This is a slights reduction on the previous year where 64% of LGB+ staff were represented in the lower two quartiles.
Equal pay
Equal Pay
Equal Pay and the Gender Pay Gap are not the same. Equal pay means that men and women are paid the same amount for doing work of equal value unless any difference in pay can be justified.
Annual median FTE salary by grade and gender (grade 7 and above combined)
| Grade | Women | Men | Difference | % difference |
|---|---|---|---|---|
| 1 | £0.00 | £0.00 | £0.00 | 0.0% |
| 2 | £32,818.00 | £32,818.00 | £0.00 | 0.0% |
| 3 | £41,680.00 | £41,680.00 |
£0.00 | 0.0% |
| 4 | £52,183.00 | £52,183.00 | £0.00 | 0.0% |
| 5 | £65,800.00 |
£65,800.00 | £0.00 | 0.0% |
| 6 | £83,019.00 | £83,019.00 |
£0.00 | 0.0% |
| 7 and above | £118,738.00 | £112,863.00 | -£5.875.00 | -5.2% |
| Solicitors |
£72,240.00 |
£90,377.00 | £18,137.00 | 20.1% |
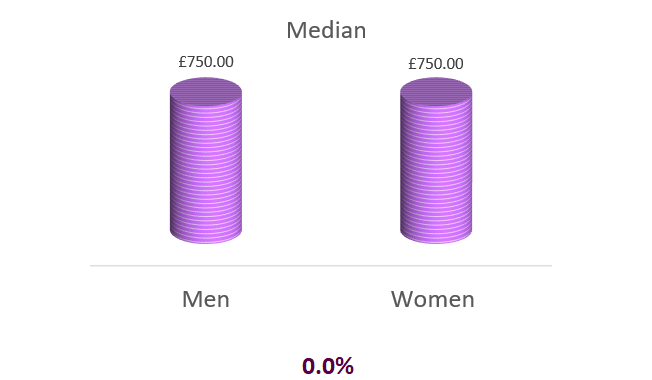
Hourly pay breakdown by grade and gender
Median
| Grade | Women | Men | Difference | % difference |
|---|---|---|---|---|
| 1 | £0.00 | £0.00 | £0.00 | 0.0% |
| 2 | £17.06 | £17.06 | £0.00 | 0.0% |
| 3 | £21.66 | £21.66 |
£0.00 | 0.0% |
| 4 | £27.12 | £27.12 | £0.00 | 0.0% |
| 5 | £34.20 |
£34.20 | £0.00 | 0.0% |
| 6 | £43.15 | £43.15 |
£0.00 | 0.0% |
| 7 and above | £61.50 | £58.46 | -£3.04 | -5.2% |
| Solicitors |
£37.42 |
£46.81 | £9.39 | 20.1% |
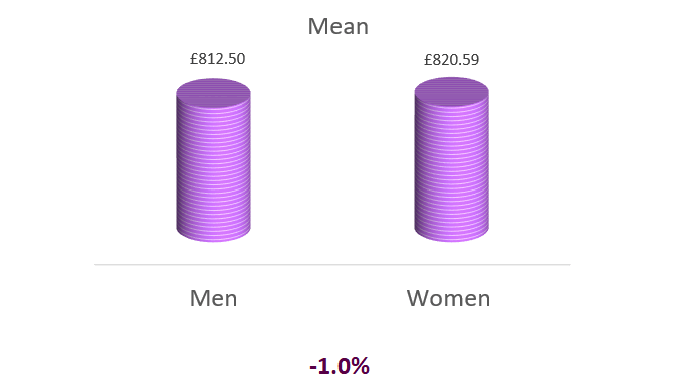
Mean
| Grade | Women | Men | Difference | % difference |
|---|---|---|---|---|
| 1 | £0.00 | £0.00 | £0.00 | 0.0% |
| 2 | £16.84 | £16.76 | -£0.08 | -0.5% |
| 3 | £20.71 | £20.39 |
-£0.32 | -1.6% |
| 4 | £26.43 | £26.48 | £0.06 | 0.2% |
| 5 | £33.10 |
£33.06 | -£0.04 | -0.1% |
| 6 | £41.94 | £42.19 |
£0.25 | 0.6% |
| 7 and above | £59.91 | £64.73 | £4.82 | 7.4% |
| Solicitors |
£38.02 |
£44.12 | £6.10 | 13.8% |
As demonstrated in the tables above the median hourly rate of pay for men and women is equal for all grades on the main SPCB pay scale.
The negative pay gap demonstrated for grades 7 and above is created by combining grades.
The whole Solicitors office has been placed into two cohorts men/women due to the numbers in the Office. Staff doing the same role are paid equally. The data provided demonstrates a gender pay gap difference.
In line with the findings last year, there is a difference in the hourly rate for solicitors where men are employed between points 44 and 56, and there is a greater representation of women across all job roles.
This is accounted for in the staffing ratio 19%:81% (men:women) of staff employed within the solicitor’s office (inclusive of an increase, proportionately, in men and associated minor decrease in women this year).
The median point for men within the solicitor’s office is at the top of Solicitor Team Leader level, whereas for women in the solicitor’s office the median point is at the top of the Solicitor grade level which demonstrates why the gap is greater in this office compared to the main pay grade scale.
Our future actions
Our future actions
Inclusive Parliament Review Programme
The Inclusive Parliament Programme (IPP) is a strategic initiative commissioned by the Scottish Parliamentary Corporate Body (SPCB) to modernise the parliamentary estate and embed inclusive design and practices across all operations. It aligns with existing Diversity & Inclusion (D&I) commitments and responds to legal obligations, including the Equality Act 2010 and judicial rulings made 2025.
The Programme vision is to create a Parliament that is inclusive, accessible, and welcoming to all—where everyone's protected characteristics are considered and they feel valued, heard, and supported.
Various activities were already underway to review our facilities and policies to better support our equality duties under the Equality Act. These various workstreams will now come together under the Inclusive Parliament Review. In summary this will encompass:
- An accessibility audit of the campus with a particular focus on disability.
- An extensive consultation with staff, Members, their staff and stakeholders on the provision of facilities at Holyrood. This will include a particular emphasis on those with the protected characteristics of disability, gender reassignment and sex.
- The development of a new SPCB Race Equity Strategy.
- A review of our existing D&I policies for Parliament staff including the SPCB’s Dignity at Work policy.
- The development of a new suite of training resources to support all staff, Members and Members’ staff to address legal responsibilities concerning diversity and inclusion.
- Monitor and prepare for actions on the reporting of pay gaps and equality action plans in relation to gender, ethnicity and disability resulting from the Equality (Race and Disability) Bill and Employment Rights Bill