Non-domestic rates and operating surplus 2010-2015
This briefing looks at non-domestic rates data in relation to operating surplus across different sectors of the business economy (excluding finance) in Scotland from 2010 to 2015. It updates SB 17-53 Non-domestic rates and operating surplus 2011-2014.
Executive Summary
This briefing is an update to SB 17-53 Non-domestic rates and operating surplus 2011-2014.
Non-domestic rates (NDR) are charged on the rateable value of non-domestic premises - there is no connection to a premise's economic performance such as turnover or profitability.
The Barclay Review1 was commissioned by the Scottish Government to explore how the NDR system in Scotland can better support business growth. It discussed the suggestion made by some ratepayers that the current NDR system be replaced by a local tax based on land value or a local turnover or sales tax, or a combination of these. It pointed out that, while this approach "could have some merit for some sectors, such a change would require an assessment of the overall tax mix in Scotland including consideration of the interactions with other taxes such as Corporation Tax and VAT and to what extent the overall package of taxes was “fair”."1
NDR as a share of operating surplus (Gross Value Added minus wages) has remained relatively constant between 2010 and 2015. On average over that period it was 3.6%.
Looking at different sectors, NDR as a share of operating surplus is significantly higher in the accommodation and food services sector than any other sector of the business economy, particularly construction and manufacturing.
Regional differences in the cost of NDR for businesses relative to their performance mainly reflect structural, non-policy factors such as productivity (affecting GVA, labour costs, etc.) and property portfolios (affecting RV and therefore NDR).
Background
This briefing looks at non domestic rates (NDR) in relation to operating surplus by sector in Scotland using data from the Scottish Annual Business Survey (ABS)1 from 2010 to 2015 (most recent data available), supplemented by data provided to SPICe by the Scottish Government.2 It updates SB 17-53 Non-domestic rates and operating surplus 2011-2014.
NDR are charged to businesses and the public and third sectors. They are based on a property’s rateable value (RV), which is revalued on a regular basis by Assessors, who are independent from government. The most recent revaluation was on 1 April 2017.
NDR is thus a property value-based tax and is not directly connected to business performance indicators such as sales or profits. The Assessors noted in a written submission to the Local Government and Communities Committee ("the Committee"):3
In essence, non-domestic rating is a property tax and not a direct business tax or tax on value of service or profitability; other taxes exist for that purpose.
There is some debate over whether the NDR system is appropriate, for instance the Federation of Small Businesses stated in a written submission to the Committee:3
Many businesses feel a property value-based tax, rather than one based on sales or profit, is unfair and arbitrary (...) A tax based on property, without a link to sales or profit, is always likely to be a larger overhead for smaller firms and start-ups, relative to large firms.
The Barclay Review5 was commissioned by the Scottish Government to explore ways the non-domestic rates system in Scotland can better support business growth. It discussed the suggestion made by some ratepayers that the current NDR system be replaced by a local tax based on land value or a local turnover or sales tax, or a combination of these. The Review noted the following arguments in favour of these options:
They may create a better link between tax liability and the ability to pay
They may alleviate ratepayer concerns that a revaluation would result in unaffordable bill increases
They could better reflect changing economic circumstances, such as the fast expanding digital economy
The Review also highlighted however:
While appropriate for some sectors, these types of changes would not be appropriate for the whole tax base, e.g. many third and public sector organisations do not deliver profit and turnover
There is no consensus amongst those arguing for closer alignment with "ability to pay" on which system would best deliver that (a tax on profit, on turnover? A combination of a tax on land value and on profits/turnover?)
Such a change would also require an assessment of the overall tax mix in Scotland including consideration of the interactions with other taxes such as Corporation Tax and VAT and to what extent the overall package of taxes was “fair”.5
This briefing looks at the ratio of NDR paid and business performance as measured by operating surplus in different sectors of the economy and across different local authorities in the business economy (excluding finance). Operating surplus is calculated by subtracting total wages and salaries from Gross Value Added (GVA). This provides an approximate measure of a company's operating cash flow.
Sectoral and geographic variations are due in large part to structural differences in terms of productivity (affecting GVA, labour costs, etc.) and property portfolios (affecting RV and therefore rates). Policy factors also come into play, though clearly less than non-policy factors, e.g. the Small Business Bonus Scheme, and to a lesser the Large Business Supplement.
A SPICe Briefing SB 17-20 Non-domestic Rates and the 2017 Revaluation provides further information on NDR including historical revenue and relief expenditure as well as rates and relief schemes for 2017-18.
Technical note on data
The figures shown in this briefing are based on the Scottish Annual Business Survey (ABS) data from 2010 to 2015. When looking at disaggregated levels such as sectoral or local authorities, changes in a small number of (large) companies can have a have a very marked effect on figures from one year to the next. The differences between local authority areas are likely to reflect the relative size of different industrial sectors in the local area.
For this reason, SPICe have considered two-year averages, three-years averages and five-year averages and only present two-year averages when the patterns therein also reflect the three and five-year average trend.
A note on terminology: the average is indicated by the last year in it e.g. "2015 (two-year average)" means the average of 2014 and 2015.
Details of the ABS are available on the Scottish Government at:1
http://www.gov.scot/Topics/Statistics/Browse/Business/SABS
ABS is not an economy wide survey as it excludes certain areas such as the financial sector, parts of agriculture and the public sector. This is referred to as the "business economy (excluding finance)" and is equal to roughly three quarters of net NDR bills in Scotland as a whole. It is as low as 25% of NDR bills in some local authorities and as high as 130% of NDR bills in others.
Data relating to both onshore and offshore oil & gas extraction (which forms part of the total figures) is allocated to UK regions according to the address at which the business is registered in ABS. Note that GVA associated with off-shore activity, under UK regional accounts procedures, is normally allocated to a separate ‘Extra Regio’ category rather than allocated to a region within the UK.
As NDR data is not part of the ABS standard publication, the rates estimates have not been subject to the same level of quality assurance that is carried out for the main publication variables. These statistics should therefore be treated as experimental and users should exercise caution in their use (especially in comparing figures from Scottish Assessors Valuation Roll and Local Government Audited NDR Income Statistics).
The rates data in ABS is much more volatile than NDR income returns from local authorities. NDR income returns from local authorities include all aspects of NDR, not just the business economy. This includes things such as write-offs and bad-debts. All NDR Income returns received from local authorities by Scottish Government are subject to independent audit by external auditors and represent the best available evidence of NDR income at local authority level. This means ABS data not a like-for-like comparison but it does suggest that some of the variation in ABS data on rates may be due to sampling and/or imputation methodology in the survey rather than actual changes in NDR paid. The figures in this briefing should thus be interpreted with caution. ABS data from Falkirk has such degree of variation in both operating surplus and NDR across the years that data from this local authority cannot be interpreted to any degree of certainty.
The ABS data was used to produce a measure of operating surplus (which includes business profits) by subtracting wages and salaries from GVA. The figure for operating surplus is therefore not taken directly from the ABS. Results are presented as the ratio of NDR to operating surplus, to give a broad view of the "cost" of rates for businesses in different sectors and local authorities. As would be expected, the ratio of NDR/operating surplus is affected by changes in both operating surplus and NDR. Volatility in operating surplus is significantly greater than in the NDR data. The results are therefore driven largely by changes in operating surplus as opposed to NDR paid.
All business sectors (excluding finance) – Scotland
This briefing considers 'totals' as well as four sectors of the business economy: accommodation and food service activities; wholesale, retail and repairs; manufacturing and construction. Figure 1 shows NDR as a share of operating surplus from 2011 to 2015 (using two-year averages). Falkirk has been excluded because of extreme volatility in the data, especially in Wholesale, retail and repairs. It is likely that a change in a very small number of enterprises impacted the data significantly for this sector.
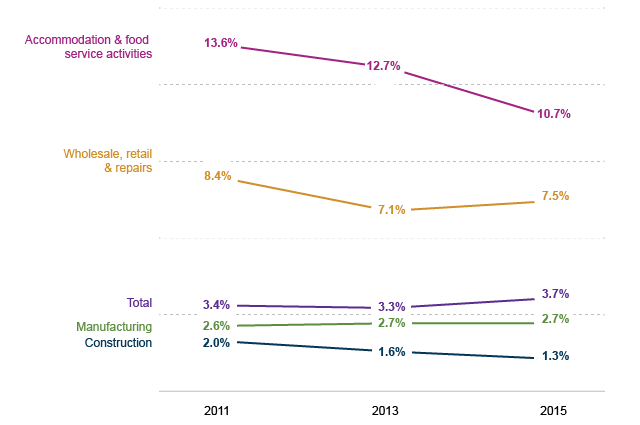
The ratio for totals remains stable over time in sectors like manufacturing, but does appear to be decreasing in accommodation and food services as well as construction.
There is a significant variation of NDR as a share of operating surplus across different sectors, partly as a reflection of different business structures (such as location, labour costs and productivity). The ratio of rates/operating surplus is highest in accommodation and food services, at 10.7% in 2015 (two-year average). This compares to 11.6% in 2014 (two-year average) and 12.7% in 2013 (two-year average). It was lowest in the construction sector where it was 1.3% in 2015 (two-year average). This compares to 1.4% in 2014 (two-year average), and 1.6% in 2013 (two-year average).
Figure 2 shows the ratio for all business sectors (excluding finance) by local authority in 2015 (two-year average). Falkirk is excluded because of data volatility.
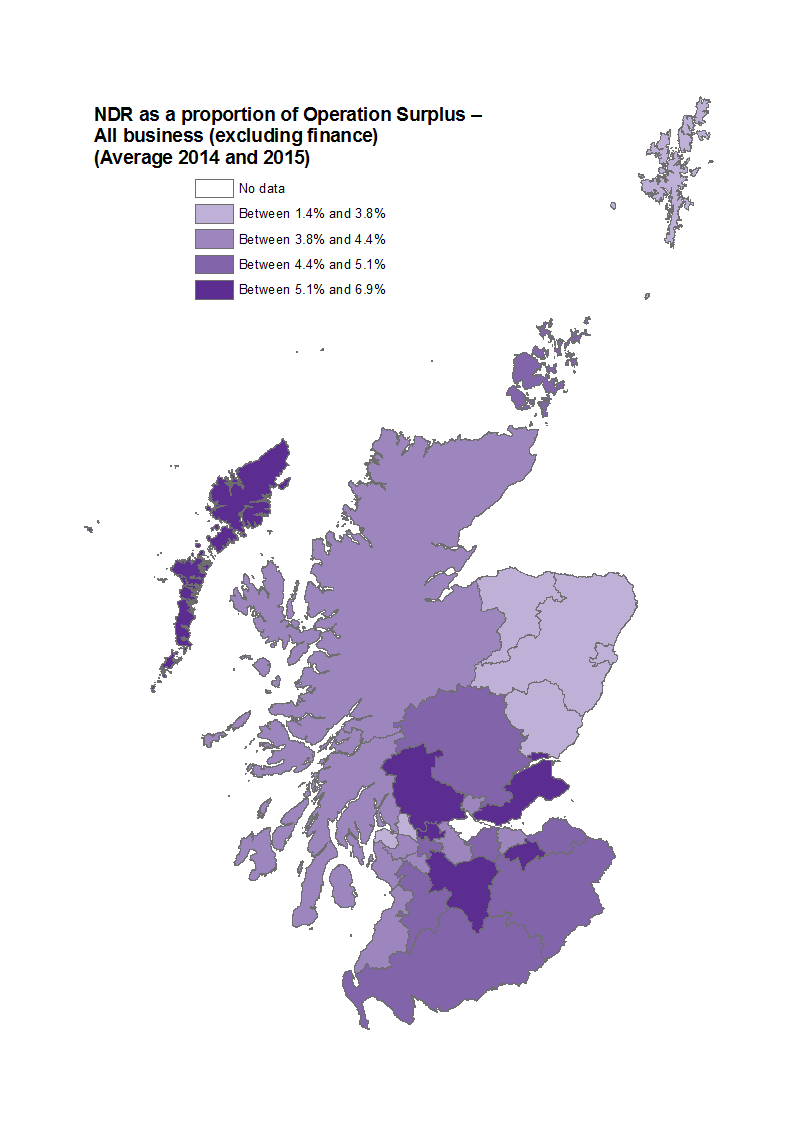
The ratio of NDR/operating surplus in 2015 (two-year average) was under 7.0% in all areas. Eilean Sear should be treated as an outlier due to volatility in the data.
The ratio was highest in the central belt of Scotland, partly as a result of higher rental prices than more rural parts of Scotland. It was lowest in Aberdeenshire, Aberdeen City and the Shetland Islands – this is partly a result of these areas’ substantial oil and gas sectors which have a high GVA.
Manufacturing
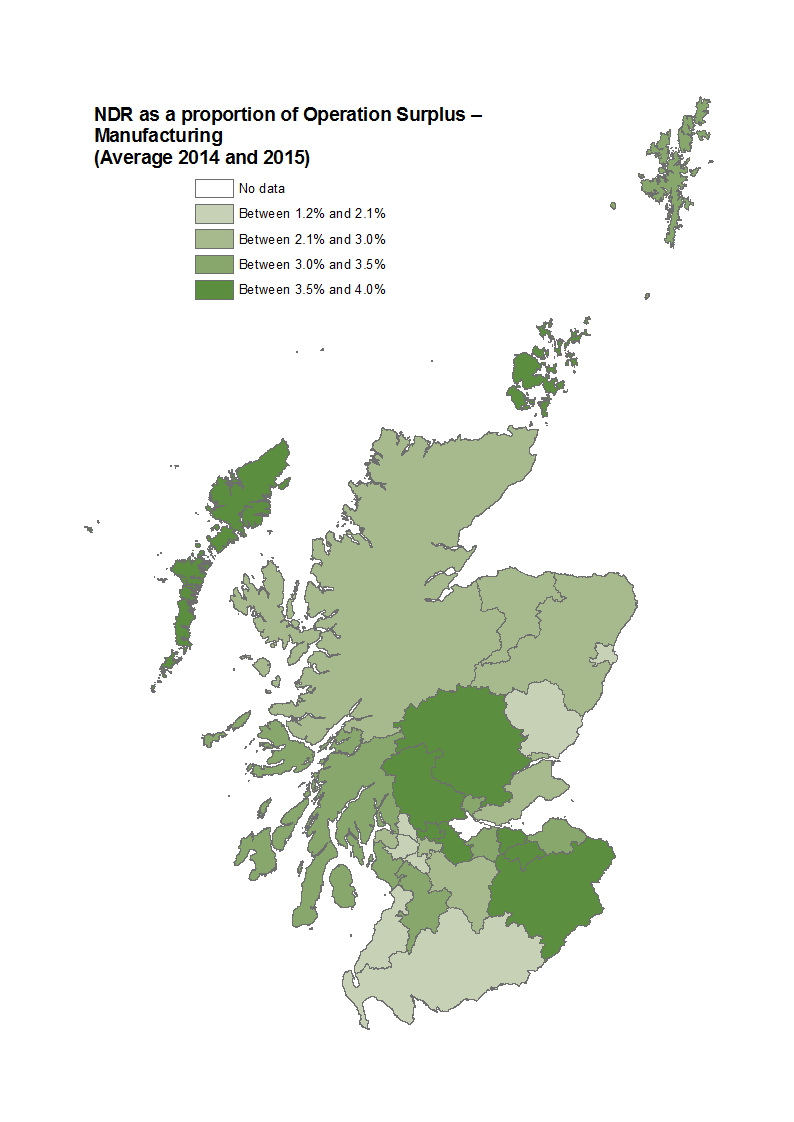
Falkirk is excluded because of the volatility in the data. The ratio of NDR to operating surplus in 2015 (two-year average) in manufacturing did not exceed 4% in any local authority. It was highest in East Dunbartonshire, the Scottish Borders and Midlothian. It was lowest in South Ayrshire and West Dunbartonshire and this trend remains when we look at three-year averages and five-year averages.
Construction
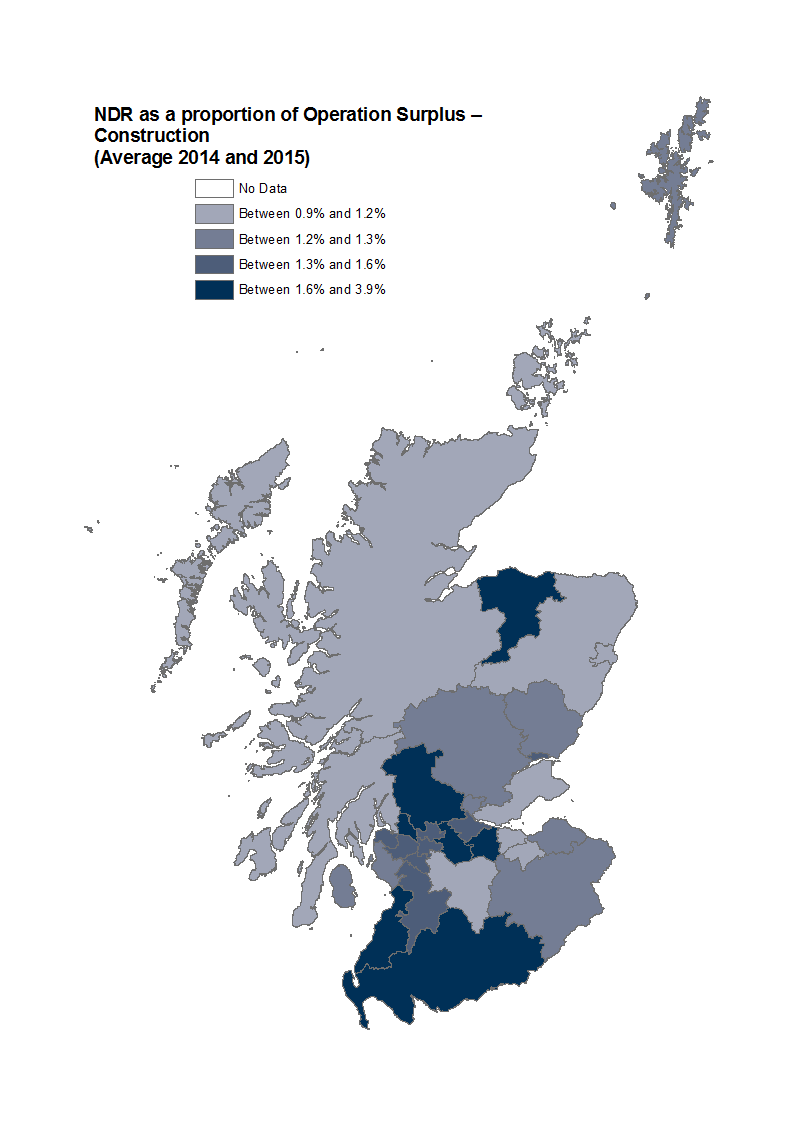
In construction, the ratio of NDR to operating surplus tends not to go above 2% and is similar across Scotland. Two, three and five-year averages see local authorities moving around in ranking quite a lot, mainly because the ratios are very close and a small change can affect the ranking of local authorities strongly.
Wholesale, retail and repairs
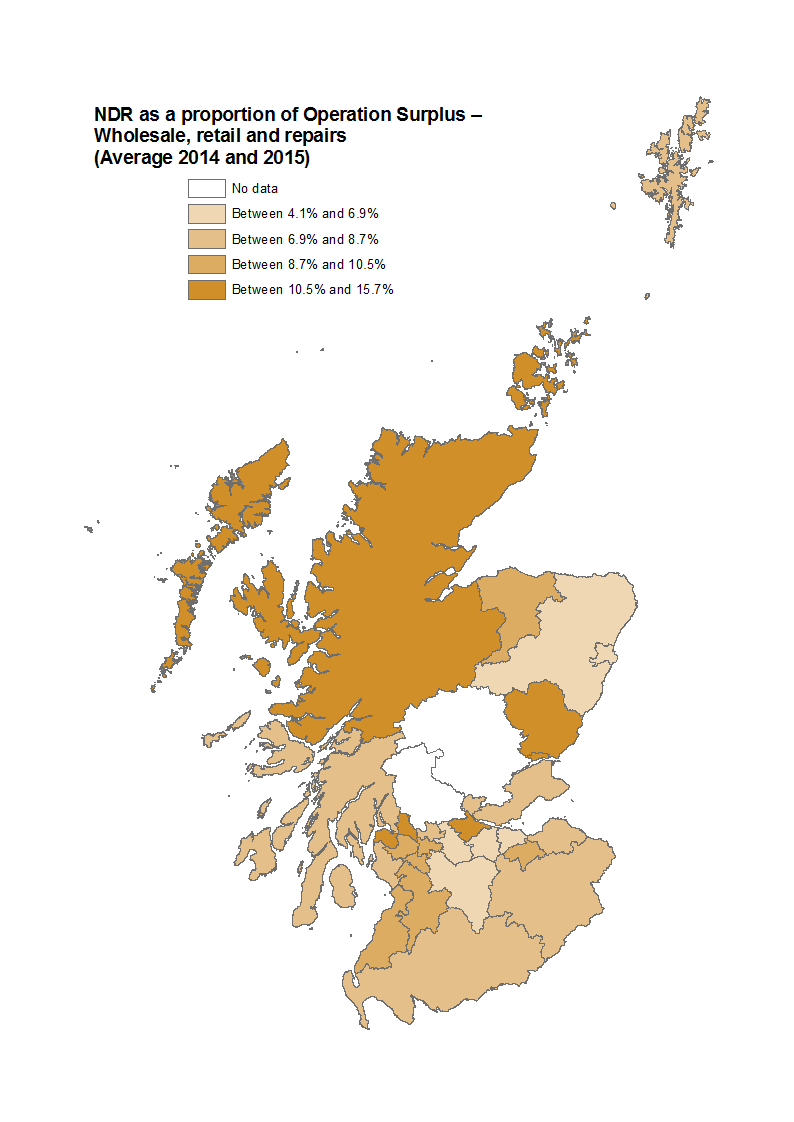
Data is not available for Stirling and Perth & Kinross in all years. The ratio of NDR as a share of operating surplus has a broader range of values than in construction (where it is stable across local authorities).
In wholesale, retail and repairs, the ratio ranges from 4.1% (Aberdeenshire) to 15.7% in Inverclyde and Eilean Siar, reflecting partly the diversity of industries across Scotland. Inverclyde, Dundee and West Dunbartonshire remain high when look at two, three and five-year averages while Aberdeenshire, Aberdeen and Moray remain low when looking at all averages. It is difficult however to draw conclusions on a sector that is so diverse in terms of space needed to operate, and GVA.
Accommodation & food services
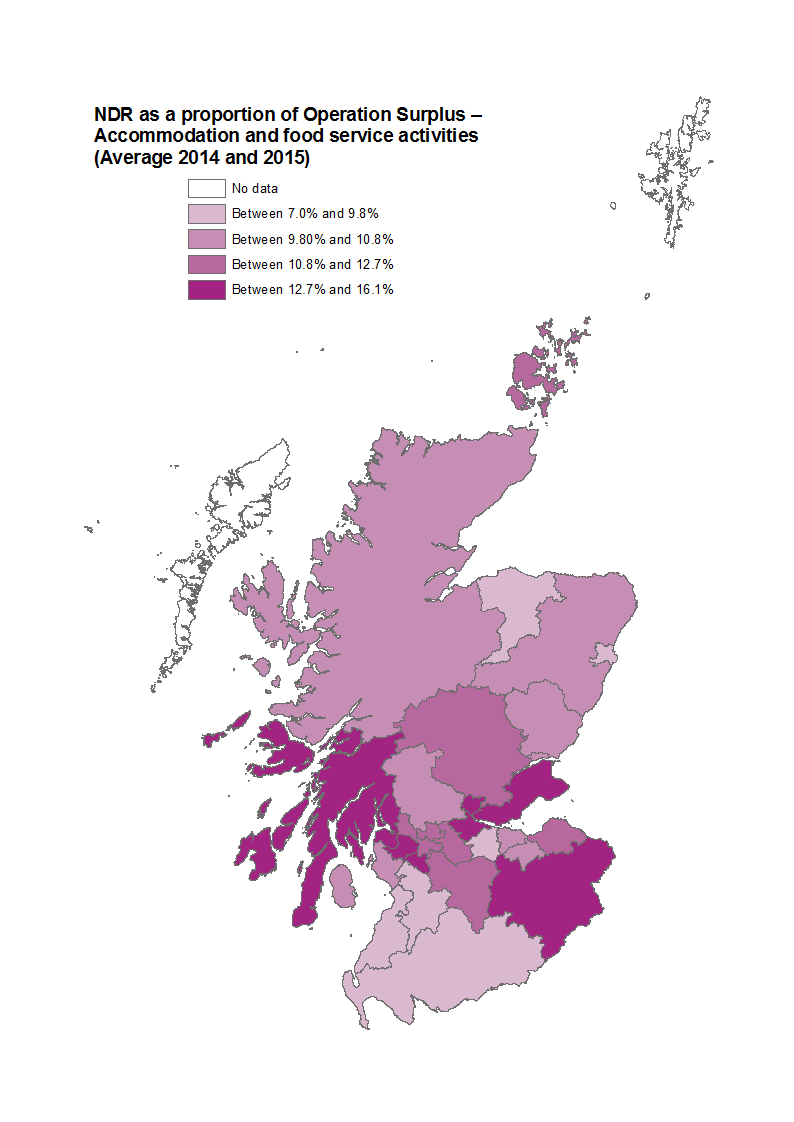
Eilean Siar and the Shetland Islands are excluded as they exhibit extreme variations in operating surplus and mainly NDR.
The ratio is higher in this sector than the other sectors considered in this briefing. It is also quite varied across different areas - ranging from 7% in Dumfries and Galloway (though in the three and five-year average Dumfries & Galloway is in the top end rather than the lower), and Moray, to over 15% in the Scottish Borders, Inverclyde and Falkirk. Looking at the three-year average, West Lothian, Dumfries & Galloway, Edinburgh and Renfrewshire are in the top end, while East Ayrshire, Aberdeen and Moray are at the lower end. Looking at five-year averages, South Lanarkshire, Fife, Edinburgh and Renfrewshire are in the top end, while the bottom end keeps broadly the same pattern as the two and three-year averages.
Employment size-bands
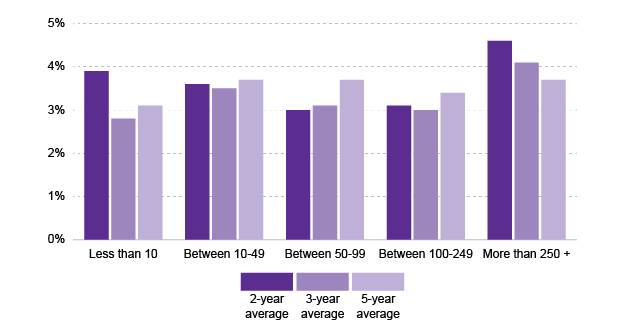
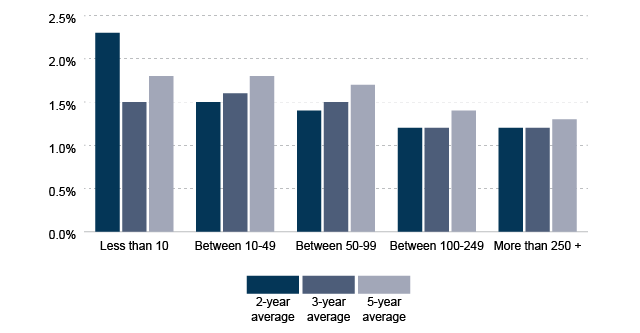
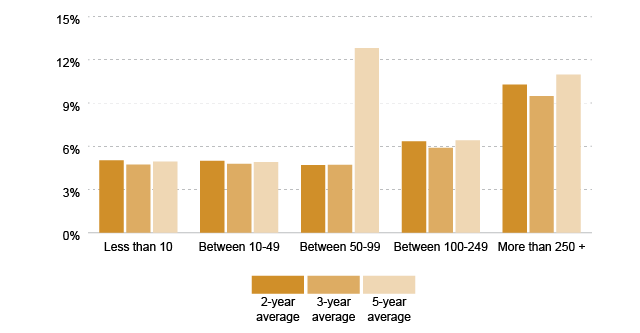
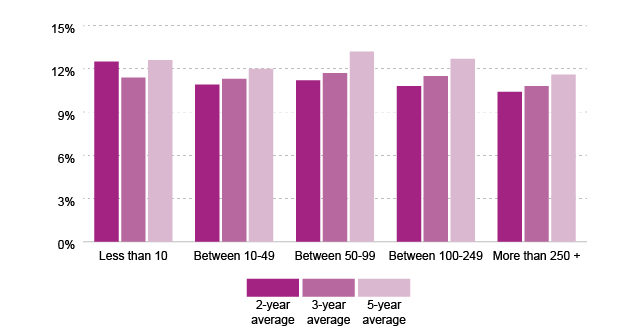
This section considers the ratio of NDR/operating surplus by employment size-band across Scotland. Overall, as shown in Figure 7, the ratio of NDR/operating surplus is higher for firms with a large number of employees. Whichever average we consider, firms with the smallest number of employees, and those in the middle (50 to 249 employees) have the lowest ratio. In other words, firms with 10-49 employees seem to have a moderately higher ratio on average than both the smallest and larger firms.
This pattern is reflected in the wholesale, retail and repair sector where the largest firms in terms of employee numbers have the highest ratio (Figure 9). It is reasonable to assume the Large Business Supplement (LBS) plays a part in this distribution. LBS is charged in 2017-18 on all properties with a RV over £51,000 and is 2.6p (added to the poundage). The Barclay Review recommended that the LBS be reduced to 1.3p to match the (current) equivalent rate in England. 1 It suggested 1 April 2020 for this change.
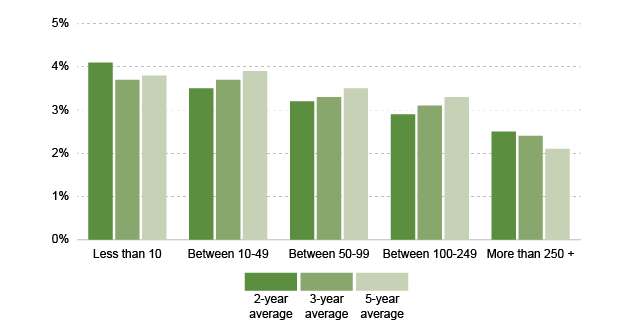
In manufacturing (Figure 8), and to a lesser extent in construction (Figure 9), however, the trend is the other way around and there is a linear correlation between the categories of firm size, and the ratio. In accommodation and food services, the pattern is harder to interpret (Figure 10).
Sources
Scottish Government. (2017). Report of the Barclay Review of Non-Domestic Rates. Retrieved from <a href="http://www.gov.scot/Resource/0052/00523643.pdf" target="_blank">http://www.gov.scot/Resource/0052/00523643.pdf</a> [accessed 17 November 2017]
Scottish Government. (2017). Scottish Annual Business Statistics. Retrieved from <a href="http://www.gov.scot/Topics/Statistics/Browse/Business/SABS" target="_blank">http://www.gov.scot/Topics/Statistics/Browse/Business/SABS</a>
Scottish Government. (2016). Personal correspondence with Scottish Government.
Scottish Parliament. (2017). Local Government and Communities Committee. Written submissions. 12th Meeting, 2017 (Session 5). 25 April 2017. Retrieved from <a href="http://www.parliament.scot/S5_Local_Gov/Meeting%20Papers/20170426_MeetingPapers.pdf" target="_blank">http://www.parliament.scot/S5_Local_Gov/Meeting%20Papers/20170426_MeetingPapers.pdf</a> [accessed 17 August 2017]