Non-domestic rates and operating surplus 2011-2014
This briefing looks at non-domestic rates data in relation operating surplus across different sectors of the business economy (excluding finance) in Scotland from 2011 to 2014.
Executive Summary
Non domestic rates (NDR) are charged on the rateable value of non domestic premises - there is no connection to a premise's economic performance such as turnover or profitability.
NDR as a share of operating surplus (Gross Value Added minus wages) has remained relatively constant from 2011 to 2014 at around 3.4%.
NDR as a share of operating surplus is significantly higher in the accommodation and food services sector than any other sector of the business economy, particularly construction and manufacturing.
Regional differences in the cost of NDR for businesses relative to their performance reflects expected geographic differences in rateable values.
Background
This briefing looks at non domestic rates (NDR) in relation to operating surplus by sector in Scotland using data from the Scottish Annual Business Survey (ABS)1 from 2011 to 2014 (most recent data available), supplemented by data provided to SPICe by the Scottish Government.2 NDR are charged to businesses and the public and third sectors. They are based on a property’s rateable value, which are revalued on a regular basis, most recently on 1 April 2017.
NDR is thus a property value-based tax and is not directly connected to business performance indicators such as sales or profits. The Assessors noted in a written submission to the Local Government and Communities Committee ("the Committee"):3
In essence, non-domestic rating is a property tax and not a direct business tax or tax on value of service or profitability; other taxes exist for that purpose.
There is some debate over whether the NDR system is appropriate, for instance the Federation of Small Businesses for instance stated in a written submission to the Committee:3
Many businesses feel a property value-based tax, rather than one based on sales or profit, is unfair and arbitrary (...) A tax based on property, without a link to sales or profit, is always likely to be a larger overhead for smaller firms and start-ups, relative to large firms.
In 2016 the Scottish Government set up the Barclay Review "to make recommendations that seek to enhance and reform the business rates system in Scotland to better support business growth and long term investment and reflect changing marketplaces." It aims to report in August 2017. Ken Barclay, in evidence to the Committee in April 2017, stated:5
We are still considering whether the tax should simply be a property tax or whether it could be another form of tax.
This briefing looks at the ratio of NDR paid and business performance as measured by operating surplus in different sectors of the economy and across different local authorities in the business economy (excluding finance). Operating surplus is calculated by subtracting total wages and salaries in Scotland/by sector/by local authority from Gross Value Added (GVA) in Scotland/that sector/that local authority.
A SPICe Briefing Non-domestic Rates and the 2017 Revaluation provides further information on NDR including historical revenue and relief expenditure as well as rates and relief schemes for 2017-18.
Technical note on data
The figures shown in this briefing are based on the Scottish Annual Business Survey (ABS) data from 2011 to 2014. When looking at disaggregated levels such as sectoral or local authorities, changes in a small number of (large) companies can have a have a very marked effect on figures from one year to the next. The differences between local authority areas are likely to reflect the relative size of different industrial sectors in the local area. Results have been aggregated over two years: rates and operating surplus are averaged for 2011 and 2012 (“2011-12”) on the one hand, and 2013 and 2014 (“2013-14”) on the other. Certain local authorities referred to as "outliers" in the briefing have figures that are not readily interpretable or have undergone a major change appears to have been caused by a change in a small number of companies.
Details of the ABS are available on the Scottish Government at:1
http://www.gov.scot/Topics/Statistics/Browse/Business/SABS
ABS is not an economy wide survey as it excludes certain areas such as the financial sector, parts of agriculture and the public sector. This is referred to as the "business economy (excluding finance)". This impact on overall Totals: Scottish rates data in ABS is equal to roughly three quarters of net NDR bills in Scotland as a whole and as low as 25% of NDR bills in some local authorities and as high as 130% of NDR bills in others.
Data relating to both onshore and offshore oil & gas extraction (which forms part of the total figures) is allocated to UK regions according to the address at which the business is registered in ABS. Note that GVA associated with off-shore activity, under UK regional accounts procedures, is normally allocated to a separate ‘Extra Regio’ category rather than allocated to a region within the UK.
As NDR data is not part of the ABS standard publication, the rates estimates have not been subject to the same level of quality assurance that is carried out for the main publication variables. These statistics should therefore be treated as experimental and users should exercise caution in their use (especially in comparing figures from Scottish Assessors Valuation Roll and Local Government Audited NDR Income Statistics).
The rates data in ABS is much more volatile than NDR income returns from local authorities. NDR income returns from local authorities include all aspects of NDR, not just the business economy. This includes things such as write-offs and bad-debts. All NDR Income returns received from local authorities by Scottish Government are subject to independent audit by external auditors and represent the best available evidence of NDR income at local authority level. This means ABS data not a like-for-like comparison but it does suggest that some of the variation in ABS data on rates may be due to sampling and/or imputation issues in the survey rather than actual changes in NDR paid. The figures in this briefing should thus be interpreted with caution. ABS data from Falkirk has such degree of variation in both operating surplus and NDR across the years that data from this local authority cannot be interpreted to any degree of certainty.
The ABS data was used to produce a measure of operating surplus (which includes business profits) by subtracting wages and salaries from Gross Value Added (GVA). The figure for operating surplus is therefore not taken directly from the ABS. Results are presented as the ratio of NDR to operating surplus, to give a broad view of the "cost" of rates for businesses in different sectors and local authorities. As would be expected, the ratio of NDR/operating surplus is affected by changes in both operating surplus and NDR. Volatility in operating surplus is significantly greater than in the NDR data. The results are therefore driven largely by changes in operating Surplus as opposed to NDR paid.
All business sectors (excluding finance) – Scotland
Figure 1 shows NDR as a share of operating surplus, averaging 2011 and 2012 ("2011/2012") on the one hand and 2013 and 2014 ("2013/2014") on the other in order to smooth variations across the years due to sampling in ABS.
In 2011/2012, NDR accounted for 3.6% of operating surplus across all business sectors in Scotland (excluding finance), with a minor drop to 3.5% in 2013/2014. However, if we exclude Falkirk, the ratio has stayed the same at 3.4% as shown in Figure 1. Comparing the average of 2011/2012 and 2013/2014, NDR is 1.5% higher in 2013/2014 than in 2011/12, while operating surplus has seen bigger variation and is 5.2% higher in 2013/2014 compared to 2011/2012.
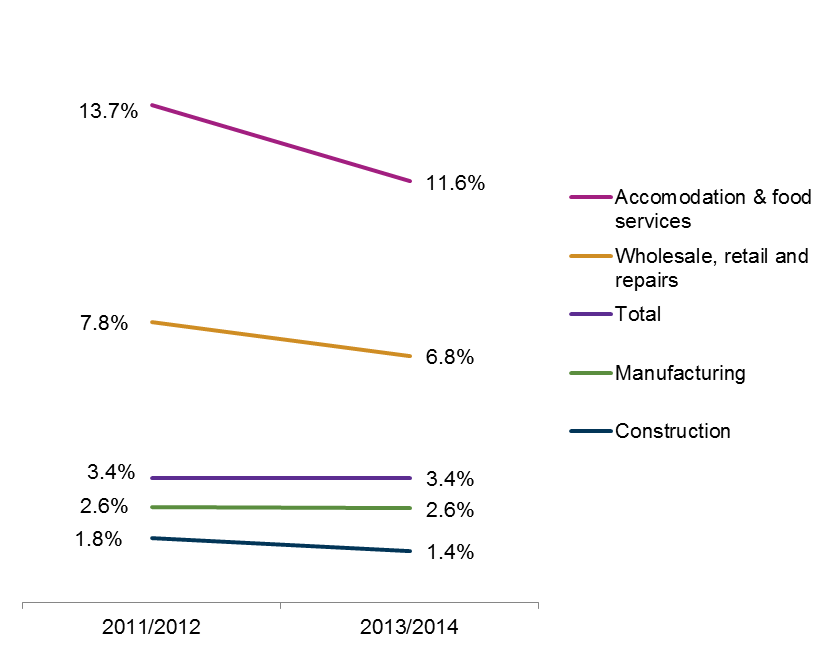
The minor decreases in accommodation and food services should be interpreted with caution. The ratio of total NDR/operating surplus in the business economy (excluding finance) has been relatively stable over time at 3.4% (when excluding Falkirk). This is mainly down to manufacturing and construction being stable.
There is a significant variation of rates as a share of operating surplus across different sectors, partly as a reflection of different business structures (such as location, labour costs, productivity) across different sectors. The ratio of rates/operating surplus is highest in accommodation & food services at 11.6% in 2013/2014 (excluding Falkirk). It was lowest in the construction sector where it was 1.4% in 2013/2014 (excluding Falkirk).
Figure 2 shows the ratio for all business sectors (excluding finance) by local authority in 2013/2014.
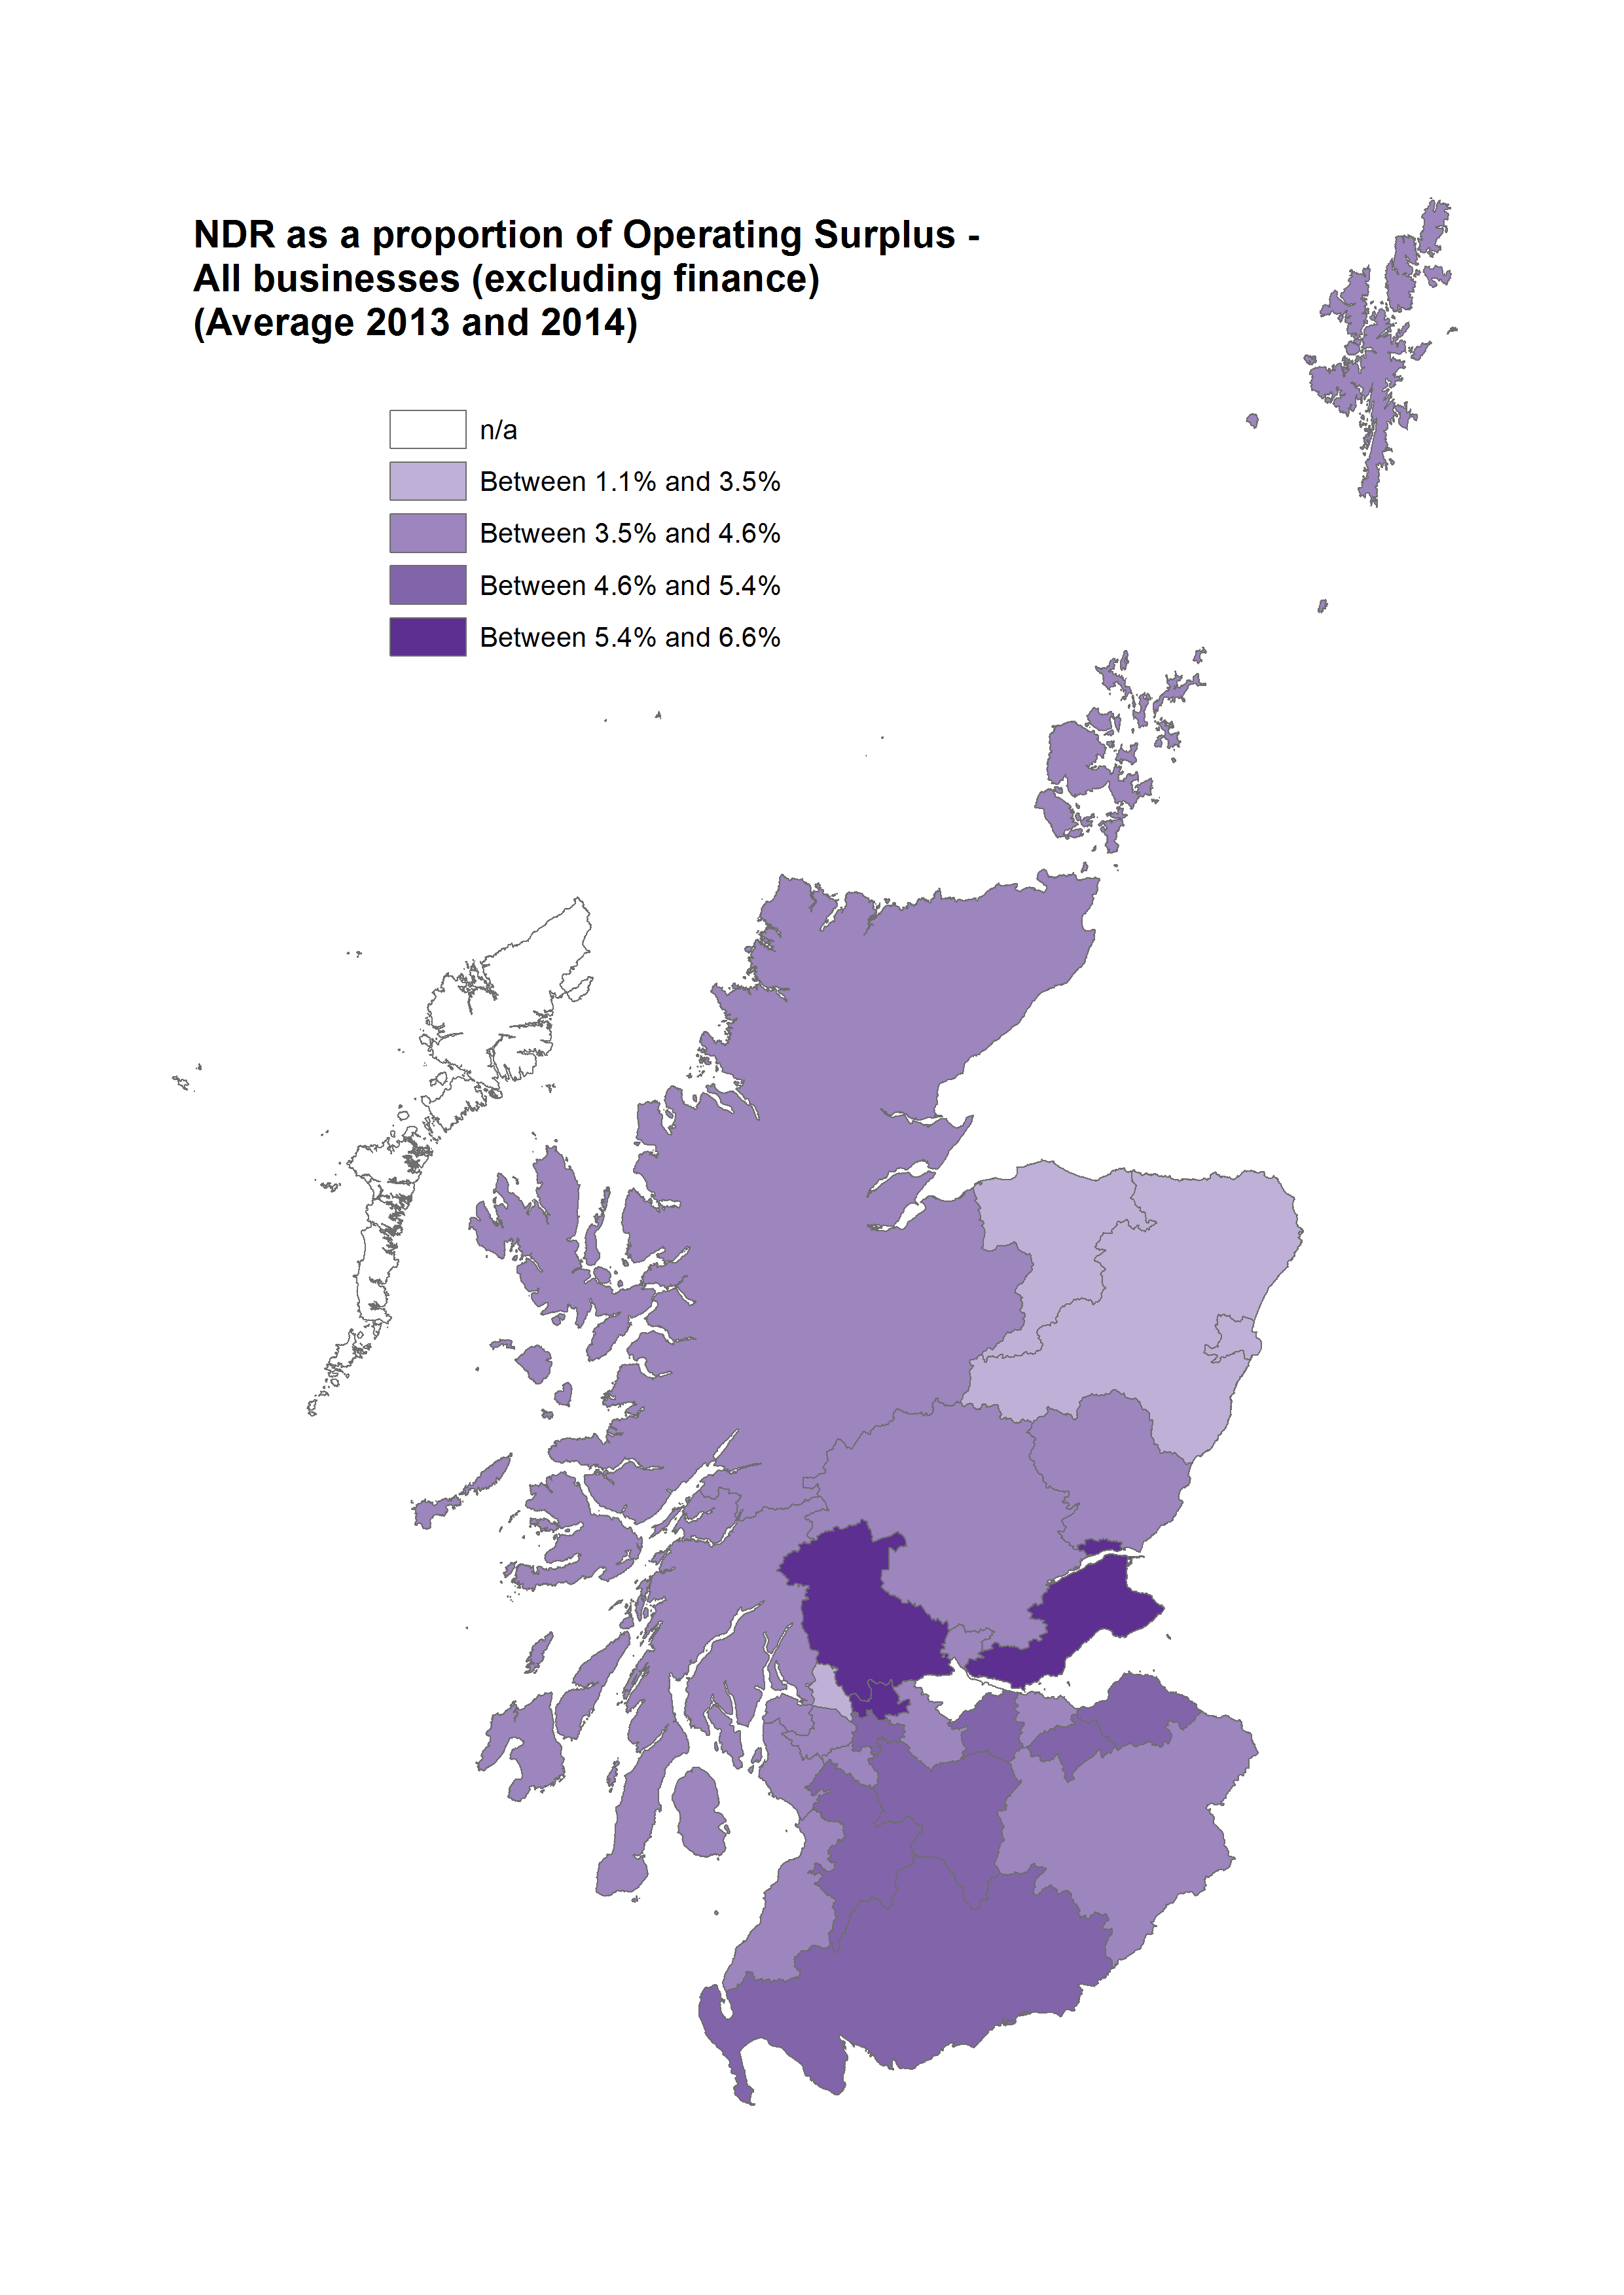
The ratio of NDR/operating surplus in 2013/2014 was under 6.9% in all areas. Eilean Sear and Falkirk were treated as outliers as the difference in NDR in 2013 and 2014 is such that it is likely due to survey sampling.
The ratio was highest in the central belt of Scotland, partly as a result of rental prices (and thus rateable values on which NDR are based) being relatively high in this part of Scotland. It was lowest in Aberdeenshire and Aberdeen City – this is partly a result of these areas’ substantial oil and gas sectors which have high gross value added relative to other sectors.
Manufacturing
Table 1 shows the profile of the manufacturing sector in relation to all business sectors (excluding finance) in 2014. This provides an indication of the percentage of the total workforce it employs (Employment), its contribution to overall economic output (GVA), its NDR burden (Rates) and an indication of the size of its business stock (No. enterprises).
Manufacturing employs a tenth of the business economy (excluding finance), accounts for almost a sixth of total GVA and slightly over a tenth of rates.
| Employment | GVA | Rates | No. enterprises | |
|---|---|---|---|---|
| Manufacturing | 10.5% | 15.3% | 11.1% | 5.9% |
Figure 3 shows the ratio for manufacturing by local authority in 2013/2014.
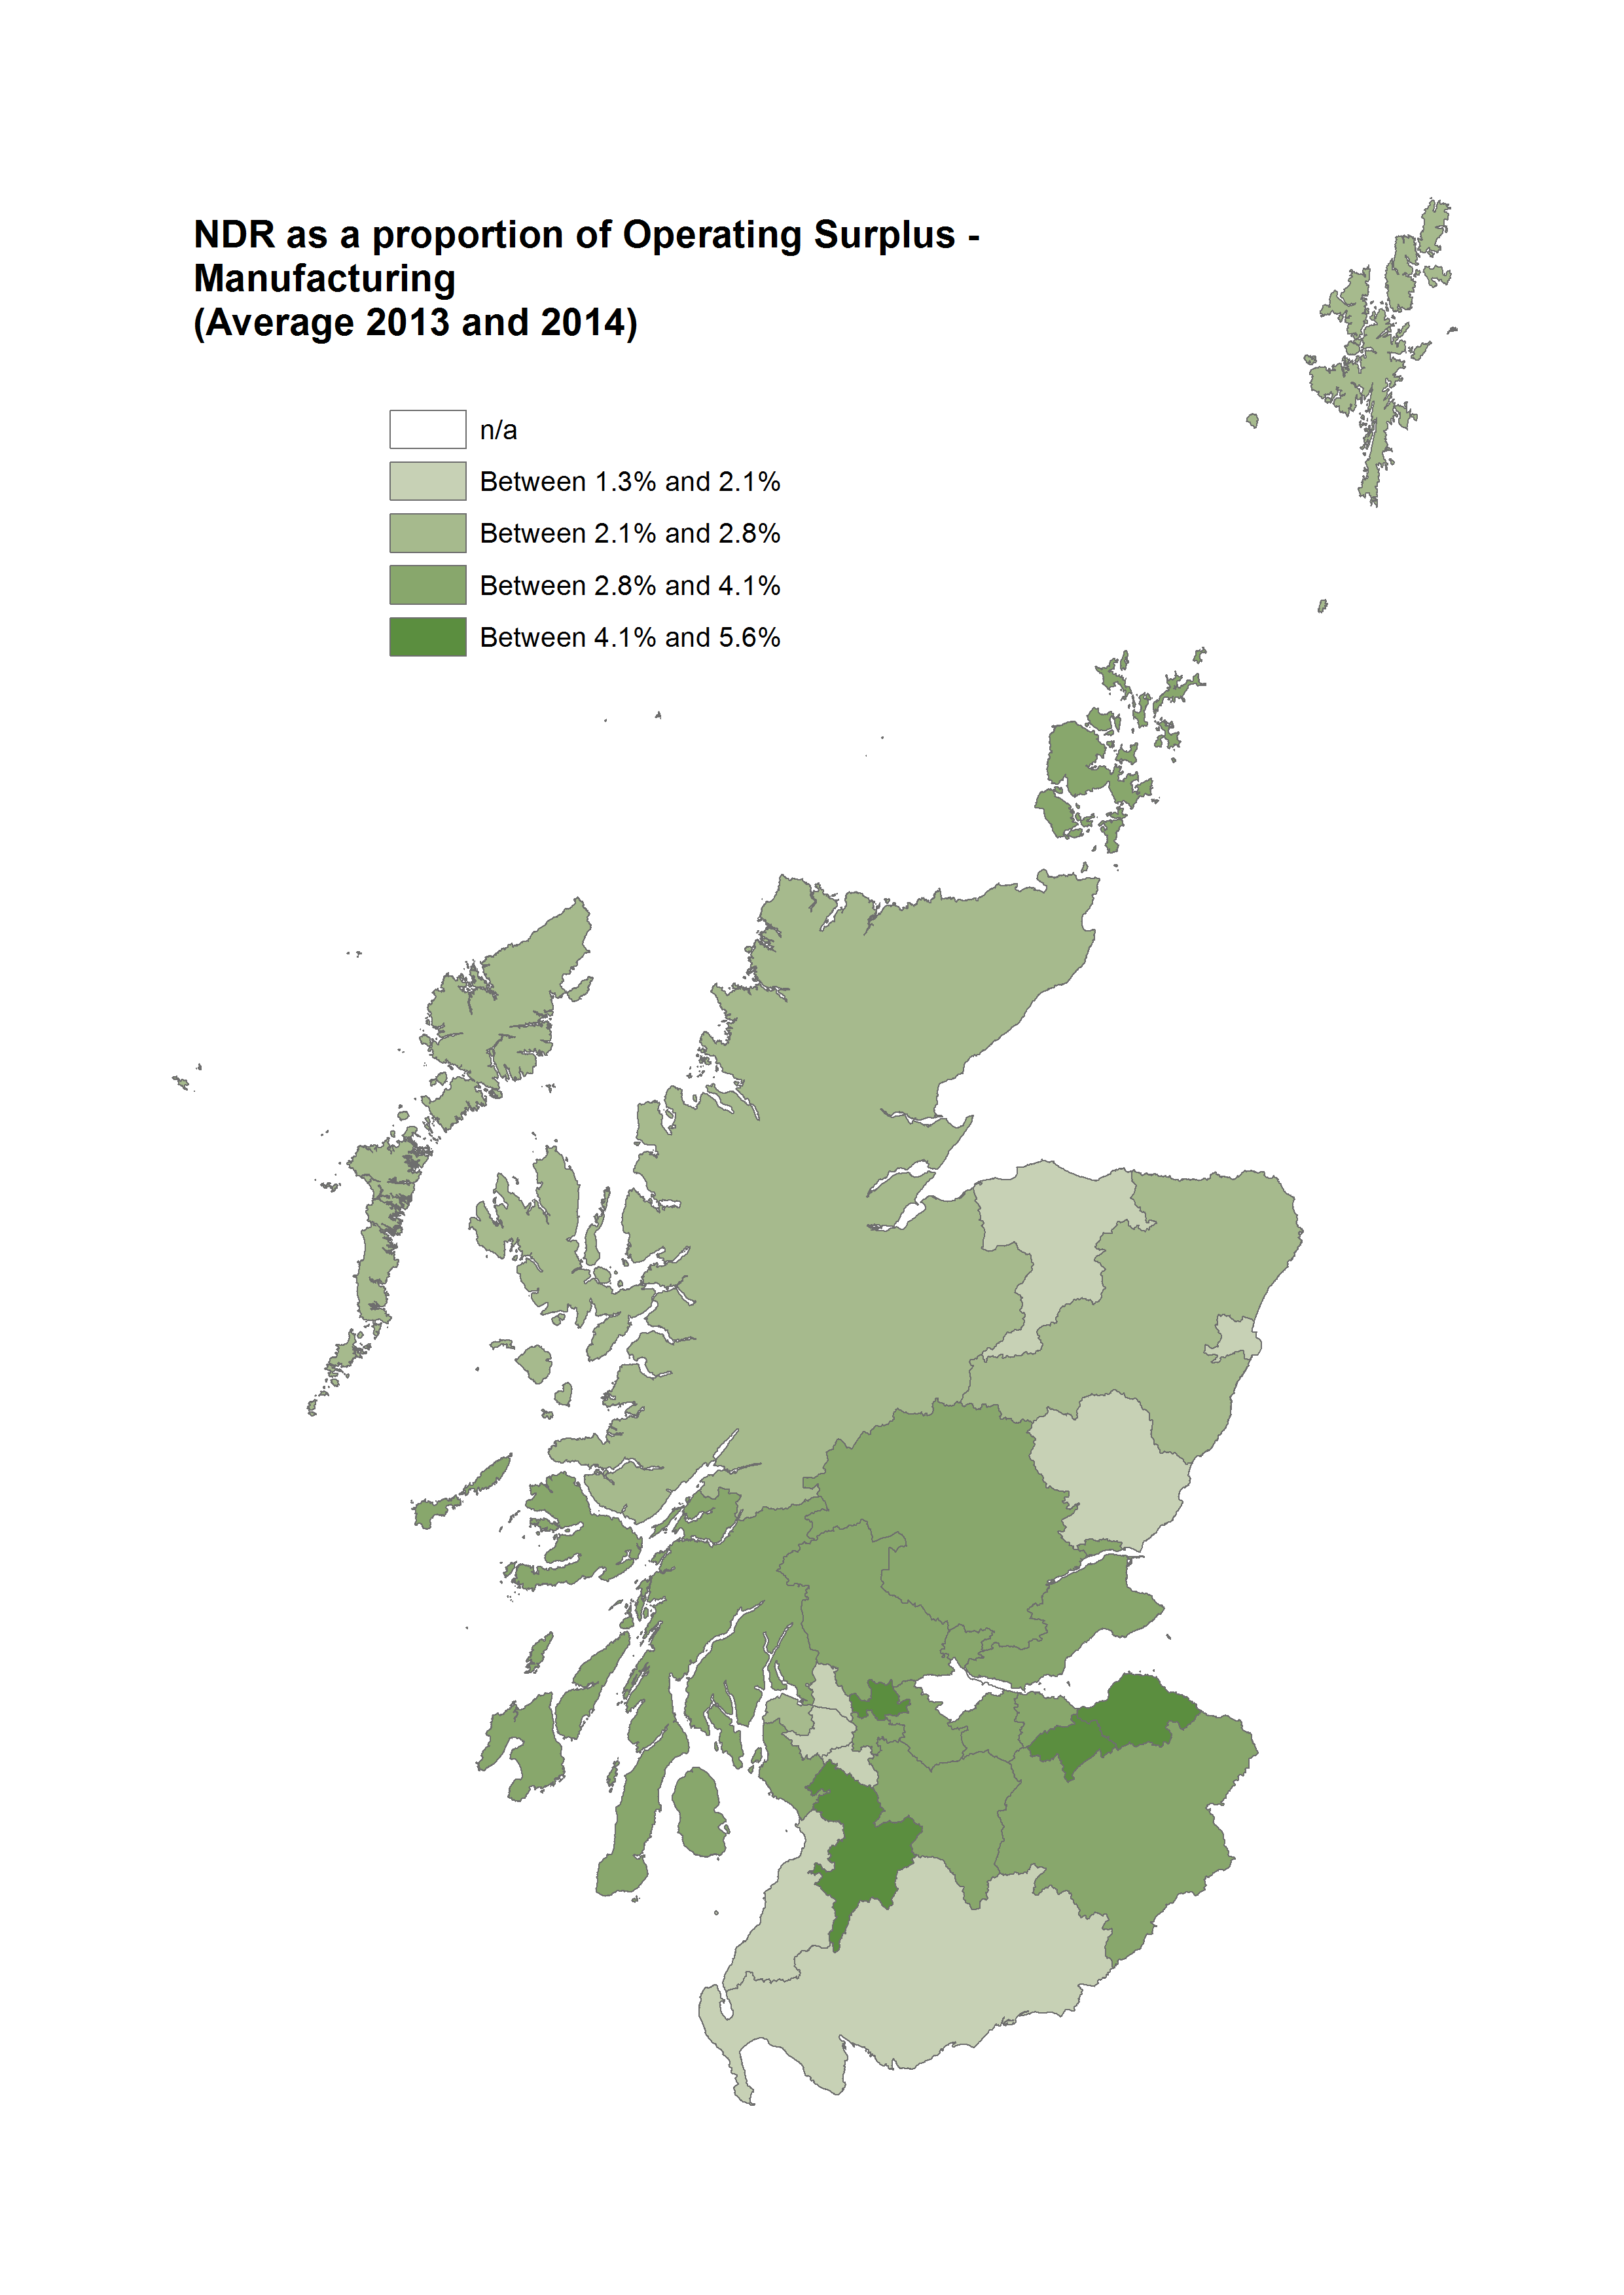
Falkirk is an outlier because of the volatility in the data.
Excluding Falkirk, the ratio of rates/operating surplus in 2013/2014 in manufacturing was highest in East Lothian, followed by Midlothian and East Ayrshire. It was lowest in Renfrewshire, Aberdeen City, South Ayrshire and West Dunbartonshire.
Construction
Table 2 shows construction in relation to all business sectors (excluding finance) in 2014. This sector is a third smaller than manufacturing in terms of employment, accounts for less than half the GVA of the manufacturing sector and pays the smallest share of rates of all sector, just over 2.1%. This is partly a reflection of the fact that construction "adds value" and that rateable values are mostly no longer paid by the construction sector once land has been developed which causes a rise in rateable values.
| Employment | GVA | Rates | No. enterprises | |
|---|---|---|---|---|
| Construction | 7.2% | 7.5% | 2.1% | 12.4% |
In 2013/2014, the ratio of rates/operating surplus in construction was under 5.0% for all local authorities, and above 3% only in Moray. It was under 2.0% in three quarters of local authorities in 2013/2014.
Figure 4 shows the ratio for construction by local authority in 2013/2014.
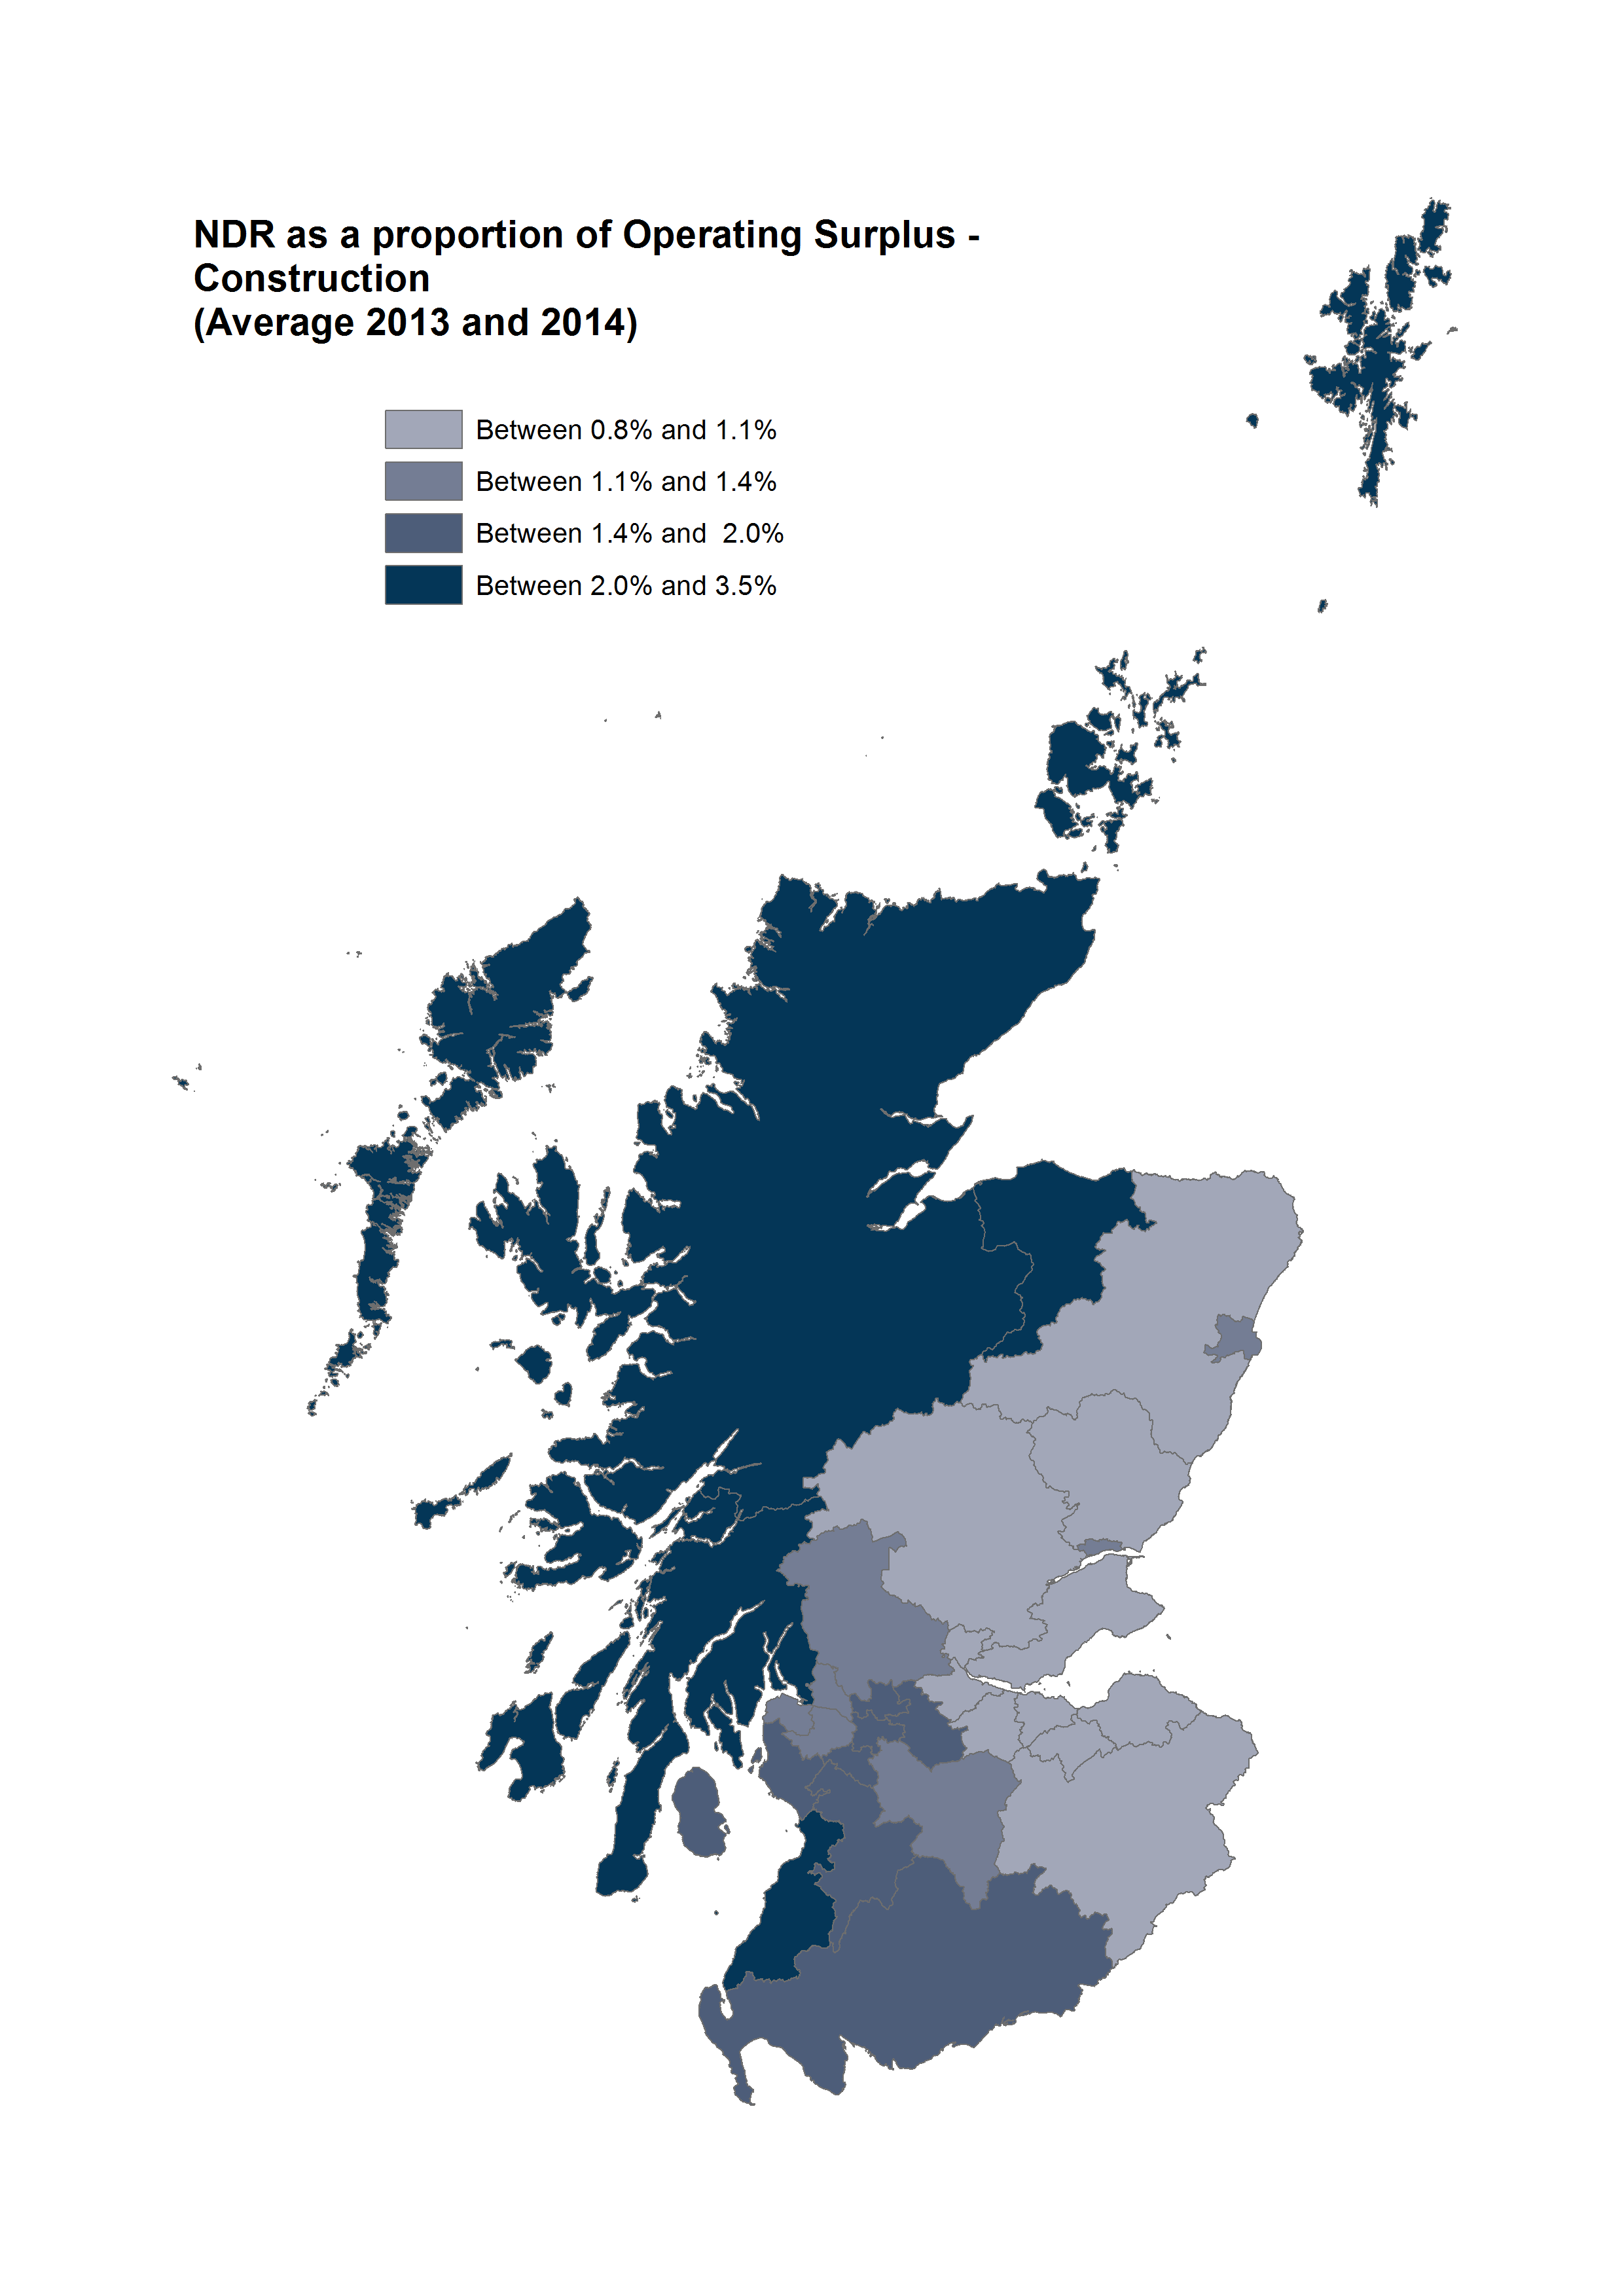
In the construction sector, the ratio of NDR/operating surplus is lowest in the East of Scotland and highest in the West.
Wholesale, retail and repairs
Table 3 shows wholesale, retail and repairs in relation to all business sectors (excluding finance) in 2014. This sector accounts for the same share of GVA as manufacturing but pays a much higher share of rates at 30.8% (compared to 11.1% in manufacturing).
| Employment | GVA | Rates | No. enterprises | |
|---|---|---|---|---|
| Wholesale, retail and repairs | 20.6% | 15.3% | 30.8% | 16.9% |
In 2013/2014, the ratio of rates/operating surplus was between 10.0% and 16.0% in 4 areas (Inverclyde, Dundee, West Dunbartonshire and Renfrewshire) and nowhere was it under 3.0%.
Figure 5 shows the ratio for wholesale, retail and repairs by local authority in 2013/2014.
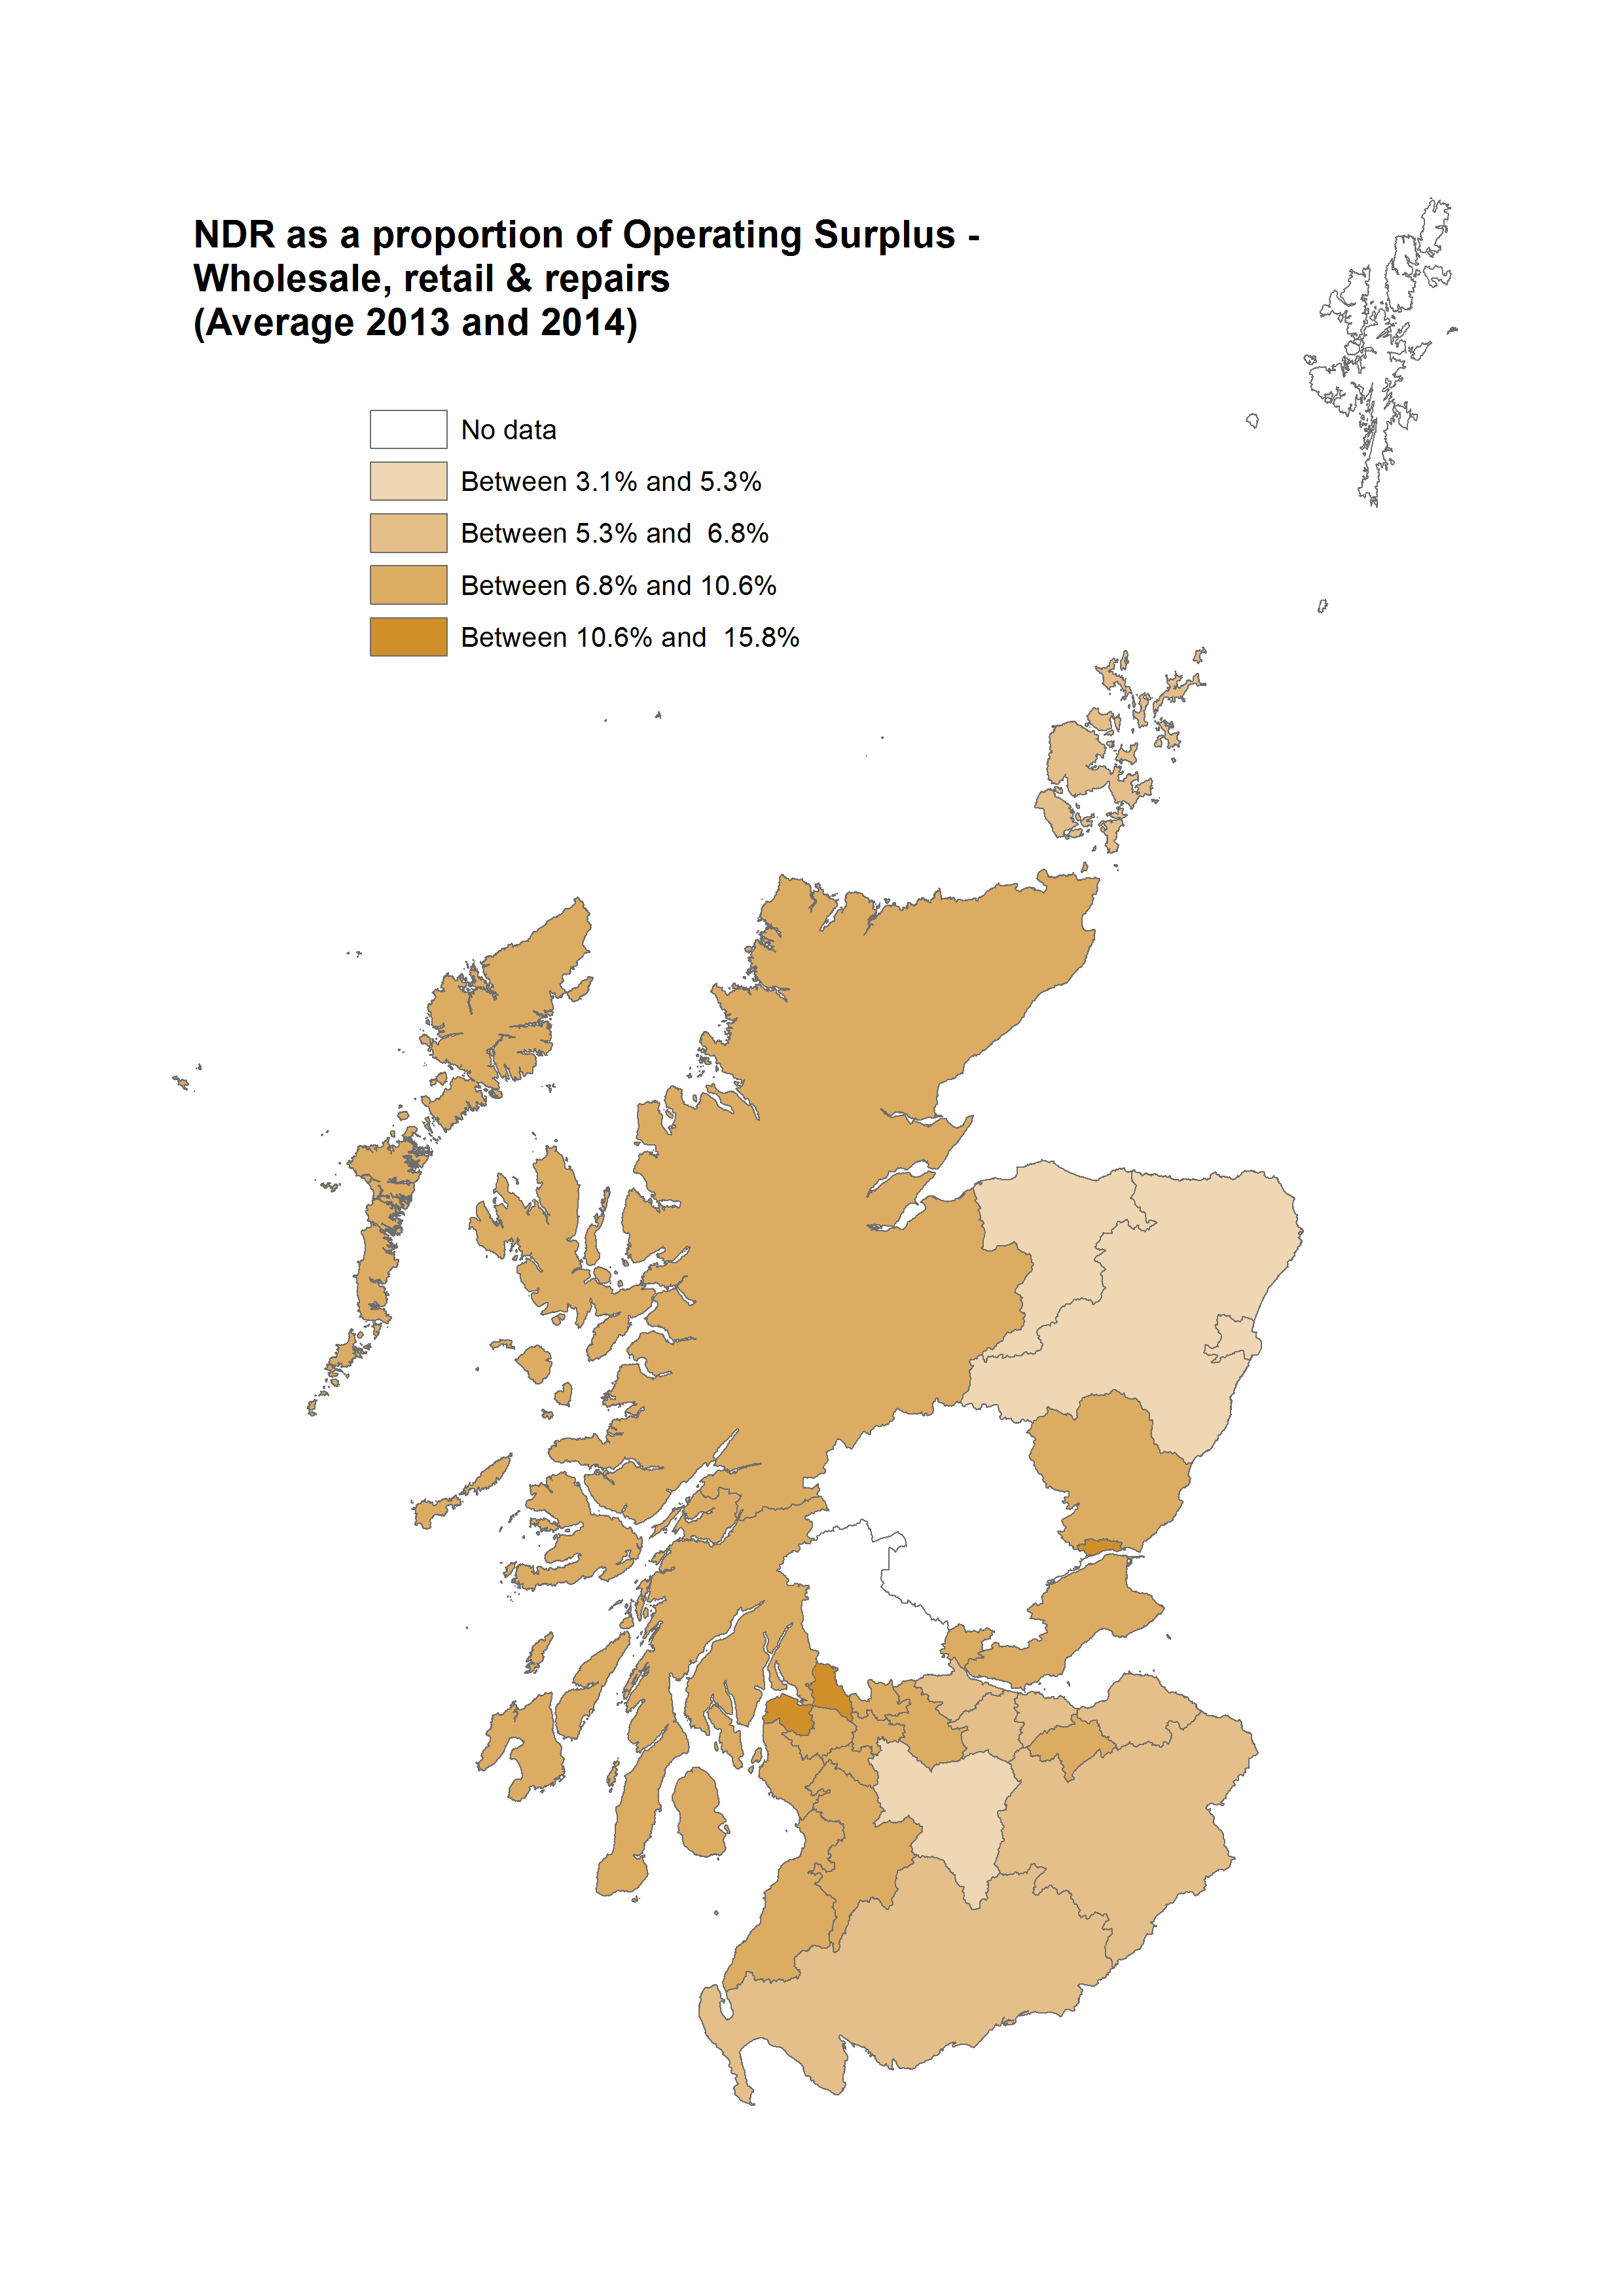
The ratio of NDR/operating surplus also seems to be marginally higher in the West of Scotland than the East.
Accommodation & food services
Table 4 shows the profile of accommodation & food services in relation to all business sectors (excluding finance) in 2014. Accounting for 10% of employment (the same as manufacturing), this sector has a lower productivity than manufacturing - it accounts for only 4% of GVA. However, this sector pays more than 10% of NDR - the same as manufacturing.
| Employment | GVA | Rates | No. enterprises | |
|---|---|---|---|---|
| Accommodation & food services | 10.0% | 4.1% | 11.0% | 8.7% |
Figure 6 shows the ratio for accommodation & food services in 2013/2014. In 2013/2014, the ratio of rates/operating surplus was over 10% in twenty local authorities. In no area was it under 4%. This is the highest ratio for all the business sectors, and is as high as 17% in East Scotland.
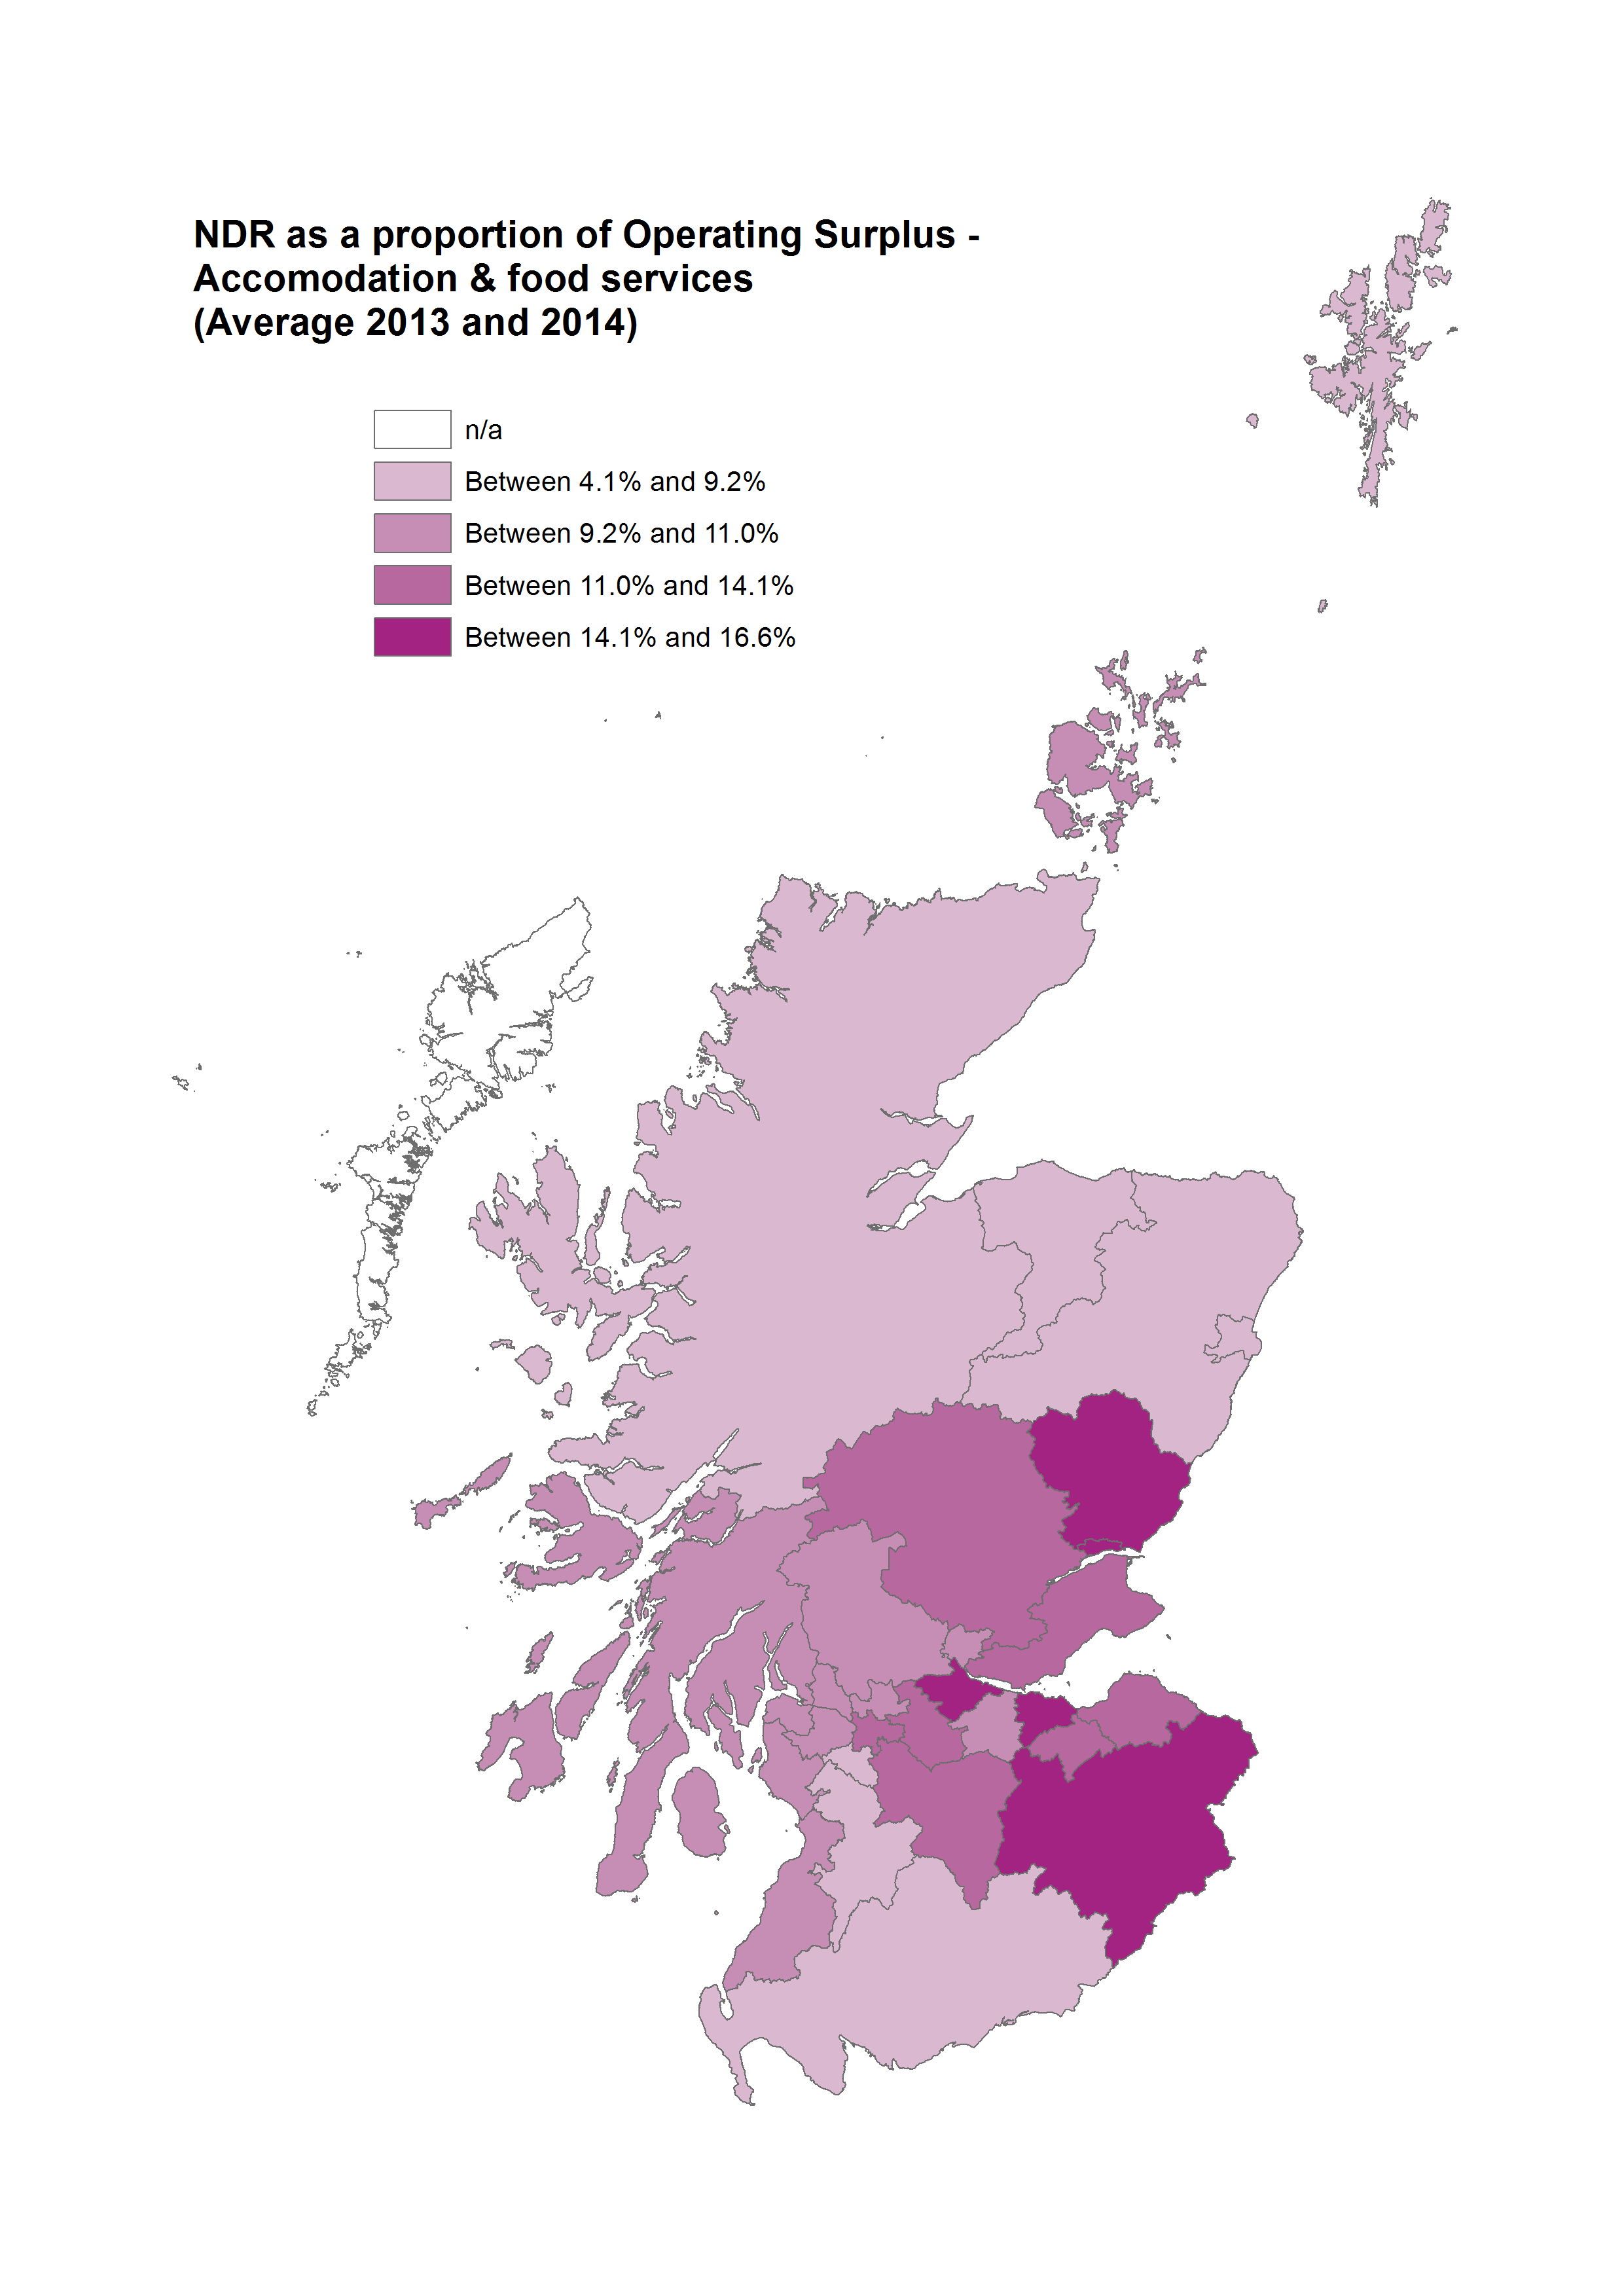
Eilean Siar was treated as an outlier because of the extreme variations in operating surplus and mainly NDR (for instance, there is an almost 600% change in NDR between two of the years which is not reflected in NDR returns reported by local authorities).
Sources
Scottish Government. (2017). Scottish Annual Business Statistics. Retrieved from <a href="http://www.gov.scot/Topics/Statistics/Browse/Business/SABS" target="_blank">http://www.gov.scot/Topics/Statistics/Browse/Business/SABS</a>
Scottish Government. (2016). Personal correspondence with Scottish Government.
Scottish Parliament. (2017). Local Government and Communities Committee. Written submissions. 12th Meeting, 2017 (Session 5). 25 April 2017. Retrieved from <a href="http://www.parliament.scot/S5_Local_Gov/Meeting%20Papers/20170426_MeetingPapers.pdf" target="_blank">http://www.parliament.scot/S5_Local_Gov/Meeting%20Papers/20170426_MeetingPapers.pdf</a> [accessed 17 August 2017]
Scottish Parliament. (2017). Local Government and Communities Committee. Wednesday 26 April 2017. Retrieved from <a href="http://www.parliament.scot/parliamentarybusiness/report.aspx?r=10917&mode=pdf" target="_blank">http://www.parliament.scot/parliamentarybusiness/report.aspx?r=10917&mode=pdf</a> [accessed 18 August 2017]