Local Government Finance: facts and figures 2026
This briefing provides a range of factual information and analysis on local government finance, including a profile of the local government budget over time, council tax and non domestic rates income, and expenditure trends from 2013-14 to 2026-27. There is also extensive discussion of local government debt, borrowing and reserves.
Introduction
Local authorities are independent statutory bodies with their own powers and responsibilities. They are accountable to their local electorates and not to the Scottish Parliament. Still, it is important for Members of the Scottish Parliament to understand some of the concepts and challenges around local government finance especially as the first Scottish Budget of Session 7 will be published in a matter of months. A main part of an MSP’s role is to scrutinise Scottish Government spending plans, and it is worth stressing that the local government allocation is the second largest part of the Scottish Budget.
Local authorities are key partners of the Scottish Government, with the relationship between the two spheres of government set out in the 2024 Verity House Agreement. One of the main commitments in the Agreement is to "respect each other’s democratic mandate" with an aspiration to reduce the use of ring-fencing (where the Scottish Government allocates pots of money to local authorities for joint priorities and the funding has strict terms and conditions attached). The message is clear from councils - they do not want to be considered a delivery agent of the Scottish Government.
Nevertheless, around 60% of local government's day-to-day spending comes in the form of a General Revenue Grant from the Scottish Government. This is announced in the Scottish Budget and MSPs vote on the final allocation of funding in February each year. How this allocation works alongside other funding streams - namely council tax and non-domestic rates - is explored throughout this briefing.
The Improvement Service, alongside partners in local government, has recently mapped the duties and powers held by local authorities in Scotland. This is a useful new resource and serves to remind us of the range of important services provided by councils to households and communities every day. But spending by councils on many of these services has reduced, sometimes dramatically, over the past 14 years. This is a message council leaders and chief executives may repeat over the next five years as the Parliament focuses on public service reform - councils have already made difficult and significant reductions to many of their services over recent years.
Despite these efforts, the Accounts Commission wrote in October 2024 that "councils face significant financial sustainability challenges, placing vital public services at risk". 1 This sentiment is echoed in the Local Government Information Unit's 2025 survey report which found that over two-thirds of respondents feel their council may not be able to balance its budget within the next five years2. As well as looking at funding, spending and demand challenges, this briefing explores a number of local authority debt and financial sustainability indicators.
Executive Summary
Funding from the Scottish Government to local government
As of February 2026, the Scottish Government is providing local government with an overall funding package of £15.7 billion in 2026-27.
Overall funding increased by £218 million in real terms over the year when comparing the 2026-27 Budget figure with the 2025-26 equivalent.
The overall settlement is 5.6% higher in real terms when compared to Draft Budget 2013-14, the earliest comparable year.
Revenue funding from the Scottish Government- which helps pay for day-to-day spending such as wages and other operational costs - increased by £948 million in real terms between Draft Budget 2013-14 and Budget 2026-27.
Spending by local government
According to many in local government, any increased funding has not been enough to meet the demands, challenges and expansion of duties placed on local authorities.
Education, social work (which includes social care) and housing have seen real terms increases in spending over the past 14 years.
Most other services have seen reductions (when looking across Scotland as a whole).
Employment costs constitute around 70% of local government revenue budgets.
Spending by councils on employment increased by 21% in real terms over the past 10 years, much of this being in the area of school education services.
Capital funding and financial sustainability
Capital funding is used to pay for the buying, construction, maintenance and improvement of physical property and other assets - things like schools, community centres, IT systems, paths and roads - whose benefits should last over a number of years, if not decades.
Local authorities receive capital grants from the Scottish Government, but they can also borrow for capital purposes.
Capital grant allocations from the Scottish Government this year are the lowest they have been since 2013-14 (in real terms).
Despite this, capital expenditure in 2026-27 is expected to be considerably higher than previous years. This will mainly be funded through borrowing.
Annual borrowing by councils has increased significantly over recent years.
Total local government debt stood at £25.3 billion in March 2025.
The overall local government settlement (revenue + capital)
Local Government Finance Circular 02/2026 shows that the Scottish Government is providing an overall funding package of £15.7 billion to local government in 2026-271. The following table shows comparable figures, in cash terms, going back to 2013-14:
Chart 1: overall local government settlements from the Scottish Government since 2013-14 (cash terms, £m)
.png)
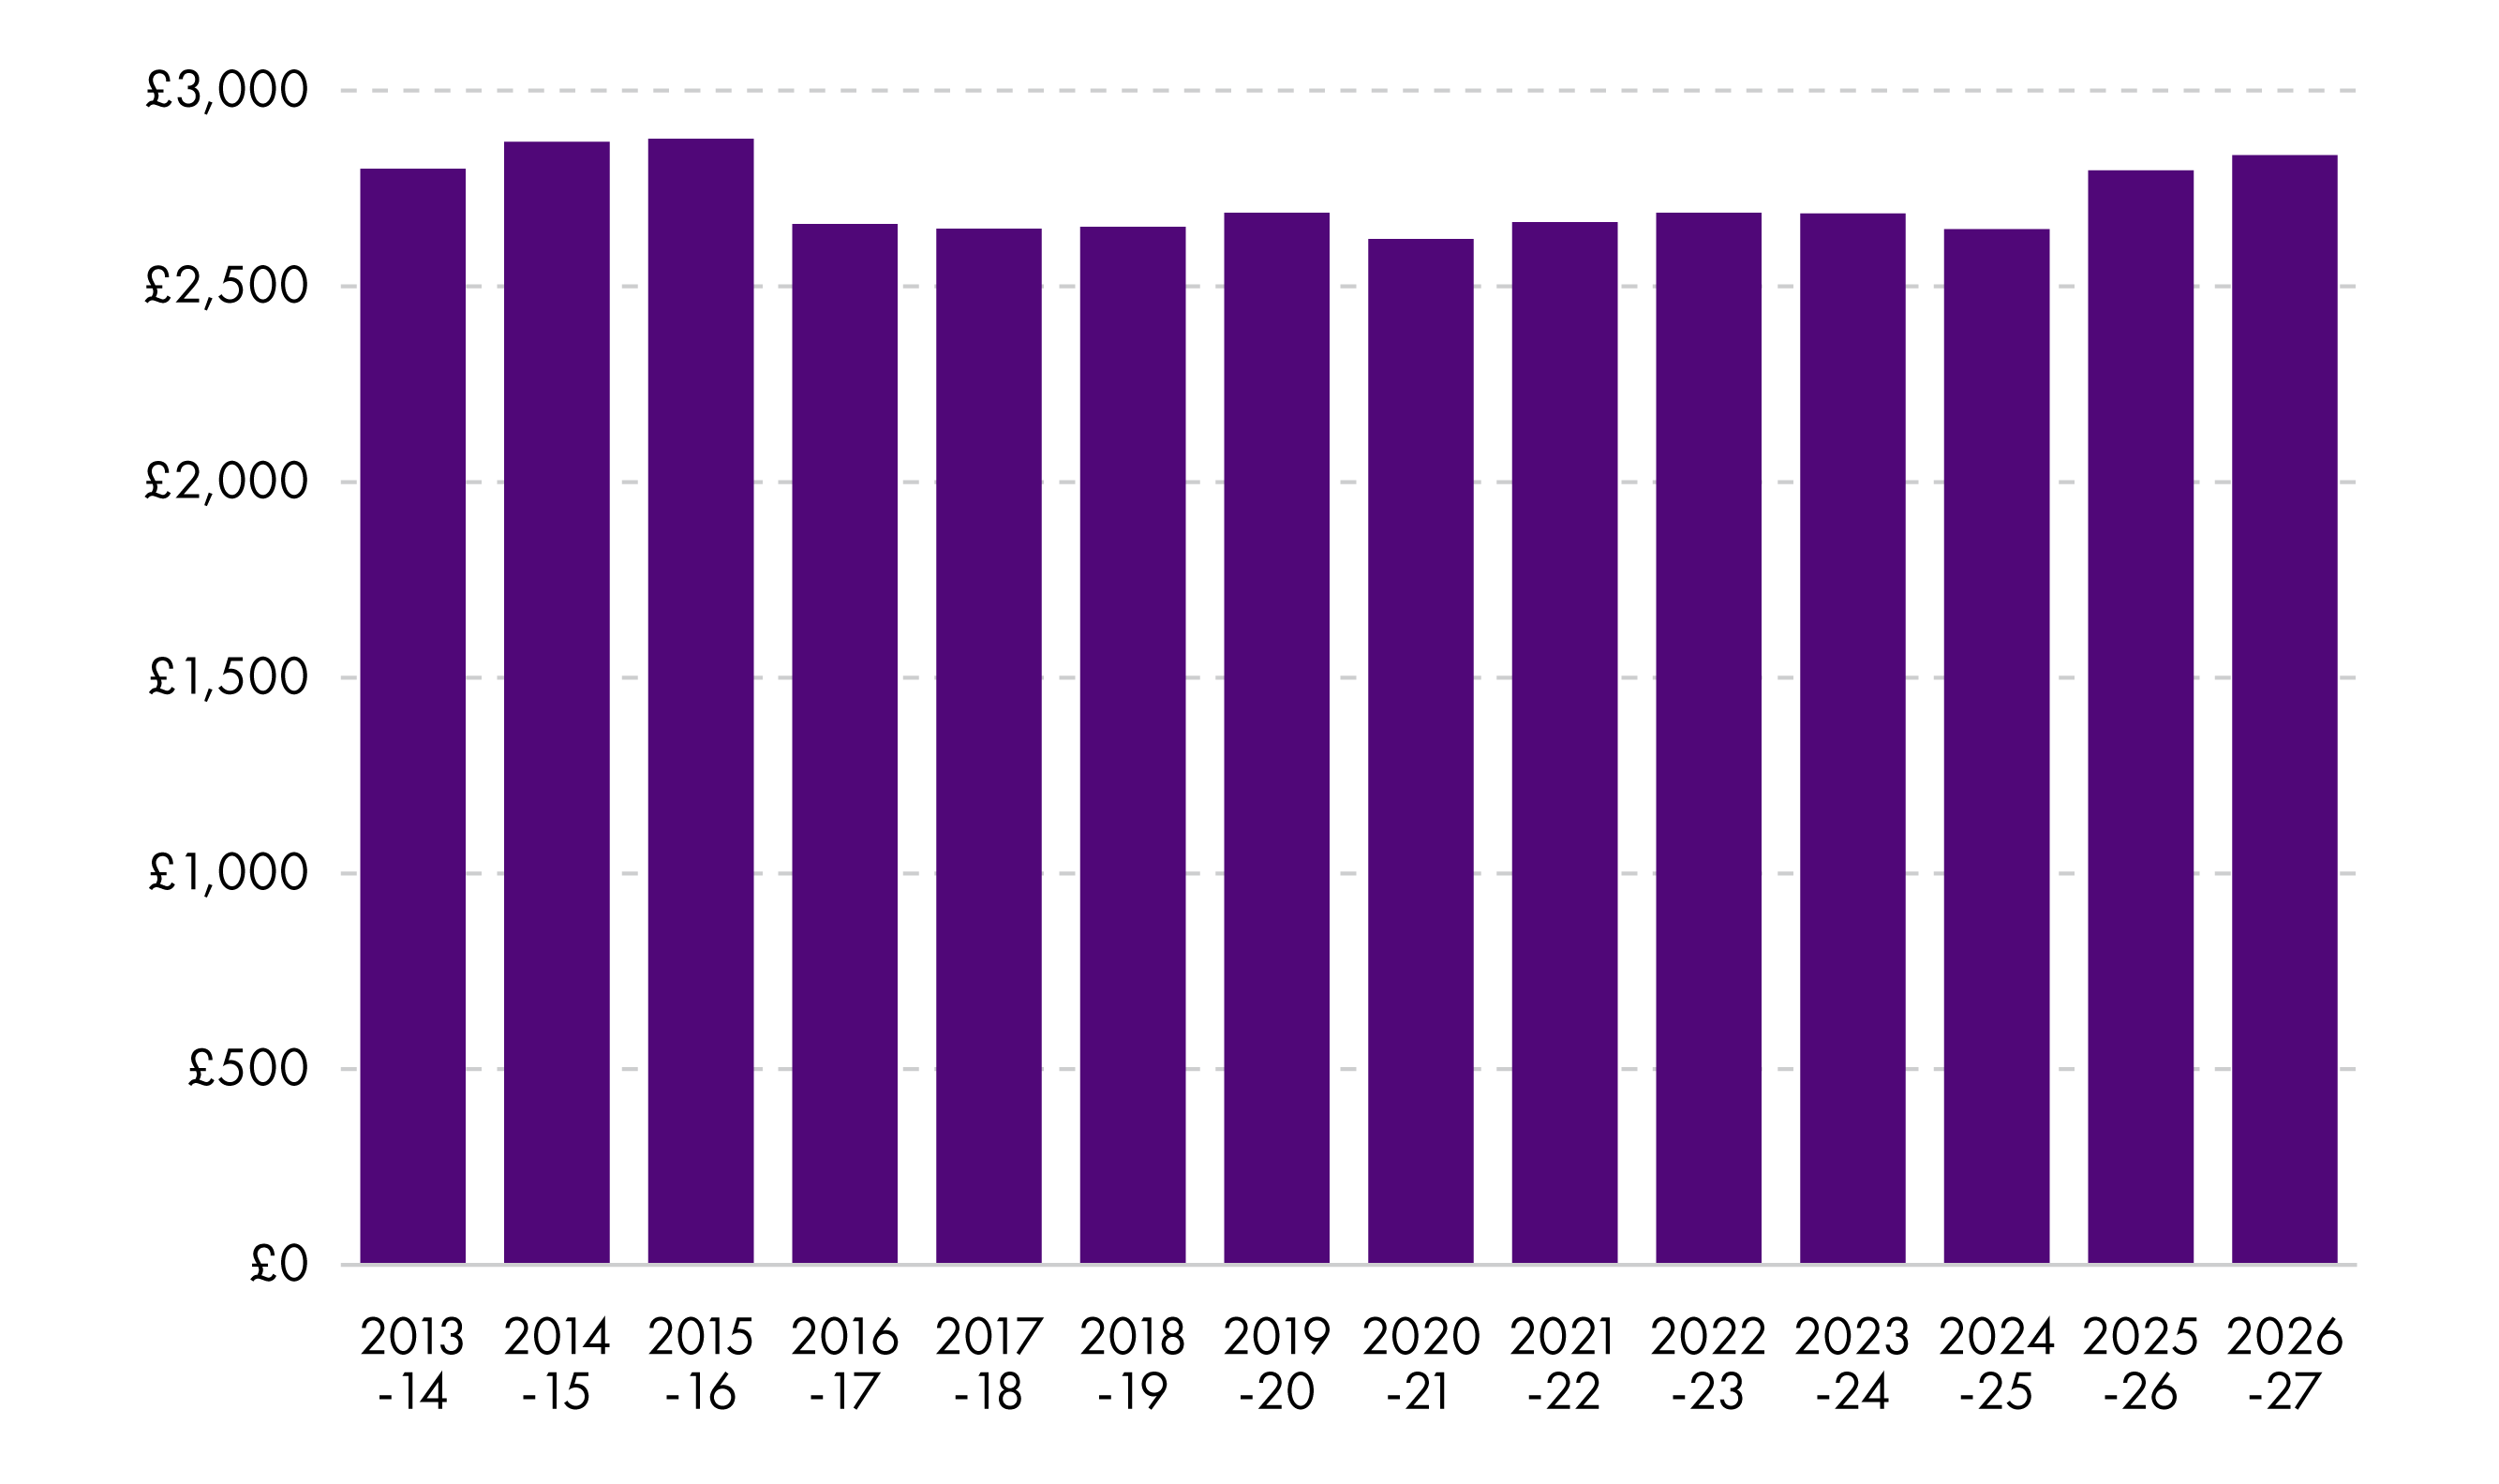
Taking into account the impact of inflation, Chart 2 (below) shows the initial budget allocations in "real terms" for each year between 2013-14 and 2026-27. This shows that the total settlement increased by £834 million, or 5.6%, over the period. However, there were some annual real term reductions over the period. For example, we can see that the settlement reduced compared to the previous year by 7.2% in 2016-17 and by 2.6% in 2020-21:
.png)
Scottish Government Finance Circulars and SPICe real terms calculations
The £15.7 billion funding for 2026-27 works out at £2,833 per person across Scotland. The comparable figure for 2013-14 was £2,798. Therefore, the local government settlement increased by £35 per person over the 12-year period (in real terms).
The charts in this briefing mostly use 2013-14 as the baseline year for comparisons over time. Before then, the local government settlement included funding for police and fire services. This was removed prior to the beginning of the 2013-14 financial year, with Police Scotland and Fire and Rescue Services Scotland being established. As such, 2013-14 is the earliest meaningful like for like comparison.
Changes in the revenue part of the settlement
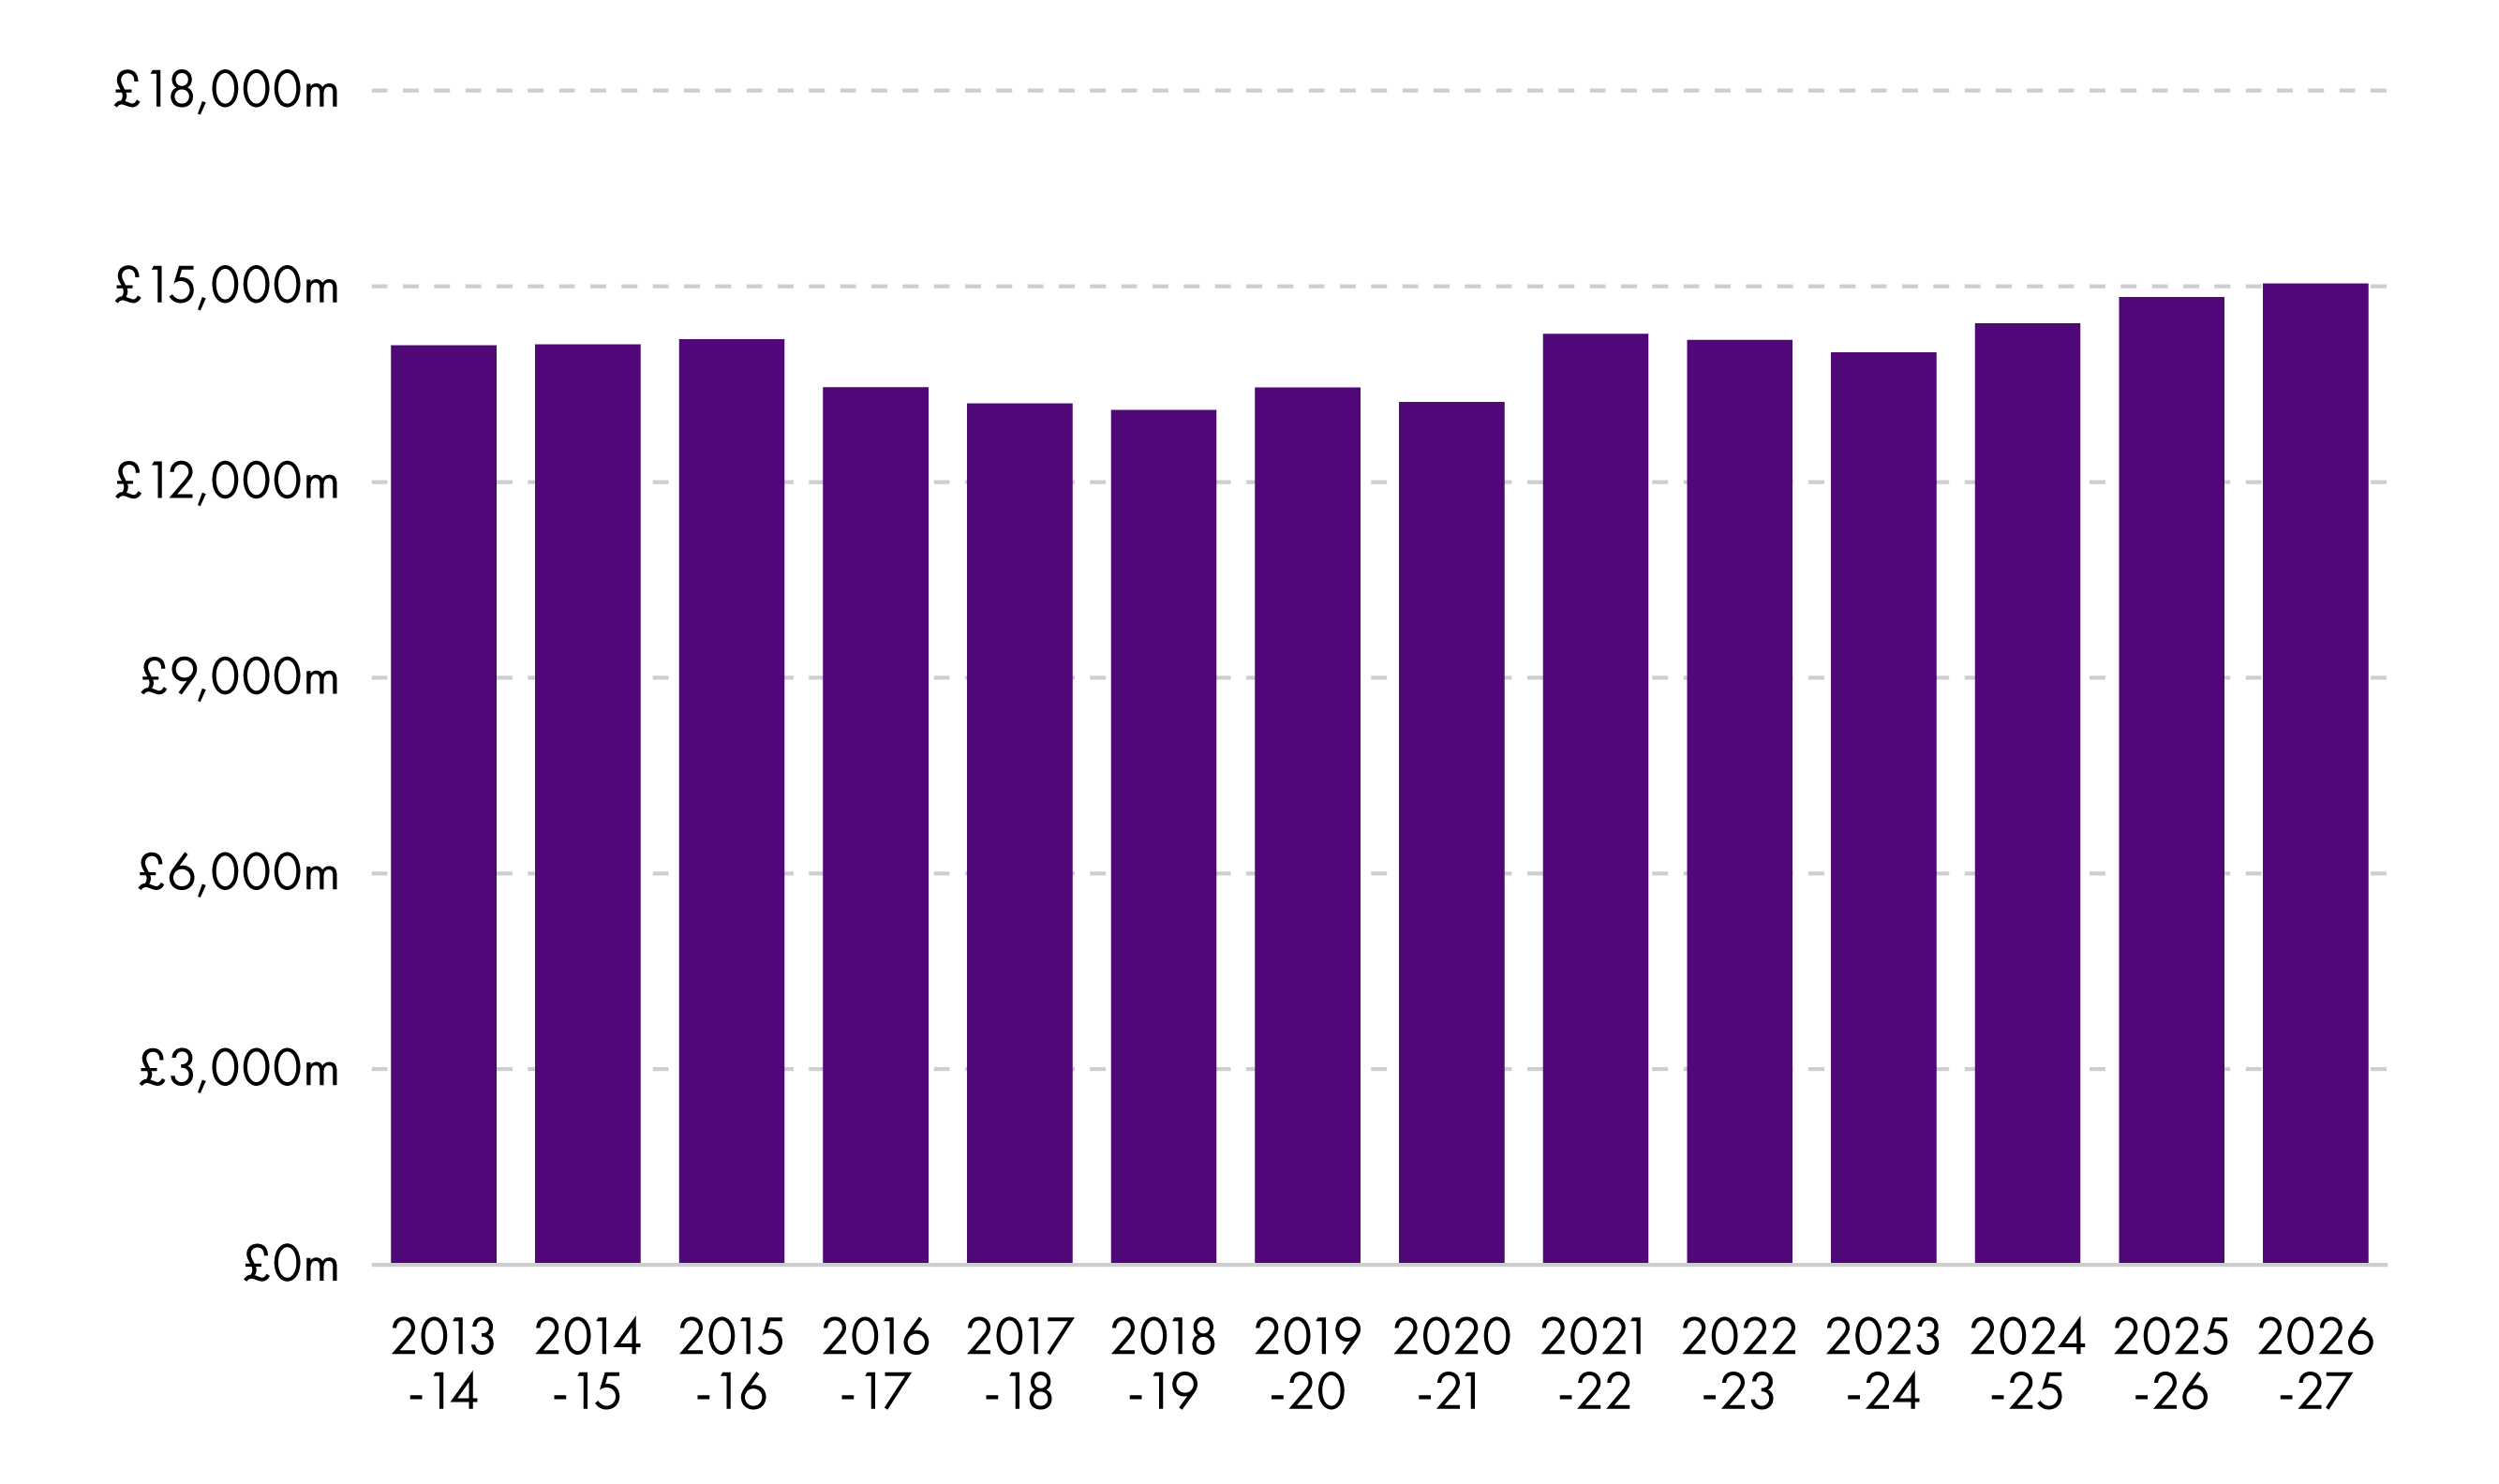
Looking at the revenue part of the local government settlement - the funding that helps pay for day-to-day spending such as wages and operational costs- Chart 4 shows a real terms increase of 7% between the 2013-14 budget and the 2026-27 budget, from £14.1 billion to £15.0 billion.
COSLA and CIPFA's Directors of Finance section contest that local authorities do much more now than they did in April 2013, particularly in the areas of early years provision, free school meals and adult social care (see 1). They argue that the costs of delivering these new or enhanced services exceed any additional money allocated by the Scottish Government over the period.
Furthermore, demand for local government services has changed over the past 15 years, as set out in a recent report from the Improvement Service. This research finds:
In the period from 2010-11 the [Scottish] population has risen by 5.4%, and there has been an especially rapid increase in the population aged 75 and over of 30.5%, leading to ageing of the Scottish population. This growth has increased demand for council services.2
Revenue allocation as a % of the Scottish Government revenue budget
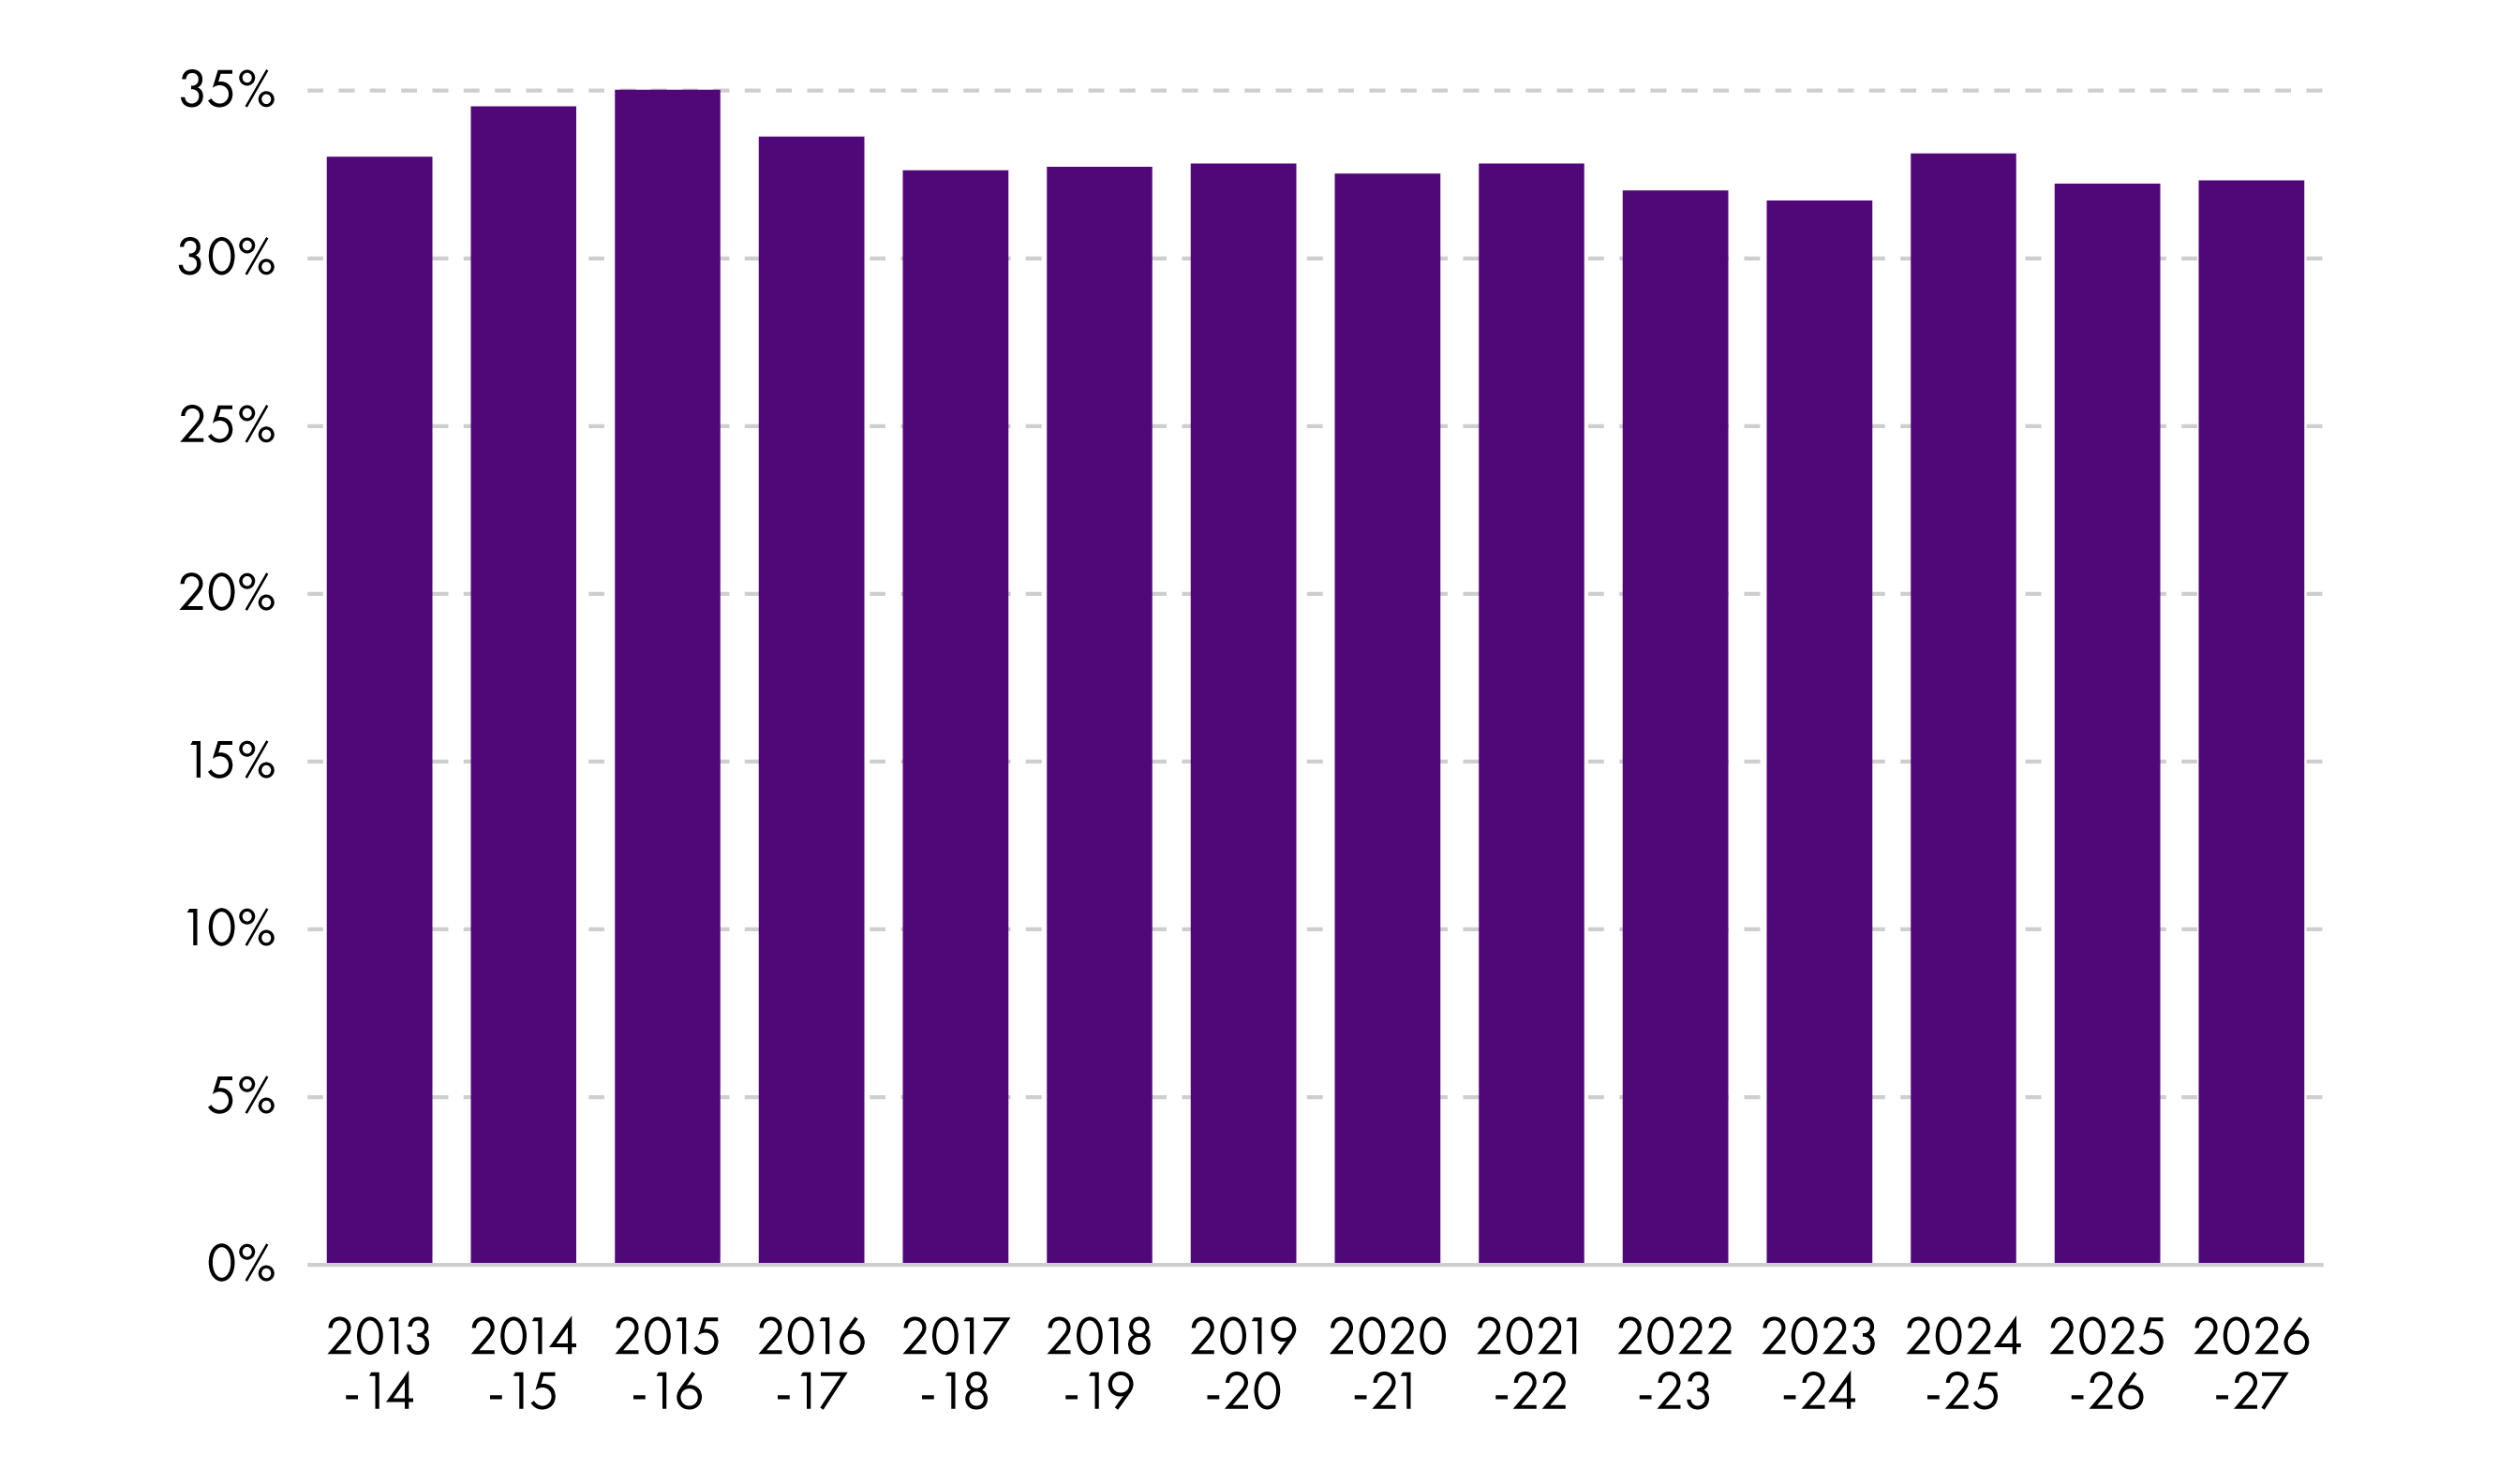
Chart 5 shows the local government revenue allocation as a share of the Scottish Government's core revenue block grant from the UK Government (plus non-domestic rates income) for each of the last 14 years. These figures are from the time of the Scottish Budget and don't include additional in-year transfers.
Scottish Government Finance Circulars and Scottish Government budget documents (earlier Draft Budget documents are available in SPICe)
The local government revenue allocation as a proportion of the Scottish Government's core revenue block grant from the UK Government remained fairly stable over the period - it was 33% in 2013-14 and 32.3% at the time of the 2026-27 Budget.
Over the same period, the budget allocation to Scotland's health boards increased from 29% of the Scottish Government's total block grant to 34% in 2026-27 (SPICe calculations).
Note: for comparison purposes, the Scottish Government budget figures do not include the Social Security Block Grant Adjustments.
Changes in overall capital allocation
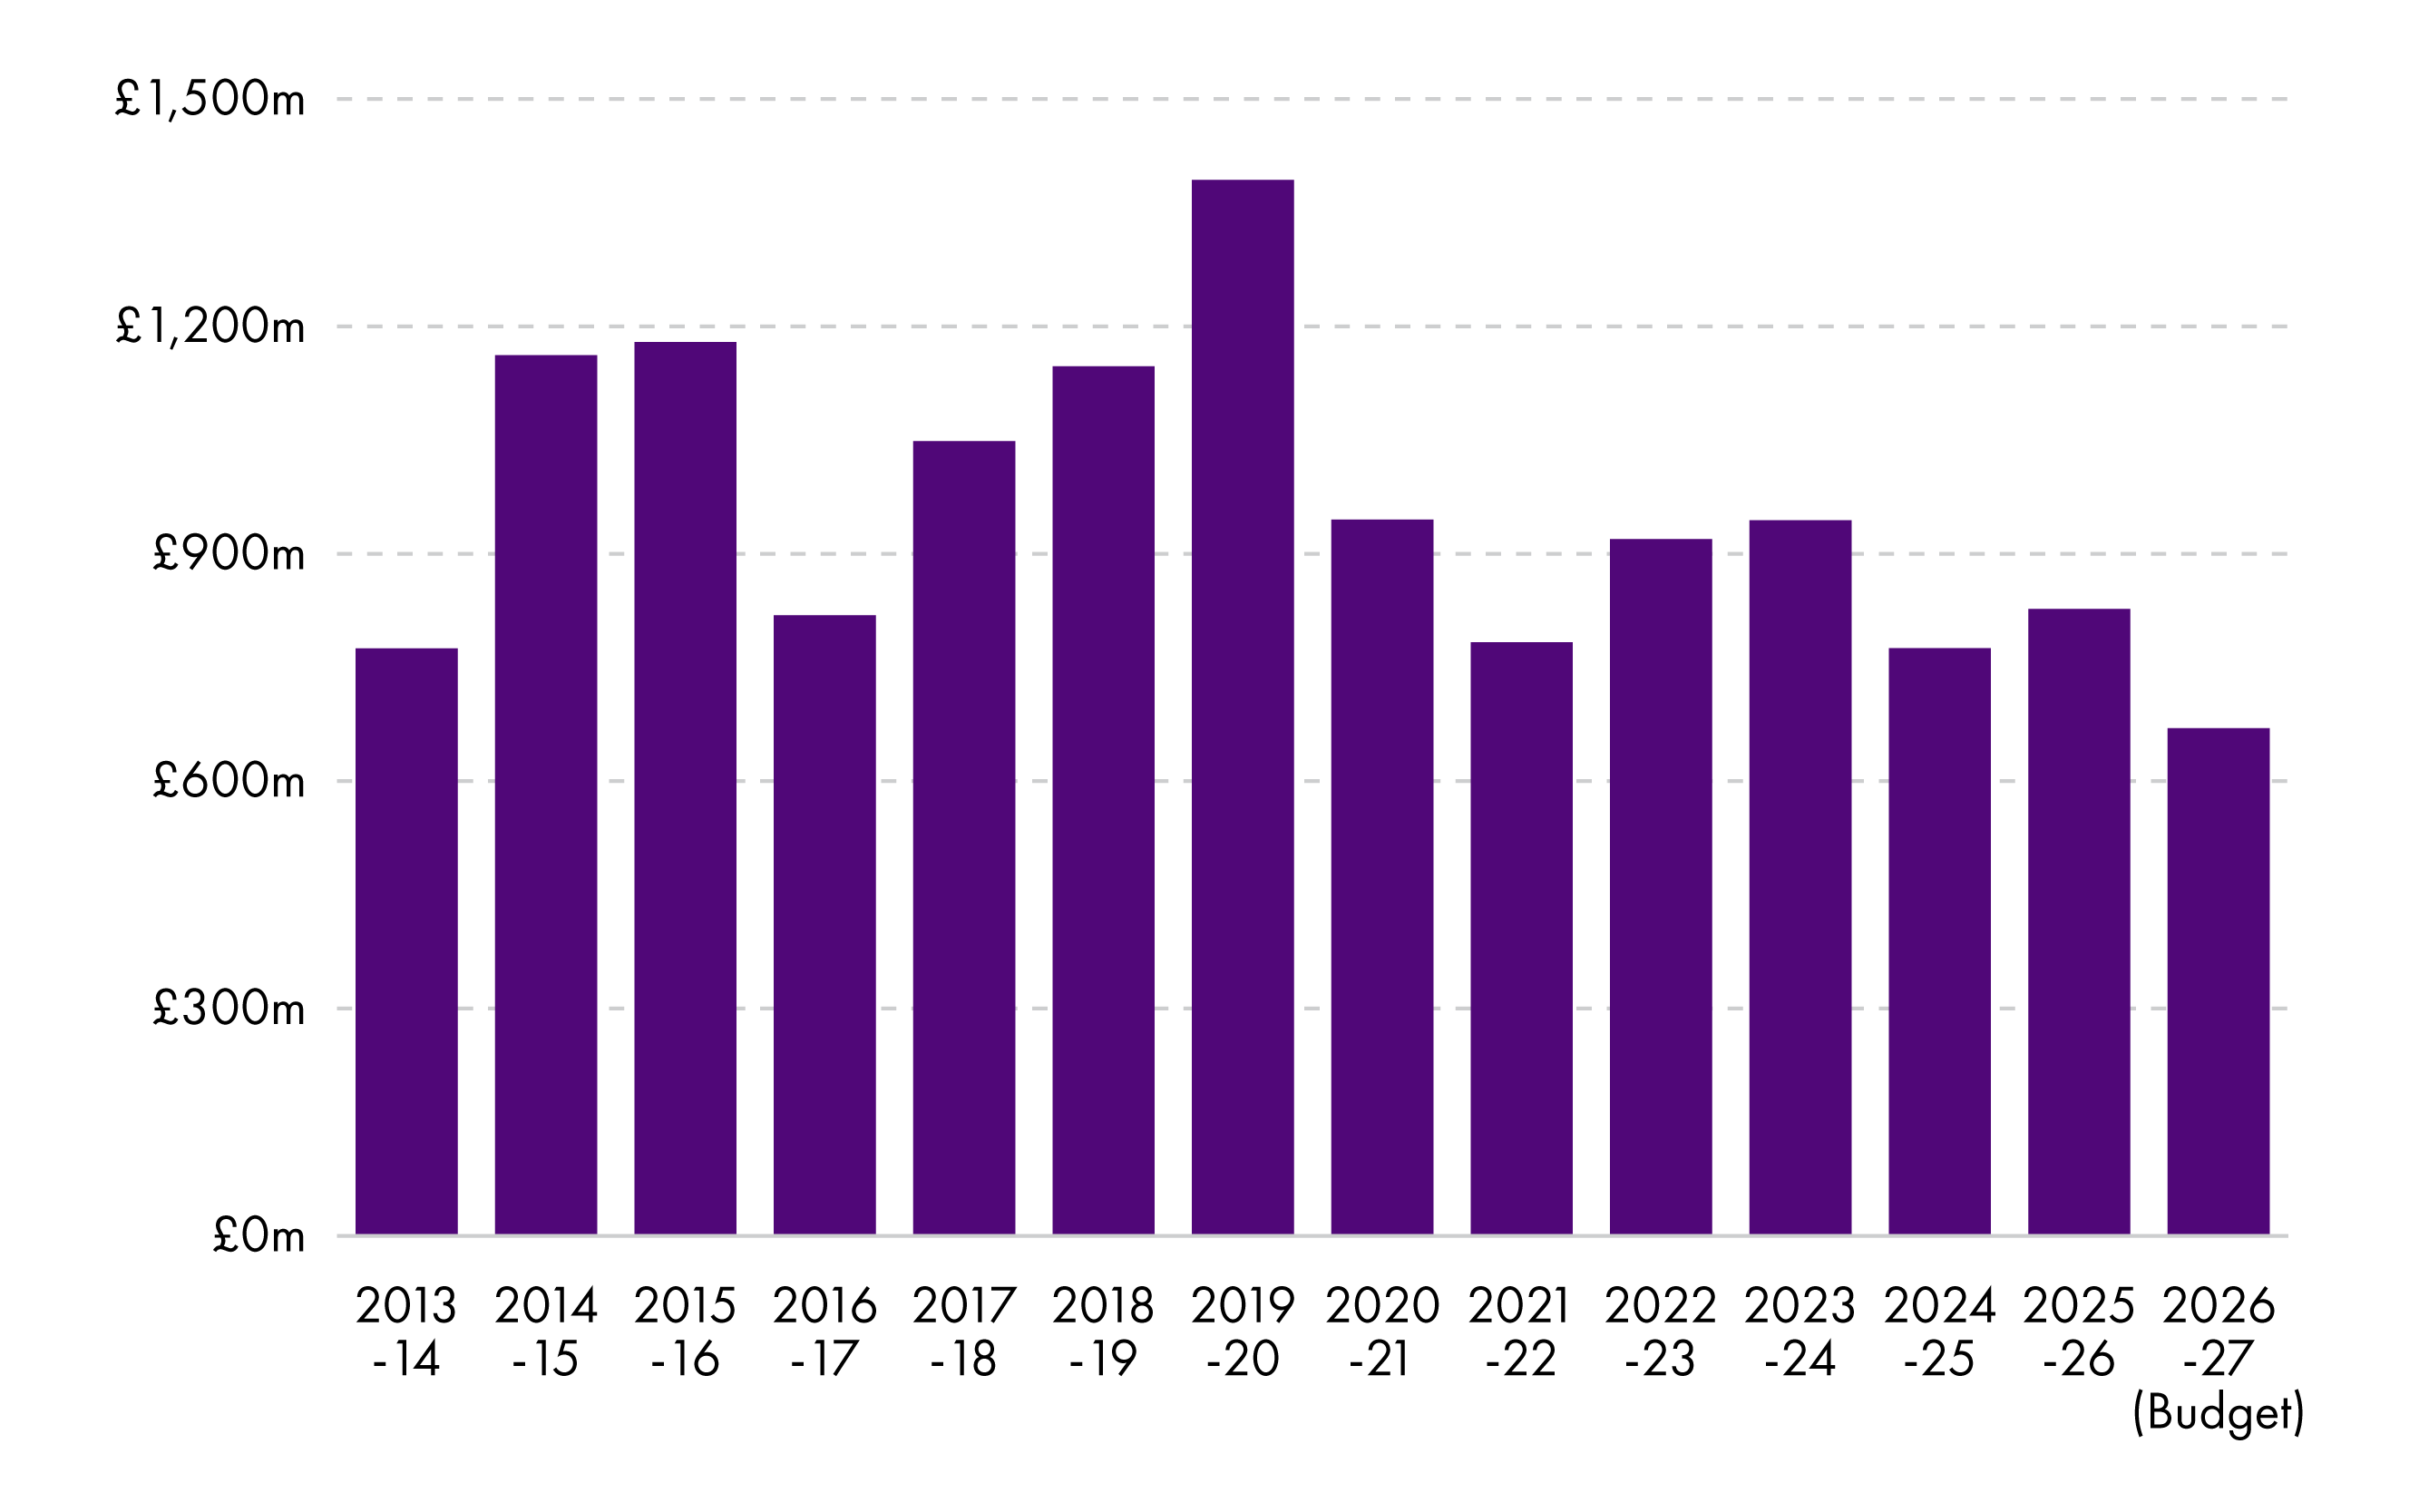
Capital funding is used to pay for the buying, construction, maintenance or improvement of physical property and other assets - things like schools, community centres, IT systems, paths and roads - whose benefits should last over a number of years. Local authorities receive capital grants from the Scottish Government but they can also borrow for capital purposes (discussed later). Capital grants can vary significantly from year to year, as demonstrated in Chart 6. Nevertheless, when presented in real-terms, there is a definite downward trend since 2020, with the capital allocation for 2026-27 being the lowest since before 2013-14.
Scottish Government Finance Circulars and SPICe real terms calculations
In a recent PQ response, the Scottish Government stated: "The Scottish Government have had to take difficult decisions in light of the disappointing capital settlement from the UK Government’s Spending Review".
How revenue funding is allocated to individual local authorities
The overall amount allocated to local government each year is decided by the Scottish Government through the wider budget process which includes engagement with COSLA on behalf of all 32 local authorities. The outcome of Ministerial decisions determined that councils should have a total of £17.1 billion revenue funding in 2026-27, a figure that includes General Revenue Grant, ring-fenced grants, forecasted non-domestic rates revenue and assumed council tax income (see column 5, Annex B of the Finance Circular 02/2026)1. How this total is then distributed amongst Scotland's 32 local authorities is based on a complex formula which has been developed over decades.
Central to the allocation process is the Settlement and Distribution Group (SDG), a joint group comprising Scottish Government and COSLA officials, as well as senior finance officers from individual local authorities. The SDG considers any new local government funding and distribution, whilst providing a forum for officials to discuss future funding issues. It makes recommendations to both Ministers and Council Leaders on the best distribution for funding in line with the agreed principles of the SDG.
The Green Book
The Scottish Government uses various data and weighted formulas to apportion a share of funding to each of Scotland's 32 councils2. These are contained within a 73 page document known as the Green Book. The lines within these are reviewed regularly and agreed where changes are proposed with COSLA3. The idea behind it is to assess, as far as possible, "how much each council needs to provide comparable and consistent service levels, operating at the same level of efficiency"4.
The formula considers around 140 local authority services - for example, early learning and childcare, adult support and protection, road maintenance, etc - each having different data sets and formulas applied to assess relative need. Many of these indicators are related to population or school pupil numbers, but other factors such as deprivation levels and rurality, road length and homelessness may be taken into account depending on the service being considered.
An important part of the settlement process is the main funding floor calculation, which provides a degree of stability for all local authorities where the alignment of funding with relative need results in a lower-than-average change in the year-to-year funding. More information is included in the Scottish Government's useful guide to the local government finance settlement5.
The Scottish Parliament debates and approves individual local authority allocations each year, although no draft finance order has ever been rejected by the Parliament (see the Official Report of the most recent debate and vote). The Budget Bill determines the overall funding for local government and the finance order determines the distribution to local authorities.
Please note that while the Green Book sets out how the allocations are calculated (by building up from calculations at the level of individual services), this does not determine how local authorities should spend their budgets. This is entirely a matter for individual local authorities and they do not need to reflect the Green Book allocations for individual services in their budget decisions.
Revenue settlements for individual councils
Once the total revenue funding for each local authority is calculated, the Scottish Government subtracts estimated council tax and non-domestic rates income from each of the 32 amounts. What remains is the value of revenue grant each council will receive, mainly in the form of General Revenue Grants.
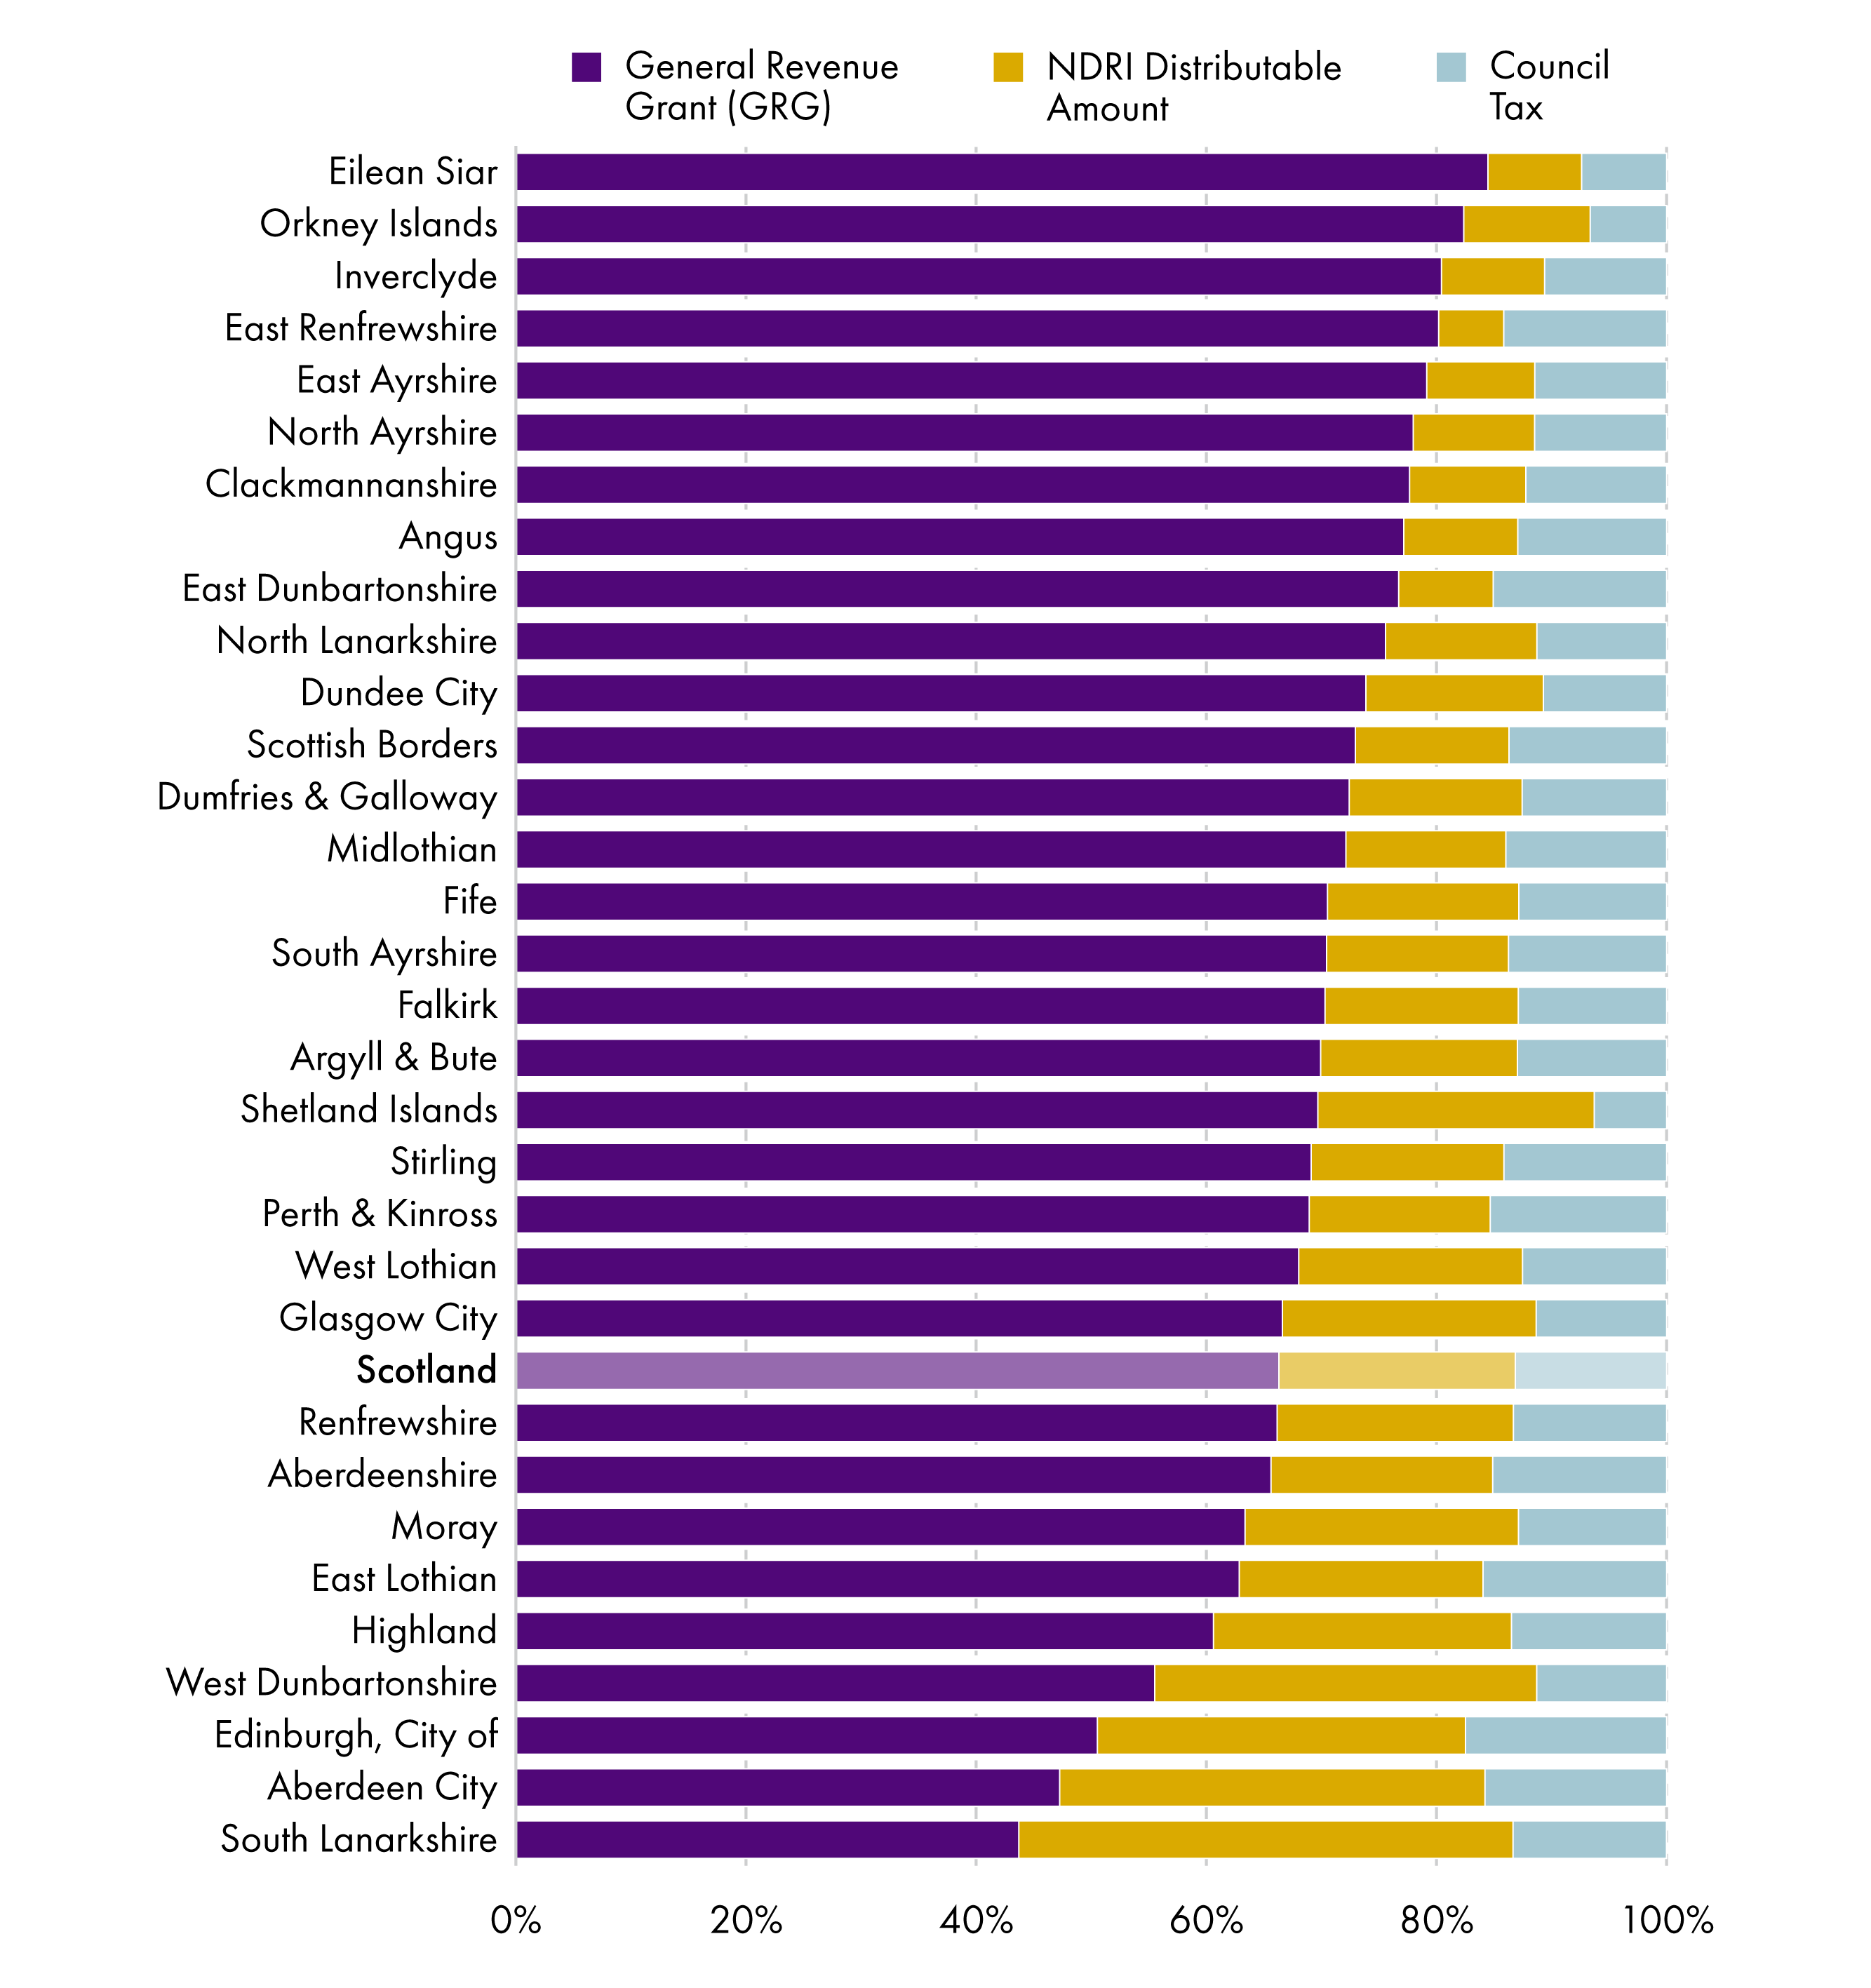
Local authorities with higher levels of council tax and non domestic rates income will see a smaller proportion of their revenue coming in the form of revenue grant in order to ensure all councils receive their formula share. Chart 7 shows this for the current financial year, with Eilean Siar, Inverclyde and East Ayrshire seeing the highest proportion of grant and South Lanarkshire, Aberdeen and Edinburgh seeing the lowest (with over 50% of their income coming from non-domestic rates (NDR) and council tax income). The reason South Lanarkshire receives such a large amount of NDR income is explained in a later section.
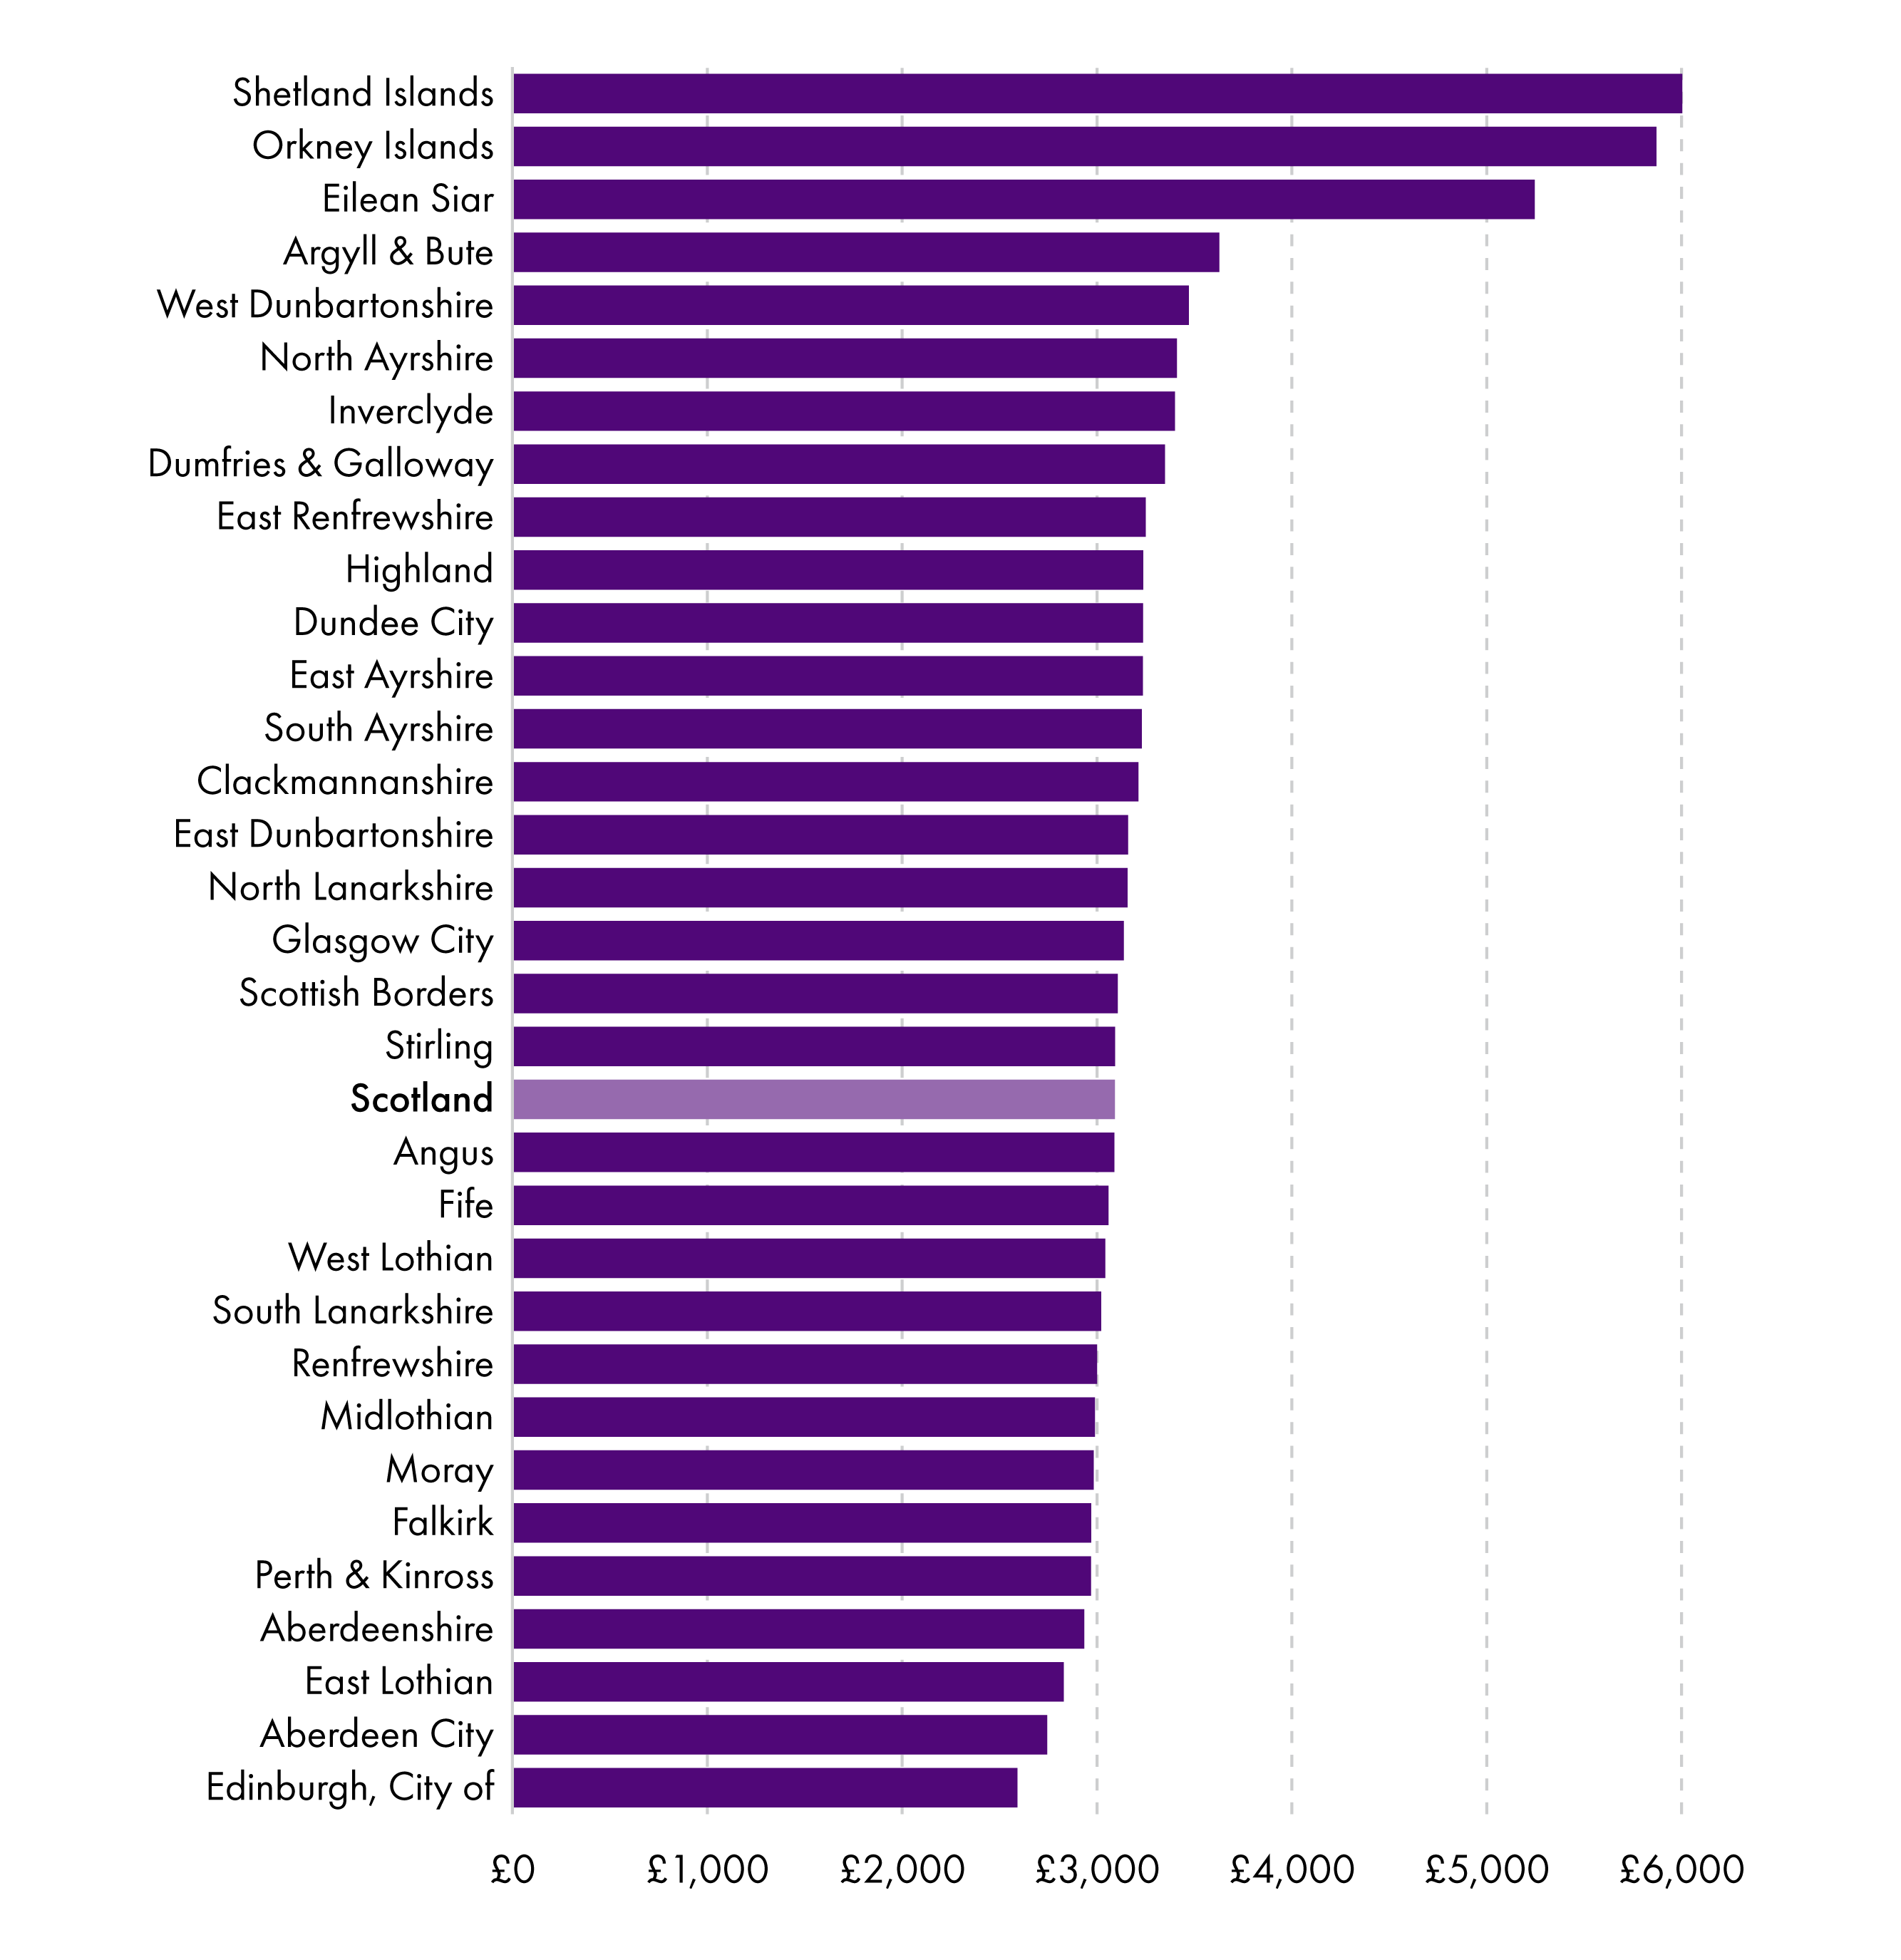
The combination of revenue grant funding, non-domestic rates and council tax income is the same as Total Estimated Expenditure (TEE) as set out in the Local Government Finance Circulars. Chart 11 (below) shows TEE per person for each local authority, with councils ranked from the highest per head to the lowest. With an all-Scotland average of £3,089 per head, Shetland and Orkney councils see the highest expenditure per head, whilst Edinburgh and Aberdeen see the smallest:
Last session, various Members of the Scottish Parliament argued that Edinburgh and Aberdeen are unfairly treated by the formula used to allocate local government funding. For example, during a Local Government, Housing and Planning Committee session in 2024, one of its Members asked COSLA:
I represent Edinburgh, which receives the lowest share per head of population but has some of the largest challenges in the country around homelessness and children in temporary accommodation. There are also the national events that take place in the capital and the costs that arise from those. What is COSLA’s thinking on that?
COSLA's position is that it seeks to increase funding for all local authorities: "the issue is the size of the cake that we are given, rather than the size of individual slices that local authorities receive". And the Scottish Government, when asked about the issue, told the Committee:
...the funding formula is a matter for COSLA. Over the years, adjustments have been made to the funding formula, but it is a thorny issue among local authorities. There is probably quite a lot of hesitance in COSLA and local government more widely about opening up that Pandora’s box, because there will be winners and losers from any adjustment to the formula. It is not something that we can do to local government; it has to be initiated by COSLA.
Allocations to individual councils over time
Revenue settlements to individual local authorities, as documented in the Scottish Government's finance circulars, include General Revenue Grants, non-domestic rates income and ring-fenced (specific) grants. Overall, this combined revenue allocation comes to around £15 billion in 2026-27.
Local authorities are informed about their likely allocations for the following financial year shortly after the publication of the Scottish Budget. However, the final allocations are not confirmed until after the Scottish Parliament debates and votes on the draft Local Government Finance Order in late February. The following allocations (which include General Revenue Grant, NDR income and ring-fenced grants) were approved by Parliament on 26th February 2026:
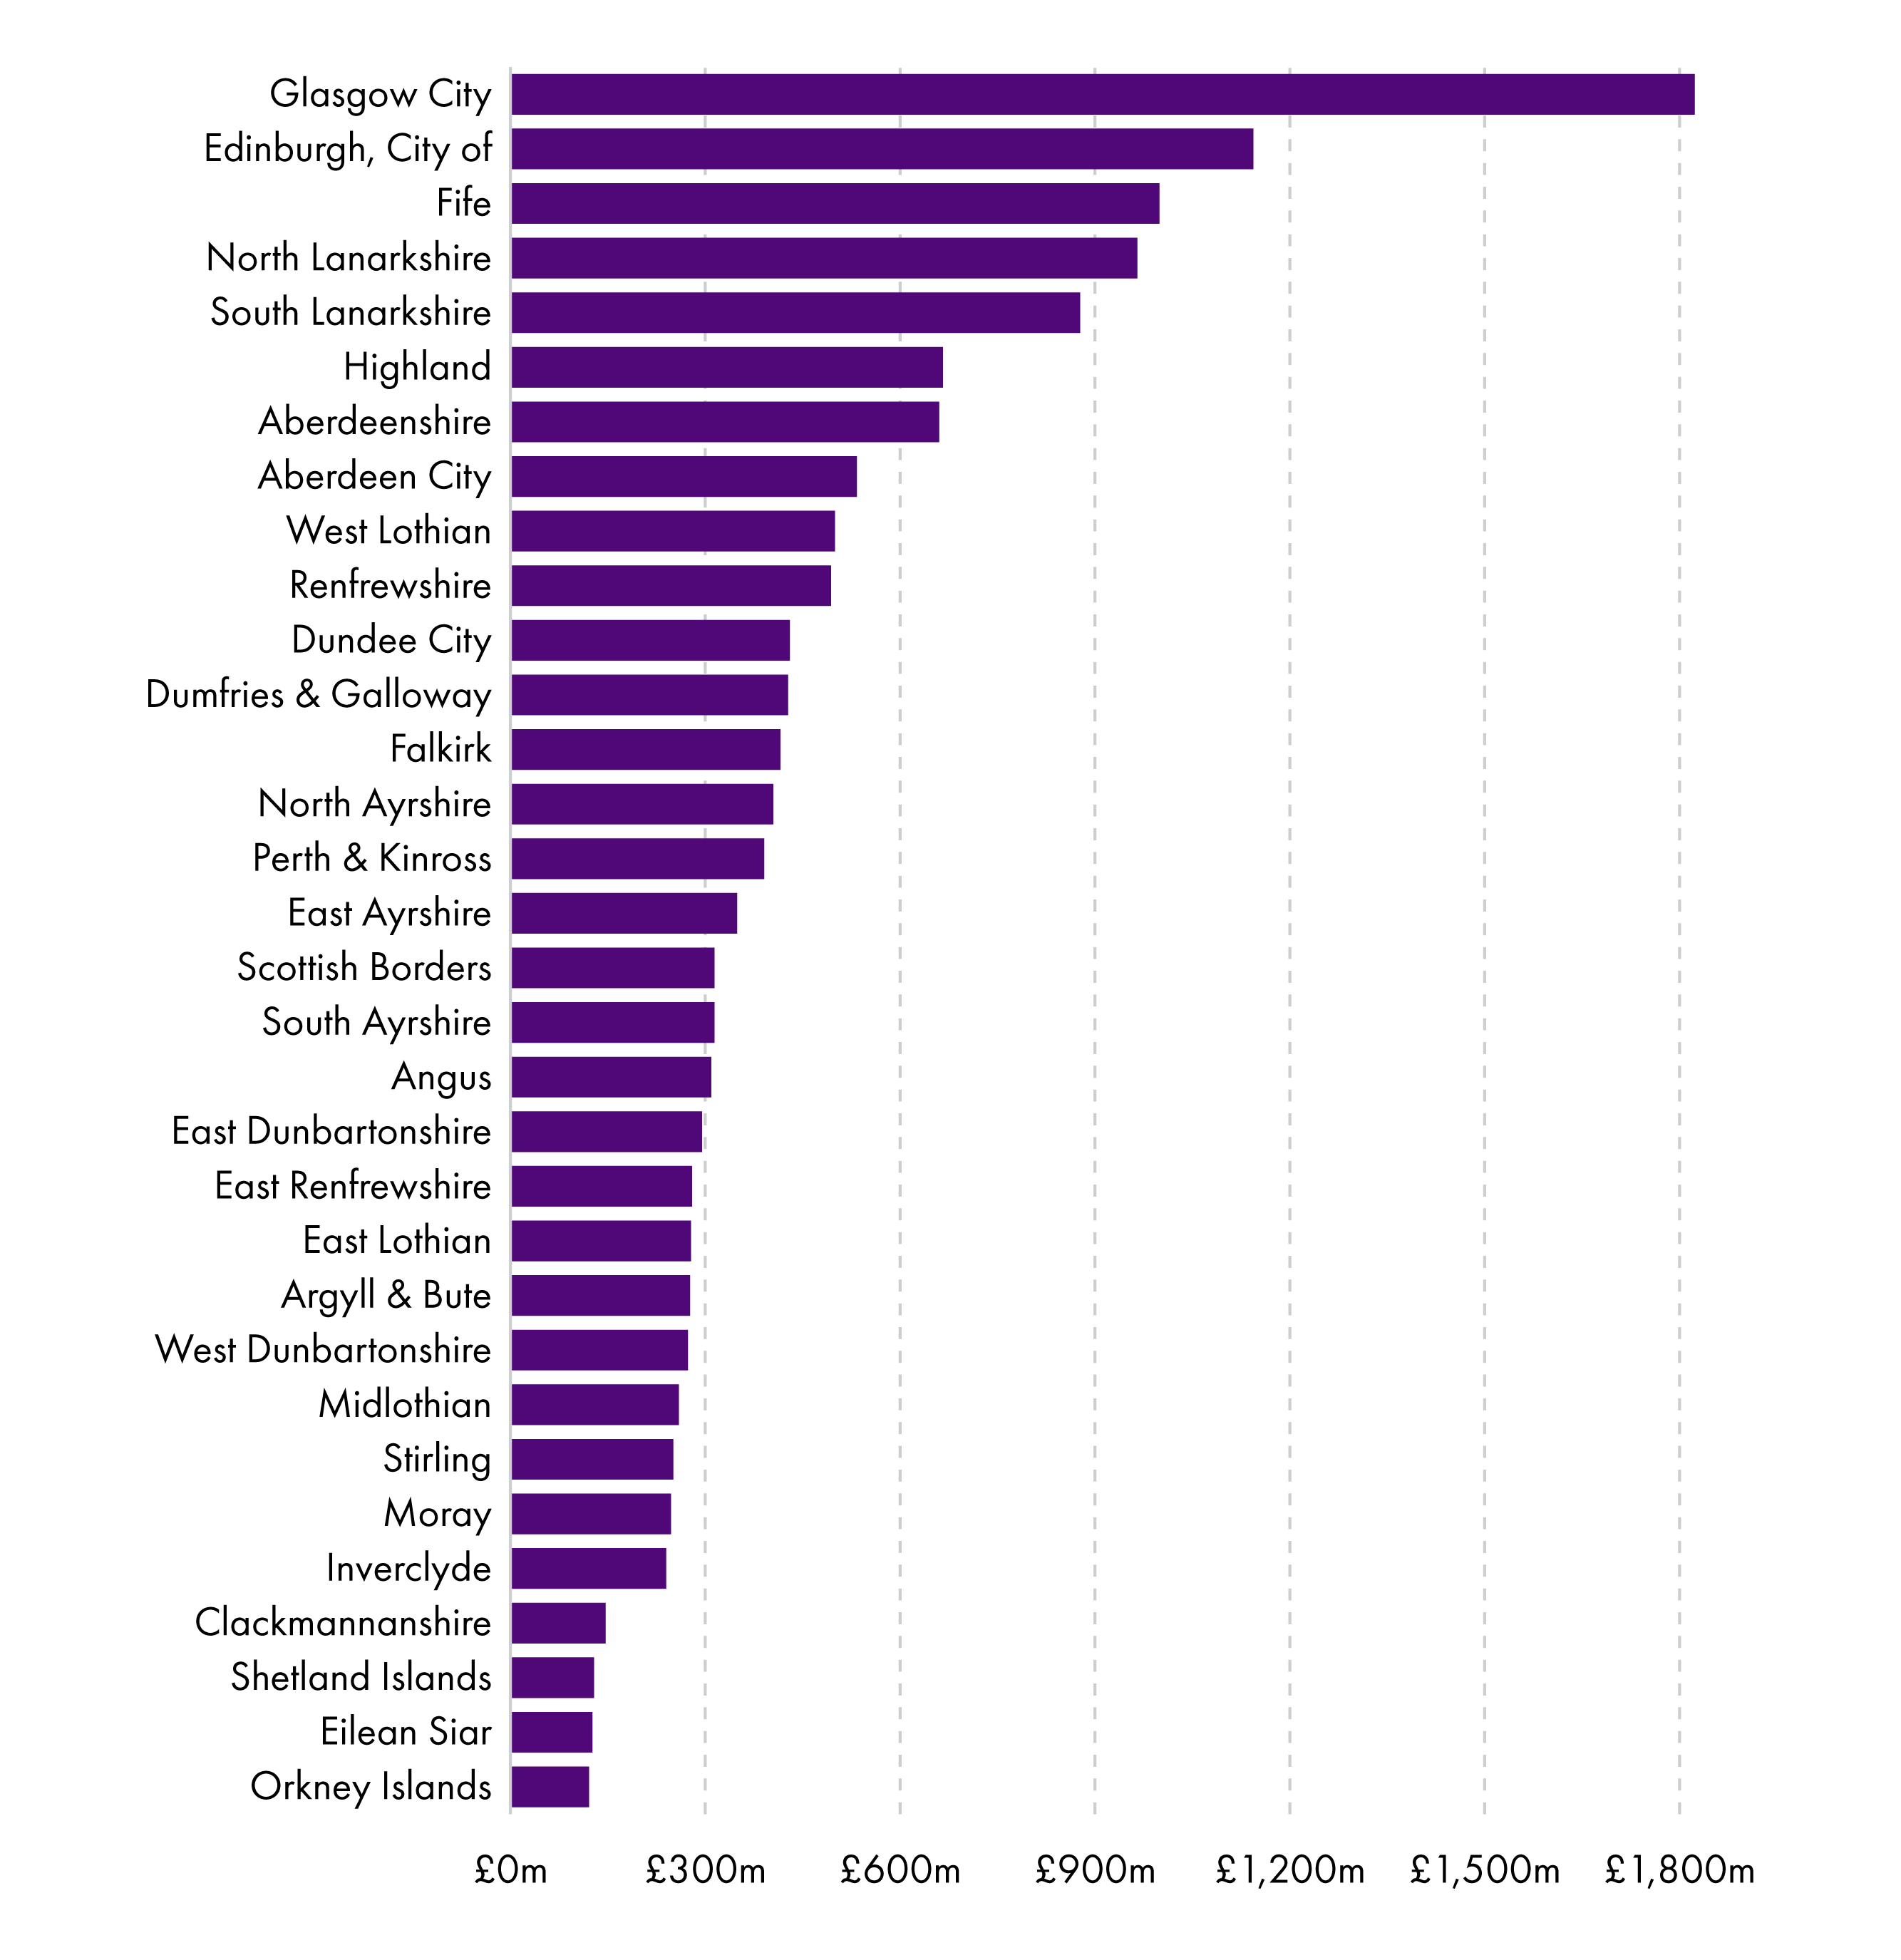
Chart 10 (below) shows the change in local authority revenue allocations between 2013-14 and 2026-27, presented in real terms, with sizeable increases seen in Orkney, the Lothians and some other eastern mainland areas. At the other end of the chart, we can see real term reductions in the revenue allocations of Argyll and Bute and Eilean Siar. The latter sees the largest reduction over the period, and it is no coincidence that this council area also saw considerable depopulation over the period (a reduction in population of 6% between 2013 and 2025).
Chart 10: changes in total revenue settlement from Scottish Government by local authority, 2013-14 to 2026-27, £m (2026-27 prices)
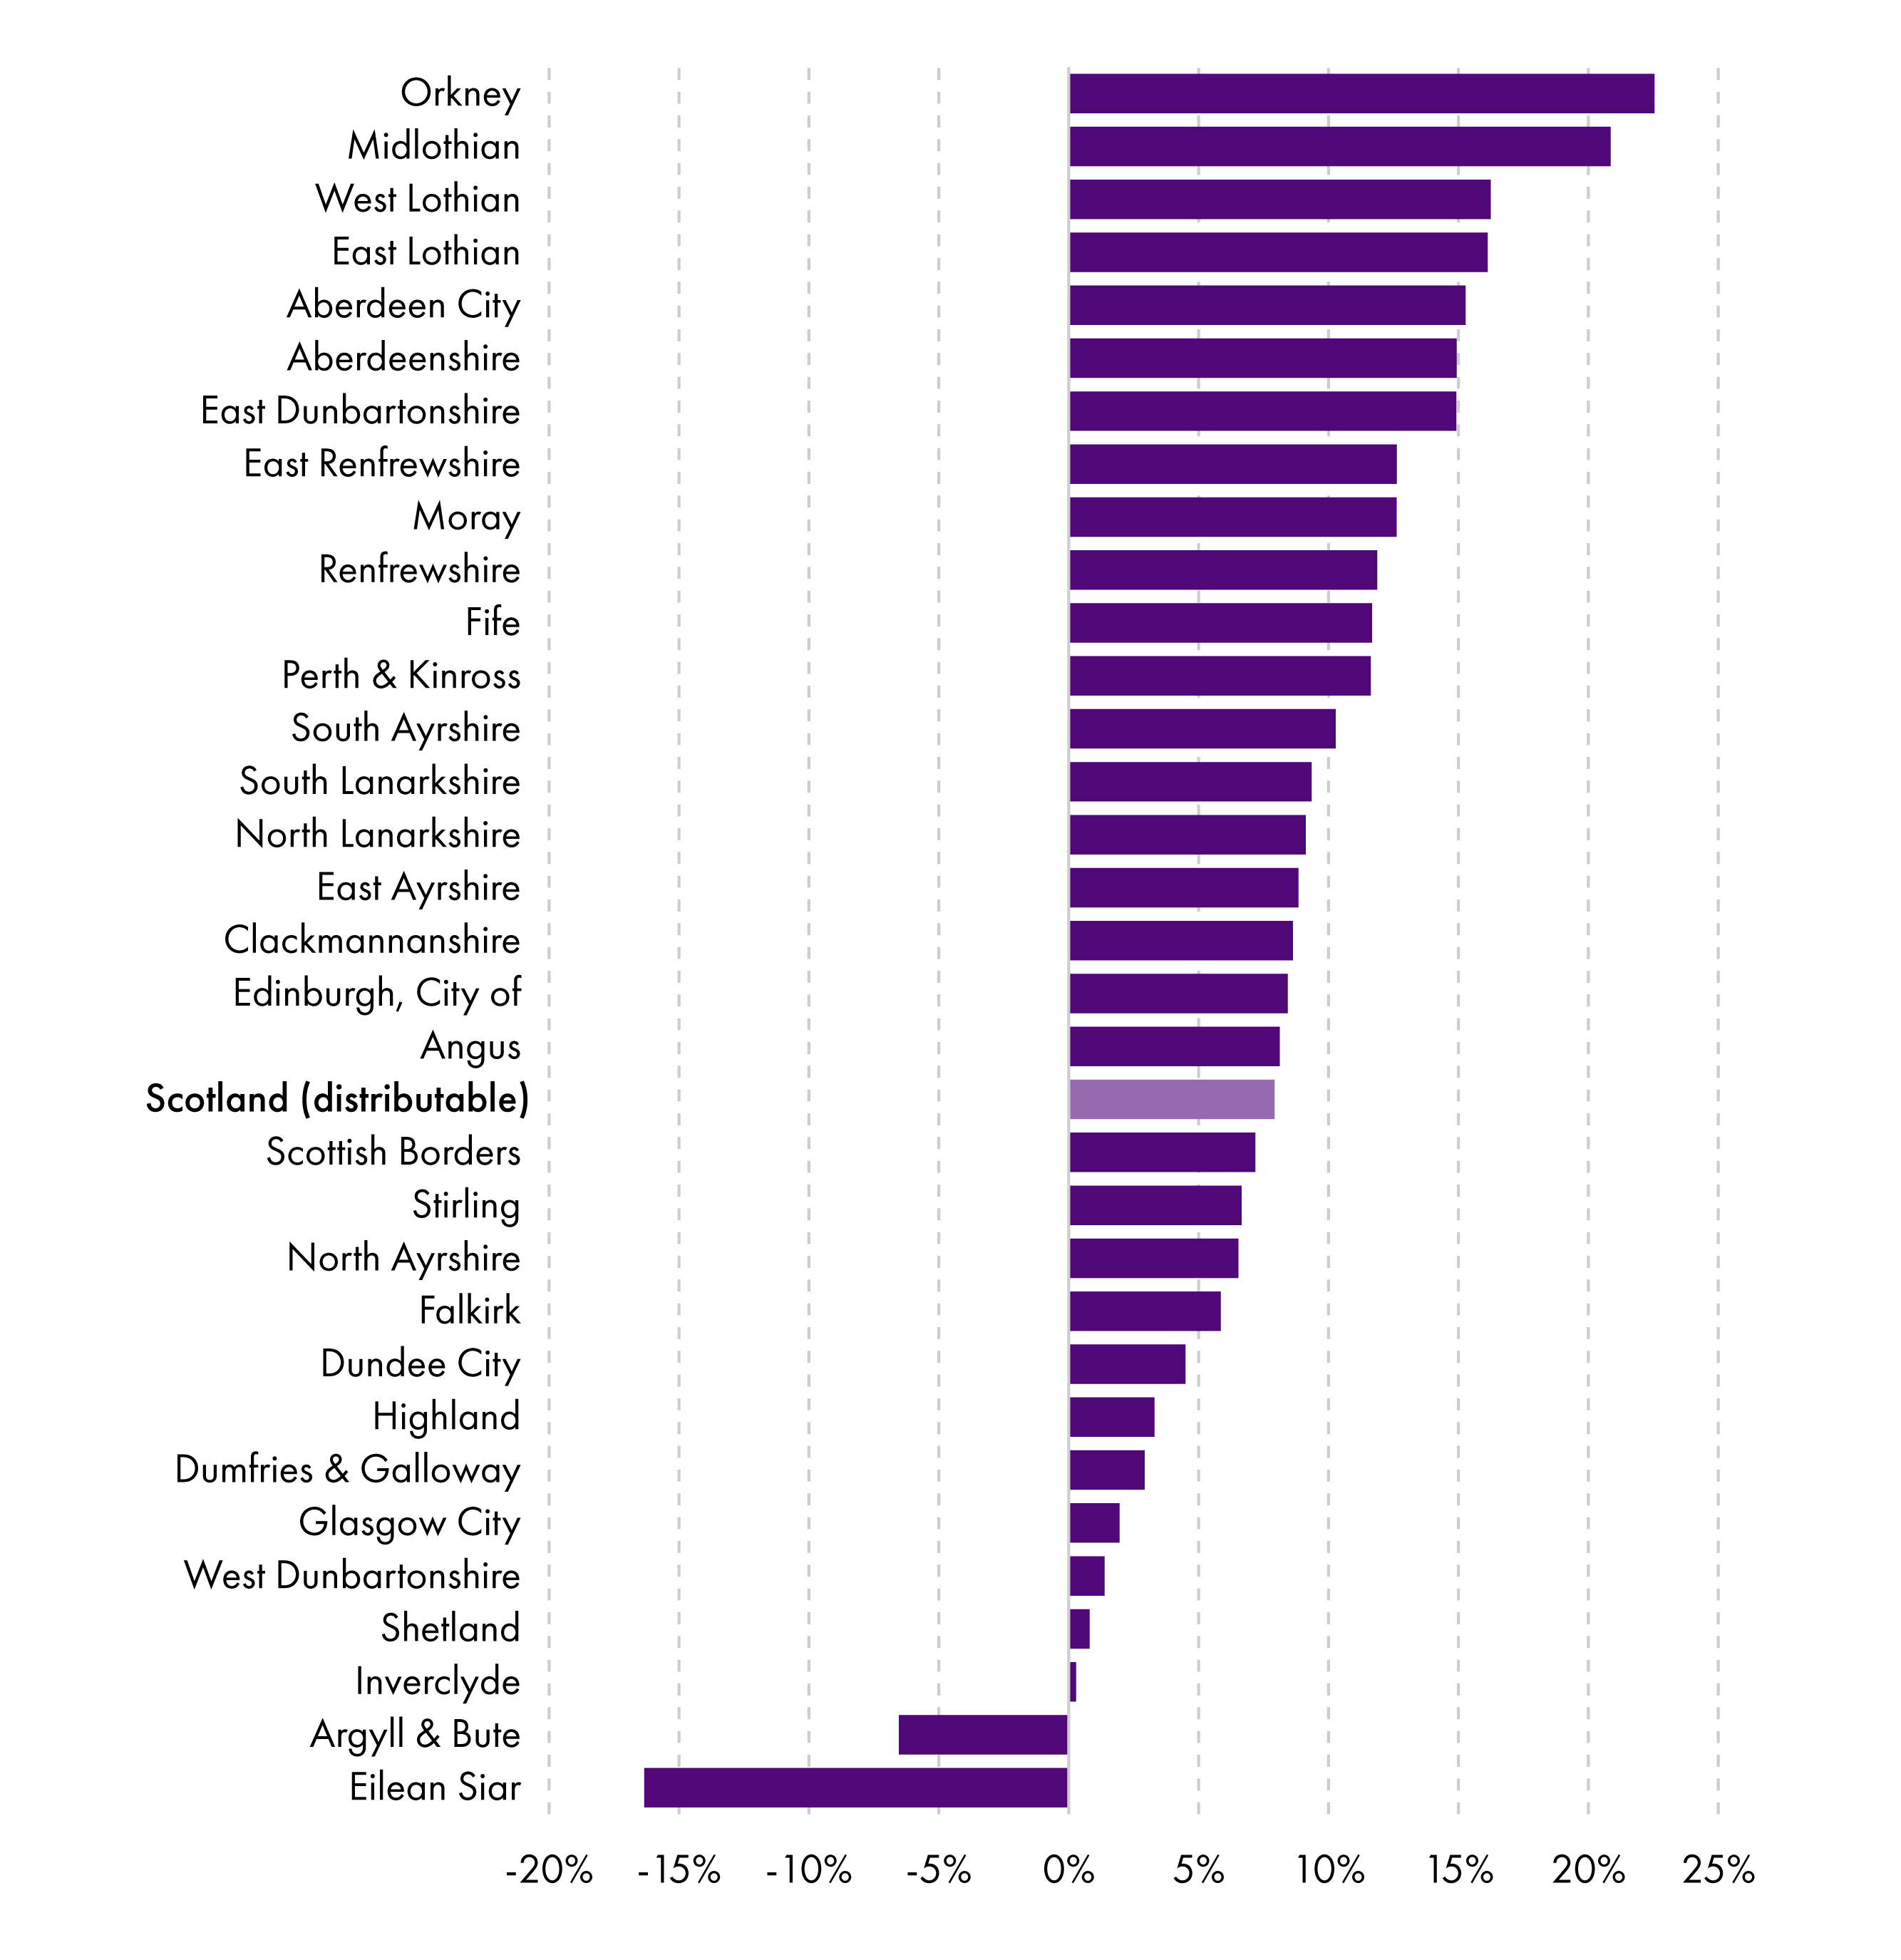
Scottish Government Finance Circulars and SPICe real terms calculations
Budget gaps in 2025-26 and 2026-27
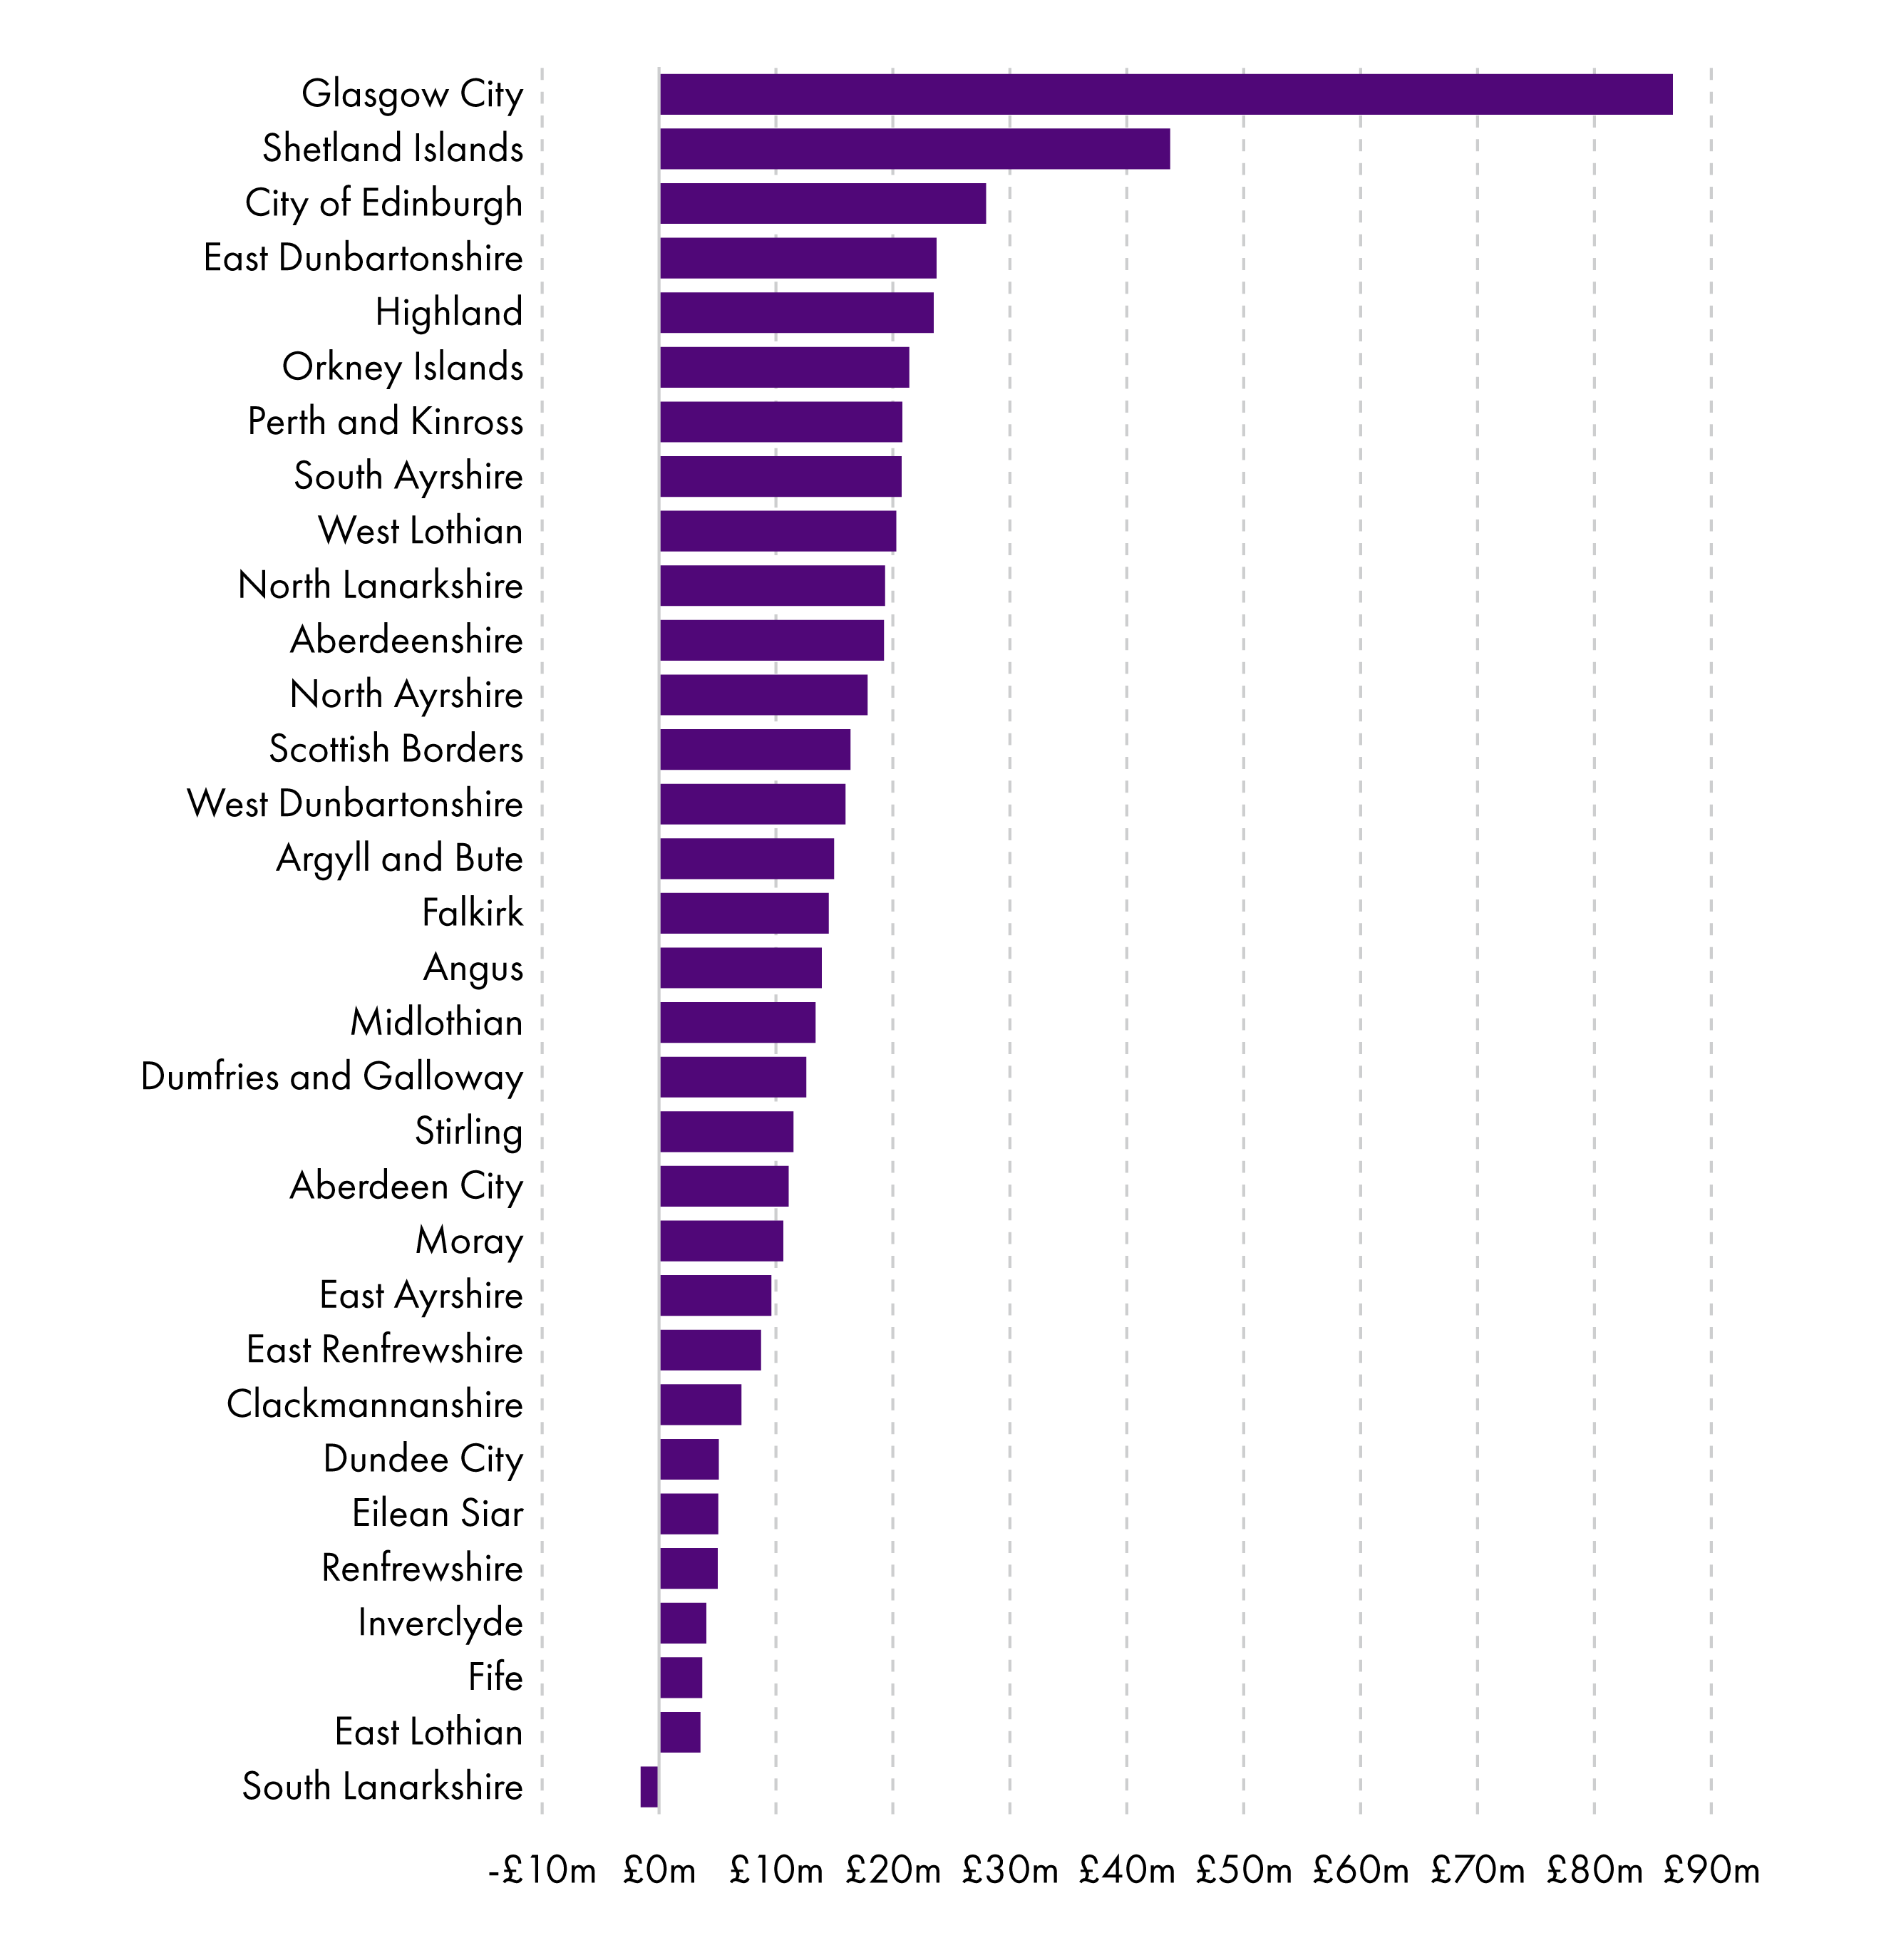
The Accounts Commission published a report in June 2026 summarising budget decisions made by Scotland's 32 councils, with information gathered by council auditors over the previous months1. One of its main findings was that in 2026-27 councils faced a gap of around £529 million between their anticipated expenditure and the income they expected to receive. At council meetings across the country, various options were discussed as to how these budget gaps should be addressed. It should be noted that all 32 councils agreed balanced budgets in 2026-27.
The range of budget gaps across the 32 councils is quite striking, from no budget gap in South Lanarkshire to a gap of £87 million in Glasgow. The following chart shows all council budget gaps in 2026-27, with data provided by the Accounts Commission:
Across Scotland, councils identified a combined budget gap of £529 million. This, according to the Accounts Commission, represents a gap of around 3% of councils’ total combined General Fund revenue budgets for 2026-27. The following shows this measure by each local authority:
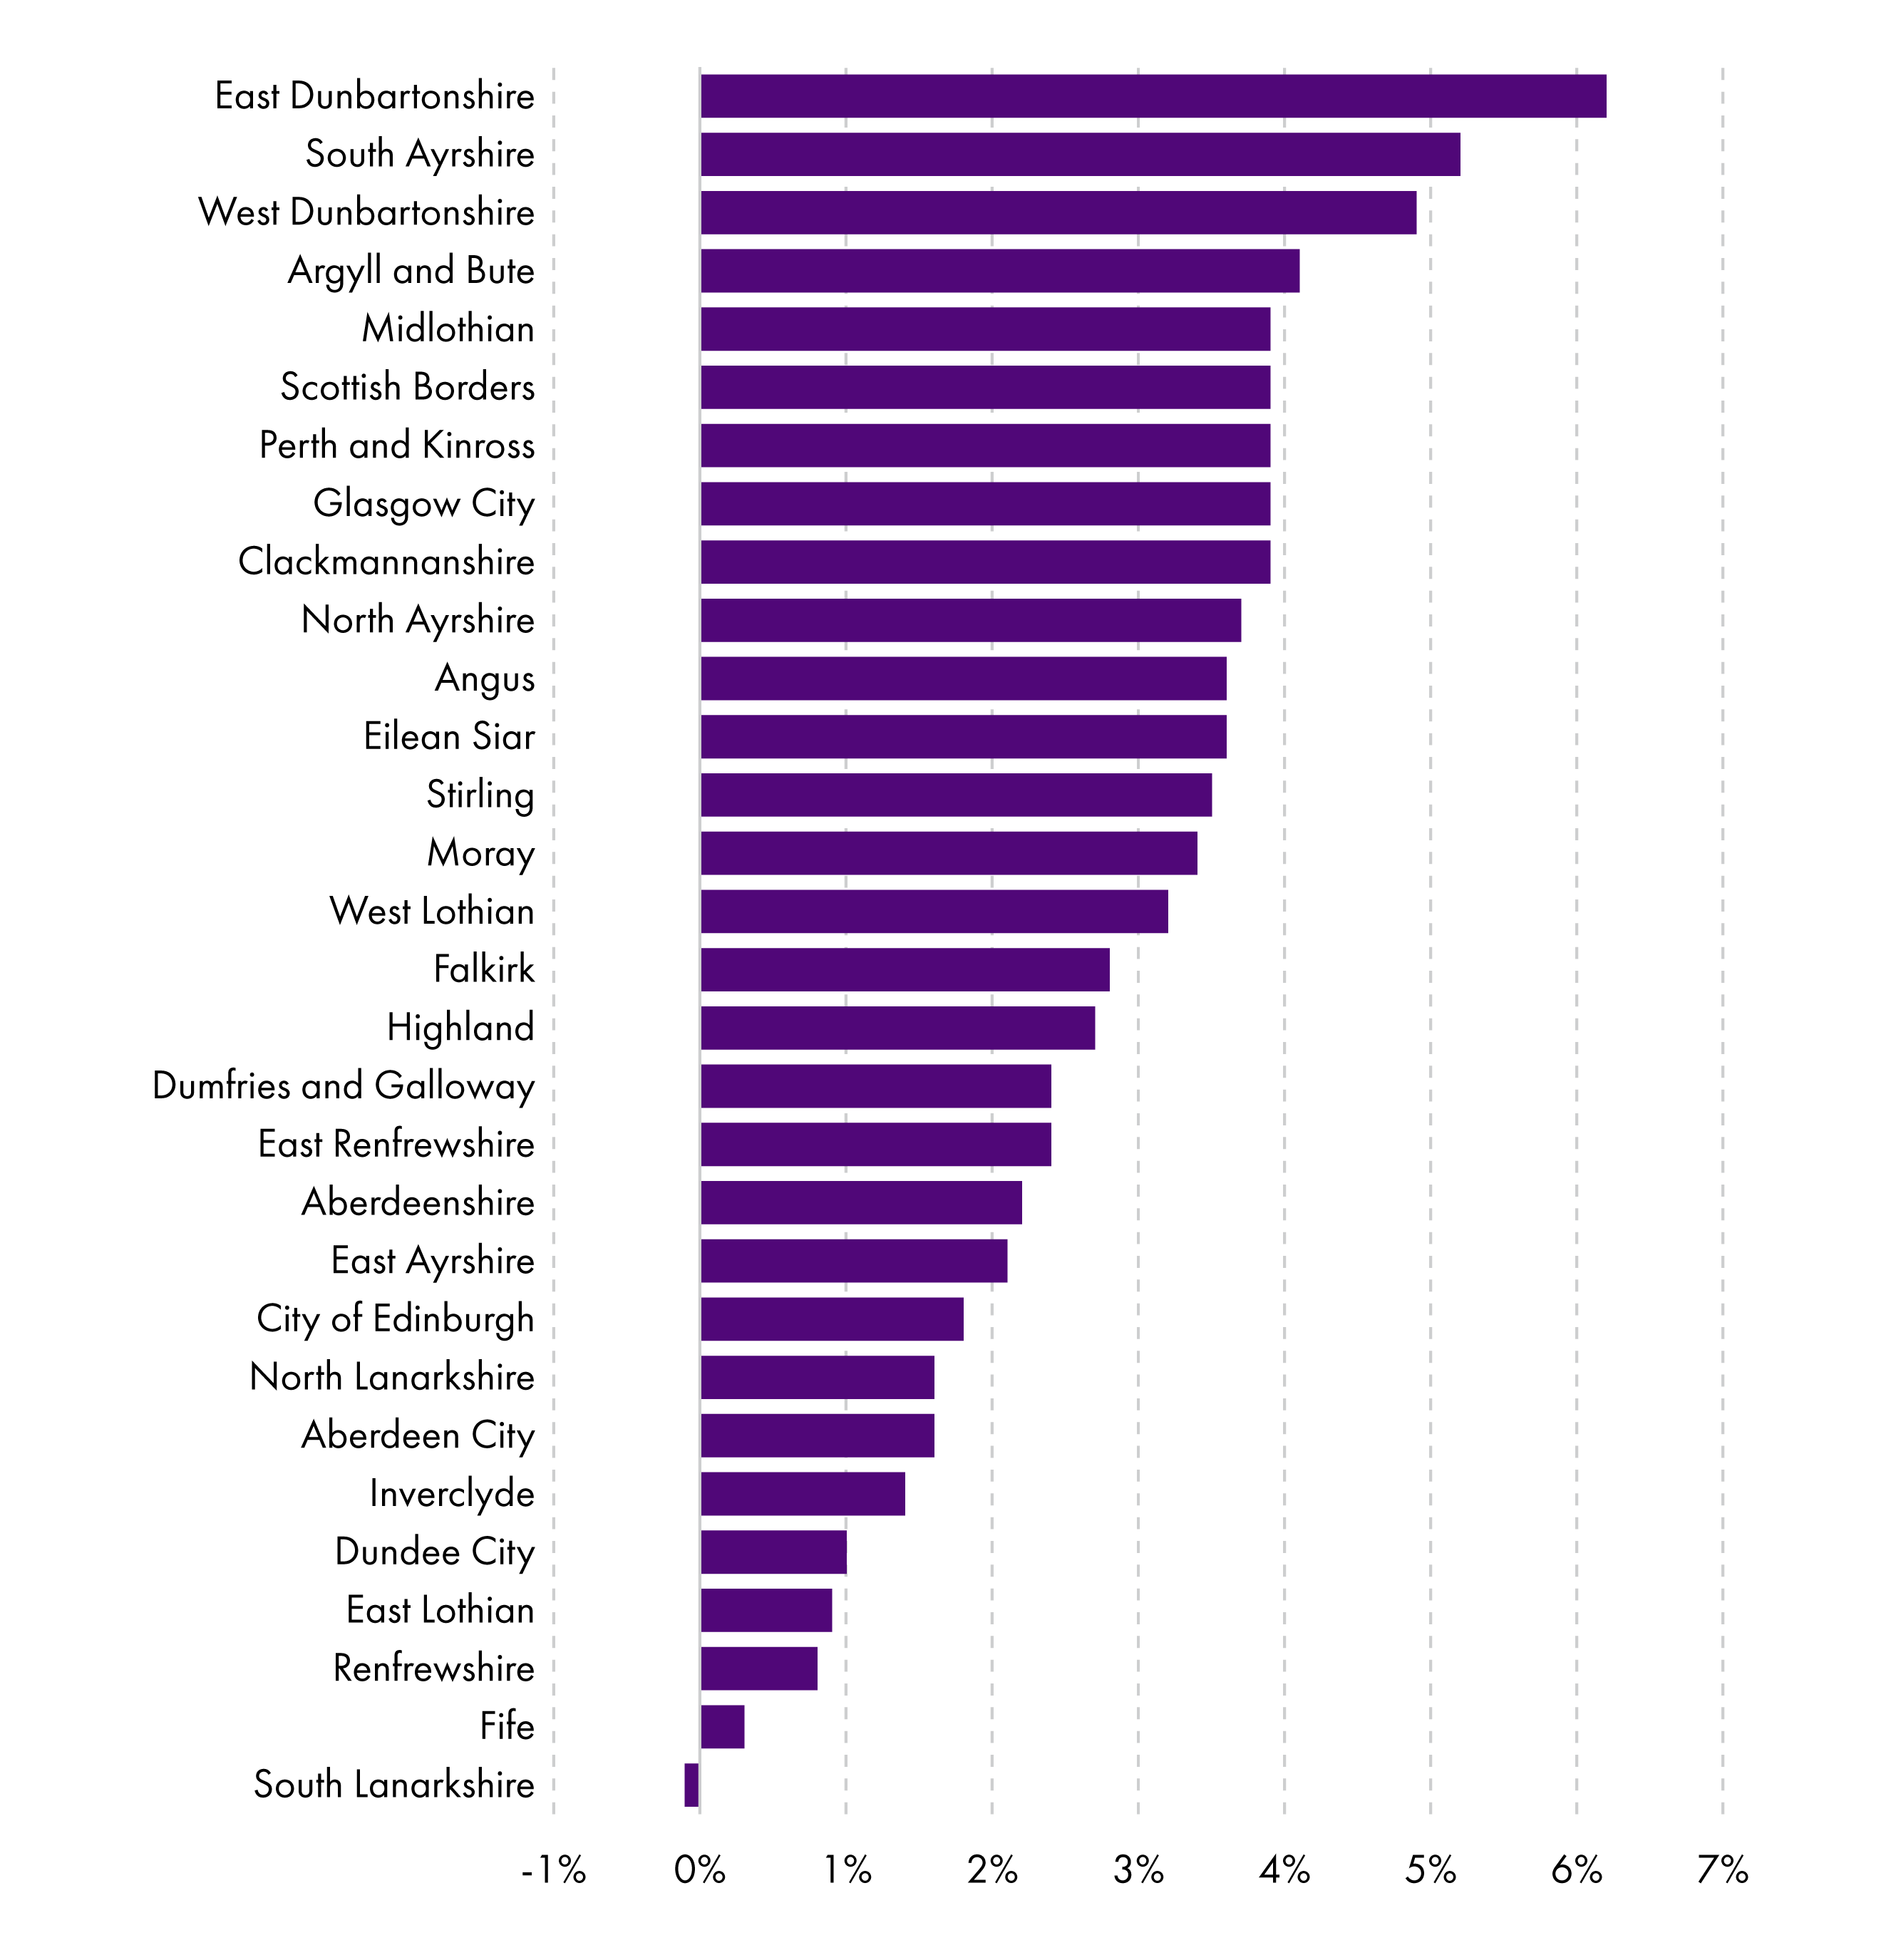
East Dunbartonshire is the council with the largest budget gap as a percentage of General Fund revenue budget. The Accounts Commission note: "Shetland and Orkney hold significant reserves related to oil and gas harbour activity and are outliers due to their use of these reserves". As such, they are not included in the chart above.
Council tax income
Council tax was introduced across the UK in 1993 as a local property tax, and most households have to pay it. Until the passing of legislation for the visitor levy in 2024, council tax was Scotland's only locally set tax, and even then there are some restrictions imposed by national government on what councils can and cannot do. For example, the ratios between the eight Council Tax bands are defined by national legislation. Moreover, the Scottish Government may try to cap or freeze council tax increases (as it has done for 11 of the past 19 years). Despite these limits and interventions, council tax is "local" in the sense that Band D rates are agreed each year by local councils, and the tax is then collected by local authorities, retained by them and spent on local authority services.
The Scottish Government's Provisional Outturn and Budget Estimates (POBE) publication shows that in 2026-27 the tax will likely bring in £3.5 billion for Scotland's councils, an estimated 19% of total local government general funding1.
| Component | 2026-27 (estimate) (£m) | % of total General Fund |
| General Revenue Grant (GRG) | 11,226 | 61% |
| Non-domestic rates (NDR) Distributable Amount | 3,474 | 19% |
| Council Tax | 3,547 | 19% |
| General revenue funding | 18,305 | 100% |
Despite council tax freezes being in place for many of the last 14 years, revenue from the tax has actually grown quite significantly in real terms, from £2.9 billion in 2013-14 to £3.5 billion in 2026-27. This will reflect new residential properties becoming liable for council tax, above inflation increases by councils in non-freeze years, as well as national changes to the higher band multipliers in 2017.
Table 2 (below) shows that while council tax income increased by 24%, General Revenue Grant income increased by 8% in real terms and there was a 1% decrease in NDR income over the period.
| Component | 2013-14 | 2026-27 (estimate) | Change (£m) | Change (%) |
| General Revenue Grant (GRG) | 10,418 | 11,226 | +808 | +8% |
| NDR Distributable Amount | 3,511 | 3,474 | -37 | -1% |
| Council Tax | 2,856 | 3,547 | +691 | +24% |
Income from council tax has increased (in real terms) for every local authority between 2013-14 and 2026-27. Chart 13 shows that there has been a big variation in the size of increases across the country, with East Lothian and Midlothian seeing the most significant increases in percentage terms. Scotland's two largest cities have seen the largest increases in monetary terms, with Edinburgh City Council receiving £84 million more council tax revenue in 2026-27 than it did in 2013-14 (in real terms).
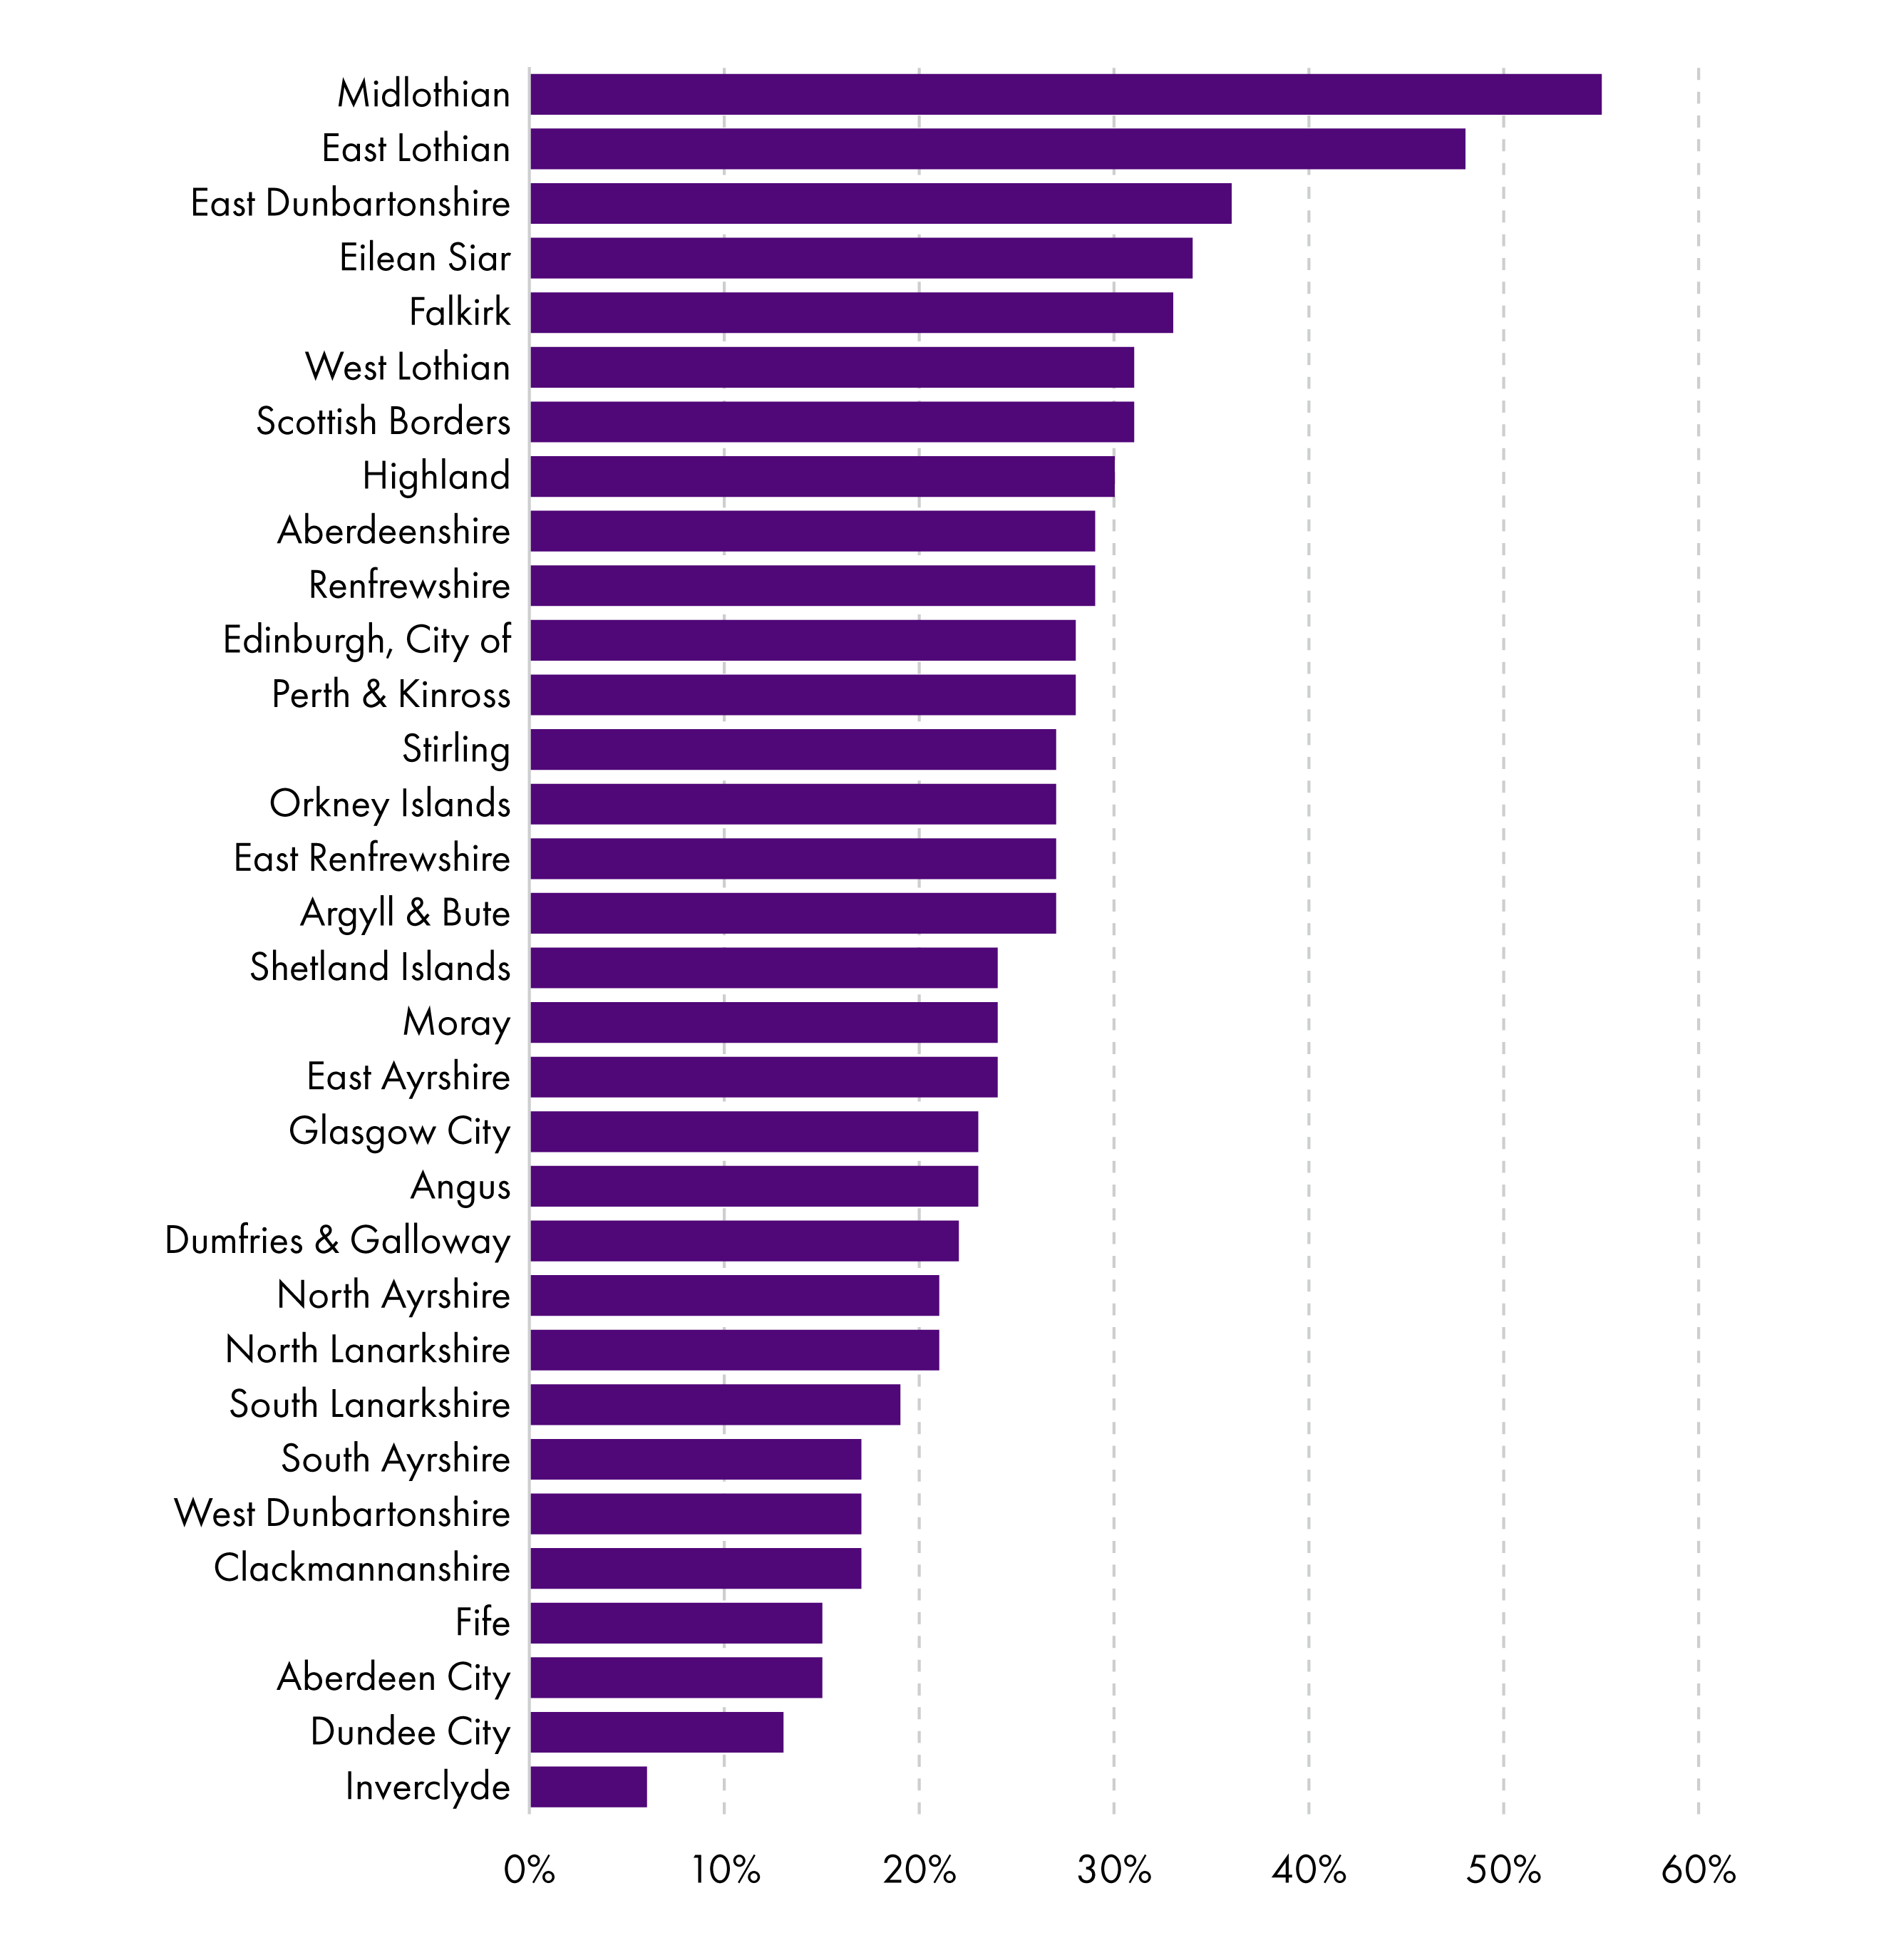
After the announcement of provisional allocations from the Scottish Government in January, councillors across Scotland met to debate and agree increases to council tax locally. This year, the average increase across Scotland amounted to 7.7%, ranging from a 4% increase in Edinburgh to 10% increases in Aberdeenshire and Moray.
Over recent years, councils have been given considerable powers over how they charge for council tax on empty or second homes. These are set out in a recent SPICe blog post.
Non-domestic rates (NDR) income
Collected by councils, Non-Domestic Rates (NDR) income is pooled nationally and notionally redistributed among Scottish local authorities as part of the overall local government settlement. The Scottish Government guarantees the combined General Resource Grant (GRG) and distributable NDR income figure to each local authority. If NDR income is lower than forecasted then GRG is increased accordingly, and vice versa.
Non-Domestic Rates are often referred to as "business rates". However, it's not just businesses that pay them. Public buildings, such as schools and council offices may also be liable. There are various non-domestic rates reliefs available, and eligible ratepayers can apply for these through their local council.
Since 1989 councils have had no role in the setting of non-domestic rates. Instead, "rate poundage" is decided by the Scottish Government each year and approved by the Scottish Parliament as part of the Scottish budget process. It is therefore difficult to argue that NDR is a truly local tax.
The amount to be paid by property occupants is determined by the national rate poundage, the rateable value of the property and any relevant reliefs. The rateable value broadly corresponds to the "notional rental value the property could achieve in the open market, if it were vacant and available to let, taking account of the type and nature of the property"1. Values are determined by independent assessors.
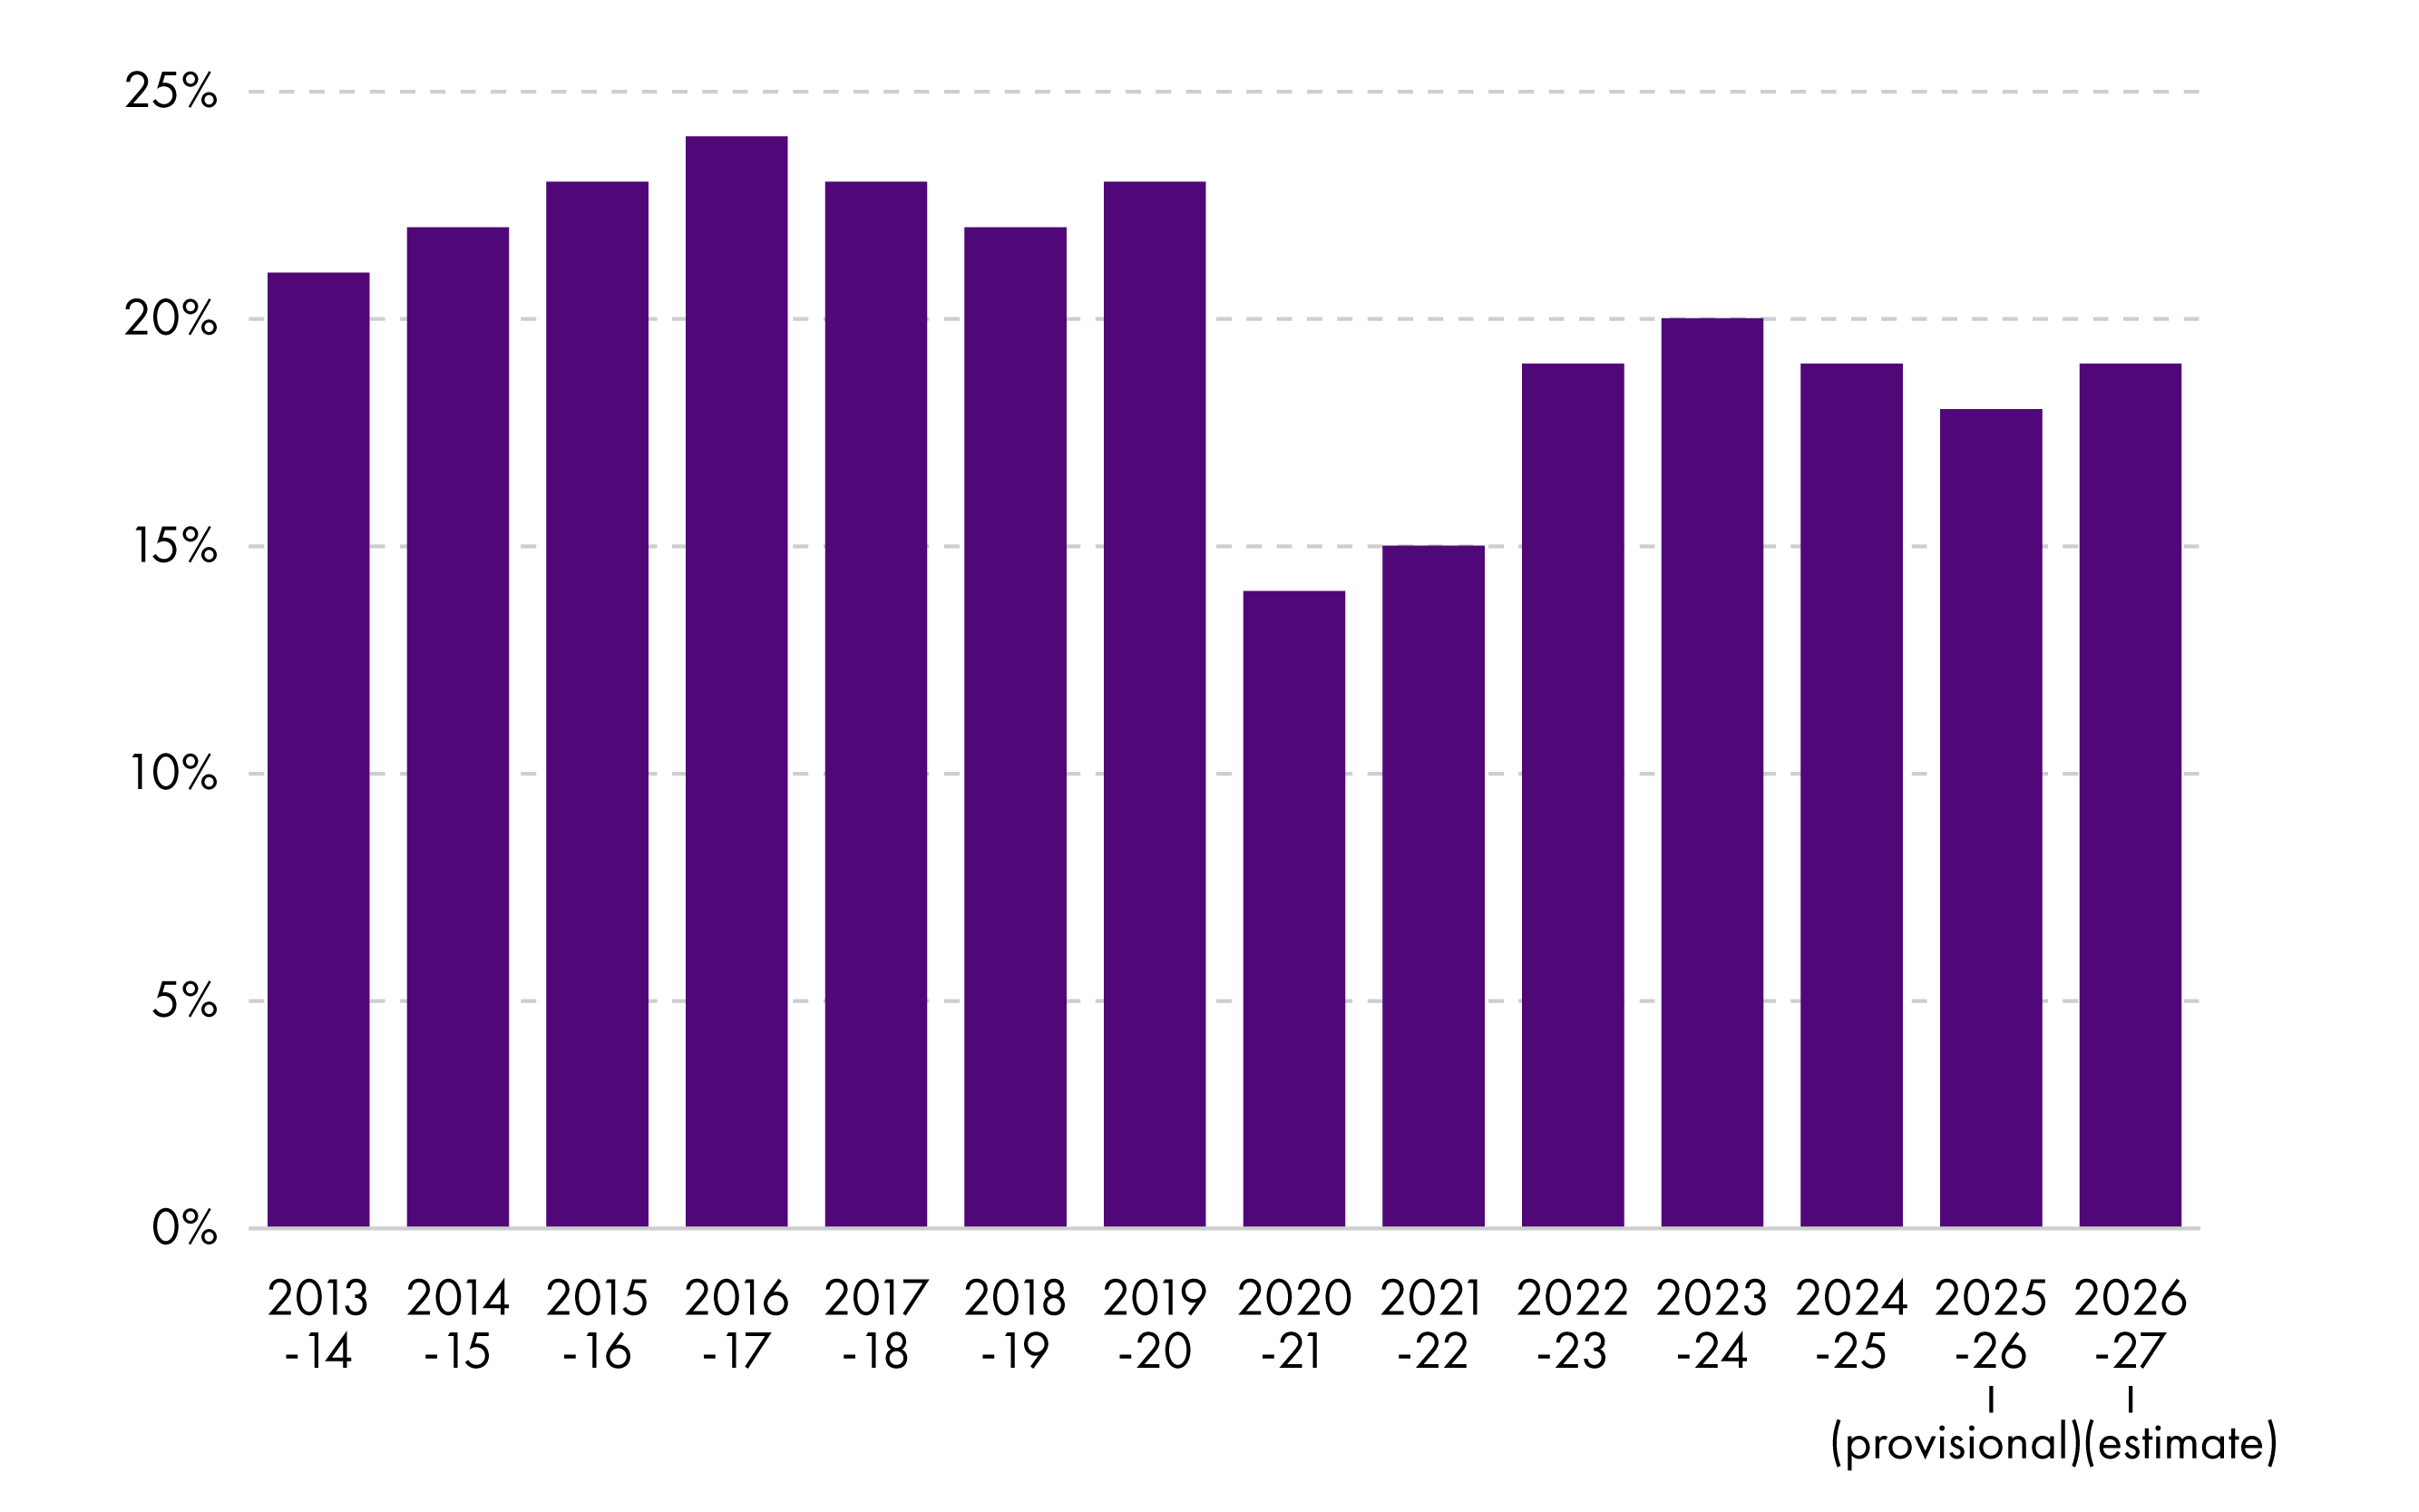
It is estimated that Scotland's local authorities will raise £3.5 billion in NDR income in 2026-272. This amounts to 19% of local government's total general revenue funding (GRG+NDR+CT income). Chart 14 shows how this has changed over the past 14 years, with NDR income as a proportion of total general funding smaller now (19%) than it was in 2013-14 (21%):
Like council tax revenues, NDR income varies across the 32 local authorities. Unsurprisingly, Scotland's two largest cities will see the highest levels of NDR income in 2026-27 in monetary terms. Those local authorities seeing the smallest NDR revenues are Eilean Siar and Orkney Islands. Low levels of NDR income and expected council tax income are compensated for by a larger than average General Resource Grant allocation (as a % of total general income) in order to ensure all councils receive their formula share.
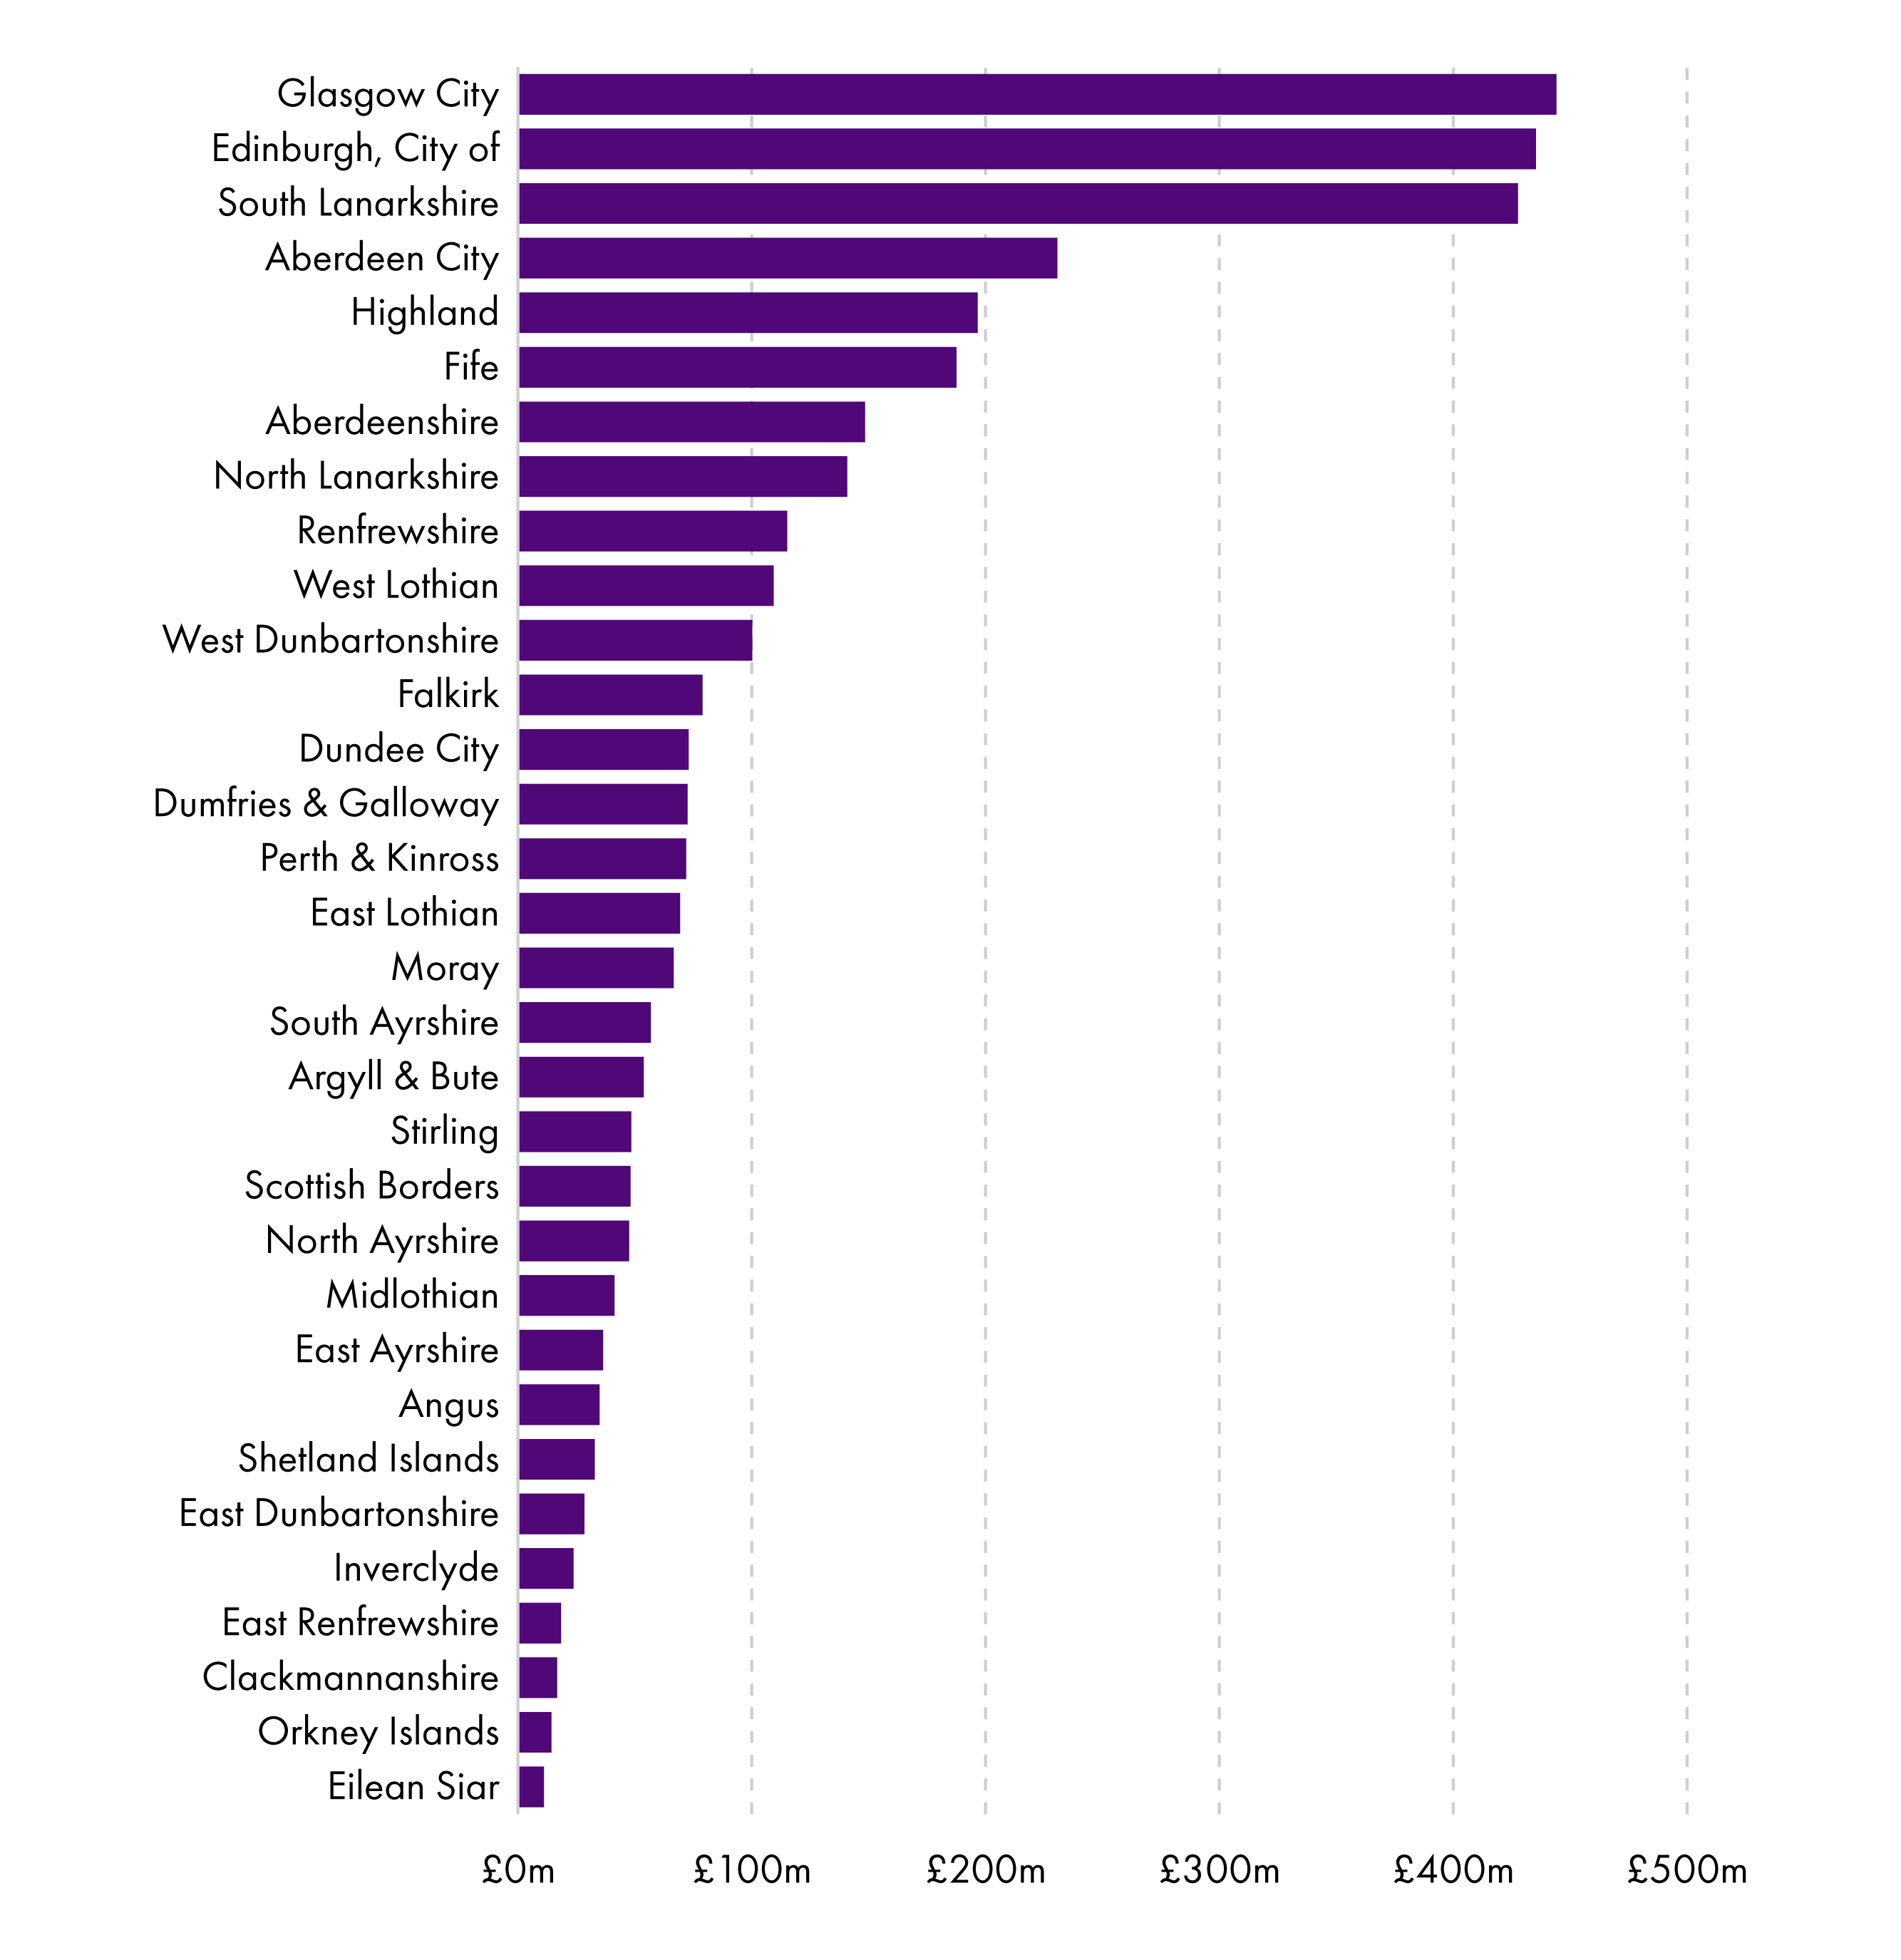
Presenting NDR income figures as per head calculations reveals some interesting results. Figure 15 shows that the local authorities with the highest NDR income per head of population are Shetland Islands and South Lanarkshire. The two local authorities with the lowest levels are East Renfrewshire and East Dunbartonshire:
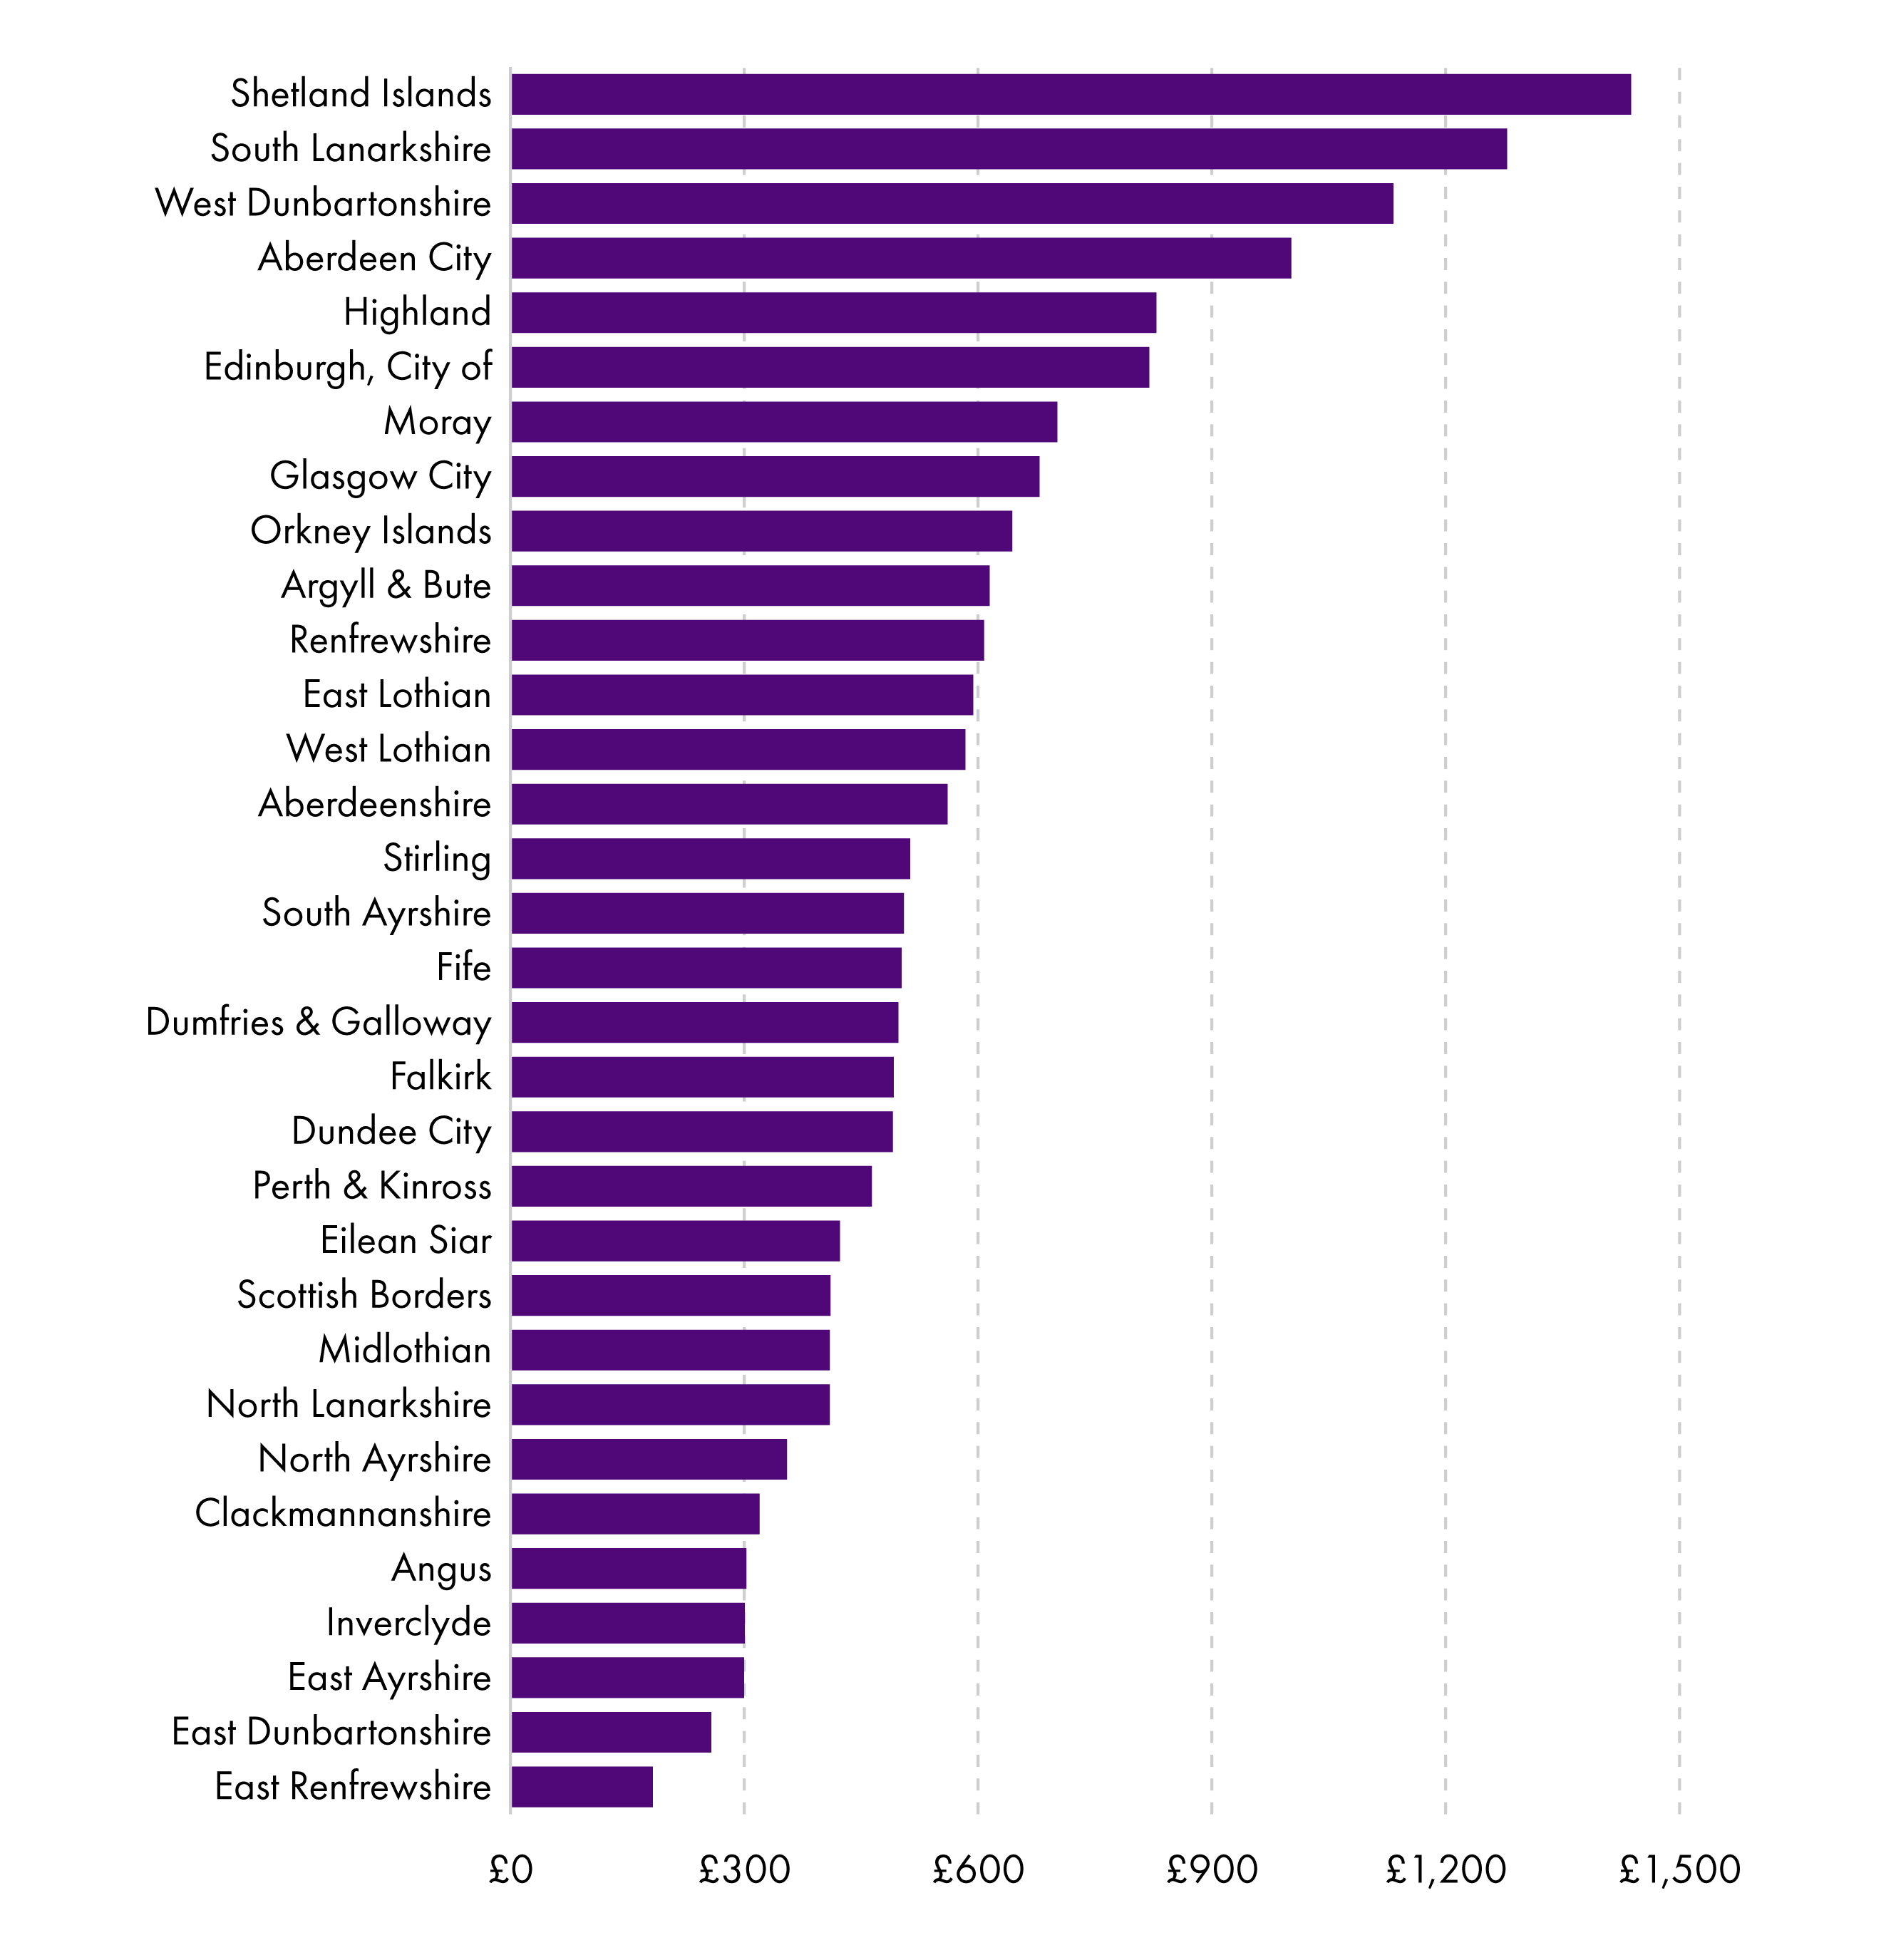
One of the reasons South Lanarkshire's NDR income is so high is because the authority is the designated assessor for renewable electricity generation. This means that many of the large renewable generators across the country have generation and transmission assets/properties valued by South Lanarkshire and their liability therefore sits with South Lanarkshire (even though the assets may not be in South Lanarkshire).
The 2026 NDR revaluation and Government statement
There has been particular interest in NDR this year as Scotland, like England and Wales, underwent a revaluation of rateable values. In January 2026, the Scottish Parliament held a debate on NDR and the impact of increased bills on businesses across Scotland. This came after draft valuation notices were sent to properties at the end of November 2025 showing proposed changes to their rateable values from 1 April 2026.
The Scottish Government published statistics showing the differences between the previous rateable values (from the 2023 revaluation) and the rateable values from the 2026 Revaluation. Over 140,000 properties were expected to see an increase in RV compared to the current values, with an average increase of £6,800.
Hotels, self-catering properties and leisure and entertainment premises were expected to see some of the highest percentage increases in RV when comparing 2023 cycle valuations and 2026 valuations. The statistical summary found:
The overall rateable value of accommodation properties increased by 29%, with a corresponding increase in the gross bills after revaluation transitional relief of 15%. Around 23,000 properties saw an increase in rateable value, on average by £5,300, while for 2,700 accommodation properties the rateable value decreased by an average of £3,300.
It is worth noting that even after the 2026 revaluation, anticipated 2026-27 NDR income across the country is still lower than what it was pre-COVID (as illustrated in Chart 14).
Announcement of reliefs in the 2026-27 Budget
As well as reducing the poundage rates (the multipliers) and continuing the Small Business Bonus Scheme (which is based on rateable value, not profitability), the Scottish Budget 2026-27 includes a new 15% NDR relief for retail, hospitality and leisure (RHL) premises liable for either the Basic or Intermediate Property Rates. The Scottish Government estimated that this could help up to 37,000 properties (subject to the cap of £110,000 per ratepayer). The Budget also extended and expanded the 100% relief for three more years for RHL properties on islands and some remote areas (capped at £110,000 per business per year).
The Scottish Government also announced a new Revaluation Transitional Relief (RTR) for those businesses seeing significant increases to their rateable values in April 2026. With this, the Government is capping increases in gross bills up to 2029.
The Budget also included details of a new Small Business Transitional Relief aimed at ratepayers losing eligibility for Small Business Bonus Scheme relief. This scheme aims to ensure they do so “in a phased manner”. Eligible ratepayers will pay 25% of any increase to their net bill in the first year (2026-27), 50% in the second year (2027-28) and 75% in the third year (2028-29).
On the 12th February 2026, the Cabinet Secretary for Finance and Local Government told the Chamber:
I committed to passing on to hospitality any additional consequential funding from the United Kingdom Government’s recent announcement on business rates for pubs and music venues in England. We consulted the business community prior to finalising our package, and I confirm that the Scottish Government will provide 25 per cent additional relief for the next three years for licensed hospitality and music venues that are on the basic or intermediate property rates, including pubs, restaurants, hotels, nightclubs and licensed clubs.
Along with the 15 per cent relief for the retail, hospitality and leisure sectors for properties on the basic or intermediate property rate, which was announced at the budget, total relief for eligible licensed hospitality premises and music venues will be 40 per cent for the next three years—capped at £110,000 per business per year.
This means that the following type of premises will be eligible for a 40% relief on their NDR Bills, if their RV is less than £100,000: hotel, hostel, live music venue, public house or night club and restaurant.
With regards to self-catering properties, the Cabinet Secretary also stated:
I have also listened to concerns that have been raised by those in the self-catering sector. I will introduce a specific revaluation transitional relief for that sector, which will cap increases in gross liabilities due to revaluation at 15 per cent year on year, up to the next revaluation.
A new, specific transitional relief was therefore added for eligible self-catering properties. This means that by 2028-29, no self-catering gross bill will be higher than +52% (the cumulative total) of its 2025-26 gross bill.
With the announcement from the new UK Prime Minister on 23 July 2026, that there would be an additional 20% relief for pubs, clubs and live music venues from 2027-28, pressure will be on the Scottish Government to introduce something similar in their forthcoming Budget.
Before the summer recess, the Scottish Government announced a comprehensive review of non-domestic rates. According to the Scottish Government: "this will examine improvements and reforms that can be made to the system, working closely with business to ensure the system provides the clarity, incentive, and transparency which businesses need".
The NDR relief system is complex. Published in 2017, the Barclay Review said that “due to this complexity, Transitional Relief schemes typically require a significant amount of rates knowledge to understand”. The Session 6 Local Government, Housing and Planning Committee heard from business representatives that some small businesses struggle to navigate the reliefs landscape.
Local government expenditure - what do councils spend their money on?
So far, this briefing has focussed on how local government is funded , how this varies across the country and how it has changed over the past 14 years. We now look at what councils spend their money on.
Around 25% of all public sector spending in Scotland is spent by local authorities, second only to the NHS12.This is because local authorities in Scotland are responsible for delivering a large range of services; however, we will see that the majority of spend is used to fund just two (extremely important) service areas.
When it comes to measuring performance and outcomes, the Improvement Service collates and publishes the Local Government Benchmarking Framework with indicators selected by the sector itself to determine whether performance is improving or not across a large range of services3. The Accounts Commission also has an important role to play in assessing whether councils are achieving "best value" when it comes to spending public money. Therefore, politicians and their electorates have a wealth of information to help them assess whether local authorities are improving performance and reducing costs.
Expenditure by service
The Scottish Government publishes an extensive range of information on local authority expenditure (see 1 and 2). These sources provide an insight into the spending priorities of local government, and it is clear that school education and social work/social care are at the top of the list. Of the total net revenue expenditure of £15 billion in 2026-27, just under half (£8.5 billion) will be spent on education services and a further 33% will go to social work services (including social care). This means that around 80% of local government net revenue expenditure will go on funding these two service areas.
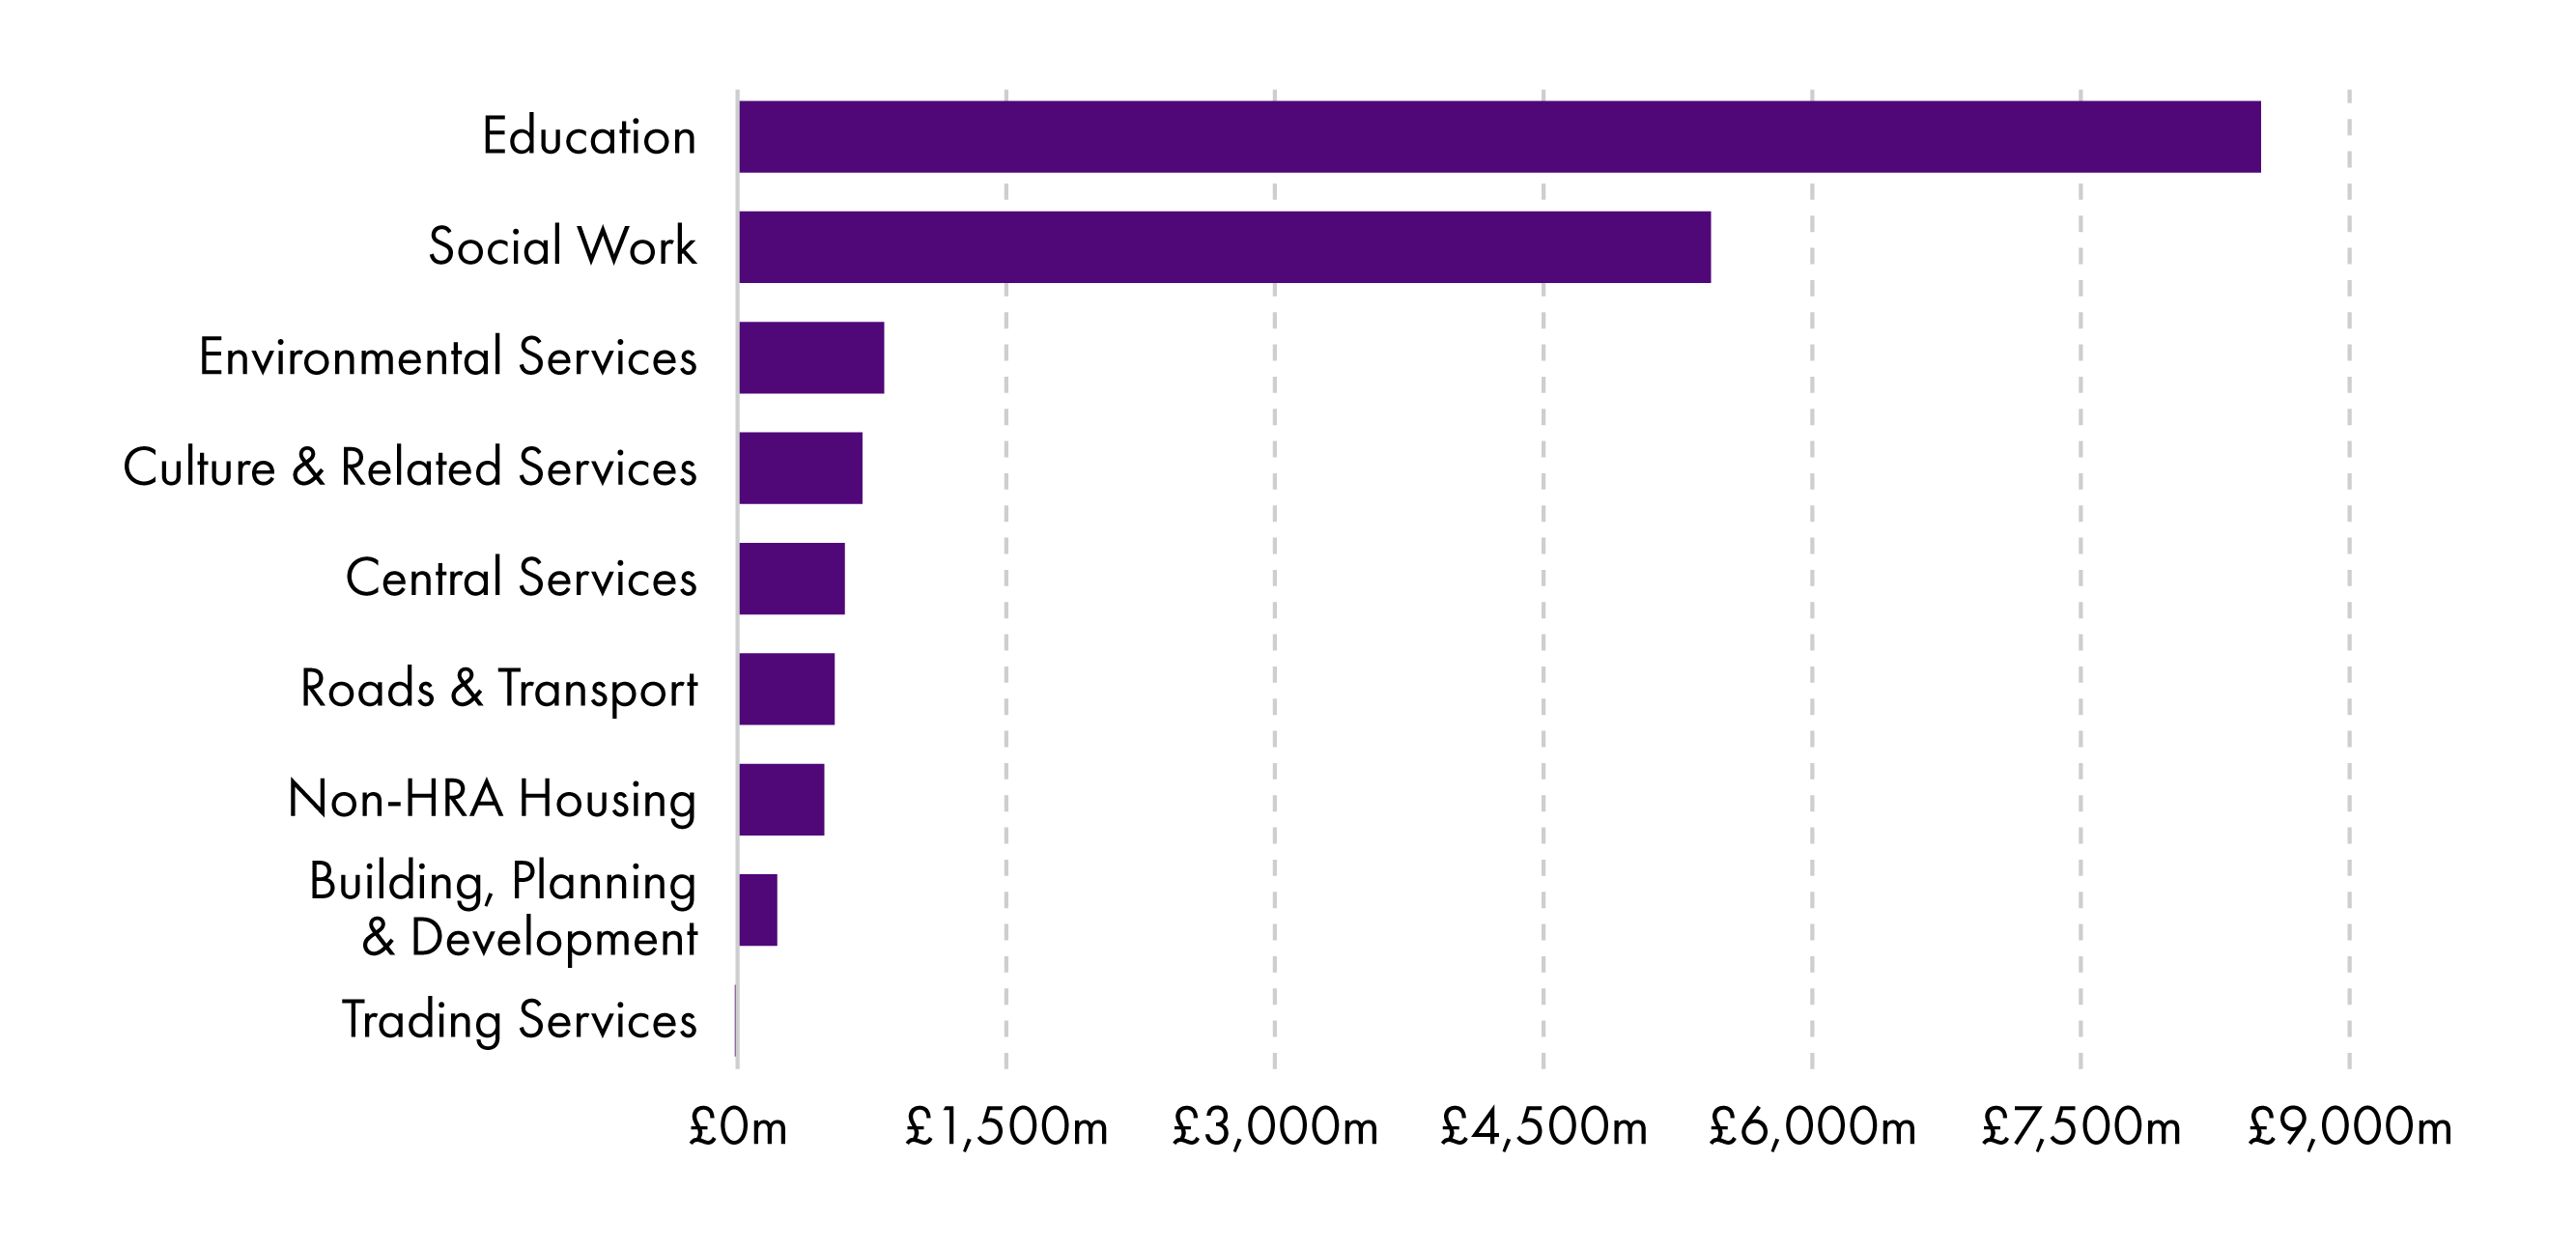
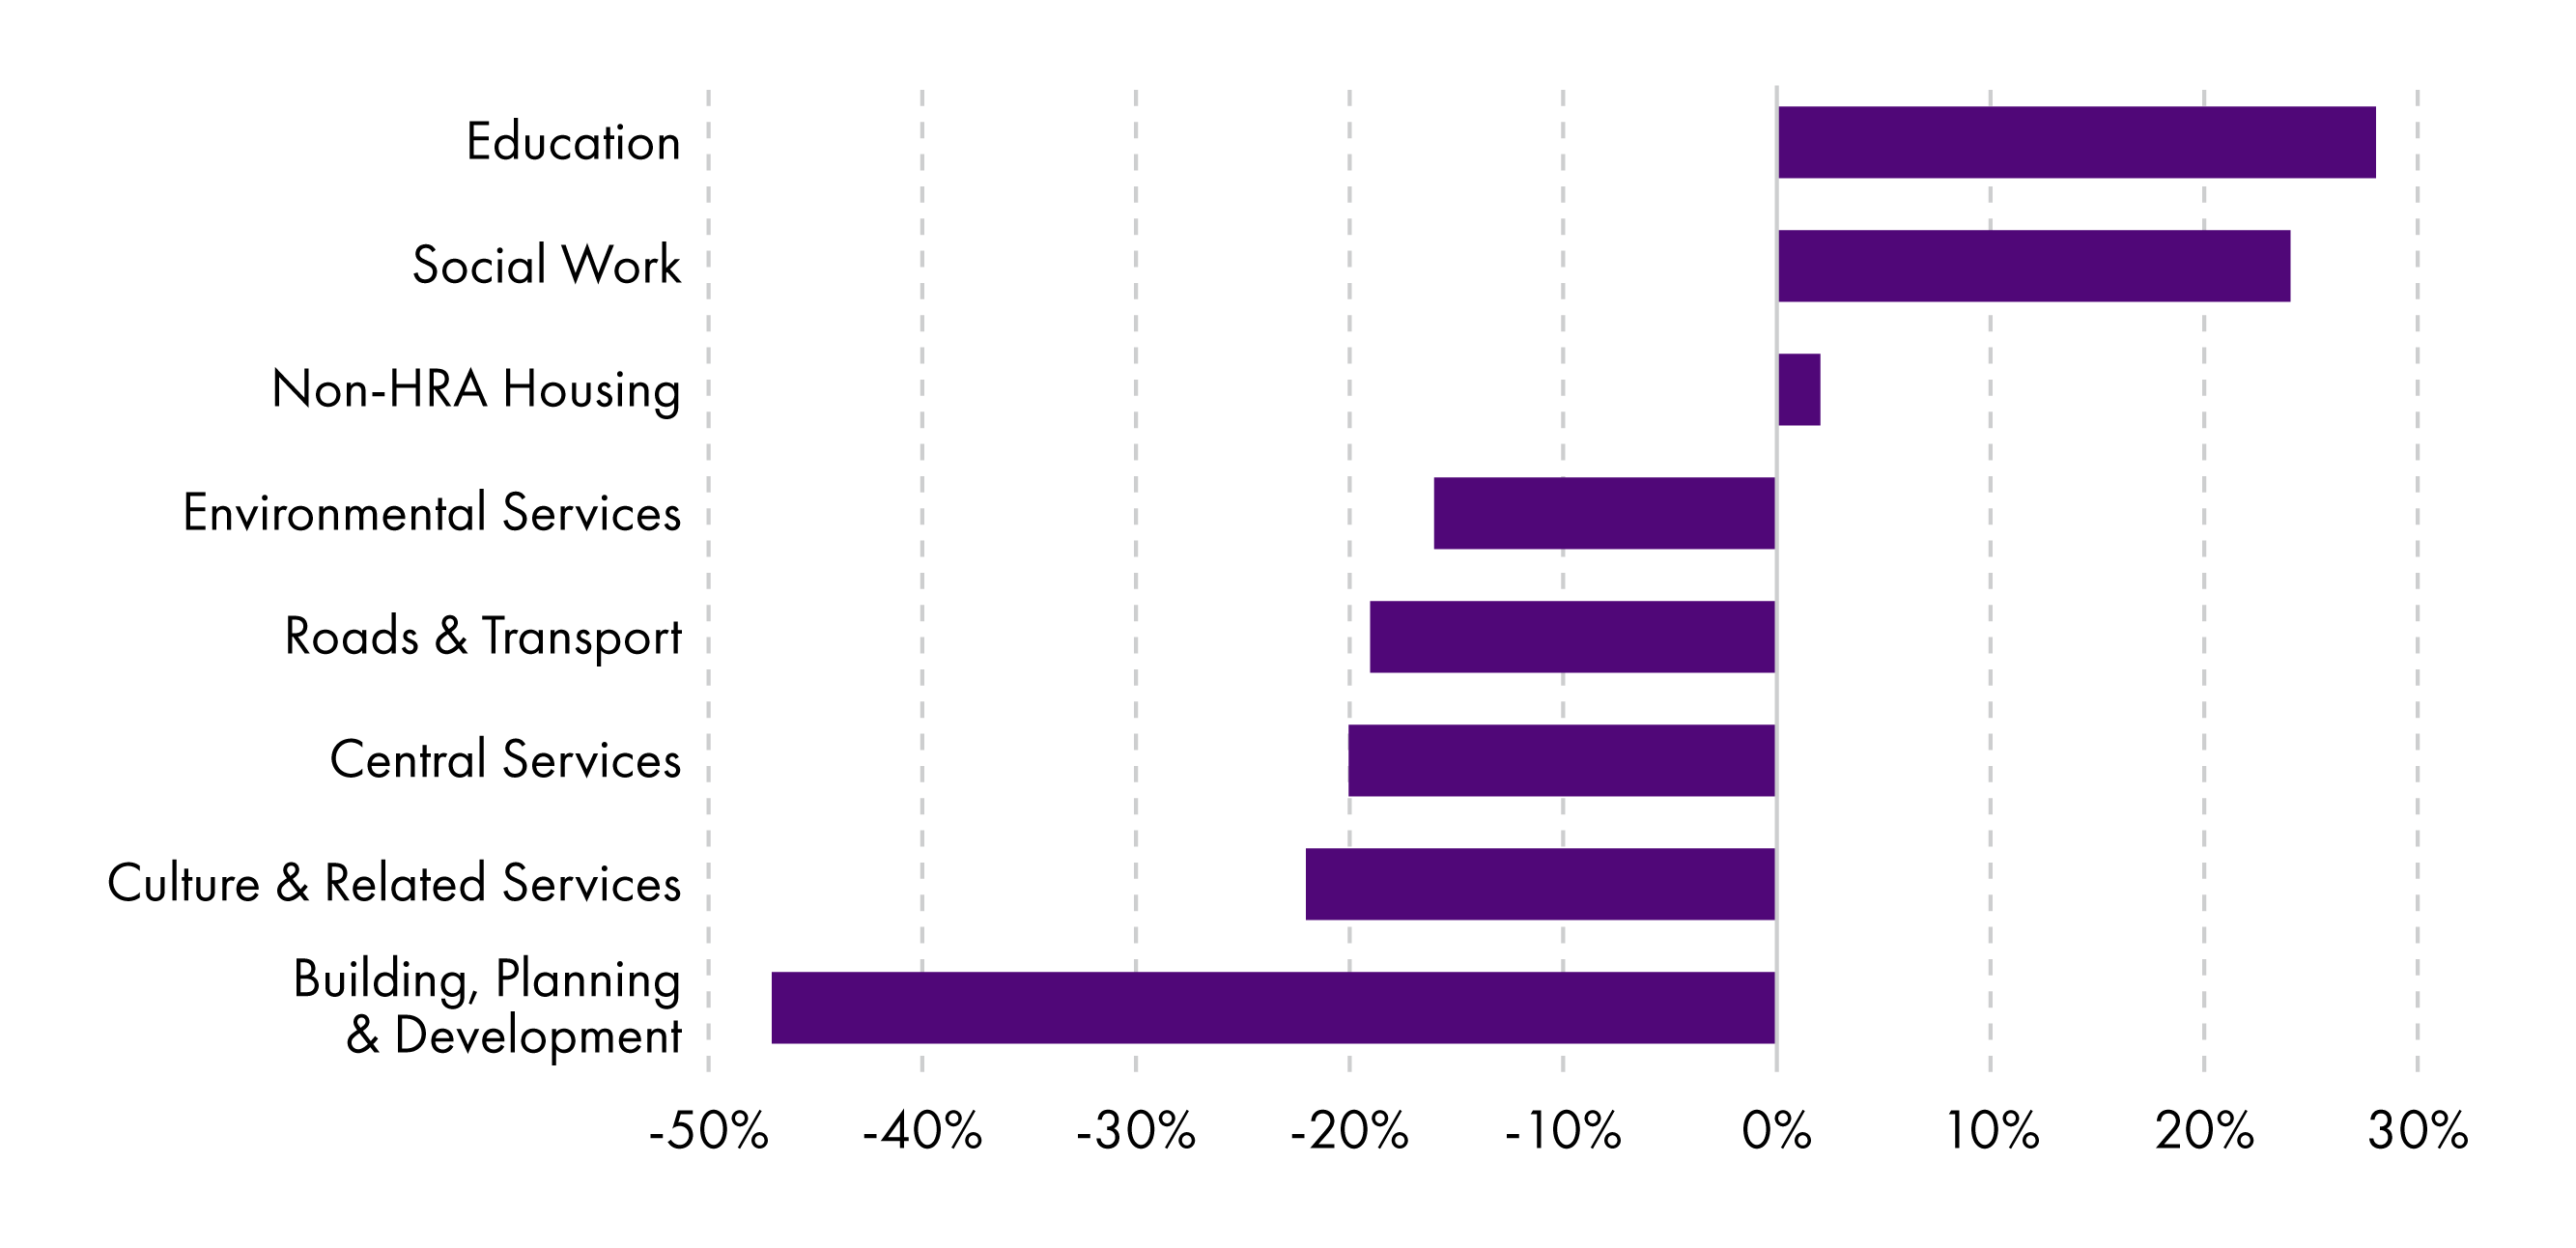
Overall, there have been significant real terms increases in the amount of money councils spend on education and social care over the 14 years between 2013-14 and 2026-27. Chart 18 (below) shows that it is only these two service areas which have seen such big increases. Almost every other service area, from environmental services to planning, has seen significant real terms reductions over the period. The latter, for example, saw a 47% real terms reduction. In 2023, the Accounts Commission concluded:
Over the last decade, there is a clear divergent pattern of spend. Spending on children’s services (education and looked after children) and adult social care has been protected and increased because of national policy directives. This means that the remaining ‘unprotected’ services have borne a disproportionate level of spending reductions.3
Employment costs
Local government is by far the largest public sector employer in Scotland, with recent figures showing that 262,000 people worked for local authorities in early 20261. That means around 1 in 10 working people in Scotland are currently employed by a local authority. This shouldn't be a huge surprise considering the range of services provided by councils: education, adult social care, social work, environmental services, waste management and planning, to name but a few.
According to COSLA, between 60% and 70% of local authority budgets are used to pay for workforce costs2. And the Scottish Government's Local Government Finance Statistics for 2024-25 show that employee costs accounted for £10.2 billion that year3. This paid for "salaries and wages, national insurance and superannuation contributions, cash allowances paid to employees, redundancy and severance payments and any other costs relating to employees"3. This area of spending grew by 21% in real terms between 2013-14 and 2024-25, although it is worth noting the reduction over the most recent year.
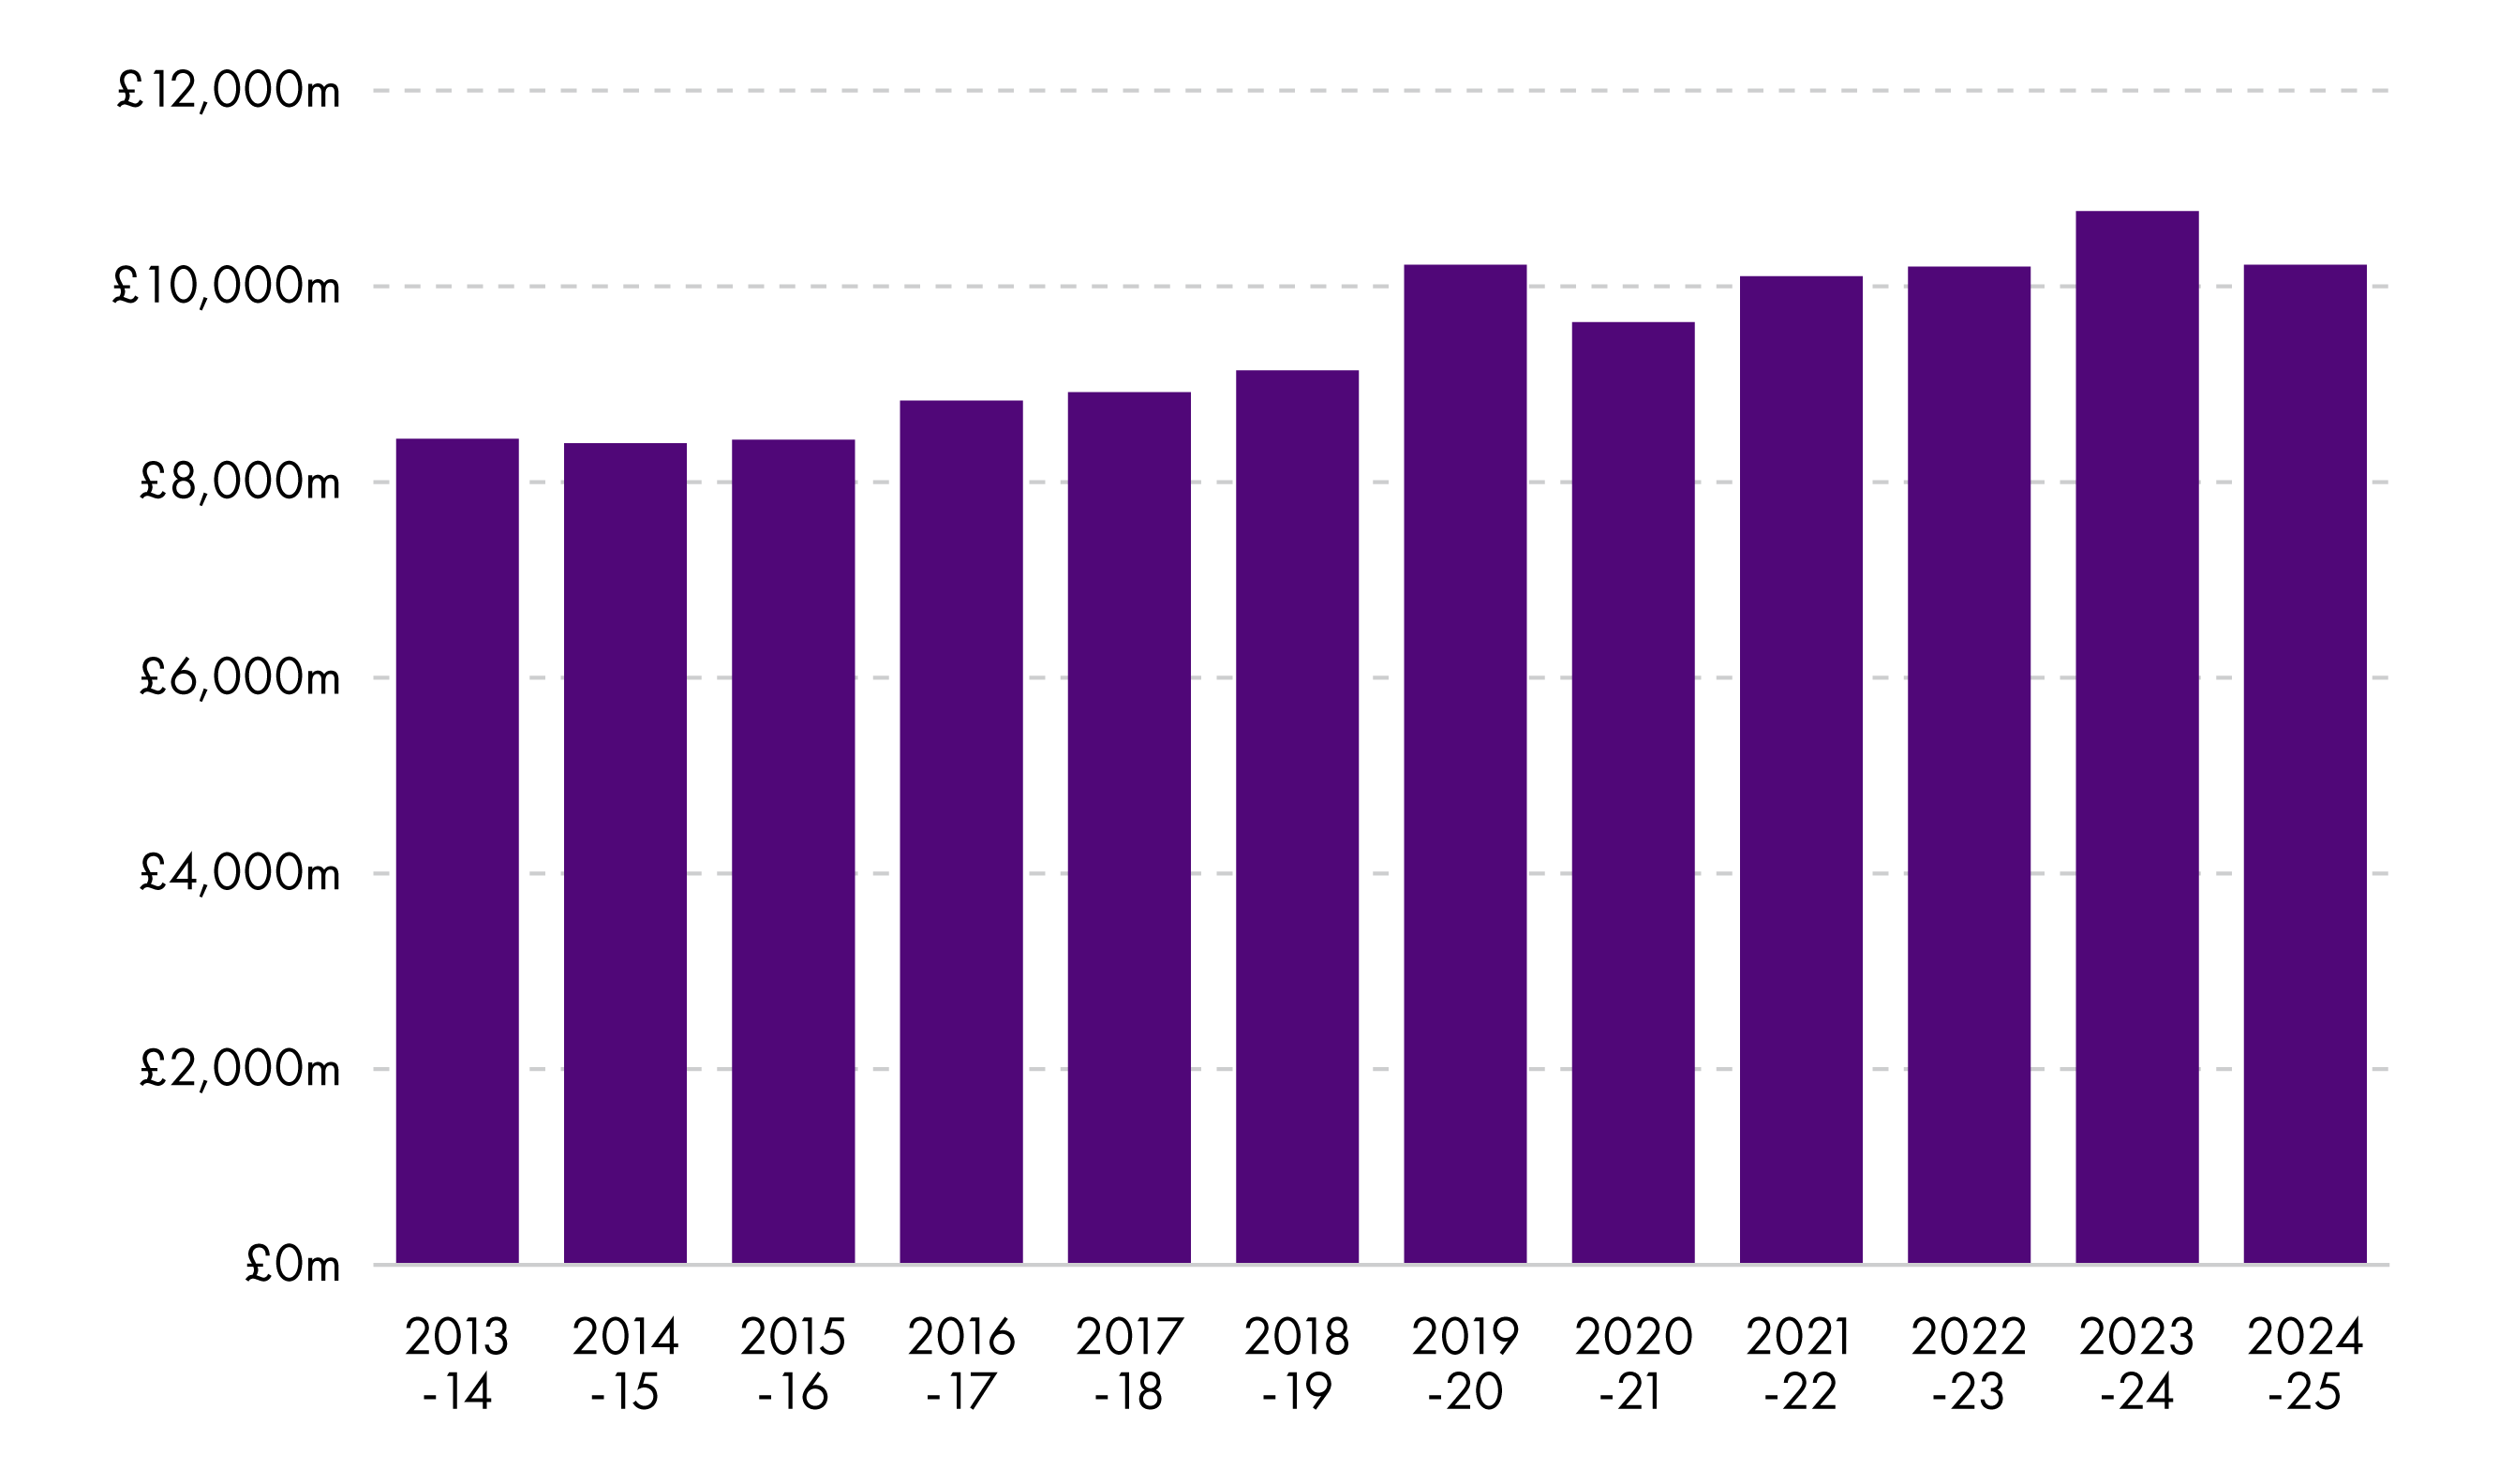
The Scottish Government publishes public sector employment statistics every quarter and these are available for a number of years1. Looking back to 2014, we can see that 248,000 people worked for local government, or 203,000 full-time equivalents. This has risen to 262,000 employees, or 214,000 full-time equivalents (FTE) in 2026. COSLA are keen to stress that over this period local government responsibilities have expanded in many areas [personal correspondence].
As illustrated in Chart 18 (above), employee costs in 2013-14 were £8.4 billion (in 2024-25 prices), increasing to £10.2 billion in 2024-25. Therefore, cost per FTE in 2013-14 was £41,500 (in 2024-25 prices) and this had risen to £47,700 in 2024-25, a 15% real terms increase. It is worth noting that the UK Government's decision to increase employer National Insurance contributions will have played a part in this increase to local government employment costs.
Total employee costs by service area (Table 5) show that the biggest increase has been in education, a £1.4 billion real terms increase when comparing 2013-14 and 2024-25.
| Service | 2013-14 | 2024-25 | Change (£m) | Change (%) |
| Education | 4,480.1 | 5,846.5 | 1,366.4 | +30% |
| Social Work | 1,763.6 | 2,000.3 | 236.7 | +13% |
| Environmental Services | 402.6 | 474.3 | 71.7 | +18% |
| Roads & Transport | 265.6 | 311.3 | 45.7 | +17% |
| Non-HRA Housing | 143.8 | 188.3 | 44.5 | +31% |
| HRA | 183.5 | 226.3 | 42.9 | +23% |
| Culture & Related Services | 302.6 | 293.4 | -9.2 | -3% |
| Other | 892.7 | 870.1 | -22.7 | -3% |
Despite the overall increase in local government employment and its associated costs, a 2024 report published by the Society of Local Authority Chief Executives and Senior Managers (SOLACE), the Improvement Service and the Society of Personnel and Development Scotland found that councils "are facing significant challenges in maintaining and developing workforce capacity across a number of key professional roles"6. Reasons include financial pressures, an ageing workforce, increased service demand, recruitment difficulties, differing population changes across the country, skills gaps and pay competition from other sectors are all contributing factors. Social care and social work are experiencing particularly severe problems. Councils are also struggling to recruit enough trading standards officers, planners and environmental health officers.
Capital expenditure
It is expected that total local government capital expenditure will amount to £5.3 billion in 2026-27. This is a large increase on the previous year, despite the considerable reduction seen in capital grants. Table 6(below) shows that total capital expenditure is expected to be higher this year than in any of the past six years (with previous years' sums put into real terms):
| 2020-21 | 2021-22 | 2022-23 | 2023-24 | 2024-25 | 2025-26 (provisional) | 2026-27 (budget estimate) | |
| Capital expenditure | 3,222 | 4,125 | 4,366 | 4,030 | 4,906 | 4,550 | 5,318 |
Table 7 (below) shows that the majority of capital expenditure in 2026-27 will be funded through borrowing. Every Scottish local authority has a loans fund. These work like internal banks in the sense that the fund borrows externally (e.g. from the Public Works Loans Board) to bring in additional money for capital projects. Money is then “lent” to borrowing departments within the local authority, with the repayment of this borrowing (principal, interest, and expenses) being paid from the General Fund over a number of years.
| Budget estimate (£m) | % of total financing | |
| General Capital Grant (GCG) from Scottish Government | 458 | 9% |
| Other Grants and Contributions | 1,058 | 20% |
| Borrowing from Loans Fund | 3,349 | 63% |
| Assets acquired under Credit Arrangements | 44 | 1% |
| Capital Fund or Capital Receipts | 152 | 3% |
| Capital Funded from Revenue Reserves | 256 | 5% |
| Total Financing | 5,318 | 100% |
Chart 20 (below) shows that annual borrowing by councils has increased significantly over recent years. Anticipated borrowing in 2026-27, at 3.3 billion, is more than double what it was in 2013-14 (again, in real terms):
Chart 20: new borrowing from Loans Funds to finance capital projects, 2017-18 to 2026-27 (2026-27 prices (£m))
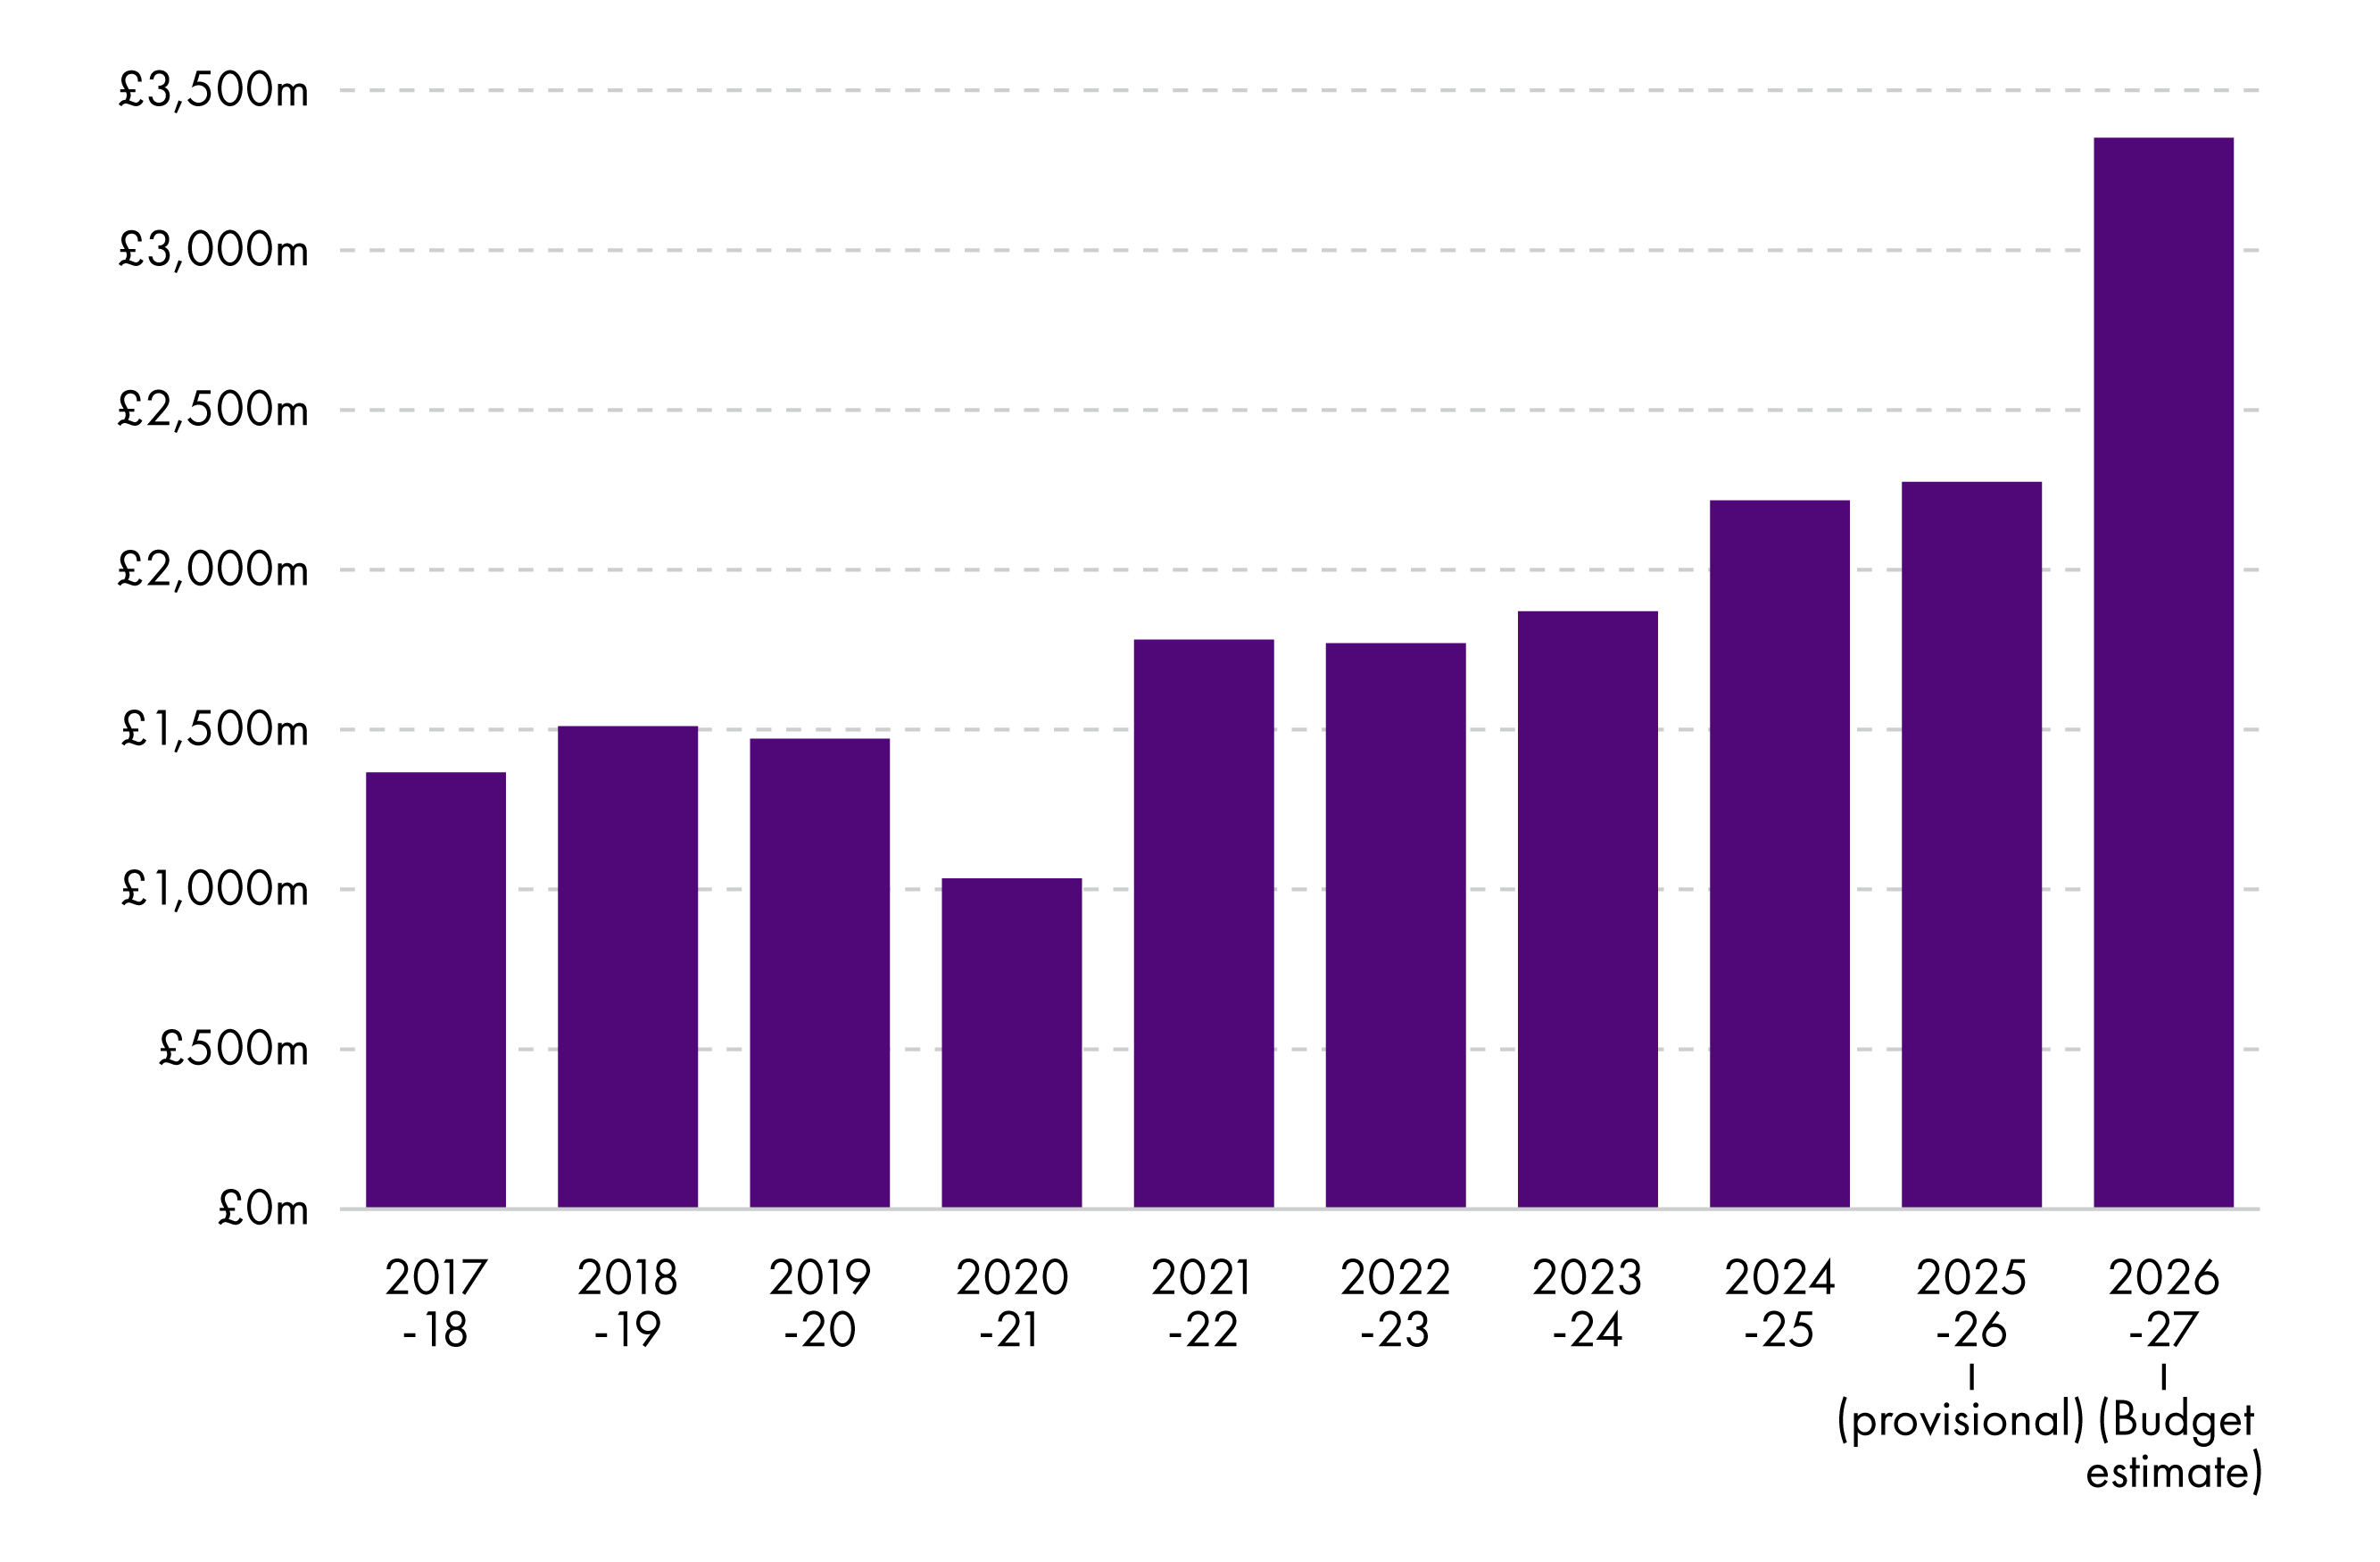
The following table shows a large real terms increase in capital expenditure when comparing outturns for 2017-18 and budget estimates for 2026-27, with much of this increase being in the areas of housing and building, planning and development.
| Service | 2017-18 Outturn | 2026-27 Budget Estimate | Change (£m) | Change (%) |
| Education | 1,229 | 1,000 | -229 | -19% |
| Culture & Related Services | 231 | 296 | 65 | 28% |
| Social Work | 59 | 80 | 21 | 36% |
| Roads & Transport | 550 | 690 | 140 | 26% |
| Environmental Services | 135 | 185 | 50 | 37% |
| Building, Planning & Development | 355 | 676 | 321 | 90% |
| Non-HRA Housing | 209 | 503 | 294 | 141% |
| Trading Services | 23 | 28 | 5 | 20% |
| Central and Other Services | 354 | 278 | -76 | -21% |
| HRA | 935 | 1,583 | 648 | 69% |
| Total Capital Expenditure | 4,080 | 5,319 | 1,239 | 30% |
Public Private Partnerships
Public-private partnership (PPP) models have been used across the UK since the 1990s to finance infrastructure investment, including the building and improvement of around 60 school projects in Scotland1. Under these schemes, a private sector consortium provides upfront financing for infrastructure projects and the public sector then pays for the project once completed over a period of 25 to 30 years, which includes maintenance and service charges. The project is delivered and assets managed for the duration of the contract by a private company known as a Special Purpose Vehicle (SPV).
The UK government's Private Finance Initiative (PFI) was the first major PPP initiative, and this was used extensively by Scottish local authorities during the 1990s and early 2000s. This model has been heavily criticised, though, because of the scale of profits made by the private sector partners and the costs to the public sector. The Scottish Government therefore developed an alternative PPP model, known as the Non-Profit Distributing (NPD) model, which they hoped would restrict the profits that could be made by the private sector2.
In early 2024, the former Director of Finance at Glasgow City Council told the Local Government, Housing and Planning Committee, that many of the original PFI arrangements are now coming to the end of their contracts3:
At the time, PPP was the only game in town—it was our only way of funding. In the past, we looked at whether there were opportunities to refinance or reduce costs, but there were not. We are now getting towards the end, so we are planning for the future. We will have a school estate that still has a significant life left, and we will have finished paying off the contract.
Audit Scotland has warned that public bodies need to begin preparing for the impact of these contracts expiring as local authorities (and other public bodies) will then become responsible for the maintenance of the buildings4. It is worth noting that PPP financing is not currently being used for new schools.
Performance data and financial sustainability
A significant amount of data relating to local authority services is collected and published. We are able to compare performance in a number of areas across time and between different council areas. This is important when looking at local government finance because, since the Local Government in Scotland Act 2003, local authorities have been required to demonstrate "best value" and therefore:
...make arrangements to secure continuous improvement in performance (while maintaining an appropriate balance between quality and cost); and, in making those arrangements and securing that balance, to have regard to economy, efficiency, effectiveness, the equal opportunities requirement and to contribute to the achievement of sustainable development1.
Over recent decades, the Accounts Commission and Audit Scotland have reviewed council performance and assessed whether best value is being achieved. This is demonstrated in the importance of best value to the annual audit process, and the fact that between 2022 and 2027 Audit Scotland will complete Best Value Audit Reports for all 32 local authorities2.
To support senior management teams across all local authorities, and help elected councillors to ask questions about the performance of council services, the Improvement Service created its Local Government Benchmarking Framework (LGBF). This was intended to be "a catalyst for improving services, targeting resources to areas of greatest impact and enhancing public accountability"3. The Improvement Service collects and presents a range of data which helps councils compare performance against a number of indicators that cover most areas of local government activity. According to the Improvement Service website, the Framework:
...reflects a commitment by SOLACE (Scotland) and COSLA to develop better measurement and comparable data in order to help councils improve services, target resources to areas of greatest impact and enhance public accountability.
Financial sustainability indicators
Every year, the Local Government Information Unit (LGIU) surveys a range of council leaders, local authority chief executives and directors of finance across Scotland. The most recent survey received 36 responses from 26 local authorities. As in 2024, its 2025 survey found low levels of confidence in the sustainability of local government finances. Indeed, "over two-thirds of respondents said they thought it was likely that their council would be unable to balance its budget within the next five years"1.
The Improvement Service's Local Government Benchmarking Framework (LGBF) includes five financial sustainability indicators2. These show averages for all Scottish local authorities in 2013-14 and 2024-25 (the most recent data compiled):
| Indicator | 2013-14 | 2024-25 |
|---|---|---|
| Useable reserves as a % of council annual budgeted net revenue | 16.0% | 20.4% |
| Uncommitted General Fund Balance as a % of council annual budgeted net revenue | 3.7% | 1.9% |
| Ratio of Financing Costs to Net Revenue Stream - General Fund | 8.4% | 6.0% |
| Ratio of Financing Costs to Net Revenue Stream - Housing Revenue Account | 25.9% | 20.7% |
| Actual outturn as a percentage of budgeted expenditure | 99.1% | 100.1% |
Improvement Service, Local Government Benchmarking Framework Annual Report 2024-25
In its Benchmarking Framework 2024-25 Annual Report, the Improvement Service provides the following summary:
Local government finances face escalating stress as funding consistently fails to keep pace with inflation, demand growth and expanding national commitments. Increasing ringfencing and new statutory obligations continue to restrict flexibility, and Scottish Government’s forward spending plans indicate further pressure on council budgets. Over 2026/27–2028/29, councils face a £10m cash reduction alongside a real terms funding fall of up to 3.8%. Demographic demand pressures contribute to a £10bn long-term gap. Reserves have been depleted below prudent levels, increasing reliance on debt – especially within the Housing Revenue Account, where financing costs now consume over 20% of rental income.
As the Benchmarking annual report only shows national averages, it is worth stating that there are considerable local variations across all of these indicators which can be viewed on the Explore Data function. The Accounts Commission noted in January that "annual overspends, and a reliance on reserves, means that a number of councils are now in breach of their own reserves policies and are taking action to address this"3.
More on local government debt
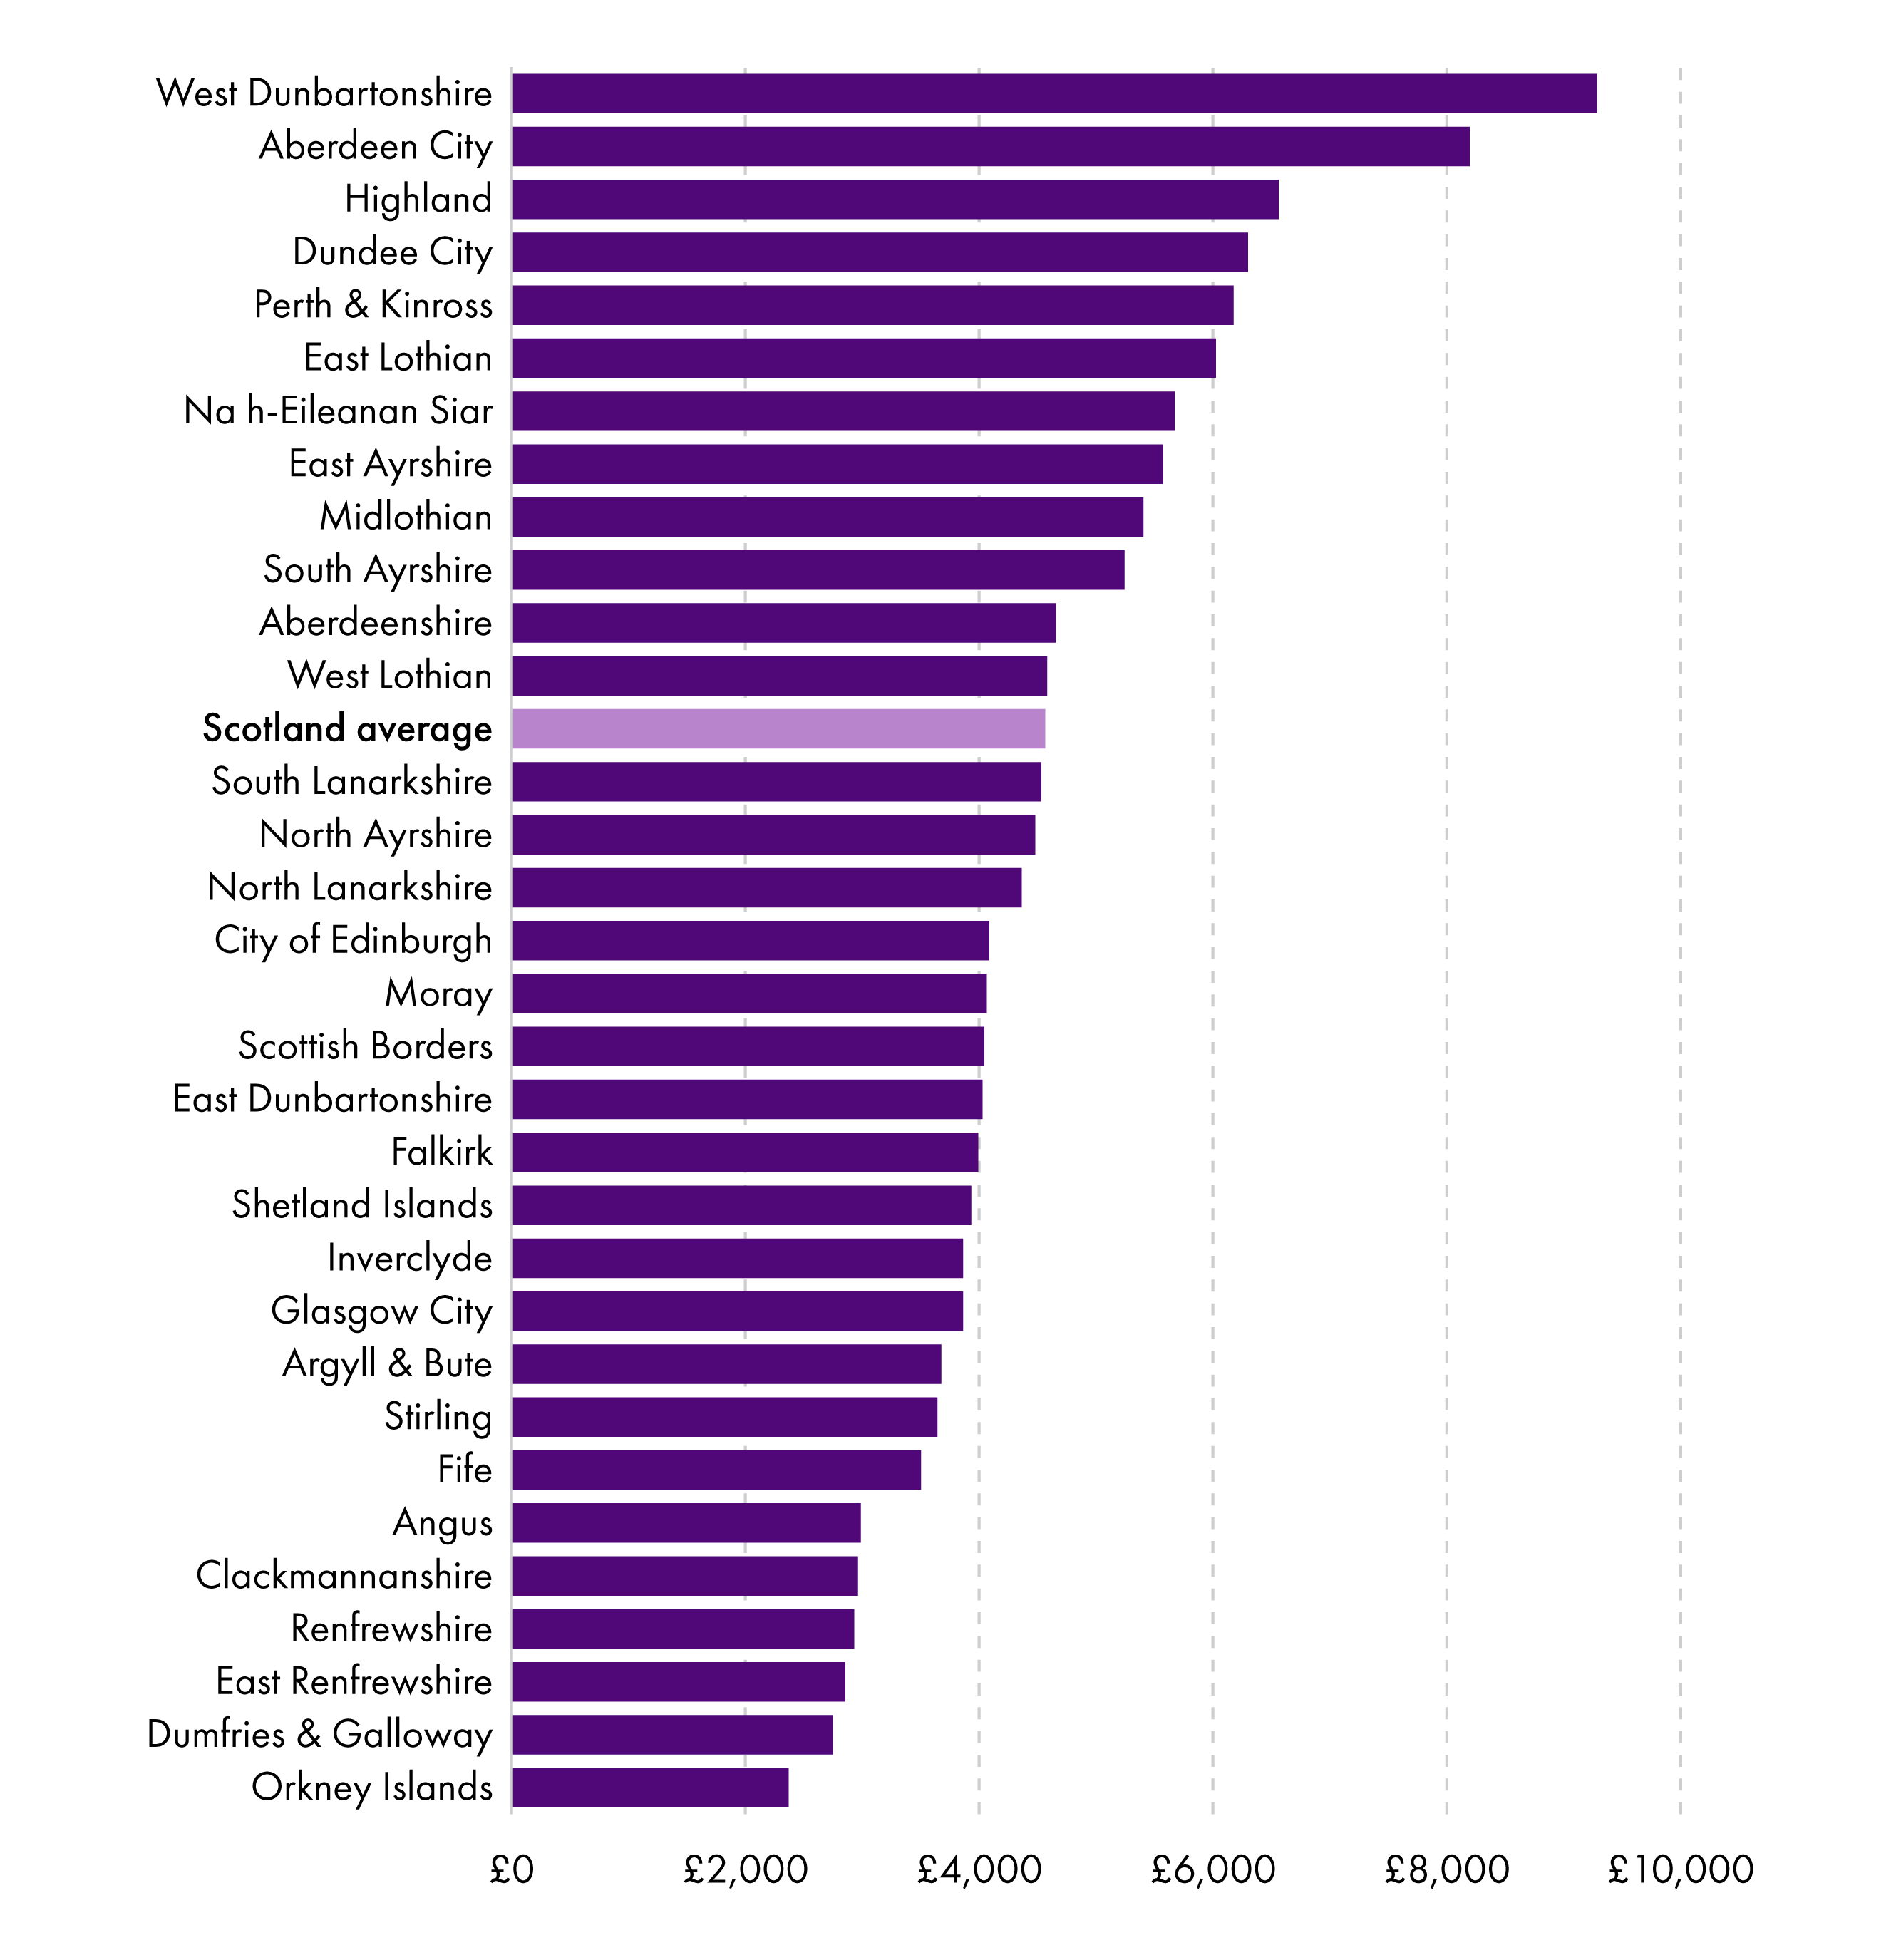
Total local government debt, including Housing Revenue Account debt, stood at £25.3 billion in March 2025. This represents a real terms increase of £2.4 billion, or +17%, since March 2014.
| March 2014 | March 2025 | |
| Total Debt (£m) | 21,553 | 25,296 |
| Debt per head (£) | 4,042 | 4,560 |
Local government debt per head now sits at £4,560 per person, a 13% real terms increase since 2014. Again, national figures mask considerable variation across the country, with the following chart showing total debt per head of population by local authority in 2024-25. The range of values from the largest total debt per head (West Dunbartonshire) to the lowest (Orkney Islands) is striking:
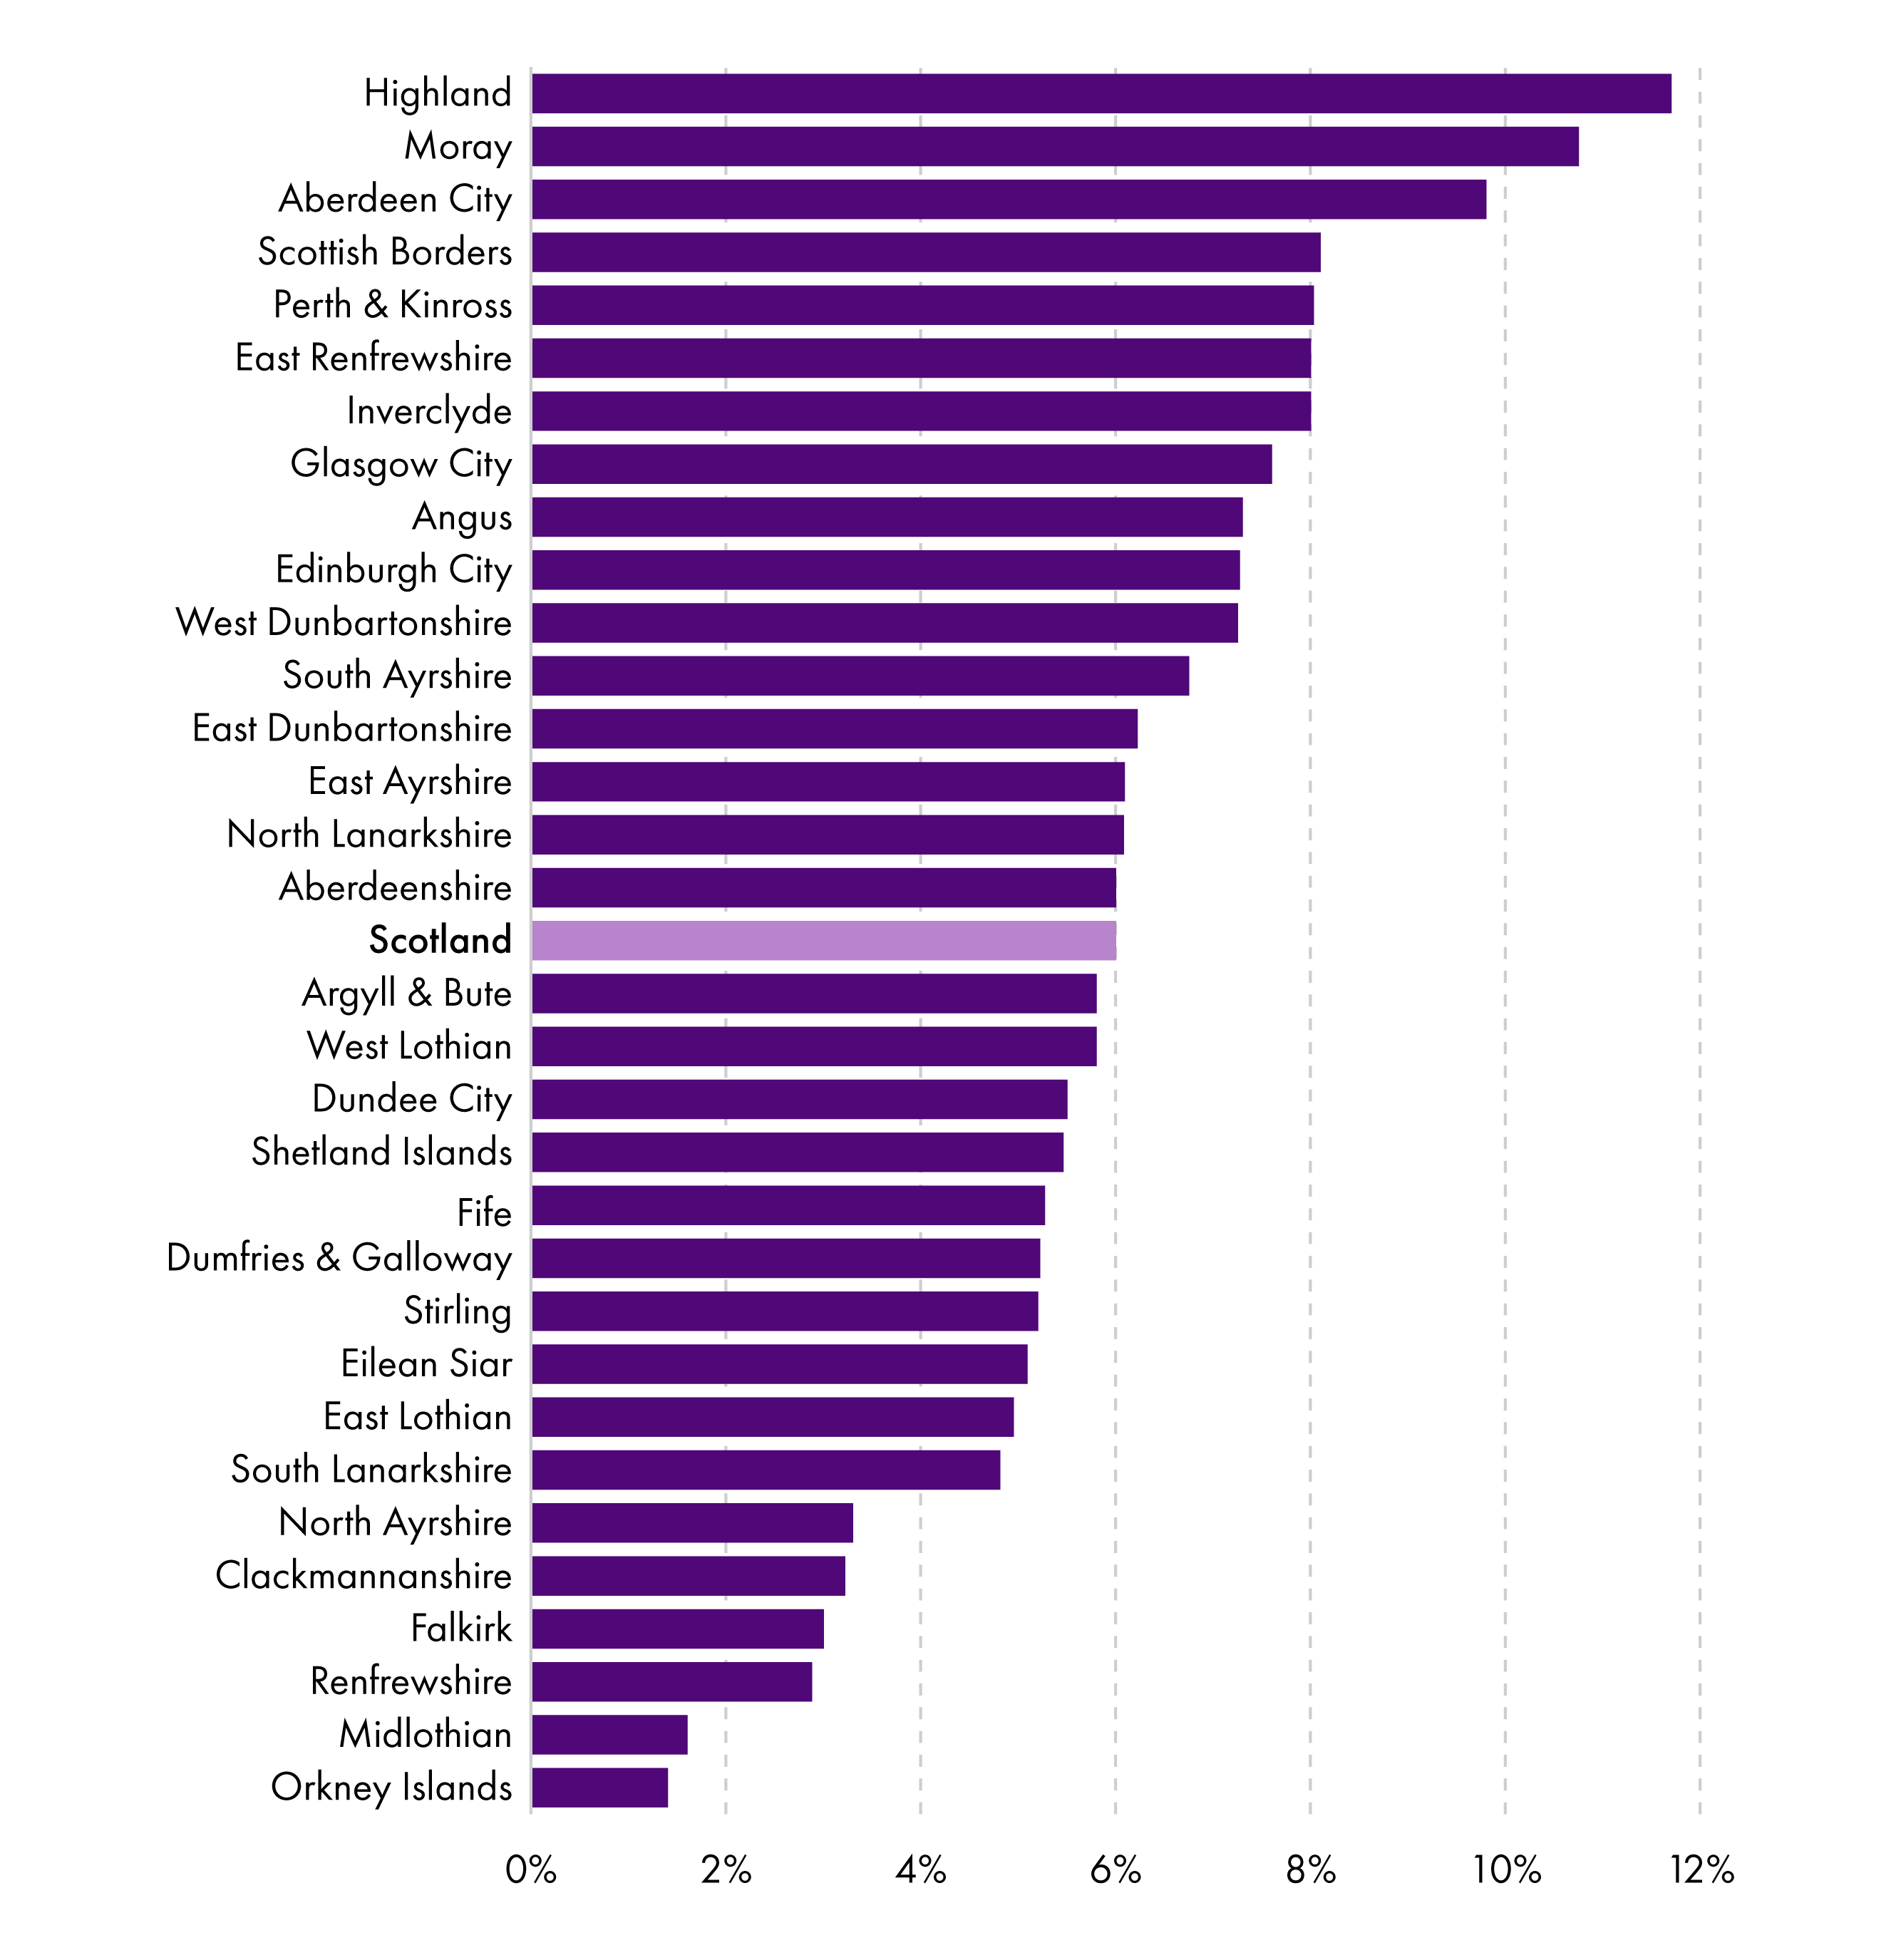
The financial sustainability indicators used by the Improvement Service acknowledge that it is not so much the level of debt that causes concern, but the ability to pay it off. The Local Government Benchmarking Framework therefore includes an indicator presenting the annual revenue costs of borrowing (mainly interest payments) as a proportion of councils' General Fund "net revenue streams" (i.e. GRG+NDR income+council tax income). As discussed above, the figure for Scotland as a whole sits at a reasonable 6.0%. However, the following chart shows the ratios for each local authority in 2024-25, and again, there is quite a range from the highest (Highland) to the lowest (Orkney):
Sources
Accounts Commission. (2024, October). Transformation in councils. Retrieved from <a href="https://audit.scot/publications/transformation-in-councils" target="_blank">https://audit.scot/publications/transformation-in-councils</a>
Local Government Information Unit. (2025, December). The State of Local Government FInance in Scotland. Retrieved from <a href="https://lgiu.org/2025-state-of-local-government-finance-in-scotland/#section-3" target="_blank">https://lgiu.org/2025-state-of-local-government-finance-in-scotland/#section-3</a>
Scottish Government. (2026, February 27). Local Government Finance Circular 02/2026. Retrieved from <a href="https://www.gov.scot/publications/local-government-finance-circular-2-2026-final-settlement-for-2026-to-2027/" target="_blank">https://www.gov.scot/publications/local-government-finance-circular-2-2026-final-settlement-for-2026-to-2027/</a>
Scottish Parliament Official Report, Local Government, Housing and Planning Committee . (2024, January 9). Local Government, Housing and Planning Committee session with Directors of Finance. Retrieved from <a href="https://www.parliament.scot/chamber-and-committees/official-report/search-what-was-said-in-parliament/LGHP-09-01-2024?meeting=15640&iob=133473" target="_blank">https://www.parliament.scot/chamber-and-committees/official-report/search-what-was-said-in-parliament/LGHP-09-01-2024?meeting=15640&iob=133473</a>
Improvement Service. (2026, July 26). https://www.improvementservice.org.uk/news/july-2026/modelling-demand-for-local-government-services. Retrieved from <a href="https://www.improvementservice.org.uk/__data/assets/pdf_file/0032/76298/Demand-and-Spending-in-Scottish-Local-Government.pdf" target="_blank">https://www.improvementservice.org.uk/__data/assets/pdf_file/0032/76298/Demand-and-Spending-in-Scottish-Local-Government.pdf</a>
Scottish Government. (2026, February 26). Green Book: Scottish Local Government Finance Settlement 2026-27: Funding Allocation Formula. Retrieved from <a href="https://www.gov.scot/publications/scottish-local-government-finance-green-book-2026-27/" target="_blank">https://www.gov.scot/publications/scottish-local-government-finance-green-book-2026-27/</a>
Scottish Government. (2026, June 4). Scottish Public Finance Manual. Retrieved from <a href="https://www.gov.scot/publications/scottish-public-finance-manual/local-government-finance/local-government-finance/" target="_blank">https://www.gov.scot/publications/scottish-public-finance-manual/local-government-finance/local-government-finance/</a>
McConnell, A. (2004). Scottish Local Government. (n.p.): (n.p.).
Scottish Government. (2026, February 27). The Funding of Local Government in Scotland, 2026-27. Retrieved from <a href="https://www.gov.scot/publications/funding-local-government-scotland-2026-27/" target="_blank">https://www.gov.scot/publications/funding-local-government-scotland-2026-27/</a>
Accounts Commission. (2026, June 12). Local government budgets 2026-27. Retrieved from <a href="https://audit.scot/publications/local-government-budgets-202627" target="_blank">https://audit.scot/publications/local-government-budgets-202627</a>
Scottish Government. (2026). Local Government 2025-26 Provisional Outturn and 2026-27 Budget Estimates. Retrieved from <a href="https://www.gov.scot/publications/local-government-2025-26-provisional-outturn-and-2026-27-budget-estimates/documents/" target="_blank">https://www.gov.scot/publications/local-government-2025-26-provisional-outturn-and-2026-27-budget-estimates/documents/</a>
Scottish Government. (2026, April 30). Non-domestic rates revaluation 2026 Scotland . Retrieved from <a href="https://www.gov.scot/binaries/content/documents/govscot/publications/statistics/2026/04/non-domestic-rates-revaluation-2026-statistics/documents/non-domestic-rates-revaluation-2026-statistics-text/non-domestic-rates-revaluation-2026-statistics-text/govscot%3Adocument/Non-domestic%2Brates%2Brevaluation%2B2026%2Bstatistics%2B-%2Btext.pdf" target="_blank">https://www.gov.scot/binaries/content/documents/govscot/publications/statistics/2026/04/non-domestic-rates-revaluation-2026-statistics/documents/non-domestic-rates-revaluation-2026-statistics-text/non-domestic-rates-revaluation-2026-statistics-text/govscot%3Adocument/Non-domestic%2Brates%2Brevaluation%2B2026%2Bstatistics%2B-%2Btext.pdf</a>
Scottish Government. (2025, August 13). Government expenditure & revenue Scotland 2024-25. Retrieved from <a href="https://www.gov.scot/publications/government-expenditure-revenue-scotland-2024-25/documents/" target="_blank">https://www.gov.scot/publications/government-expenditure-revenue-scotland-2024-25/documents/</a>
Scottish Government. (2026, February 5). Scottish Local Government Finance Statistics (SLGFS) 2024-25. Retrieved from <a href="https://www.gov.scot/publications/scottish-local-government-finance-statistics-2024-25/documents/" target="_blank">https://www.gov.scot/publications/scottish-local-government-finance-statistics-2024-25/documents/</a>
Improvement Service. (2026). Local Government Benchmarking Framework. Retrieved from <a href="https://www.improvementservice.org.uk/products-and-services/data-intelligence-and-benchmarking/local-government-benchmarking-framework" target="_blank">https://www.improvementservice.org.uk/products-and-services/data-intelligence-and-benchmarking/local-government-benchmarking-framework</a>
Accounts Commission. (2023). Local government in Scotland Overview 2023. Retrieved from <a href="https://audit.scot/uploads/docs/report/2023/nr_230517_local_government_overview.pdf" target="_blank">https://audit.scot/uploads/docs/report/2023/nr_230517_local_government_overview.pdf</a>
Scottish Government. (2026). Public sector employment in Scotland: web tables. Retrieved from <a href="https://www.gov.scot/publications/public-sector-employment-statistics-web-tables/" target="_blank">https://www.gov.scot/publications/public-sector-employment-statistics-web-tables/</a>
COSLA. (2022). Submission to Finance Committee's inquiry into Scotland's public finances in 2023-24: the impact of the cost of living and public service reform. Retrieved from <a href="https://yourviews.parliament.scot/finance/scotland-public-finances-23-24/consultation/view_respondent?uuId=489985552" target="_blank">https://yourviews.parliament.scot/finance/scotland-public-finances-23-24/consultation/view_respondent?uuId=489985552</a>
Improvement Service, SOLACE and SPDS. (2024, September). Scotland's Local Government Workforce Report 2024. Retrieved from <a href="https://www.improvementservice.org.uk/__data/assets/pdf_file/0027/53559/Local-Government-Workforce-Report-2024-v4.pdf" target="_blank">https://www.improvementservice.org.uk/__data/assets/pdf_file/0027/53559/Local-Government-Workforce-Report-2024-v4.pdf</a>
Hudson, N. (2018, January). Private financing of Scotland’s infrastructure, SPICe blog. Retrieved from <a href="https://spice-spotlight.scot/2018/01/30/private-financing-of-scotlands-infrastructure/" target="_blank">https://spice-spotlight.scot/2018/01/30/private-financing-of-scotlands-infrastructure/</a>
Scottish Parliament Information Centre. (2023, March). Briefing for the Citizen Participation and Public Petitions Committee on petition PE2004: Abolish the use of Public Private Partnerships in Scotland. Retrieved from <a href="https://www.parliament.scot/get-involved/petitions/view-petitions/pe2004-abolish-the-use-of-public-private-partnerships-in-scotland" target="_blank">https://www.parliament.scot/get-involved/petitions/view-petitions/pe2004-abolish-the-use-of-public-private-partnerships-in-scotland</a>
Scottish Parliament Official Report. (2024, January). Official Report for the Local Government, Housing and Planning Committee's first meeting of 2024. Retrieved from <a href="https://www.parliament.scot/api/sitecore/CustomMedia/OfficialReport?meetingId=15640" target="_blank">https://www.parliament.scot/api/sitecore/CustomMedia/OfficialReport?meetingId=15640</a>
Audit Scotland. (2023, September). Investing in Scotland's infrastructure. Retrieved from <a href="https://audit.scot/uploads/docs/report/2023/briefing_230928_scotlands_infrastructure.pdf" target="_blank">https://audit.scot/uploads/docs/report/2023/briefing_230928_scotlands_infrastructure.pdf</a>
Scottish Government. (2020). Best Value: revised statutory guidance 2020. Retrieved from <a href="https://www.gov.scot/publications/best-value-revised-statutory-guidance-2020/" target="_blank">https://www.gov.scot/publications/best-value-revised-statutory-guidance-2020/</a>
Accounts Commission. (2026). Best Value. Retrieved from <a href="https://audit.scot/best-value" target="_blank">https://audit.scot/best-value</a>
Improvement Service. (2026). Local Government Benchmarking Framework. Retrieved from <a href="https://www.improvementservice.org.uk/benchmarking/home" target="_blank">https://www.improvementservice.org.uk/benchmarking/home</a>
Accounts Commission. (2026, January 29). Local government in Scotland: Financial bulletin 2024/25. Retrieved from <a href="https://audit.scot/publications/local-government-in-scotland-financial-bulletin-202425" target="_blank">https://audit.scot/publications/local-government-in-scotland-financial-bulletin-202425</a>