Scotland's exports: Policy and statistics 2026
This briefing gives an overview of the latest data and the different sources covering Scotland's exports, the recent international context, and relevant policy from the Scottish Government and the UK Government. The briefing also includes four case studies giving more detail on service exports, food and drink exports, refined petroleum product exports, and exports to the USA.
Key points
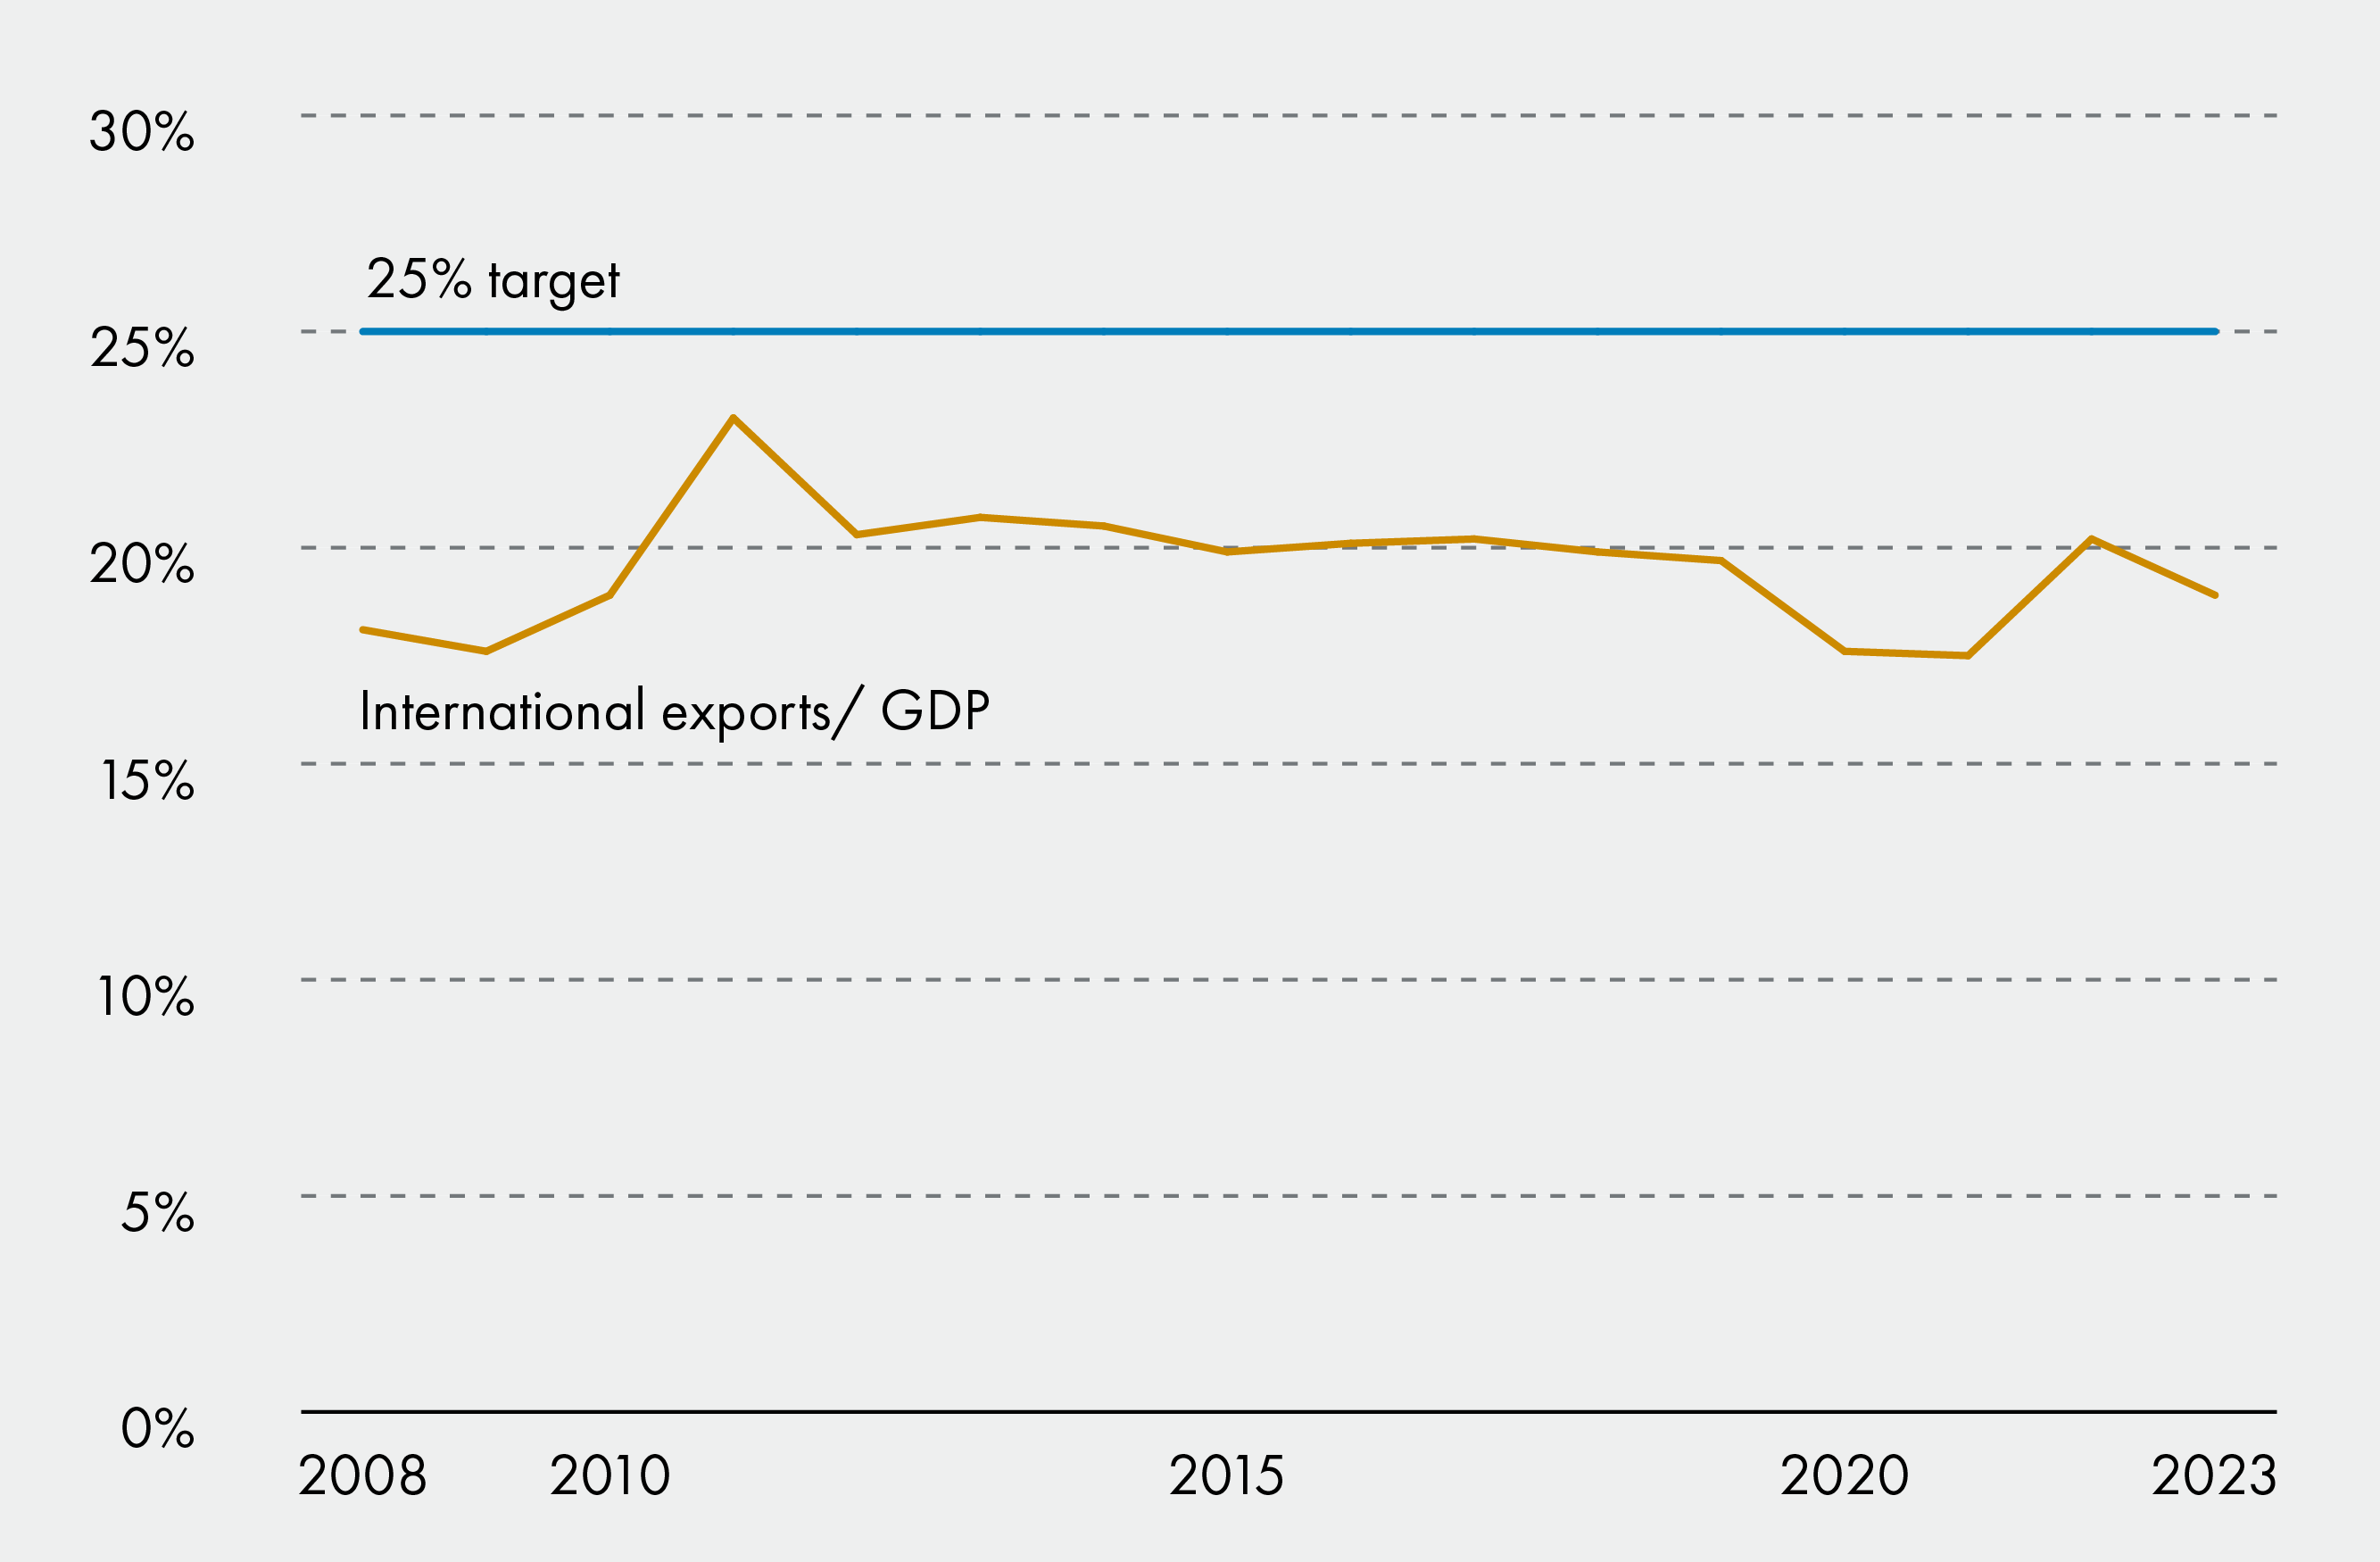
The Scottish Government's export growth strategy 'A Trading Nation' has the headline goal of increasing the value of Scotland's international exports from the equivalent of 20% of Scottish GDP to 25% by 2029. However, since this strategy was launched there has been considerable volatility in the international trading environment, from political changes such as the UK's exit from the EU, to the supply chain disruption from the Covid-19 pandemic, and most recently geopolitical events such as the Russian invasion of Ukraine and the conflict in the Middle East.
Since the strategy was launched in 2019, the value of Scottish international exports compared to GDP has mostly remained below the equivalent of 20% of Scottish GDP.
There are two key data sources which have informed this briefing:
Exports Statistics Scotland (ESS) published by the Scottish Government provides annual data on the value of exports from Scotland to the rest of the UK and internationally. It bases its analysis on the sale of goods and services to customers outside Scotland. The analysis is based on economic activity of the business.
Regional Trade Statistics published by HMRC provides quarterly data on the value and mass of international exports from the UK, broken down by nation and region.
ESS figures show that in 2023 the total value of exports was £93.1 billion, which is a fall of £3.3 billion compared to 2022 in cash terms (-3.3% in cash terms, or -7.0% in real terms). Looking at the change in value of exports by destination between 2022 and 2023:
Exports to the rest of the UK (rUK) reduced by 5.0% in cash terms.
Exports to the EU reduced by 4.5% in cash terms.
Exports to the rest of the world grew by 2.4% in cash terms.
Overall the rest of the UK (rUK) is the main destination for Scotland's exports, accounting for 59.5% in 2023. The rUK accounts for 65.7% of service exports in 2023 and 78.0% of of 'other' exports (which includes agriculture, utilities and construction).
Service exports account for 49.0% of all exports in 2023, and over two thirds of the value of all service exports was from three industrial sectors; financial and insurance activites (25.1%), wholesale and retail trade (22.6%), and professional, scientific and technical activities (19.3%).
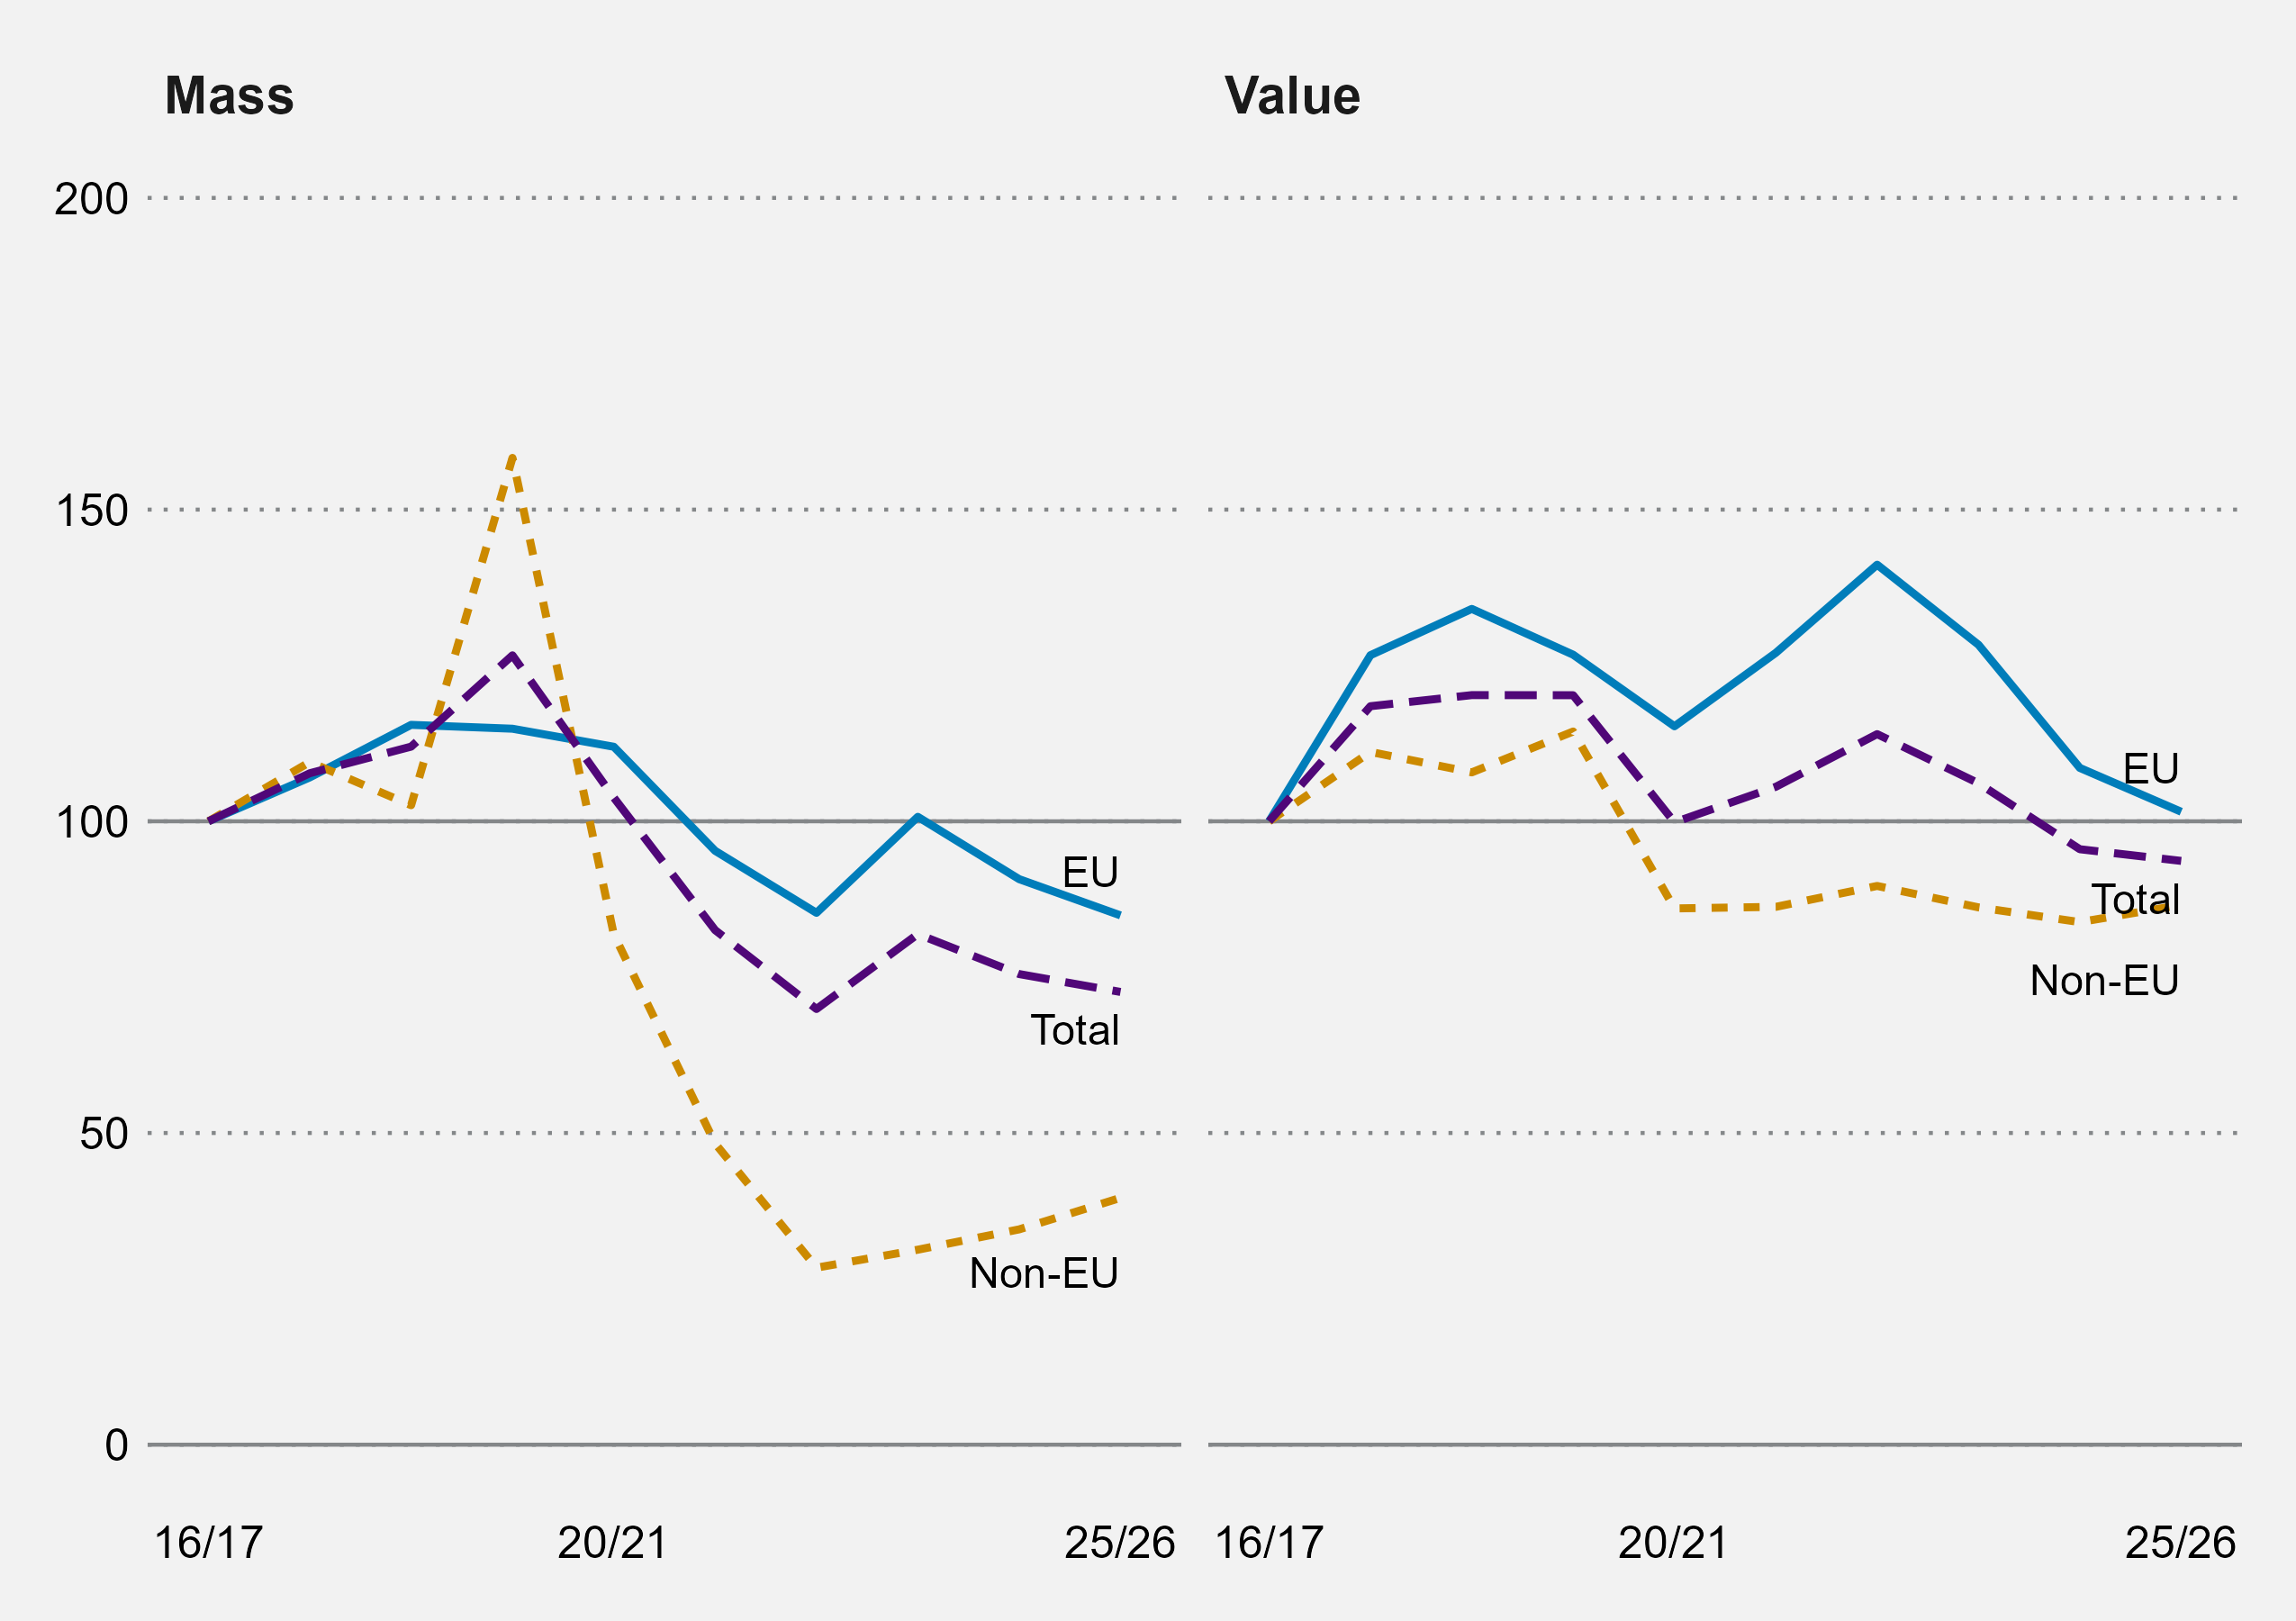
While RTS data covers only international exports of goods, it provides more timely data than ESS, and also includes the mass of exported goods. The total mass of goods exports from Scotland peaked in 2019-20; by 2025-26 the total mass of Scottish exports had reduced by 42.6% compared with this peak.
The mass of both EU and non-EU exports have fallen, but the fall of non-EU exports has been more significant. These increased rapidly in 2019-20 then fell significantly, and in 2025-26 were 75% below their 2019-20 peak. The mass of EU exports decreased by 26.1% in the same period.
Responsibility for negotiating international agreements, including trade deals, is reserved, but the Scottish Government has a number of strategies which aim to support firms exporting. These include 'A Trading Nation' which focused resources on countries and sectors which it started were most likely to deliver the largest, most sustainable contributions to Scotland's economic growth. The Scottish Government updated these prioritisations in 2025.
Since 2019, there have been a number of geopolical shocks and global events which have impacted on world trade flows. From a UK perspective, one of these events, the UK's departure from the European Union was a policy choice of which the main impact - a fundamental change to the trading relationship with its main market - fell on the UK itself. Other events such as the COVID-19 global pandemic and Russia's illegal invasion of Ukraine have impacted on Scotland and the UK along with the rest of the world.
Case studies included at the conclusion of the briefing set out the trading performance in areas such as service exports, food and drink, mineral fuels, lubricants & related materials, and exports to the United States - which remains Scotland's largest international destination.
How this briefing is structured
This briefing intends to give a broad overview of exports from Scotland, covering the data we have on what is exported and to where, as well as an overview of recent policy to support exporters, and the international context.
Section 1 sets out why governments are interested in exports
Section 2 looks in more detail at the two main sources of data on exports
Section 3 gives an overview of recent policy to support exporters
Section 4 gives an overview of international developments which have had an impact on Scotland's trade
Section 5 comprises four case studies covering significant sectors within Scotland's exports
Introduction - what are exports and why do we care?
There are a number of reasons why the performance of exporting businesses is important to understand. Economists suggest that increasing the proportion of firms able to export is a key driver of productivity. Research by the European Central Bank1 notes that:
On the export side, the possibility to expand into larger (export) markets provides incentives to improve the efficiency or quality of production, thereby boosting productivity within firms.
In the evidence paper which accompanied the Scottish Government's National Strategy of Economic Transformation2 (March 2022), the Scottish Government note that:
While Scotland has grown its international exports over the past 20 years, their value as a share of GDP has remained broadly static and remains low relative to comparable small advanced economies.
Growing productivity is understood to be an important way of driving improvements to living standards. A House of Lords briefing on Economic growth, inflation and productivity3 notes that:
A key mechanism through which economic growth is understood to lead to higher living standards is productivity growth. Economic growth can also be the result of increased employment or investment, but these processes do not necessarily lead to rising wages or incomes. Productivity growth, however, means that businesses can produce more output per given labour input, which effectively increases the value of labour in the production process, allowing for higher wages.
The Scottish Government has a ten-year export growth strategy (A Trading Nation, May 2019) which includes the headline goal of increasing the value of exports as a proportion of GDP to 25%4. The years since this strategy was launched have been marked by considerable turmoil affecting international markets and supply chains. Following the UK's exit from the EU Scottish exporters must negotiate different and evolving trading relationships; the Covid-19 pandemic had a considerable impact on international supply chains; the Russian invasion of Ukraine has had a significant impact on key markets including agricultural produce and oil and gas. These pressures have been exacerbated most recently by the conflict in the Middle East.
Figure 1 below shows the value of Scottish international exports of goods and services compared with Scotland's onshore GDP since 2008i.
Export Statistics Scotland, Quarterly National Accounts Scotland
Main data sources
This section will set out the latest data from the two main sources on Scotland's exports, as well as noting other sources which might be considered.
Export Statistics Scotland
Overview: Exports Statistics Scotland (ESS) published by the Scottish Government provides annual data on the value of exports from Scotland to the rest of the UK and internationally. It bases its analysis on the sale of goods and services to customers outside Scotland. The analysis is based on economic activity of the business, allowing the data to be broken down by Standard Industrial Classification code. This analysis is published every second year.
Exports Statistics Scotland (ESS)1, published by the Scottish Government, provides estimates of the value of Scotland's international exports and exports to the rest of the UK. This publication provides the values of export for all sectors including the manufacturing and service sectors but excluding oil and gas.
ESS defines exports as direct sales of goods or services to customers based outside Scotland. This includes sales to visitors to Scotland - businesses completing the global connections survey are asked to provide their best estimate as to the proportion of their sales to visitors or customers based outside Scotland. The estimated value of goods excludes VAT, freight and insurance costs.
The primary source of data for ESS is the Global Connection Survey (GCS). The GCS is sent to a representative sample of 6,000-10,000 businesses with operations in Scotland. It collects data about businesses sales to customers in different locations. If a business sells goods or services to a customer not based in Scotland, this is counted as an export. Where data is unavailable the Scottish Government uses other sources such as the Office for National Statistics or HMRC. A full list of data sources is available on the Scottish Government website.
The data is classified by sector using the Standard Industrial Classification (SIC). SIC codes provide a framework for classifying economic activity for the collection, tabulation, presentation and analysis of data. Classification is based on the economic activity of the business. This allows it to be compared to other sources which use the SIC codes. However, some codes are excluded from the analysis.
In 2020, the Scottish Government decided to delay the collection of the GCS data. This was because of the Coronavirus (COVID-19) pandemic and to allow businesses to focus on preparing for the end of the EU Exit Transition Period. Due to this delay the Scottish Government changed the methodology. They switched from using the ONS Inter-Departmental Business Register (IDBR) to using the Scottish Annual Business Statistics (SABS) as their basis for company turnover.
This change in methodology meant that the 2021 publication included only three years of data. However, the 2023 publication has used the SABS data to revise data from earlier years, meaning the 2023 publication includes data from 2008 to 2023.
More information on the ESS methodology can be found on the Scottish Government website.
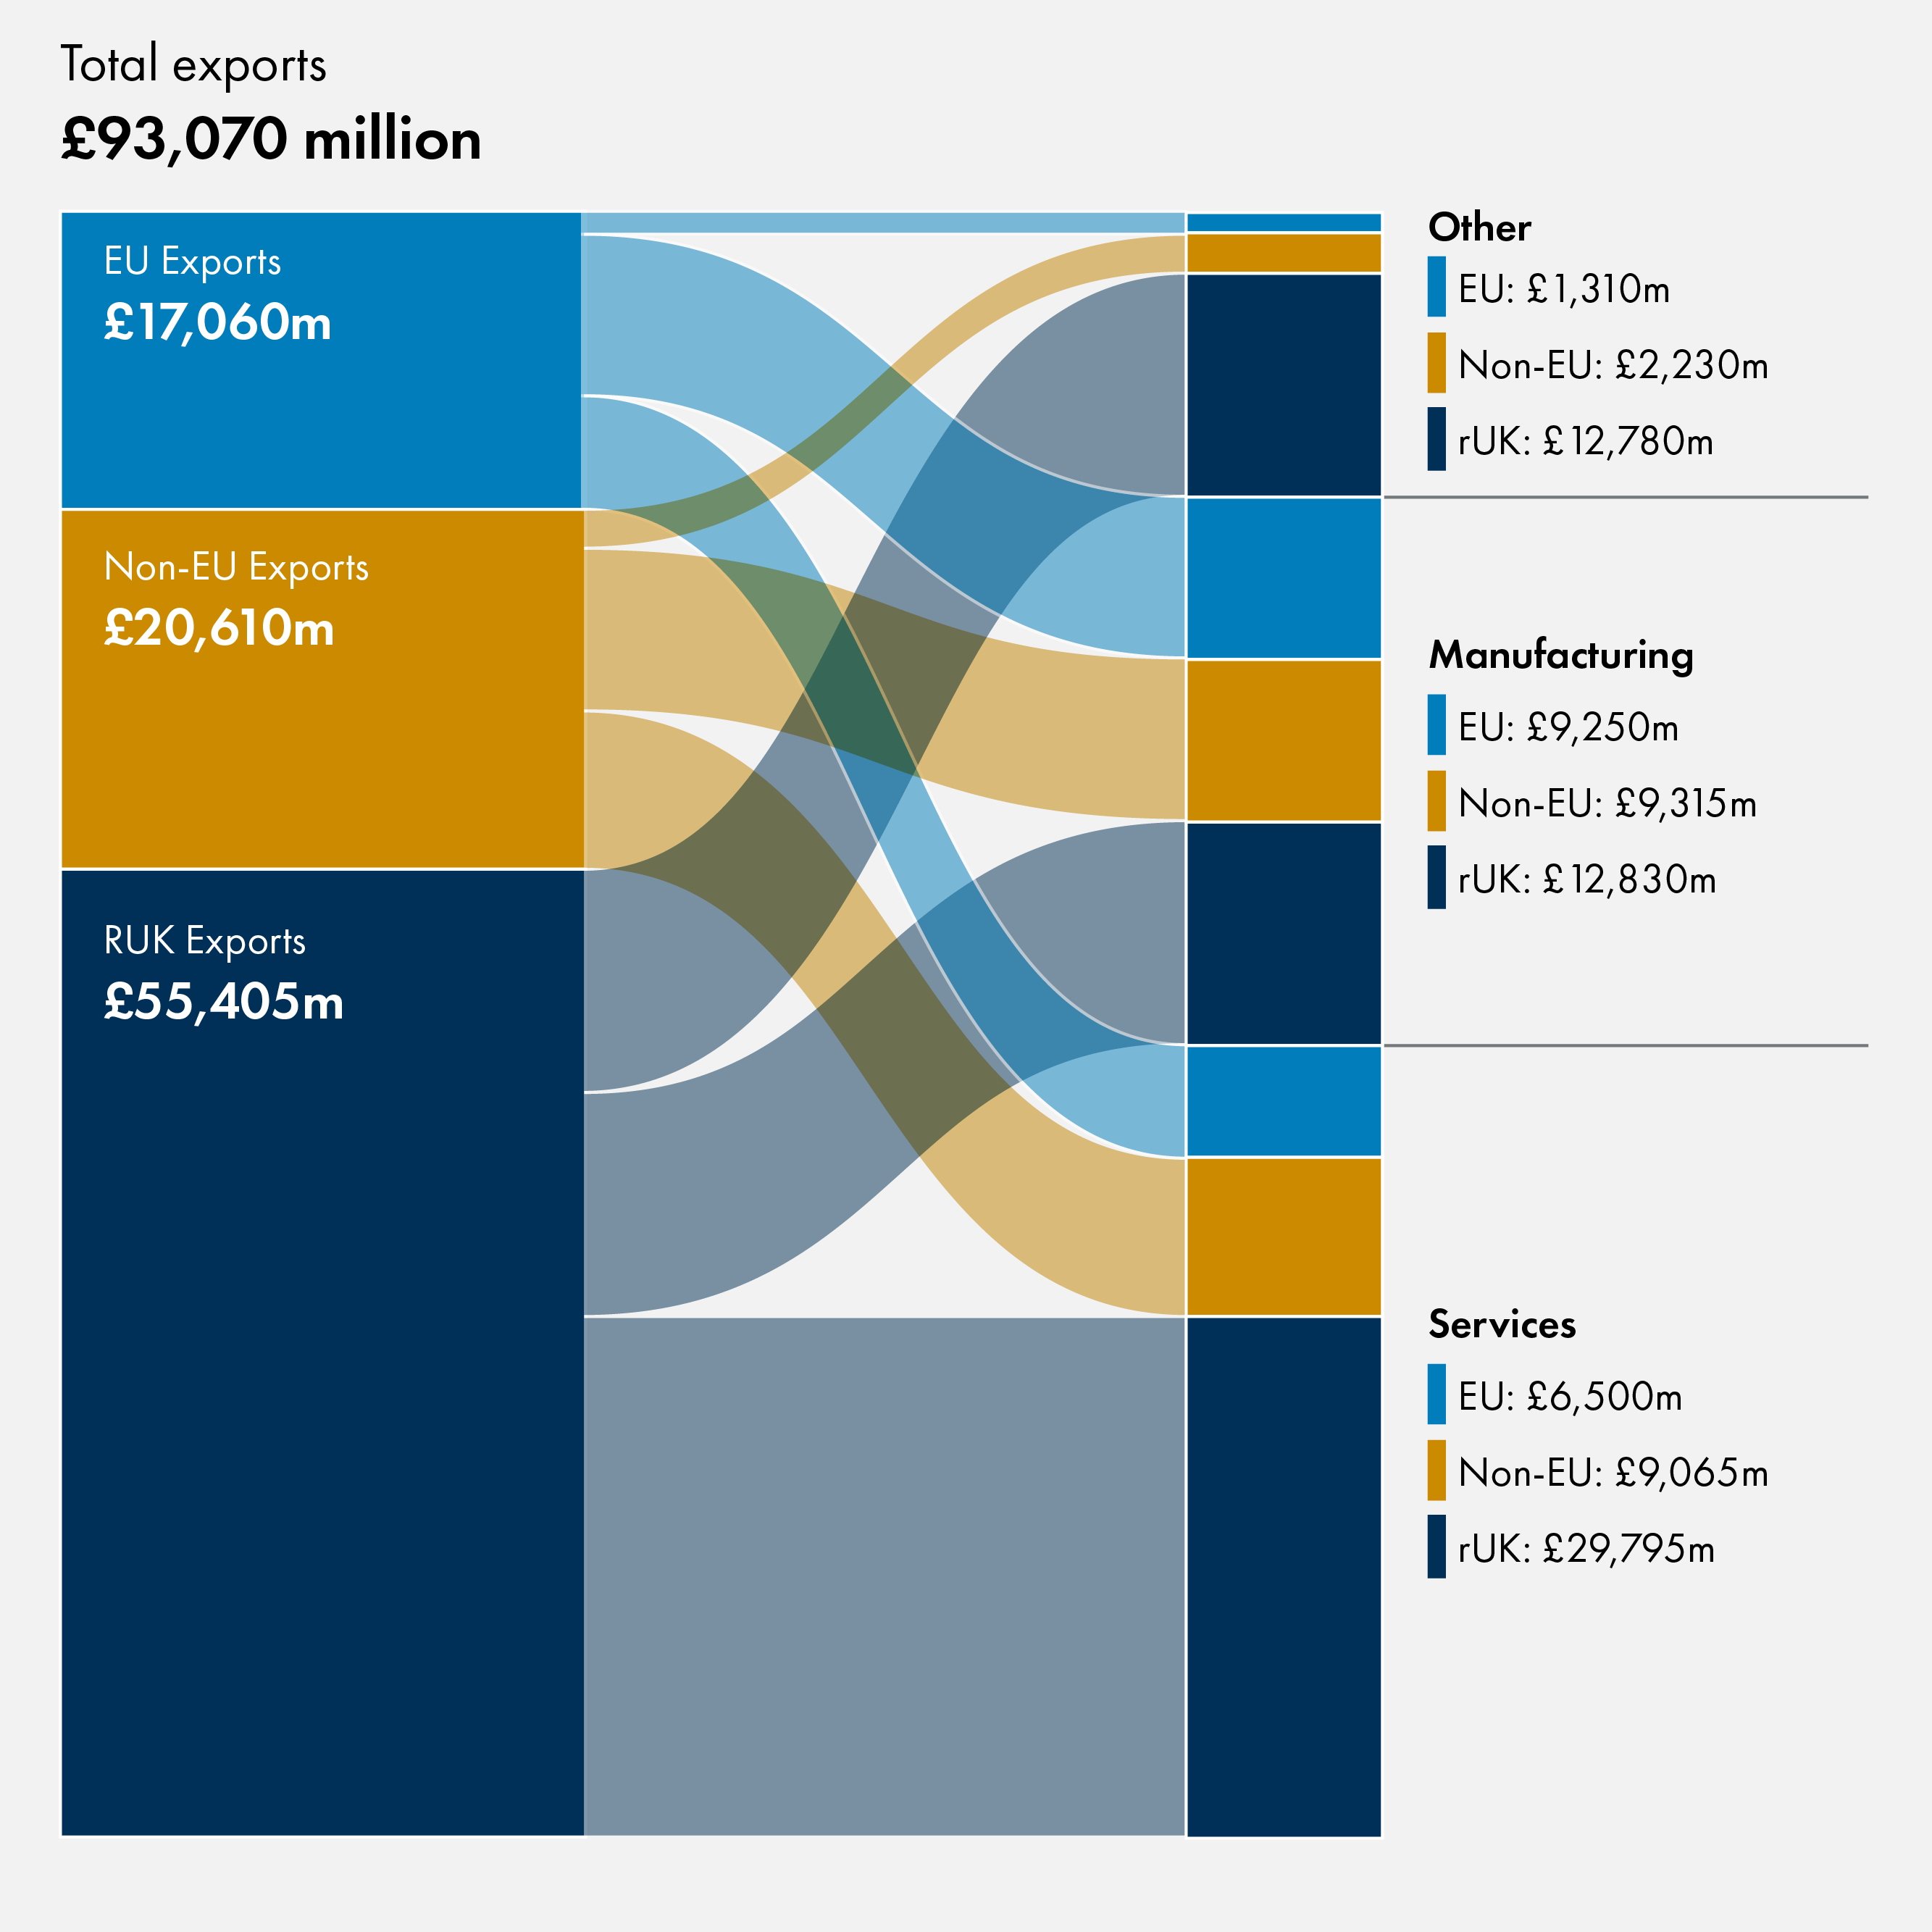
ESS provides a broad overview of Scotland's exports, covering goods, services and other exports such as utilities. It also provides detail of exports to the rest of the UK, to the European Union and to the rest of the world. The most recent publication, published in November 2025 set out data from 2008 to 2023. Figure 2 below sets out how the 2023 exports can be broken down by sector and destination.
Export Statistics Scotland 2023
In 2023 the total value of Scotland's exports was £93.1 billion, which is a fall of £3.3 billion (3.3%) compared to 2022 in cash terms. Adjusting for inflation, this is a reduction of 7%. Exports fell to the rest of the UK (rUK - down by 5.0% in cash terms), to the EU (down by 4.5% in cash terms), but exports to the rest of the world grew (increased by 2.4% in cash terms). Compared to 2019, prior to the UK's exit from the EU and the Covid-19 pandemic, total Scottish exports have increased by £12.9 billion (16%). However, there has been considerable inflation over this period. After accounting for inflation, Scottish exports have reduced by £2.0 billion in real terms between 2023 and 2019 (-2%).
Looking at the sectors, manufacturing exports in 2023 were worth £31.4 billion. This is an increase of £2.9 billion in cash terms (10%), but a fall of £2.4 billion in real terms (-7%).
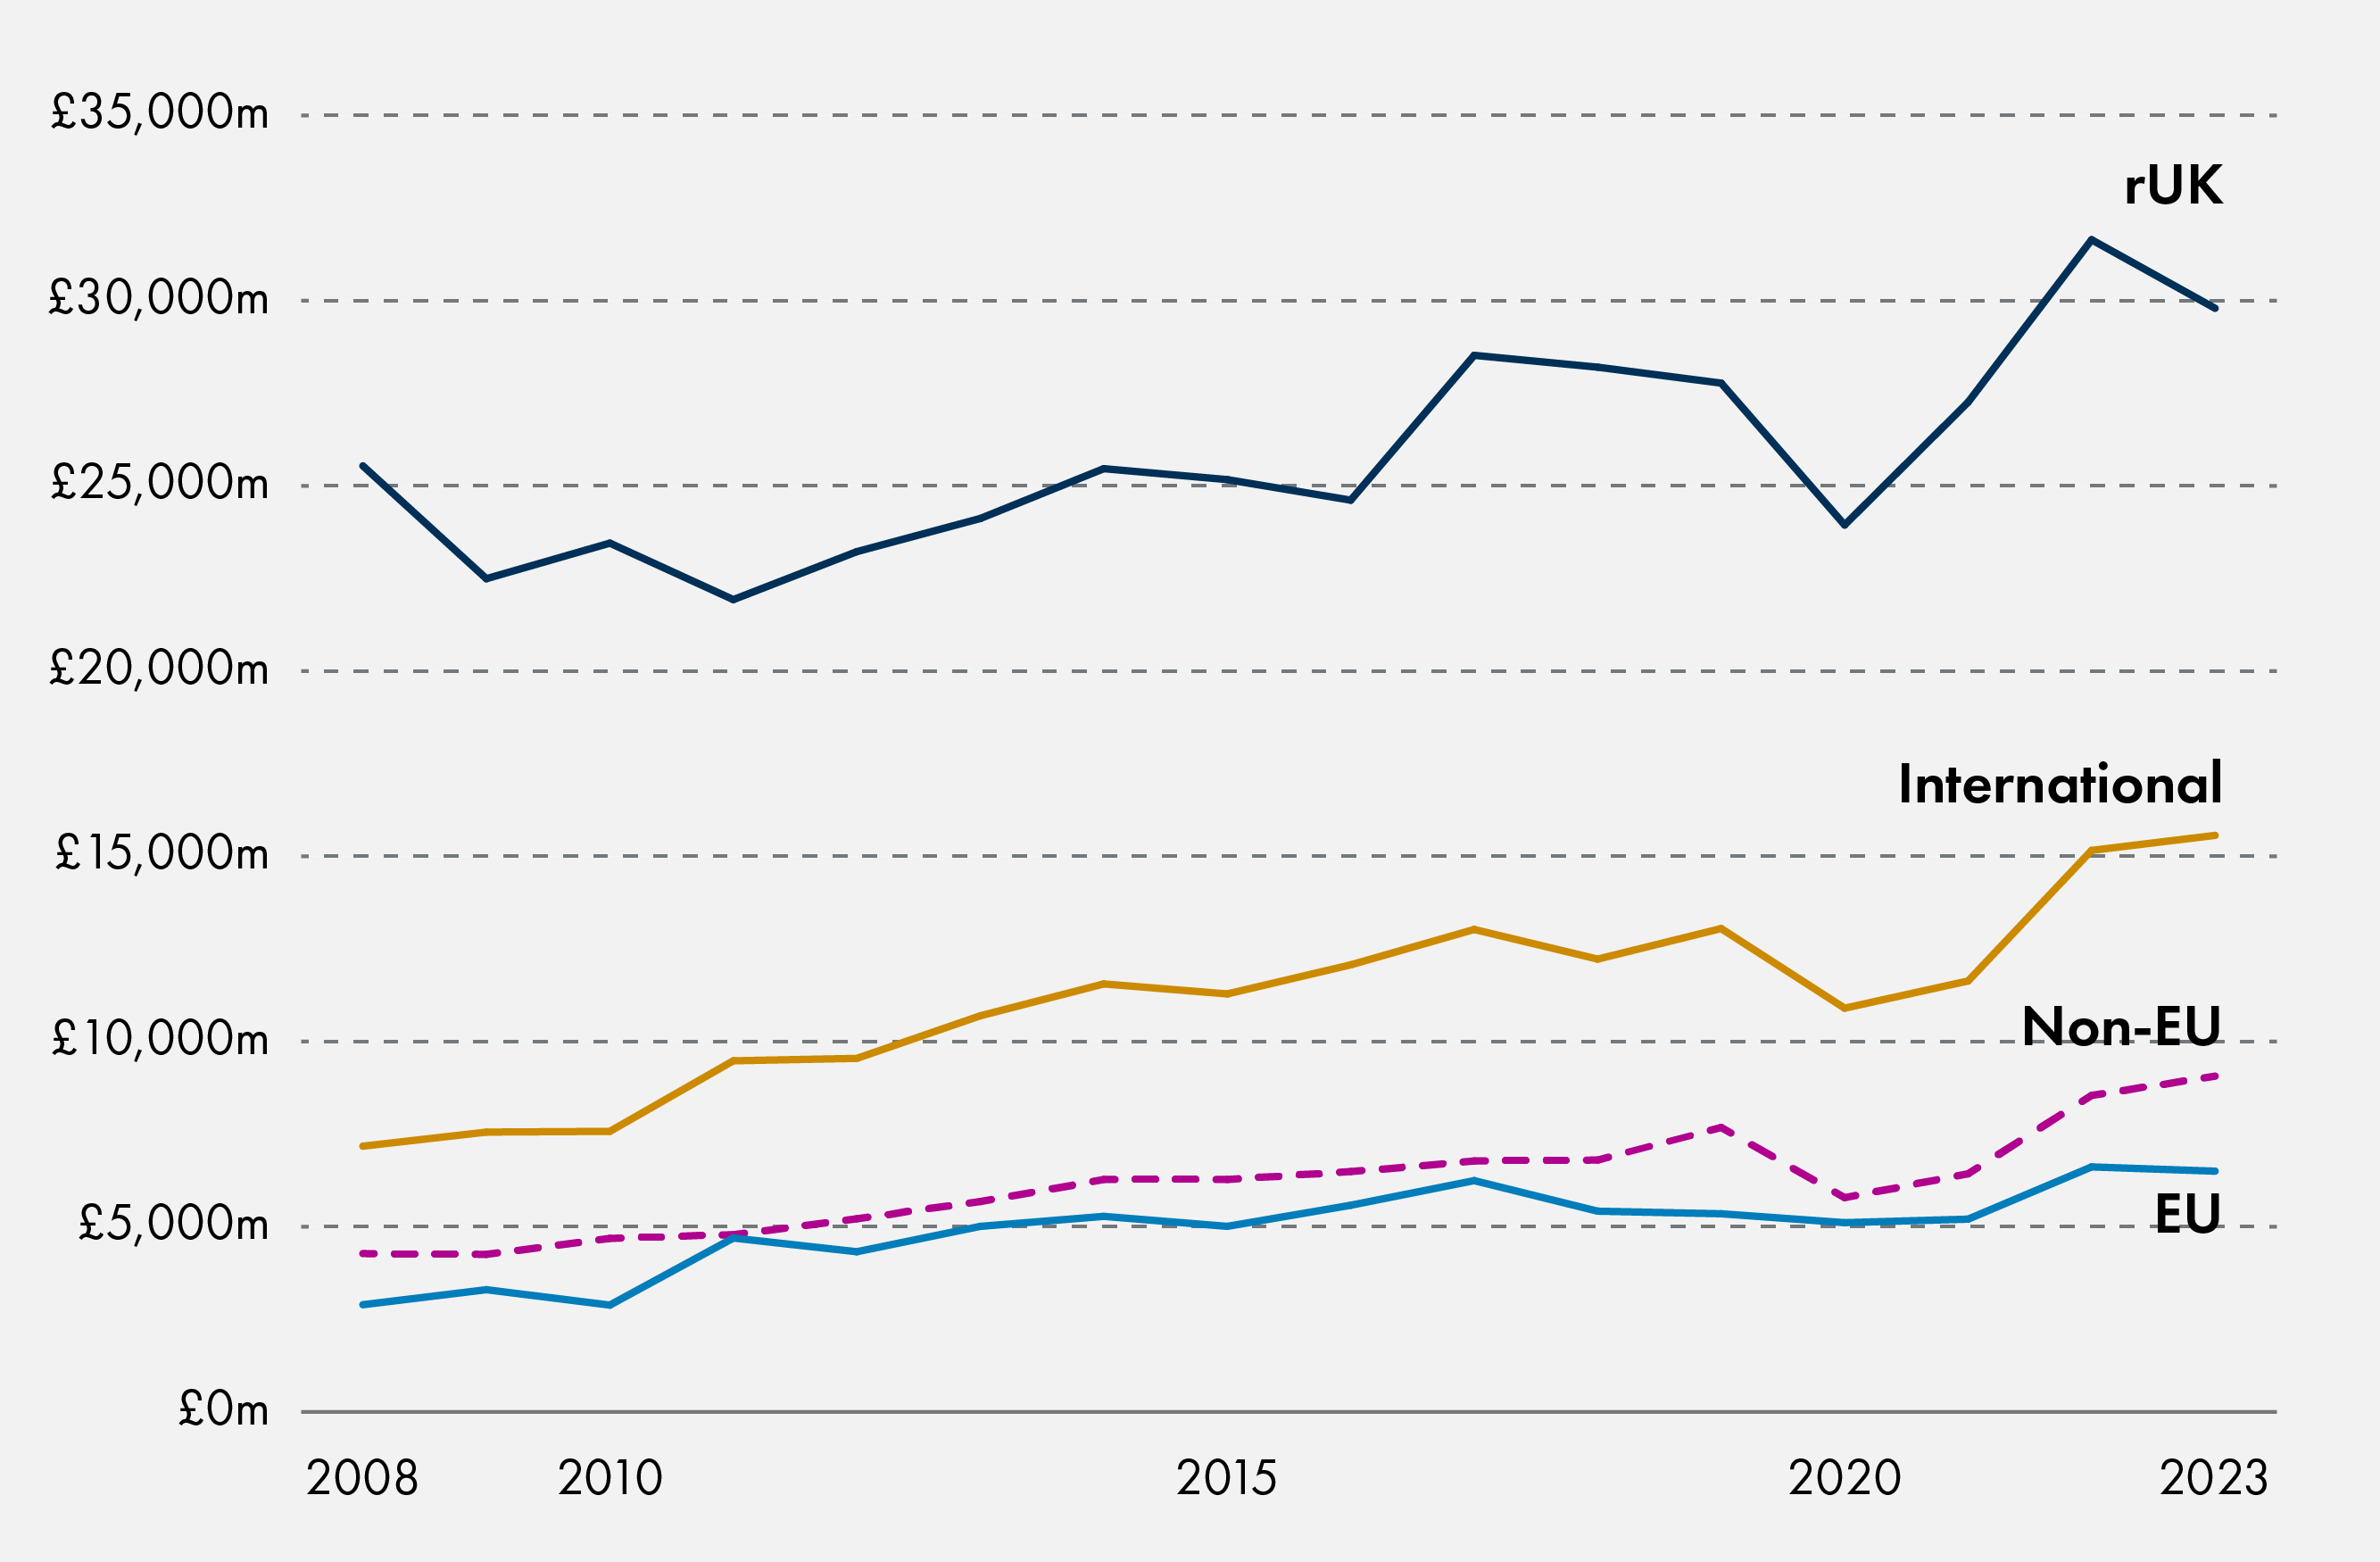
Exports of services were worth a total of £45.4 billion in 2023, accounting for 49% of all exports. Unlike manufacturing, these are predominately to the rest of the UK which accounted for 66% of service exports in 2023. Service exports to all destinations increased between 2019 and 2023; to the rUK by £2.0 billion (7%), to the EU by £1.2 billion (21.5%) and to the rest of the world by £1.4 billion (18%). Much of this recovery occurred in 2022.
As with exports of manufactured goods, calculating the real terms change presents a different picture. In real terms, total service exports are £3.1 billion lower in 2023 than in 2019 (-6%). This decline is almost entirely driven by a decline in the real terms value of service exports to the rUK, which have decreased by £3.2 billion between 2019 and 2023 (-10%)
Other exports (which include agriculture, mining, utilities and construction) were worth £16.3 billion in 2023, and grew by £5.5 billion (51%) since 2019 in cash terms. In real terms, other exports grew by £3.5 billion (27%) between 2019 and 2023. The rUK is the destination for the vast majority of other exports, accounting for 78% by value in 2023 and driving almost all the growth in value compared to 2019 (an increase of £4.5 billion, 20.4%).
Regional Trade Statistics
Overview: Regional Trade Statistics published by HMRC provides quarterly data on the value and mass of international exports from the UK, broken down by nation and region. The analysis is based on movement of goods based on the Standard International Trade Classification (SITC)
The Regional Trade Statistics (RTS), published by HM Revenue and Customs (HMRC), were developed to support the economic decision-making of the devolved administrations and other regional bodies within the UK. This quarterly publication gives detailed information on exports and imports, broken down by nation and region of the UK. It provides data on the value and mass of trade. However, it should be noted that it only provides information on trade in goods and does not cover trade in services.
The RTS data is based on HMRC’s Trade in Goods Statistics (TIGS) dataset. This data covers the UK’s international trade in goods disaggregated to country and product level based on trade declarations. The data is attributed to each UK region and nation based on the distribution of employees of a business across the UK.
Exports are classified using the Standard International Trade Classification (SITC) which is a standardised way of classifying goods. The groupings of SITC reflect:
the production materials
the processing stage
market practices and uses of the products
the importance of the goods in world trade
technological changes.
More information on the methodology can be found on HMRC's website.
ONS also publish sub-national experimental trade statistics, based on HMRC data, with estimates of the value of exports, imports and balance of goods for International Territorial Levels (ITLs) and city regions, broken down by industry and EU and non-EU split.
This section looks at data from the HMRC regional trade in goods statistics database. HMRC publish quarterly data around 10 weeks after the end of each three month period, and so is much more timely than Export Statistics Scotland (the latest data covers January to March 2026 and was published on 11 June 2026). However, the data covers only exports of goods internationally, and does not cover exports to the rest of the UK. There are some definitional differences between these two sources which are discussed in a later section.
HMRC provide data in terms of value of exports, and also in terms of mass of exports which allows us to account for price differences and inflation.
HMRC Regional Trade Statistics
The total mass of goods exports from Scotland peaked in 2019-20; by 2025-26 the total mass of Scottish exports had reduced by 42.6% compared with this peak. As the chart above shows the mass of both EU and non-EU exports have fallen, but the fall of non-EU exports has been more significant. These increased rapidly in 2019-20 then fell significantly, and in 2025-26 were 75% below their 2019-20 peak. The mass of EU exports decreased by 26.1% in the same period.
It's worth noting that the mass of exports increased rapidly in the years leading to 2019-20; between 2016-17 and 2019-20 the total mass of exports increased by 26.6%. As with the decline since 2019-20, this increase was largely driven by non-EU exports which grew by 58.3% between 2016-17 and 2019-20.
The value of Scottish goods exports peaked in 2022-23 with total exports worth £37.3 billion, an increase of 45% since 2016-17 in nominal terms. However, adjusting for inflation, this was an increase of 23% as shown in Figure 4 above.
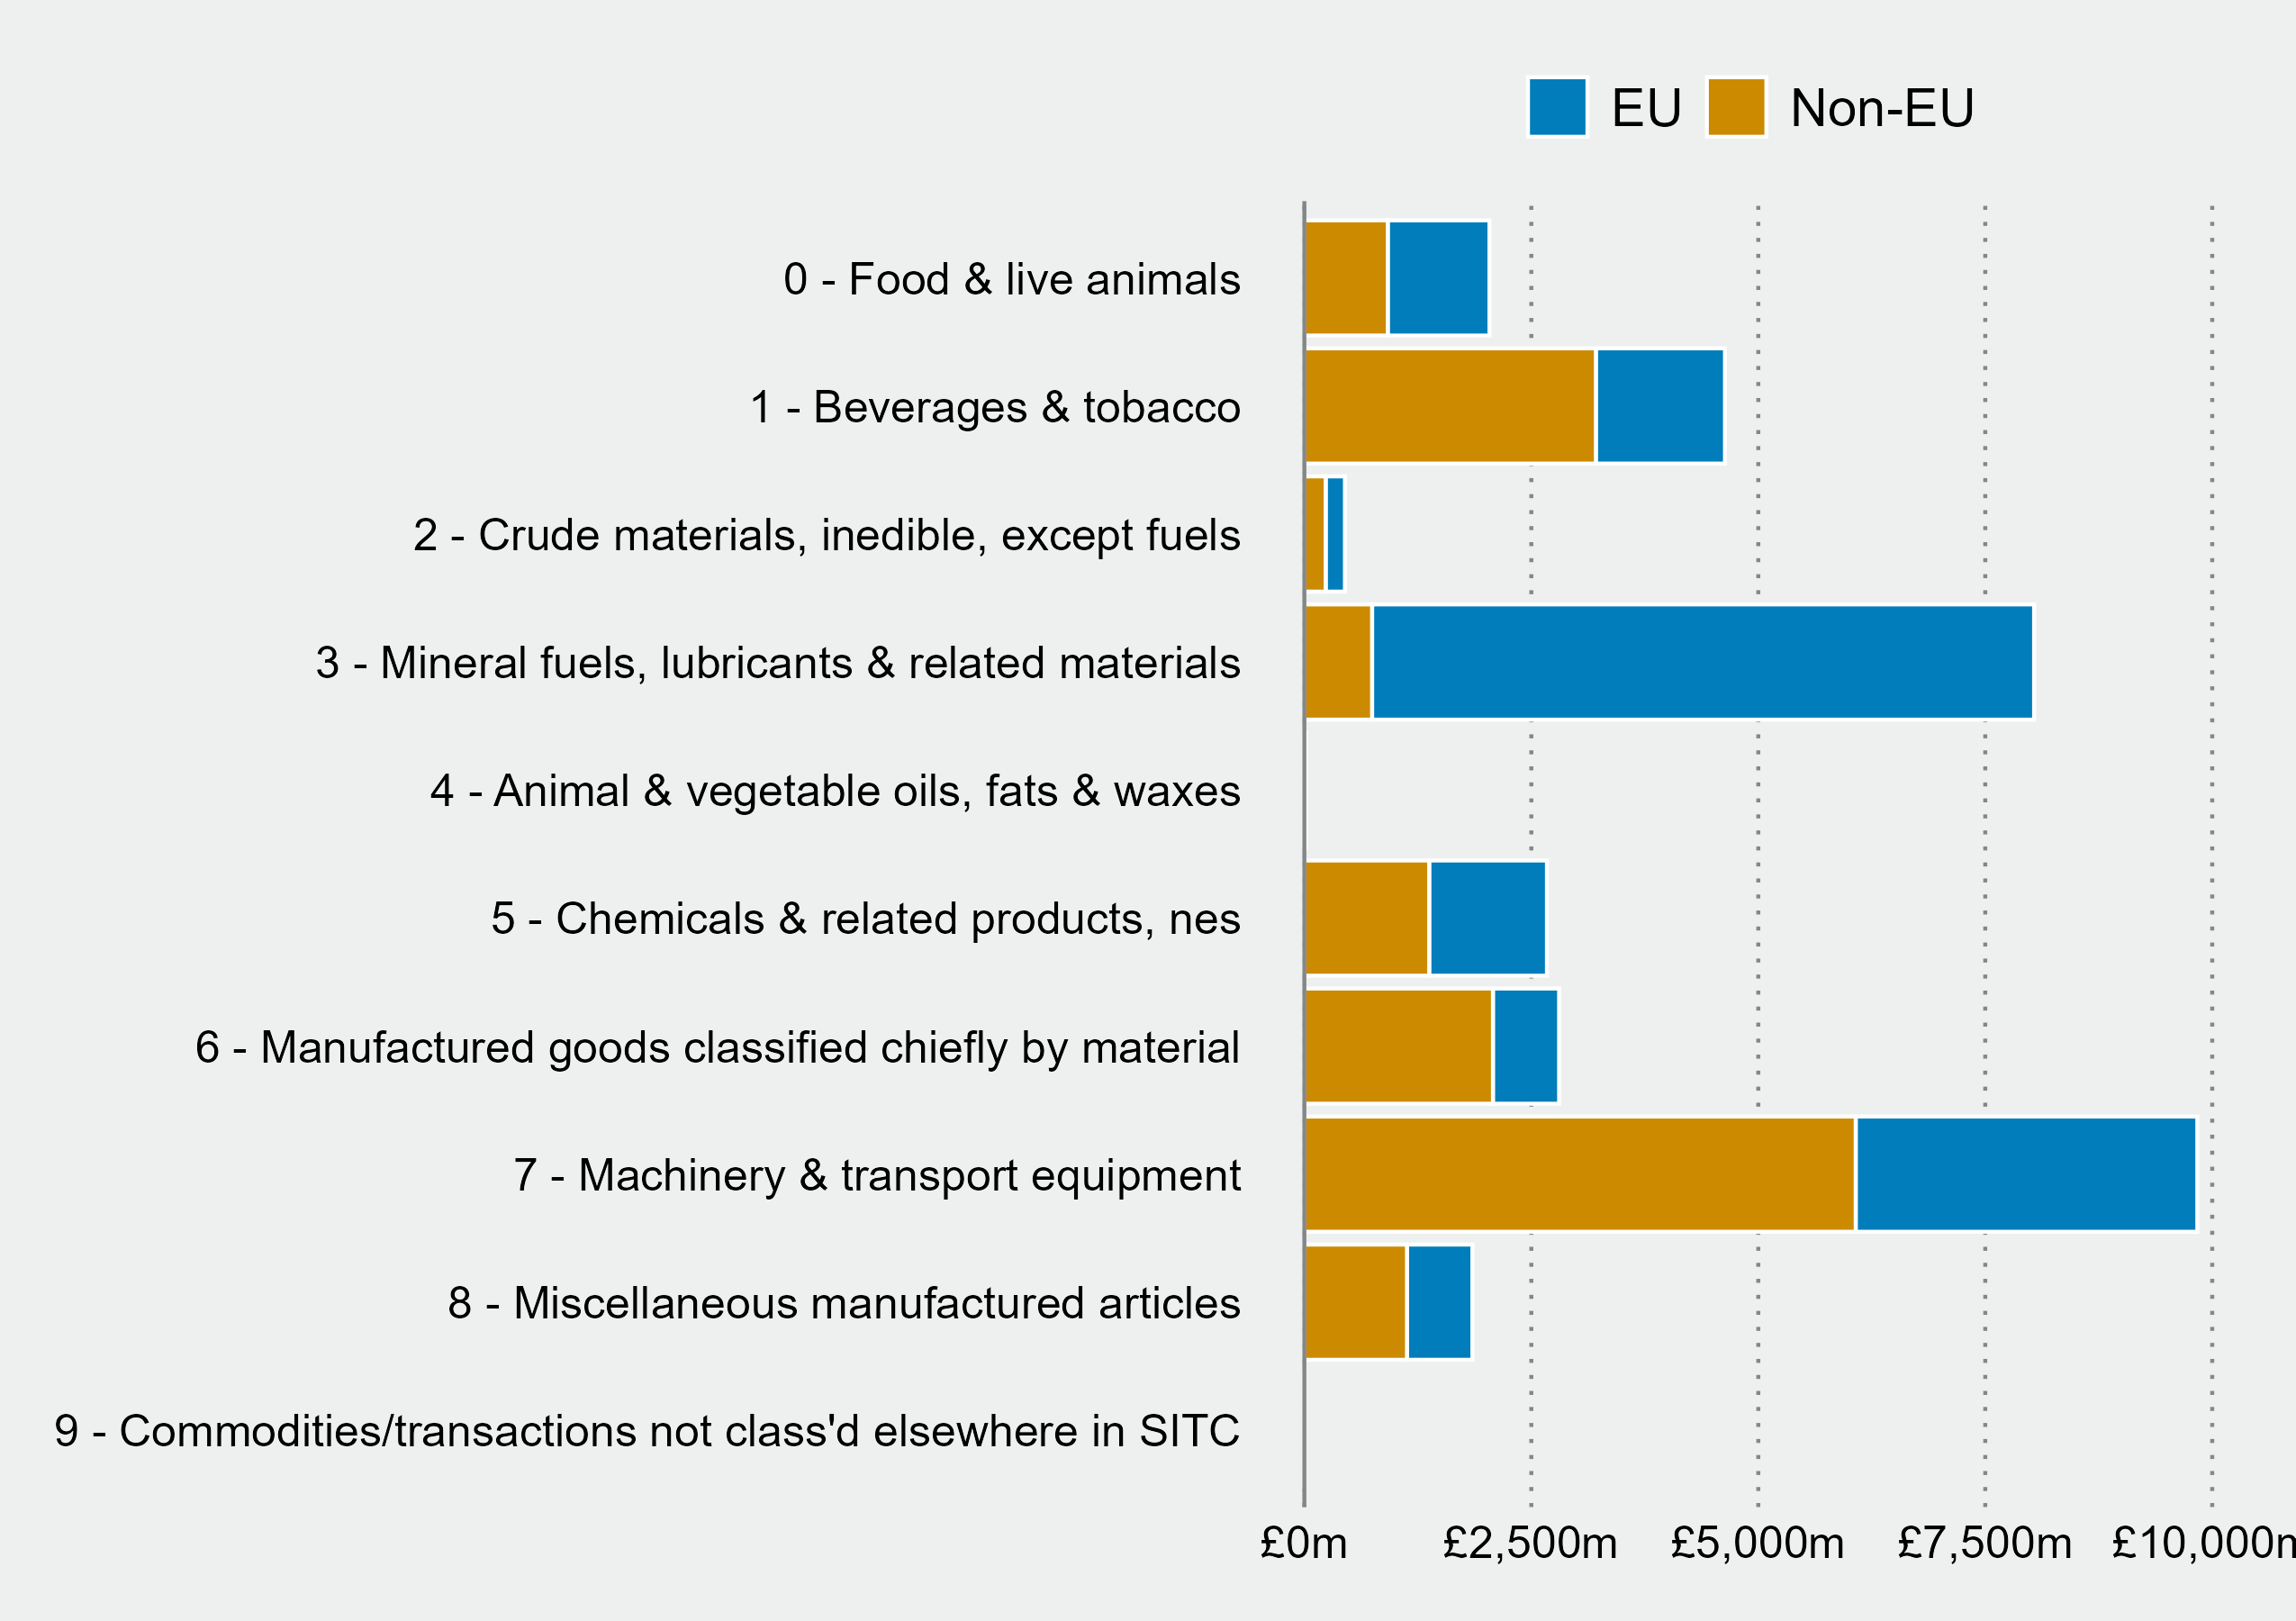
Figure 5 below sets out the main sectors of goods exports, showing the proportion of goods going to the EU or the rest of the world.
HMRC Regional Trade Statistics
How do Scottish exports compare to the rest of the UK?
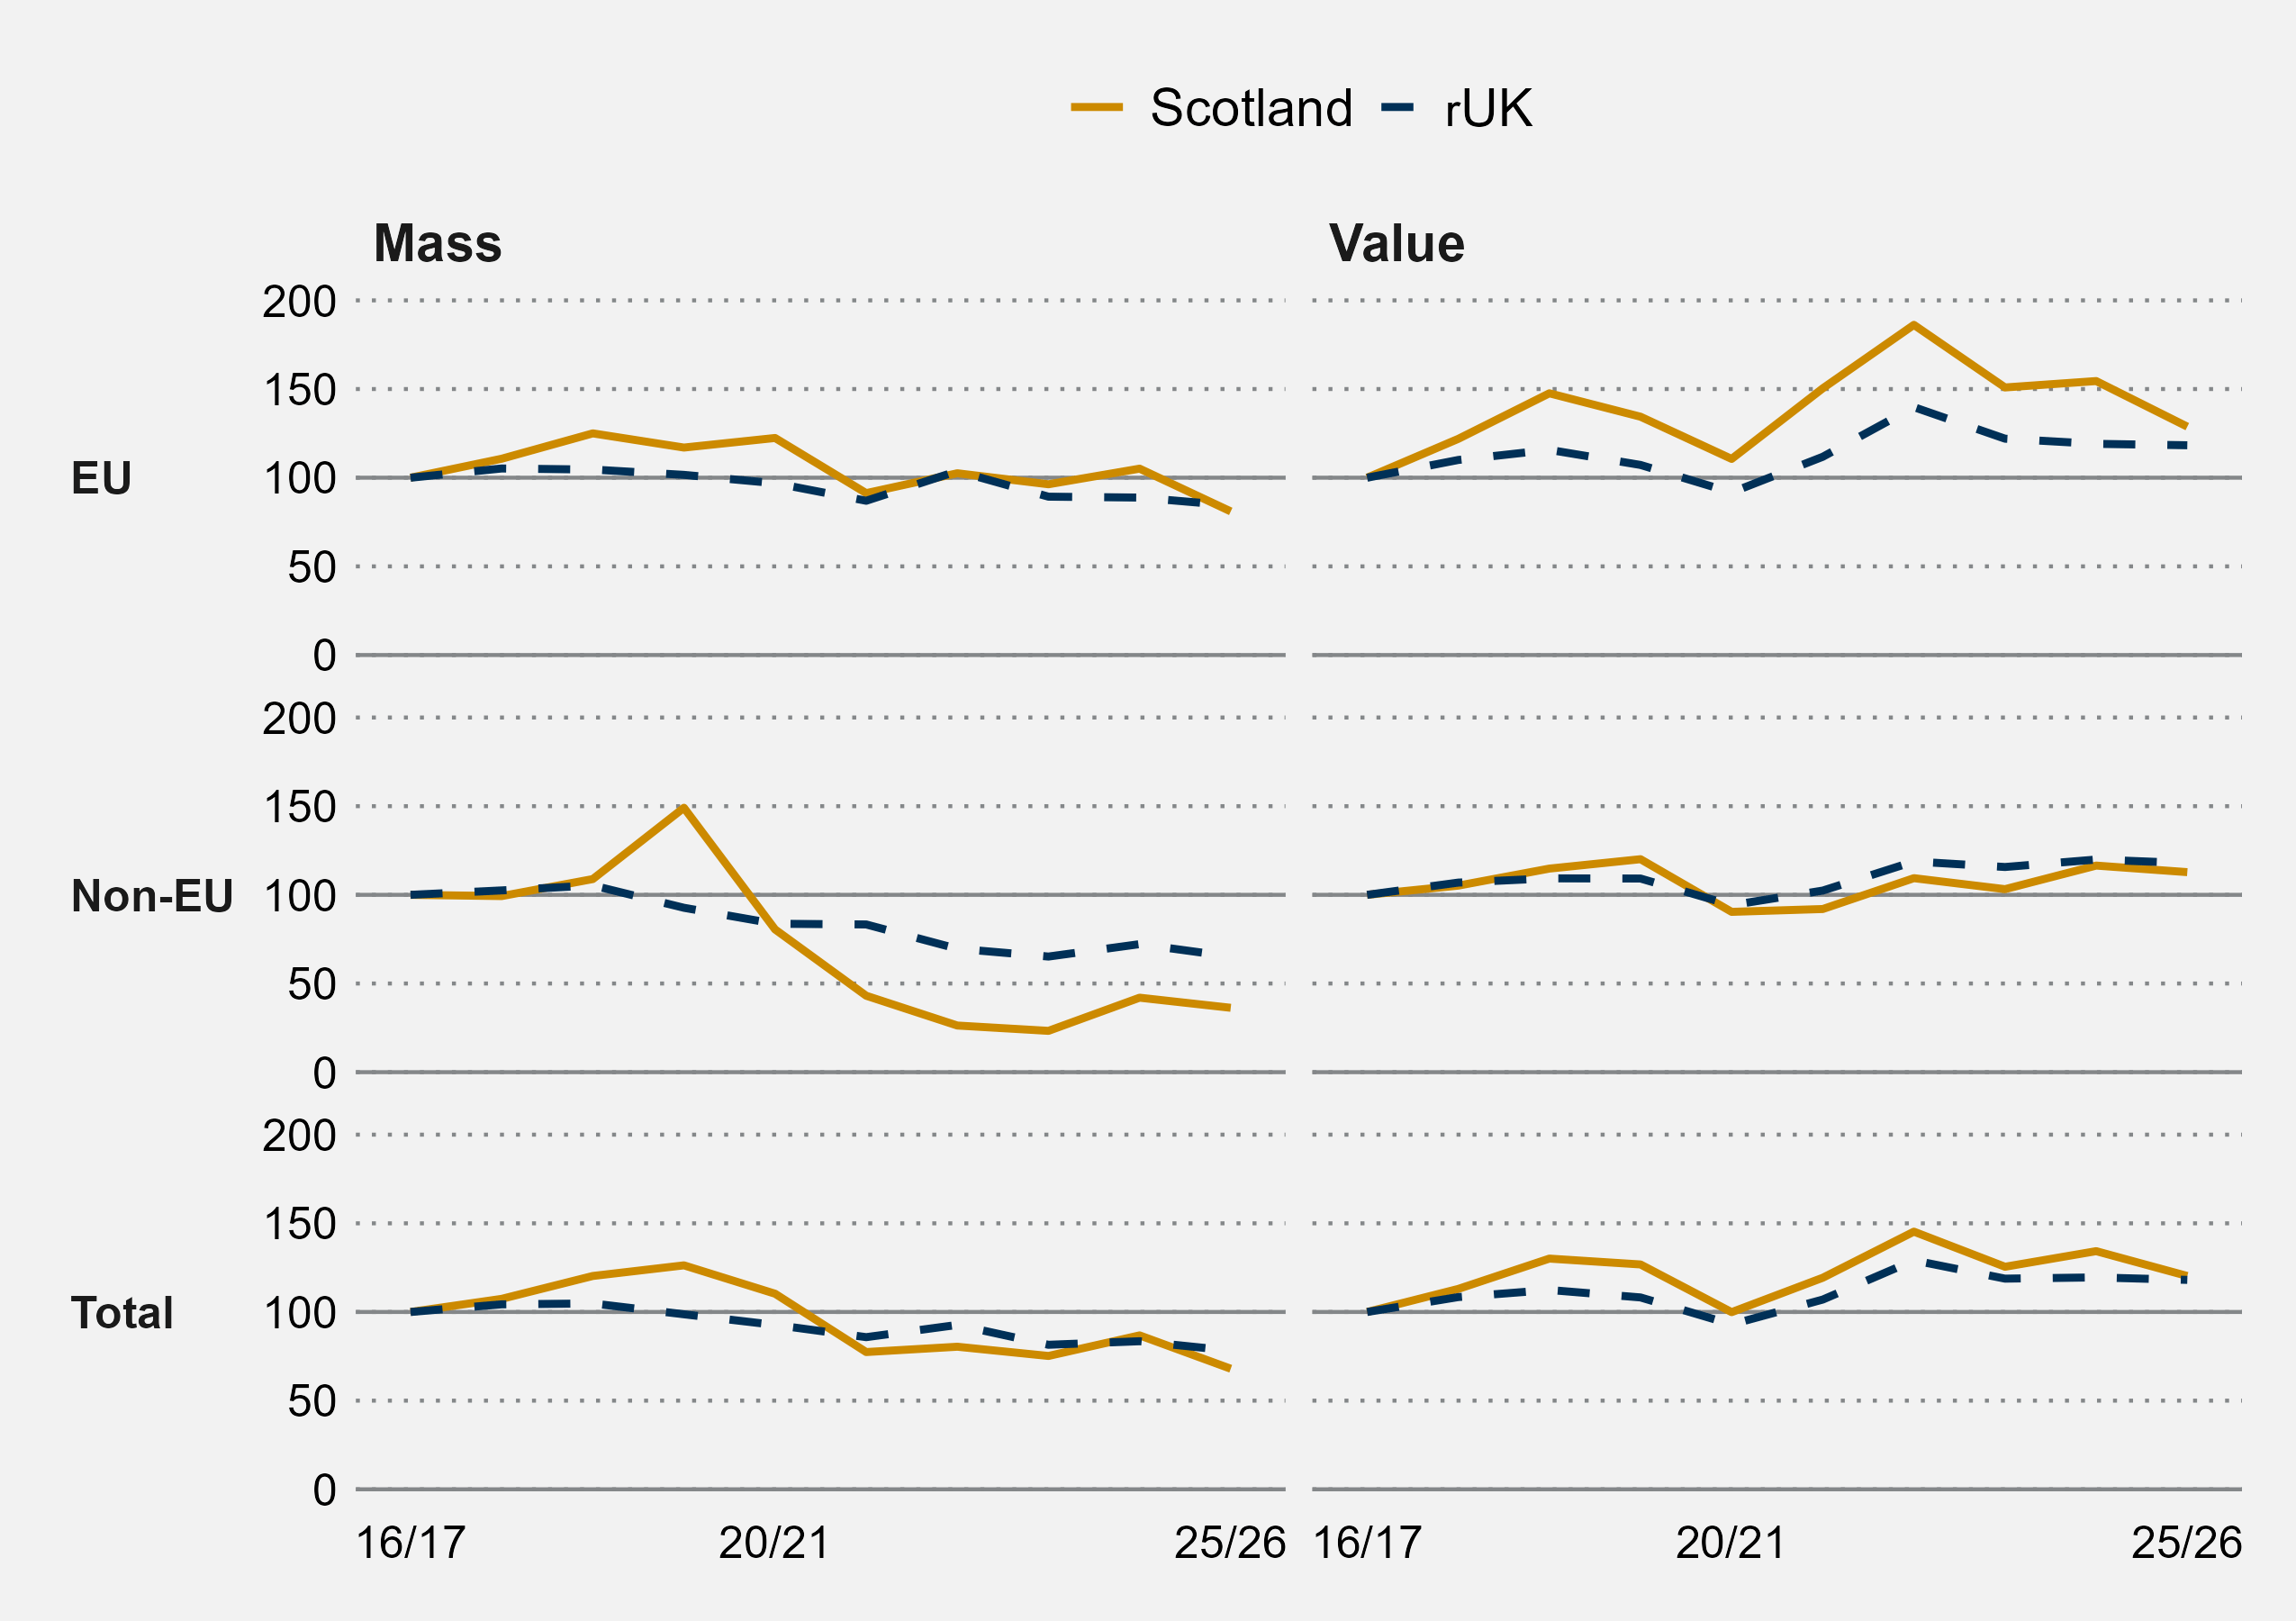
The RTS data allows a user to break the data down by UK region, so we have compared Scotland and the rest of the UK (UK excluding Scotland). Overall, the value of exports from Scotland has reduced by 11.5% since 2016-17 in real terms. Exports from the rest of the UK have fallen by 13.2% over the same period. Figure 6 below shows the change in mass and real terms value of Scotland and the rUK exports since 2016-17.
HMRC Regional Trade Statistics
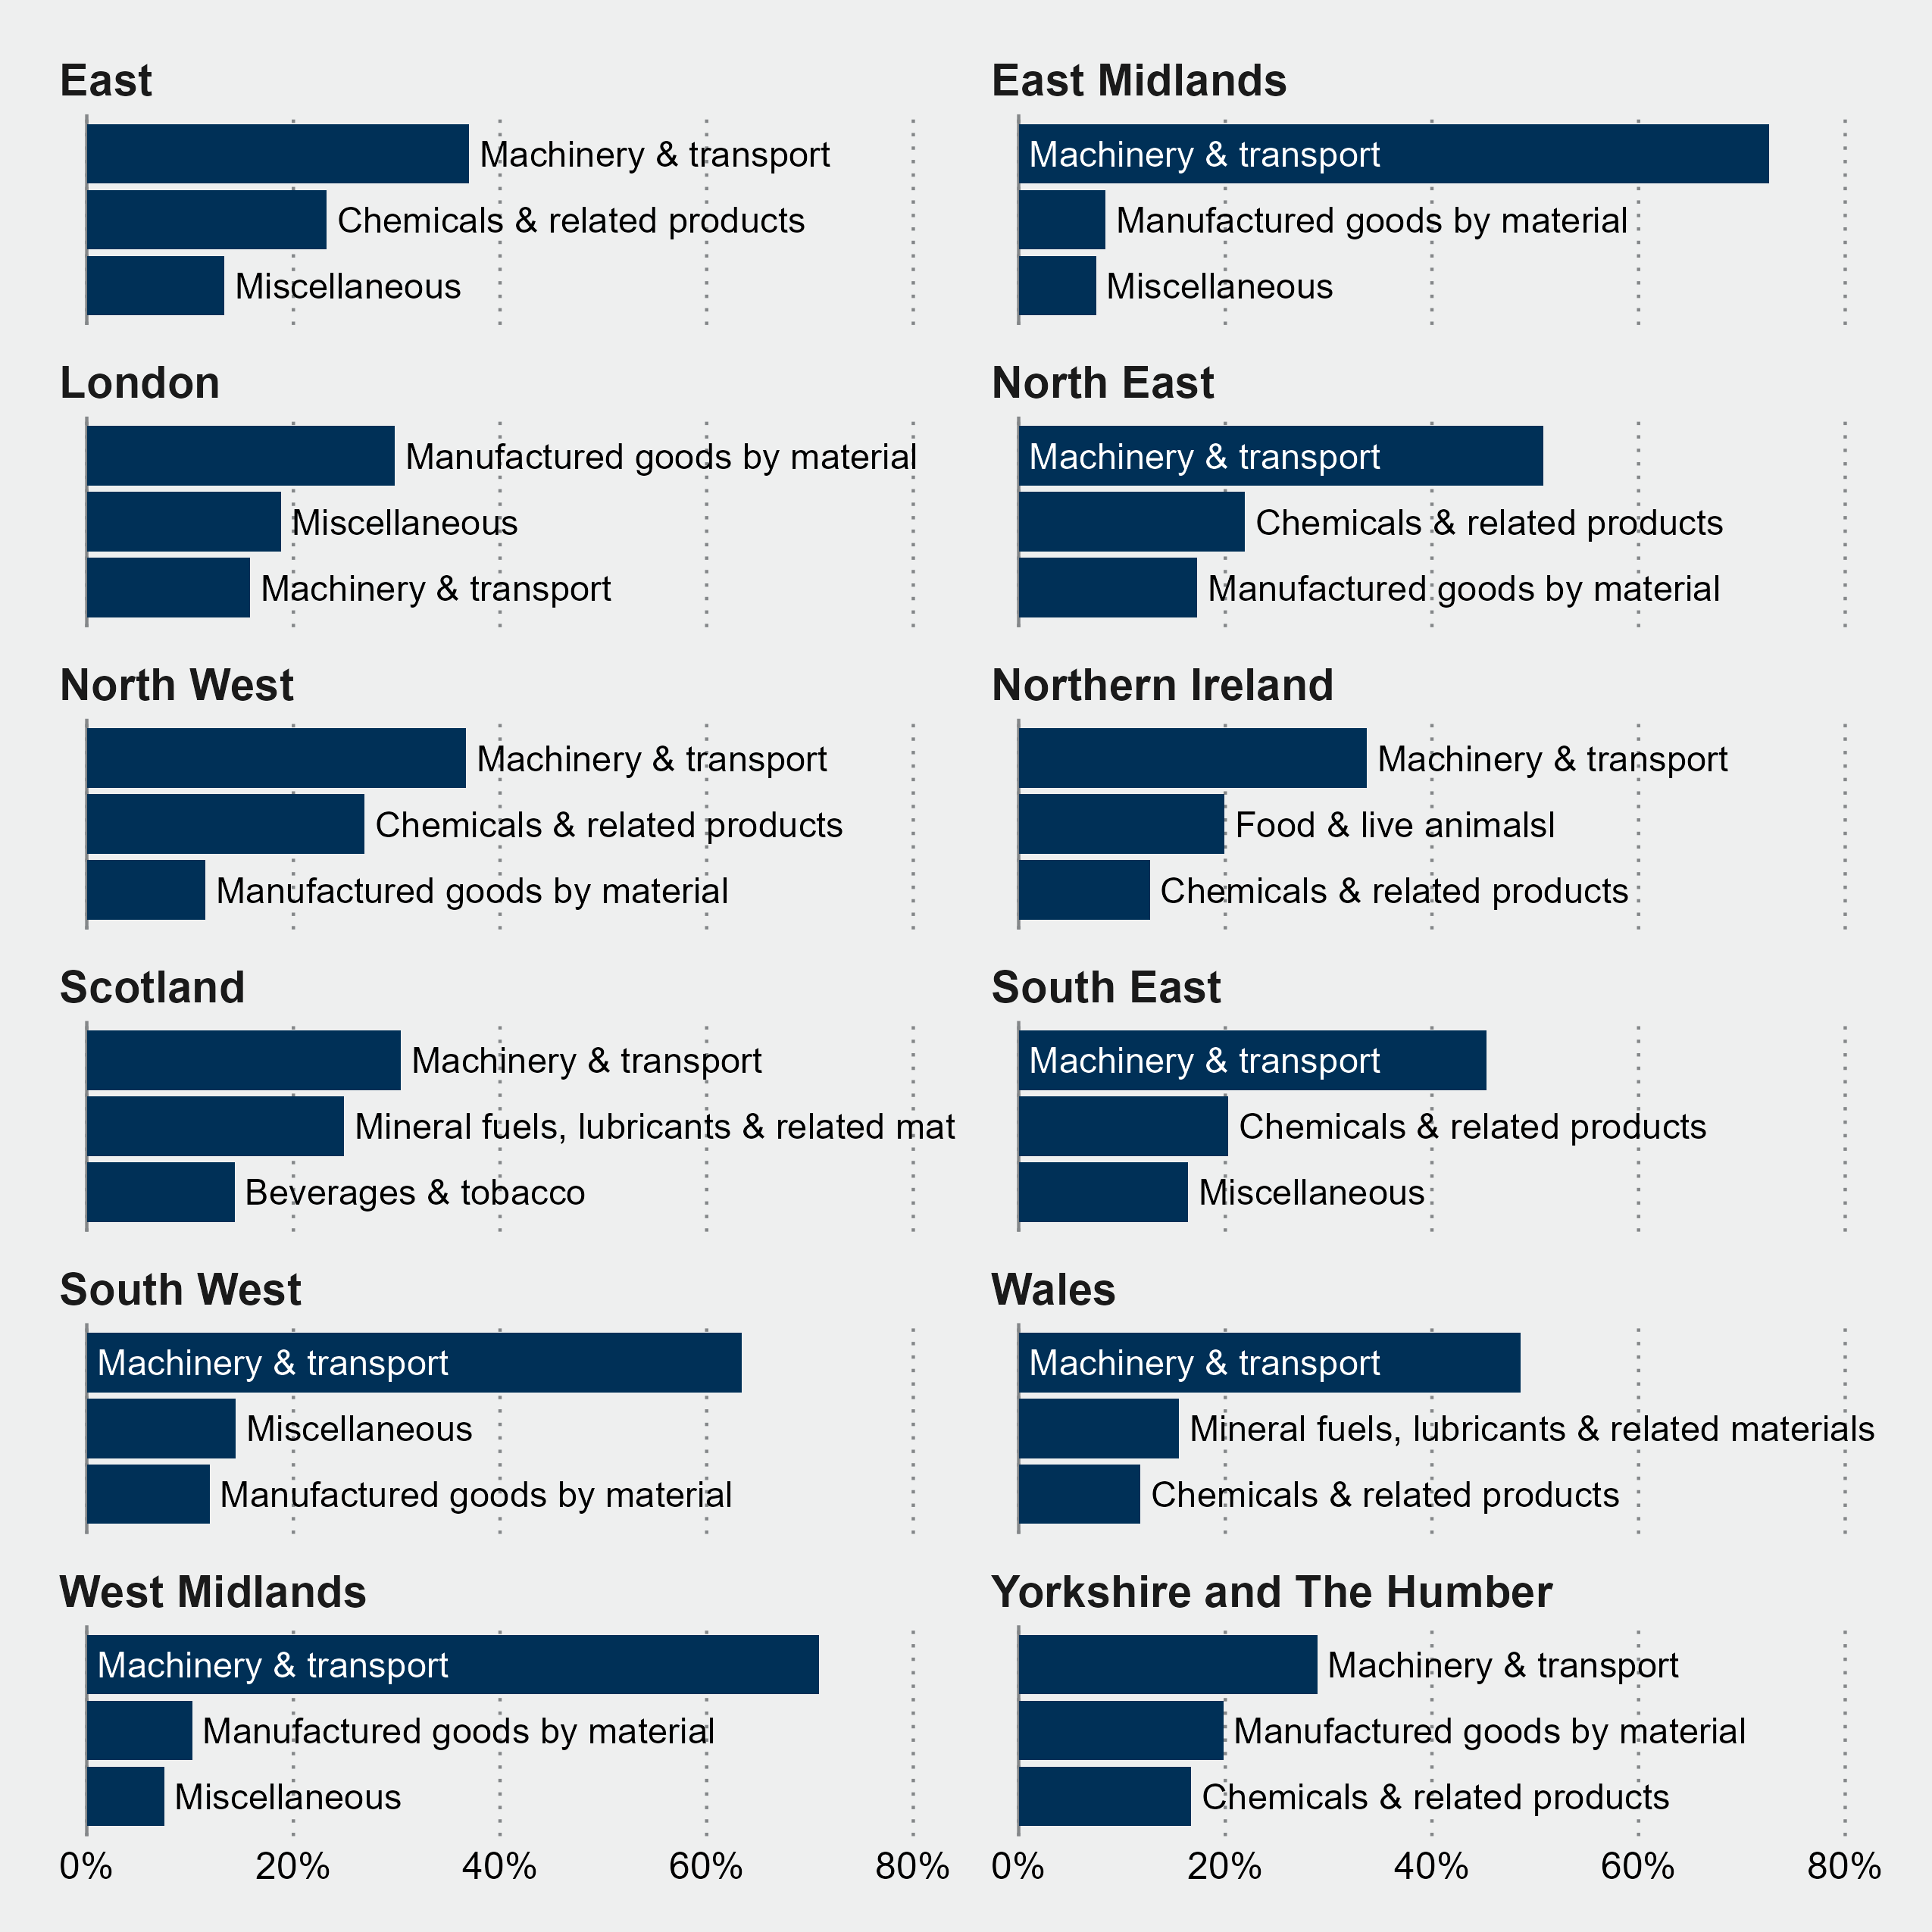
We can also compare the types of exports from Scotland, and other nations and regions in the UK. Across the UK, all regions apart from London have machinery and transport as their largest broad commodity group by value in 2025-26. Scotland is the only nation or region where exports of beverages and tobacco are within the top three by value.
HMRC Regional Trade Statistics
Other data sources
Aside from the main data sources described earlier in this briefing, there are other sources that users may wish to consider.
The Scottish Quarterly National Accounts (QNAS)
The Scottish Quarterly National Accounts (QNAS) produced by the Scottish Government provide estimates of Scotland's exports on a balance of payments basis. This means that exports are counted when there has been a change in economic ownership - where all risk, rewards, and rights and responsibilities of ownership are transferred. In most cases, a change in economic ownership will happen at the same time as a change in legal ownership, but there are some exceptions such as some transactions involving leases1. The series provides the total value of exports of goods and services to the rest of the UK and to the rest of the world annually and quarterly, as well as imports from the rest of the UK and the rest of the world. Further information is available on the Quarterly National Accounts website.
The Scottish Government also publish Quarterly energy statistics Scotland. The Q4 publications include a summary of Scotland's imports and exports of electricity.
Office for the Internal Market (OIM)
The Office for the Internal Market (OIM) is part of the Competition and Markets Authority (CMA). The OIM independently advises the UK Government and the devolved administrations on how specific laws, rules and regulations impact the UK Internal Market and reports on how well it is working.
The OIM has published plans which note that the ONS is planning to produce experimental estimates for interregional trade covering all four UK nations in 2024. The ONS published a methodology for producing these experimental statistics in July 2023.
The ONS published Interregional trade in goods and services on 10 February 2025, covering the years 2019 and 2020. The OIM used this data in its 2025-26 annual report, as part of its assessment of developments in the UK internal market.
Comparability of data sources
Looking across different sources, there are differences in how trade value is attributed to Scotland. HMRC Regional Trade Statistics begins with a trade value for the UK, and then apportions trade to Scotland using the proportion of employees in each region of the UK. In contrast, ESS finds businesses that have economic activity in Scotland, based on Scottish local units from the Inter-Departmental Business Register (IDBR), and then estimates the export activity of these Scottish companies.
| Measure | RTS | ESS |
|---|---|---|
| Value | Y | Y |
| Mass | Y | N |
| Goods | Y | Y |
| Services | N | Y |
| Frequency | Quarterly | Every two years |
| Lag | 10 weeks after end of quarter | Approx 2 years |
The policy approach
While responsibility for negotiating international agreements, including trade deals, is reserved, the Scottish Government has a number of strategies which aim to support firms exporting. This section will look at the policy context both before and after the UK's exit from the European Union.
The Trade Board was established in 2017 to support the then trade and investment strategy. It has met between 2 and 4 times per year. Its remit is to provide the Scottish Government with advice to support the International Trade and Investment Directorate, provide insights on the trading situation for key Scottish sectors, and promote the benefits of exporting to businesses.
In 2022 the membership of the board was updated to reflect the priority sectors identified in the Trading Nation strategy.
The most recent membership was:
ABC Bank
Proserv
Scottish Business Network
University of Strathclyde
Nova Innovation
Verlume
Fios Genomic
Summerhall Distillery Ltd
Scottish Engineering
IQVIA
DirectID
Scotland Food and Drink
Following the 2026 election, the group is listed as no longer active, with the most recent minutes being from February 2026.
Scottish Government export growth strategy
On 1 May 2019 the Scottish Government published ‘A Trading Nation – a plan for growing Scotland's exports’. This plan set a headline target of growing exports from 20% to 25% of GDP over ten years.
The Scottish Government described ‘A Trading Nation’ as the most detailed examination of Scotland's international exports ever undertaken by the Scottish Government, and at 230 pages it is certainly comprehensive. In preparing the strategy, the Scottish Government posed four key questions;
What are the export strengths we should promote?
Where should we promote these strengths and when should we step up our presence in these markets?
Who should we work with most intensively to boost out export performance?
How do we best configure government and wider support to deliver export goals?
To explore and answer these questions, the plan was put together with engagement from over 30 organisations including the UK Directorate for International Trade (DIT), the Scottish Council for Development and Industry, Chambers of Commerce, the Confederation of British Industry Scotland, the Institute of Directors, the Federation of Small Business, Universities Scotland and the Fraser of Allander Institute.
In contrast to the previous exports strategy, ‘A Trading Nation’ focused resources on countries and sectors which it stated were most likely to deliver the largest, most sustainable contributions to Scotland's economic growth.
The plan included several actions which the Scottish Government and agencies would aim to undertake to achieve the strategy's aims.
Analyse key markets – USA and China – at sub-nation level.
Build on existing academic links in the advanced technology sector to create significant Scottish presence in those markets.
In contrast to traditional export promotion activities (focused on a specific sectoral trade mission), opportunity to pioneer a new approach of identifying specific challenges in target markets and positioning a strategic cross sectoral offering.
Undertake analysis of the sub-sector economic impact – ie how exports in one sector will increase GDP in Scotland.
Given the uncertain political context, it was very likely that the conditions of trade with the countries and sectors identified in the plan would change over time, and there was a commitment to keep the plan under review.
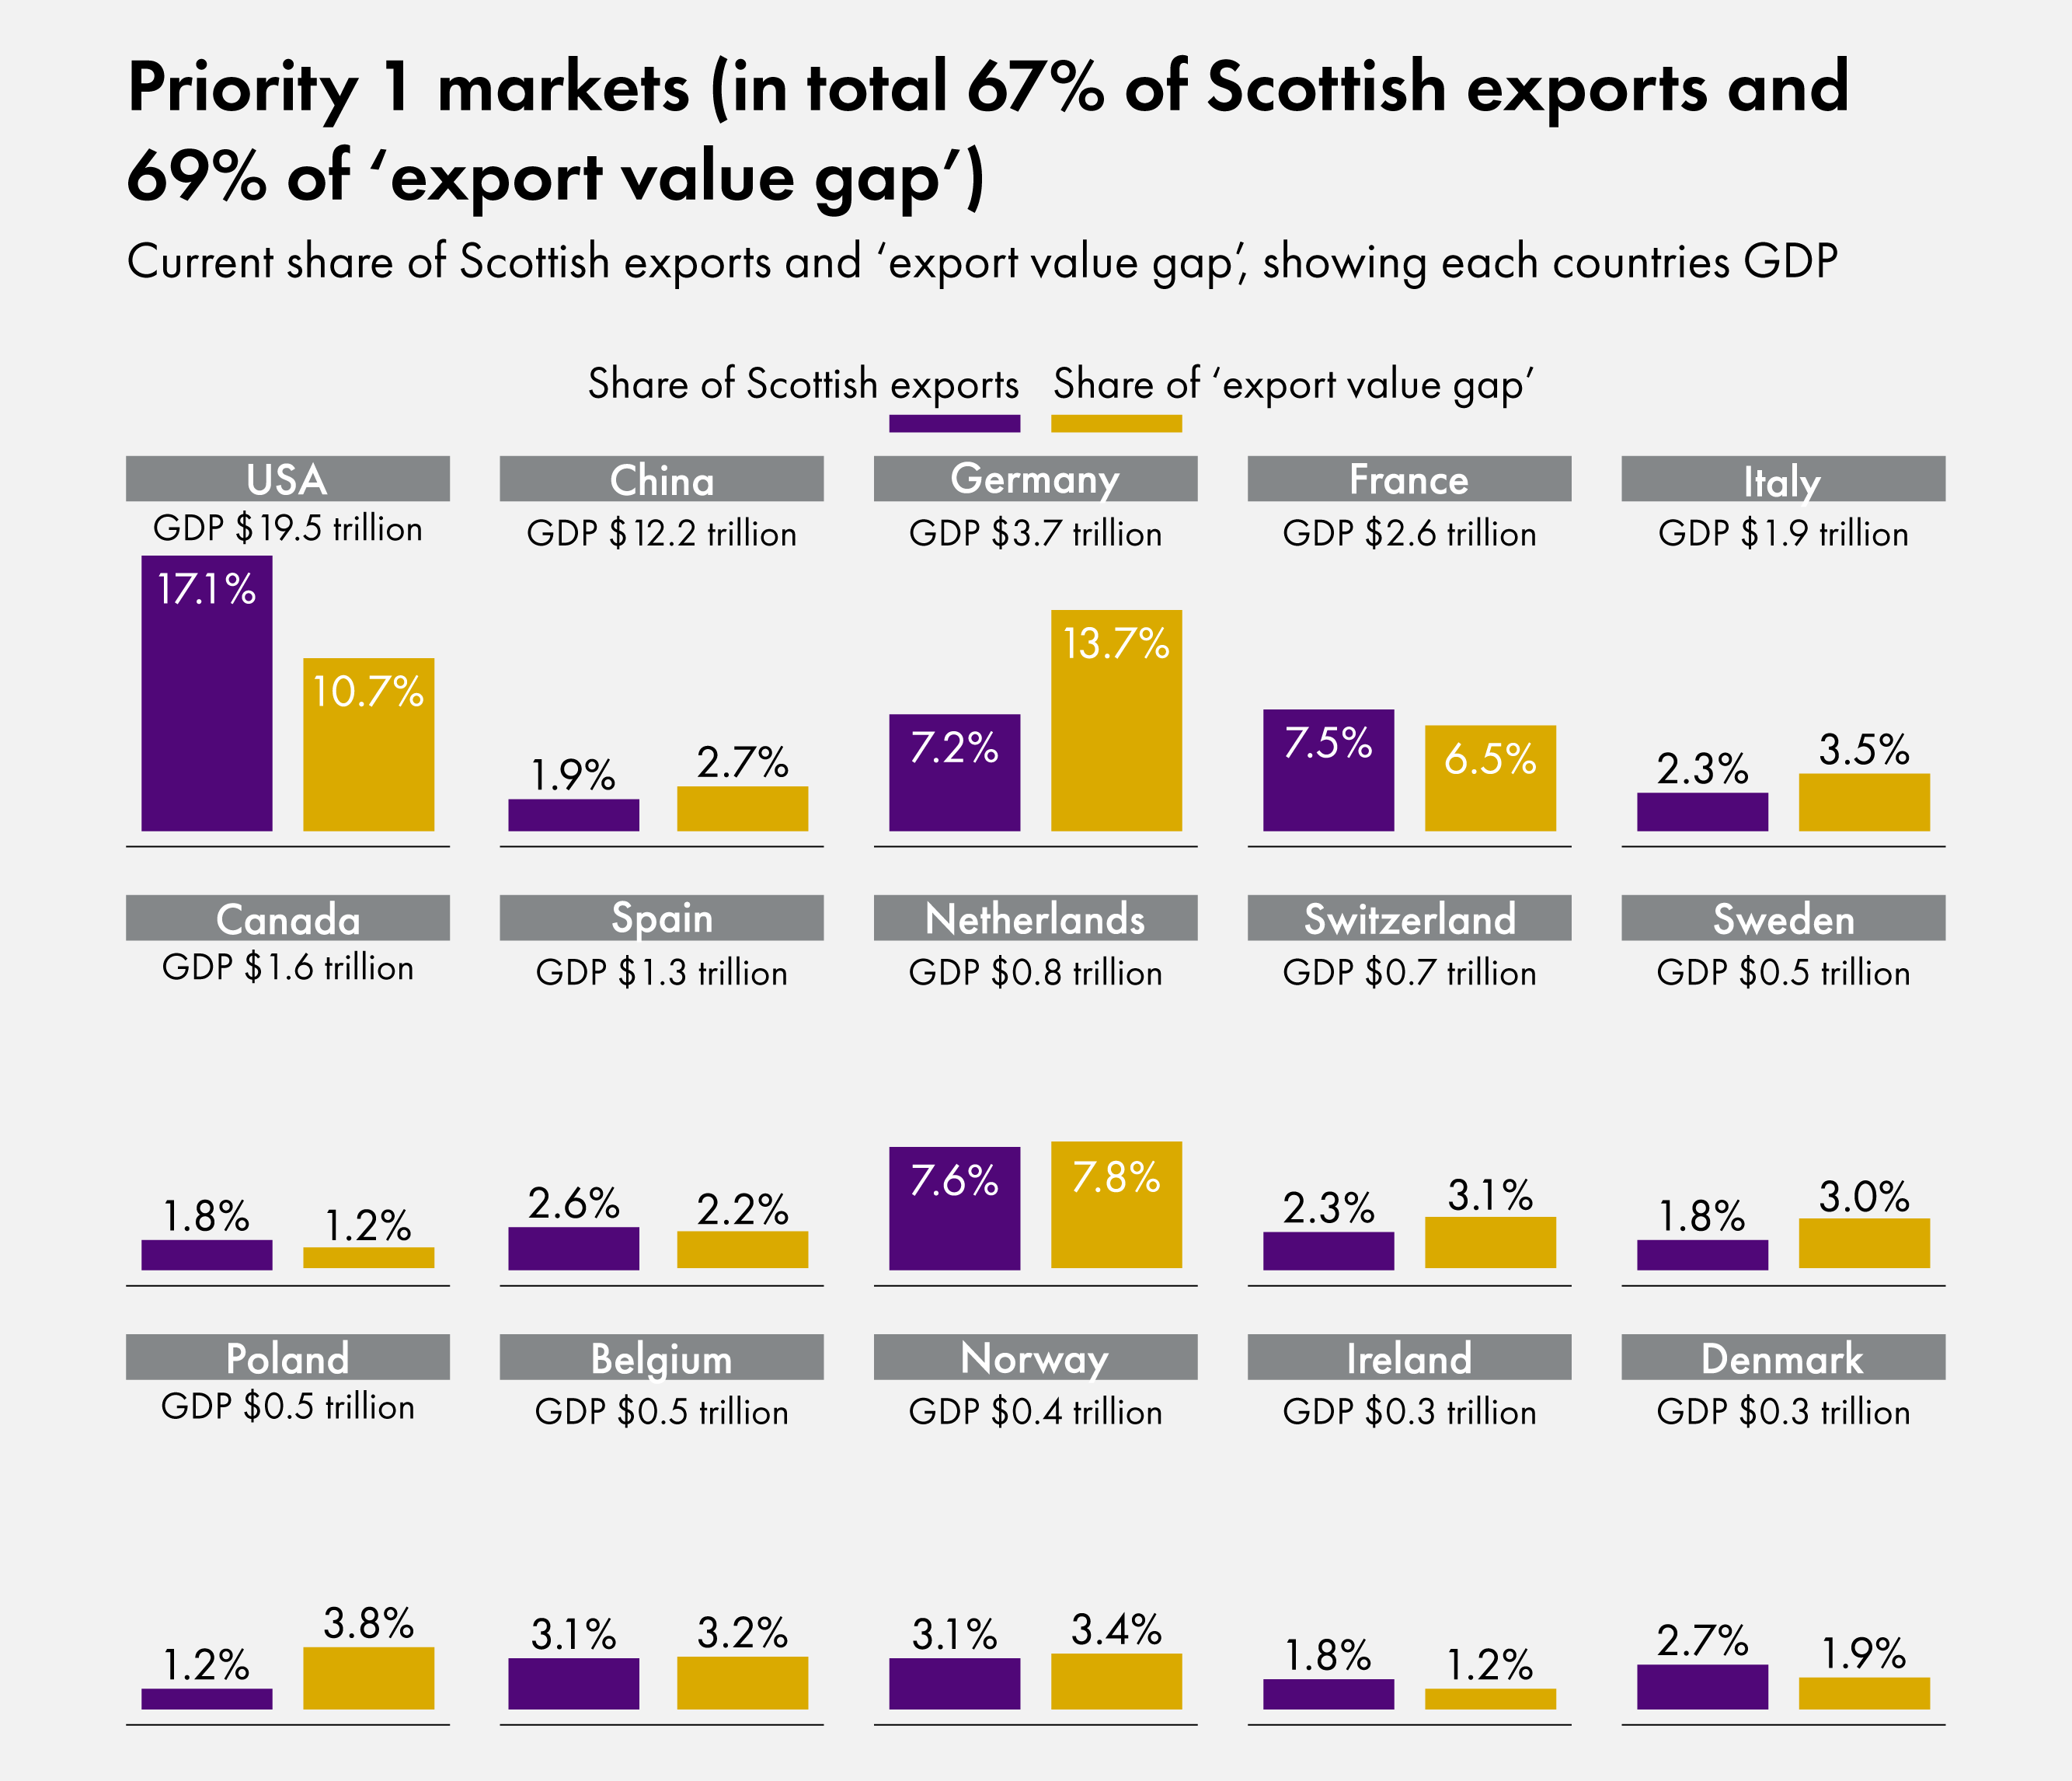
The plan included £20 million of funding over the first three years of the plan to support businesses engaged in trade and investment. To target this investment, the Scottish Government profiled the 26 countries which accounted for over 80 per cent of current exports, and identified these countries’ share of the ‘export value gap’. This gap was calculated by comparing Scotland's 2015-17 exports with those of similar competitors. Details on this calculation are set out in section 4.1 of the analytical methodology note. The top 15 countries were priority 1 markets where the Government expected the bulk of future growth to come from, Figure 8 below lists these.
Scotland: A Trading Nation strategy, Scottish Government, 2019. GDP figures sourced from the World Bank, as at 2017
The Government stated that exporters to these priority 1 markets – representing 67% of international exports – would be supported by the Scottish Government through:
Scottish Development International in-market presence.
Trade envoys, often with a focus on specific sectors (the plan suggests a possible increase from 4 to 12).
GlobalScot expansion (from 600 to 2,000).
Priority for in-market sector specialists.
Priority for trade missions and ministerial visits.
Scotland: A Trading Nation strategy, Scottish Government, 2019. GDP figures sourced from the World Bank, as at 2017
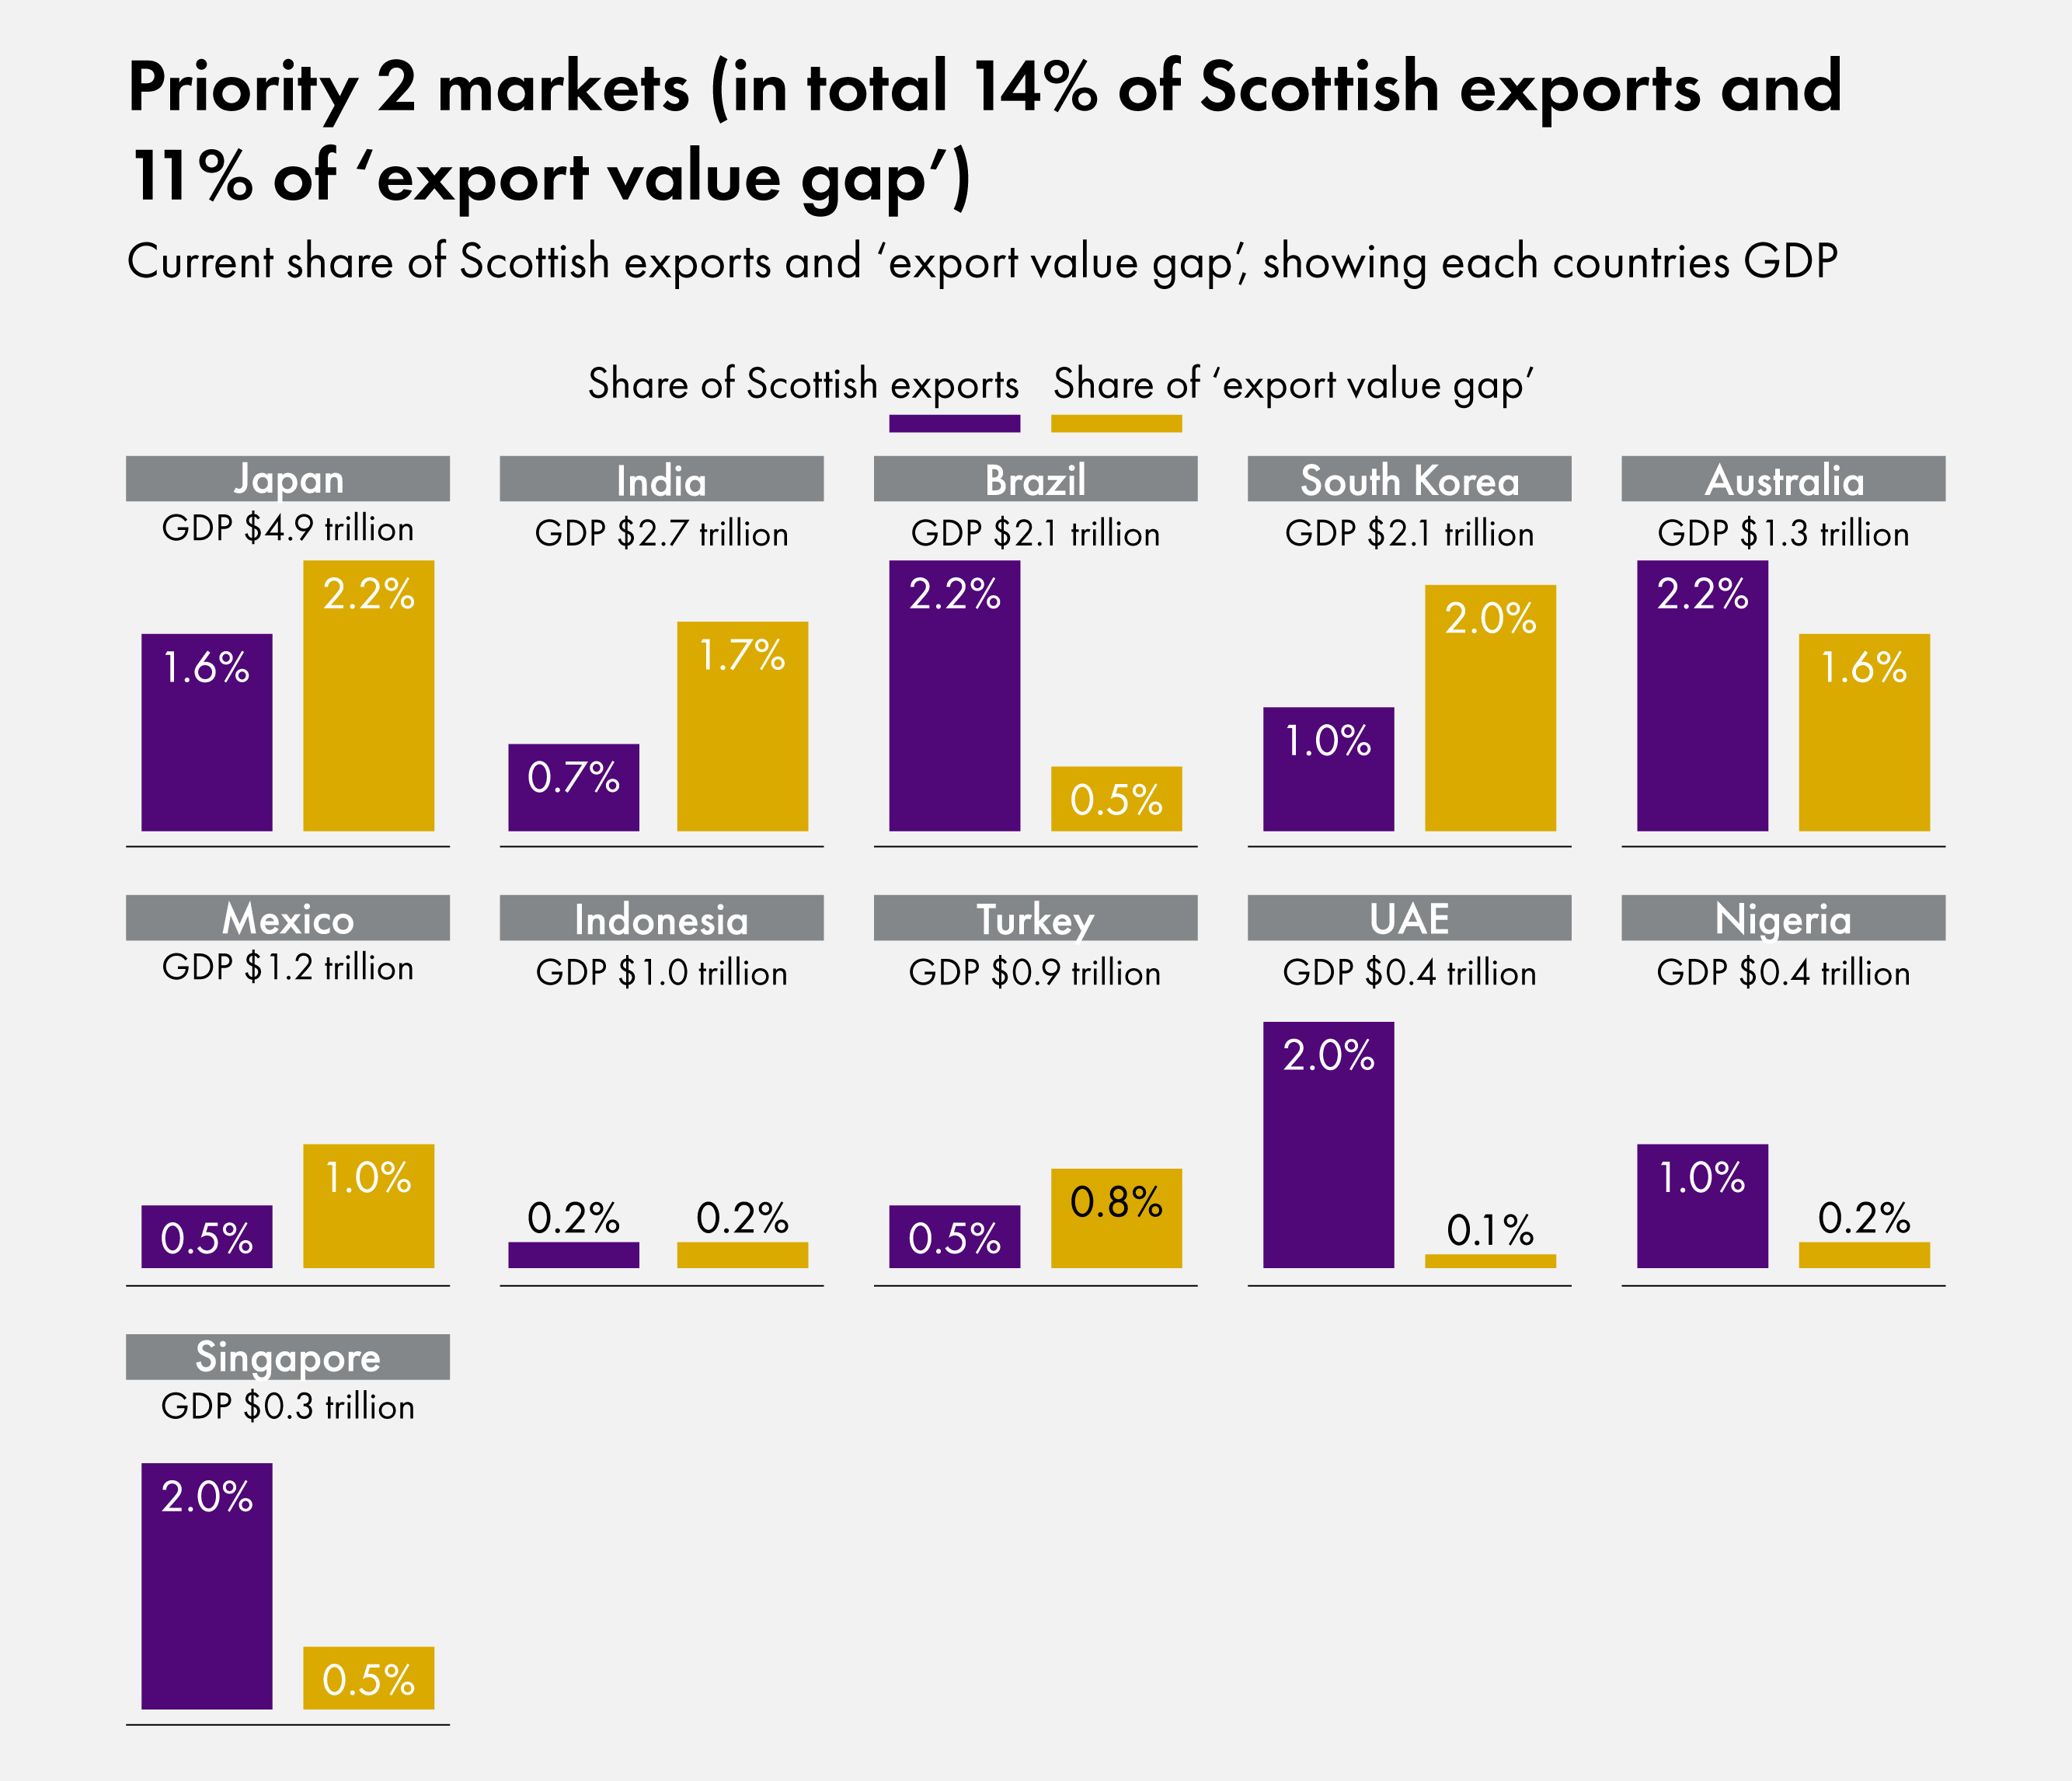
The next 11 countries were designated priority 2 markets (see Figure 9 above). These countries accounted for 14% of current international export value and 11% of the export value gap. The plan stated that these markets would be supported through the expansion of the GlobalScot network and Trade Envoys, close working with DIT, and might also benefit from SDI in-market presence, a scaled back set of the policy responses identified for priority 1 countries.
Trading Nation progress review 2022
In September 2022, the Scottish Government published a progress review of the Trading Nation strategy. This reflected on progress since the strategy was published in 2019, and noted the significant shocks which have affected global supply chains such as Brexit and the Covid-19 pandemic (these shocks are covered more later in this briefing).
The Scottish Government quotes analysis of business survey data which highlights that these conditions are challenging for exporting firms in Scotland, but despite these challenges international exports remain equivalent to about 21% of GDP (against a target to increase this to 25% by 2029). The Scottish Government notes that:
Scotland's international exports will require significant annual growth over the next eight years to achieve the 25% target.
The progress report also set out the key actions that the Scottish Government planned to take to support exporting firms:
Develop 'Skills for Exporting', to set out an assessment of the needs of exporters following EU Exit, and support available from partner organisations.
Ensuring the criteria and definitions within the segmented model of export support continue to capture both existing and emerging export growth potential.
Developing an approach to trade missions and overseas ministerial visits that is consistent with net zero obligations and the Vision for Trade.
Expand business networks, including the GlobalScot network in priority markets and sub-sectors, and increase the number of exporters that can directly access their expertise and advice.
Embed Vision for Trade commitments into the evaluation of priority markets
Use sectoral plans such as the Hydrogen Action Plan and its related Hydrogen Sector Export Plan to find and support new markets for our products and services across the sectors that will drive net zero.
Develop sub-national plans in particular for the USA as resources permit.
Refine the approach to engagement with emerging markets in the 2nd tier of ATN priority markets.
Identify major international events over the next three years to target for major Showcasing Scotland promotional activities, including Osaka Expo 2025
Leverage support from the UK Department of International Trade for companies to ensure it complements existing trade support options
Ensure exporters are aware of the increasing net zero considerations of consumers and businesses.
Work towards addressing key NSET ambitions, such as talent attraction, by using global networks effectively
Updates to country and sector prioritisation
On 11 September 2025 the Scottish Government published an update to to the analysis that supported the 2019 Trading Nation strategy1. Taking stock of developments in Scotland's trading relationships and global trade since the Trading Nation strategy was developed, this updates the prioritisation.
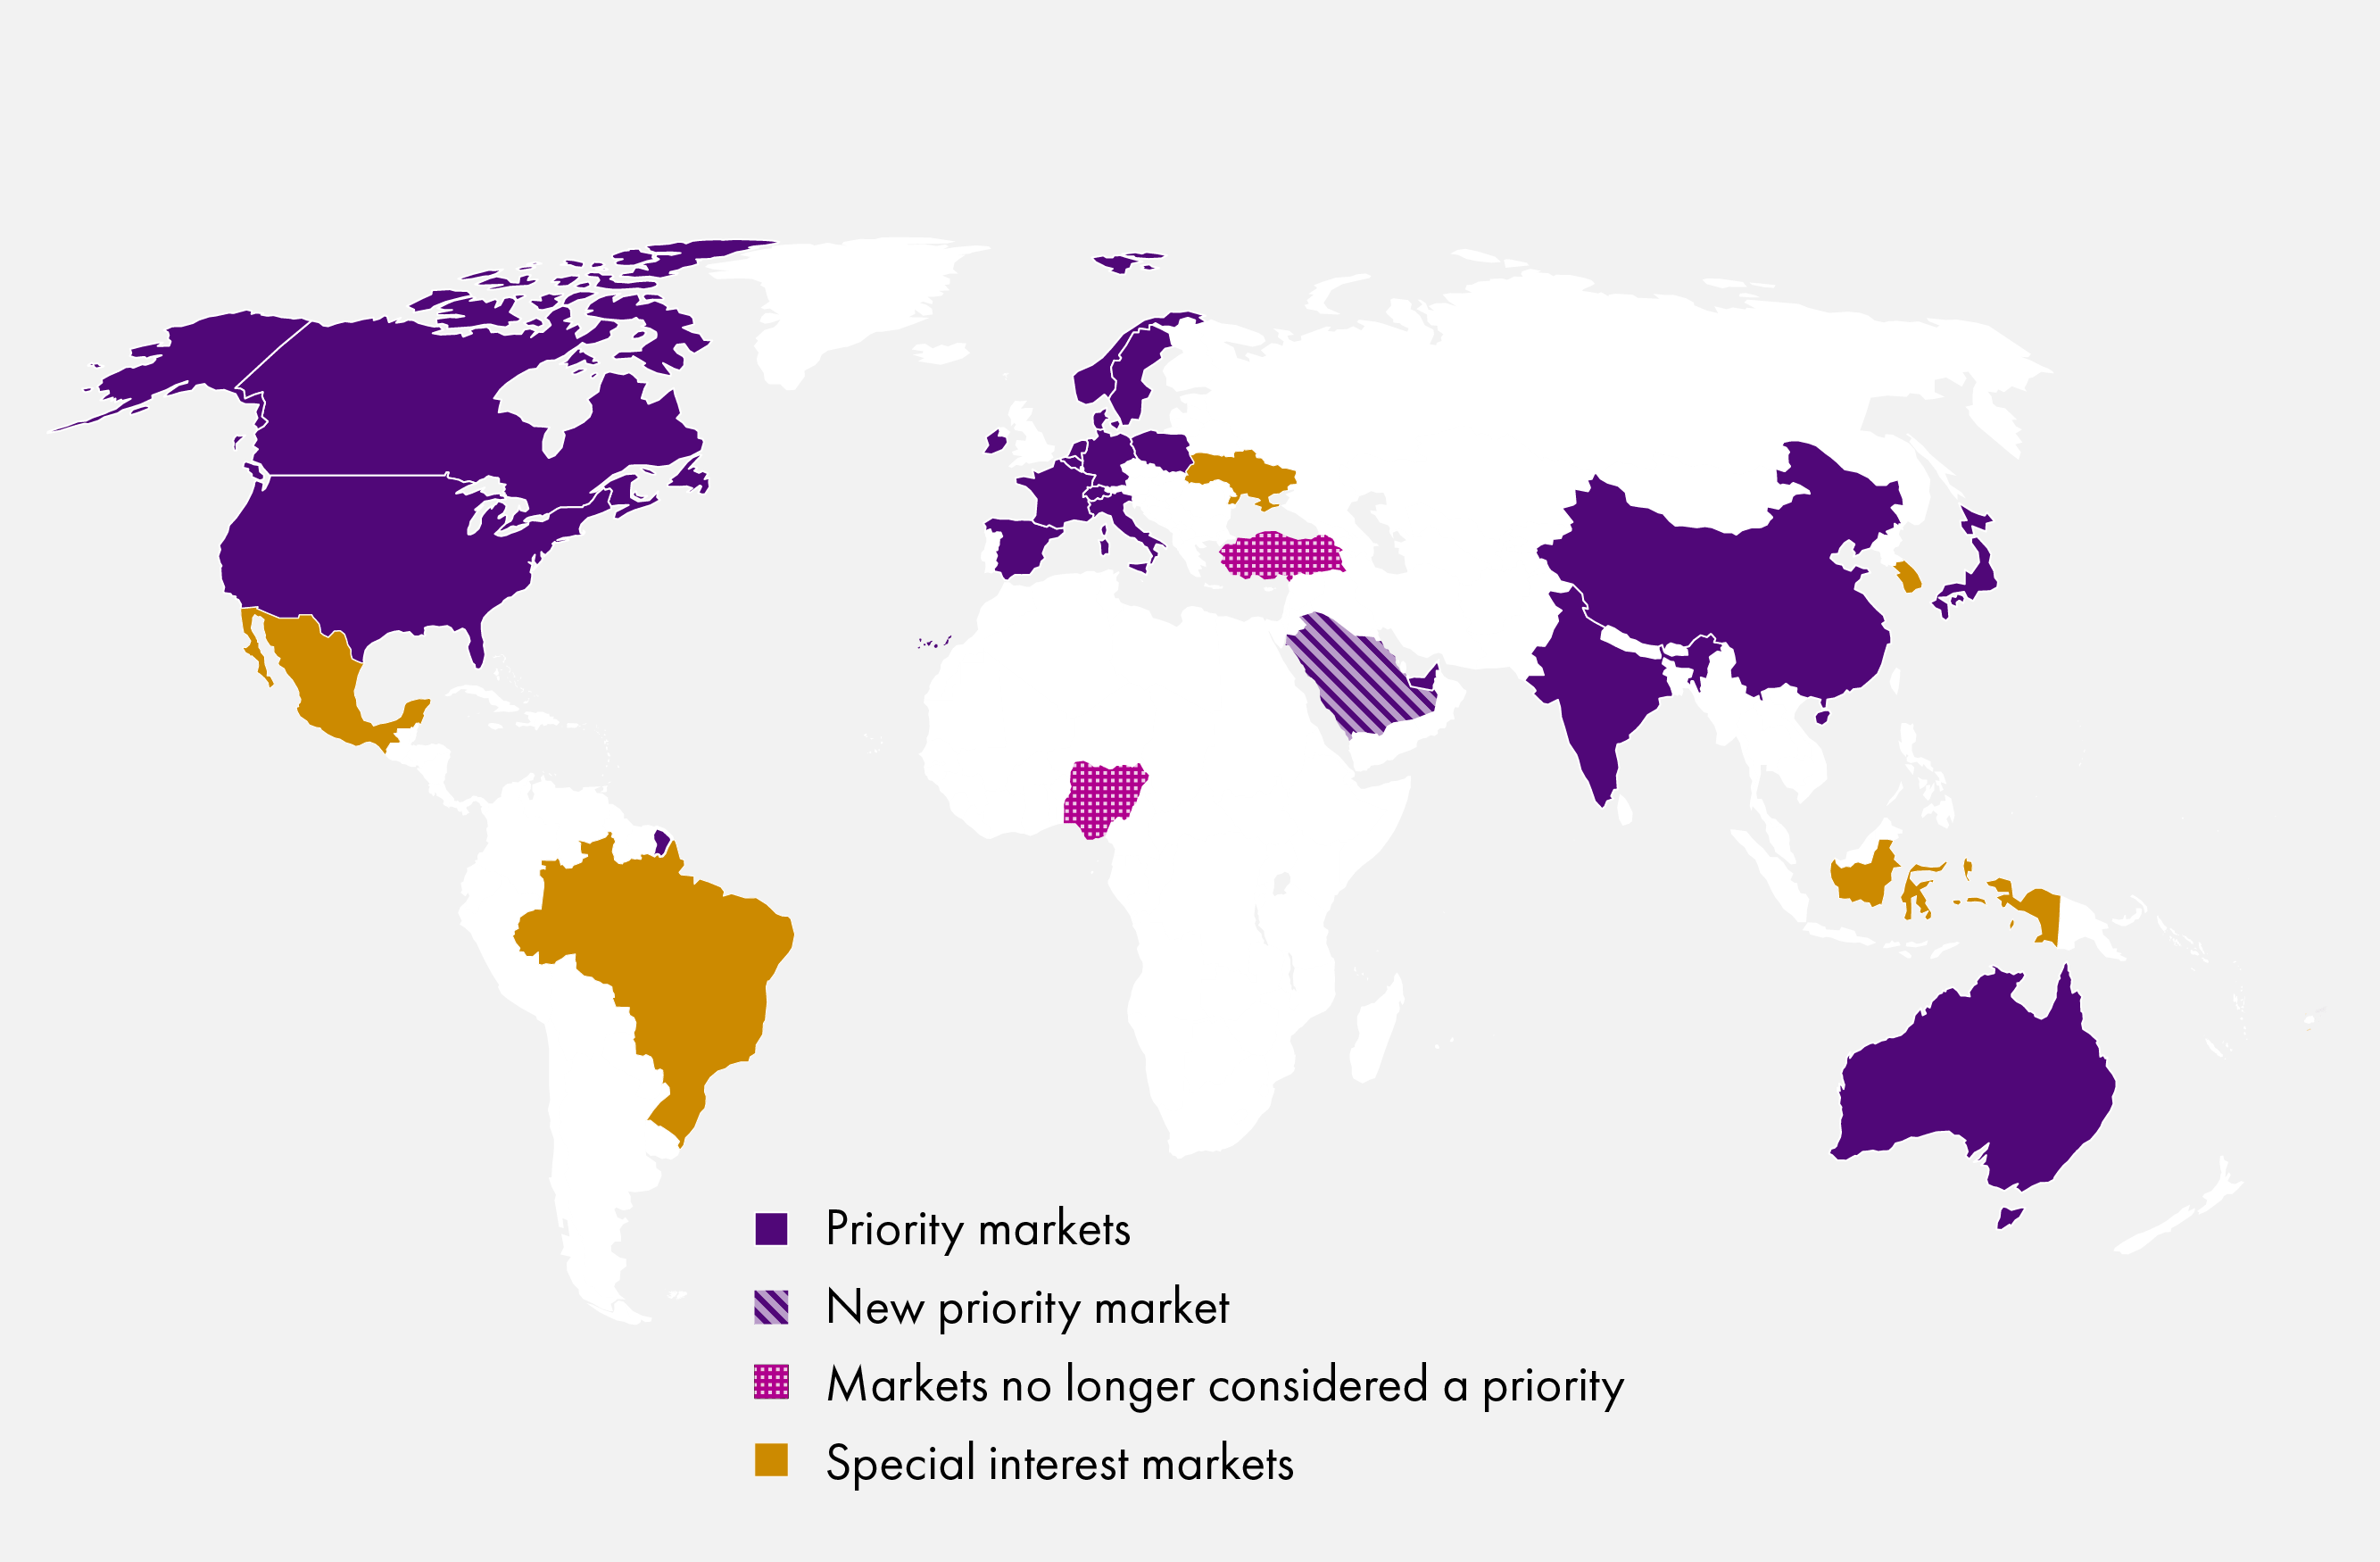
Rather than priority 1 and priority 2 markets, the updated prioritisation now identifies 'priority markets' and 'special interest markets'. Compared to the original trading nation strategy, there are a few changes worth highlighting:
Previously, there were 15 'priority 1' markets which would receive greater focus and resources to encourage purchases of Scottish exports. Now, there are 20 'priority' markets.
Turkey and Nigeria, previously categorised as 'priority 2' markets, are now no longer considered a priority.
Saudi Arabia, previously not identified as either a 'priority 1' or 'priority 2' market, is now considered a priority market.
Figure 10 below sets out these changes:
Scottish Government
The Scottish Government notes that this updated prioritisation was underpinned by work to update Scotland's trade data tool, which quantifies the 'export value gap' that is used to identify where opportunities for growth might be.
The methodology has been updated in three ways compared to the methodology underpinning the original strategy.
The Scottish Government has added an additional variable - Freedom House scores. These scores are produced by Freedom House, and measure access to political rights and civil liberties. The Scottish Government explains that this additional variable is used to ensure that the principles outlined in the Vision for Trade, discussed elsewhere in this briefing, can be used in the quantitative ranking of trading partners.
'Hub' type economies, such as the Netherlands and Singapore who re-export a considerable portion of their imports, have been reassessed. Using data from the Netherlands and Singapore statistical authorities, the Scottish Government has estimated that 39% of Scottish goods exported to the Netherlands are then re-exported, while 77% of Scottish exports to Singapore are likely to be re-exported.
The Scottish Government has also added a 'recent trade' variable. This uses three year averages from 2017 to 2019, and from 2019 to 2021, to help to account for the unusual impact that the Covid-19 pandemic had on trade data in 2020 and 2021.
Other trade policy since Brexit
Since the UK's exit from the EU, the Scottish Government has published several strategies which touch on exports.
In January 2021, immediately after the end of the transition period, the Scottish Government published its Vision for Trade. This vision set out the five principles that the Scottish Government intended to guide how the Scottish Government would seek and support trading relationships. The five principles were:
Inclusive growth: Trade should drive economic development, provide good quality jobs, improve quality of life and reduce inequality.
Wellbeing: Increased wellbeing is one of the main purposes of the National Performance Framework
Sustainability: Trade decisions should consider sustainability through economic, social and environmental lenses.
Net zero: Trade should be supporting the Scottish Government's transition to net zero.
Good governance: Decisions must be compatible with the international rules-based system at all times.
The vision linked to three other strategies: A Trading Nation1 which highlights the priority markets where Scotland should achieve export growth, and the Inward Investment2 and the Capital Investment plans3 which highlight the opportunities to invest in Scotland. The vision stated that it aimed "to build the right trading conditions which facilitate implementation of operational trade and investment plans".
The Scottish Government has published four annual reports, the most recent in January 20264. Key activity covered in this report includes:
A six point export plan was published to help Scottish companies exporting during the current challenging period for international trade.
Tackling market access barriers, such as reopening the market for Scottish pork exports to China.
In February 2025, the Scottish Government published a Gender Export Gap report. In response to the findings of the report, the Scottish Government established a working group to implement six recommendations such as raising awareness of exporting opportunities to women led SMEs.
The Scottish Government also set outs its priorities for the UK Governments trade strategy.
The UK context
International relations (including international trade) are a reserved matter under the Scotland Act 1998. This means that the Scottish Government has no formal role in the development of UK trade policy, nor in negotiating and signing international treaties. The Scottish Parliament also has no formal role in the scrutiny and ratification (i.e. approval) of trade agreements.
This means that Scottish Government or Scottish Parliament input into the negotiation of UK trade agreements may be limited.
In August 2018, the Scottish Government published Scotland's role in the development of future UK trade arrangements1. This policy paper set out "the role of the Scottish Government, Scottish Parliament and others in the development of future UK trade arrangements". The policy paper was published in the context of the UK leaving the European Union upon which the UK would regain responsibility for negotiating its own trade agreements. The policy paper stated:
The conduct and content of future trade policy, negotiations and agreements will have very important implications for Scotland. The broad and increasing scope of modern trade agreements means that they often deal with and merge a range of reserved and devolved policy areas, and touch on many areas of life. In addition, the Scottish Parliament and Scottish Ministers are responsible for observing and implementing international obligations, and would be responsible for the payment of any compensation costs arising from, for example, claims under investor state dispute settlement, present in many modern trade deals. Given these responsibilities, it is important that Scottish Ministers have full, early and formal involvement in policy formulation and opportunities to influence the development and agreement of international negotiations, including in formulating and negotiating mandates. The UK Government must involve the devolved authorities at each step to ensure any future agreements deliver for the whole of the UK.
During the negotiation (between 2021 and 2023) of the Comprehensive And Progressive Agreement for Trans-Pacific Partnership (CPTPP), the UK Government stated that it had kept the Devolved Administrations involved at every stage of negotiations, and that the Devolved Administrations had provided their views on CPTPP regularly3.
Ahead of the UK General Election on 4 July 2024, the Labour Party manifesto committed to using the Scotland Office to support Scotland internationally:
The Scotland Office will maximise Scotland’s influence, and with Labour it will once again become an advocate for Scotland, both at home and abroad. The Scotland Office will ensure the voice of Scotland is properly heard on issues under the competence of the UK Government. Scotland has an enviable international reputation. Its culture, products and services are internationally renowned – from whisky and salmon to computer game development, bioscience and financial services. Labour will champion ‘Brand Scotland’ across the world through the Scotland Office, and our diplomatic and trade networks.
Since the 2024 UK General Election there have been some examples of this approach being taken, such as in June 2025 when the UK Scotland Office announced a £100,000 deal with the Scottish Chambers of Commerce. The same month, the UK Scotland Office and the Scottish Chamber of Commerce announced a trade mission to Spain.
Lisa Claire Whitten, Viviane Gravey and Billy Melo Araujo analysed the devolved governments involvement in UK trade policy post Brexit in Territory, Politics and Governance2, and noted that:
In contrast to long-standing consensus in UK [Intergovernmental relations] literature, this research has identified a rare positive example of consultation practices between devolved governments and central government.
The impact of geopolitical events and COVID-19
Since the Scottish Government published its export growth strategy in 2019, there have been a number of geopolitical shocks and global events which have impacted on world trade flows. Whilst international relations are reserved, the consequences of geopolitical developments have clear impacts on areas of devolved competence including on Scotland's export policy.
From a UK perspective, one of the key events, the UK's departure from the European Union was a policy choice of which the main impact - a fundamental change to the trading relationship with its main market - fell on the UK itself. Other events such as the COVID-19 global pandemic and Russia's illegal invasion of Ukraine have impacted on Scotland and the UK along with the rest of the world. More recently the conflict in the Middle East has added a further shock to world trade flows principally due to the rising cost in energy prices.
These events are shown in the timeline below.

This section will summarise the impact on Scotland's exports, based on the data available for the period since the UK's departure from the EU.
Whilst the impact on Scotland's exports caused by these geopolitical events become more difficult to measure as time passes since the event, in many cases these events have led to increased costs (particular energy costs) and compounded on each other creating a challenging international environment since 2019.
The UK's departure from the EU
Following the UK referendum on leaving the EU which took place in June 2016, the UK Government chose to negotiate a Brexit which involved leaving both the EU Single Market and Customs Union.
From a trading perspective, the EU Single Market guarantees the free movement of goods and the freedom to provide services across all EU member states. The Single Market also ensures a common framework of rules, regulations and standards for all goods manufactured and sold across the EU and for all services provided. These rules apply irrespective of whether a business trades across the EU or not.
Single Market membership also provides for the free movement of capital and services, for example, the provision for passporting of financial services. This means that financial services firms authorised in one EU member state can provide their services across the EU without the need for further authorisations.
The Customs Union applies a common tariff to all goods entering from outwith the EU. As a result of this common tariff, individual Member States are unable to adopt their own independent trade policies. Instead, the EU has competence for negotiating trade agreements on behalf of the Member States.
The UK Government chose instead to negotiate a new trade agreement with the EU which formed one element of the EU-UK Trade and Cooperation Agreement (TCA). The UK formally left the EU on 31 January 2020 and left the EU's legal order, including the Single Market and Customs Union at the end of December 2020.
As a result of the Free Trade Agreement there are zero tariffs and zero quotas on the trade in goods between the UK and the EU. However, the TCA did not include any sort of agreement in terms of Non-Tariff Barriers (NTBs). The Institute for Government provides some examples of NTBs:
Institute for Government. (2017, January 16). Non-tariff barriers. Retrieved from https://www.instituteforgovernment.org.uk/article/explainer/non-tariff-barriers [accessed 8 June 2026]
Regulations: Any rules which dictate how a product can be manufactured, handled, or advertised.
Rules of origin: Rules which require proof of which country goods were produced in.
Quotas: Rules that limit the amount of a certain product that can be sold in a market.
By way of an example of NTBs, the TCA does not provide for common regulatory standards for goods. As such, manufacturers who wish to place goods on both the UK and EU markets need to comply with both the UK and the EU regulatory rules for those goods, even where they are different. In addition, exports from the UK to the EU need to demonstrate that they have been manufactured in line with EU rules and comply with EU rules in their end state. Linked to this, UK exporters of agri-food products are now required to meet the EU’s sanitary and phytosanitary (SPS) requirements which are measures designed to protect humans, animals, and plants from diseases, pests, or contaminants.
Whilst the TCA provided a number of measures to facilitate the trade in goods, it was more limited in its coverage of trade in services. As a result of Brexit, UK nationals lost the right to free movement in the EU and the right to freely provide services across the EU.
For financial services this meant that UK based providers lost the right to passporting which facilitates the provision of financial services across the EU without the need for further authorisation. The loss of freedom to provide services has also affected others such as the cultural sector in the UK and legal services providers.
Departure from the EU also meant the UK lost access to the EU's trade agreements with around 50 non-EU countries. Whilst many of these agreements were rolled over, the UK Government has sought to renegotiate some of these whilst negotiating new Trade Agreements such as those with Australia (in force since May 2023), New Zealand (May 2023), India (July 2026) and Switzerland (July 2026).
The UK-EU reset
The Labour Party manifesto for the 2024 General Election included a commitment to reset the UK's relationship with the EU. In the lead up to the election, Sir Keir Starmer made it clear that a Labour government would not seek to take the UK back into the European Union Single Market or the Customs Union. The Labour manifesto made clear that a Labour government would instead seek to improve the UK’s trading relationship with the EU “by tearing down unnecessary barriers to trade.” To achieve this, the manifesto committed to:
“seek to negotiate a veterinary agreement to prevent unnecessary border checks and help tackle the cost of food; help our touring artists; and secure a mutual recognition agreement for professional qualifications to help open up markets for UK service exporters”.
The Labour Party Manifesto. (2024, June 13). Change. Retrieved from https://labour.org.uk/change/ [accessed 8 June 2026]
To inform the reset in relations, the Scottish Parliament's Constitution, Europe, External Affairs and Culture Committee (CEEAC) undertook an inquiry into the Review of the UK EU Trade and Cooperation Agreement.
The Committee published the UK-EU Trade and Cooperation Agreement: Barriers to trade in goods and opportunities to improve the UK-EU trading relationship report on 10 September 2024. The report made the following recommendations2:
That the new UK Government should negotiate improvements to the trading relationship to better facilitate UK-EU trade.
Non-tariff barriers have placed “considerable administrative, resource and cost pressures on businesses”, and “harmed exports”. Key amongst these barriers include the requirements for customs formalities and regulatory checks for all exports from the UK to the EU.
There is a need for the UK to seek closer regulatory alignment with the EU.
The UK Government should seek a veterinary agreement with the EU to significantly reduce border checks and the administrative burden on exports of agri-foods.
The UK Government should seek a mutual recognition agreement with the EU on conformity assessments, and the linkage of the respective UK and EU emissions trading schemes.
The Committee published its second inquiry report UK-EU Trade and Cooperation Agreement: trade in services, youth mobility, and touring artists; and opportunities to improve the UK-EU trading relationship on 16 May 2025.
The reset in relations led to the Prime Minister meeting with the President of the European Commission Ursula von der Leyen and António Costa, the President of the European Council for the first EU-UK summit since the UK’s withdrawal from the EU in May 2025.
In relation to developing the trading relationship, the key document agreed by the UK and the EU was the Common Understanding which set out high-level agreement to work towards:
Establishing a Common Sanitary and Phytosanitary Area by way of a European Union-United Kingdom Sanitary and Phytosanitary Agreement.
Formal linking of the Emissions Trading Schemes (ETS) of the UK and the EU.
More details of the outcomes of the UK-EU summit in May 2025 are provided in the SPICe blog: The UK-EU summit: a reset in relations?
At the time of writing, the details for the agreement of a common sanitary and phytosanitary area and linking of emissions trading schemes are still being negotiated by the UK and the EU.
The COVID-19 pandemic
In the first three months of 2020, the world economy slowed abruptly as a result of the COVID-19 global pandemic. Lockdowns and restrictions contributed to significant trade disruption both to production and supply and also resulted in falling global demand.
Bank of England analysis published in July 2021 on the effect of COVID-19 on global trade highlighted three trends1:
The pandemic affected services trade more than goods trade. Services trade fell by more than 20% in 2020, almost four times the decline in goods trade.
The impact of the COVID-19 shock on trade was different across countries. In particular, the fall in Chinese trade was much smaller than in other regions.
The pandemic had a significant impact on shipping costs, which increased by around 350% in the year from May 2020.
Writing in October 2022, the Office of National Statistics (ONS) wrote on the impact of COVID-19 on UK trade2:
The coronavirus (COVID-19) pandemic affected international trade in the nations and regions of the UK in 2020, which all saw decreases in both total exports and total imports from 2019.
Imports decreased in all nations and regions for trade in both goods and services from 2019 to 2020.
According to the ONS:
The impact of coronavirus (COVID-19) on UK trade was first reported in Quarter 1 (Jan to Mar) 2020, when the UK and its trading partners started to implement measures to stop the spread of coronavirus. These measures, which included border restrictions and the closure of non-essential industries, contributed to all UK nations and regions experiencing a decrease in total exports and total imports from 2019 to 2020.
Office of National Statistics. (2022, October 20). International trade in UK nations and regions: the impact of coronavirus (COVID-19): 2020. Retrieved from https://www.ons.gov.uk/businessindustryandtrade/internationaltrade/articles/internationaltradeinuknationsandregionstheimpactofcoronaviruscovid19/2020#:~:text=The%20coronavirus%20(COVID%2D19),services%20from%202019%20to%202020. [accessed 8 June 2026]
ONS figures published at the time suggested Scotland's exports of goods and services fell from £60.6 billion in 2019 to £49.1 billion in 20202. Figures for the exports of goods from Scotland showed they fell from £36.6 billion to £28.2 billion.
Russia's illegal invasion of Ukraine
Having already occupied the Crimean peninsula in Eastern Ukraine in March 2014, Russia launched a full scale illegal invasion of Ukraine in February 2022.
At the time of the invasion Russia was a provider of a significant amount of Europe's energy supplies whilst Ukraine was the source of much of Europe's grain.
Whilst energy prices had been rising during 2021 and the early part of 2022, Russia's invasion of Ukraine exacerbated these issues. Sanctions placed on Russia meant the sale of Russian gas to Europe (including the UK) dried up leading to greater demand for the more limited supplies available. This led to volatility in gas prices and record wholesale prices.1
According to the Energy and Climate Intelligence Unit writing in February 2024, gas prices;
peaked in March and August 2022 at record levels that were at least ten times the typical prices in the years before the crisis. Only towards the end of 2022 did wholesale prices begin to fall, but are still around twice their historical levels, and are forecast to remain elevated for the rest of the decade.
Energy and Climate Intelligence Unit. (2024, February 22). The Cost of Gas in 2.5 years of the Gas Crisis. Retrieved from https://eciu.net/analysis/reports/2024/the-cost-of-gas-in-2-5years-of-the-gas-crisis [accessed 8 June 2026]
The Energy and Climate Intelligence Unit has also suggested that the UK has been the worst hit by the gas crisis of all countries in Western Europe3.
Food prices have also been affected by Russia's illegal war against Ukraine. Before the war, Ukraine was often referred to as the “breadbasket of Europe”4 with more than 70% of the country made up of agricultural land. Ukraine's main crops include sunflower, corn, soybeans, wheat and barley and it is a key food exporter around the world including to Europe and Africa. Russia's invasion of Ukraine led to difficulties for Ukraine in producing, harvesting and exporting those crops. These factors led to food shortages and rising food prices.
The Bank of England's Chief Economist, Huw Pill, identified Russia's invasion of Ukraine as being a key factor in the rise in food prices that the UK has experienced over the last two years. Food price inflation peaked at 18.9% in March and April 2023, but has since returned to more normal levels with prices increasing by just 2.2% in the year ending December 20245. According to Huw Pill, much of that inflation is as a result of Russia's invasion of Ukraine6 which caused disruption to the supply chain of staples grown in Ukraine such as wheat and sunflower oil, and brought up costs of raw materials and basic food.
The conflict in the Middle East
On 28 February 2026, the United States and Israel launched an attack on Iran with the wide-ranging intentions of degrading Iran’s nuclear program, ballistic missiles, navy, drones, and control of its terror proxies1. Iran has responded by launching drone and missile attacks on Israel and on US allies in the Gulf region. This region, and in particular the Strait of Hormuz, is important for global oil markets and the Strait of Hormuz is an important trade route for several industrial goods.

World Economic Forum: Beyond oil - 9 commodities impacted by the Strait of Hormuz crisis
The economic impact of this conflict, and in particular continued disruption to the Strait of Hormuz, is likely to be felt in several sectors of the Scottish economy causing a knock on effect which pushes up the price of Scotland's exports potentially leading to a fall in international demand:
Energy: The United Kingdom remains exposed to international fossil fuel markets – as of 2025, 31.7% of all UK electricity was generated from gas2. Around 20% of the global supply of liquefied natural gas transited through the Strait of Hormuz in 2024, so disruption in the region has a significant impact on the global price of gas. As the UK relies on imports, any price increases are passed on to consumers and businesses. Ofgem increased the energy price cap by £221 from July 2026, and the consultancy Cornwall Insights forecast a further increase from October, despite the UK Government's announcement that VAT on fuel bills would be temporarily cut. The conflict has also led to significant increases to the cost of other products using oil and gas, such as petrol and diesel, and oil for heating.
Agriculture: The United Nations highlights the risk that restricted supply of fertilisers will reduce crop outputs later this year and next year, driving up food prices3. Approximately one third of global fertiliser supply passes through the Strait of Hormuz. These concerns have prompted NFU Scotland to call for urgent government action to support farmers struggling with fertiliser and energy costs.
Manufacturing: The London School of Economics notes that half of the world’s sea-borne trade in sulphur is via the Strait of Hormuz4. Sulphur is a key input to industrial processes. 30% of global helium comes from the Ras Laffan industrial hub in Qatar which is vital for semiconductor manufacturing. There are also shortages of aluminium used in cars.
Shipping and travel: The costs of insuring shipping to transit the Strait of Hormuz have increased significantly since the conflict began. The airline industry has also been hit, with a number of European carriers cancelling flights or increasing ticket costs in the face of jet fuel shortages.
The British Chambers of Commerce noted in April that the conflict in the Middle East had reduced export activity to the region by around 20%. At the time of writing the situation remains highly uncertain, with attempts to secure a lasting peace so far unsuccessful.
Other global supply chain disruption
A further disruption to global trade was caused by the blockage of the Suez Canal in March 2021. According to the BBC's Business Correspondent writing at the time, the Suez Canal sees around 50 vessels per day travelling through it (sometimes many more) and these vessels account for about 12% of global trade. In particular it is an important route for getting oil and liquified natural gas from the Middle East to Europe1.
At the time of the blockage which lasted for six days, it was estimated that around $9.6 billion of trade was delayed each day. The BBC reported that analysis by German insurer Allianz showed the blockage could cost global trade between $6bn to $10bn a week and reduce annual trade growth by 0.2 to 0.4 percentage points2.
Shipping costs have also been impacted by disruption to freight in the Red Sea due to attacks by Houthi rebels. Sky News noted that shipping costs have risen more than 300% since November 2023. Measures to reduce to the risk to shipping meant that journeys can take up to ten days longer and insurance costs have also increased. However, the impact on shipping costs due to these attacks has not been as great as the Suez canal blockage.
Since President Trump returned to the White House, there has been considerable volatility in international trading arrangements due to increased tariffs imposed by the USA, and counter measures from other nations.
Writing in June 2026, Chatham House note that there are four other choke points for international trade which have recently experienced disruption:
The Taiwan Strait is a key corridor for international trade, carrying approximately 20 per cent of global maritime cargo. Increased tensions in the region present a significan trisk to this traffic.
The Strait of Malacca carries almost a quarter of global seaborne trade, and the area has recently seen a significant increase in piracy.
The Mozambique Channel, while not as important to global trade routes since the Suez Canal was opened, still accounts for nearly 30 per cent of global tanker traffic. Mozambique has been struggling with an Islamist insurgency, which presents a risk should the conflict escalate to the Channel.
The Panama Canal is a key trade corridor for both the USA and China. In addition to geopolitical competition, environmental factors have also had an impact on the operation of the canal. In 2023 and 2024, severe droughts reduced dailly transits by nearly 40 per cent.
Case studies
This section will set out more detail on the export performance of three significant industrial sectors and one major international market.
The first case study looks at the two largest service exports from Scotland: Financial services and Wholesale and retail trade.
The second looks at food and drink exports, with a detailed overview of seafood and beverages.
The third case study looks at mineral fuels, lubricants and related materials.
The final case study looks at Scotland's exports to the USA
Service exports
Exports of services were valued at £45.4 billion in 2023, and accounted for 49% of all Scottish exports. Service exports has accounted for between 41% and 51% in every year since 2008. As outlined previously, Export Statistics Scotland is the best data source for Scotland's service exports. This means that the most recent data we have is for the year 2023 however.
The Fraser of Allander Institute recently published analysis of Scotland's services exports, which included Nowcasting worki to provide data on international exports (not including exports to the rUK) up to 20251.
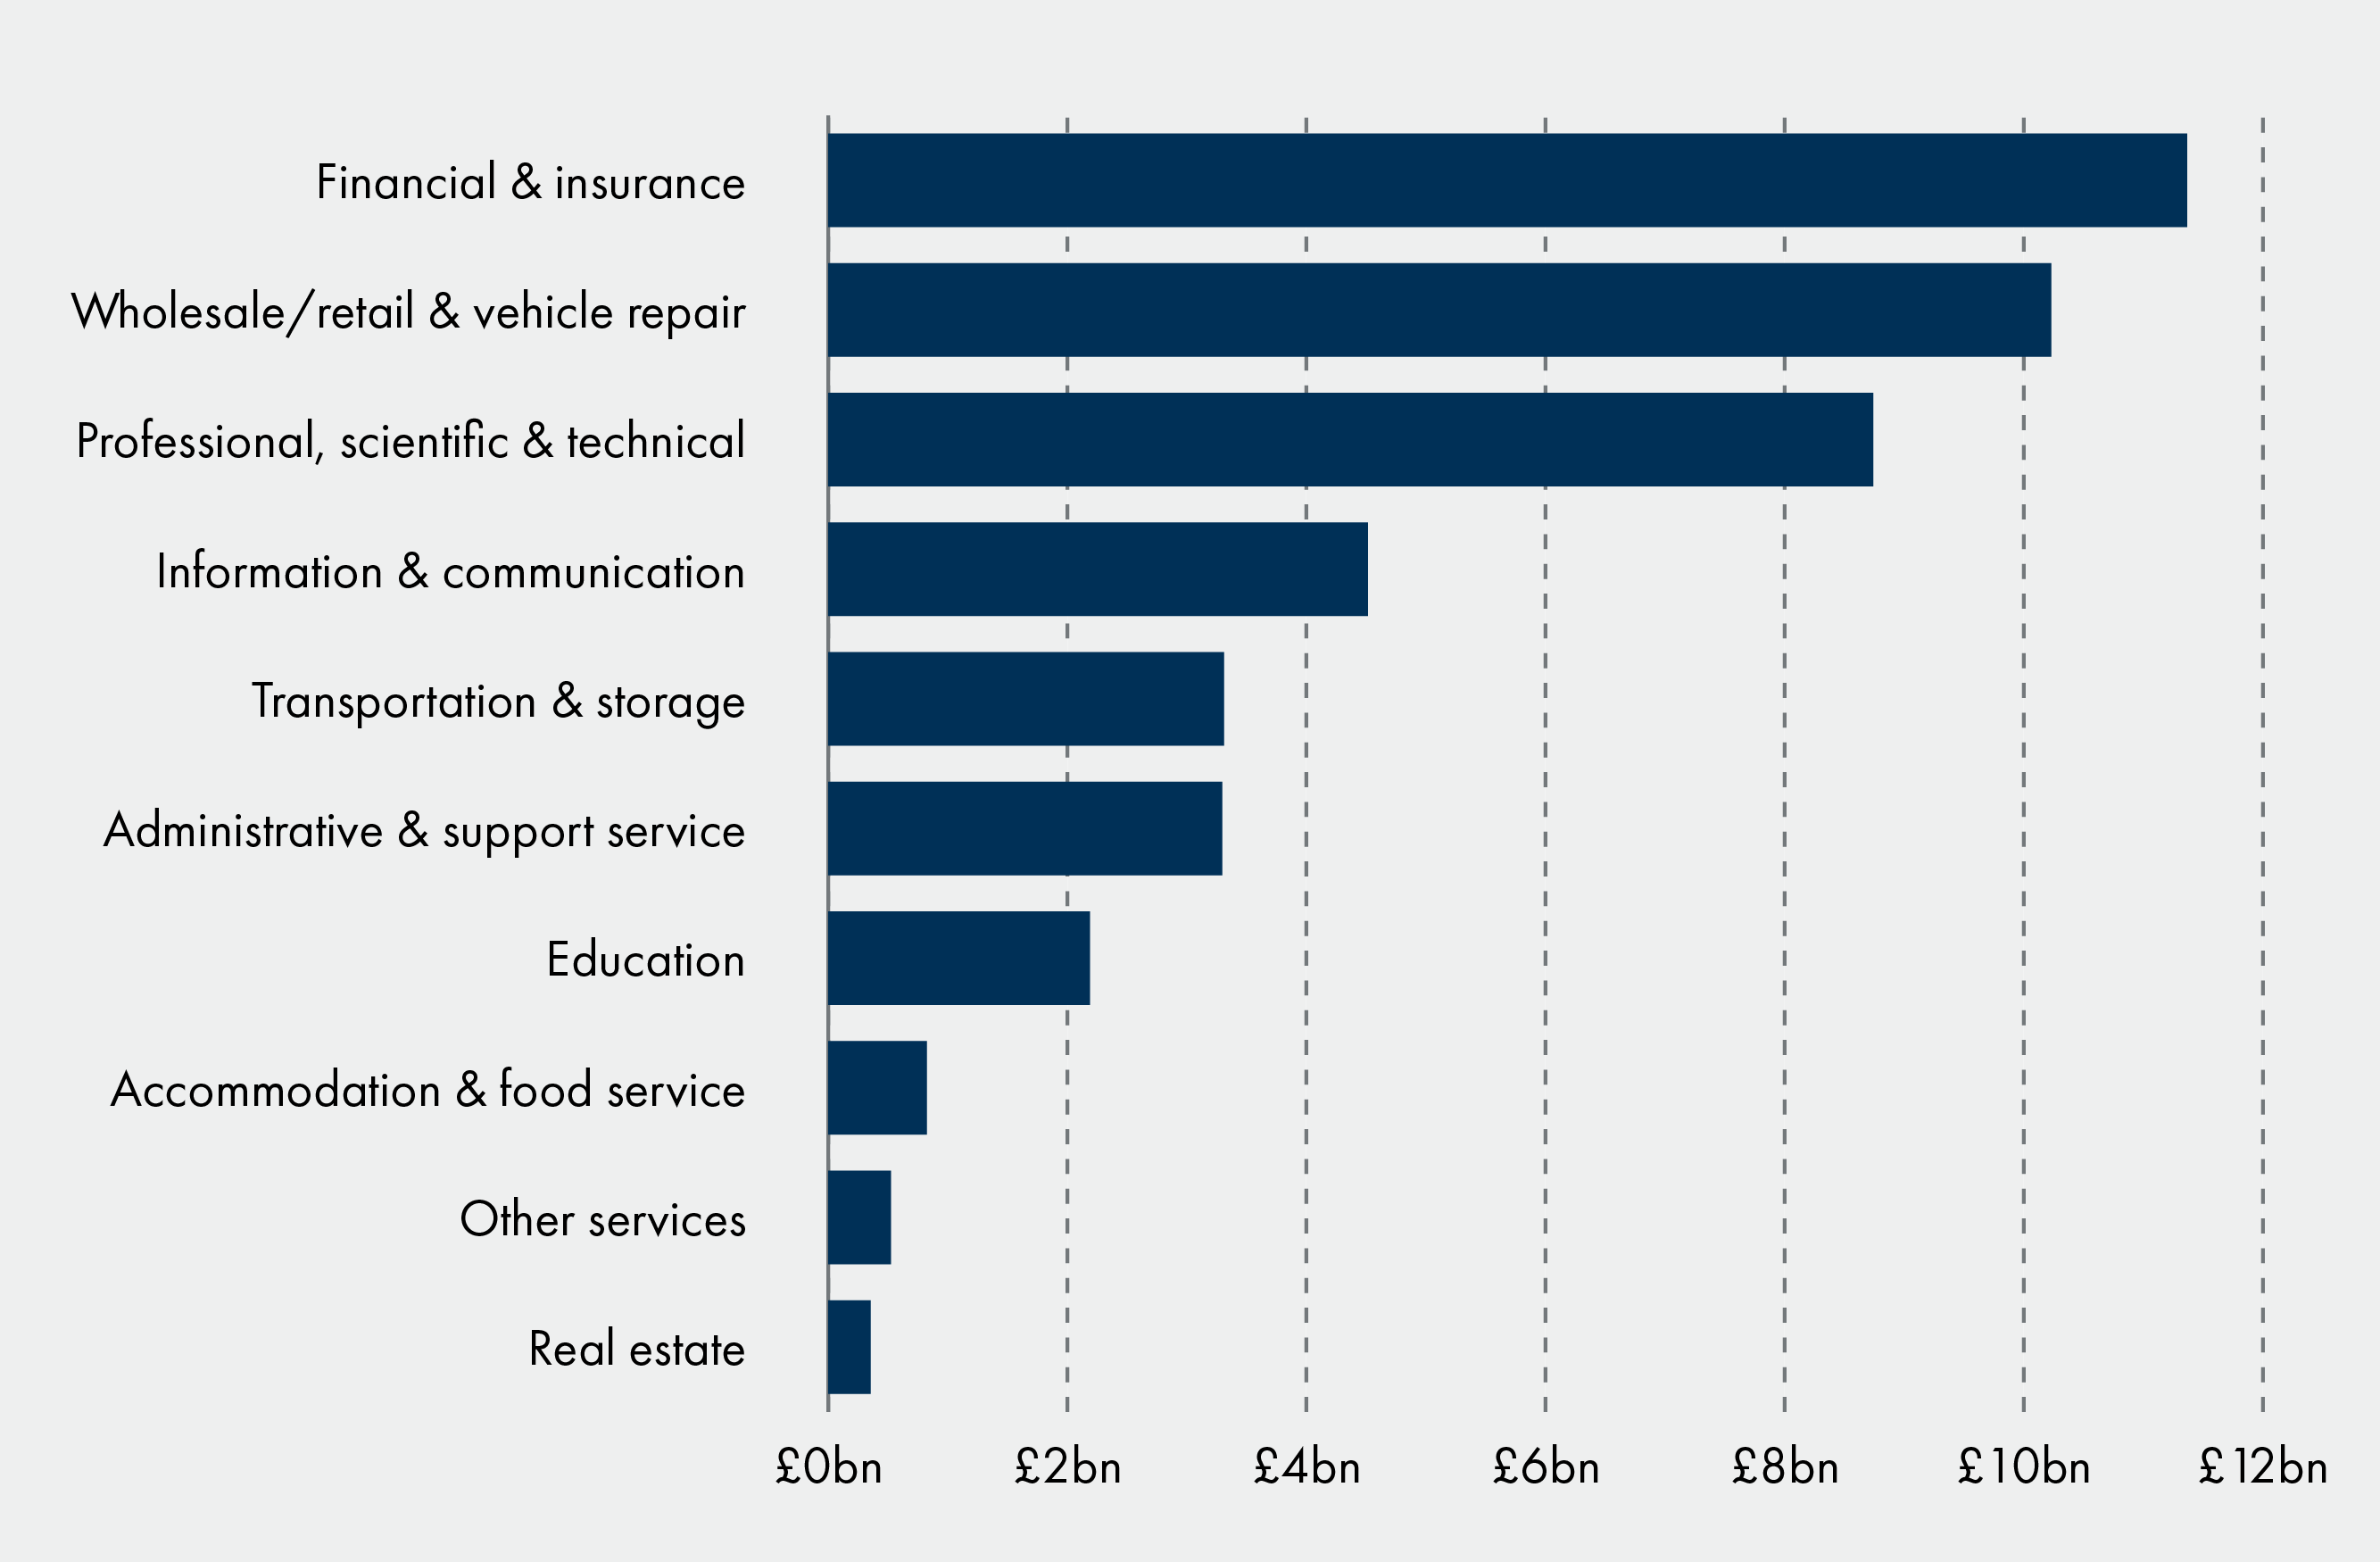
In 2023, 66.9% of all service exports were accounted for by three industrial sectors; financial and insurance activities (25.1%), wholesale and retail trade (22.6%), and professional, scientific and technical activities (19.3%). These proportions have been broadly stable in recent years, but looking back to 2008 financial and insurance services have declined from over one third of all service exports to around one quarter, while professional, scientific and technical activities have grown from 12.4% in 2008 to nearly a fifth in 2023.
Export Statistics Scotland 2023
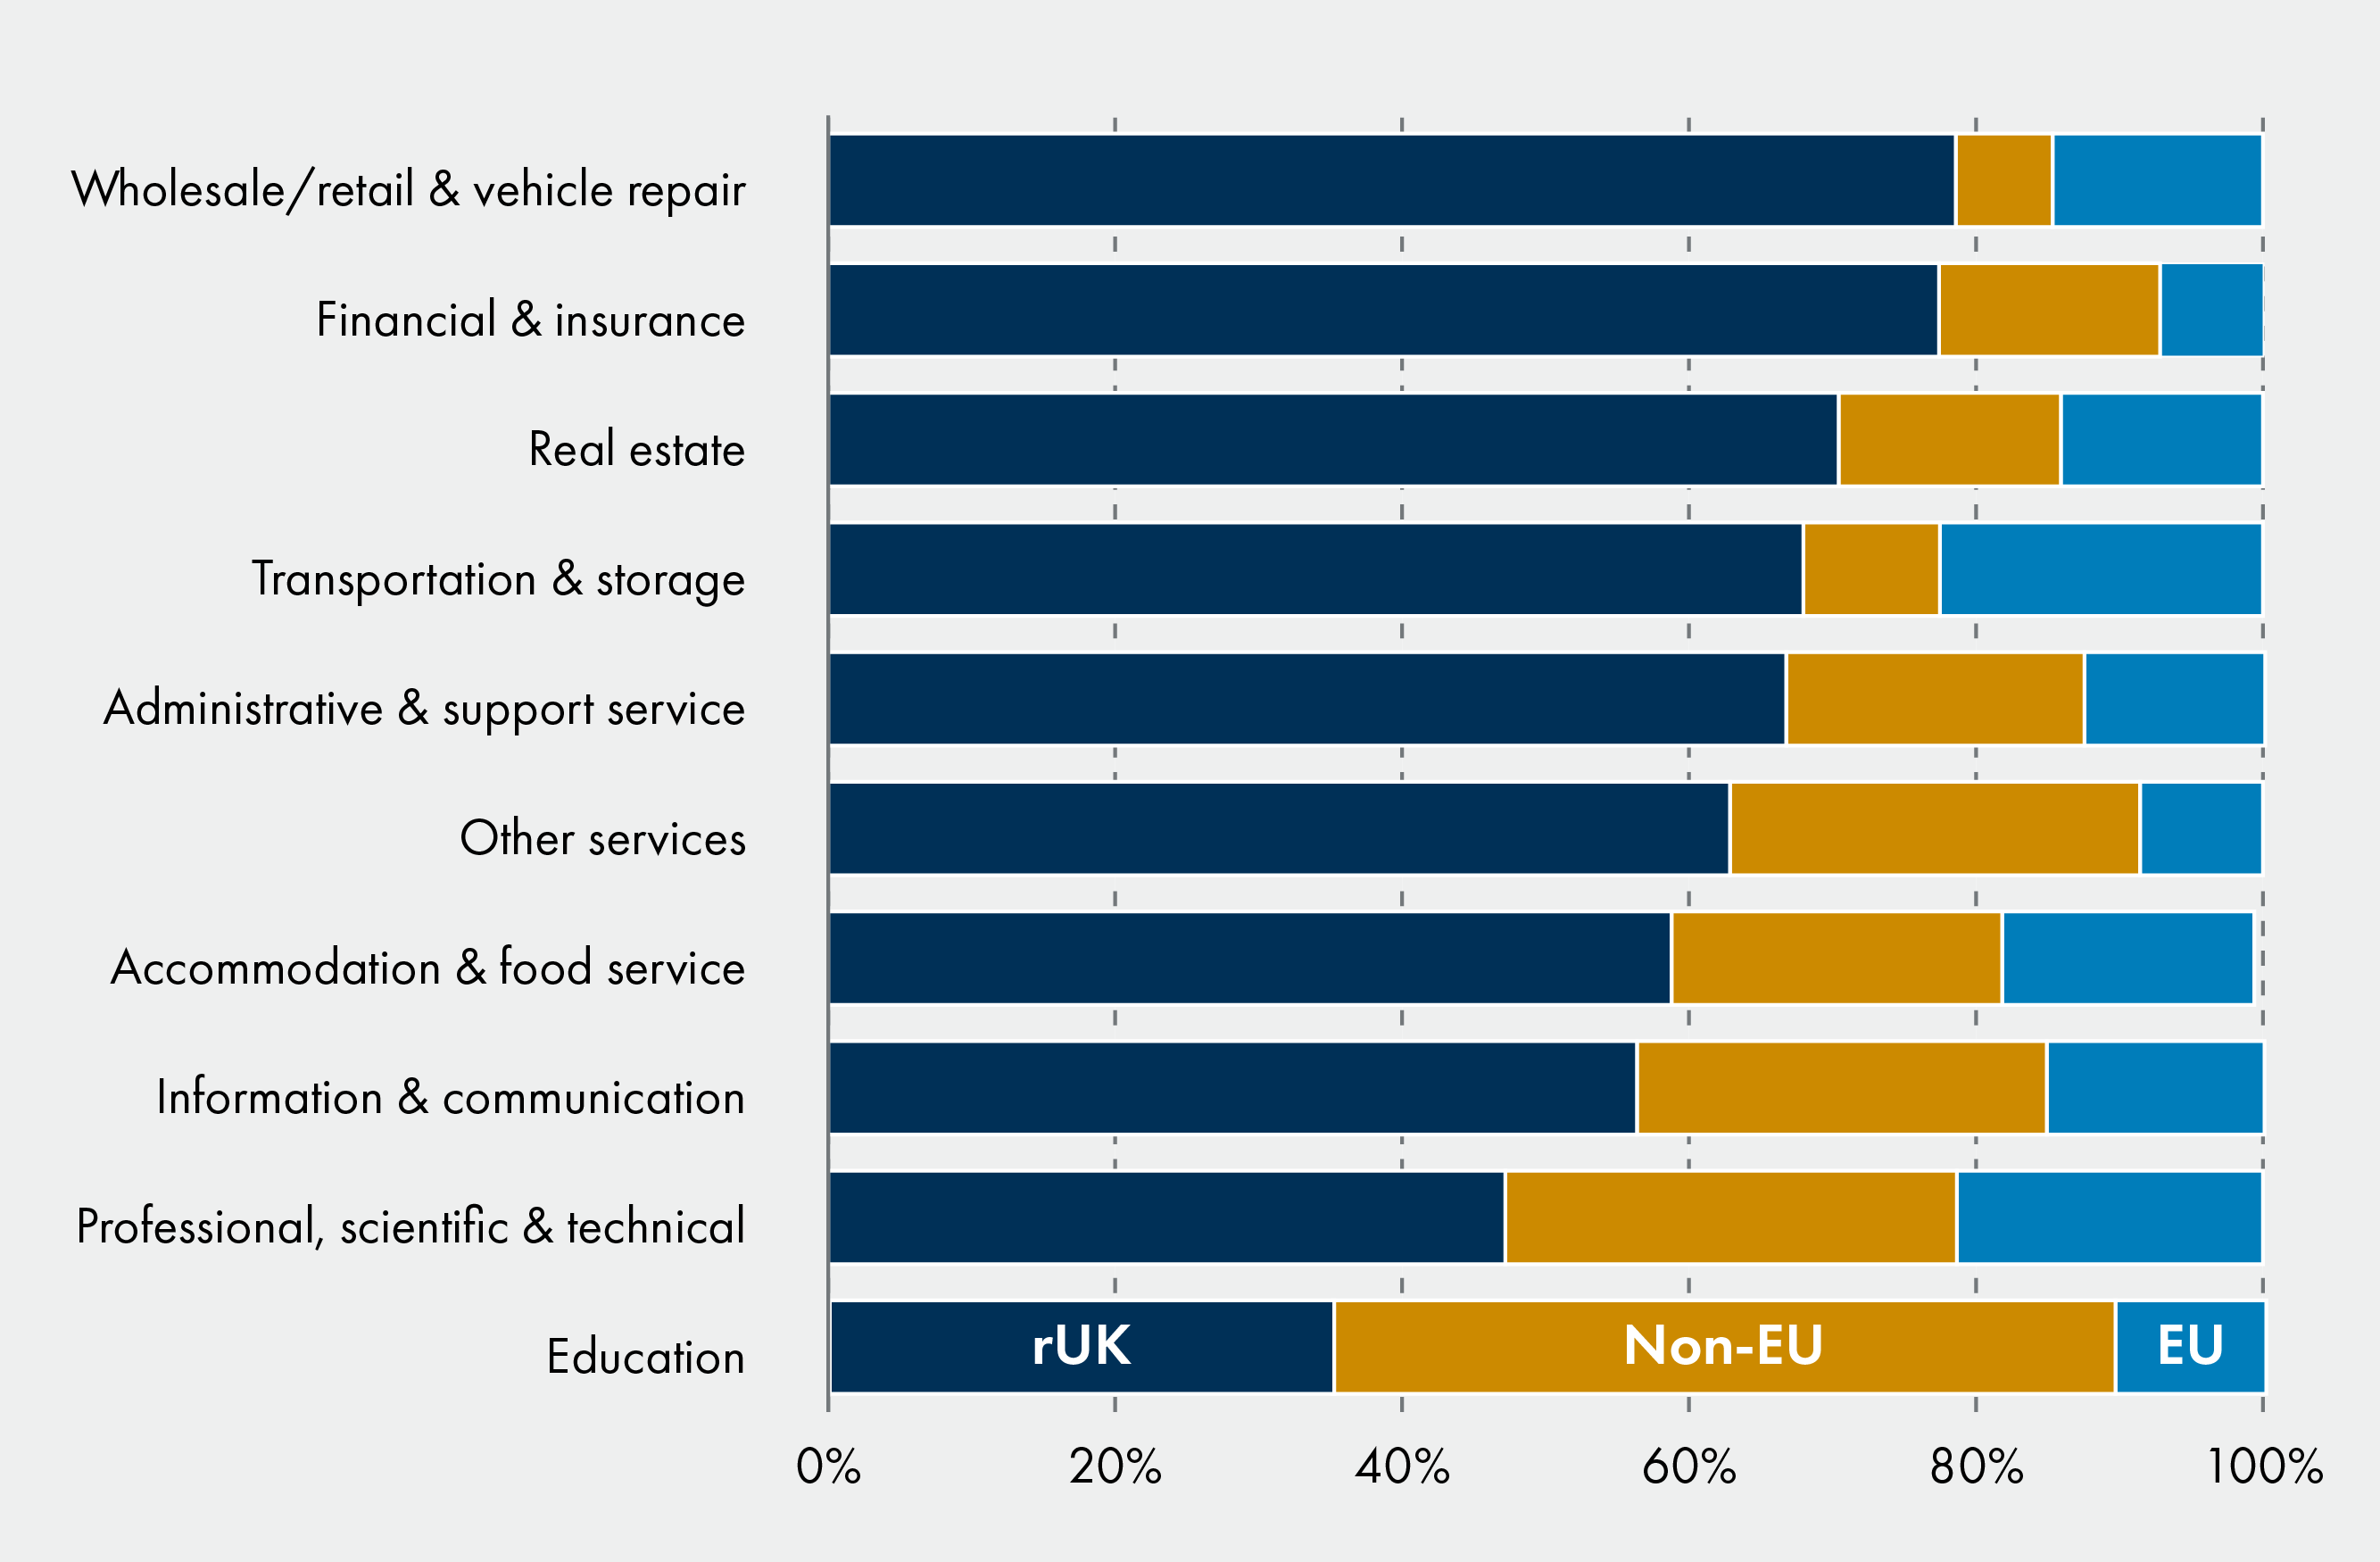
The majority of service exports are to the rUK; in 2023 rUK service exports were worth £29.8 billion (65.7%), followed by non-EU exports at £9.1 billion (20.0%), and EU exports at £6.5 billion (14.3%). Education (35.1% to rUK) and Professional, scientific and technical (47.2% to rUK) are the only sectors where more is exported to international destinations than to the rest of the UK.
Export Statistics Scotland 2023
Exports of education include the cost of students from outside of Scotland taking courses at Scottish educational settings - in other words UK and international students spending on tuition fees is recorded as an export of education services. When we look at education exports data in more detail it shows that while overall there has been an increase in value, it varies across destination.Adjusting for inflation, education exports grew by 13.1% between 2019 and 2023. This has been driven entirely by growth in education exports to the rest of the world, which have increased by 62.4% between 2019 and 2023. Exports to the rUK (-9.2%) and to the EU (-35.4%) both declined over the same period.
The Fraser of Allander nowcast suggests that international exports of education have continued to grow in 2024 and 2025, from £1.4 billion in 2023 to £1.7 billion in 20251.
Financial services
Financial services remain a significant sector in Scotland's economy. The Trade in Services Report notes that in 2022 the Gross Value added was £14.3 billion, which was 8.6% of the Scottish economy, and as noted earlier in this briefing financial services account for just over one quarter of all service exports by value (25.1%).
The guidance note for the Global Connections Survey1, which is the source of data for Export Statistics Scotland, notes that financial service exports include sales of bank and building society services, earnings on foreign exchange transactions, investment management fees and fees generated from advisory and other related functions, insurance service charges for direct insurance such as health, property and transport insurance, and service charges associated with pension schemes.
Export Statistics Scotland show that total financial service exports were worth £11.4 billion in 203 - as noted earlier this is just over one quarter of all service exports by value. The majority of financial services exports go to the rest of the UK. In 2023, £8.8 billion went to the rest of the UK which is 77.4% of total financial services exports. Of the rest 7.2% went to the EU and 15.4% went to non-EU destinations.
In 2023 financial services made up:
16.5% of services exports to international destinations
12.6% of services exports to the EU
19.3% of service exports to non-EU destinations
29.5% of services exports to the rest of the UK.
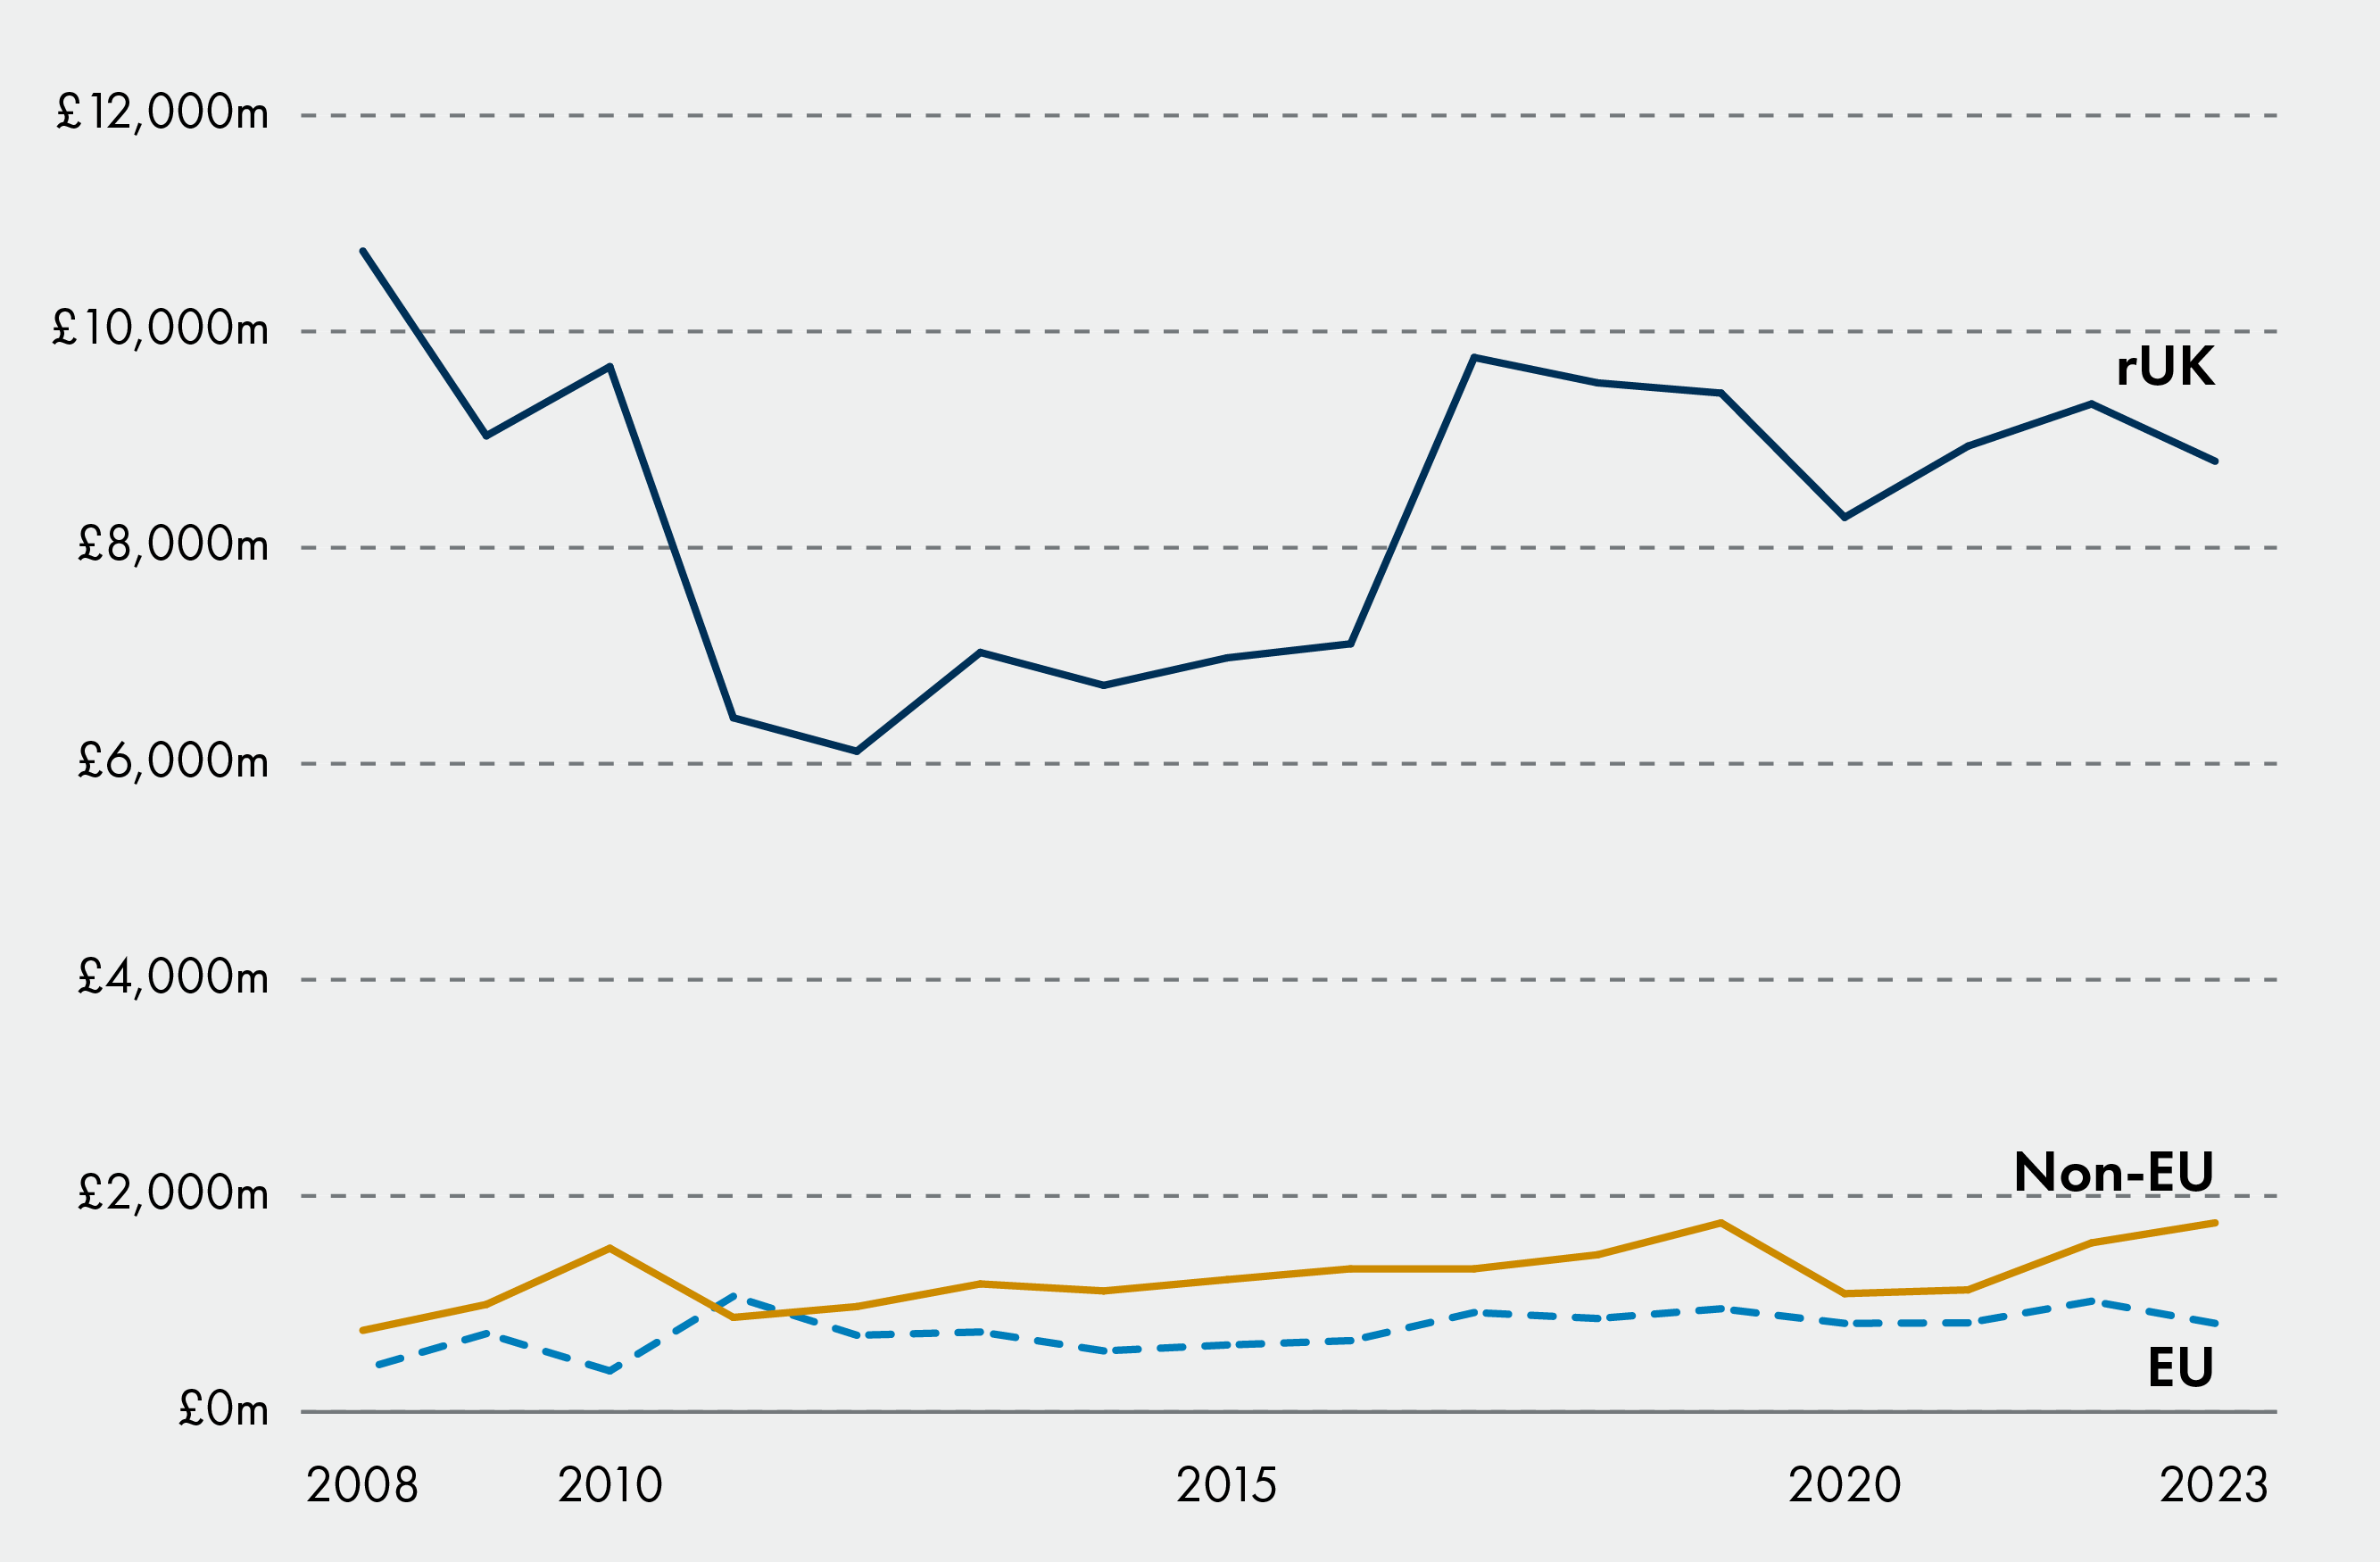
Export Statistics Scotland 2023
Overall, the value of financial services exports fell by £550 million in 2023, a reduction of 4.6% since 2022. In real terms, this is a reduction of £1.3 billion, or 10.3%. There is a variation across destinations:
Rest of the the UK exports reduced by £1.1 billion in real terms (-11.3%)
EU exports exports reduced by £270 million in real terms (-24.8%)
Non-EU exports grew by £86 million in real terms (+5.1%).
In March 2026 The City UK published a report on 'Exporting from across Britain: Financial and related professional services 2026'2. This report looks at international exports of financial and related services from Scotland, so not quite the same basis or geography as ESS, but provides some further detail on Scotland's financial services exports. The report notes that in 2023, Scotland accounted for 7.7% of the UK's international exports of financial services, and 4.2% of related professional service exports. 71% of Scotland's international exports were to the rest of the world, with the remaining 29% going to the EU.
The report draws on ONS data going back to 2014, which shows that international exports of financial services from Scotland increased significantly between 2015 and 2019, growing by 61% over this period from £5.2 billion to £8.4 billion. After dipping to £7.6 billion in 2020, financial service exports have grown to reach £10.3 billion in value in 2023.
Wholesale and retail trade
'Wholesale and retail trade; repair of motor vehicles and motorcycles' is the second largest sector of Scotland's service exports.
The Scottish Government explains in their guidance note for the Global Connections Survey that exports from retail include all sales to tourists and other visitors to Scotland, as well as online sales, shipped products and sales with reclaimable VAT.
The majority of Scottish exports of wholesale and retail trade are to the rest of the UK, consistent with most service exports. In 2023, £8.0 billion went to the rest of the UK (78.6%). Of the rest 14.7% went to the EU and 6.7% went to non-EU destination.
In 2023 wholesale and retail trade exports accounted for:
14.1% of services exports to international destinations
23.1% of services exports to the EU
7.6% of service exports to non-EU destinations
27.0% of services exports to the rest of the UK.
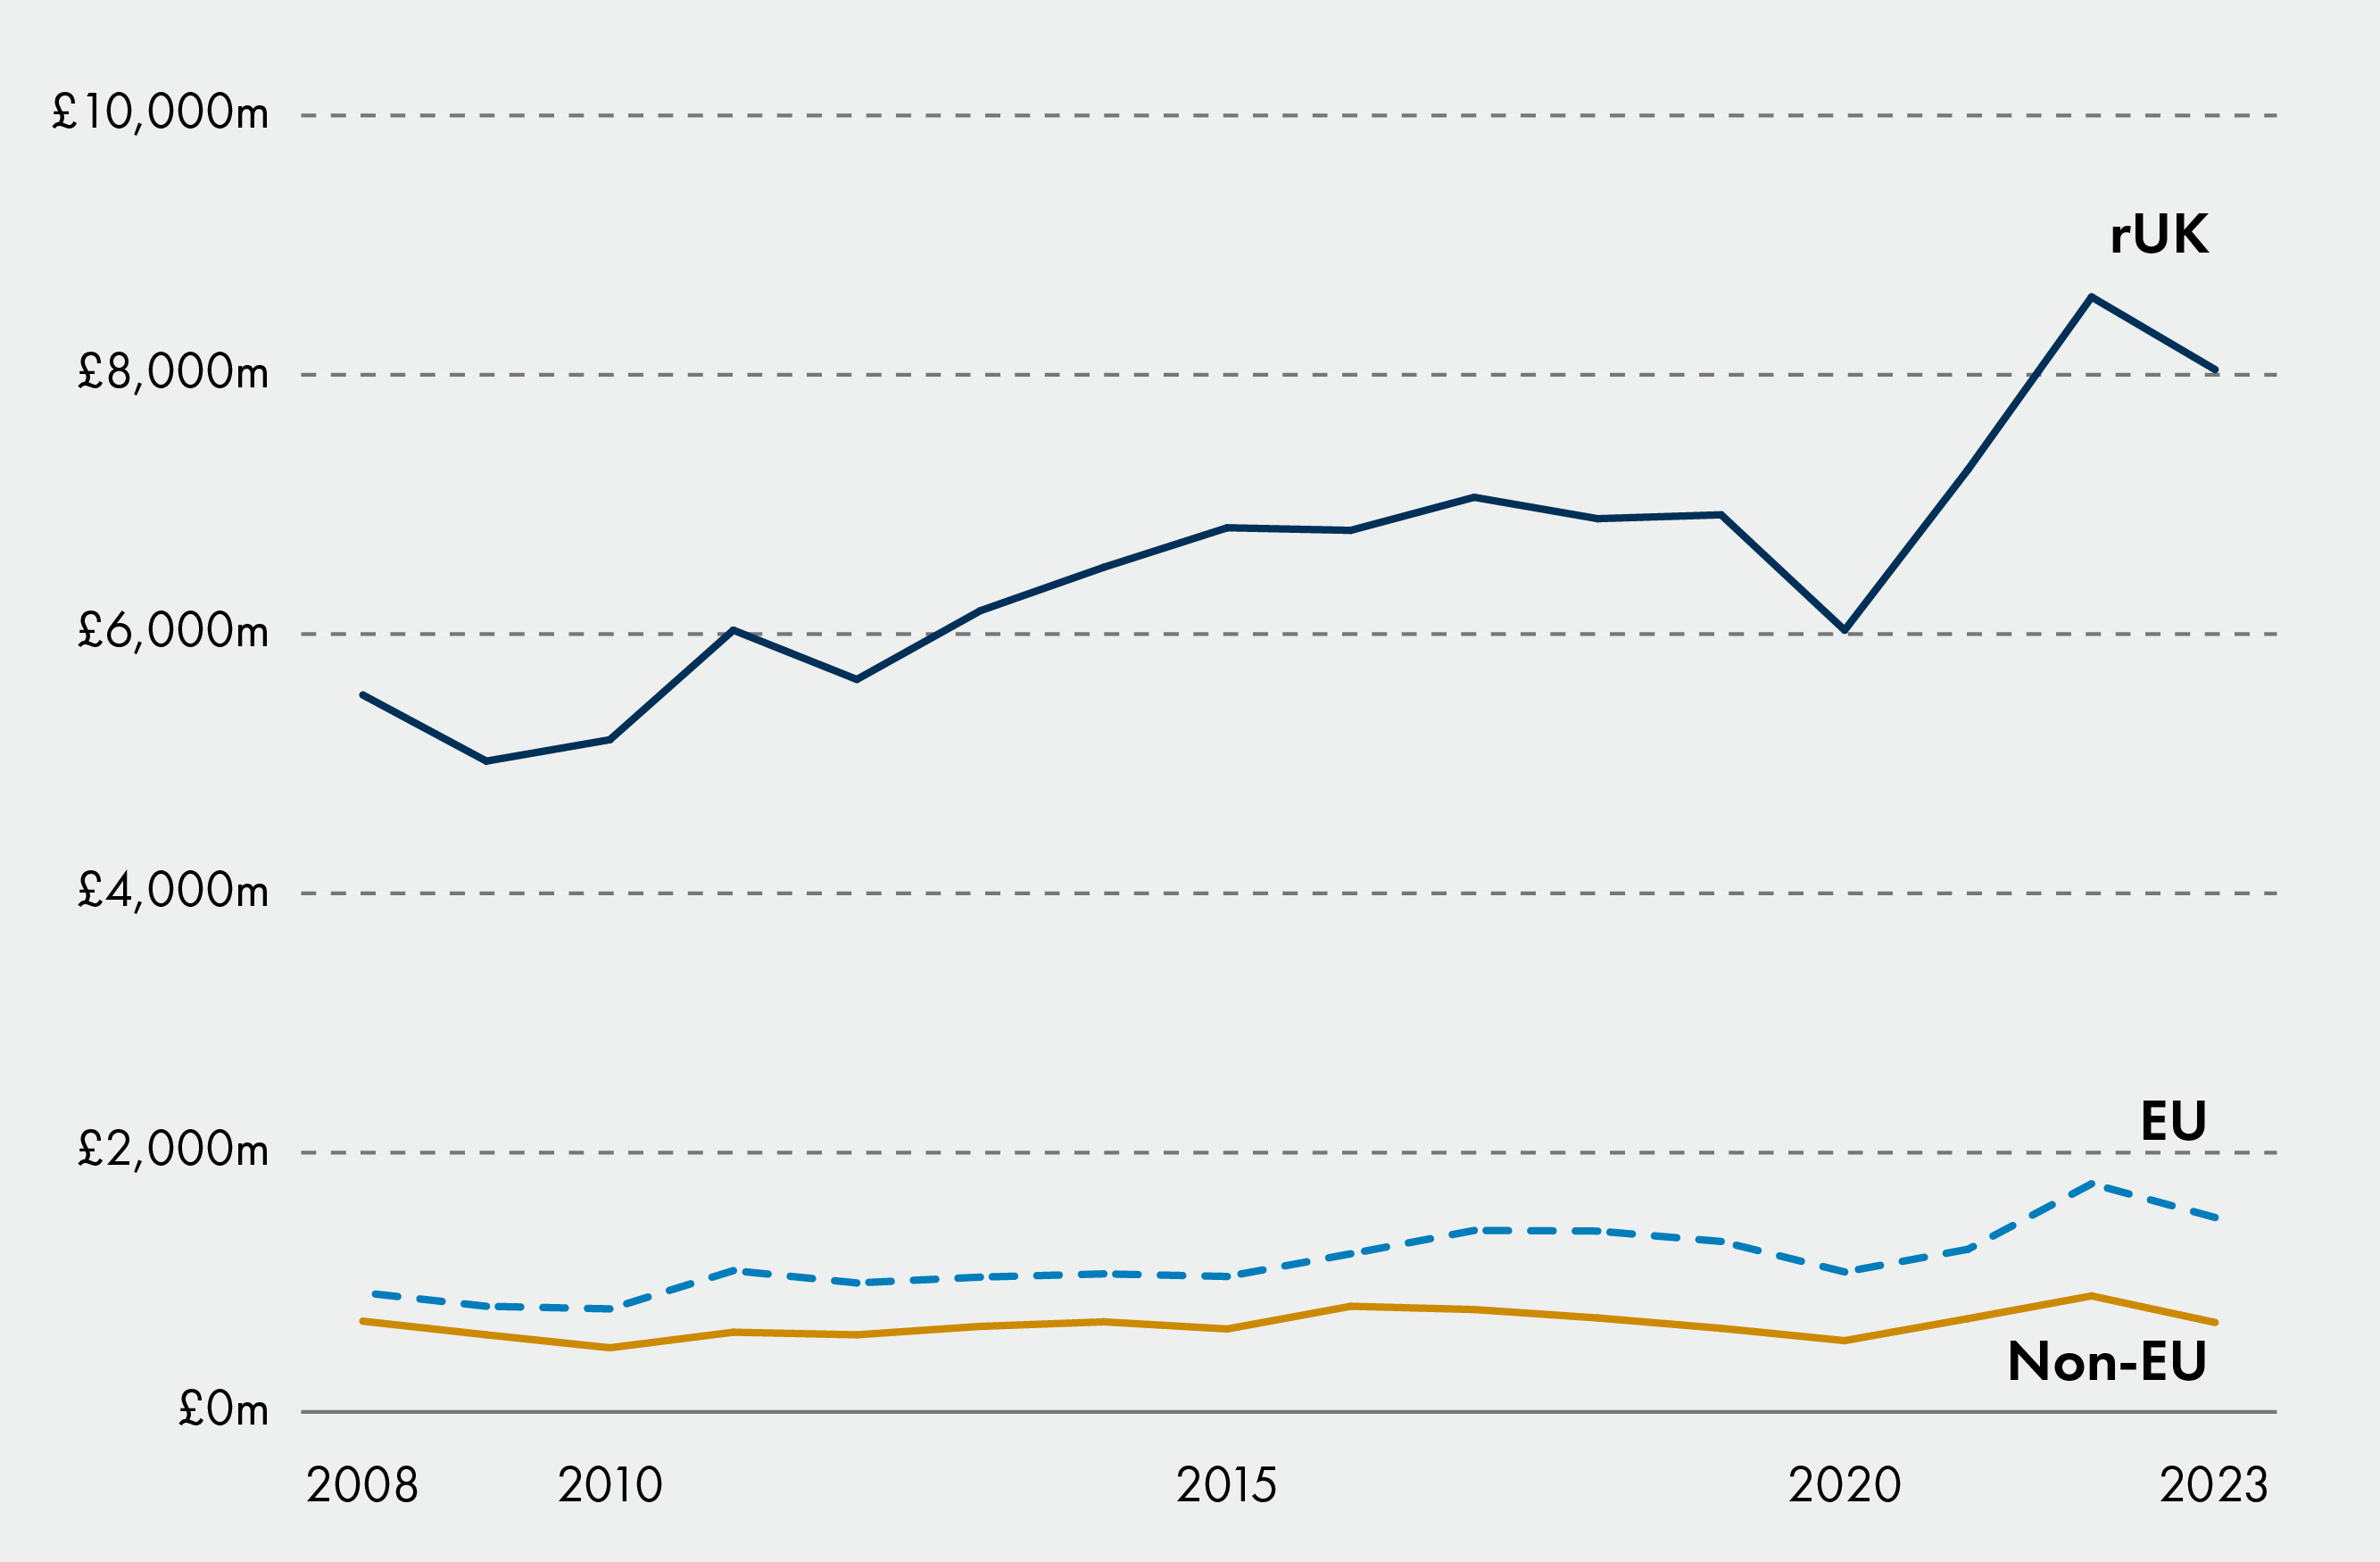
Export Statistics Scotland 2023
Overall, the value of wholesale and retail trade exports increased between 2019 and 2023 in nominal terms, by £1.4 billion (15.2%). In real terms however, this was a reduction of £308 million (-2.9%). Wholesale and retail exports to all destinations declined in real terms:
Exports to the rest of the UK declined by £172 million in real terms (-2.1%)
Exports to the EU declined by £60 million in real terms (-3.9%)
Exports to the rest of the world declined by £75 million in real terms (-9.9%).
Food and drink
For this section when we talk about food and drink, we have combined the 'Food and live animals' and 'Beverages' classifications used in the Regional Trade Statistics. This provides the most timely data on goods exports from Scotland, but covers only international exports, in other words it does not include exports to the rUK. Overall, between 2016-17 and 2025-26 the value of Scotland's international food and drink exports decreased by £491 million in real terms (-6.6%). This decrease has not been uniform however. If we convert the last 10 years of data into 2025-26 real terms, the value of food and drinks exports peaked in 2022-23 at £8.7 billion.Since then it has declined by an average rate of 7.4% per year.
In 2025-26, Scotland accounted for 27.4% of the UK's value of food and drink exports.
Beverages exports (mainly whisky), worth £4.9 billion and seafood exports, worth £1.1 billion, were Scotland's two most valuable food and drinks exports in 2025-26. Taken together, these account for 86.2% of Scotland's food and drink exports. Since 2016-17, the value of beverages exports has decreased by 5.9% in real terms, whereas the value of seafood exports has decreased by 2.4% in real terms.
The following table provides a breakdown of the value of food and drink exports by commodity grouping in 2016-17 prices.
| Commodity Group | 2016-17 | 2019-20 - real | 2025-26 real | Change: 2016-17 to 2019-20 | Change: 2016-17 to 2025-26 | Change: 2019-20 to 2025-26 |
|---|---|---|---|---|---|---|
| Beverages | 5,172 | 5,522 | 4,869 | 350 | -303 | -653 |
| Seafood | 1,118 | 1,260 | 1,091 | 142 | -27 | -169 |
| Feeding stuff for animals | 221 | 246 | 278 | 25 | 57 | 32 |
| Cereals & cereal preparations | 230 | 226 | 206 | -5 | -24 | -19 |
| Meat & meat preparations | 131 | 136 | 143 | 5 | 12 | 6 |
| Live animals | 77 | 67 | 108 | -10 | 31 | 41 |
| Miscellaneous edible products & preparations | 50 | 65 | 70 | 15 | 20 | 5 |
| Vegetables & fruit | 87 | 102 | 66 | 15 | -20 | -36 |
| Dairy products & birds' eggs | 61 | 66 | 59 | 5 | -2 | -7 |
| Coffee, tea, cocoa and spices | 24 | 25 | 23 | 1 | -1 | -3 |
| Sugar, sugar preparations & honey | 28 | 25 | 19 | -3 | -9 | -6 |
HMRC Regional Trade Statistics
As discussed above, international food and drinks exports have decreased in real terms since 2016-17. The table above shows that there have been differing trends in this time though:
After 2017-18, the real value of food and drink exports declined, before recovering from 2020-21 and peaking in 2022-23.
Since then, there has been a steady decline in the value of food and drink exports.
Figure 17 below looks at both the real terms value of food and drinks exports, and the total weight of products being exported (mass). When looking at the breakdown of mass by EU and non-EU destination, we can see that there has been a shift in the balance:
The mass of EU exports has declined by 24.9% between 2016-17 and 2025-26.
The mass of non-EU exports has increased by 24.4% between 2016-17 and 2025-26, although it peaked in 2022-23.
These trends have shifted the balance of food and drink exports by mass. In 2016-17, 55.5% of the mass of food and drink exports were to the EU - by 2025-26 this had reduced to 42.9%.
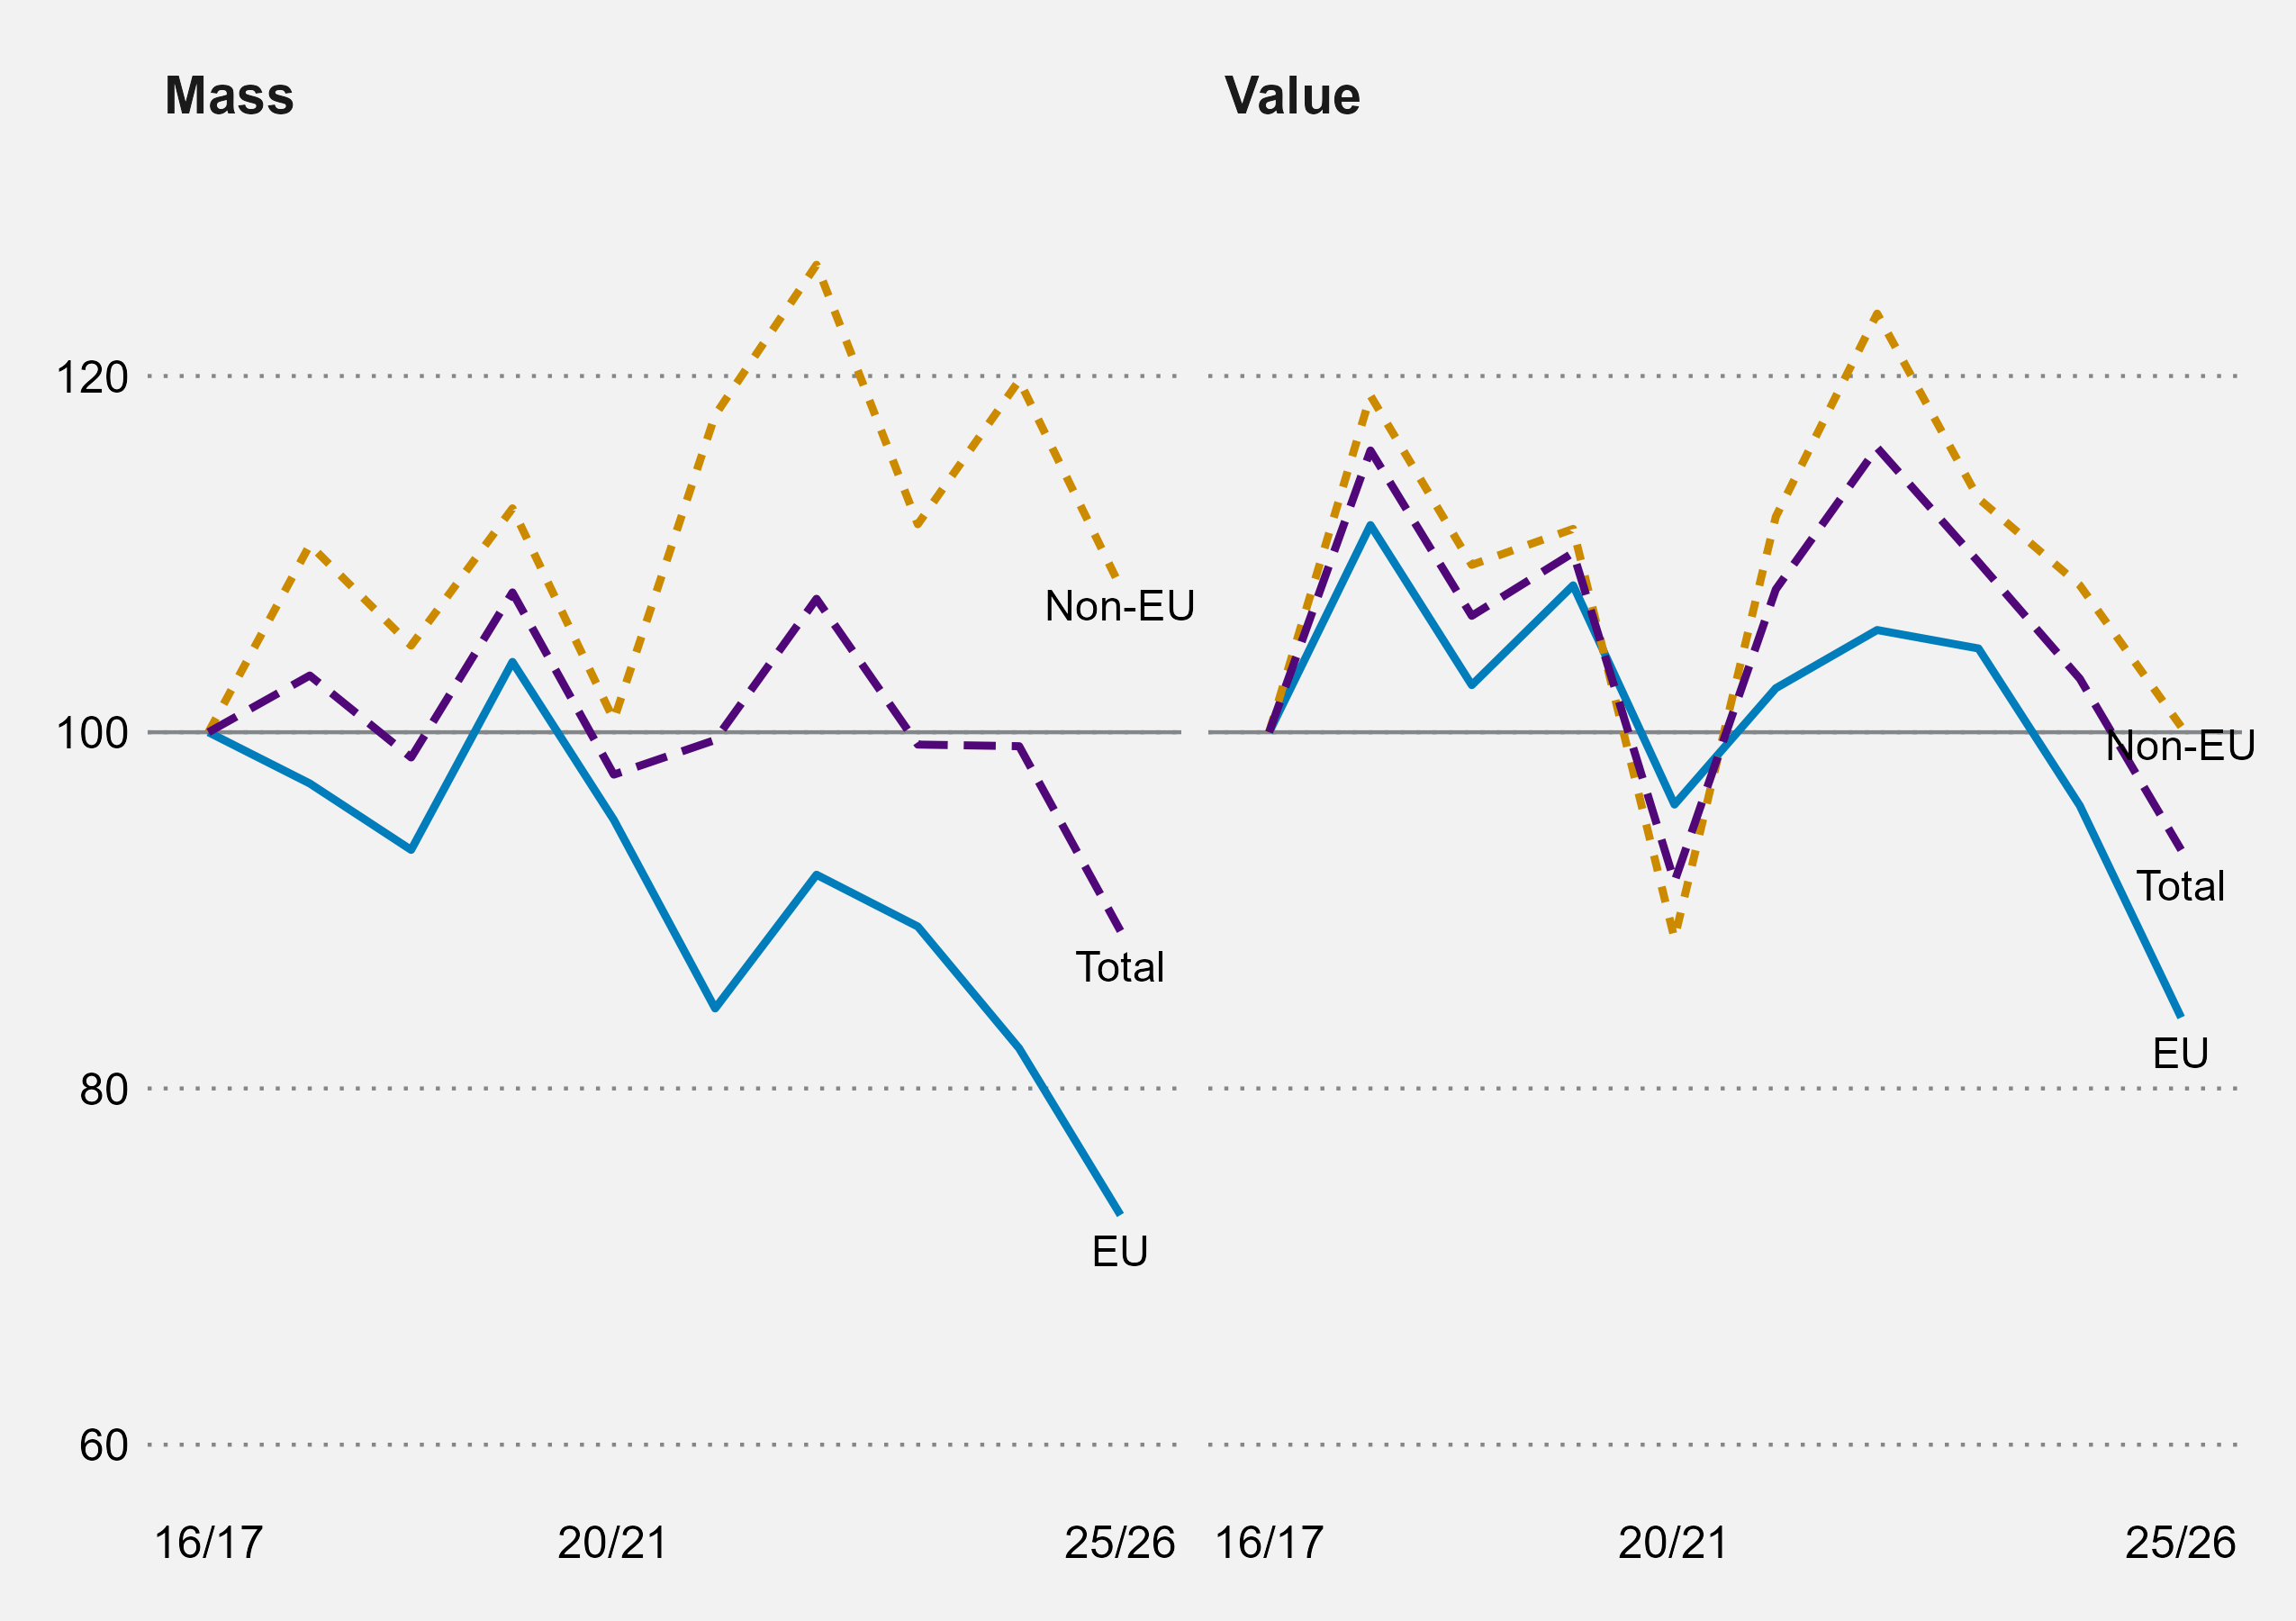
HMRC Regional Trade Statistics
As highlighted above, alongside being the final year before the impact of COVID was felt, 2019-20 was also the final full year during which the UK was a member of the EU Single Market. Perishable goods exports are at particular risk when there are trade disruptions such as those which followed EU exit. For example the new requirements for checks on Scottish exports to the EU and the need for Export Health Certificates for animal and plant based goods are particular issues for perishable items with shorter shelf lives.
In a written submission to the Session 6 Culture, Europe and External Affairs Committee (CEEAC), Scotland Food and Drink highlighted the impact of new procedures on Scottish exporters to the EU following EU exit:
The TCA's provision for zero tariffs and quotas prevented immediate and significant trade barriers with the EU. However, the introduction of non-tariff barriers, such as customs checks and sanitary and phytosanitary (SPS) controls, has created logistical challenges and increased costs for Scottish exporters. The complexity of these new requirements has been particularly challenging for smaller producers, who are vital to the diversity and success of Scotland's food and drink sector
Scotland Food and Drink. (2024, March 27). Submission to the Constitution, Europe, External Affairs and Culture Committee about the EU-UK Trade and Cooperation Agreement (TCA). Retrieved from https://www.parliament.scot/-/media/files/committees/constitution-europe-external-affairs-and-culture-committee/tca-scotland-food-and-drink.pdf
Scotland Food and Drink set out that the main impact had been on perishable goods such as seafood and meat and dairy which now faced delays and increased costs.
Quality Meat Scotland provided written evidence to CEEAC setting out the experience of Scottish meat exporters to the EU following EU exit:
The introduction of EU border controls on imports of red meat from Great Britain at the beginning of 2021 has had a lasting impact on export activity. Although HMRC trade statistics suggest that overall UK export volumes of beef and lamb to the EU have rebuilt to similar levels to the five-year average from before the Ccovid-19 pandemic, with beef volumes 4.2% lower and lamb shipments down just 0.2% compared to the 2015-19 average for the January to August period, the structure of trade has changed. For beef (HS 0201 & 0202), bone-in products have increased in share at the expense of boneless cuts, while for sheepmeat (HS0204), carcasses have increased their dominance of export volumes from 67.5% in 2015-19 to around 87% in 2023.
Quality Meat Scotland. (2024, June 6). Review of EU-UK Trade and Cooperation Agreement. Retrieved from https://www.parliament.scot/-/media/files/committees/constitution-europe-external-affairs-and-culture-committee/tca-qms.pdf
Quality Meat Scotland also highlighted that the challenges have been greater for smaller exporters with larger companies showing more resilience and better able to adapt:
This reflects the greater ability for larger exporters to consolidate a range of products from multiple sites into single export deliveries and to absorb the additional cost and time required for filling out paperwork. For smaller exporters sending smaller loads which need to be grouped with those of other firms, exports continue to face much greater disruption and cost, and some smaller firms have exported significantly less, or even stopped exports altogether due to the level of cost becoming prohibitive.
Quality Meat Scotland. (2024, June 6). Review of EU-UK Trade and Cooperation Agreement. Retrieved from https://www.parliament.scot/-/media/files/committees/constitution-europe-external-affairs-and-culture-committee/tca-qms.pdf
Quality Meat Scotland also highlighted a significant effect of EU exit in terms of the type of produce Scottish meat exporters can send to the EU with the export of mince and meat preparations such as sausages prohibited due to the EU's sanitary and phytosanitary rules. This change in type of produce which can be exported to the EU following EU exit is exemplified by the 28% increase in the export of live animals from Scotland to the EU between 2019-20 and 2023-24. This change means that more of the processing of Scottish meat products will be taking place in the EU before being shipped to its final destination.
These issues have been exacerbated by continued turbulence in international trade, with the Food and Drink Federation noting that UK food and drink export volumes had still not recovered to pre-Brexit levels:
In particular, EU food export volumes are still nearly a third (31%) lower in 2025 than 2019 levels. This is because of the added complexity that businesses face trading with our most important trade partner, the EU.
...
The additional tariffs imposed by the US in the second half of 2025 had a significant impact on global supply chains. The UK’s exports to the US, our largest market outside the EU, dropped 8.9% in H2 2025 compared to H2 2024. This is a stark contrast to the 18.9% rise in the first half of 2025, before the full impact of the new tariff regime.
Food & Drink Federation. (2026, March 31). Food and drink export values reach record high in 2025, but volumes fail to return to pre-Brexit levels. Retrieved from https://www.fdf.org.uk/fdf/news-media/press-releases/2026/food-and-drink-export-values-reach-record-high-in-2025-but-volumes-fail-to-return-to-pre-brexit-levels/
Seafood
As highlighted in the food and drink case study, perishable goods have been particularly hit by EU exit with new checks and paperwork required on all Scottish animal and plant exports to the EU. The Scottish seafood industry has been significantly hit by the new non-tariff barriers.
As Figure 18 below shows, between 2019-20 and 2025-26 the value of total seafood exports fell by 11.2% in real terms and the weight of exports fell by 6.3%. There were different trends for exports to the EU and out with the EU:
The mass of exports to the EU declined by 24.7% between 2019-20 and 2025-26, while the real terms value declined by 26.3%.
Conversely, the mass of exports outside of the EU increased by 83.3%, while real terms value increased by 38.1%.
Exports to the EU still account for the majority of international seafood exports though; even after this shift since 2019-20 EU exports account for 63.5% of the value and 66.7% of the mass in 2025-26. However, this has reduced from 76.5% of the value and 79.2% of the mass in 2019-20.
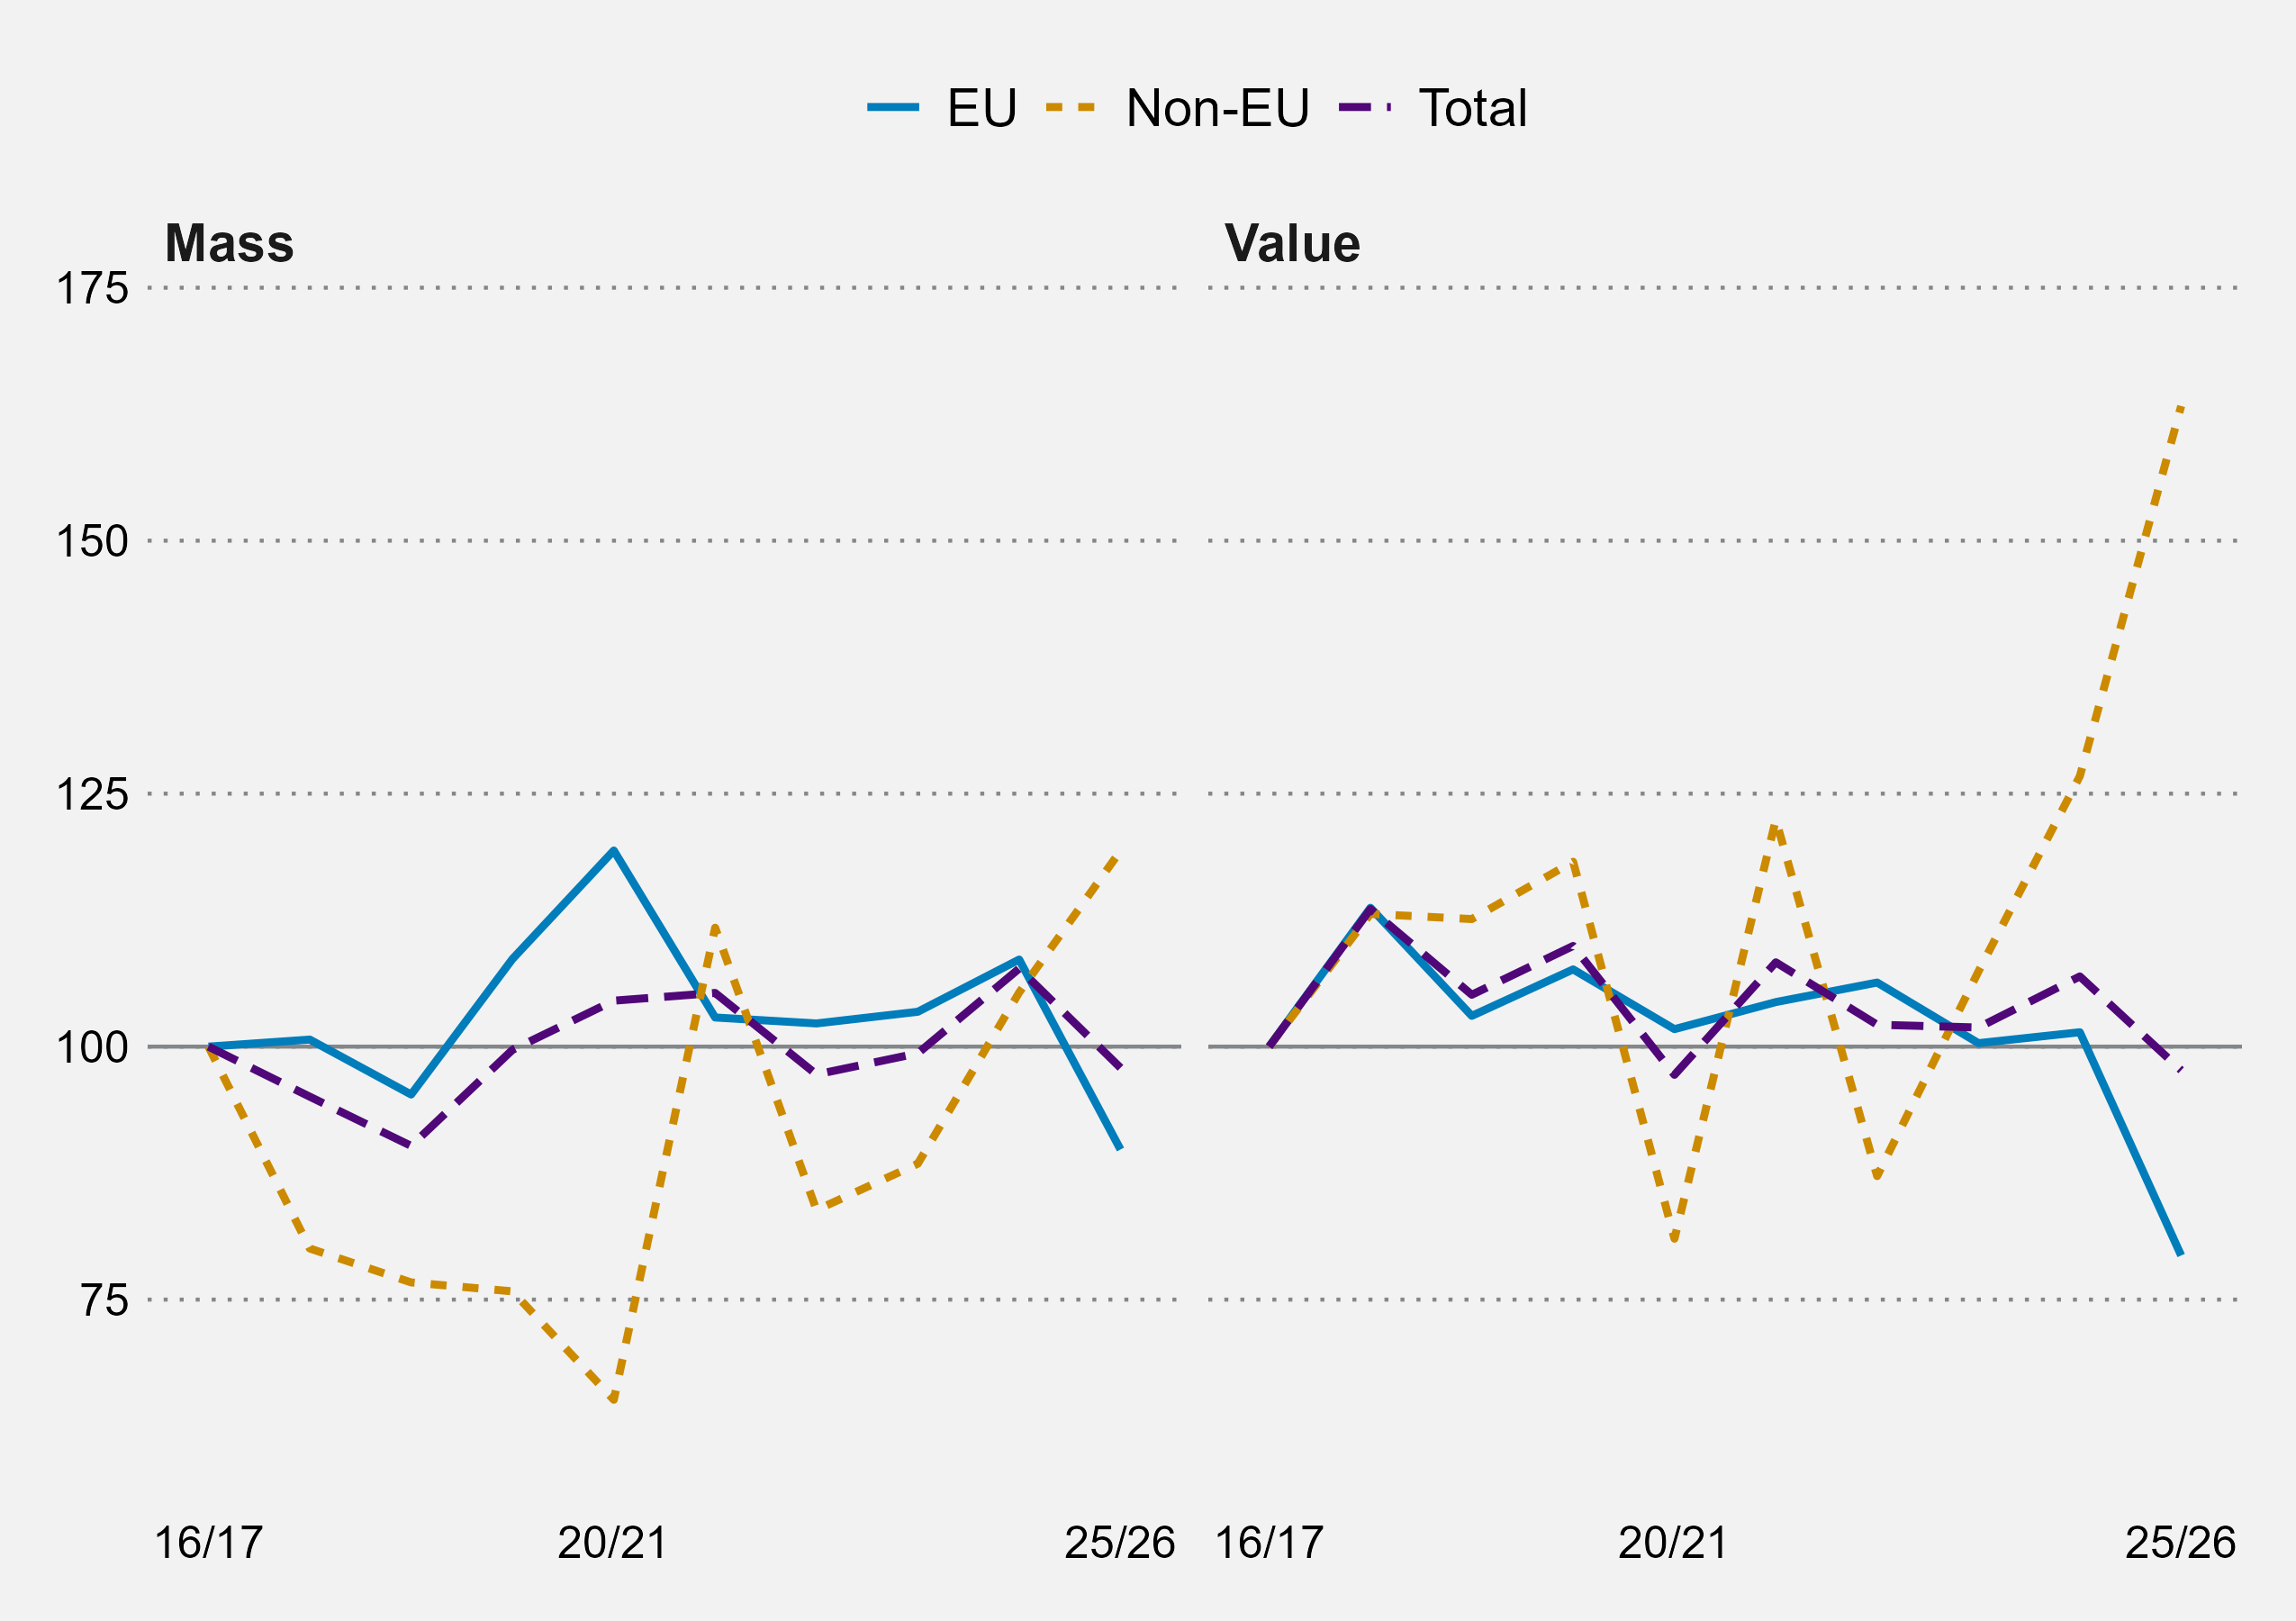
HMRC Regional Trade Statistics
In 2025-26, France accounted for 73.5% of the total value of Scotland's seafood exports to the EU.
In correspondence with SPICe, Seafood Scotland, the national trade and marketing body for the industry in Scotland, explained that the main reasons for the variations in Scotland's seafood exports to the EU were socio economic, and related to four issues:
The majority of exports redirected to Western Europe transport hubs
Departure from the European Union and the subsequent logistical issues redirected exports to the largest European trade hubs such as France and the Netherlands to the detriment of smaller entry ports. Exports are monitored up to their landing in the EU and their intra-EU destination is often unknown; this means that while the value of exports have grown to France and the Netherlands, products could travel further to other European markets.
Local investments in fish processing in Eastern Europe
For more than a decade, Poland’s fish processing sector has gone through a considerable transformation and has become one of the largest in Europe thanks in part to a low-cost workforce, and easy access to other EU markets from a transport and regulatory perspective. Lithuania is also benefiting from a growing interest in its processing industry. These factors have led to a growth in Scottish seafood exports going to Poland for processing before being circulated more widely across the European Union.
Tourism rebound
Post-Covid, an intra-EU tourism rebound also partially drove hospitality industry demand for products such as seafood from Scotland, especially as tourism numbers got closer to pre-pandemic levels.
Inflation
In the UK, inflation during 2023 impacted negatively on UK demand for seafood products, which are usually more expensive than other food options. This meant more seafood from Scotland was exported, for example to the EU.
In written evidence to the CEEAC, Seafood Scotland described the nature of post-EU exit trade with the EU as sub-optimal:
Trade in seafood between the EU and UK is manageable but sub-optimal at present. There are a number of additional trade barriers as a result of EU exit which hampered trade significantly in the early stages and which still represent costs and challenges for the sector, albeit these have reduced over time.
Additional processes, certification and documentation, mainly to ensure compliance with customs rules of origin and SPS requirements under the TCA and to meet EU official controls for third countries, have added a considerable time and cost burden for Scottish seafood traders. The Scottish seafood sector has worked very hard to adapt to the new post-EU exit trading relationship but, in many ways, this effort has been directed to merely “standing still” as regards EU trade, and maintaining trade flows and relationships with EU businesses and customers, rather than growing or improving them from the position prior to EU exit.
Seafood Scotland . (2024, March 27). Briefing Paper: Review of the EU-UK Trade and Cooperation Agreement – March 2024. Retrieved from https://www.parliament.scot/-/media/files/committees/constitution-europe-external-affairs-and-culture-committee/tca-seafood-scotland.pdf [accessed 26 July 2024]
Salmon Scotland set out the post EU trading environment in its own submission to the CEEAC:
In 2019, there were over 53,000 tonnes of Scottish salmon exported to the EU. In 2023, volumes were nearer 44,000 tonnes (a reduction of 9,600 tonnes) leading to a loss in export value to the EU in the region of £80-£100 million.
Salmon Scotland . (2024, March 27). Review of the EU-UK Trade and Cooperation Agreement Brief for Constitution, Europe, External Affairs and Culture Committee meeting . Retrieved from https://www.parliament.scot/-/media/files/committees/constitution-europe-external-affairs-and-culture-committee/tca-salmon-scotland.pdf [accessed 26 July 2024]
Non-EU international exports
In 2019-20 the top five non-EU most valuable export destinations for Scottish seafood were the USA, China, Taiwan, South Korea and Canada. By 2025-26 Canada had replaced South Korea as the fourth most valuable destination while Japan and South Korea were 7th and 8th. Seafood exports to Vietnam grew significantly to £16.5 million, making Vietnam the fifth most valuable non-EU market for Scottish exports. Although seafood exports to Australia declined, Australia still became the sixth most valuable non-EU destination for Scottish seafood exports in 2025-26.
| Country | 2019/20 | 2025/26 | Percentage change - cash terms | Percentage change - real terms |
|---|---|---|---|---|
| United States | 94 | 187 | 100% | 56% |
| China | 32 | 103 | 220% | 150% |
| Taiwan | 21 | 26 | 27% | -1% |
| Canada | 11 | 17 | 55% | 21% |
| Japan | 10 | 5 | -45% | -57% |
| South Korea | 18 | 5 | -74% | -80% |
| Australia | 7 | 6 | -14% | -33% |
| Vietnam | 2 | 17 | 618% | 461% |
HMRC Regional Trade Statistics
Alongside the destinations for Scottish seafood exports highlighted above, the seafood sector has also seen developments of new markets. For example, Scottish seafood exports to India grew by 4,372% (from a low base) to £1.1 million in 2025-26.
Beverages
Beverages are the second most valuable export product from Scotland. In 2025-26, beverages accounted for 15.8% of the value of Scotland's international exports, behind only 'petroleum, petroleum products and related materials' which accounted for 17.1% of the total value. In 2025-26 Scotland accounted for 59.9% of the UK total. In 2025-26 beverage exports from Scotland were worth £4.9 billion, with £1.5 billion going to the EU and £3.4 billion going to non-EU destinations.
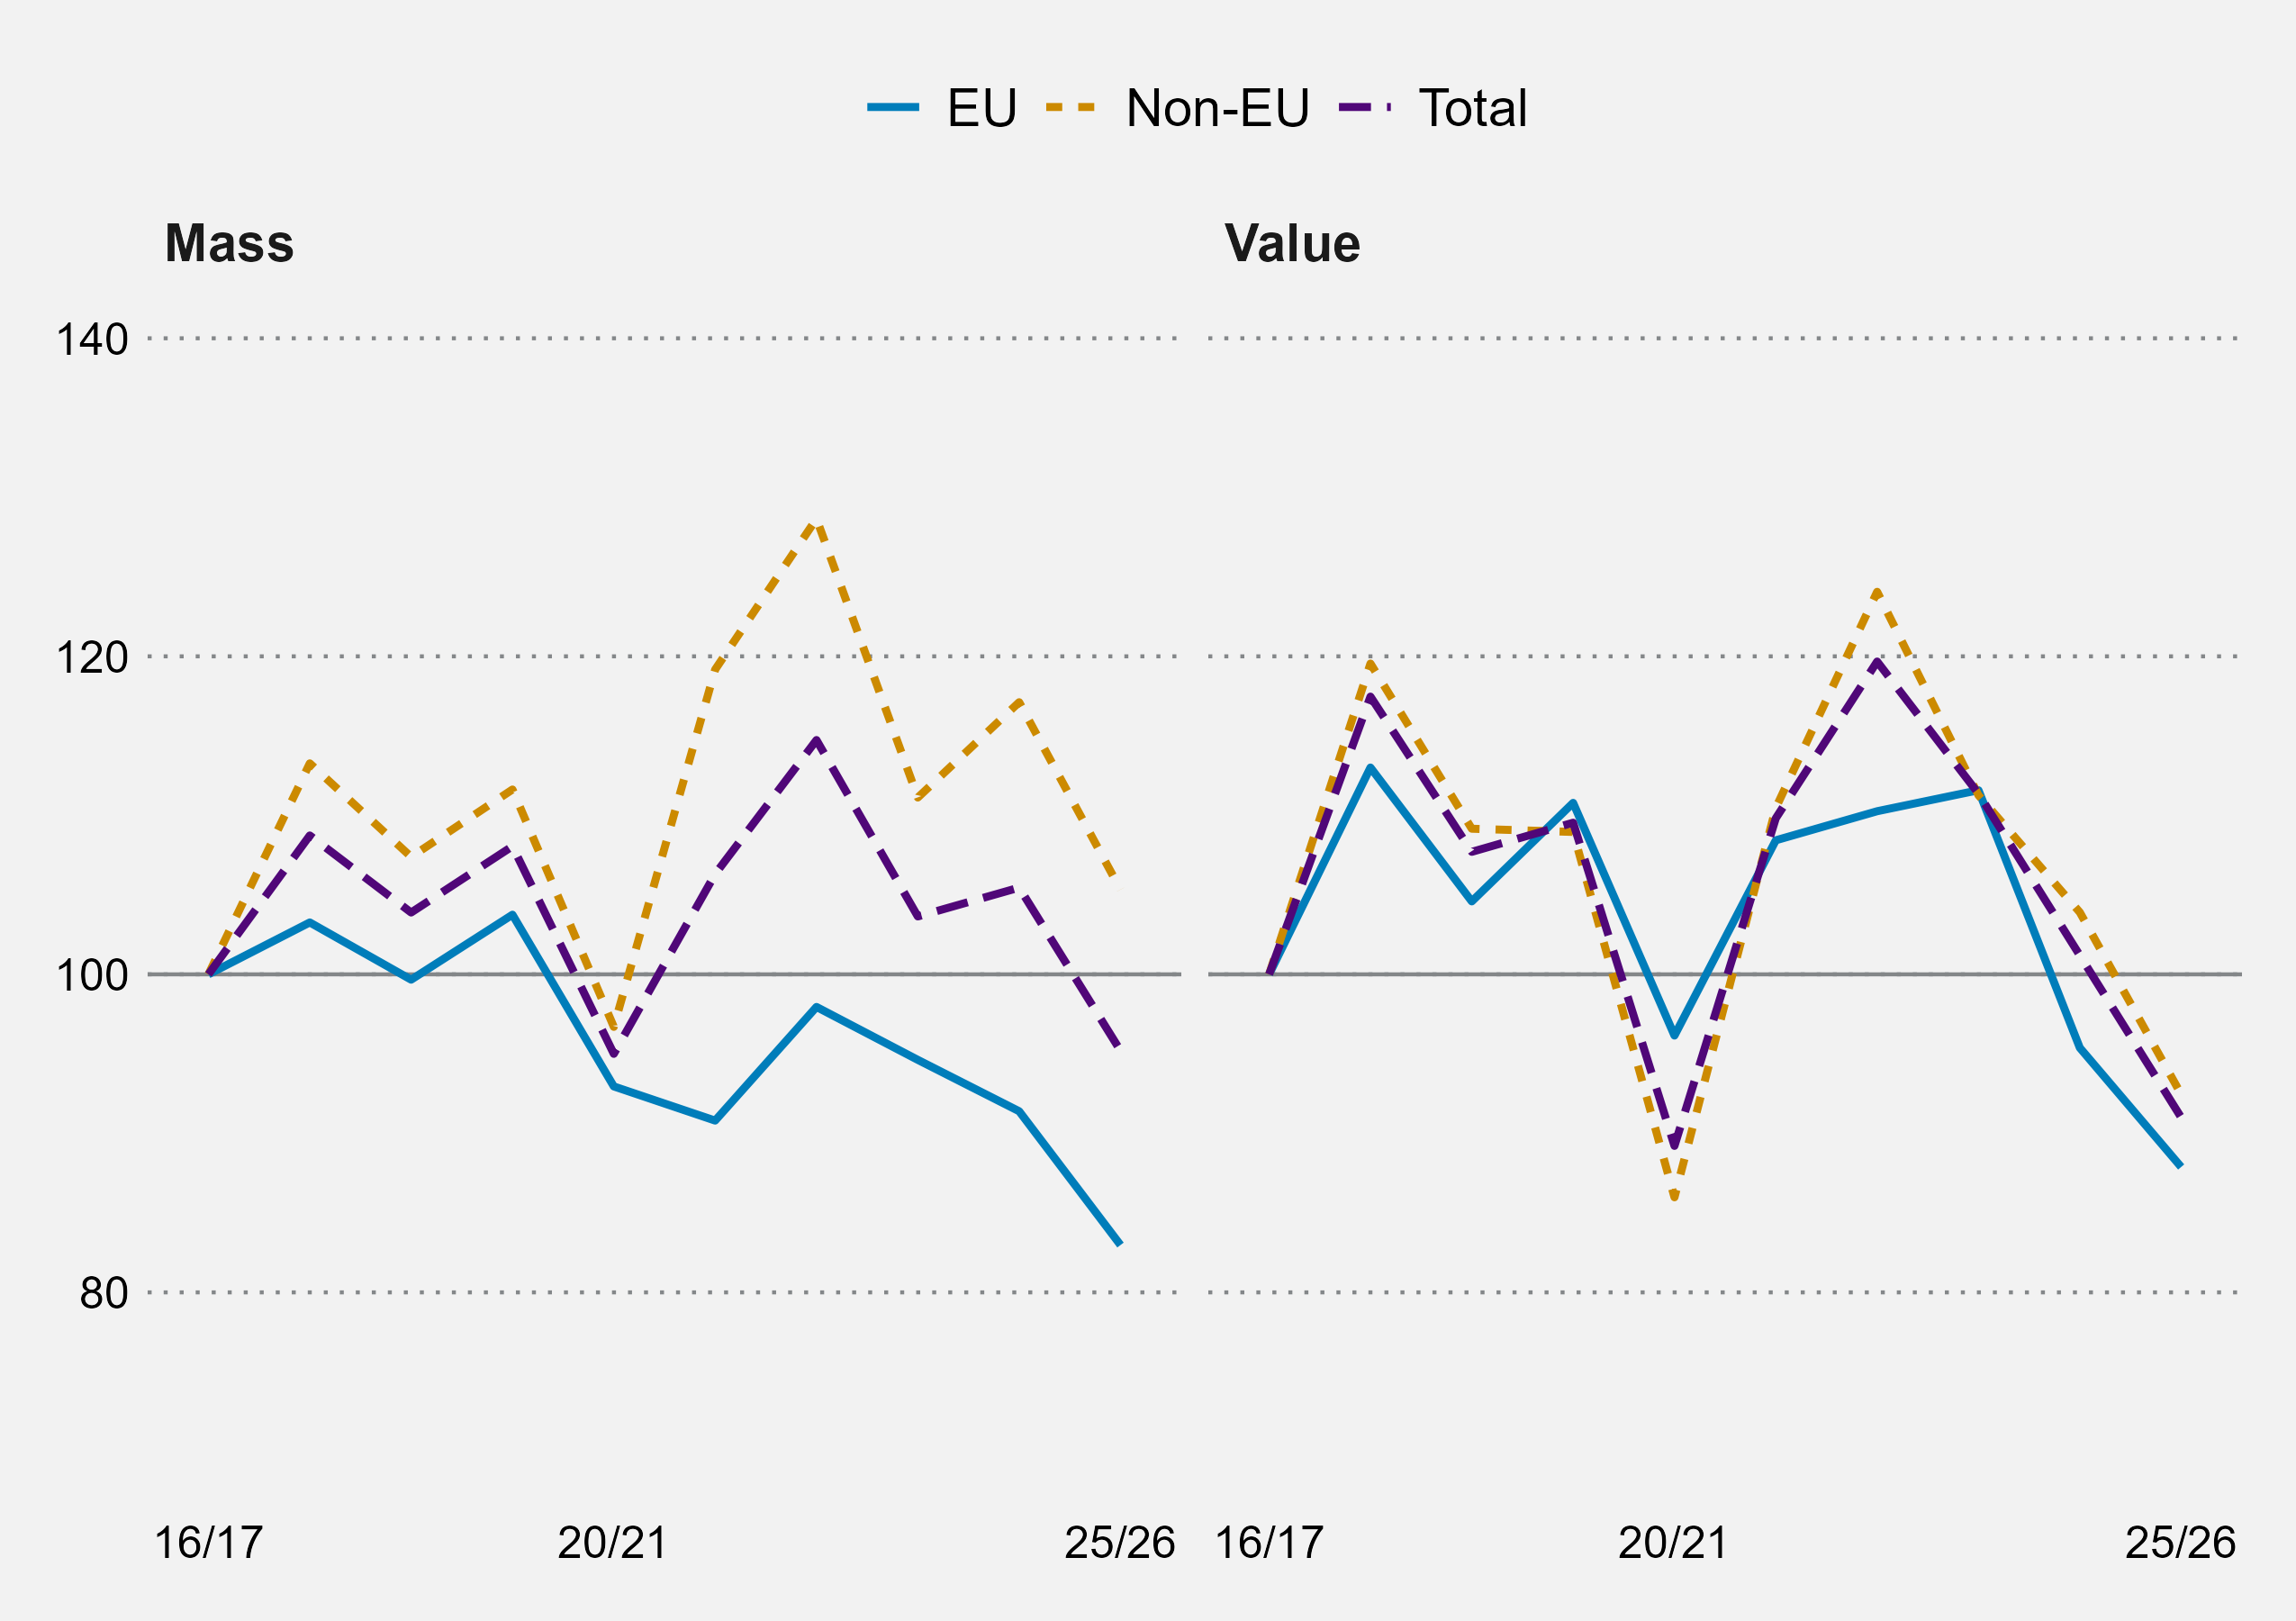
HMRC Regional Trade Statistics
Between 2019-20 and 2025-26, the total value of Scotland's beverage exports increased by £274 million (6.3%), with £21 million of this growth coming from exports to the EU and £253 million from exports outside of the EU. However, in real terms total beverage exports have declined by 16.9% between 2019-20 and 2025-26; exports to the EU are down by 20.7% over this period, and exports outside of the EU are down by 15.1%.
Looking at the mass rather than the value of exports, the volume of beverages exported has declined by 11.9% between 2019-20 and 2025-26. The volume exported to the EU has declined by 20.0%, while the volume exported outside of the EU has declined by 5.6%. The decrease in the volume of exports to the EU closely matches the real terms decrease in the value. However, for exports outside of the EU the value has declined more significantly in real terms than exported volumes have.
Exports to Latvia (-52% in real terms to £93 million) and Netherlands (-50% in real terms to £70 million) are the most significant declines among EU destinations. Despite the overall decline in the value of beverage exports to the EU, there were some growing markets. Exports to Belgium grew by 87% in real terms, reaching £71 million, while exports to Italy grew by 27% in real terms, reaching £81 million.
| Country | 2019/20 | 2025/26 | Percentage change - Cash terms | Percentage change - Real terms |
|---|---|---|---|---|
| France | 372 | 374 | 0% | -21% |
| Spain | 161 | 173 | 8% | -16% |
| Germany | 152 | 167 | 10% | -14% |
| Latvia | 150 | 93 | -38% | -52% |
| Poland | 73 | 91 | 26% | -2% |
| Italy | 50 | 81 | 63% | 27% |
| Belgium | 30 | 71 | 139% | 87% |
| Netherlands | 109 | 70 | -36% | -50% |
| Ireland | 57 | 49 | -14% | -33% |
| Sweden | 43 | 42 | -3% | -24% |
HMRC Regional Trade Statistics
The USA remains the most valuable destination for Scottish beverage exports at £892 million in 2025-26, although this is a decline of 29% in real terms since 2019-20.The most significant growth has been in exports to Turkey, where the value of exports has increased by 278% in real terms since 2019-20 and are worth £210 million in 2025-26. This makes Turkey the third most valuable non-EU destination after the USA and Singapore.
| Country | 2019/20 | 2025/26 | Percentage change - Cash terms | Percentage change - Real terms |
|---|---|---|---|---|
| United States | 980 | 892 | -9% | -29% |
| Singapore | 232 | 213 | -8% | -28% |
| Turkey | 44 | 210 | 383% | 278% |
| India | 128 | 195 | 52% | 19% |
| Taiwan | 165 | 170 | 3% | -20% |
| UAE | 70 | 127 | 81% | 41% |
| China | 87 | 124 | 43% | 12% |
| Japan | 115 | 122 | 6% | -17% |
| Australia | 121 | 112 | -7% | -28% |
| Brazil | 58 | 111 | 93% | 51% |
| Canada | 119 | 106 | -11% | -31% |
| Mexico | 104 | 94 | -10% | -30% |
| South Korea | 74 | 81 | 9% | -15% |
| Panama | 39 | 56 | 45% | 13% |
| Colombia | 38 | 55 | 46% | 14% |
HMRC Regional Trade Statistics
Scotland's biggest beverage export is whisky. According to the Scotch Whisky Association:
43 bottles of Scotch Whisky were shipped every second to around 163 global markets, totalling the equivalent of 1.34bn bottles
In total Scotch Whisky exports were worth £5.3 billion in 2025. According to the Scotch Whisky Association, the EU is now the largest market by value for Scotch Whisky exports, passing the Asia Pacific region:
The EU remains Scotch Whisky’s biggest regional market by volume and has reclaimed its position as the largest regional market by value. It totalled £1.5bn in exports in 2025 (down -1.8% on 2024), with the equivalent of 444m bottles exported (down -9% on 2024). Asia Pacific, previously the Scotch Whisky sector’s most valuable regional market, saw a fall of -8.3% in value, with export volume remaining relatively steady (+0.08%) in 2025.
...
Asia Pacific, previously the Scotch Whisky sector’s most valuable regional market, saw a fall of -8.3% in value, with export volume remaining relatively steady (+0.08%) in 2025.
The SCotch Whisky Association. (2026). Scotch Whisky: An Internationally Traded Spirit. Retrieved from https://www.scotch-whisky.org.uk/industry-insights/international-trade/
Another beverage Scotland is famous for is Irn Bru which is manufactured by AG Barr. The 2026 Annual Report for AG Barr states that international exports of all its products were worth £18.5 million in 2026 which is a decrease of £0.5 million compared to 20252.
Mineral fuels, lubricants and related materials
Data on these goods exports are taken from HMRC Regional Trade statistics. Mineral fuels, lubricants and related materials include the following categories of goods:
Coal, coke & briquettes
Petroleum, petroleum products & related materials
Gas, natural & manufactured
Between 2016-17 and 2025-26, the total value of these exports has increased by £1 billion to £8 billion. This represents a 14.8% increase in nominal terms, but in real terms is a decrease of 15.6%.
However, the profile of this has been uneven. The value of these exports peaked at £12.8 billion in 2019-20 in nominal terms, before declining since then. The exception to this trend is 2022-23 and 2023-24, where the nominal value of exports grew.
This overall decline in the value of exports has been driven largely by exports outside of the EU. Between 2016-17 and 2025-26, the value of exports to the EU increased by £2.2 billion in nominal terms (44.5%, or 6.3% in real terms). The value of exports outside of the EU decreased by £1.2 billion over the same period in nominal terms (-61.9%, or -72.0% in real terms).
This decline in exports is largely explained when looking at the mass exported. In 2016-17, 26.8 million metric tonnes of 'Mineral fuels, lubricants and related materials' was exported from Scotland, but by 2026-27 this had reduced to 19.2 million metric tonnes. The mass of exports peaked in 2019-20 at 35.4 million metric tonnes, driven by a significant increase in the mass of non-EU exports.
Both the mass of EU (-12.4%) and non-EU exports (-74.6%) declined between 2016-17 and 2025-26.
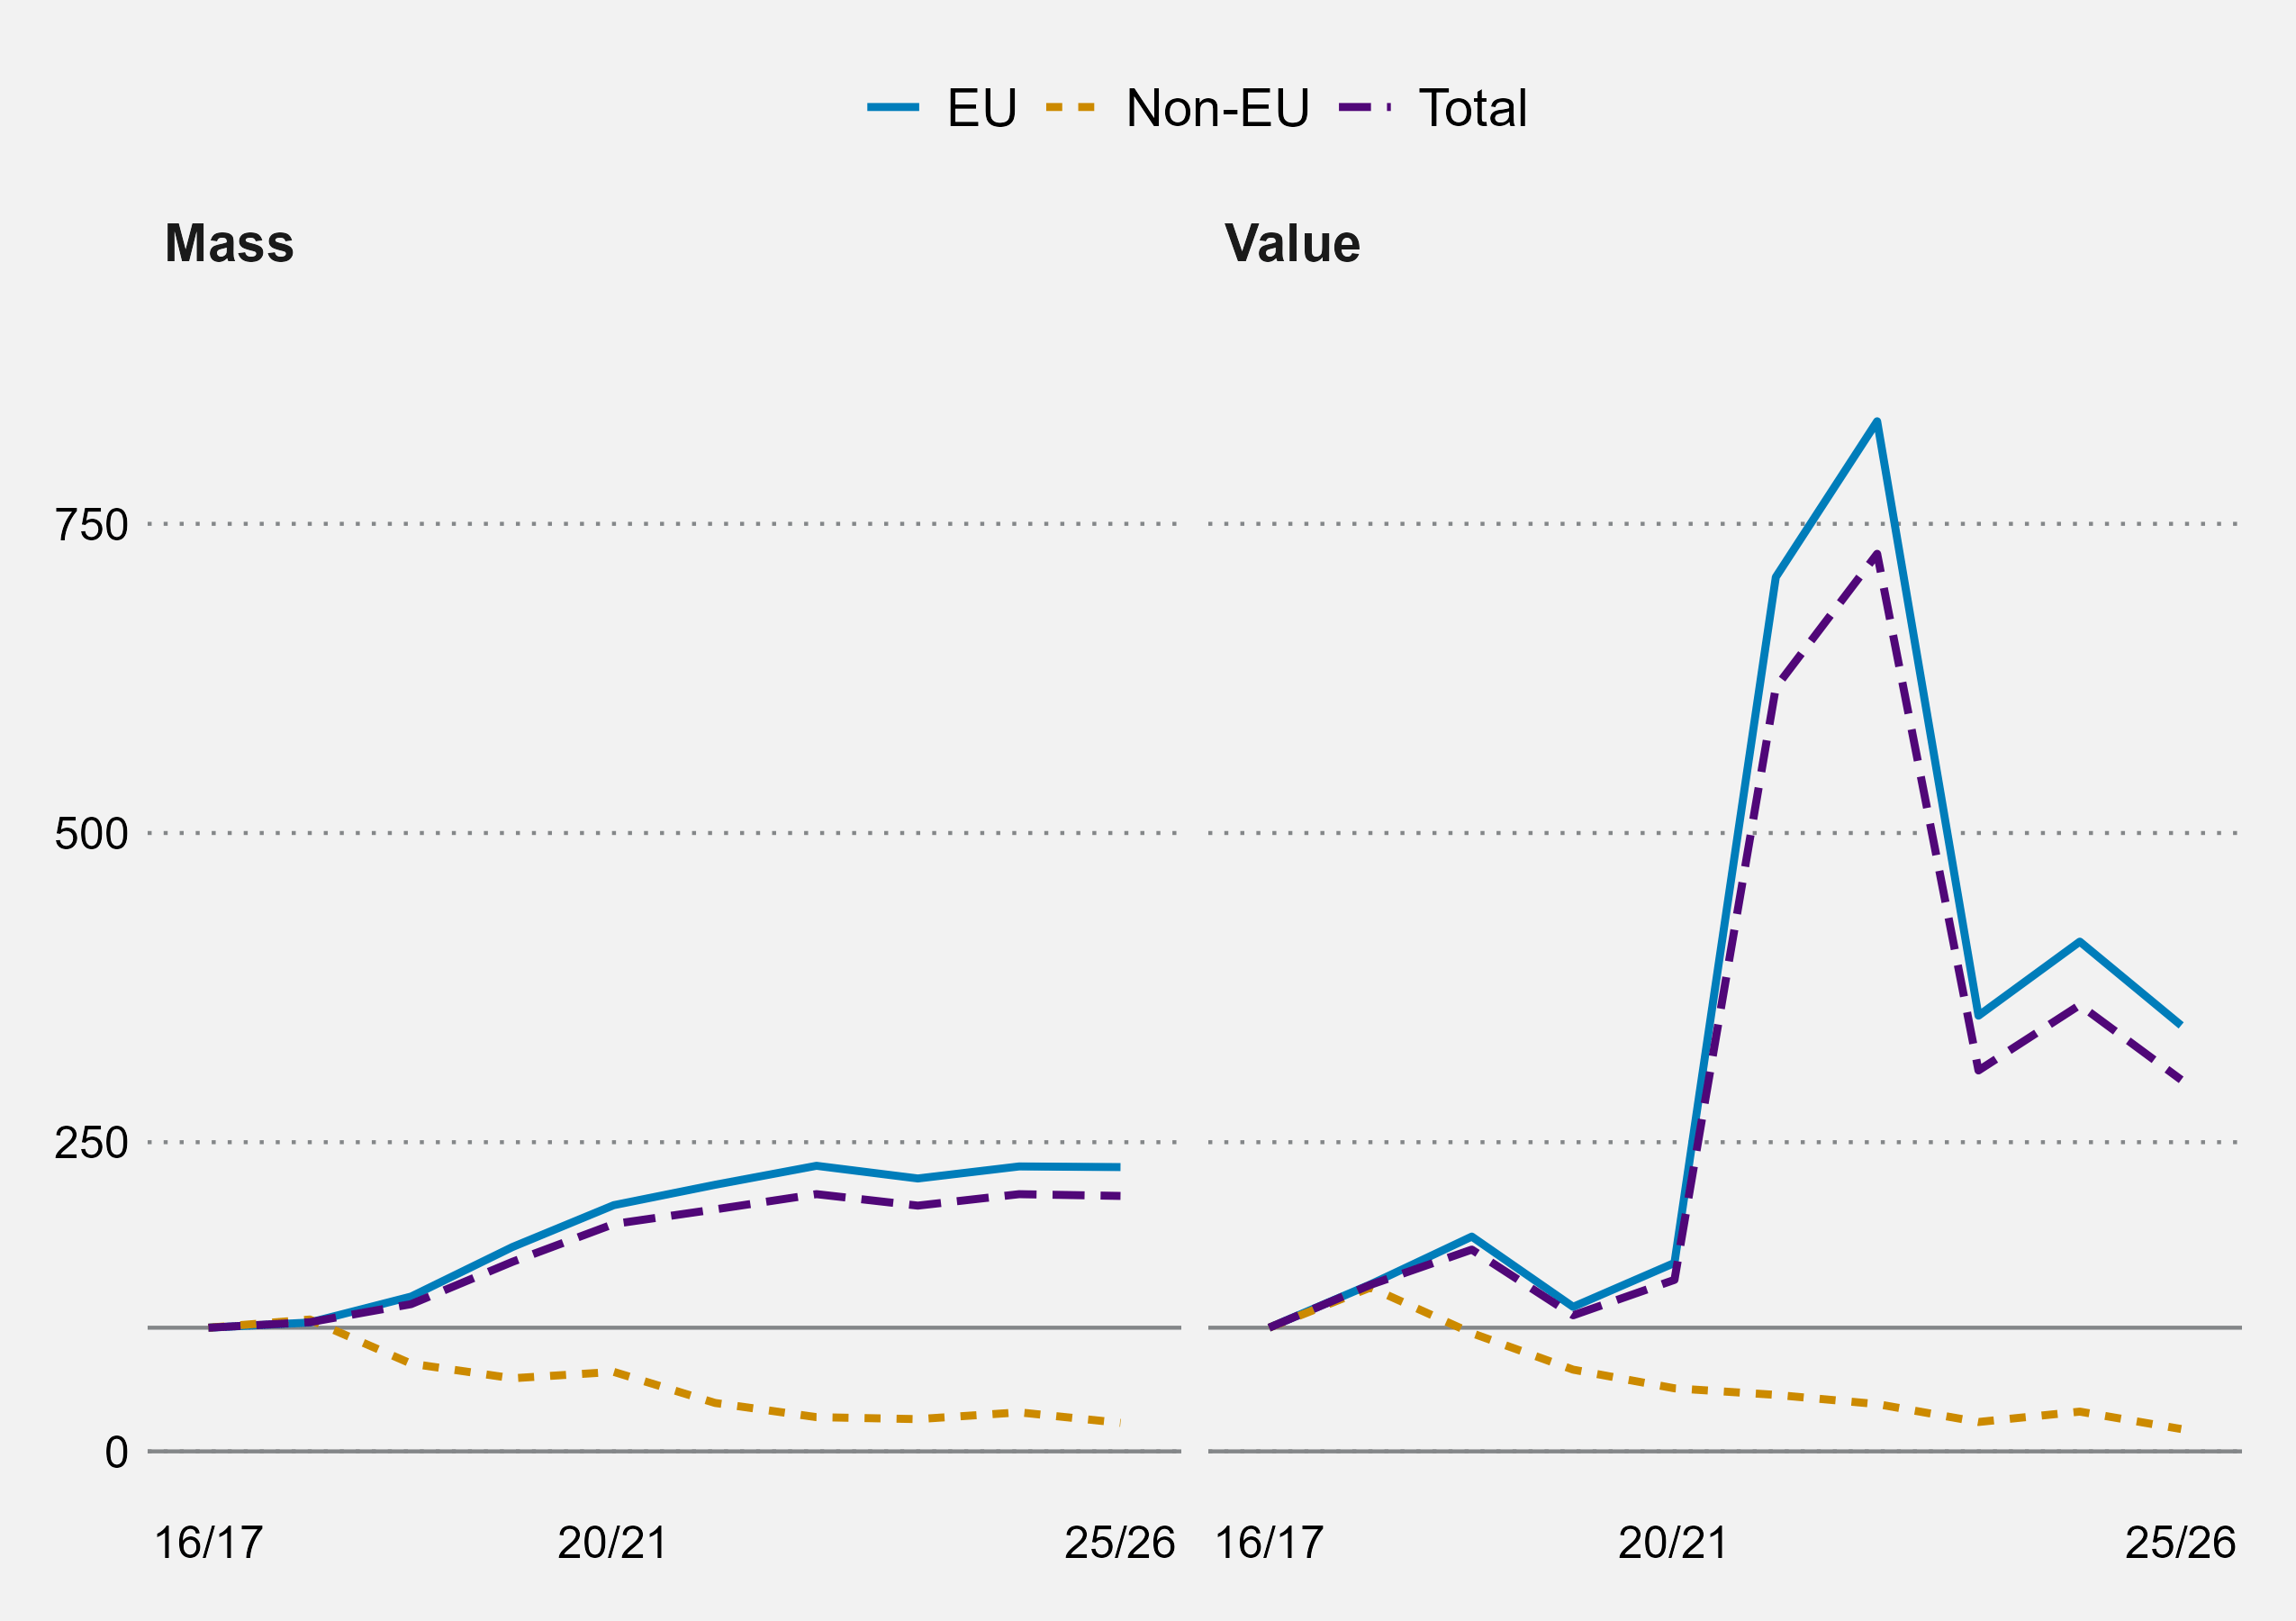
HMRC Regional Trade Statistics
The majority of the value of "Mineral fuels, lubricants & related materials" exports comes from "Petroleum, petroleum products & related materials", accounting for 79.4% in 2025-26. Exports of 'gas, natural and manufactured' account for 20.6% in the same year.
Figure 21, below, shows the indexed mass and volume of 'gas, natural and manufactured' exported from Scotland from 2016-17 to 2025-26. While the volume of gas exported increased steadily to 2021-22, before growing more slowly, there is far more volatility in the value.
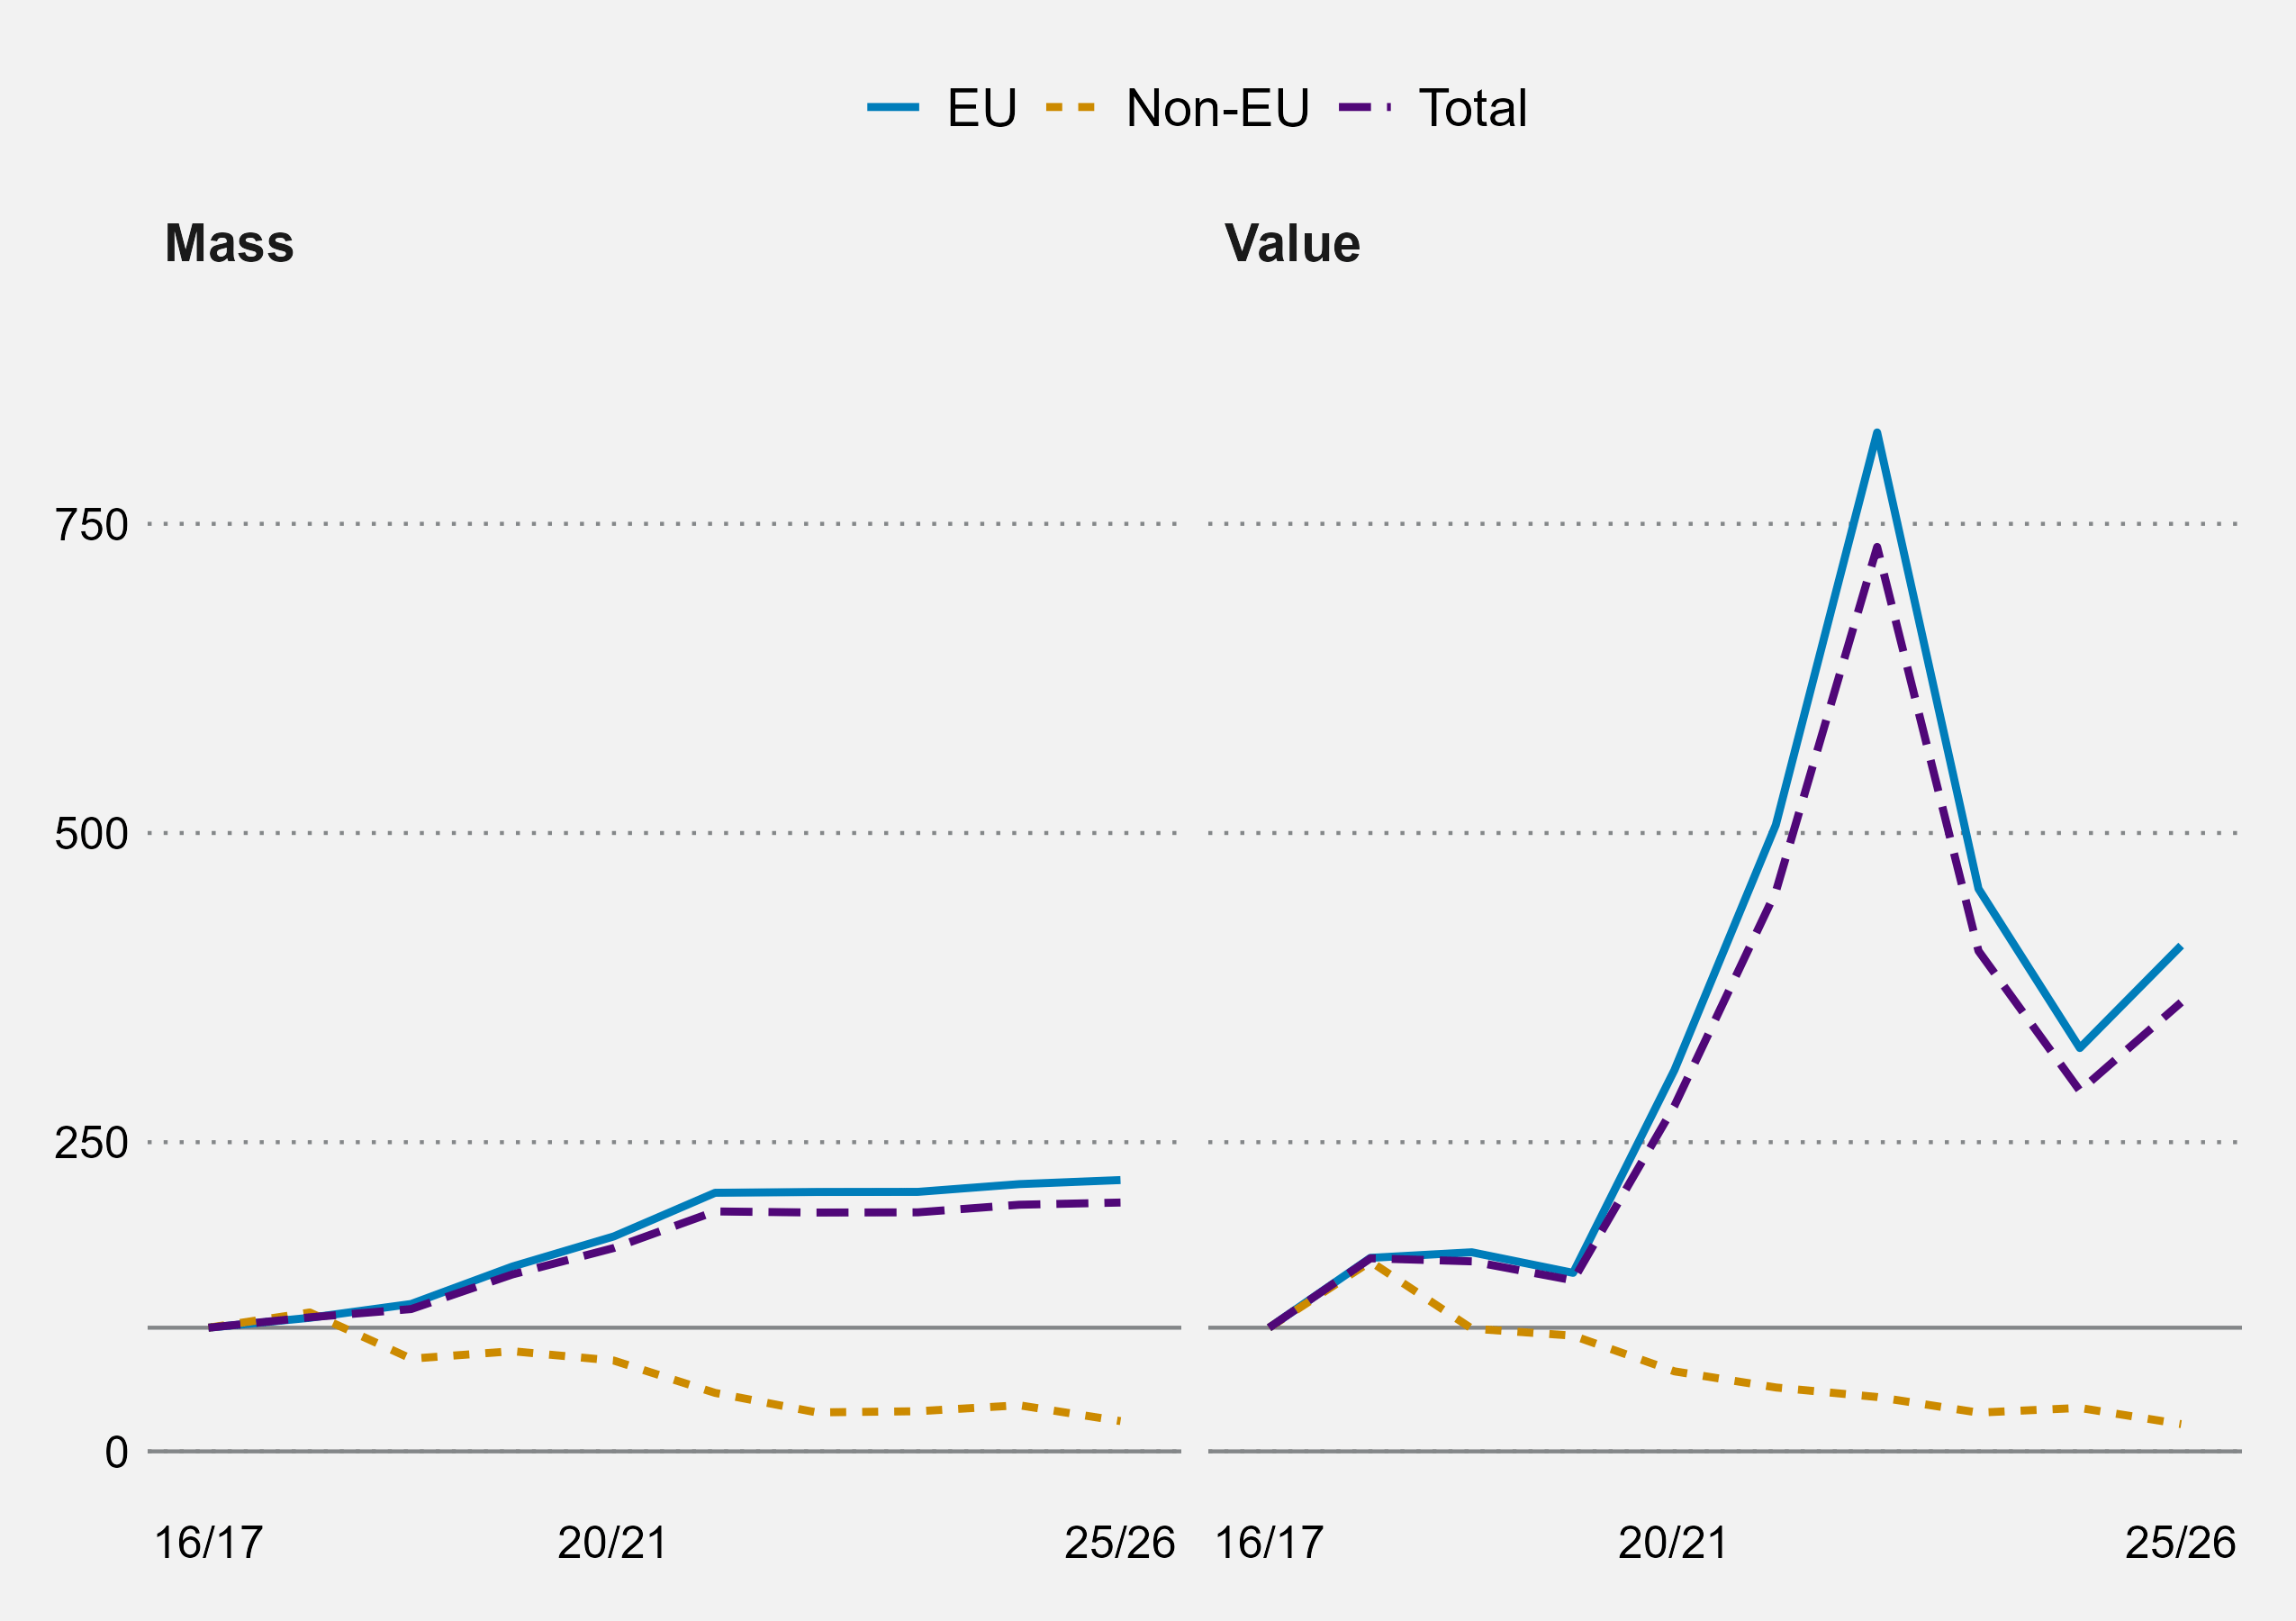
HMRC Regional Trade Statistics
The significant increase in the value of exports of gas in 2021-22 and 2022-23 coincides with the Russian invasion of Ukraine, and the significant increase in the wholesale price of natural gas. If we look at the ratio of value (in nominal terms) compared to the mass of exports, we can this effect quite clearly:
| Year | Ratio |
|---|---|
| 2016-17 | 0.19 |
| 2017-18 | 0.28 |
| 2018-19 | 0.27 |
| 2019-20 | 0.20 |
| 2020-21 | 0.37 |
| 2021-22 | 0.50 |
| 2022-23 | 0.87 |
| 2023-24 | 0.51 |
| 2024-25 | 0.37 |
| 2025-26 | 0.47 |
HMRC Regional Trade statistics, SPICe calculations
Exports to the USA
There has been considerable attention on the trading relationship between the UK and the USA in recent years, from new trade deals being negotiated to the imposition of tariffs. The USA is the largest market for Scotland's international exports by value after the EU Single Market, and according to ESS in 2023 accounted for 17% of Scotland's international exports (compared to 45% for the EU, and 3% for China which is the third largest partner).
The Scottish Government identified the USA as its top priority market in the original 2019 Trading Nation strategy, and it remains a target market following the 2025 re-prioritisation exercise.
In May 2025, the Scottish Government announced a six point export plan which aimed to increase support for Scottish exporters. This included some actions focused on supporting exports to the USA. The six points, to be delivered during the 2025-26 financial year, were:
Produce a US export plan which identifies the US states with the best markets for Scottish products.
Deliver an international growth support programme, which will provide grants to Scottish companies.
Bring more global buyers to Scotland to showcase goods.
Increase funding for overseas trade missions through the International Trade Partnership with the Scottish Chambers of Commerce.
Increase funding for exporters in technology, life sciences, renewables and hydrogen sectors.
Increase the number of overseas trade missions and exporter showcase events through Scottish Development International.
Since the publication of this plan, the Scottish Government has produced or commissioned a number of sector reports to identify the specific opportunities in US states. Each sector report identifies the relevant industry trends, Scotland's current market penetration in the USA, the key sub sectors and states to focus on, and the policy and regulatory context. These were all published on 18 June:
Engineering and advanced manufacturing: This report notes that Scotland's exports in this sector are increasingly focused on high-value and capital intensive goods, for example in pharmaceuticals, aerospace components and renewable energy technologies. This clearly has significant synergy with other sectors identified in the US export plan. Robotics, automation, advanced materials, and quantum and photonics are key 'core' strengths in Scotland. California, Texas, Michigan, North Carolina and Florida are identified as key states.1
Financial and banking services: The report notes that financial services is a key contributor to Scotland's economy. The key sub sectors which present the greatest opportunities to grow exports to the US are asset management, banking and insurance. The key states to focus on are those with development financial services hubs: California, New York, Florida, Illinois and Texas.2
Fintech: RegTech, payments, WealthTech, and open banking and open finance are the key sub sectors which offer the greatest opportunities for Scottish growth. The key states identified are California, New York, Texas, Florida and Illinois.3
Food and drink: Unsurprisingly, the report notes that beverages is a key sub-sector for Scotland. The report also notes that non-alcoholic and health oriented drinks are an emerging opportunity, while premium grocery products are an area Scotland has already had some success with. Key states include California, New York, Massachusetts, Illinois and Florida.4
HealthTech and digital health: This report identifies three key sub-sectors (MedTech and regulated medical devices, AI diagnostics and telehealth) across five key states which offer the greater opportunities for Scottish exporters; California, Massachusetts, New York, North Carolina and Texas.5
Pharmaceutical services: This report notes that while pharmaceuticals are no longer exempt from tariffs, the UK-US trade deal creates duty free access to key parts of the sector. California, Texas, North Carolina, New Jersey and Massachusetts are key states that Scottish exporters should target.6
Renewables: The report identifies Scotland's strengths in offshore and floating wind, onshore wind, clean fuel, green and blue hydrogen, carbon capture, geothermal, and grid optimisation as key opportunities for Scottish exporters. The key states to target are California, Texas, New York, Nevada and Massachusetts.7
Space sector: Scotland already enjoys a strong position in small satellite manufacturing, which along with vertical launch capability, satellite data analytics, and photonics and optics are the key sub-sectors identified in the report. The key states to focus on are California, Florida, Texas, Colorado and Washington.8
To understand how Scotland's exports to the USA have performed in the challenging international trade environment, the best source are HMRC Regional Trade Statistics can provide more timely information on Scotland's goods exports to the USA.
Figure 22, below, shows the mass and value of Scotland's exports to the USA between 2016-17 and 2025-26.
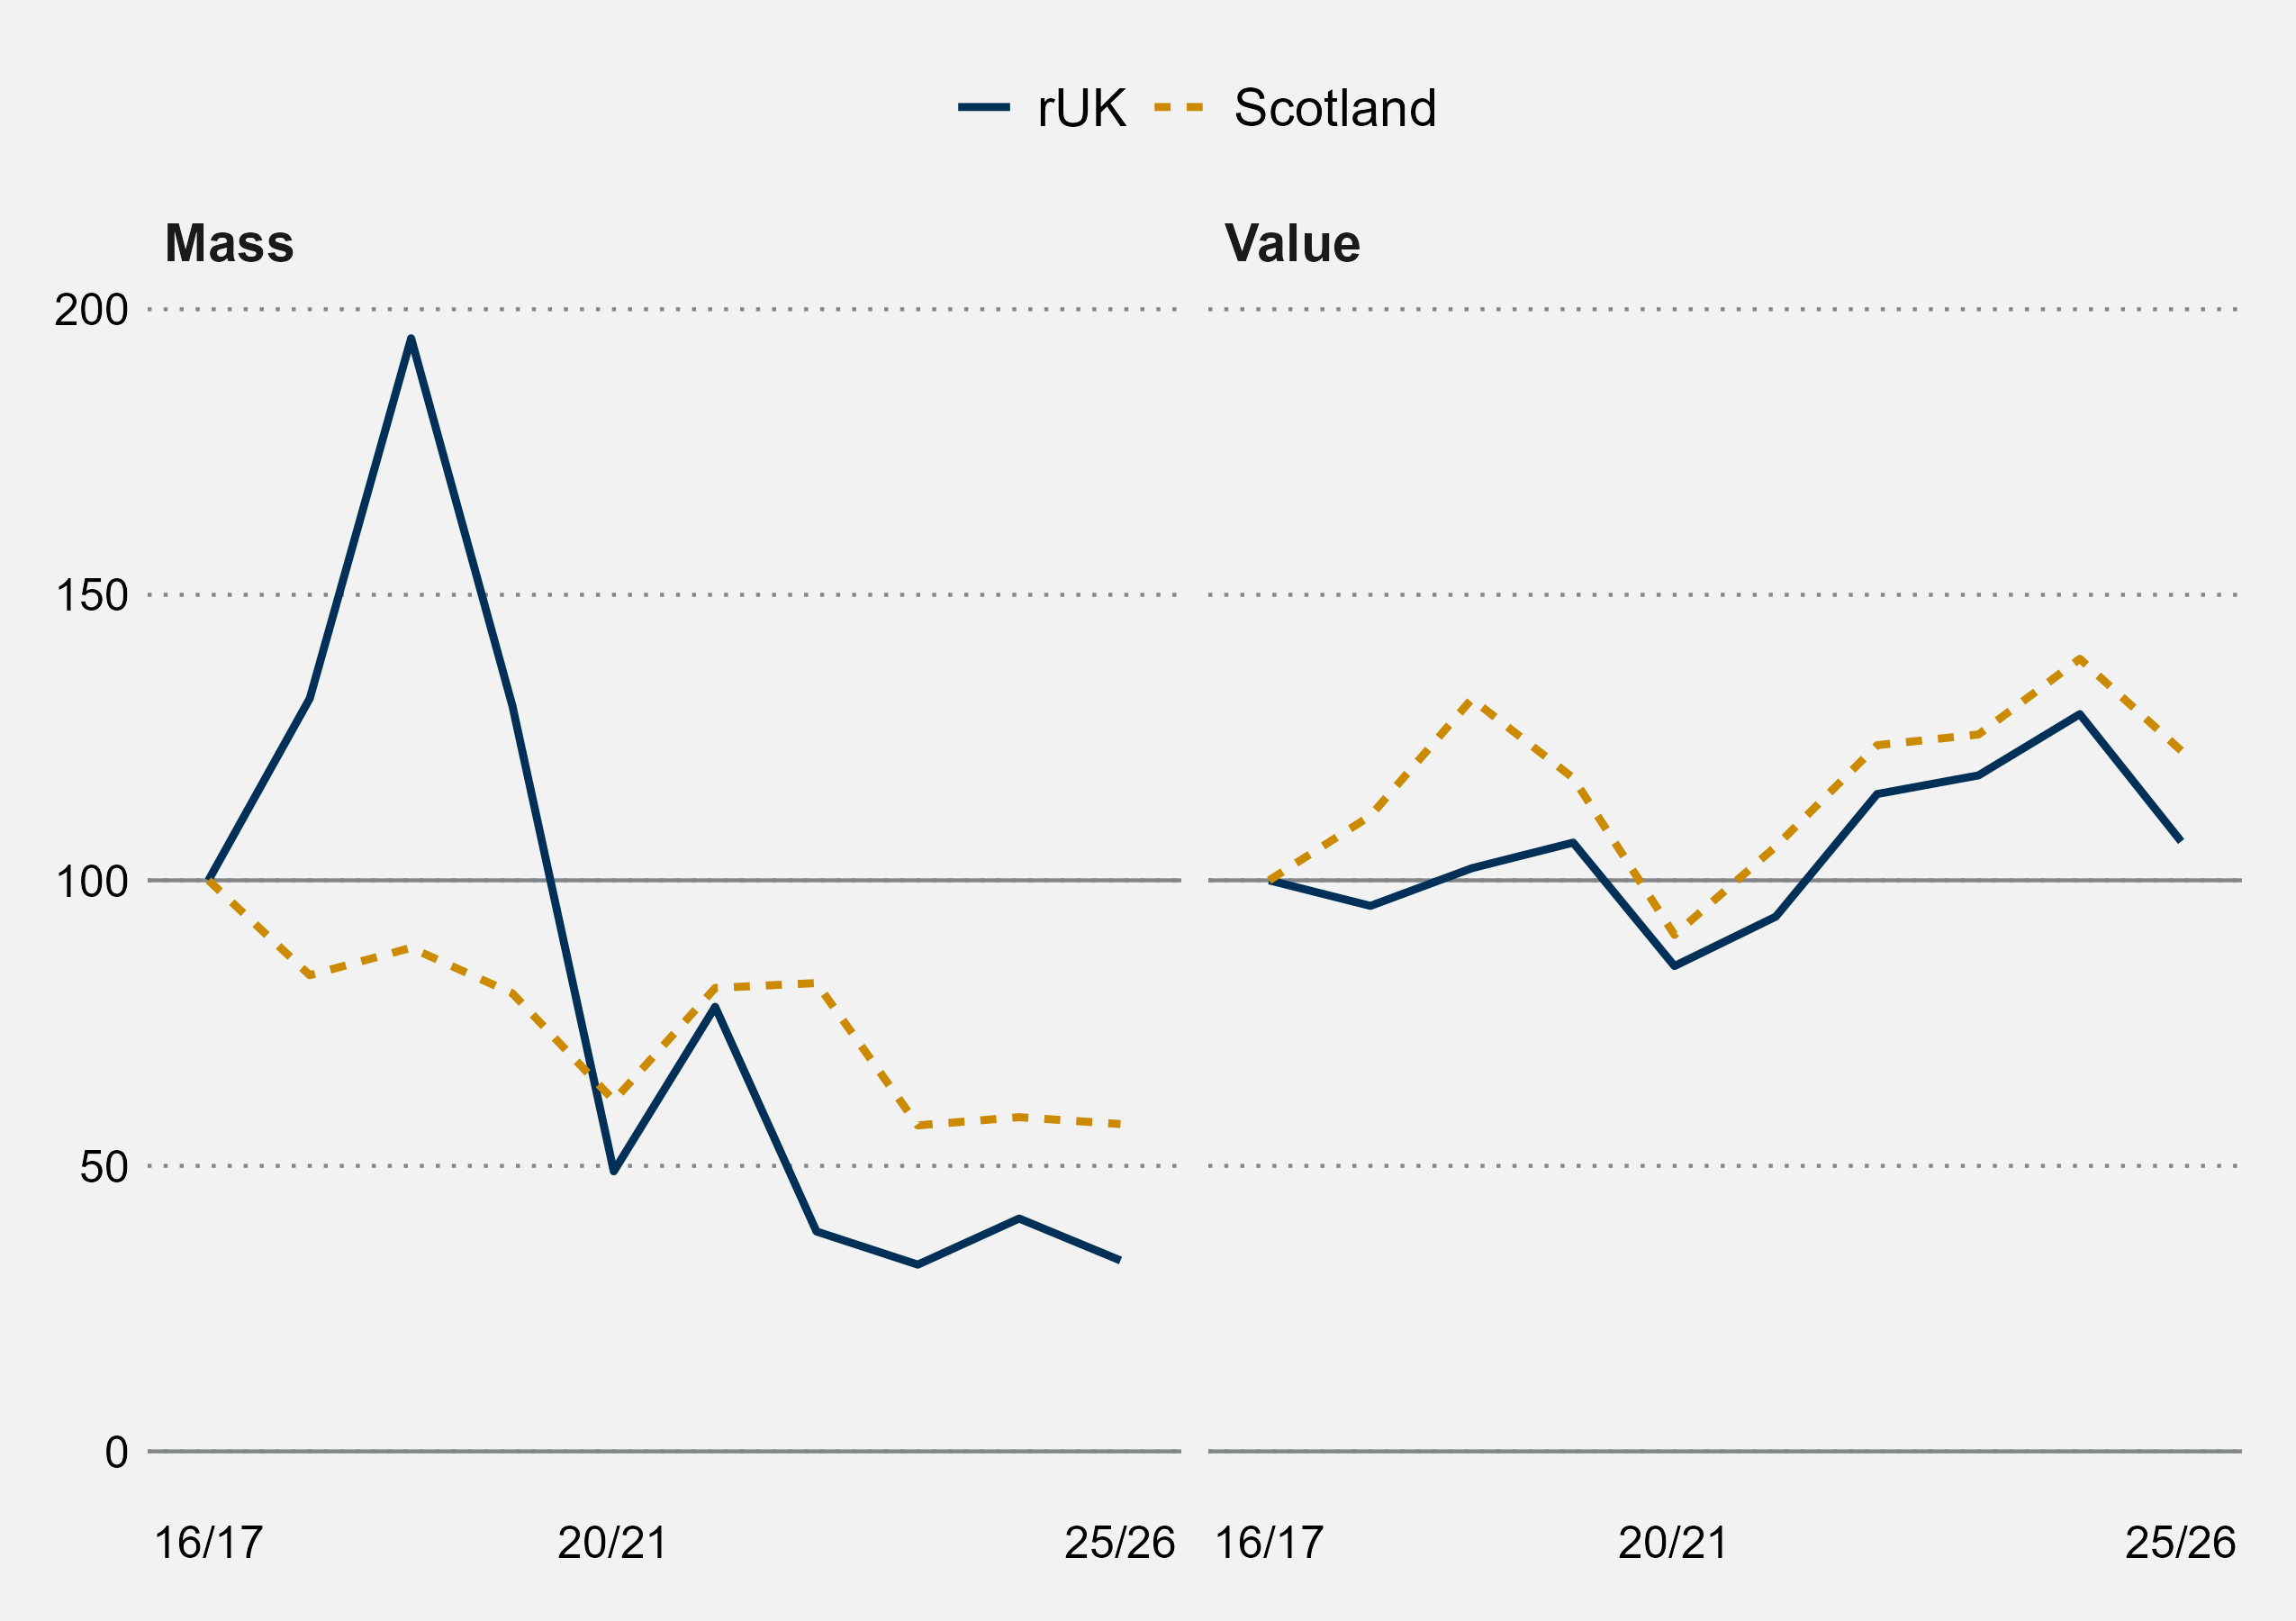
HMRC Regional Trade Statistics
In 2025-26, goods exports to the USA were worth a total of £3.9 billion. This has increased from £3.2 billion in 2016-17 (an increase of 22.7% in nominal terms, but a decrease of 9.8% in real terms). Figure 22, above, shows that the mass of goods exported from Scotland to the USA has been declining fairly steadily since 2016-17. The mass of goods exported from the rest of the UK initially increased sharply in this period, before declining significantly.
Figure 23 below shows the industrial classification of goods exports from Scotland to the USA in 2025-26:
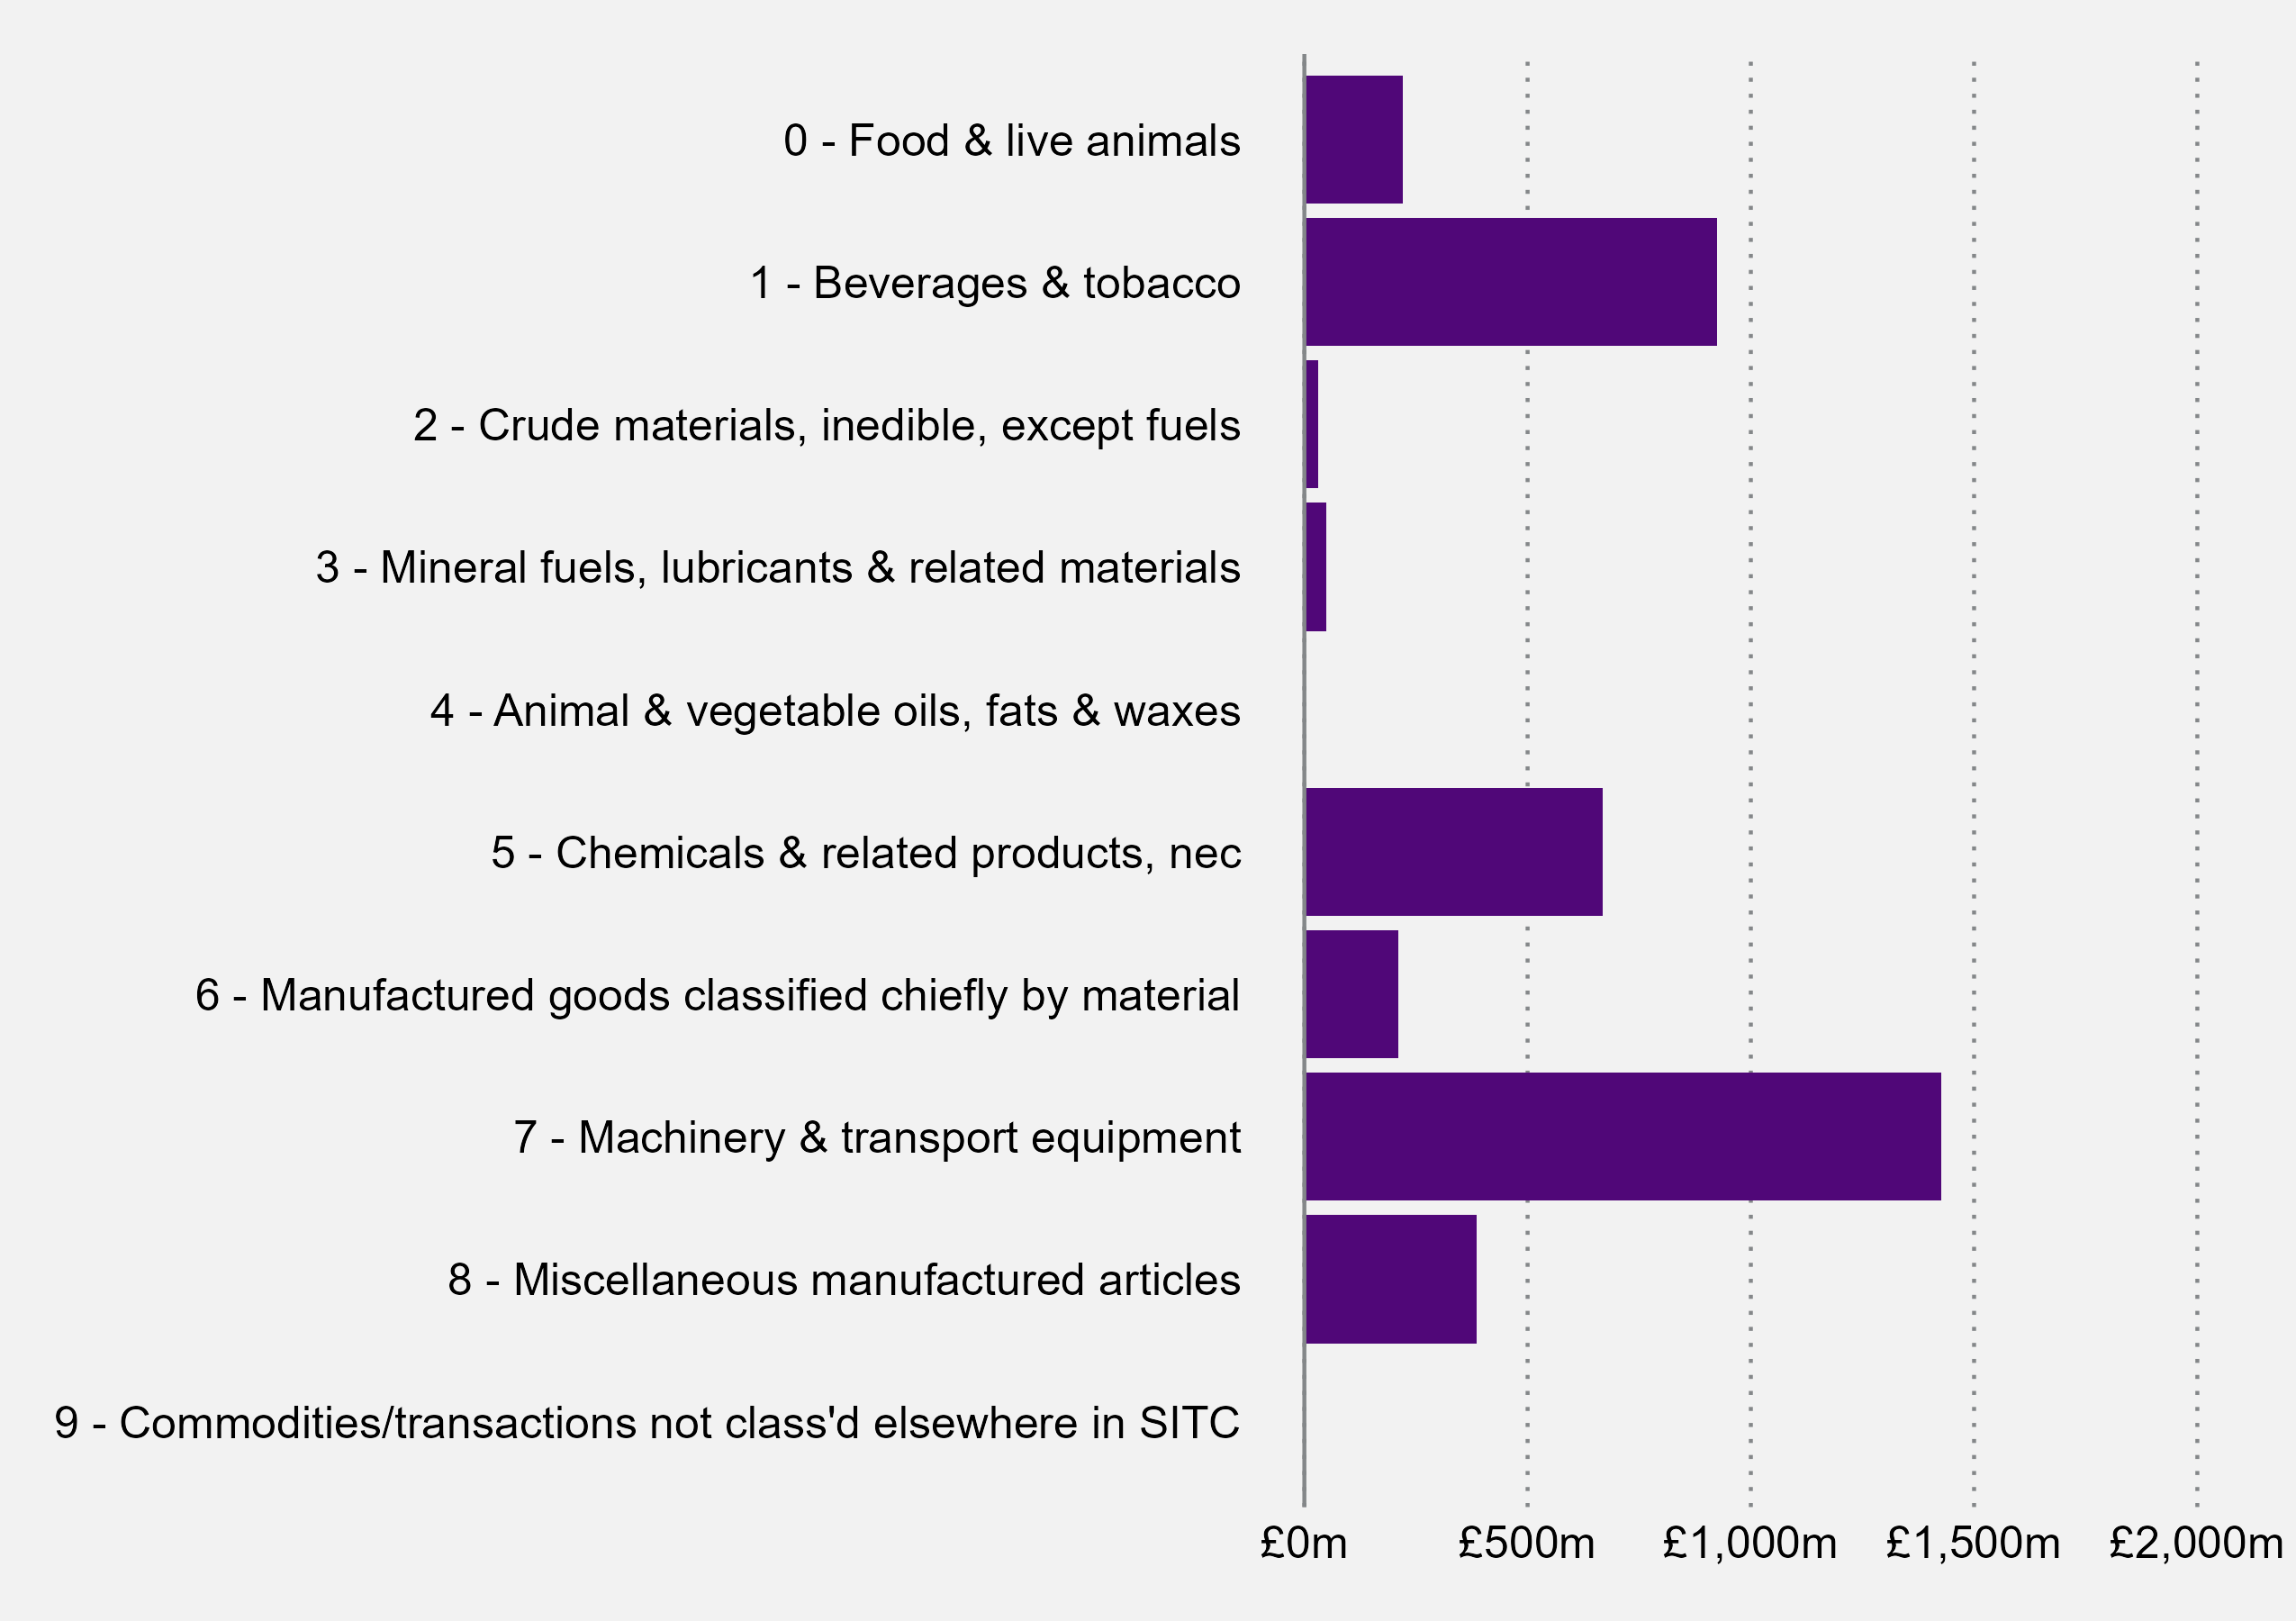
HMRC Regional Trade Statistics
Three sectors dominate Scottish goods exports to the USA; Machinery and transport equipment (36.4% of the total value in 2025-26), beverages and tobacco (23.6%), and chemicals and related products (17%). These three sectors have been the largest three by value in every year since 2016-17 apart from three. In 2017-18, 2018-19 and 2019-20, exports of mineral fuels, lubricants & related products were the third largest sector.
One sub sector of exported good which has shown considerable volatility is exported of non-ferrous metals. These have averaged about £96 million in each financial year since 2016-17. However, in 2024-25, these exports were worth £389.3 million - with £339.2 million of exports by value between January and March 2025. Future Economy Scotland note that over half of Scottish exports of non-ferrous metals are exported to the USA, and suggest that front loading activity to avoid anticipated tariffs might explain some of the activity in Q1 20259.
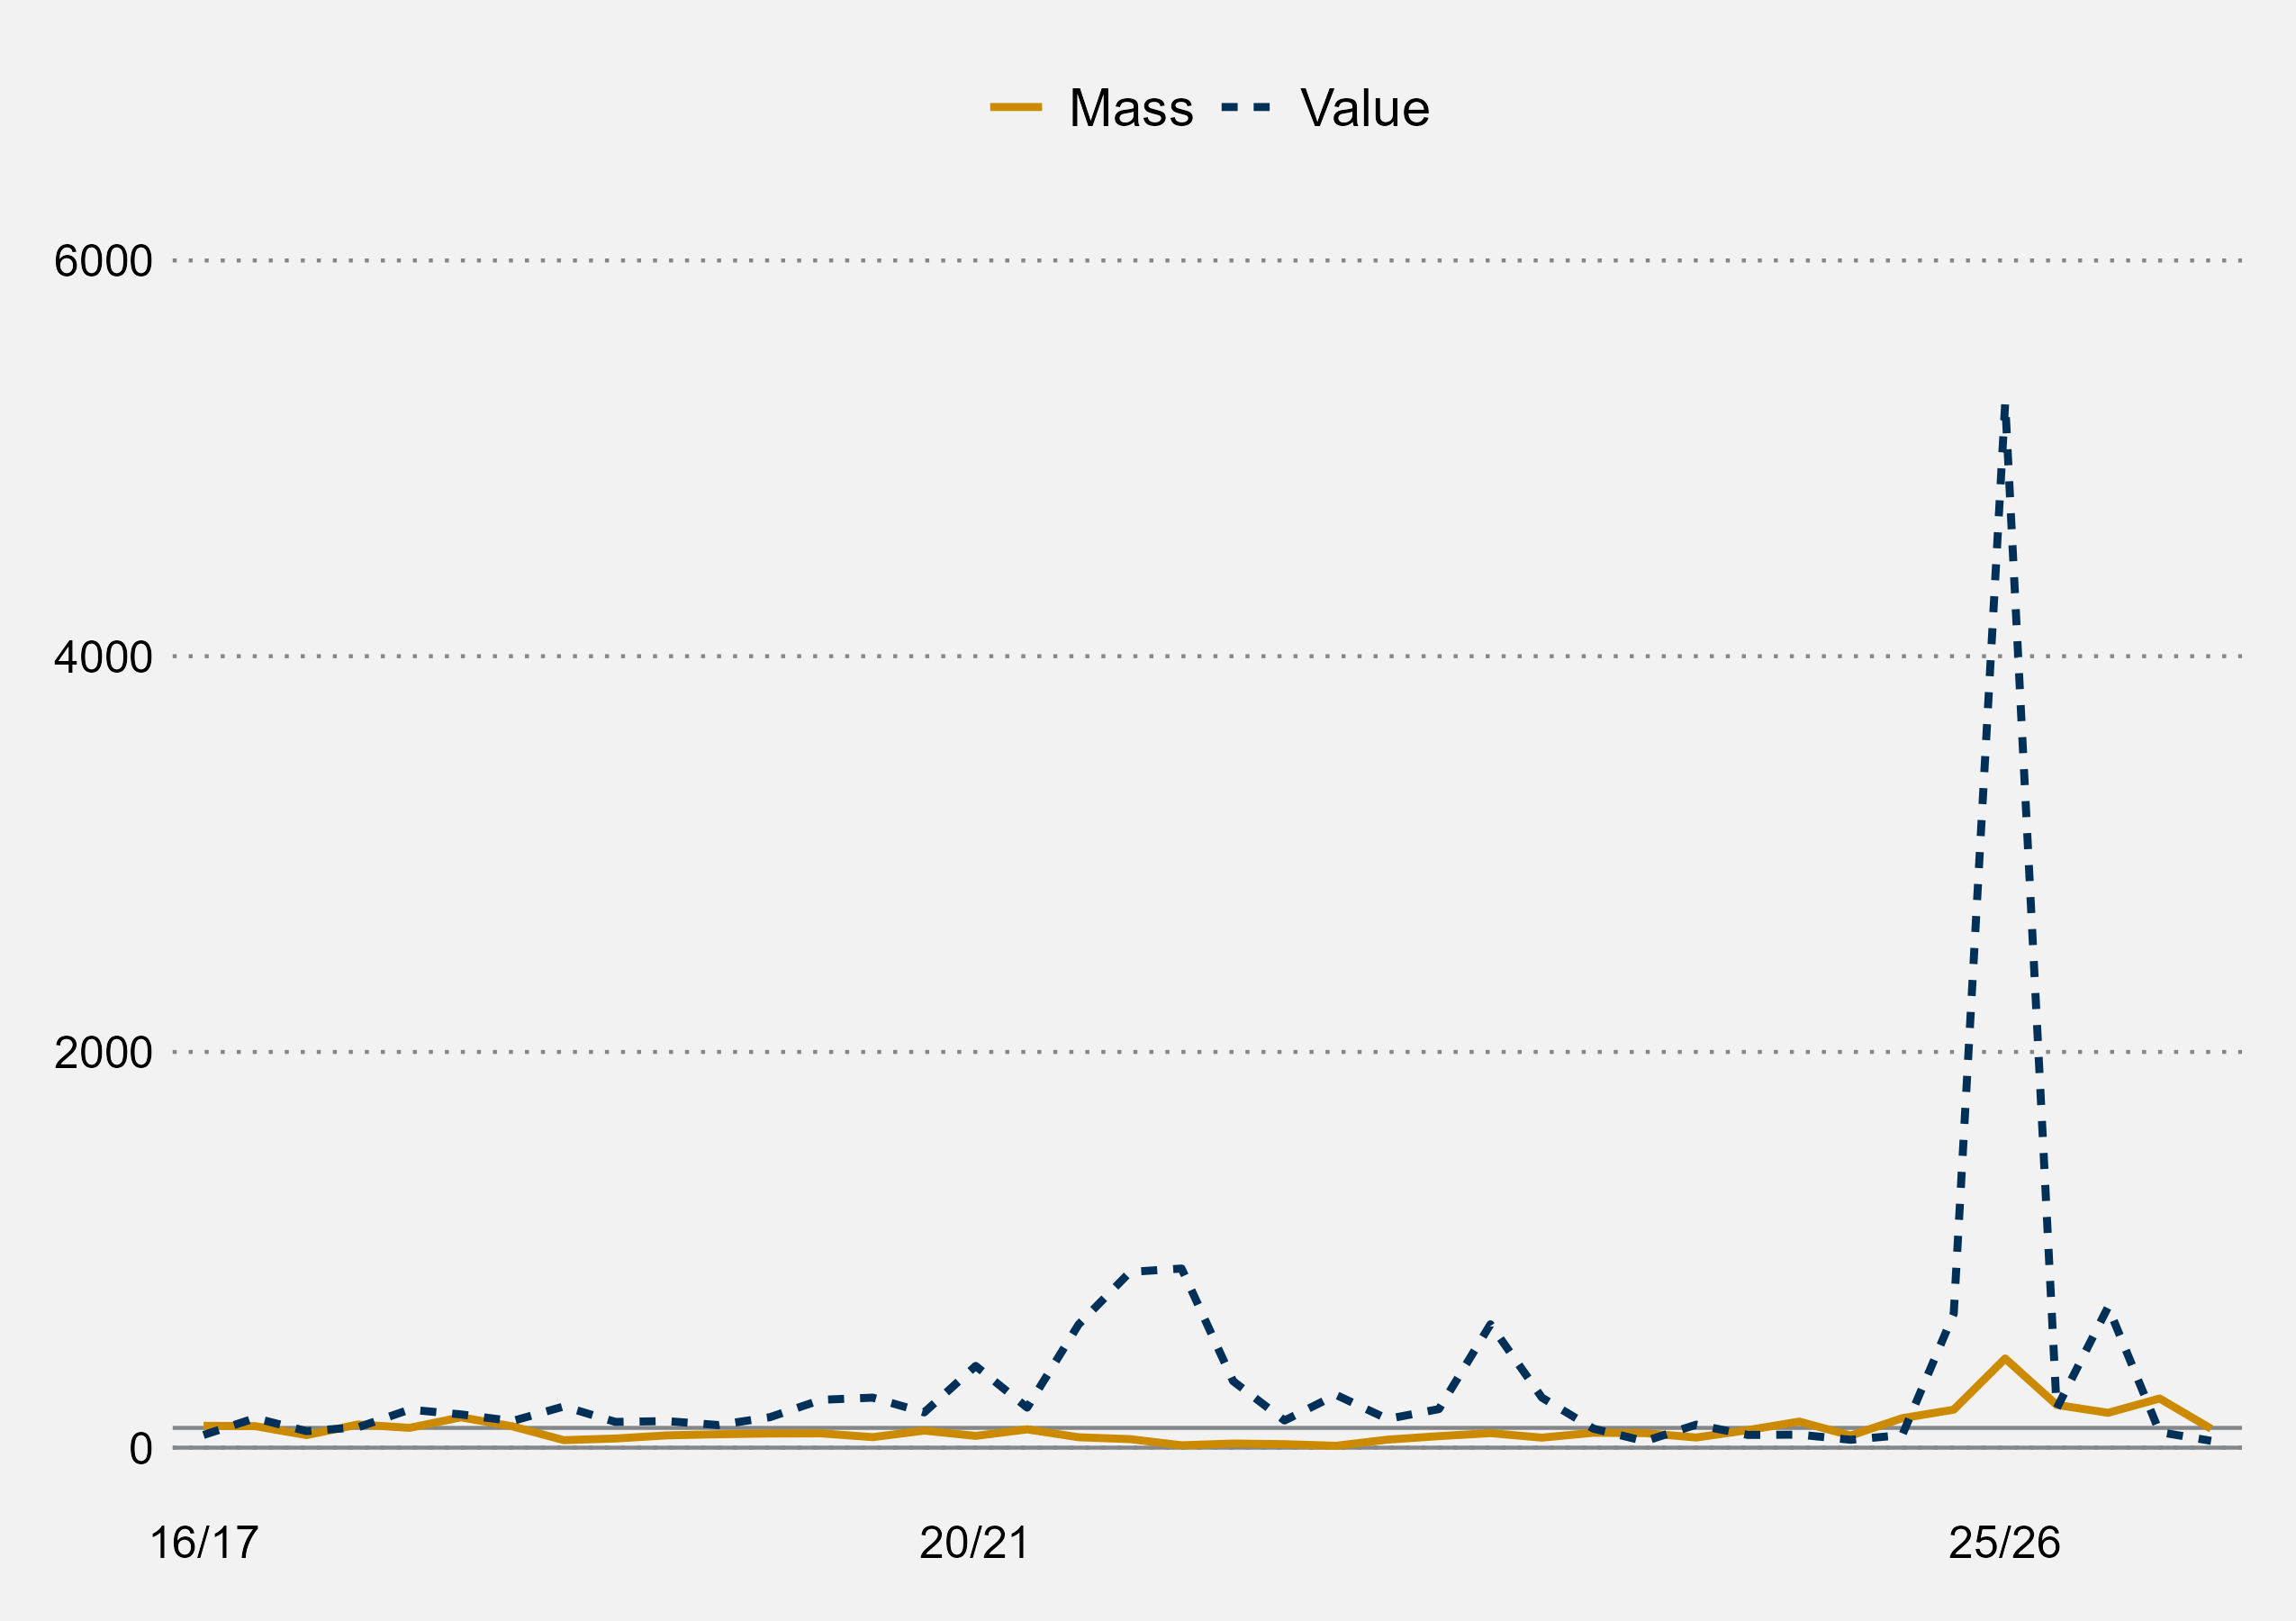
HMRC Regional Trade Statistics
Sources
European Central Bank. (2017). Does trade play a role in helping to explain productivity growth?. Retrieved from <a href="https://www.ecb.europa.eu/pub/pdf/other/ebbox201707_01.en.pdf" target="_blank">https://www.ecb.europa.eu/pub/pdf/other/ebbox201707_01.en.pdf</a> [accessed 14 September 2024]
Scottish Government. (2022, March 1). Scotland National Strategy for Economic Transformation: evidence paper. Retrieved from <a href="https://www.gov.scot/publications/scotland-national-strategy-economic-transformation-evidence-paper/" target="_blank">https://www.gov.scot/publications/scotland-national-strategy-economic-transformation-evidence-paper/</a> [accessed 8 April 2024]
House of Lords Library. (2023, June 28). Economic growth, inflation and productivity. Retrieved from <a href="https://lordslibrary.parliament.uk/economic-growth-inflation-and-productivity" target="_blank">https://lordslibrary.parliament.uk/economic-growth-inflation-and-productivity</a> [accessed 14 September 2024]
Scottish Government. (2019). A Trading Nation. Retrieved from <a href="https://tradingnation.mygov.scot/" target="_blank">https://tradingnation.mygov.scot/</a> [accessed 25 January 2024]
Scottish Government. (2025, November 25). Exports Statistics Scotland 2023. Retrieved from <a href="https://www.gov.scot/publications/exports-statistics-scotland-2023/" target="_blank">https://www.gov.scot/publications/exports-statistics-scotland-2023/</a>
Office for National Statistics. (2023, July 3). Globalisation in the context of the UK National Accounts: Blue Book 2023. Retrieved from <a href="https://www.ons.gov.uk/economy/grossdomesticproductgdp/articles/globalisationinthecontextoftheuknationalaccounts/bluebook2023" target="_blank">https://www.ons.gov.uk/economy/grossdomesticproductgdp/articles/globalisationinthecontextoftheuknationalaccounts/bluebook2023</a>
Scottish Government. (2025, September 11). A Trading Nation - Updating Scotland's Country and Sector Prioritisation. Retrieved from <a href="https://www.gov.scot/publications/trading-nation-updating-scotlands-country-sector-prioritisation/" target="_blank">https://www.gov.scot/publications/trading-nation-updating-scotlands-country-sector-prioritisation/</a> [accessed 28 May 2026]
Scottish Government. (2022, September 5). Shaping Scotland's economy: inward investment plan. Retrieved from <a href="https://www.gov.scot/publications/shaping-scotlands-economy-scotlands-inward-investment-plan/" target="_blank">https://www.gov.scot/publications/shaping-scotlands-economy-scotlands-inward-investment-plan/</a>
Scottish Government. (2021, March 16). Investing with Purpose: global capital investment plan. Retrieved from <a href="https://www.gov.scot/publications/investing-purpose-scotlands-global-capital-investment-plan/" target="_blank">https://www.gov.scot/publications/investing-purpose-scotlands-global-capital-investment-plan/</a>
Scottish Government. (2026, January 30). Scotland's Vision for Trade: annual report January 2026. Retrieved from <a href="https://www.gov.scot/publications/scotlands-vision-trade-annual-report-january-2026/" target="_blank">https://www.gov.scot/publications/scotlands-vision-trade-annual-report-january-2026/</a> [accessed 28 May 2026]
Scottish Government. (2018, August 30). Scotland's role in the development of future UK trade arrangements. Retrieved from <a href="https://www.gov.scot/publications/scotlands-role-development-future-uk-trade-arrangments/" target="_blank">https://www.gov.scot/publications/scotlands-role-development-future-uk-trade-arrangments/</a> [accessed 23 July 2024]
Whitten, L.C., Gravey, V., & Araujo, B.M. (2026). A Brexit benefit? Exploring devolved government’s involvement in UK trade policy. Territory, Politics and Governance, 1-17.
Institute for Government. (2017, January 16). Non-tariff barriers. Retrieved from <a href="https://www.instituteforgovernment.org.uk/article/explainer/non-tariff-barriers" target="_blank">https://www.instituteforgovernment.org.uk/article/explainer/non-tariff-barriers</a> [accessed 8 June 2026]
The Labour Party Manifesto. (2024, June 13). Change. Retrieved from <a href="https://labour.org.uk/change/" target="_blank">https://labour.org.uk/change/</a> [accessed 8 June 2026]
Scottish Parliament . (2024, September 10). Constitution, Europe, External Affairs and Culture Committee 2nd Report, 2024 (Session 6) UK-EU Trade and Cooperation Agreement: Barriers to trade in goods and opportunities to improve the UKEU trading relationship. Retrieved from <a href="https://bprcdn.parliament.scot/published/CEEAC/2024/9/10/b83e263f-a6be-4f34-a943-e8f1774f5346/CEEACS062024R02.pdf" target="_blank">https://bprcdn.parliament.scot/published/CEEAC/2024/9/10/b83e263f-a6be-4f34-a943-e8f1774f5346/CEEACS062024R02.pdf</a> [accessed 8 June 2026]
Bank of England. (2021, July 23). How has Covid affected global trade?. Retrieved from <a href="https://www.bankofengland.co.uk/bank-overground/2021/how-has-covid-affected-global-trade" target="_blank">https://www.bankofengland.co.uk/bank-overground/2021/how-has-covid-affected-global-trade</a> [accessed 8 June 2026]
Office of National Statistics. (2022, October 20). International trade in UK nations and regions: the impact of coronavirus (COVID-19): 2020. Retrieved from <a href="https://www.ons.gov.uk/businessindustryandtrade/internationaltrade/articles/internationaltradeinuknationsandregionstheimpactofcoronaviruscovid19/2020#:~:text=The%20coronavirus%20(COVID%2D19),services%20from%202019%20to%202020." target="_blank">https://www.ons.gov.uk/businessindustryandtrade/internationaltrade/articles/internationaltradeinuknationsandregionstheimpactofcoronaviruscovid19/2020#:~:text=The%20coronavirus%20(COVID%2D19),services%20from%202019%20to%202020.</a> [accessed 8 June 2026]
Energy and Climate Intelligence Unit. (2023, February 20). The Cost of Gas since the Russian Invasion of Ukraine. Retrieved from <a href="https://eciu.net/analysis/reports/2023/the-cost-of-gas-since-the-russian-invasion-of-ukraine" target="_blank">https://eciu.net/analysis/reports/2023/the-cost-of-gas-since-the-russian-invasion-of-ukraine</a> [accessed 8 June 2026]
Energy and Climate Intelligence Unit. (2024, February 22). The Cost of Gas in 2.5 years of the Gas Crisis. Retrieved from <a href="https://eciu.net/analysis/reports/2024/the-cost-of-gas-in-2-5years-of-the-gas-crisis" target="_blank">https://eciu.net/analysis/reports/2024/the-cost-of-gas-in-2-5years-of-the-gas-crisis</a> [accessed 8 June 2026]
Energy and Climate Intelligence Unit. (2025, June 19). Industrial Energy Costs in the Gas Crisis. Retrieved from <a href="https://eciu.net/analysis/reports/2025/industrial-energy-costs-in-the-gas-crisis" target="_blank">https://eciu.net/analysis/reports/2025/industrial-energy-costs-in-the-gas-crisis</a> [accessed 8 June 2026]
Farming Life. (2022, February 24). Why is Ukraine known as the ‘breadbasket of Europe’? Here’s what it produces and exports. Retrieved from <a href="https://www.farminglife.com/country-and-farming/why-is-ukraine-known-as-the-breadbasket-of-europe-heres-what-it-produces-and-exports-3584361" target="_blank">https://www.farminglife.com/country-and-farming/why-is-ukraine-known-as-the-breadbasket-of-europe-heres-what-it-produces-and-exports-3584361</a> [accessed 8 June 2026]
UK Parliament. (2024, July 11). House of Commons Library Briefing: Rising cost of living in the UK. Retrieved from <a href="https://commonslibrary.parliament.uk/research-briefings/cbp-9428/#:~:text=UK%20food%20and%20non%2Dalcoholic,in%20food%20prices%20since%201977." target="_blank">https://commonslibrary.parliament.uk/research-briefings/cbp-9428/#:~:text=UK%20food%20and%20non%2Dalcoholic,in%20food%20prices%20since%201977.</a> [accessed 8 June 2026]
Sky News. (2023, August 7). Food prices may never fall again following Ukraine invasion, Bank of England chief economist says. Retrieved from <a href="https://news.sky.com/story/food-prices-may-never-fall-again-following-ukraine-invasion-bank-of-england-chief-economist-says-12935641" target="_blank">https://news.sky.com/story/food-prices-may-never-fall-again-following-ukraine-invasion-bank-of-england-chief-economist-says-12935641</a> [accessed 8 June 2026]
Atlantic Council. (2026, March 11). Twenty questions (and expert answers) about the Iran war. Retrieved from <a href="https://www.atlanticcouncil.org/dispatches/twenty-questions-and-expert-answers-about-the-iran-war/#goals" target="_blank">https://www.atlanticcouncil.org/dispatches/twenty-questions-and-expert-answers-about-the-iran-war/#goals</a> [accessed 8 June 2026]
UK Department for Energy Security and Net Zero. (2026). UK energy in brief 2026. Retrieved from <a href="https://www.gov.uk/government/statistics/uk-energy-in-brief-2026" target="_blank">https://www.gov.uk/government/statistics/uk-energy-in-brief-2026</a>
United Nations. (2026). ‘Clock is ticking’: Hormuz disruption raises fears of global food crisis. Retrieved from <a href="https://news.un.org/en/story/2026/04/1167289" target="_blank">https://news.un.org/en/story/2026/04/1167289</a>
London School of Economics. (2026, April 15). The Economic Impact of the Iran War: A Global Supply Chain Shock. Retrieved from <a href="https://blogs.lse.ac.uk/mec/2026/04/15/the-economic-impact-of-the-iran-war-a-global-supply-chain-shock/" target="_blank">https://blogs.lse.ac.uk/mec/2026/04/15/the-economic-impact-of-the-iran-war-a-global-supply-chain-shock/</a>
BBC News. (2021, March 24). Egypt's Suez Canal blocked by huge container ship. Retrieved from <a href="https://www.bbc.co.uk/news/world-middle-east-56505413" target="_blank">https://www.bbc.co.uk/news/world-middle-east-56505413</a> [accessed 19 March 2024]
BBC. (2021, March 29). The cost of the Suez Canal blockage. Retrieved from <a href="https://www.bbc.co.uk/news/business-56559073" target="_blank">https://www.bbc.co.uk/news/business-56559073</a> [accessed 19 March 2024]
Fraser of Allander Institute. (2026, August 5). Trade in Services Report. Retrieved from <a href="https://www.gov.scot/publications/trade-services-report/" target="_blank">https://www.gov.scot/publications/trade-services-report/</a>
Scottish Government. (2022, July 28). Global Connections Survey: guidance. Retrieved from <a href="https://www.gov.scot/publications/global-connections-survey/" target="_blank">https://www.gov.scot/publications/global-connections-survey/</a>
TheCityUK. (2026). Exporting from across Britain: Financial and related professional services 2026. Retrieved from <a href="https://www.thecityuk.com/our-work/exporting-from-across-britain-2026/" target="_blank">https://www.thecityuk.com/our-work/exporting-from-across-britain-2026/</a>
Scotland Food and Drink. (2024, March 27). Submission to the Constitution, Europe, External Affairs and Culture Committee about the EU-UK Trade and Cooperation Agreement (TCA). Retrieved from <a href="https://www.parliament.scot/-/media/files/committees/constitution-europe-external-affairs-and-culture-committee/tca-scotland-food-and-drink.pdf" target="_blank">https://www.parliament.scot/-/media/files/committees/constitution-europe-external-affairs-and-culture-committee/tca-scotland-food-and-drink.pdf</a>
Quality Meat Scotland. (2024, June 6). Review of EU-UK Trade and Cooperation Agreement. Retrieved from <a href="https://www.parliament.scot/-/media/files/committees/constitution-europe-external-affairs-and-culture-committee/tca-qms.pdf" target="_blank">https://www.parliament.scot/-/media/files/committees/constitution-europe-external-affairs-and-culture-committee/tca-qms.pdf</a>
Food & Drink Federation. (2026, March 31). Food and drink export values reach record high in 2025, but volumes fail to return to pre-Brexit levels. Retrieved from <a href="https://www.fdf.org.uk/fdf/news-media/press-releases/2026/food-and-drink-export-values-reach-record-high-in-2025-but-volumes-fail-to-return-to-pre-brexit-levels/" target="_blank">https://www.fdf.org.uk/fdf/news-media/press-releases/2026/food-and-drink-export-values-reach-record-high-in-2025-but-volumes-fail-to-return-to-pre-brexit-levels/</a>
Seafood Scotland . (2024, March 27). Briefing Paper: Review of the EU-UK Trade and Cooperation Agreement – March 2024. Retrieved from <a href="https://www.parliament.scot/-/media/files/committees/constitution-europe-external-affairs-and-culture-committee/tca-seafood-scotland.pdf" target="_blank">https://www.parliament.scot/-/media/files/committees/constitution-europe-external-affairs-and-culture-committee/tca-seafood-scotland.pdf</a> [accessed 26 July 2024]
Salmon Scotland . (2024, March 27). Review of the EU-UK Trade and Cooperation Agreement Brief for Constitution, Europe, External Affairs and Culture Committee meeting . Retrieved from <a href="https://www.parliament.scot/-/media/files/committees/constitution-europe-external-affairs-and-culture-committee/tca-salmon-scotland.pdf" target="_blank">https://www.parliament.scot/-/media/files/committees/constitution-europe-external-affairs-and-culture-committee/tca-salmon-scotland.pdf</a> [accessed 26 July 2024]
The SCotch Whisky Association. (2026). Scotch Whisky: An Internationally Traded Spirit. Retrieved from <a href="https://www.scotch-whisky.org.uk/industry-insights/international-trade/" target="_blank">https://www.scotch-whisky.org.uk/industry-insights/international-trade/</a>
AG Barr. (2026, April 21). Annual Report and Accounts 2026. Retrieved from <a href="https://www.agbarr.co.uk/media/l0iibclx/50067-ag-barr-annual-report-2026-web2.pdf" target="_blank">https://www.agbarr.co.uk/media/l0iibclx/50067-ag-barr-annual-report-2026-web2.pdf</a>
Scottish Government. (2026, June 18). US Export Plan: sector report - engineering and advanced manufacturing. Retrieved from <a href="https://www.gov.scot/publications/export-plan-sector-report-engineering-advanced-manufacturing/pages/1/" target="_blank">https://www.gov.scot/publications/export-plan-sector-report-engineering-advanced-manufacturing/pages/1/</a>
Scottish Government. (2026, June 18). US Export Plan: sector report - financial and banking services. Retrieved from <a href="https://www.gov.scot/publications/export-plan-sector-report-financial-bs/" target="_blank">https://www.gov.scot/publications/export-plan-sector-report-financial-bs/</a>
Scottish Government. (2026, June 18). US Export Plan: sector report - FinTech. Retrieved from <a href="https://www.gov.scot/publications/export-plan-sector-report-fintech/pages/1/" target="_blank">https://www.gov.scot/publications/export-plan-sector-report-fintech/pages/1/</a>
Scottish Government. (2026, June 18). US Export Plan: sector report - food and drink. Retrieved from <a href="https://www.gov.scot/publications/export-plan-sector-report-food-drink/pages/1/" target="_blank">https://www.gov.scot/publications/export-plan-sector-report-food-drink/pages/1/</a>
Scottish Government. (2026, June 18). US Export Plan: sector report - HealthTech and digital health. Retrieved from <a href="https://www.gov.scot/publications/export-plan-sector-report-healthtech-digital-health/pages/1/" target="_blank">https://www.gov.scot/publications/export-plan-sector-report-healthtech-digital-health/pages/1/</a>
Scottish Government. (2026, June 18). US Export Plan: sector report - pharmaceutical services. Retrieved from <a href="https://www.gov.scot/publications/export-plan-sector-report-pharmaceutical-services/pages/1/" target="_blank">https://www.gov.scot/publications/export-plan-sector-report-pharmaceutical-services/pages/1/</a>
Scottish Government. (2026, June 18). US Export Plan: sector report - renewables. Retrieved from <a href="https://www.gov.scot/publications/export-plan-sector-report-renewables/pages/1/" target="_blank">https://www.gov.scot/publications/export-plan-sector-report-renewables/pages/1/</a>
Scottish Government. (2026, June 18). US Export Plan: sector report - space. Retrieved from <a href="https://www.gov.scot/publications/export-plan-sector-report-space/pages/1/" target="_blank">https://www.gov.scot/publications/export-plan-sector-report-space/pages/1/</a>
How are Trump’s tariffs impacting Scotland’s economy?. (2025, September 17). Retrieved from <a href="https://www.futureeconomy.scot/posts/322-how-are-trump-s-tariffs-impacting-scotland-s-economy" target="_blank">https://www.futureeconomy.scot/posts/322-how-are-trump-s-tariffs-impacting-scotland-s-economy</a>