Access to legal aid and advice services in Scotland
This briefing examines access to legal aid and advice services in Scotland. It analyses patterns of service use and develops two model-based measures. These are: the Civil Legal Support Index, which captures spatial access to legal help; and the Mismatch Index, which measures the divergence between expected and observed use of services.
About the author
Dr Mustapha Douch is an Associate Professor in Economics at the University of Edinburgh. He specialises in economic modelling and has published widely on issues such as international economics and applied microeconomics topics. He is also an Academic Fellow at the Scottish Parliament.
His previous positions include Visiting Principal Economist at the Bank of Lithuania, the Bank of Estonia, and Visiting Professor at the University of Turin, Jagiellonian University, and Vilnius University. He has been a consultant for the United Nations University -World Institute for Development Economics Research (WIDER), Scottish Enterprise and the Financial Conduct Authority, among others.
Dr Douch has been working with the Scottish Parliament Information Centre (SPICe) as part of its Academic Fellowship scheme. This aims to build links between academic expertise and the work of the Scottish Parliament.
The views expressed in this briefing are the views of the author, not those of SPICe or the Scottish Parliament.
What this research looks at
Looking at how people access legal support
This study examines unequal access to legal aid and advice services across Scotland by combining survey evidence on civil justice problems with spatial analysis of local legal aid and advice service provision. The first step was to analyse the Scottish Crime and Justice Survey to identify the most common civil justice problems, patterns of help‑seeking, and the factors associated with accessing advice organisations and solicitors.
This analysis shows that many problems remain unresolved and that access is shaped not only by deprivation, but also by trust, confidence, and problem type.
Looking at structural risk factors
The next step was to built a dataset for Scotland’s 32 Local Authorities covering 2013–2024. This combined indicators on housing, health, labour market conditions, crime, deprivation, demographics and practical access barriers. From this, the access to Civil Legal Support Index (CLSI) was constructed. It captures social need, barriers to reaching help, and weakness in local legal and advice supply.
Looking at actual versus expected use levels
Finally, a gravity model was used to estimate how service uptake depends on proximity and provider capacity. The Mismatch Index compares expected access to Civil Legal Aid services with observed use to identify under‑served areas.
The results show that local capacity and distance strongly shape uptake, while several rural, island, and commuter‑belt councils face persistent deficits in provision.
Cover image from the Scottish Legal Aid Board.
Methodology and key findings
The methodology
This study brings together more than a decade of council‑by‑year evidence (2013–2024) on housing and homelessness, health, work and incomes, crime, education, demographics and practical access barriers for Scotland’s 32 Local Authorities. Using that base, the access to Civil Legal Support Index (CLSI) tracks where legal need is high, where it is hard to reach help, and where local supply is thin.
The CLSI has been paired with a gravity model that explains where people access Civil Legal Aid based on proximity and provider capacity. The resulting mismatch measure compares “expected” access (given those fundamentals) with what actually happened in each area and year.
A detailed methodology has been published separatelyon the Scottish Parliament website.
High level findings
The picture is consistent and policy‑relevant.
People use nearby, well‑resourced services. Where local legal aid and advice capacity is thin, fewer people get help, especially for family law issues (covering things like divorce, child contact and civil remedies for domestic abuse).
Distance still reduces uptake and the “home‑council” effect is strong. Even after allowing for distance and capacity, residents are much more likely to use providers in their own local authority.
The overall risk of people facing civil justice problems without getting timely help has not improved much, but the reasons behind that risk have changed. Unemployment has eased while housing stress and health‑related need have grown. Poor health is the single strongest signal of high legal aid and advice need.
Provision is uneven
Provision remains concentrated in Glasgow and Edinburgh. Several island and commuter‑belt councils have little or no local cover, and seven councils show the most serious combination of high need, high barriers and low supply.
Where local supply is fragile, economic shocks (as seen in Aberdeen) can quickly become access crises. Third sector advice provision helps but does not systematically fill gaps where private firms are thin; market forces alone have not corrected geographic inequalities.
Policy intervention options
The Mismatch Index adds a clear diagnostic element. It flags under‑served places where observed use falls short of what we would expect given population, proximity and capacity, and highlights clusters where outreach, new provision or clearer cross‑boundary routes would make the biggest difference. Read alongside CLSI, it shows whether gaps are driven by high need, hard‑to‑reach services or thin supply, and therefore what kind of remedy is most appropriate.
An overview of how people deal with civil justice problems
Unequal access to legal and advice services for civil justice issues in Scotland remains a pressing policy concern, shaped by an interplay of socio-economic, demographic, and psychological factors. Our analysis of data from the Scottish Crime and Justice Survey1 highlights several key patterns.
While reports of civil justice problems and service use have declined over time, it is unclear whether this reflects reduced legal need or growing barriers to support. A substantial proportion of individuals with civil justice problems take no formal action, suggesting persistent unmet legal need, particularly among vulnerable groups.
Problem complexity strongly influences help-seeking behaviour. Individuals are more likely to seek assistance from Citizens Advice Bureaux and similar advice agencies or solicitors when issues are legally complex or high-stakes. Nevertheless, many everyday problems, especially those involving family relationships, neighbours, housing or policing, still remain unresolved.
Socio-economic deprivation shapes both problem prevalence and service use. But higher service engagement among deprived groups may reflect the concentration of serious issues rather than equitable access. Moreover, barriers to accessing support, including cost, knowledge of rights, institutional trust and perceptions of efficacy, exist across the entirety of the socio-economic spectrum. This highlights that inequality in access is not limited to income alone.
Demographic factors further influence patterns of access. Younger individuals, migrants, and minority faith groups report higher exposure to discrimination or complex legal issues but are less likely to seek formal support. This suggests there are systemic barriers in reaching the most vulnerable. Age and prior experiences with institutions also play critical roles in shaping legal capability and engagement with justice services.
Structural and psychological vulnerabilities may limit the likelihood of issue resolution despite accessing external help. Factors playing a role include self-esteem, low confidence in police or justice institutions and prior negative police experiences.
Civil justice problems - general trend
Reported civil justice problems show a decline over time
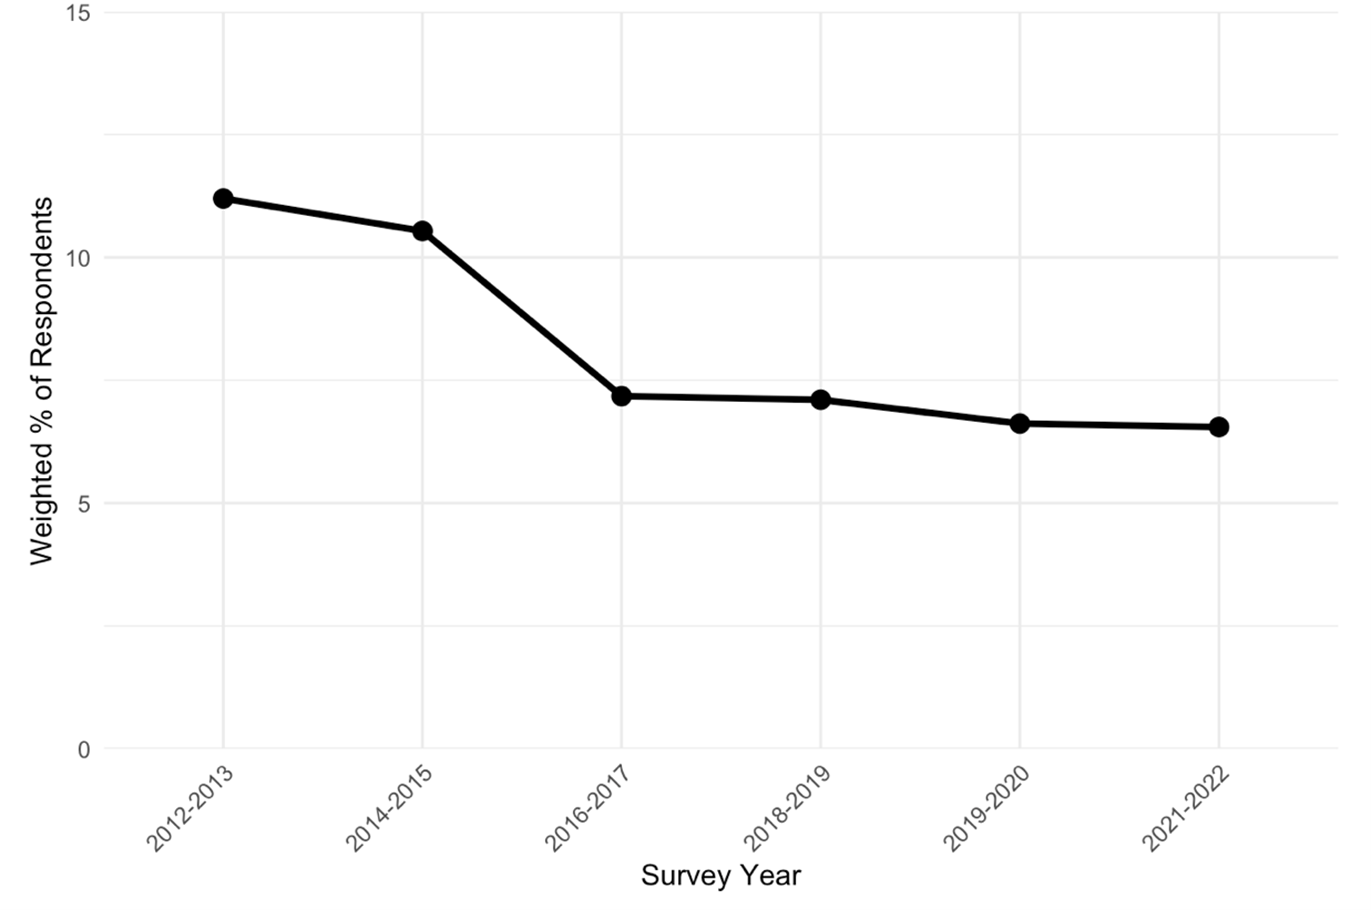
Figure 1 shows a decline in the proportion of respondents reporting at least one civil justice problem between 2012 and 2022. Over the same period, the proportion of those accessing advice services (such as Citizens Advice Bureaux and similar services) or solicitors also fell1.
Only three survey waves include detailed data on advice services and solicitor use, limiting the ability to draw strong causal conclusions about changes over time. This means it is unclear whether the reduction in service use reflects a genuine decline in legal need, or growing barriers to accessing support.
If fewer individuals are seeking help despite experiencing problems, this may indicate widening inequalities in access to legal help. There are potential consequences for the effective enforcement of rights as well as public confidence in the civil justice system.
Author's calculation from the Scottish Crime and Justice Survey
Actions taken to resolve civil justice problems and outcomes
Most people do not seek help to address civil justice problems and, for those who do, a significant proportion of problems remain unresolved
The Sankey diagram (Figure 2) illustrates the pathways from experiencing a civil justice problem to actions taken and eventual outcomes.
Most respondents with a civil justice problem did not seek help from either an advice agency or a solicitor. Among those who did not seek help, a substantial proportion reported either giving up or having an ongoing unresolved issue.
While resolution rates appear broadly similar regardless of whether help was sought, this should not be interpreted as evidence that external assistance is ineffective. The complexity and severity of issues differ substantially across individuals, and those seeking formal support may face more legally complex or entrenched problems.
These patterns have important implications. The high proportion of individuals who take no formal action suggests potential unmet need and barriers to accessing legal help or other forms of support.
The persistence of unresolved issues among those who do not seek help raises concerns about long-term social and economic consequences, particularly for vulnerable groups. Moreover, without accounting for differences in problem type and severity, simple comparisons of outcomes risks understating the value of legal and advice services in supporting those with the most complex civil justice problems.
.png)
Author's calculation from the Scottish Crime and Justice Survey
Civil justice problem types and service use
Patterns of service use reflect complexity of problems
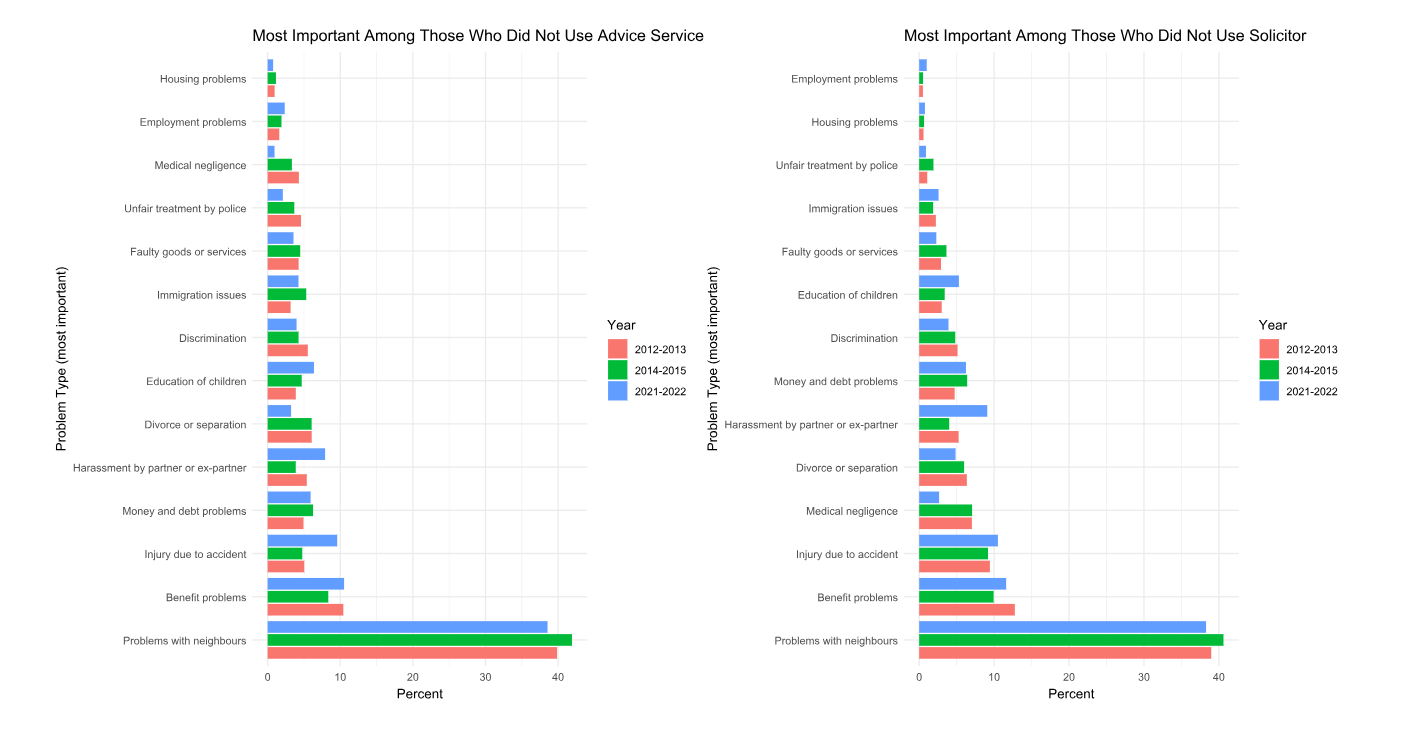
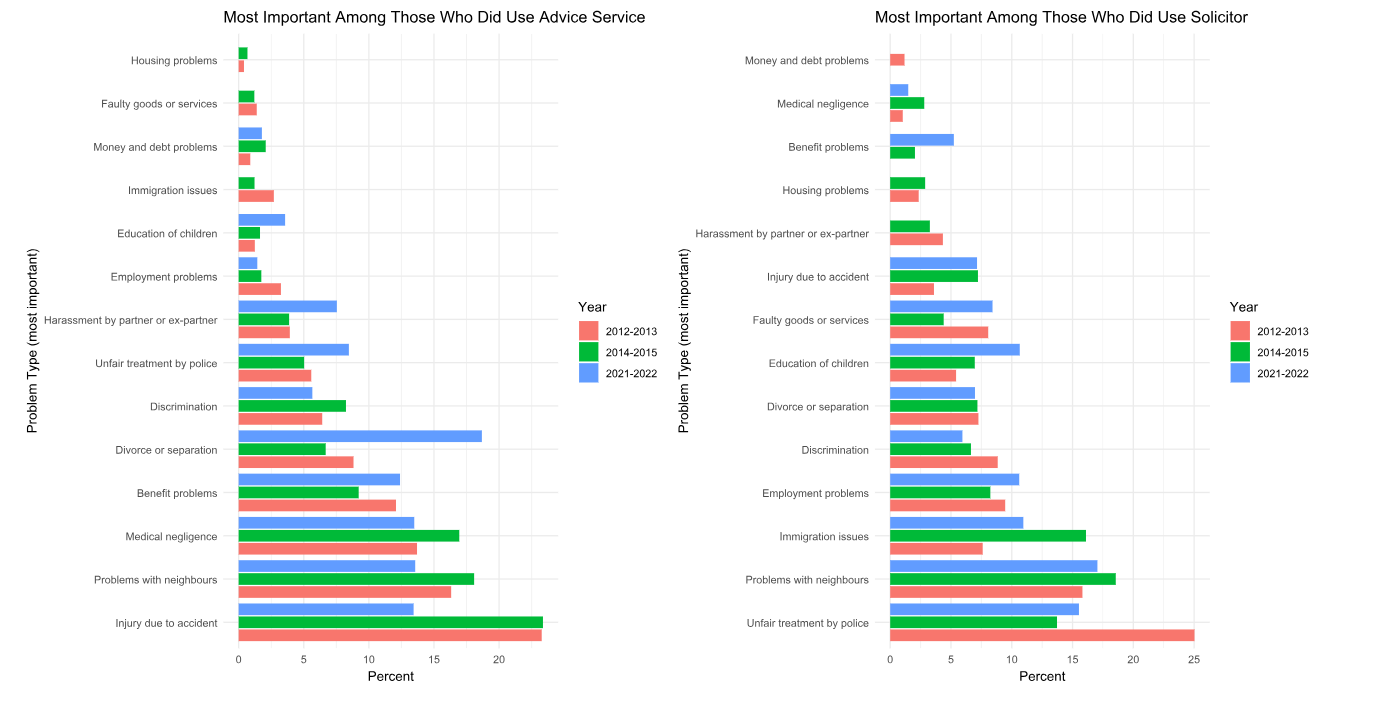
Figures 3 and 4 compare the most important problem reported by those who did and did not seek help.
Among those who did not use advice services or solicitors, social security benefit problems and neighbour disputes were most common. These issues may be perceived as manageable without formal intervention.
In contrast, those who sought assistance were more likely to report legally complex issues, including injury due to accident, unfair treatment by police, immigration matters, and divorce or separation. This pattern suggests that perceived complexity or seriousness of a problem may influence the decision to seek legal advice or support.
The implications are significant. If individuals are more likely to seek help only when problems become legally complex or high-stakes, earlier-stage issues may go unresolved and potentially escalate. This may reinforce inequalities, as those with fewer resources or lower legal capability may delay seeking support until problems worsen. It also suggests that service demand is shaped not only by the incidence of legal problems, but by perceptions of complexity, risk, and the expected value of formal assistance.
.
Author's calculation from the Scottish Crime and Justice Survey
Author's calculation from the Scottish Crime and Justice Survey
Deprivation and civil justice problems
Deprivation plays an important role in shaping both problem prevalence and service use.
The measure of deprivation used for these results, and in the Scottish Crime and Justice Survey, is Scottish Index of Multiple Deprivation (SIMD) quintiles.
Those in less deprived areas are more likely to report civil justice problems but less likely to use solicitors and advice services
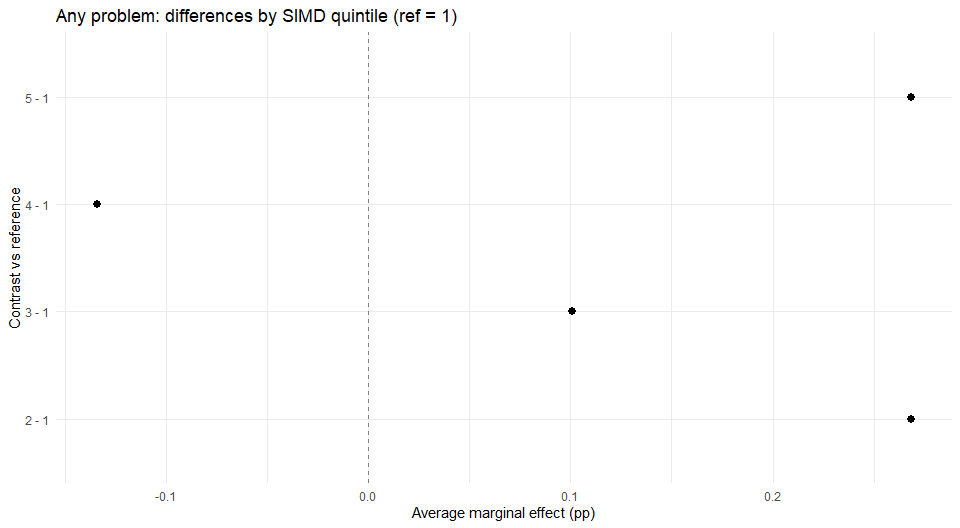
As shown in Figure 5, relative to the most deprived quintile (1), individuals in less deprived areas (quintiles 2, 3, and 5) were more likely to report having any civil justice problem. This may reflect differences in reporting behaviour or types of disputes encountered.
These findings carry important implications. Higher reporting among less deprived groups does not necessarily indicate greater underlying legal need but may instead reflect greater awareness of rights and confidence in identifying issues as ‘legal’ problems.
Conversely, lower reported incidence in the most deprived quintile may mask unmet or unrecognised legal need. This raises concerns that inequalities in legal capability and access to information may shape not only who seeks assistance, but who perceives themselves as experiencing a civil justice problem in the first place.
Moreover, individuals in less deprived quintiles were less likely to access advice services than those in the most deprived quintile. A similar pattern appears for solicitor use. This suggests that barriers to service access are not concentrated solely among the most deprived groups.
Author's calculation from the Scottish Crime and Justice Survey
In this image, quintile 1 is the baseline. The figure shows how much more or less likely people in other deprivation quintiles are to report any civil justice problem compared with those in the most deprived areas. Values below zero indicate lower likelihood than the baseline.
Those in more deprived areas may be experiencing more concentrated, complex civil justice problems
When examining problem types (Figure 6), some serious problems, including those which reflect social vulnerability - such as housing problems, harassment by partners or former partners, child contact disputes, and unfair treatment by police - are concentrated in the most deprived quintile. Medical negligence and faulty goods disputes are more prevalent in less deprived areas.
These patterns have important implications for understanding inequality in civil justice. While service use appears relatively higher among the most deprived groups, this may reflect a greater concentration of serious, potentially interlinked, civil justice problems in these communities rather than equal access in practice.
At the same time, our Civil Legal Support Index and Mismatch Indexshow the presence of service use gaps across all quintiles, indicating that unmet legal need may be widespread.

Author's calculation from the Scottish Crime and Justice Survey
Reasons for giving up when faced with civil justice problems
Perceived powerlessness, as well as issues around costs, capability and local resources, are key drivers in giving up on civil justice problems
Across all quintiles, the most common reasons for giving up were ‘not worth the hassle’ and ‘thought nothing could be done’.
Notably:
cost concerns were greatest in SIMD quintile 3
uncertainty about rights was highest in the least deprived quintile
lack of local resources was cited across most quintiles.
When considered alongside the distribution of problem types, these findings carry important implications. The prevalence of surrender-based responses (such as ‘nothing could be done’) suggests that perceived powerlessness may be a significant barrier to engagement with the civil justice system.
The fact that cost concerns peak in the middle quintile indicates that financial barriers are not confined to the most deprived. This potentially reflects groups who fall outside eligibility thresholds for legal aid support yet still face affordability constraints. Meanwhile, high uncertainty about rights in the least deprived quintile highlights that legal capability gaps exist across the socio-economic spectrum.
When considered alongside factors discussed previously, this suggests that unequal access to civil justice is shaped not only by income, but by perceptions of efficacy, knowledge of rights, and the availability of local support. In deprived areas in particular, individuals may face serious, socially embedded problems while simultaneously perceiving them as unsolvable, raising concerns about entrenched and cumulative disadvantage.

Author's calculation from the Scottish Crime and Justice Survey
Demographic Patterns
The analysis also looked at how various demographic factors affected people's experiences of civil justice problems. This section looks at:
Impact of age on experience of civil justice problems
Types of problem experienced and use of advice services and solicitors varied by age
Neighbour disputes were the most common issue across all age groups. Younger respondents (16–17) reported higher levels of discrimination and unfair treatment by police, while older respondents (65+) reported more faulty goods disputes1.
As shown in Figure 8, advice service use was highest among those aged 35–54 and lowest among 16–18 year olds. Solicitor use was relatively high among 18–19 year olds compared to advice service usage for the same age range.
These findings suggest important age-related inequalities in both problem type and pathways to support. The higher incidence of discrimination and police-related issues among younger respondents raises concerns about early negative interactions with authority and potential long-term impacts on trust in public institutions. At the same time, very low advice service use among 16–18 year olds may indicate barriers related to legal awareness, confidence or practical access.
The relatively high solicitor usage among 18–19 year olds could reflect the seriousness of issues faced at this age, such as discrimination and unfair police treatment. Formal representation may be perceived as necessary to deal with these. Overall, the patterns suggest that there are access to justice implications related to life stage as well as to socio-economic situation.
.png)
Author's calculation from the Scottish Crime and Justice Survey
Impact of country of birth and religion on experience of civil justice problems
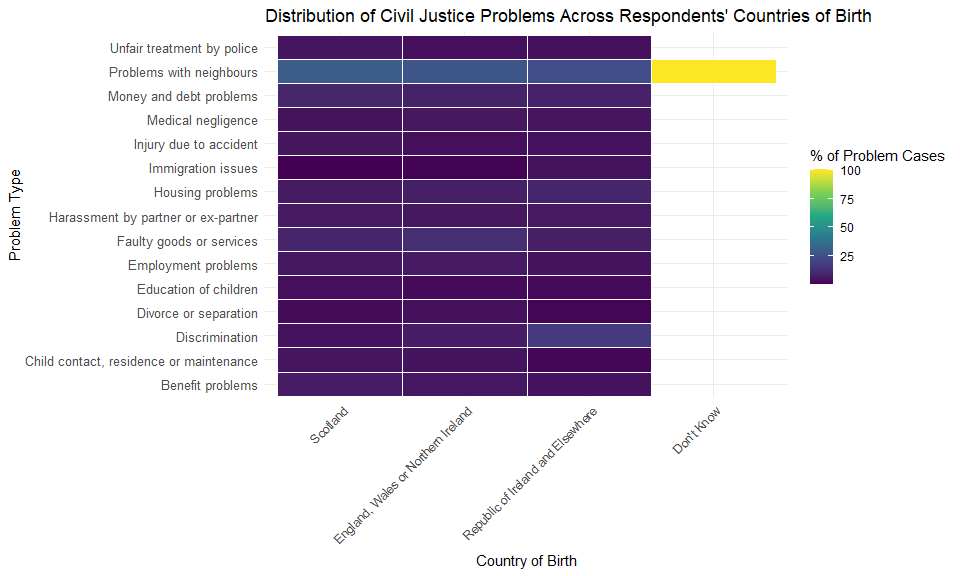
People born outside the UK or having a minority religion were both more likely to experience discrimination and less likely to access advice services or solicitors
Impact of country of birth
Problem types were broadly similar across country-of-birth categories, except for higher reports of discrimination among those born outside the UK. Those born outside the UK were less likely to access both advice services and solicitors1.
These findings have important implications for equality of access within the civil justice system. The higher incidence of discrimination reported by individuals born outside the UK, combined with lower rates of service use, suggests the potential presence of unmet legal need within migrant communities. Barriers may include language difficulties, limited awareness of rights, uncertainty about eligibility for services, or concerns about immigration status and institutional trust.
Taken together, this pattern raises concerns that those facing discrimination may be among the least likely to seek formal assistance, potentially reinforcing existing vulnerabilities.
Author's calculation from the Scottish Crime and Justice Survey
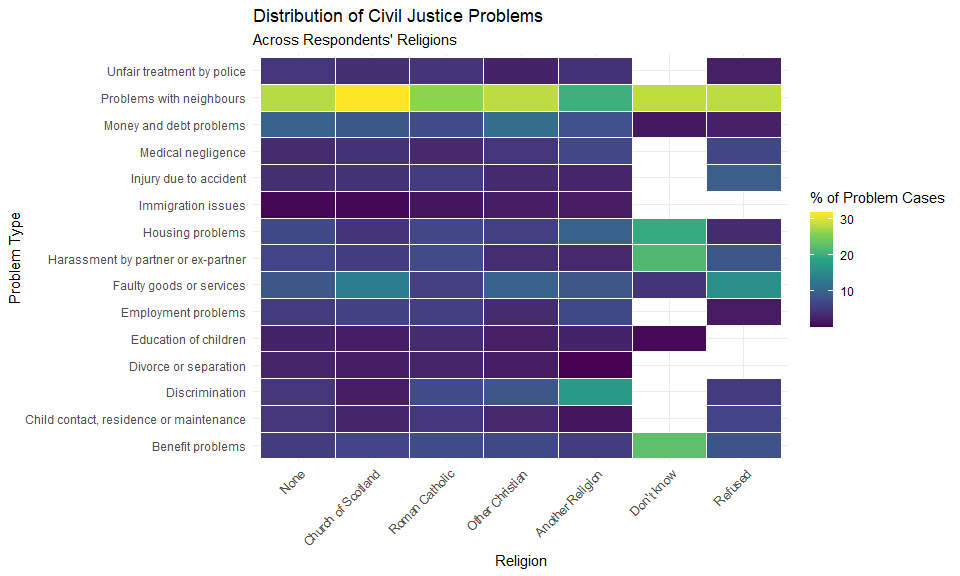
Impact of religion
Figure 10 shows that neighbour disputes were the most common problem across religious categories. Respondents identifying with religions other than Christianity or no religion reported higher levels of discrimination.
Advice service and solicitor usage were lowest among those declaring ‘Another religion’1. This may reflect differences in perceived institutional trust, prior experiences of discrimination, or reliance on informal support networks.
Higher reports of discrimination combined with lower levels of formal service use suggest potential unmet need among minority faith groups. If experiences of bias or exclusion reduce trust in formal institutions, individuals may be less likely to seek help through the civil justice system.
Author's calculation from the Scottish Crime and Justice Survey
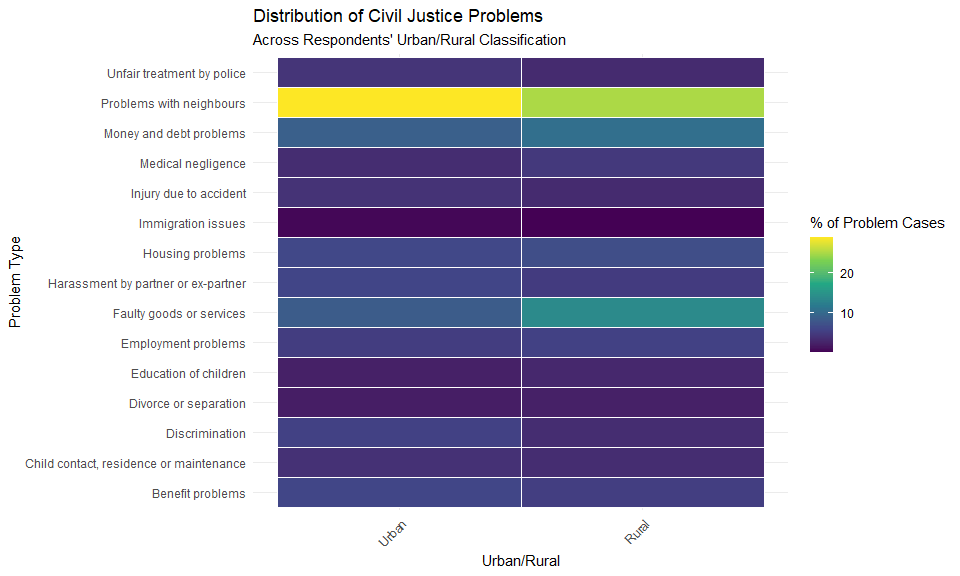
Impact of living in urban or rural areas on experience of civil justice problems
There were only minor differences between people's experience of civil justice problems on the basis of living in an urban or rural area
Figure 11 highlights that problem type distribution was mostly the same across urban and rural areas. Neighbour disputes were more common in urban areas, while faulty goods issues were more common in rural areas.
There were minimal differences in rates of accessing advice service or solicitors (Figure 12), suggesting that geographic density alone does not explain access disparities.
This indicates that, while the nature of disputes may vary slightly by location, potentially reflecting differences in housing patterns or consumer markets, physical proximity to services may not be the primary determinant of access. Instead, other factors - such as digital access, awareness, perceived efficacy and socio-economic characteristics - may play a more substantial role in shaping engagement with civil justice services across both urban and rural contexts.
Author's calculation from the Scottish Crime and Justice Survey
.png)
Author's calculation from the Scottish Crime and Justice Survey
Psychological and other factors influencing access to, and outcomes from, civil justice advice
Methodology for identifying themes
The approach began by simplifying a large set of survey answers into a smaller number of “themes” so that the patterns would be easier to see. This is a standard technique called principal component analysis. In plain terms, it just means that related answers which tended to move together were grouped together.
Factors are psychological, related to how long someone has been in an area and related to what types of problem they have
The themes identified include trust in the police and justice system, self-reliance or confidence, past contact with the police, fears of discrimination, whether someone is new to the area or long established (including immigration related experiences), and the kinds of problems people report (for example, financial, neighbour or family law issues, including domestic abuse). The first few themes carry most of the signal; the later ones add more specialised nuances.
What the findings may mean
These findings suggest that both personal factors (like self-reliance and confidence) and the type of problem shape whether and how people seek help, and whether that help succeeds. Problems with clearer advice pathways and more established forms of support may be easier to identify and take forward than problems that are more relational, contested, or harder to frame in ways that services can readily act on.
A few cautions are worth noting. These are associations, not proofs of cause and effect; some patterns may be driven by unmeasured factors like stigma, past service experiences, or local provision. Themes are a summary of many answers, so they help us see the big picture but cannot capture every nuance.
Even so, the results point to clear opportunities: make it easier to ask for help early; ensure pathways are welcoming and credible for those who distrust formal systems; and tailor support to the complexity of the problem.
This part of the briefing looks at:
Factors influencing use of advice agencies and solicitors
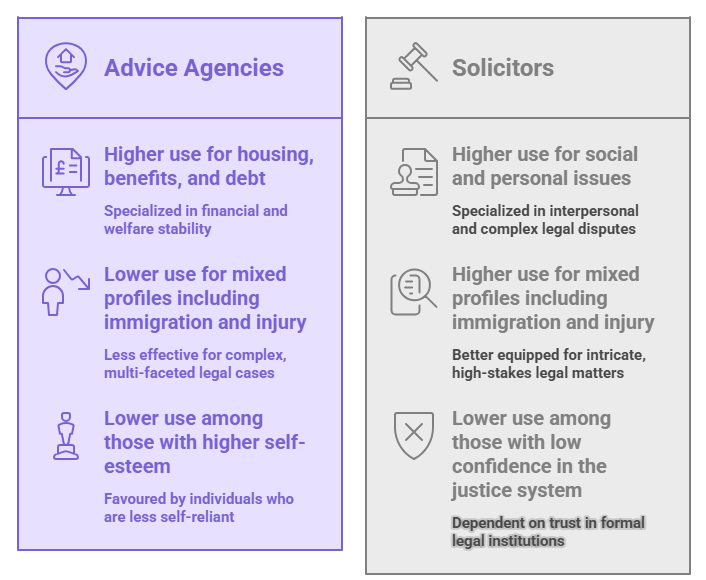
What is influencing access to advice agencies?
When looking at who turns to Citizens Advice Bureaux and similar advice agencies, several patterns stood out. People who described themselves as more self-reliant were less likely to seek help, even when they faced problems where advice could be useful. Advice agency use was lower among people who identified as having higher self-esteem.
Those whose difficulties mainly involved neighbours were also less likely to use advice agencies. This may reflect a view that these are informal disputes best handled personally, rather than legal or administrative issues.
Advice service use was also lower among those whose problem profile was:
centred more on neighbour issues than on family law issues (such as divorce, child contact and partner harassment)
centred more on social issues than employment or faulty goods-related issues.
A further significant component linked lower advice agency use to a mixed profile involving longer residence in the local area, immigration issues, personal injury and medical negligence problems, and fewer faulty goods problems.
By contrast, advice service use was higher among those whose problems were more closely linked to housing, benefits, and debt. This is consistent with the central role advice services play in benefit and debt advice, though future analysis could usefully separate housing from benefits and debt, as more serious housing cases may follow different routes into legal representation.
What is influencing access to solicitors?
Solicitor use was lower among people whose problems were more centred on neighbour issues than on family law-related issues.
Lower use was also associated with one component capturing weaker confidence in the effectiveness of the police and justice system, and with a separate component capturing more positive previous experience with the police. These appear to represent different attitudinal dimensions rather than a single consistent pattern. Lower use among people who view the police and justice system as less effective may reflect wider scepticism towards formal institutions.
Solicitor use was higher among those with a mixed profile involving longer residence, immigration issues, personal injury and medical negligence problems, and fewer faulty goods problems. Solicitor use was also higher among those whose problems were wider social and personal issues, including neighbour disputes, harassment, and police-related contact, than employment or faulty goods-related, and among people living in less deprived areas. Higher use among people in less deprived areas could reflect a mix of affordability, greater familiarity with legal processes, or confidence in navigating formal routes.
Author's calculation from the Scottish Crime and Justice Survey
Factors associated with issues which remain unresolved after seeking advice
The main factors influencing whether an issue was resolved
Importantly, getting through the door does not always lead to resolution. Across both advice agency and solicitors, unresolved outcomes were related to several factors. These encompassed:
lower self-esteem
lower confidence in the police and the justice system
experience of family law problems (such as divorce, child contact and partner harassment).
Certain problem types, alongside psychological factors, influence whether an issue is resolved for advice agency users
Among advice agency users, unresolved problems were associated with lower self-esteem, lower confidence in the police, and one main mixed problem profile. This profile combined partner harassment, divorce or separation, child contact issues, personal injury, and reporting crime. In other words, unresolved outcomes were linked to a cluster of family-related, safety-related, and injury-related problems rather than to one single issue alone.
A broader mix of problem type is associated with unresolved issues for solicitor users
Among solicitor users, the pattern was broader and less concentrated around one type of issue. Unresolved outcomes were associated with lower confidence in the police and with several mixed problem profiles. These included combinations of medical negligence, personal injury, housing, immigration, discrimination, neighbour problems, employment issues, police contact, lower self-direction, and fewer money and debt problems. This suggests that unresolved outcomes for solicitor users were linked to overlapping clusters of difficulty rather than to one separate problem type.
Access to Civil Legal Support Index (CLSI)
The goal was to build a clear, year by year picture of where people are most likely to struggle to access support with civil justice problems across Scotland’s 32 local authorities. This involved assembling a multi-dimensional dataset at council level (council by year) using data from 2013 to 2024. It brings together indicators on housing and homelessness, health, work and incomes, crime, education, demographics, practical access barriers, and supply deficit. This evidence base was used to create the access to Civil Legal Support Index (CLSI).
The Civil Legal Support Index is hosted on the University of Edinburgh's website. It can be adjusted by year and by pillar (social need, access barriers or legal advice and support supply). The weighting of each of these pillars in the overall calculation can also be adjusted).
The Civil Legal Support Index can be accessed via the following weblink:
This part of the briefing looks at:
The methodology behind the access to Civil Legal Support Index
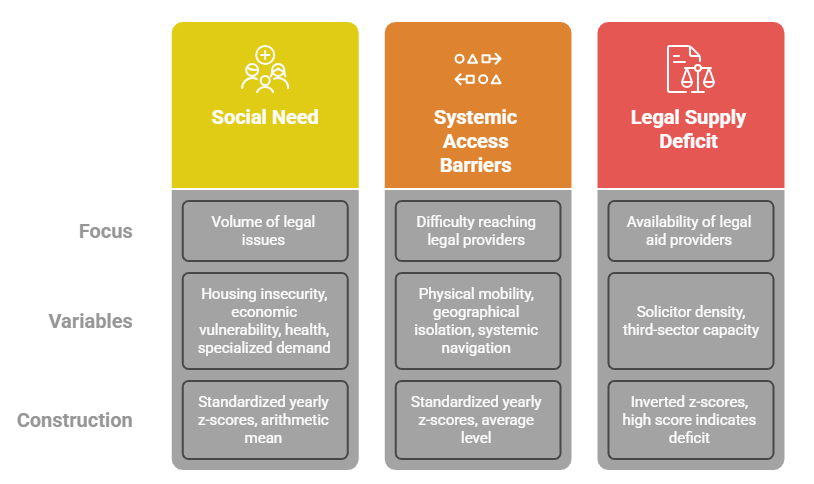
What the CLSI measures:
social need: signals that civil justice problems are more likely to arise, such as homelessness and overcrowding, unemployment and low incomes, poorer health or disability, lower qualifications, crime levels, and the presence of people who may need immigration advice
access barriers: the everyday frictions that make it hard to reach or use services, such as households without a car, weaker public transport and longer travel times to services (including rurality and remoteness), digital exclusion, and long working hours that leave little time to seek help
legal and advice supply (or its absence): the local “safety net” for civil legal support, solicitors who can take legal aid cases and advice/third sector capacity such as law centres and advice services. Because we are measuring vulnerability, places with fewer providers score worse.
How the index is built and how to read it
For each of these ingredients, a council is compared to its peers in the same year and then a simple average within each pillar is taken. Higher scores mean more need, more barriers, or a thinner legal advice and support safety net.
When the three pillars are combined, places with high CLSI scores are those where need is high, getting to help is harder and there are fewer local providers. Those are the areas where people are most at risk of going without advice unless services adapt, by adding capacity, reducing travel/time hurdles, or tailoring support to the kinds of problems people face locally.
The index flags structural relative access pressure. It does not seek to predict actual outcomes. Nor is it a verdict on service quality.
What it took to build the dataset
Many sources are reported for small neighbourhoods (data zones). These were carefully aggregated to the council level so the results translate more directly to how services can be planned at local authority level.
Some measures change every year (e.g. unemployment), while others are older baselines (e.g. 2011 census items). They were all aligned on a common annual timeline, with what is dynamic and what is stable clearly marked.
Different providers publish data in different formats. Names and units were standardised, inputs were cleaned and checked, and consistent rules were applied so figures are comparable across places and years. Where a series had small gaps, simple, transparent methods were used to fill them in.
CLSI is a relative, year by year comparison. It does not cover all advice services. And it does not, by itself, capture remote/telephone advice if that is not consistently recorded. Nor does it measure outcomes. That is why it should be interpreted alongside usage and model-based expectations.
Even so, it provides a clear, policy-ready map of where to focus effort and how to tailor responses to local conditions.
Author's calculation from the Scottish Crime and Justice Survey
The measure used by CLSI is a 0 to 100 risk score that summarises the chance that residents cannot get timely support with civil justice problems. Scotland’s national average stayed around 42 to 52 across the decade.
Key findings from analysing the access to Civil Legal Support Index
The lowest levels of local legal capacity are found in two very different places
Islands with small or dispersed populations cannot sustain commercial practices. The Shetland Islands show a practical supply collapse at 0.0001 providers (solicitor and advice/third sector) per 10,000 residents. Na h‑Eileanan Siar is at 0.38 and Orkney at 0.44. These areas often have low poverty, so a system‑wide crisis may not trigger. However, when issues arise, there is nowhere to go locally.
Affluent commuter councils next to cities also lack local provision. East Dunbartonshire has 0.36 providers per 10,000 and East Renfrewshire at 0.83. Firms base themselves in nearby Glasgow, so residents depend on travel and city capacity. This creates ghost capacity. On paper, help is nearby, but locally it is missing. If city capacity tightens or transport costs rise, access fails.
There are critical cold spots
Risk is highest where high need and barriers meet low supply. In 2024, seven councils met this test: North Ayrshire, North Lanarkshire, South Lanarkshire, Renfrewshire, West Lothian, Fife, and Aberdeen City.
North Ayrshire is the clearest example. It combines high deprivation (17.0 percent income deprived) and poor health (9.12 percent reporting bad health) with very low capacity. There were 1.86 providers per 10,000 residents and no organisations captured in our third-sector advice supply measure.
Other squeezed periphery councils have needs comparable to Glasgow but lack the density that makes a commercial market viable.
The third sector advice supply measure used captures registered legal charities and organisations accredited to the Scottish National Standards for Information and Advice Providers. It does not capture all advice or support which may exist locally. For example, some provision may sit in unaccredited local authority services or in organisations whose remit otherwise falls outside the definition used here. In addition, some of the charities captured do not offer direct advice provision.
Urban areas hog capacity creating commuter dependency
Glasgow has the highest measured need and barriers, and also the highest supply at 7.24 providers per 10,000 residents. Edinburgh has lower need but still holds a large share of supply at 3.84 per 10,000 residents. High volumes make urban practice viable. This pulls supply into cities and away from nearby councils that also have significant need. As a result, surrounding areas become dependent on city capacity that they do not control.
There are service cliff-edges in some island communities
In Shetland, Orkney, and Na h‑Eileanan Siar, supply does not taper. It disappears. Because populations are small, the market sees no viable business case. This means that there is no local capacity to provide face-to-face legal advice when problems arise. Support may only be available to those residents who can access it remotely.
Transport barriers compound access problems
Advice deserts also face the highest public transport barriers. In the bottom 20 percent of supply areas, the average transport barrier is 76.5 percent, compared with 62.0 percent elsewhere. Where there are few or no local lawyers, people are also least able to travel to find one. Lack of local help and poor transport trap residents in legal need.
Some councils, most clearly Dundee City and North Lanarkshire, face a reinforcing trio of problems: high deprivation, high public transport barriers (often above 70 percent) and shrinking local firm numbers. As need rises, residents rely more on public transport just as local options decline. This trap is now a structural feature in 13 councils.
Advice/third sector provision may not be plugging some access gaps
Advice agency and third sector provision (such as university law clinics) is not consistently filling local gaps.
Using this broader measure, the location of advice services shows almost no relationship with where solicitors are absent. The correlation between solicitors per 10,000 residents and advice services per 10,000 residents was 0.01 in 2024. In the seven critical cold cpots, average advice service density is lower, at 0.176 per 10,000 residents, than elsewhere, at 0.194.
Correlation is measured on a scale of -1 to +1. A correlation coefficient of +1 would indicate perfect positive correlation - so that as one factor goes up so does the other. A correlation coefficient of -1 would indicate perfect negative correlation. And a correlation coefficient of 0 would show no linear relationship.
This suggests that advice provision is not systematically filling the gaps left by low solicitor supply. However, this finding should be interpreted with some caution, due to the difficulty in developing a measure which accurately captures all local advice provision.
Concentrations of asylum seekers match clusters of existing legal support
The number of asylum seekers in a local authority area has been captured as a rate per 10,000 residents. This measure is included within the "Need component" as an indicator of specialised legal demand. It is strongly correlated with total legal supply (solicitor and advice/third sector providers), with a correlation coefficient of 0.68.
Placing people near lawyers makes sense, but it concentrates complex legal needs in the same hubs that already carry Scotland’s wider social demand. This may create hidden capacity pressure in cities.
Poor health is the strongest predictor of access risk
Poor health is the strongest area-level predictor of access to legal support risk in 2024, with a correlation coefficient of 0.95. Areas like North Ayrshire and Inverclyde have high chronic illness and disability, which are likely to increase overall need for legal and advice service support. In these places, lack of access to legal support may worsen existing vulnerability. There may therefore be benefit in considering access to legal support as part of a wider local response to social and health-related need.
Inverclyde has a very high need, including Scotland’s highest rate of reported bad health. Yet it maintains a strong supply at nearly 4.0 Civil Legal Aid solicitors per 10,000 and a supply score of 52.4. This shows that collapse is not inevitable in high-poverty areas. Understanding Inverclyde’s approach could inform national policy.
Scotland Mismatch Index
The Mismatch Index is a statistical model looking specifically at expected and observed use of Civil Legal Aid solicitors. This allows identification, at data-zone level, of areas which appear under- or over-served in terms of access to Civil Legal Aid services.
This part of the briefing looks at:
What the Mismatch Index does
The Mismatch Index looks specifically at access to services providing Civil Legal Aid by comparing expected use with observed use in each area.
It is a simple way to show where access to Civil Legal Aid is falling short of what would be expected. For each place where people live (data zone) and for each year, the following data were compared:
Expected access: how much advice or how many applications would be expected, given how many people live there, how close and well‑resourced nearby providers are, and how far people have to travel.
Observed use: how much advice or how many applications actually happened from that place.
If expected access is higher than observed use, the index is positive: that area looks under‑served.
If observed use is higher than expected use, the index is negative: that area looks comparatively well‑served.
Mismatch is reported on a logarithmic scale. This makes the measure less sensitive to raw count differences, helps compare small and large areas more fairly, and treats under-use and over-use in a balanced way.
It has been possible to undertake separate calculations for specific categories of advice (adults with incapacity, family law and "other") and overall. These categories were chosen because the Scottish Legal Aid Board was able to supply data broken down in this way.
Adults with incapacity covers work by solicitors under the Adults with Incapacity (Scotland) Act 2000, such as guardianship and intervention orders, and power of attorney.
Family law covers issues such as divorce and child contact, as well as civil interventions to protect someone from domestic abuse and harassment.
The "other" category covers all other problem types, including housing, discrimination, medical negligence, fatal accidents, judicial review and immigration.
How we built the Mismatch Index
1) Estimate expected access.
This was done using a well-known economic approach called the gravity model. The basic idea is that places with more people tend to generate more demand, while use tends to fall as travel time increases. In the context of Civil Legal Aid, this means that places with more solicitors and advice capacity would generally be expected to attract more use, particularly when they are easier for people to reach.
This model was applied to multi-year data, allowing the effects of distance and supply to differ by category of problem (adults with incapacity, family law or other). The analysis also allowed for wider council-level differences and year-to-year changes that are not directly measured in the data. In practice, this means the model adjusts for underlying differences between councils, such as service context, population, and institutional arrangements, as well as broader changes over time, including policy shifts or economic shocks.
2) Predict flows and aggregate them to where people live
For each origin area, the model’s predicted flows to all feasible destinations were added up, covering the nearest set of providers as well as any observed links in the data. This gave an expected total for each area and year. The actual recorded flows were also summed to create the observed total.
3) Compare expected and observed use
The Mismatch Index compares expected and observed use in each area and year. Positive values indicate that fewer people are accessing Civil Legal Aid in an area than expected, suggesting under-service. Negative values indicate that more people are using Civil Legal Aid in an area than expected. These results were then used to identify hot spots, meaning clusters of under-served areas, and cold spots, meaning clusters of comparatively well-served areas.
How the Mismatch Index supports policy development
Why this is significant
The Mismatch Index helps identify where additional effort may have the greatest effect. It highlights places where adding capacity or improving referral pathways may be most likely to turn expected access into actual use. It also provides a consistent year-by-year way of comparing areas, helping to show whether gaps are persistent, emerging, or narrowing over time.
When the Mismatch Index is set alongside the need and barriers index (the Civil Legal Support Index), there is an indication of whether gaps are driven by high need, hard‑to‑reach services, or limited supply, and therefore what kind of remedy may be most appropriate.
Because it can be calculated consistently each year, the Mismatch Index can help measure whether actions (for example, additional supply, improved transport links, digital routes) are closing the gap in targeted areas.
The Mismatch Index is about structural access, not service quality or outcomes. It is based on recorded use so, if remote or telephone advice is logged differently, the index may under‑state access in some places. It shows associations rather than proof of cause and effect. It should therefore be read alongside local knowledge.
Even so, it provides a clear, policy‑ready signal of where people are most at risk of going without legal advice and where work to increase capacity or improve access is likely to matter most.
High-level findings
Distance and low levels of local supply both show up clearly. Areas with longer travel times to providers, weaker public transport, or few Civil Legal Aid solicitors tend to have positive mismatch - that is, lower use than expected (under‑serving) - even after accounting for population size.
Key findings are:
There are different sensitivities between the different categories of advice. Family andadults with incapacity are more distance‑sensitive; under‑serving is more likely where travel is harder or local capacity is limited. “Other” matters look somewhat less distance‑sensitive.
There is a "home‑council effect". People strongly prefer to use providers in their own council area. Where strong cross‑boundary pathways are lacking, communities near council borders can show under‑serving even when nearby supply exists just over the line.
Provider clusters matter for access. City centres and areas around strong provider clusters more often show negative mismatch (better‑than‑expected access), especially where advice service presence is high.
This part of thebriefing also looks at:
Civil Legal Aid use sensitivity (estimated elasticities) by distance and supply
predicted Civil Legal Aid use if distance or supply increases.
Elasticity estimates capture the proportional responsiveness of Civil Legal Aid use to changes in distance or supply. Predicted flows look at the impact of different values of distance and supply on service use. They therefore focus on expected levels of use rather than percentage responsiveness.
Civil Legal Aid use sensitivity by distance and supply
This section looks at estimated elasticities. These show how much Civil Legal Aid use is estimated to change, in percentage terms, when distance or supply changes by 1%.
Distance elasticities are more negative, indicating that service use falls more sharply as travel becomes harder. Supply elasticities are positive, indicating that service use responds more strongly to additional provision.
Looking at distance elasticities by case type
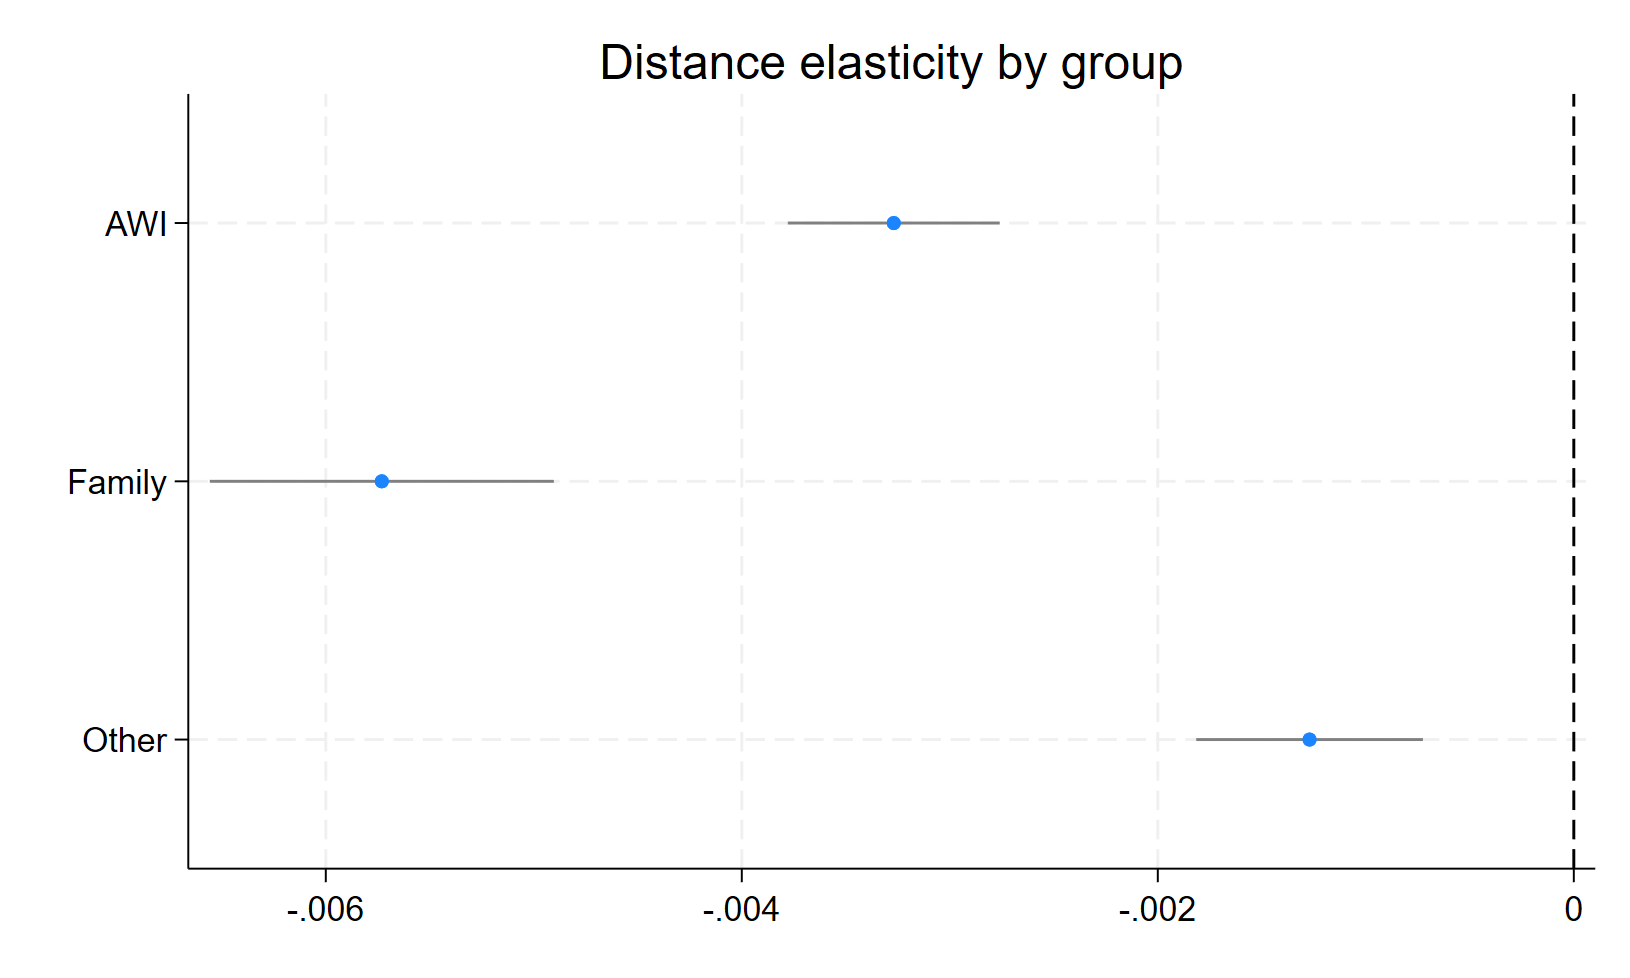
Author's own calculations from Scottish Legal Aid Board data
This image shows how sensitive Civil Legal Aid use is to changes in distance for each case type. It highlights how use changes as travel becomes harder. More negative values mean that use falls more sharply as distance increases. This makes it possible to see which case types are most constrained by geography. The x-axis shows the estimated percentage change in legal aid use associated with a 1% increase in distance.
Looking at supply elasticities by case type
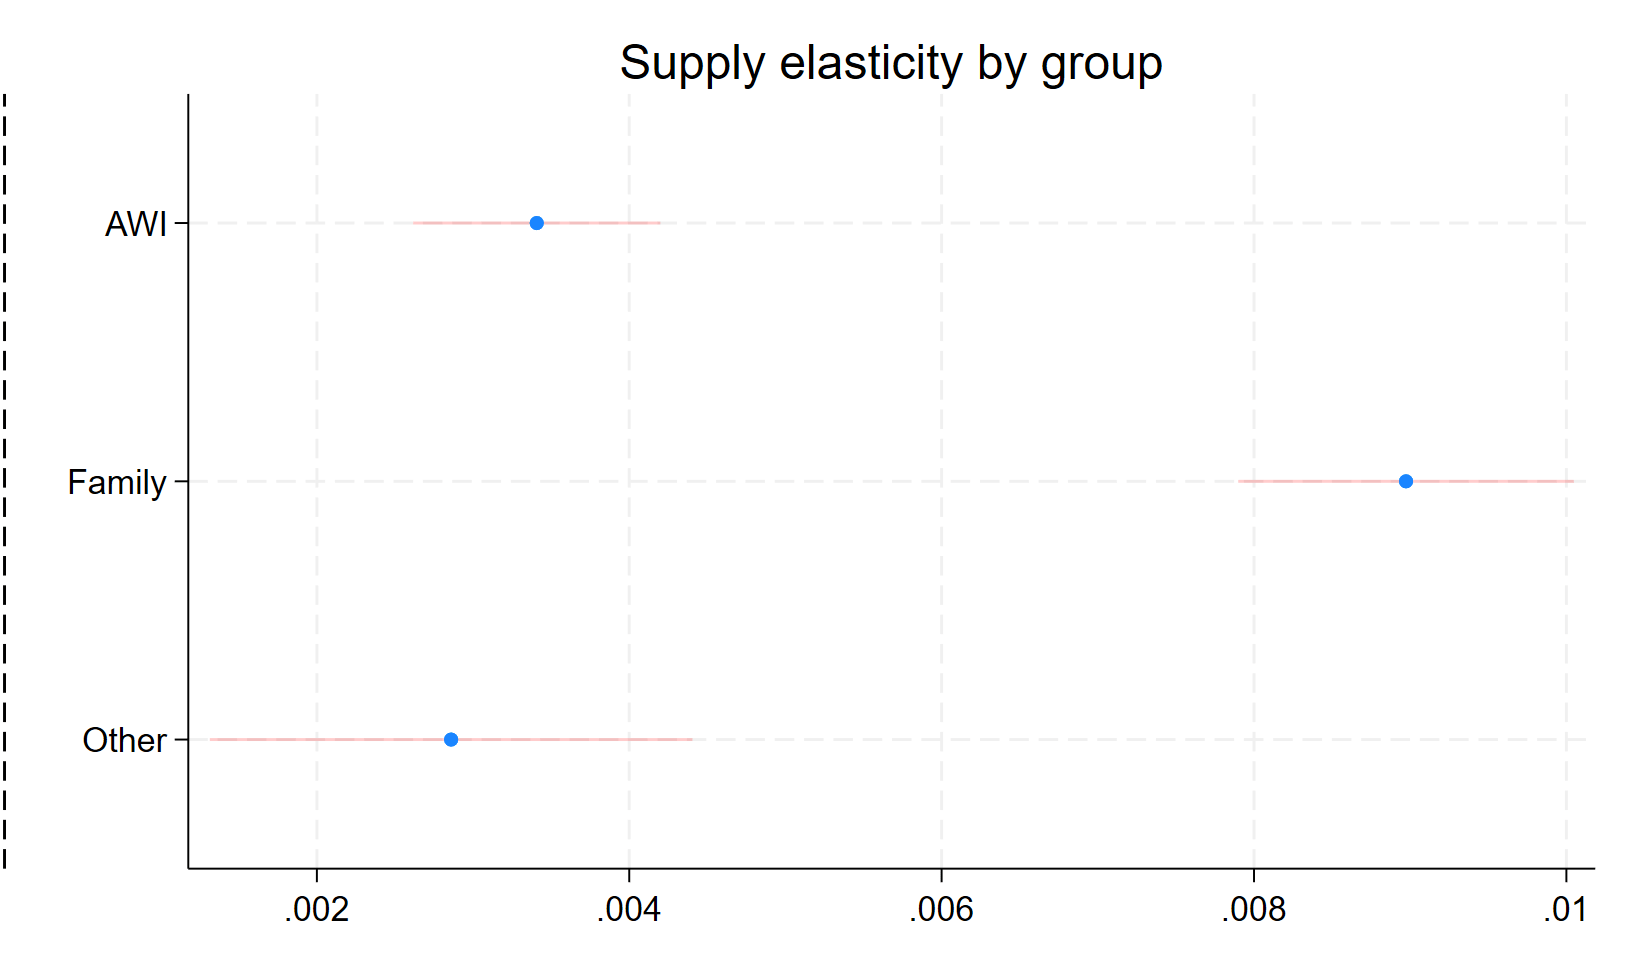
Author's own calculations from Scottish Legal Aid Board data
The case type-specific elasticity image shows how strongly Civil Legal Aid use responds, in percentage terms, to changes in supply for each type of case. For supply, larger positive elasticities indicate that extra local capacity is more likely to increase uptake. This makes it possible to see which case types would benefit most from additional provision. The x-axis shows the estimated percentage change in Civil Legal Aid use associated with a 1% increase in capacity.
Predicted Civil Legal Aid use if distance or supply increase
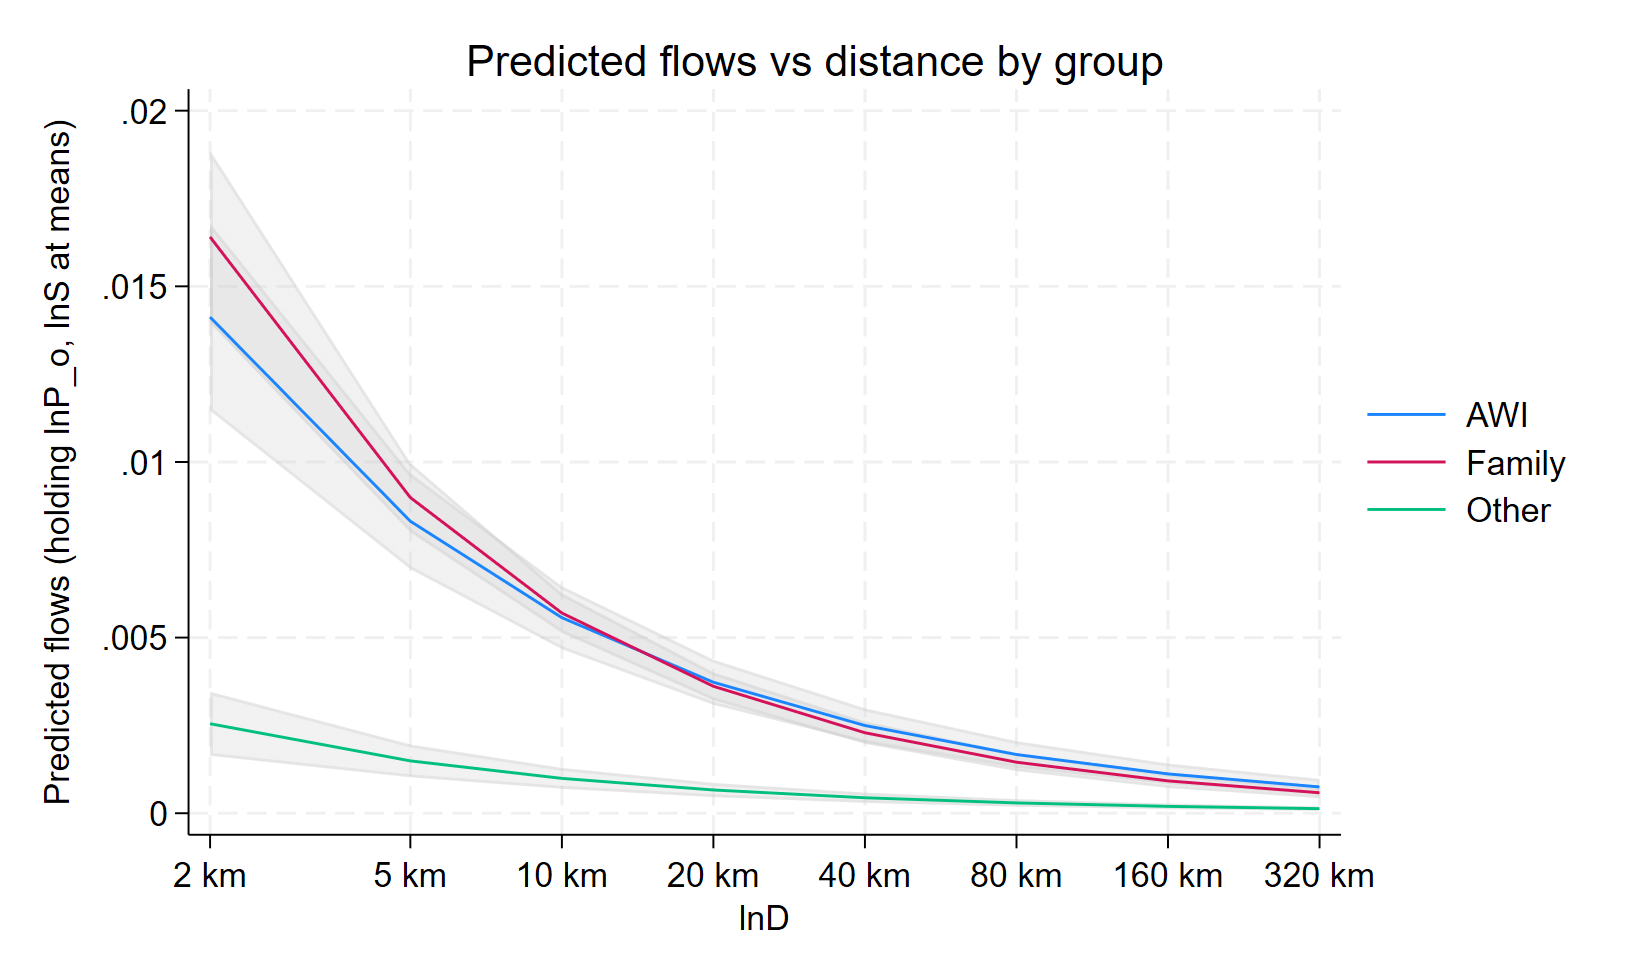
Impact of distance on predicted use by case type
To make the gravity results easier to interpret, predicted Civil Legal Aid use was plotted against distance for each case type, holding other factors constant at typical values. Figure 17 shows how expected Civil Legal Aid use changes as distance to services increases, holding other factors constant at typical values. A steeper decline indicates that a case type is more sensitive to travel barriers.
Author's calculation from the Scottish Crime and Justice Survey
Impact of supply on predicted use by case type
Similarly, predicted Civil Legal Aid use was also plotted against provider capacity to show how expected use changes as more legal aid provision becomes available. Figure 18 shows how expected Civil Legal Aid use changes as provider capacity increases, holding other factors constant at typical values. A steeper increase indicates that a case type is more responsive to additional provision.
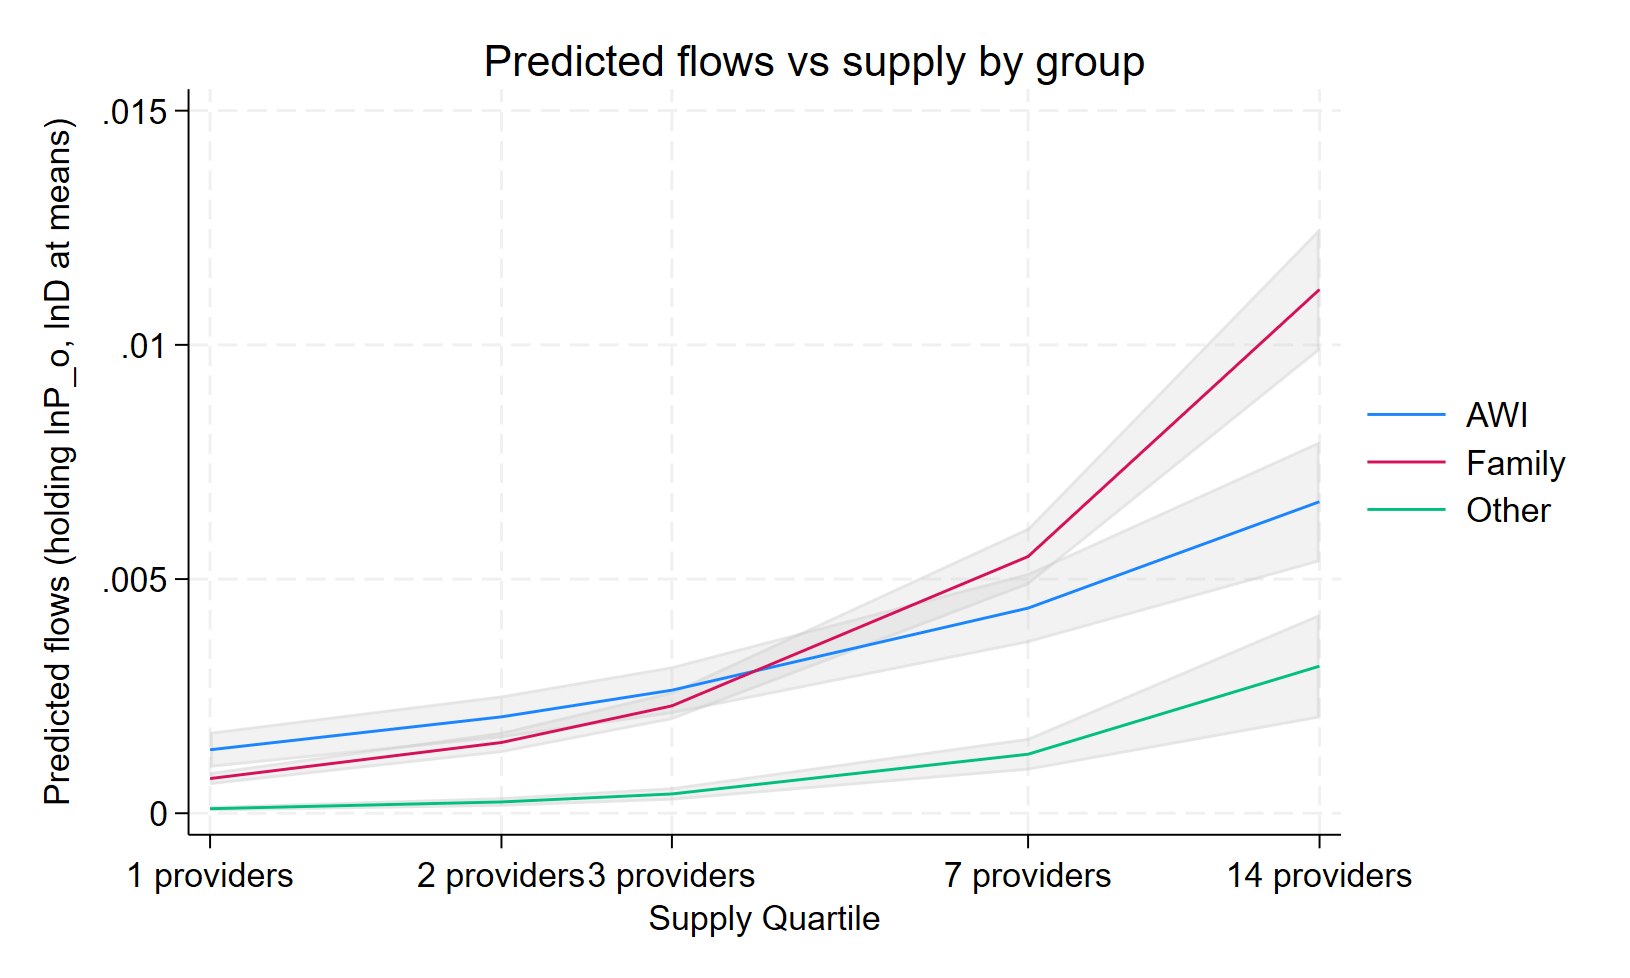
Author's own calculations from Scottish Legal Aid Board data
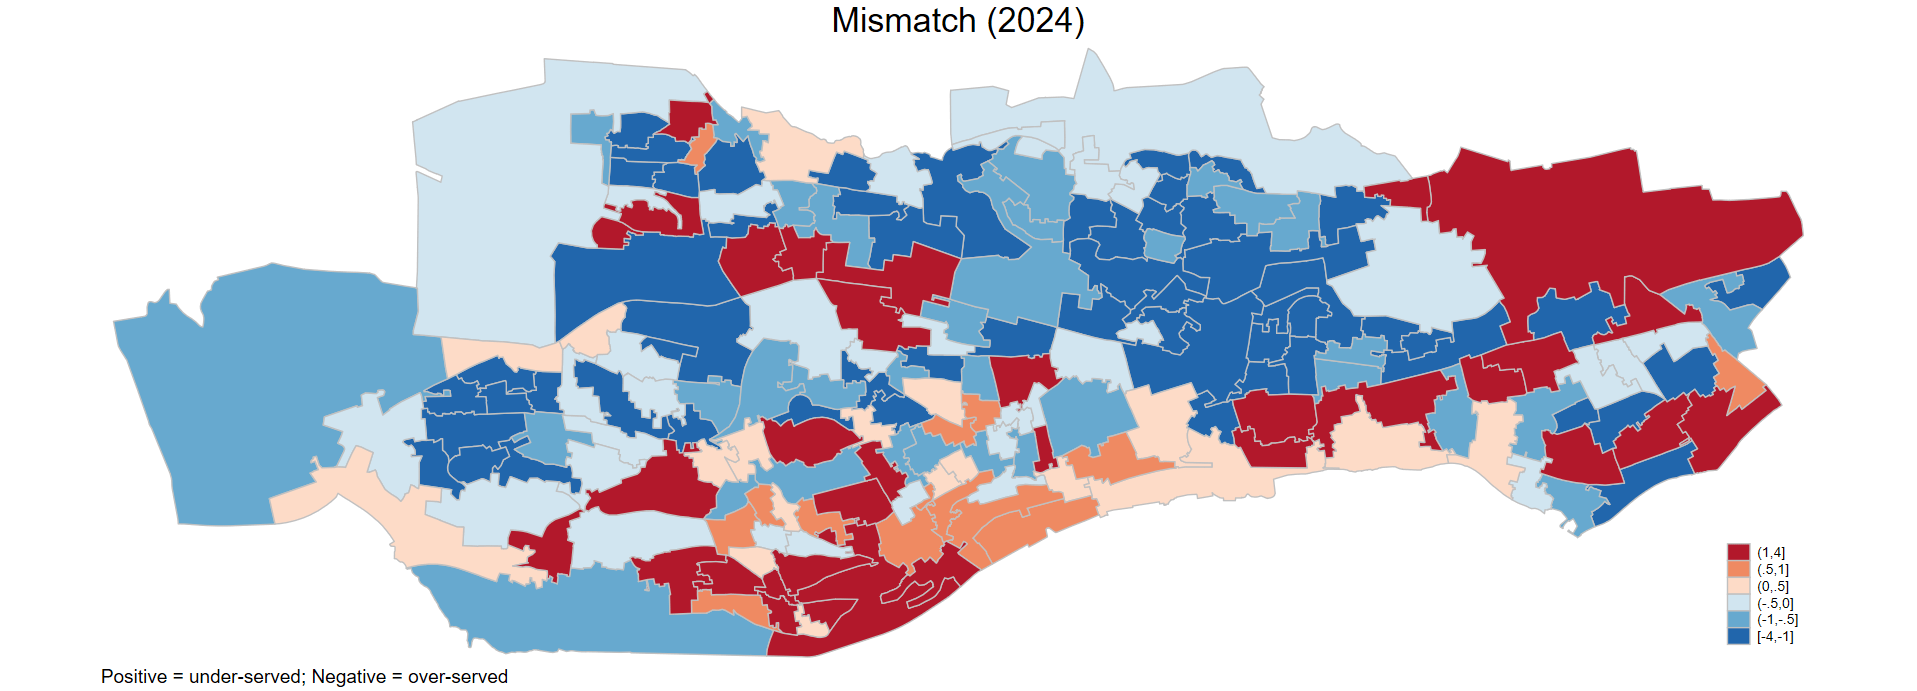
Overall mismatch across Scotland
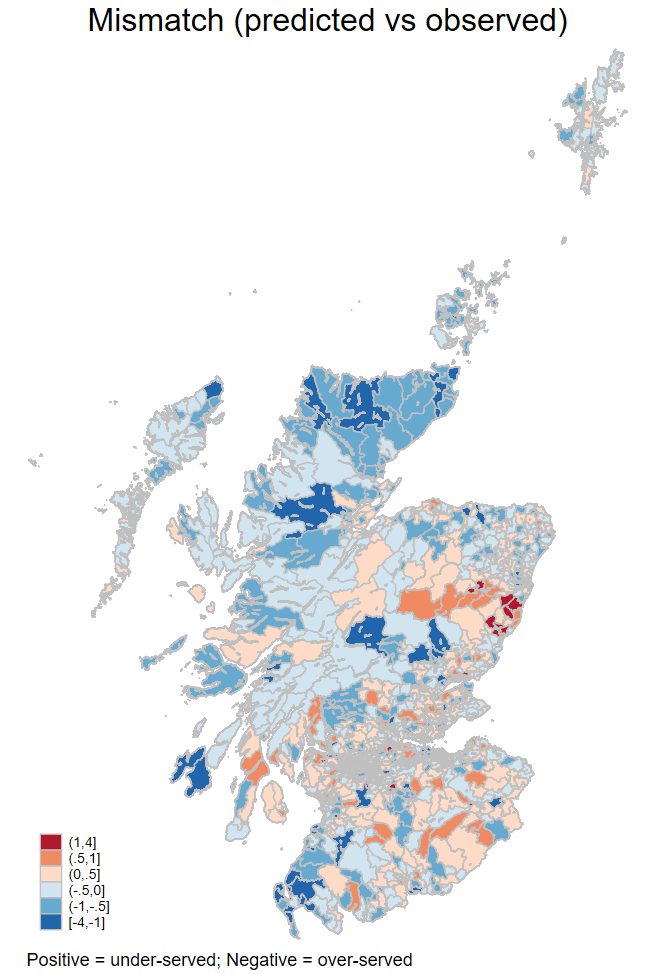
Author's own calculations from Scottish Legal Aid Board data
Author's own calculations from Scottish Legal Aid Board data
Negative (blue) mismatch scores mean observed use is higher than predicted. Positive (red) mismatch scores mean observed use is lower than predicted.
The mismatch analysis highlights a clear geography of unequal access (average across 2017-2024). Areas at the bottom of the ranking (blue) have strongly negative mismatch scores. This means that observed use of Civil Legal Aid is higher than the model would predict given their distance to services and the level of local provision.
By contrast, the top of the ranking (red) identifies areas with strongly positive mismatch scores. Here, expected access is higher than the use that is actually observed. These are the places that appear under-served.
This part of the briefing looks in more detail at:
the factors driving negative mismatch (areas which appear over-served)
the factors driving positive mismatch (areas which appear under-served)
The factors driving negative mismatch
In practical terms, these are places that appear comparatively well served, or at least better connected to legal support than their structural characteristics alone would suggest.
Many areas showing positive mismatch are in urban centres
Many potentially over-served locations are in or around major urban centres, such as Dalry and Fountainbridge in Edinburgh, or Glasgow Harbour and Partick South in Glasgow.
These places benefit from close proximity to dense clusters of solicitors and other support services. In the model, this is captured primarily through proximity to Civil Legal Aid solicitor supply.
More broadly, these areas may also benefit from nearby advice agencies and wider public services, which can make routes into legal advice easier even where they are not directly measured in the same way. They may also have stronger transport links and more opportunities for informal referral into legal advice.
Some smaller and semi-rural areas appear in the over-served group
Some smaller or semi-rural areas appear in the over-served group, for example, Carluke East, Carstairs and Carnwath, and Renfrewshire Rural North and Langbank. This may indicate the importance of specific local routes into support, such as reliance on nearby towns or stronger-than-expected referral pathways. It may reflect fewer practical and social barriers to access than the broader model captures: for example, better transport connections, shorter effective travel times, stronger local knowledge of services, or fewer difficulties in navigating available support.
The factors driving positive mismatch
These are the areas which appear under-served in comparison to their structural characteristics. Several of these are particularly striking because they are not all remote rural areas.
Urban and city-centre locations appear in the under-served group
Some - such as City Centre West, Calton and Gallowgate in Glasgow, and parts of Airdrie and Coatbridge - are urban locations where one might expect physical proximity to services to translate into higher use. Their appearance here suggests that proximity alone is not enough.
In these areas, there may be other barriers suppressing take-up, such as low awareness of services, weaker trust in formal institutions, more complex advice needs, stigma, digital exclusion, or service pathways that are harder to navigate than the geography implies. In other words, these places may be close to legal help on the map, but not close to it in practice.
Some urban periphery areas also appear to be under-served
A second pattern is that several under-served areas, including North Haugh near Perth, Pittencrieff in Dunfermline, Raith Estate and Southerton in Kirkcaldy, and Bathgate East, sit outside the largest provider hubs in Scotland. In these locations, the mismatch may reflect a combination of moderate distance, weaker local supply, and fewer easy referral routes.
Even where nearby services exist at a council or city scale, they may not be accessible in a meaningful sense if travel costs, service visibility, or administrative barriers are high. This is especially important because the gravity model already adjusts for distance and supply. A positive mismatch therefore points to something beyond simple geography, suggesting unmet need or hidden barriers.
There are two types of access problem - low levels of local supply and hidden barriers
These rankings reinforce the idea that problems with accessing Civil Legal Aid are not only about how many providers exist, but also about whether people can realistically identify, reach and use them. The over-served locations appear to benefit from strong urban infrastructure, service clustering, and possibly embedded referral networks. The under-served locations point to places where those links are weaker, or where local populations face obstacles that reduce uptake despite apparent proximity to provision.
These problems require different policy solutions
These findings are significant for policy because they help distinguish between two very different problems. In some areas, the issue is clearly lower levels of local supply or remoteness, which calls for more local capacity. For example, this could involve additional solicitor provision or new outreach options.
In others, especially some urban under-served areas, the issue may be hidden access barriers rather than absolute absence of provision. There, the response may need to focus more on navigation and trusted referral routes to support for groups who are less likely to seek help even when services are nearby. Given the correlation between poor health and increased risk around access to legal help, co-location with community or health services may be worth considering. The potential impact of digital exclusion can also be explored.
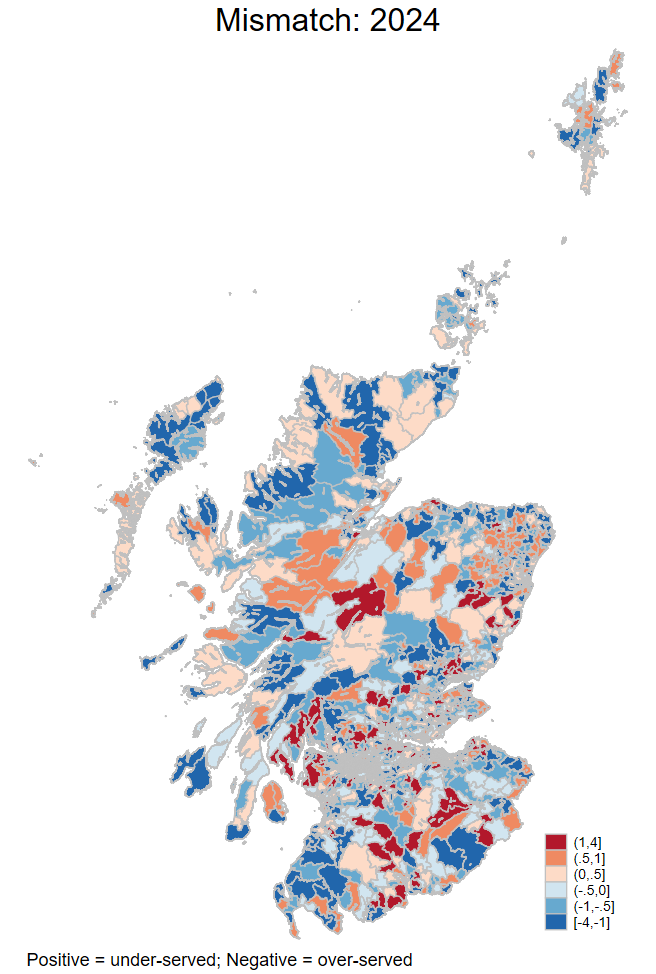
What the 2024 snapshot tells us
Over-served areas remain broadly the same, suggesting stability in the factors influencing access
The 2024 Mismatch Index closely resembles the longer-run average, suggesting that patterns of relative over- and under-service are fairly stable over time. Over-served areas remain concentrated in or near major urban service centres, such as Dalry and Fountainbridge and Glasgow Harbour, consistent with the enduring advantages of dense provider networks and stronger transport connections.
Under-served areas also show marked continuity, with places such as North Haugh, Pittencrieff, Bathgate East, and parts of Glasgow and North Lanarkshire again appearing among the most under-served. This suggests that barriers to access are persistent and, in some urban areas, cannot be explained by distance alone.
The 2024 picture reinforces longer-term trends
What the 2024 ranking adds, therefore, is confidence that the mismatch patterns are not simply artefacts of averaging across years. The same broad contrast remains visible: some places consistently perform better than expected because services are concentrated and easier to reach, while others repeatedly fall short despite not always being the most remote.
This suggests that under-served areas in the 2024 ranking should be treated as current priority locations for intervention, not just historical anomalies. It also underlines the value of the Mismatch Index as a policy tool, because it identifies both persistent structural gaps and the places where short-term service pressures may be compounding longer-run disadvantage.
Mismatch in Edinburgh, Glasgow, Dundee and Aberdeen
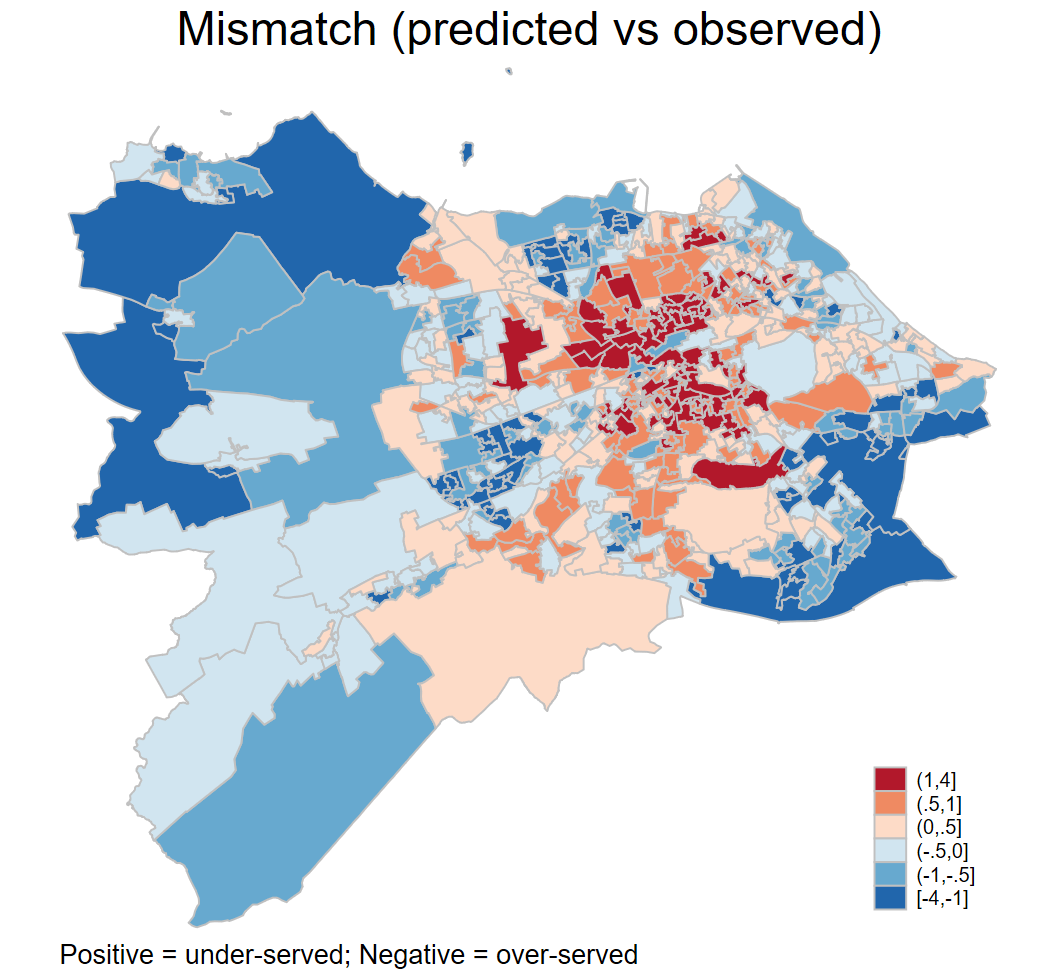
Author's own calculations from Scottish Legal Aid Board data
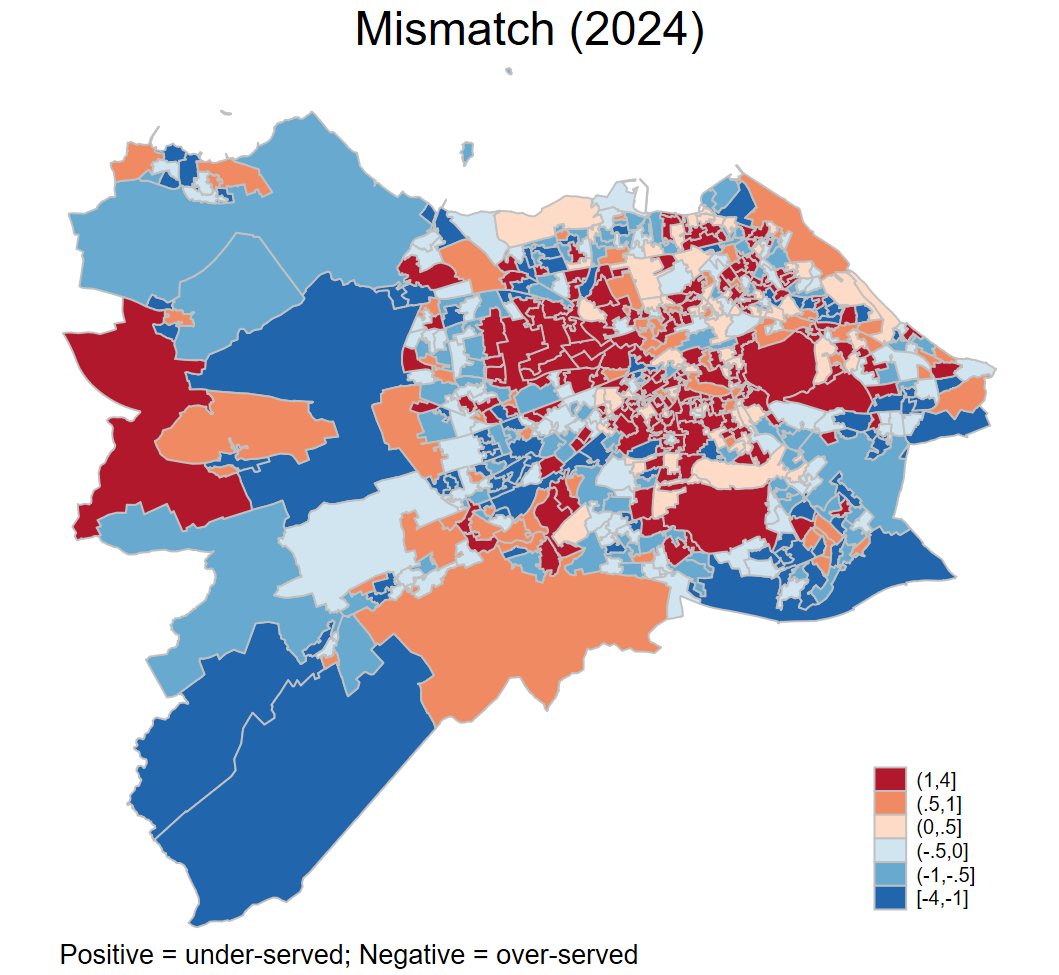
Author's own calculations from Scottish Legal Aid Board data
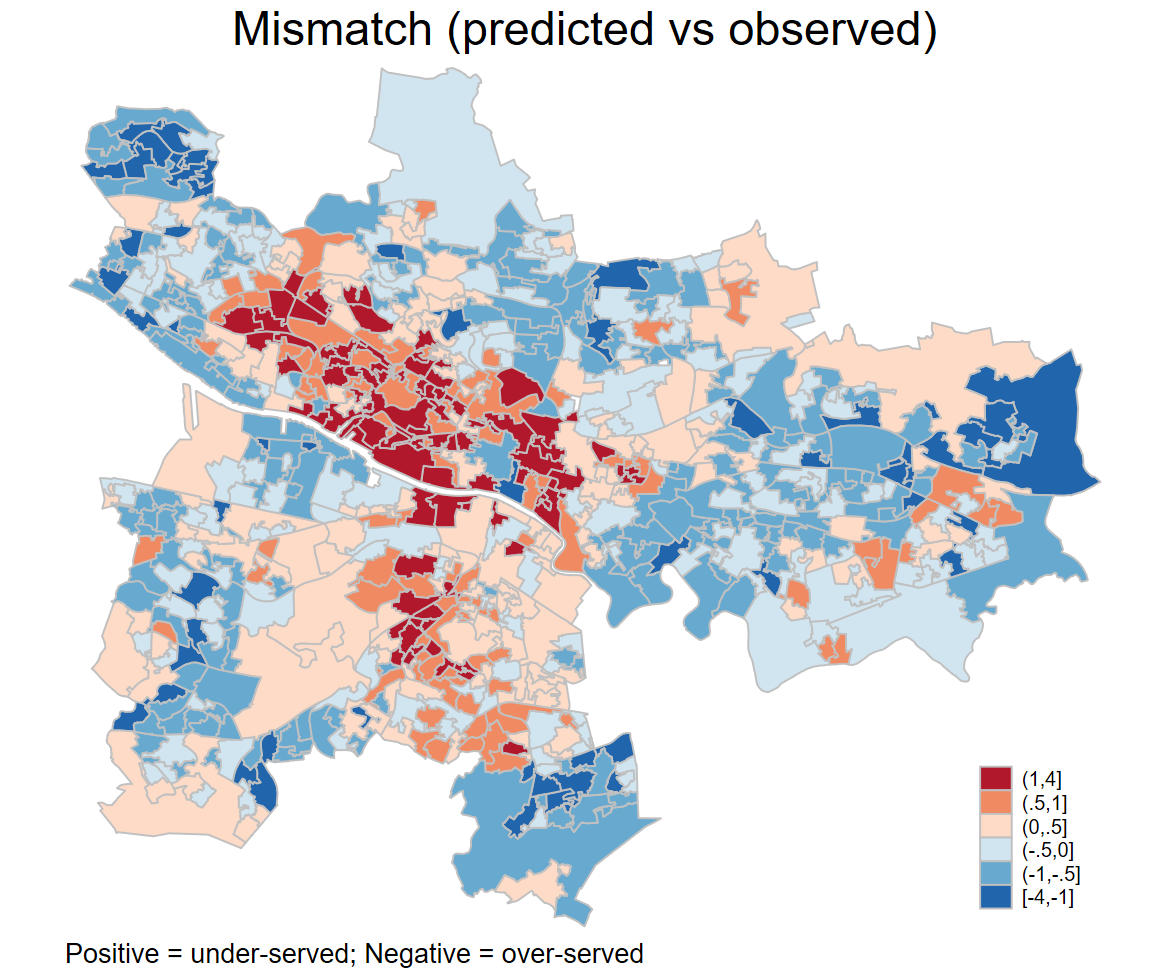
Author's own calculations from Scottish Legal Aid Board data
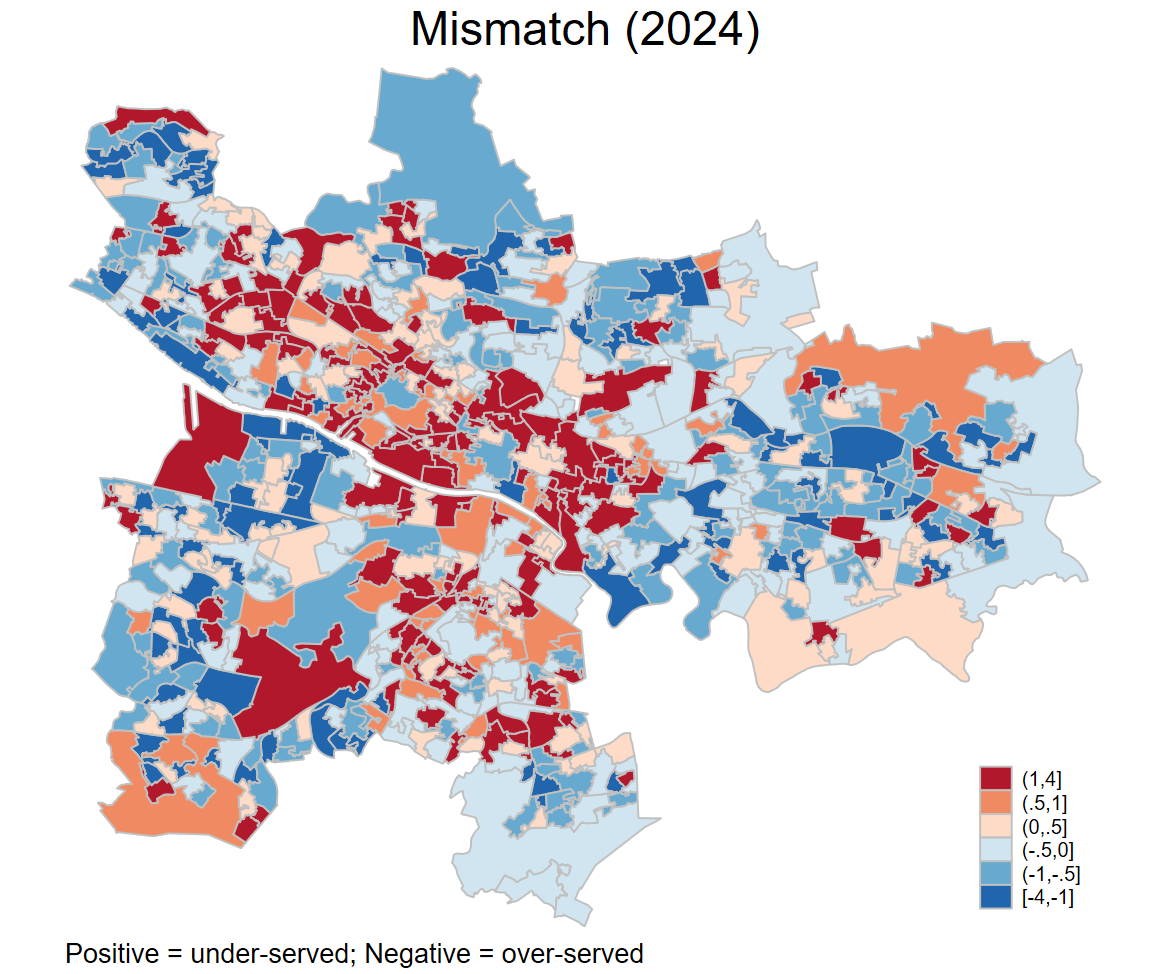
Author's own calculations from Scottish Legal Aid Board data
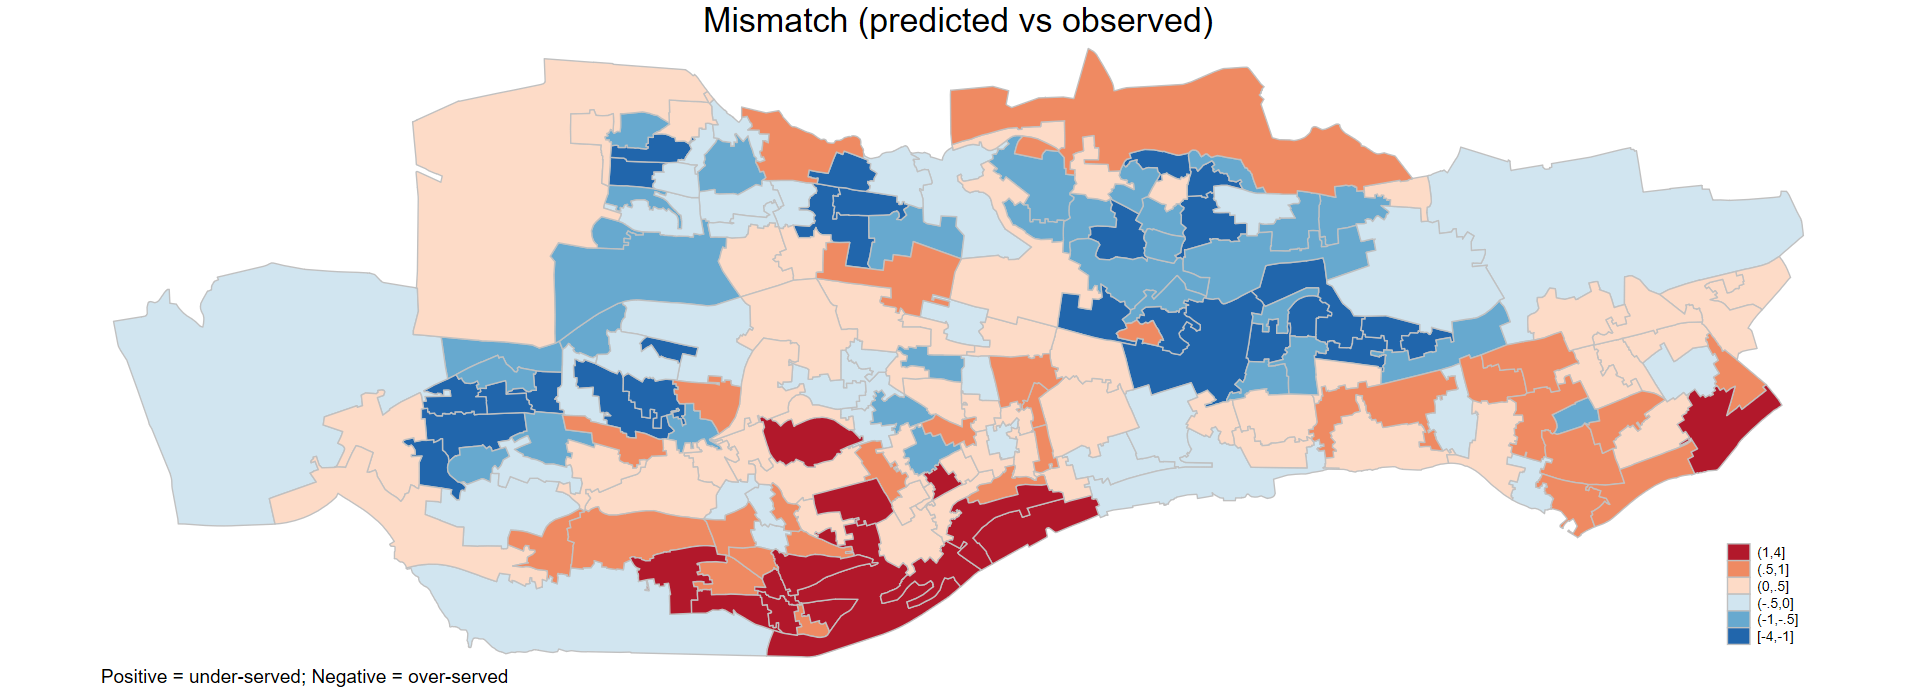
Author's own calculations from Scottish Legal Aid Board data
Author's own calculations from Scottish Legal Aid Board data
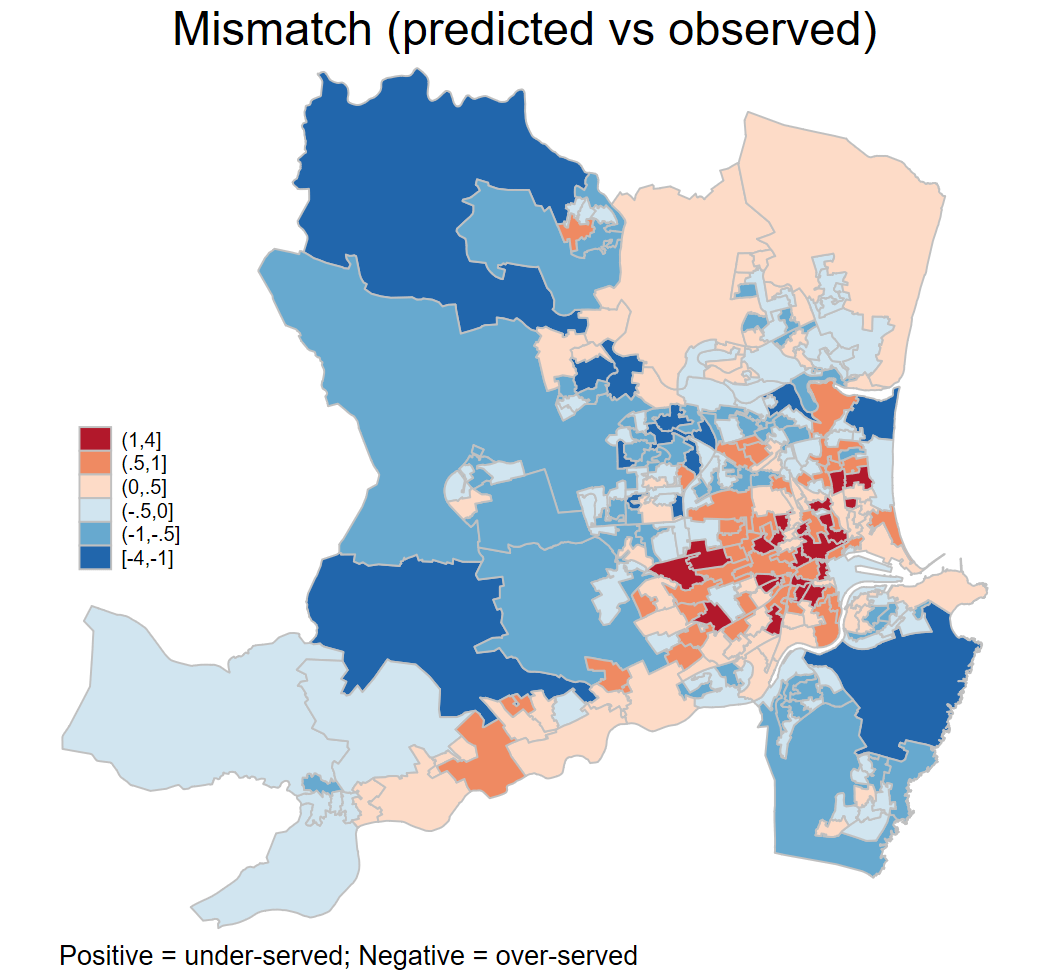
Author's own calculations from Scottish Legal Aid Board data
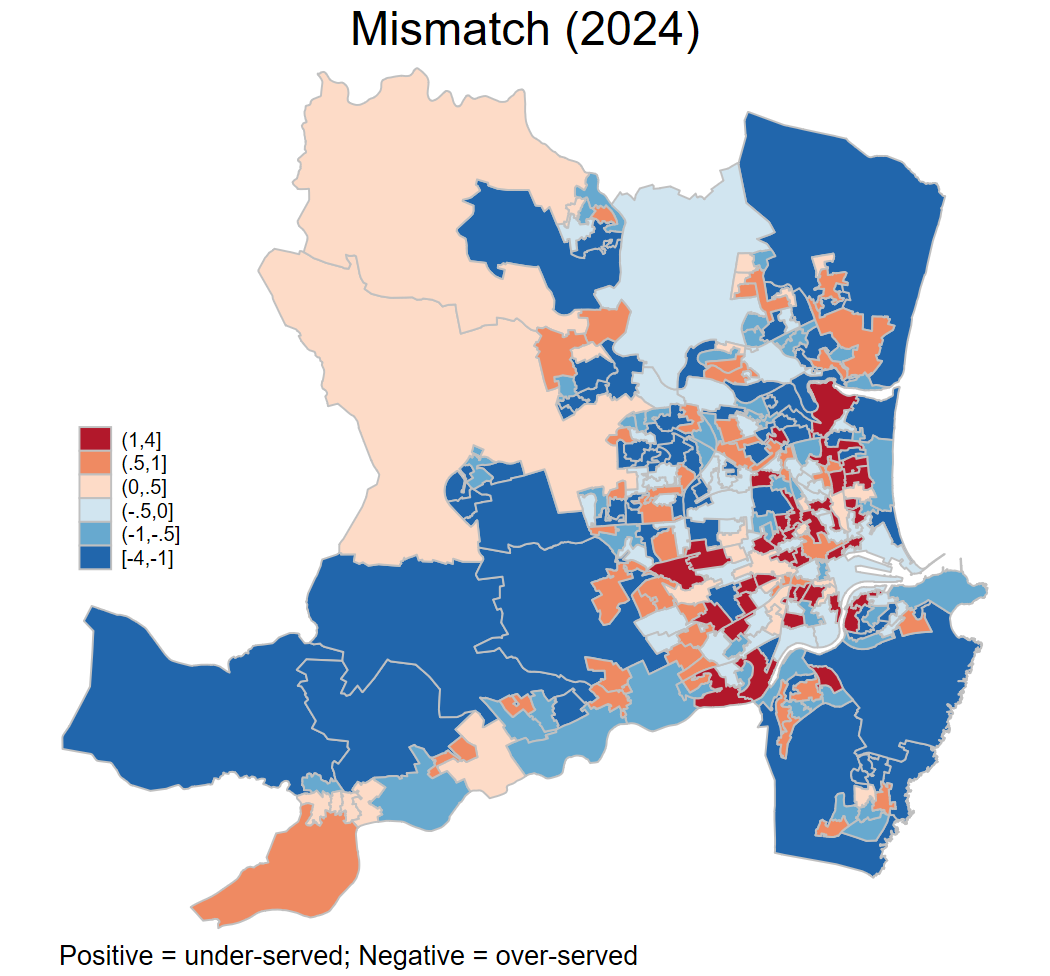
Author's own calculations from Scottish Legal Aid Board data
Sources
Scottish Government . (2023). Scottish Crime and Justice Survey. This study uses responses to civil justice questions asked in 2012/13, 2014/15 and 2021/22. Retrieved from <a href="https://www.gov.scot/collections/scottish-crime-and-justice-survey/" target="_blank">https://www.gov.scot/collections/scottish-crime-and-justice-survey/</a> [accessed 17 May 2026]
Scottish Government. (2023). Author's analysis based on Scottish Crime and Justice Survey civil justice questions in 2012/13, 2014/15 and 2021/22.. Retrieved from <a href="https://www.gov.scot/collections/scottish-crime-and-justice-survey/" target="_blank">https://www.gov.scot/collections/scottish-crime-and-justice-survey/</a> [accessed 17 May 2026]