Scotland's economy: Subject profile
This briefing provides information about Scotland’s economy. It presents a range of statistics to illustrate the features of Scotland's economy and how the economy has performed in recent decades.
Summary
This briefing provides information about Scotland’s economy.
Scotland’s economy is a small service‑sector‑dominated economy with onshore output of £219 billion in 2025 - around 7% of the UK total. As in many advanced economies, its structure has shifted over recent decades from manufacturing to services, with finance, professional services and health growing the fastest. Scotland’s public sector is larger than the UK average.
In terms of performance, Scotland’s economy has experienced a slowdown in growth since around 2008. Geopolitical events and the Covid-19 pandemic have been destabilising, but something more structural appears to be happening. Across a number of metrics, Scotland’s economy is on a slower growth trajectory than pre-2008.
GDP per capita, for example, grew at an average rate of 1.8% between 1998 and 2008. But annual growth has averaged 0.6% between 2008 and 2025, exceeding 1.8% in only four of those years.
It’s not just that Scotland’s economy has hit a few speed bumps. It appears to be travelling in a lower gear.
This has had a direct impact on peoples’ living standards. Pre-2008, the average citizen got around 10% better off every three and a half years. Since then, the same improvement has taken around twelve and a half years. Had wages continued to grow at their pre-2008 rate, median employee earnings would be roughly £170 per week or £8,800 per year higher today.
Had employee wages continued to grow at their 1998-2008 rate, median employee earnings would be roughly £170 per week or £8,800 per year higher today.
.png)
ONS: Annual Survey of Hours and Earnings, see SPICe dashboard for details
Scotland is not alone in this, but some features of its economy stand out.
Scotland has attracted more Foreign Direct Investment projects than other parts of the UK. However, investment spending across the economy (which facilitates business growth, better infrastructure and economic dynamism) remains one of the lowest in the OECD. Linked to this, productivity growth – described by economists as the ‘economy’s speed limit’ - has outpaced the UK since 2008 but remains low by historic standards. Scotland’s productivity levels are stubbornly stuck in the OECD’s second quartile, having barely moved up international league tables since the onset of devolution.
On economic dynamism, the picture is mixed. Scotland has relatively fewer high growth businesses than internationally comparable economies. Measures of business innovation and early-stage entrepreneurial activity are slightly below the UK average. Rates of business R&D spend are average by international standards. But higher education R&D spend as a share of GDP is almost the highest in the OECD, providing a strong foundation for R&D infrastructure.
Wealth inequality is high. In 2020-2022, a typical household in the wealthiest 10% had £1.3 million in total wealth. The equivalent figure for the least wealthy 10% was £7,600. Over recent decades and particularly since the late 1980s, it has become harder for low-income households to accumulate wealth. Inherited wealth has become a more important determinant of living standards.
Scotland’s unemployment rate has remained remarkably low since the Covid-19 pandemic. Employment levels are also high compared to historic standards but economic inactivity – particularly due to ill health – is now consistently higher than the UK average. A factor in this is that Scotland’s population is ageing faster than the UK’s.
One area where the impact of devolved powers is notable is on poverty, particularly child poverty. There is a clear gap between Scotland’s relative child poverty rate and the UK’s, with lower housing costs and the Scottish Child Payment driving this difference.
Scotland’s international exports as a share of GDP continue to hover around 20%, despite a longstanding Scottish Government target to increase this to 25%. Food and drink lead the way, although there is evidence that Scotland’s exports are concentrated amongst a small number of sectors and businesses.
Finally, it is worth noting that national statistics can mask regional variation. Some variation is to be expected, with different economic profiles for different parts of the country. Factors such as a region’s demography, geography, infrastructure and economic history can all shape this. But Scotland appears to have quite high levels of regional inequality. Some big trends of the 21st century – an ageing population, climate change, the energy transition, and technological change – will affect different parts of Scotland in different ways.
Introduction
This subject profile sets out information about Scotland’s economy. It presents a high-level overview of the main data on the economy and is intended to give a summary rather than a detailed exploration of the factors underlying the performance data. It complements a separate briefing looking at the economic policy landscape in Scotland.
As well as presenting the latest headline statistics, this subject profile also sets out some of the structural longer-term features of the Scottish economy. This is due to the nature of reserved and devolved powers.
Most of the tools used for short-term management of the economic cycle are reserved, for example, monetary policy, most of fiscal policy, and the ability to borrow on a significant scale.
Devolved powers (e.g. skills, health, infrastructure, economic development) are more able to shape the ‘supply side’ of the economy and influence long‑term economic performance.
There is no single statistic that characterises an economy or its performance. Instead, economists use a range of measures. This subject profile presents a series of statistics on Scotland’s economy under different categories. No judgement is made about the relative importance of each statistic.
Economic activity
Measures of economic activity tell us about the monetary value of goods and services produced in the economy. They do not present information about the wellbeing derived from these goods and services or how they are distributed.
Gross Domestic Product (GDP)
GDP measures the value of goods and services produced in the economy over a certain time period, usually one year. It excludes the value of goods and services used for intermediate consumption (i.e. things used up in producing other goods and services) to avoid ‘double counting’.
In current prices (before adjusting for inflation), Scotland’s onshore GDP in 2025 was £219 billion1, around 7.2% of the UK total. Including extra-regio economic activity (primarily oil and gas extraction in Scottish adjacent waters), Scotland’s GDP in 2025 was £231 billion, around 7.6% of the UK total. The volatility in global oil and gas prices means that GDP performance over time is often measured using onshore GDP.2
Under the chained volume measure (which adjusts for inflation), onshore GDP growth in Scotland has slowed during the devolution era.
Between 1999 and 2006, GDP growth averaged 2.2% per year. This slowed to 1.4% per year in 2007 – 2014. Since 2015, GDP growth has averaged 0.8% per year.
The 2008 global financial crisis and the Covid-19 pandemic clearly had an impact on GDP performance. But what is also striking is the relatively subdued recovery from these recessions.
A similar trend of slower GDP growth since the 2008 global financial crisis has occurred across the UK and many international peers.
When compared to the UK as a whole, Scotland’s GDP has tended to grow at a lower rate, on average. Almost all of the gap is due to Scotland’s relatively slower population growth. This is intuitive – with more people it is easier to produce more goods and services. To assess the change in economic activity per person, GDP per capita is a more relevant measure.
GDP per capita
The slowdown in GDP growth is also apparent on a per-person basis. This appears to be a long-term trend, in which the economy’s ‘trend’ rate of growth has slowed, rather than just being the impact of volatility from one-off events.
Scotland's economy is on a lower growth trajectory than before 2008.
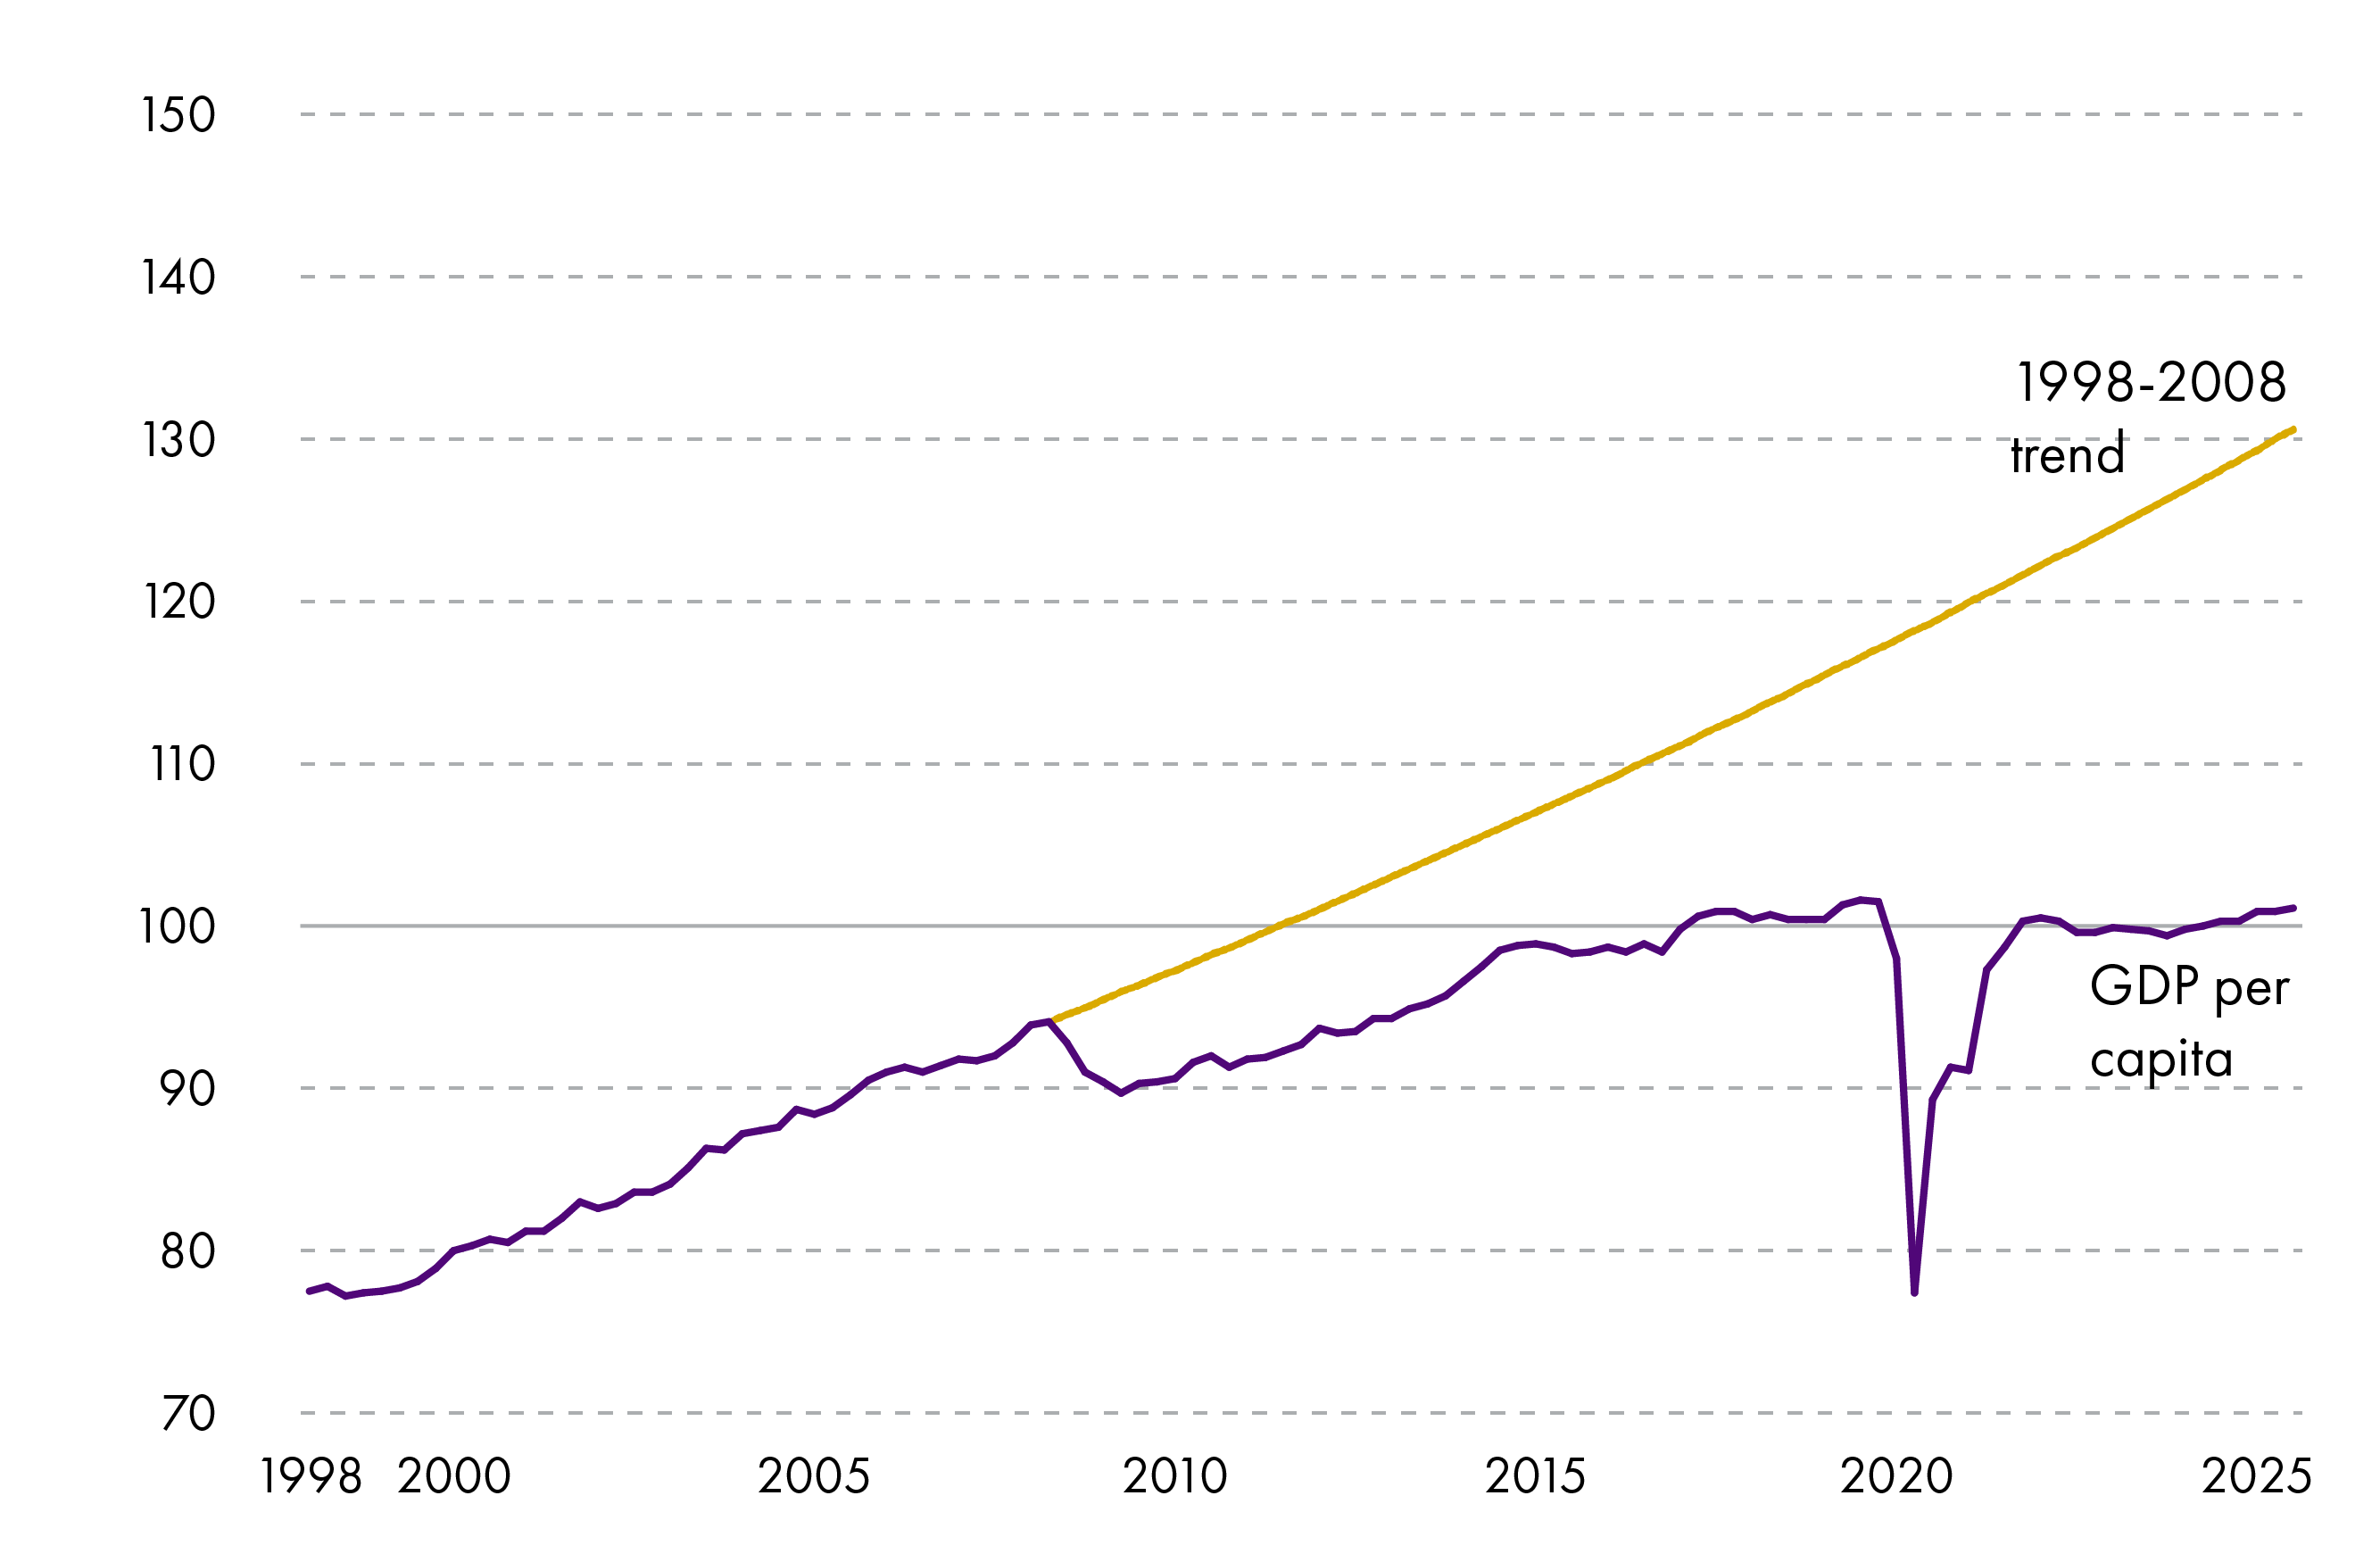
Scotland’s annual growth rate of onshore GDP per capita averaged 1.8% between 1998 and 2008. It averaged 0.6% between 2008 and 2025, exceeding 1.8% in only four of those years.
Directly comparable official statistics pre-1998 are unavailable, but academic studies tend to show that 1998-2008 was not an outlier for Scotland’s economy.1 The post-2008 slowdown in growth appears to be unprecedented in the post-World War II era.
As noted above, these trends are also occurring in economies elsewhere both in the UK and internationally, albeit to varying degrees.
Productivity
Productivity is one of the main drivers of GDP growth (along with factors such as population growth and labour market participation). It tells us about how efficiently the economy generates output for a given amount of inputs. The average rate of productivity growth has been described as the economy’s ‘speed limit’.1
Economists often measure productivity as output per hour worked, as there is a strong link between increasing this metric and growing wages over the long-term. 2 Gains in productivity can also be used to work fewer hours whilst maintaining a given standard of living.
Productivity levels in Scotland’s onshore economy are the highest in the UK outside London and the South East of England. However, they remain below the UK average, due to the significant disparity in performance between London and the rest of the UK.
Productivity levels in Scotland are slightly below the UK average but higher than everywhere outside the South East of England.
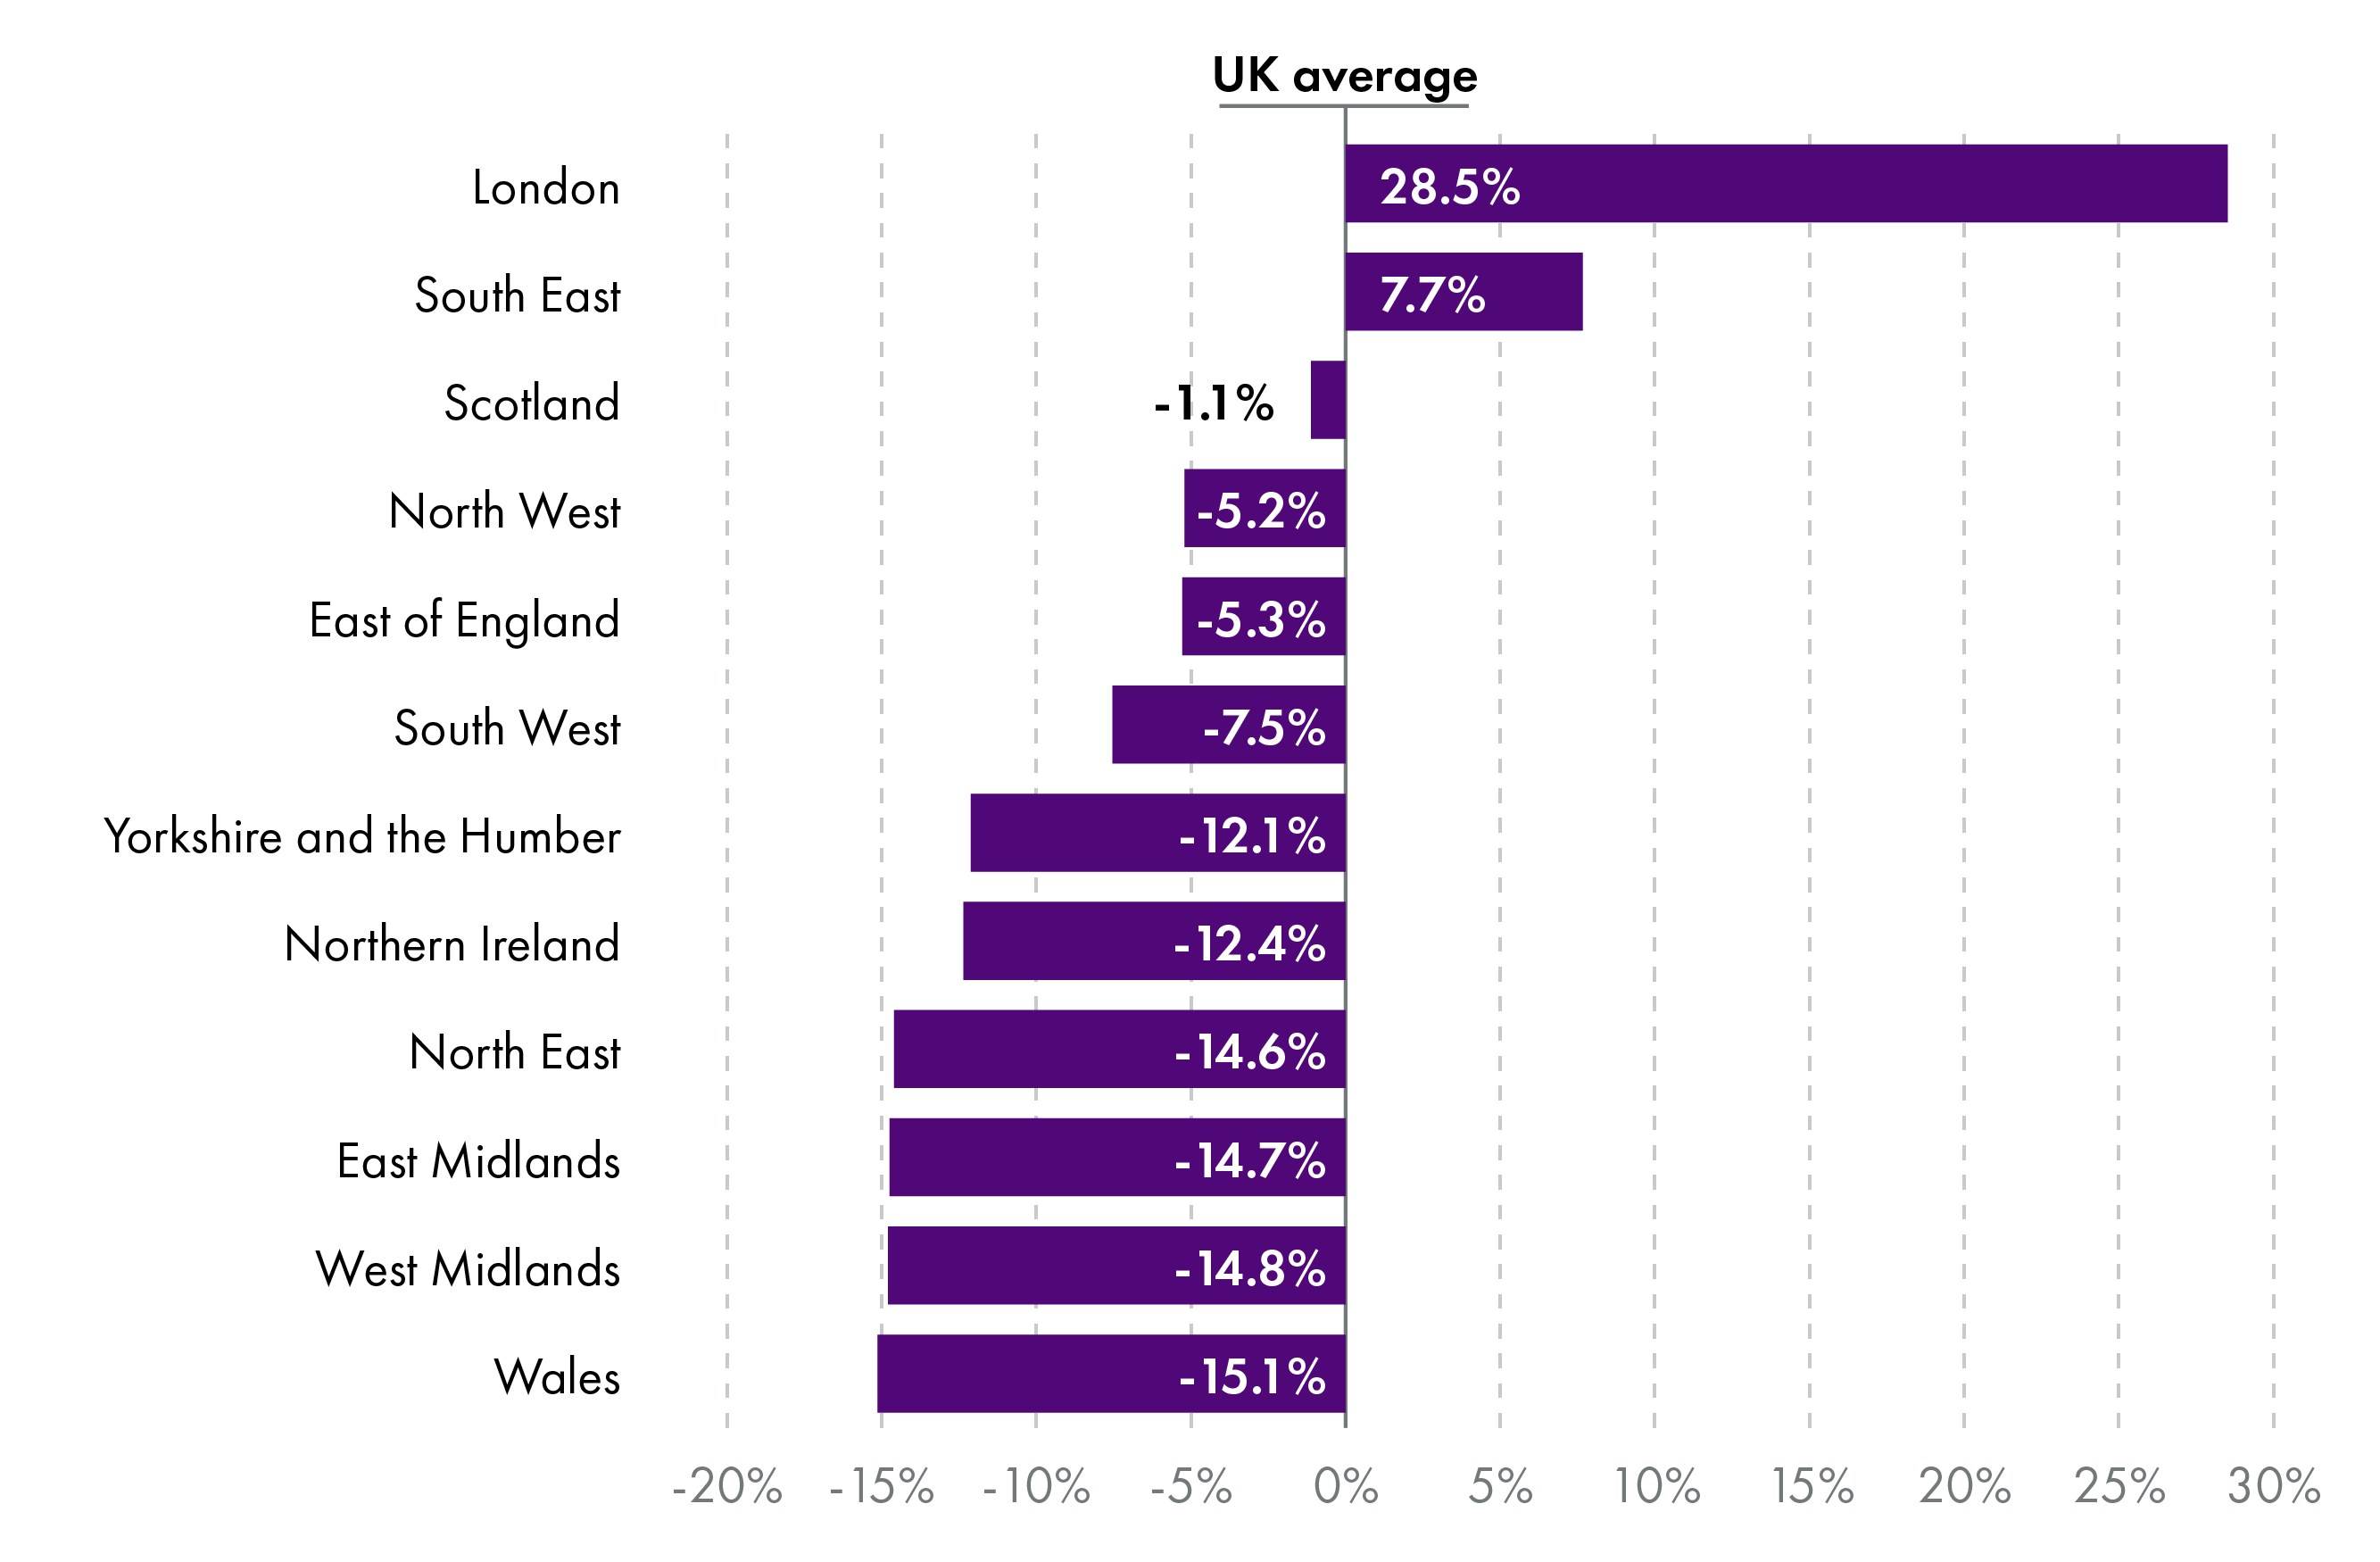
Comparing more widely, Scotland’s place in international league tables is in the second quartile of advanced economies.3 In 2023, its output per hour worked ranked 17th out of 37 in the Organisation for Economic Co-operation and Development (OECD). Scotland ranked 19th in 1998.
The Scottish Government has noted that if Scotland’s productivity levels matched the OECD top quartile, average wages would be almost 10% higher. Improving productivity performance has therefore been a key target for the Scottish Government.
In terms of how productivity has changed over time, productivity growth in Scotland and other advanced economies has slowed since around the 2008 global financial crisis. However, over that time, Scotland’s productivity growth rate has outpaced the UK overall.
| Region | 1998-2008 | 2008-2024 | 1998-2024 |
|---|---|---|---|
| Scotland | 1.4 | 0.8 | 1.1 |
| UK | 1.8 | 0.4 | 0.9 |
| EU 27 | 1.6 | 0.8 | 1.1 |
Source: Scottish Government
There is variation in productivity levels between different sectors of Scotland’s economy. The sectoral makeup of the economy therefore matters to its productivity performance.
In general, higher‑productivity industries, such as advanced manufacturing, tend to be more technology‑driven and able to scale output through innovation. Lower‑productivity sectors, such as hospitality, are usually more labour‑intensive and face tighter constraints on automation. It is harder in these sectors to increase output without adding more workers. In many economies, including Scotland’s, lower-productivity sectors are big employers.
This raises a difficult trade-off for governments. To improve the economy’s productivity, should they focus on growing highly productive industries so that they make up a greater share of the economy, or focus on boosting productivity in high employment/low-productivity industries?
Productivity levels vary across sectors. Primary industries (which includes oil and gas extraction) report far higher levels of output per worker than other industries. Within service sectors, industries such as IT and professional services report higher productivity levels than sectors that include retail and hospitality, education, health and social work, arts and creative industries.
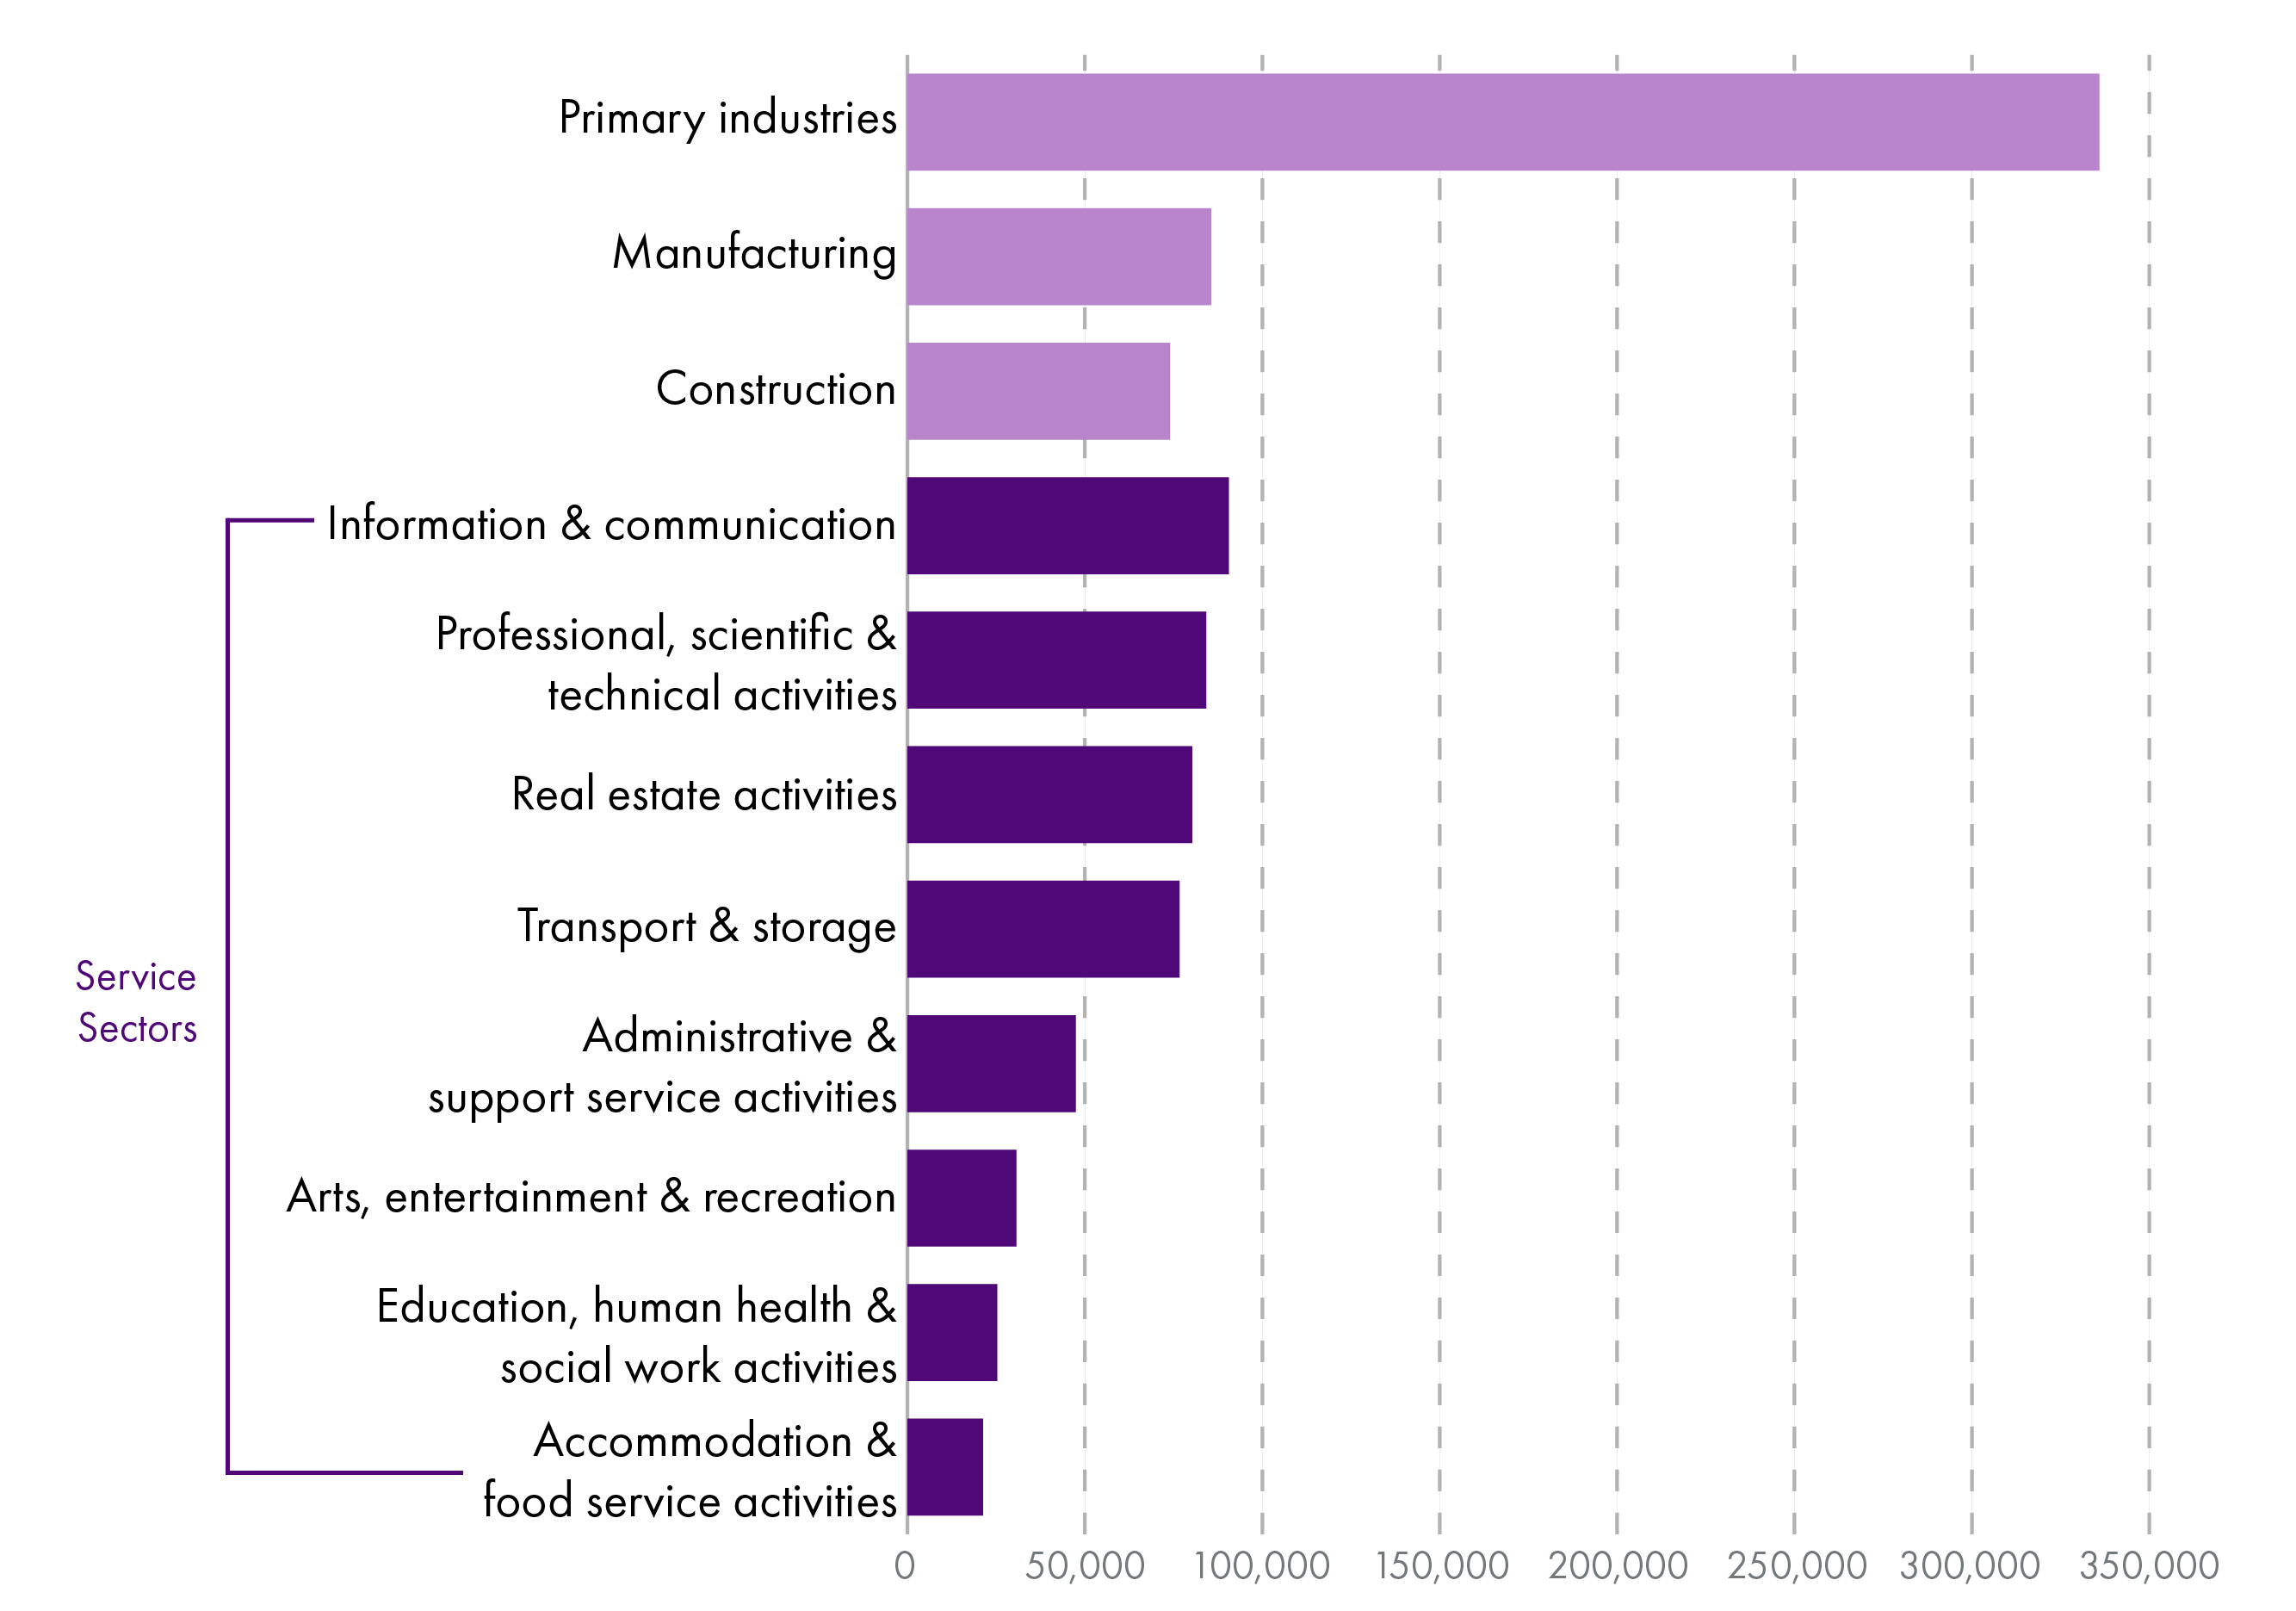
Note: Gross Value Added is a measure of economic output, similar to GDP.
Living standards
Living standards is a broad term used to describe people’s quality of life. Statistics on living standards help to show how economic activity is translated into economic wellbeing.
There is no single way to measure living standards, as different indicators capture different aspects of economic wellbeing. However, the most commonly used headline measure is disposable income per person. Whichever measure is used, perhaps the most informative aspect is how each measure changes over time.
Disposable income
Disposable income is the amount of money households have available for spending and saving after direct taxes such as income tax and National Insurance Contributions have been deducted. It represents the income people can use in their day‑to‑day lives.
Disposable income is widely used as a measure of living standards because it reflects people’s material resources more directly than broader economic indicators like GDP. Higher disposable income generally allows households to consume more goods and services and maintain a higher standard of living.
Having averaged 2.9% per year in the first decade of devolution, growth in disposable income per person is set to average 0.4% per year over Session 7.
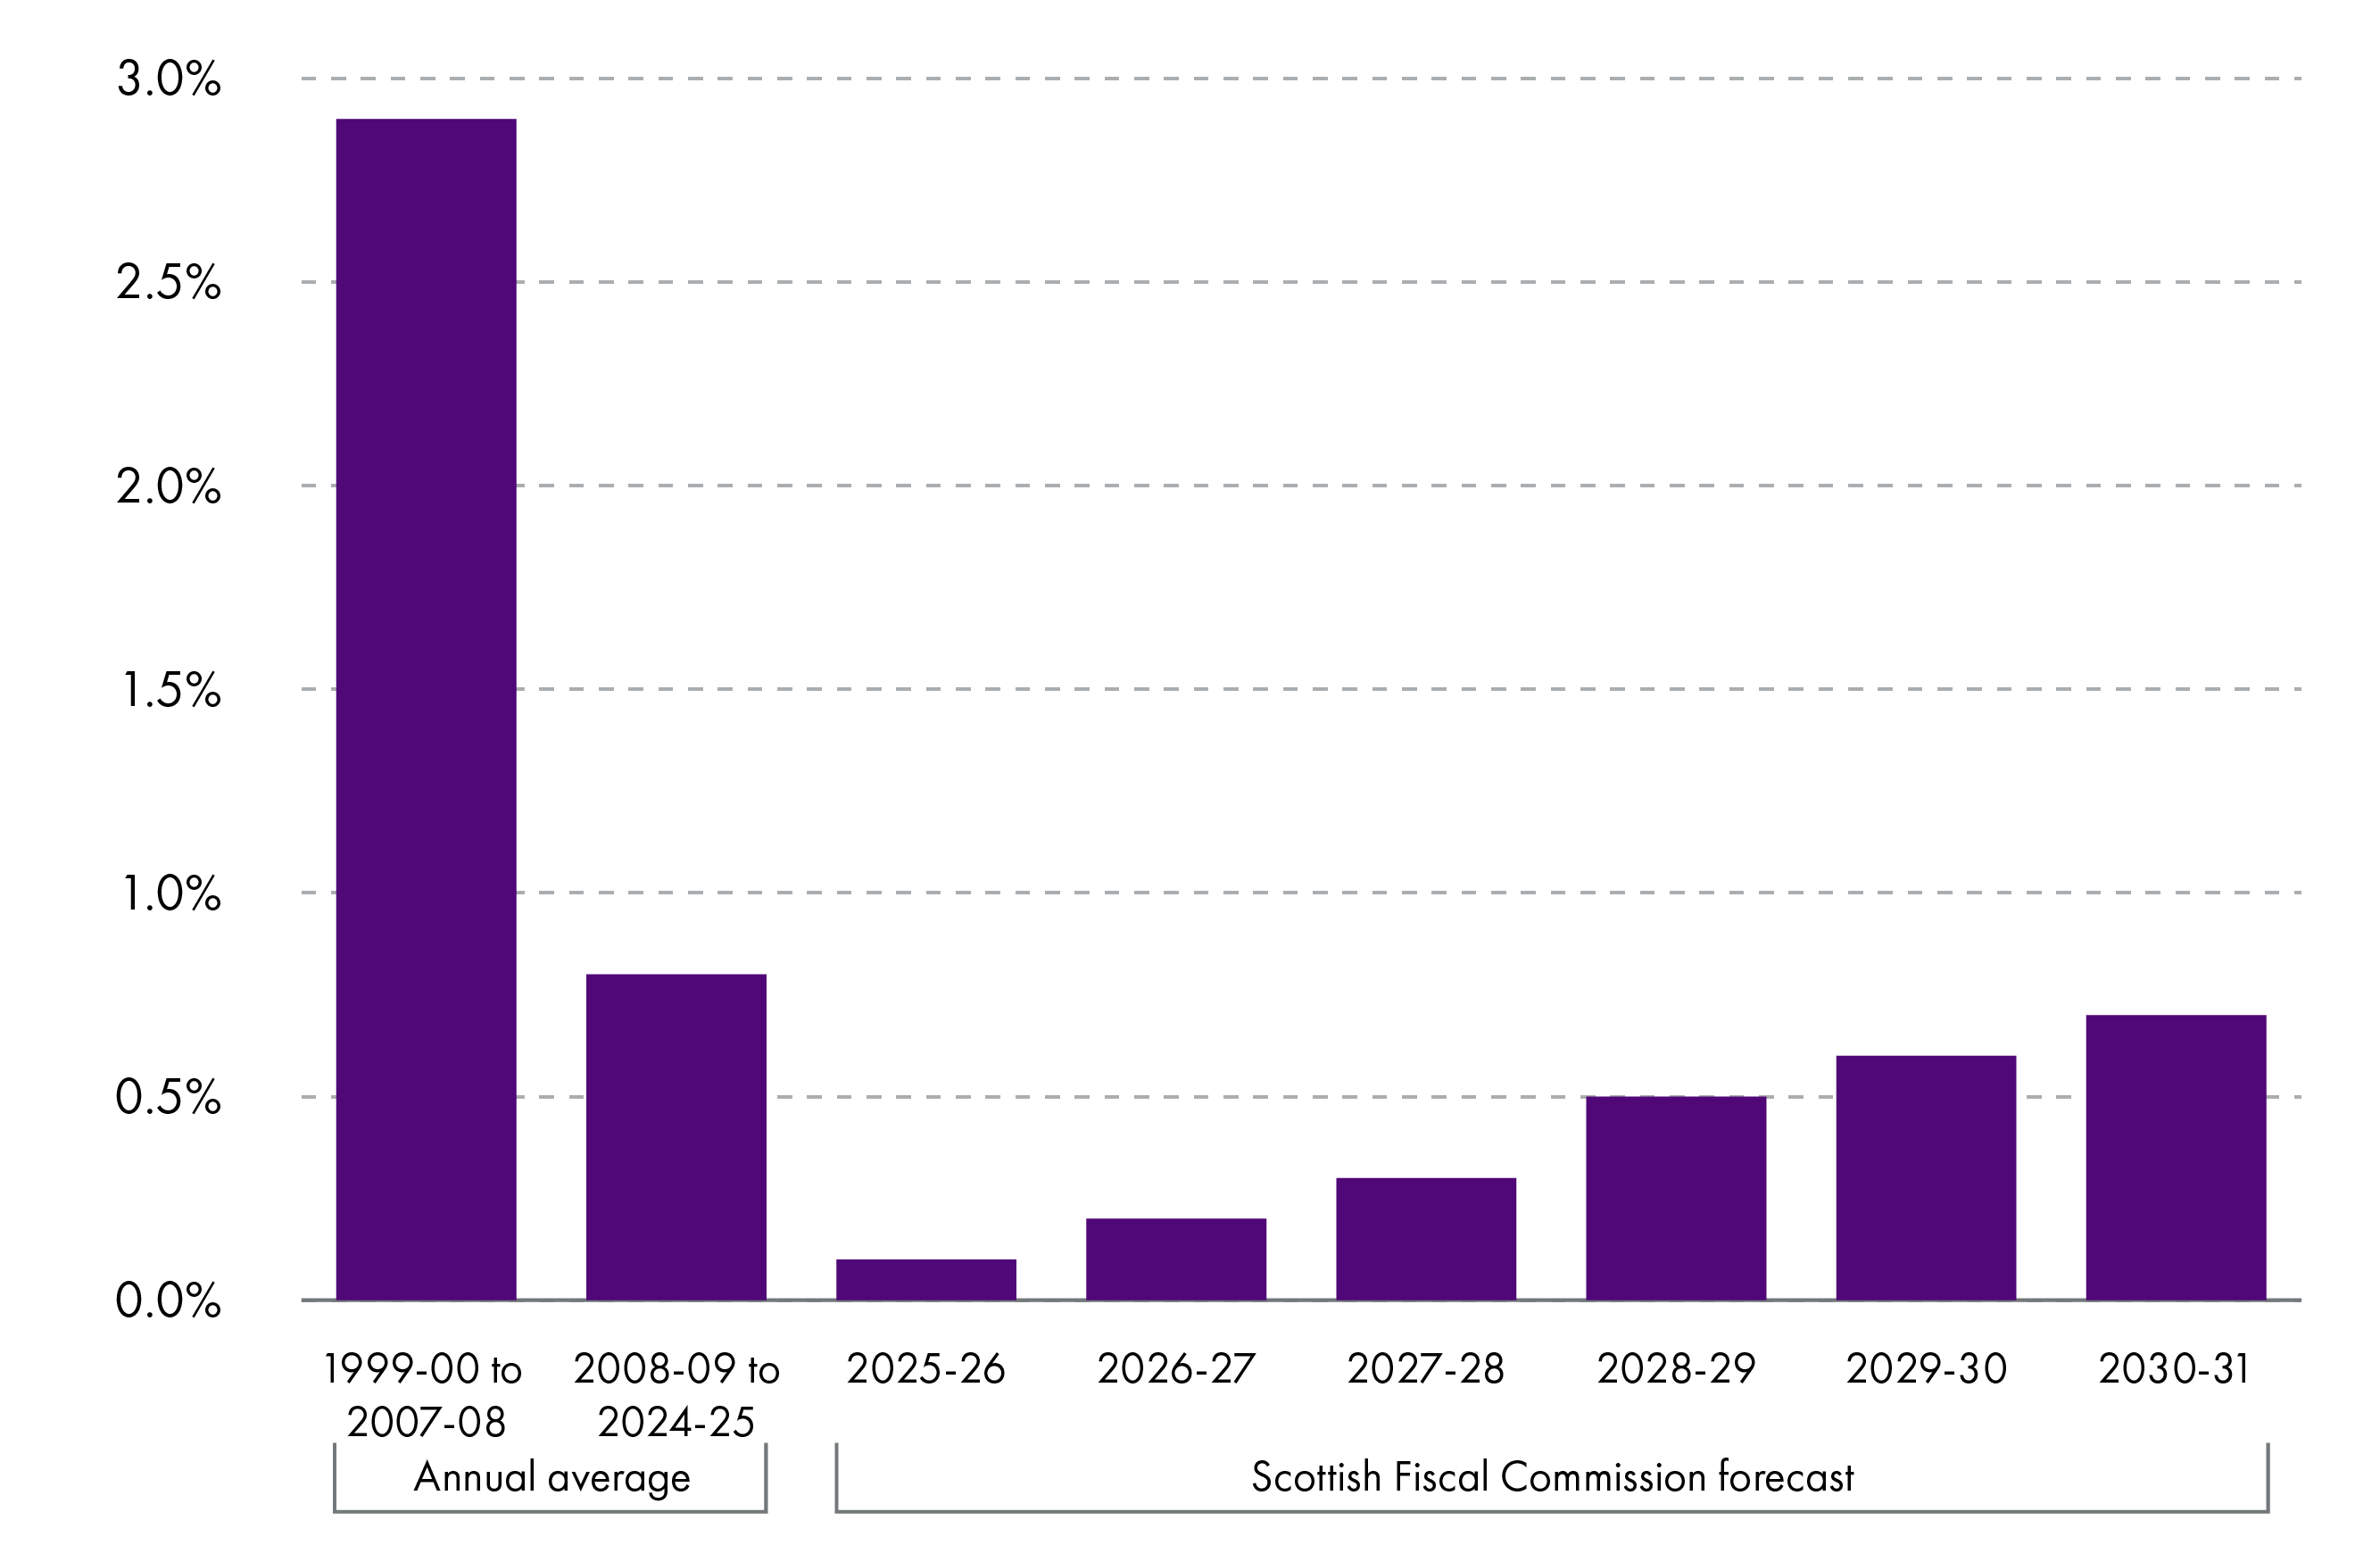
Source: Scottish Fiscal Commission
Figure 4 implies that in the early years of devolution, disposable income per person was growing by 10% roughly every three and a half years. But since 2008-09, 10% growth in disposable income per person has taken around twelve and a half years.
The consequences of this slow growth in living standards go beyond people’s personal finances. For example, there is evidence that higher disposable income per person leads to better health1 and education outcomes,2 although the interactions are complex and can work in both directions.
Employee earnings
Employee earnings primarily come from wages and salaries1 (by far the main source of income2 for the average household) but also include bonus payments. They do not include self-employment income, pensions and social security payments.
Tracking how employee earnings have changed over time is therefore a good indicator of how the average household’s primary income source – a key determinant of living standards – has changed. It won’t, however, be relevant for all households (for example, pensioner households, the self-employed or those where nobody is in employment).
As with other measures of living standards, growth in employee earnings has slowed since 2008.
Had employee wages continued to grow at their 1998-2008 rate, median employee earnings would be roughly £170 per week or £8,800 per year higher today.
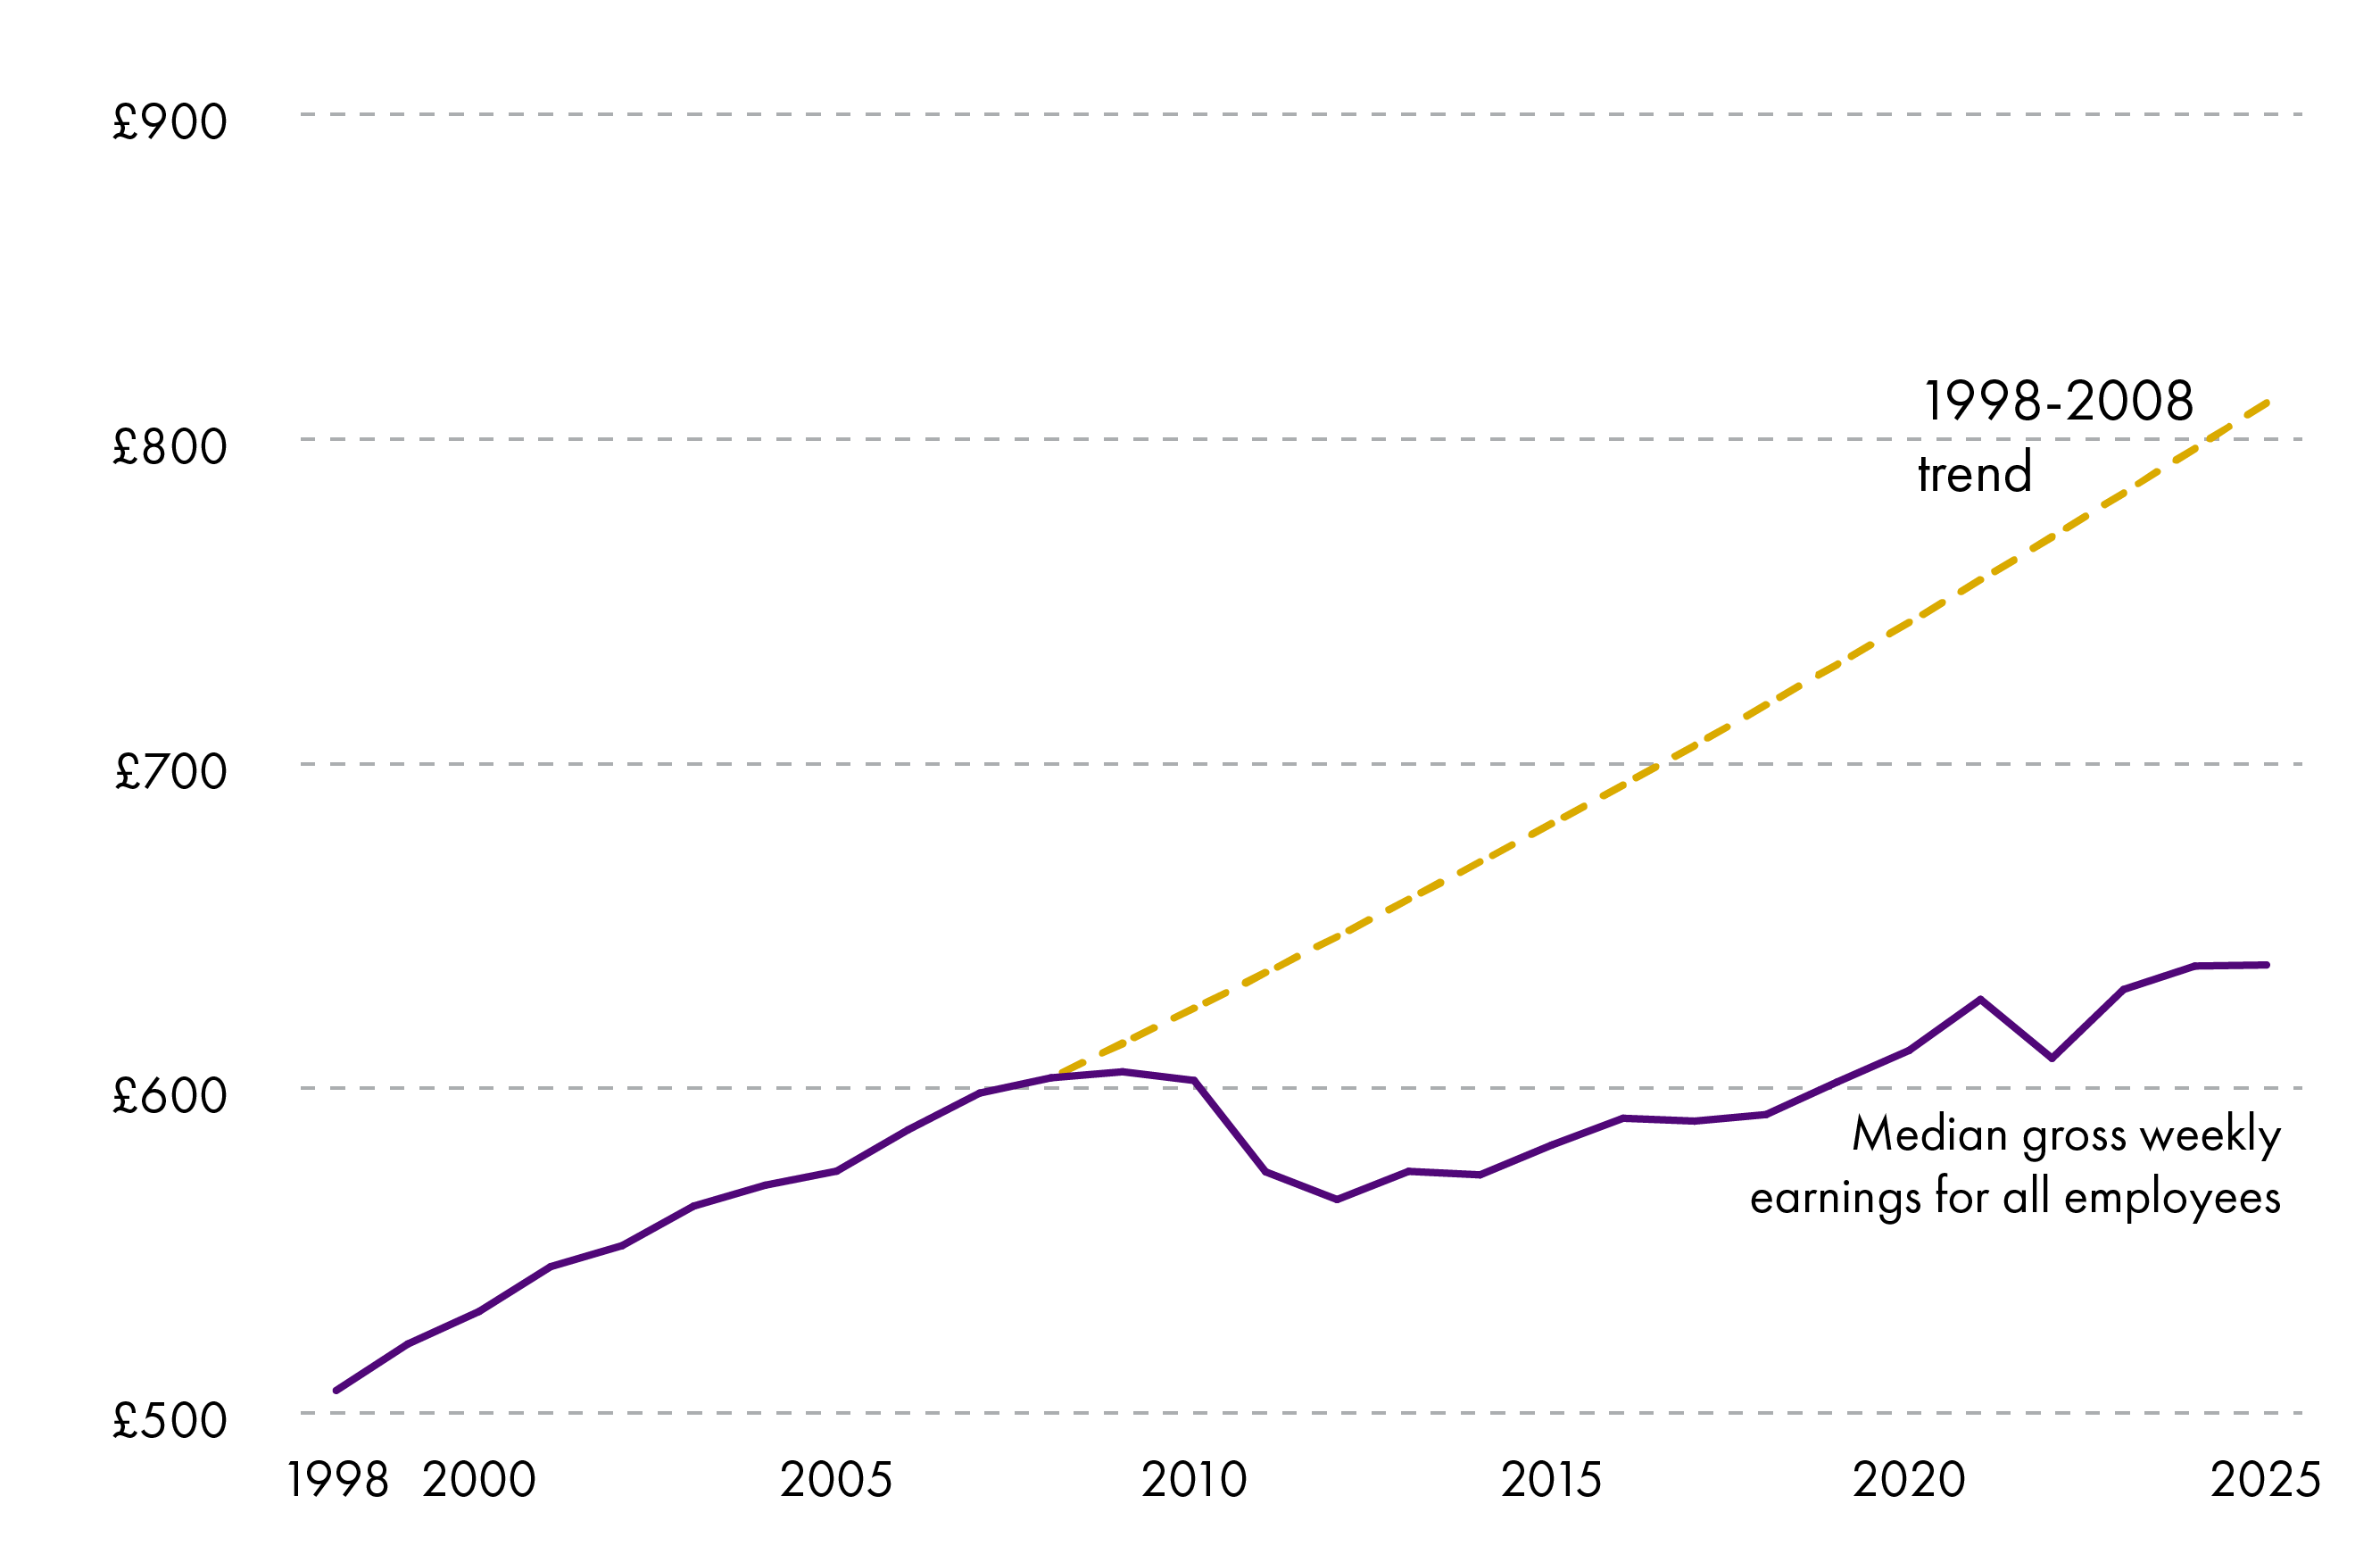
ONS: Annual Survey of Hours and Earnings, see SPICe dashboard for details
Note: Gross earnings are earnings before tax and social security payments are deducted. Figures have been converted into 2025 prices using CPI to allow for real terms comparison. Includes full-time and part-time employees.
Real terms median earnings for employees grew at an average annual rate of 1.8% between 1998 and 2008. Even ignoring a period of decline in the early 2010s, median employee earnings have grown at an average annual rate of 0.9% since 2014.
Sectors of Scotland's economy
It is useful to know how economic output in Scotland is divided up into different sectors. This can help policy makers target interventions depending on their objectives – perhaps to support sectors that are large employers, or to facilitate high-growth sectors.
The headline indicator of a sector’s share of the economy is Gross Value Added (GVA).
Gross Value Added (GVA)
GVA is a measure of economic output. It is the difference between the value of goods and services produced and the cost of raw materials and other inputs used in production. In other words, it estimates the value created by economic activity in a sector, region or business.
GVA is not the same as GDP. However, both measures are conceptually similar in that they attempt to measure the value created by economic activity. The difference between the two is that GVA excludes the effects of taxes and subsidies.
This is why GVA is used as the headline metric when comparing economic output across different sectors.
Goods and services in some sectors may be subject to VAT, for example, increasing their final sale price. Activities in other sectors may be subsidised to boost their output.
These differences reflect policy choices rather than underlying value of economic activity.
If GDP were used to compare sectors, one industry could appear larger simply because it is more heavily taxed, while another could appear more productive because it is subsidised. By excluding these effects, GVA allows for a more accurate, like‑for‑like comparison of the ‘undistorted’ economic value created across different sectors.
Service sectors account for 78% of Scotland's economic output, with manufacturing seeing a notable decline in share over the last three decades.
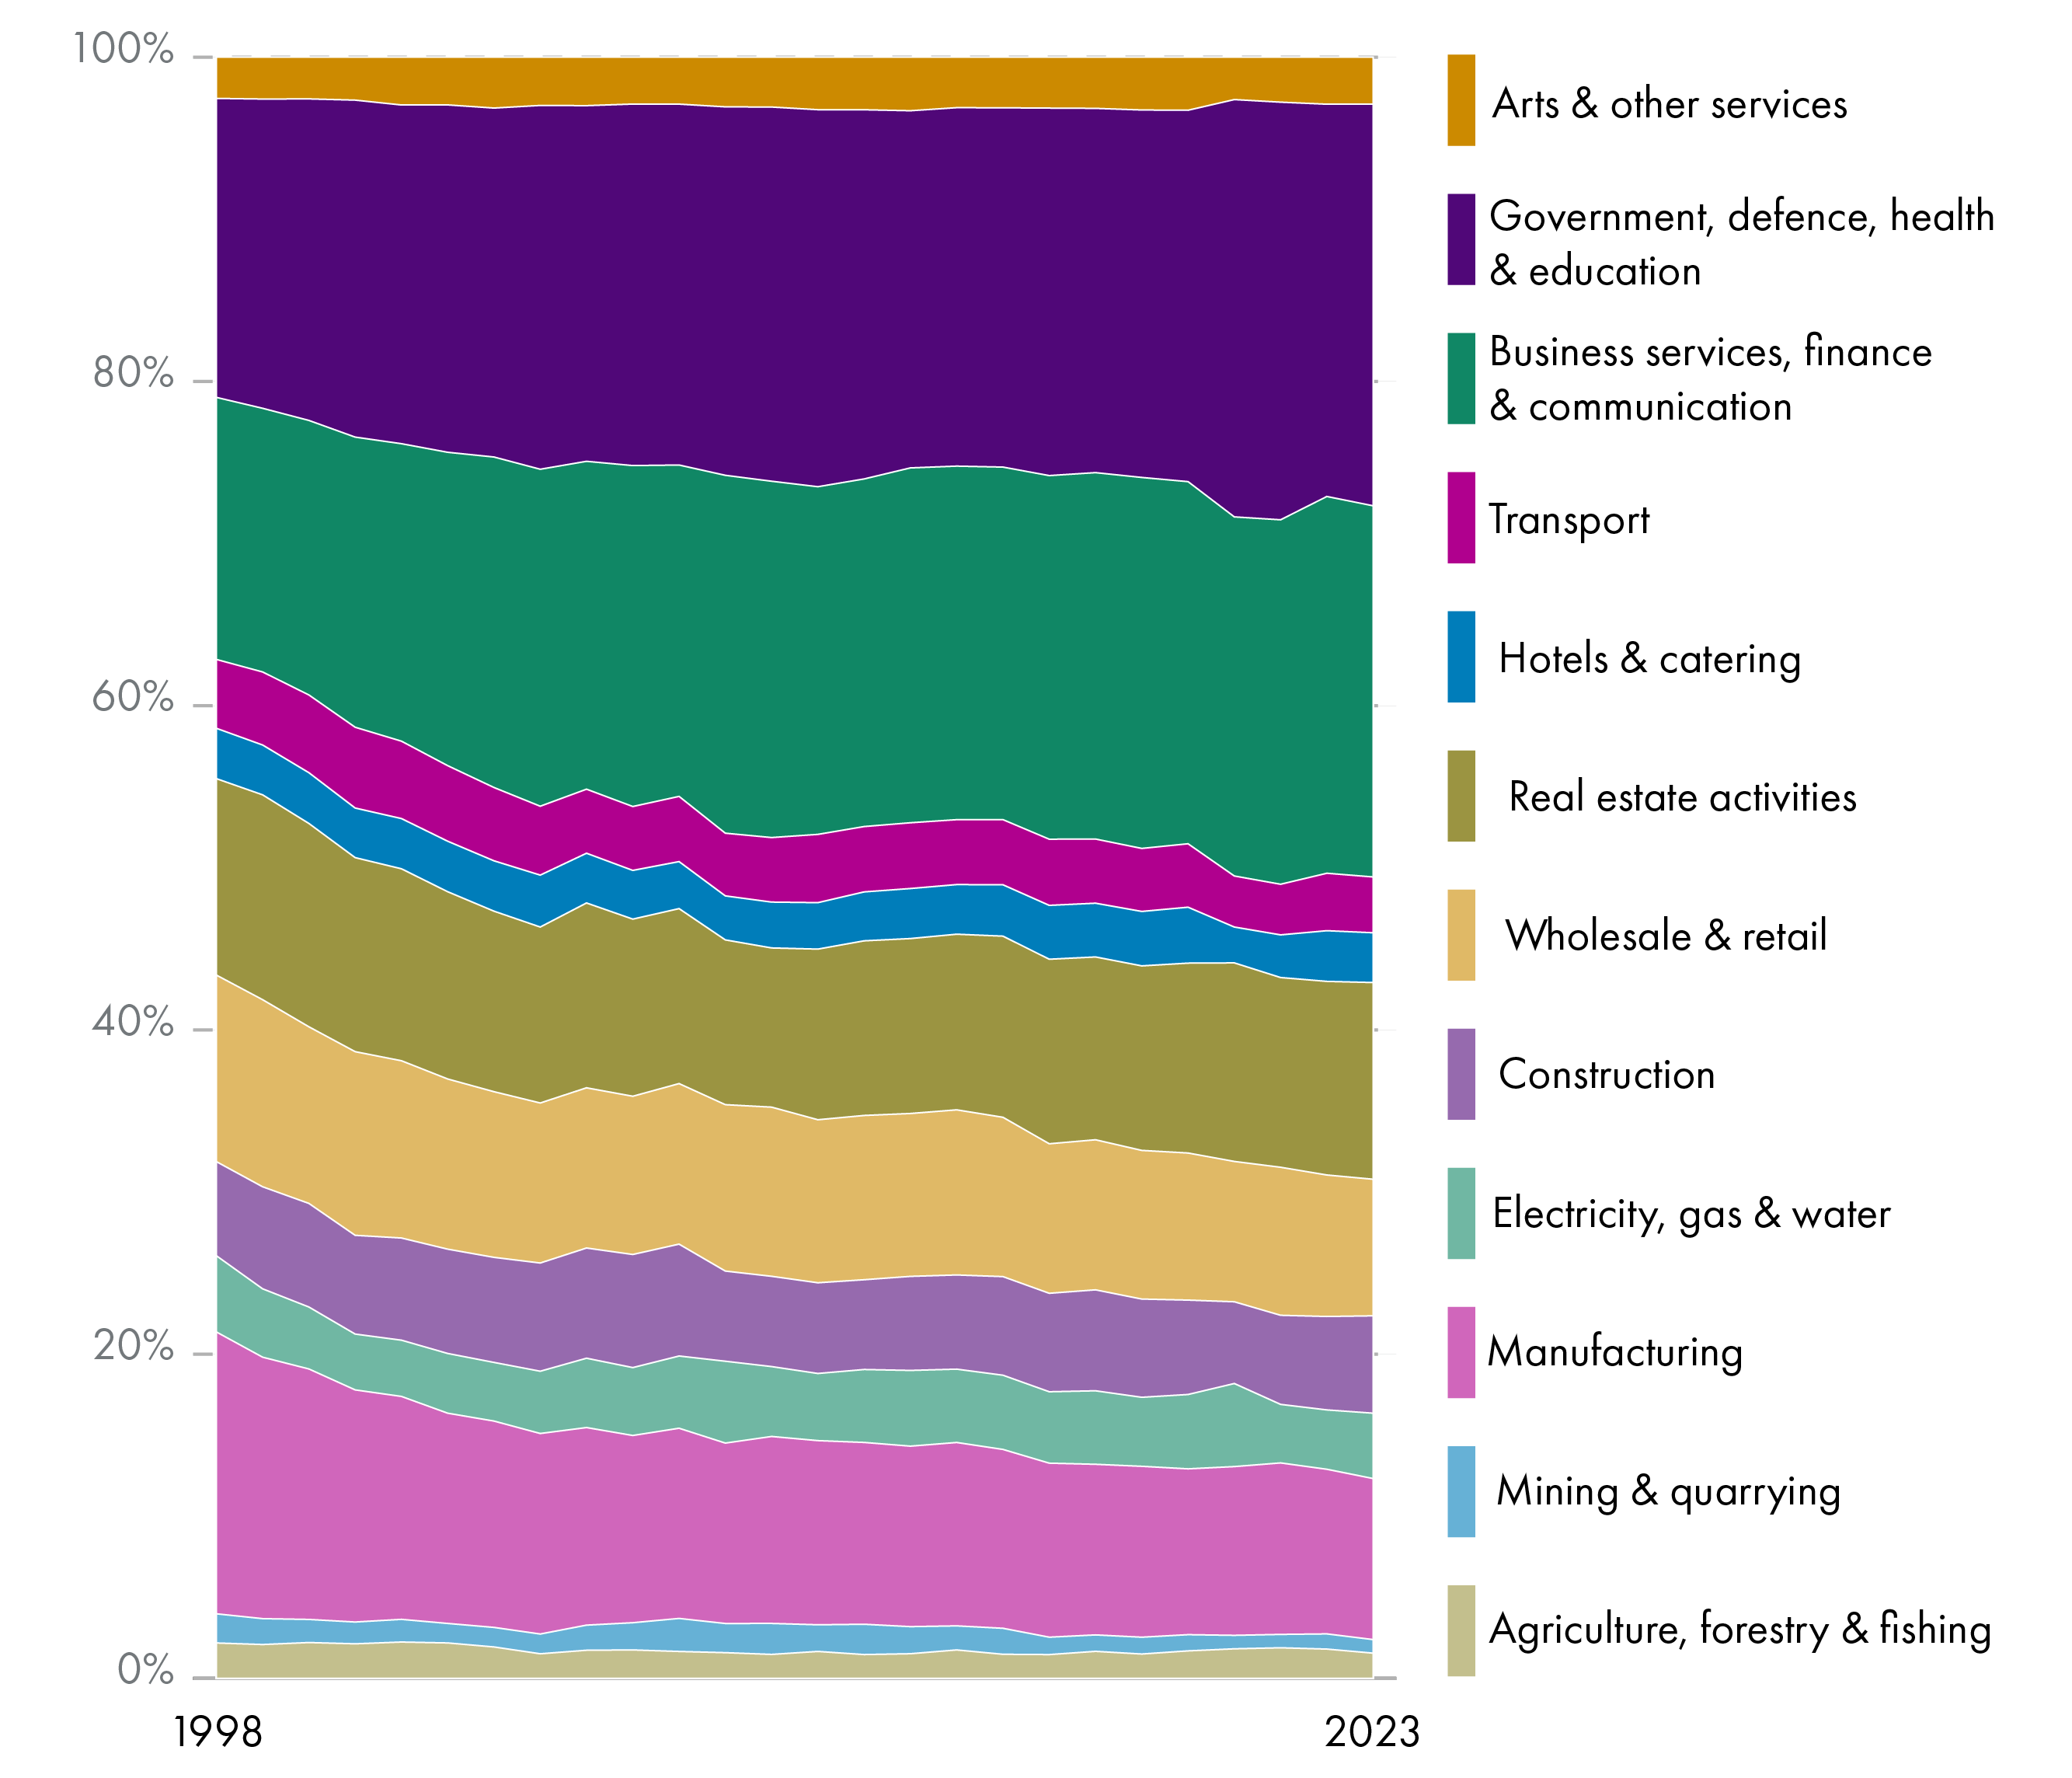
Note: Sector groupings are based on ONS SIC categories. SPICe has aggregated some broad groupings as shown in the chart. More detail can be found by clicking on the source, downloading the data and navigating to Table 1C. Figures exclude extra-regio activity.
Figure 6 shows that the vast majority of Scotland’s GVA is accounted for by service sectors. This share has been growing over time.
To explore this in more detail, Table 2 disaggregates sector groupings and shows the percentage point change in share of GVA between 1998 and 2023.
| Sector | Change in share of Scotland’s GVA 1998-2023 (percentage point) |
|---|---|
| Human health and social work activities | +4.4 |
| Financial and insurance activities | +3.0 |
| Professional, scientific and technical activities | +2.4 |
| Administrative and support service activities | +1.3 |
| Public administration and defence | +1.1 |
| Education | +0.9 |
| Arts, entertainment and recreation | +0.4 |
| Construction | +0.2 |
| Information and communication | +0.1 |
| Other service activities | +0.03 |
| Real estate activities | +0.01 |
| Activities of households | -0.02 |
| Accommodation and food service activities | -0.03 |
| Electricity, gas, steam and air conditioning supply | -0.3 |
| Water supply; sewerage and waste management | -0.4 |
| Agriculture, forestry and fishing | -0.6 |
| Transportation and storage | -0.8 |
| Mining and quarrying | -1.0 |
| Wholesale and retail trade; repair of motor vehicles | -3.1 |
| Manufacturing | -7.5 |
Source: Regional GVA by industry, ONS
Note: Sectors are disaggregated according to sectors in ONS SIC categories.
Manufacturing has seen a 7.5 p.p. decline in share of GVA (from 17.4% to 9.9%). Service sectors oriented around health and social care, finance, business services and science have seen the largest increases.
So where does this leave Scotland’s economy? Drilling down into more detailed sectoral divisions, Table 3 shows the top 20 sectors by GVA.
| Sector | GVA, 2023, £ million |
|---|---|
| Owner-occupiers' imputed rental | 16,948 |
| Human health activities | 14,028 |
| Retail trade | 8,570 |
| Financial service activities | 8,487 |
| Specialised construction activities | 5,967 |
| Real estate activities, excluding imputed rental | 5,311 |
| Wholesale trade | 4,766 |
| Insurance and pension funding | 4,300 |
| Social work activities | 4,170 |
| Manufacture of beverages and tobacco products | 4,130 |
| Food and beverage service activities | 3,757 |
| Architectural and engineering activities | 3,324 |
| Legal and accounting activities | 3,217 |
| Construction of buildings | 3,109 |
| Computer programming and consultancy | 2,992 |
| Scientific research and development | 2,880 |
| Activities auxiliary to finance and insurance | 2,733 |
| Land transport | 2,613 |
| Residential care activities | 2,460 |
| Telecommunications | 2,446 |
Source: Regional GVA by industry, ONS
Note: Sectors are disaggregated according to 2-digit divisions in ONS SIC categories.
Imputed rent in real estate activities
In terms of GVA, real estate activities is one of the largest sectors in Scotland’s economy. The largest component of this is owner-occupiers’ imputed rent. This is effectively an estimate of what owner-occupiers would pay themselves if they were renting their residence.
GVA attempts to measure the value added from goods and services in the economy – not the extent of cash transactions. Housing is treated as a service that people consume and derive value from. For renters, the economic value of ‘consuming’ housing is captured in their rental payments to landlords. For owner‑occupiers, no transaction takes place, so statisticians estimate what the home could be rented for on the open market and record this as a notional (or ‘imputed’) rent.
This helps ensure that GVA reflects all housing services being consumed, not just those that involve a visible payment.
Including imputed rent also avoids misleading comparisons across different territories or over time. For example, if one area has more renters and another has more homeowners, the first might appear to have a larger housing sector simply because more rent is actually paid. Similarly, if people switch from renting to owning, measured economic activity would fall even though nothing real has changed about the housing they consume.
Employment in different sectors
Another way of measuring each sector’s size is by employment levels.
| Sector | Employment level | Employment share |
|---|---|---|
| Agriculture, forestry and fishing | 81,000 | 3.1% |
| Mining and quarrying | 26,000 | 1.0% |
| Manufacturing | 182,000 | 6.9% |
| Electricity, gas, steam and air conditioning supply | 21,000 | 0.8% |
| Water supply; sewerage and waste management | 19,000 | 0.7% |
| Construction | 157,000 | 5.9% |
| Wholesale and retail trade; repair of motor vehicles | 329,000 | 12.5% |
| Transportation and storage | 108,000 | 4.1% |
| Accommodation and food service activities | 214,000 | 8.1% |
| Information and communication | 71,000 | 2.7% |
| Financial and insurance activities | 89,000 | 3.4% |
| Real estate activities | 42,000 | 1.6% |
| Professional, scientific and technical activities | 189,000 | 7.2% |
| Administrative and support service activities | 168,000 | 6.4% |
| Public administration and defence | 171,000 | 6.5% |
| Education | 218,000 | 8.3% |
| Human health and social work activities | 427,000 | 16.2% |
| Arts, entertainment and recreation | 78,000 | 3.0% |
| Other service activities | 50,000 | 1.9% |
| Activities of households | 0 | 0.0% |
Source: Business Register and Employment Survey, ONS, accessed through Nomis
A sector’s share of employment generally matches its share of GVA, with some exceptions.
Some sectors stand out as accounting for a greater share of employment than output. These are sectors related to retail, hospitality and health and social care. These sectors are service based and comparatively labour-intensive. In other words, relatively large numbers of people are needed to deliver them.
Conversely, real estate activities (see box), manufacturing and financial and insurance activities account for a considerably higher share of output than employment.
Businesses by sector
In terms of the number of businesses in each sector, construction and professional, scientific and technical activities are the largest.
| Sector | Number of businesses |
|---|---|
| Construction | 53,495 |
| Professional, scientific and technical activities | 47,185 |
| Other service activities | 35,030 |
| Human health and social work activities | 28,070 |
| Administrative and support service activities | 26,795 |
| Retail trade incl. fuel sales | 25,825 |
| Arts, entertainment and recreation | 23,350 |
| Education | 22,370 |
| Agriculture, Forestry and Fishing | 20,530 |
| Manufacturing | 20,335 |
| Accommodation and food service activities | 18,860 |
| Transportation and storage | 17,240 |
| Information and communication | 15,655 |
| Real estate activities | 9,640 |
| Wholesale trade | 7,415 |
| Motor trade incl. vehicle repairs | 5,460 |
| Mining and quarrying, utilities | 3,605 |
| Financial and insurance activities | 3,415 |
Source: Businesses in Scotland 2025, Scottish Government
Note: Self-employed people operating as sole traders would be classified as a business in these statistics.
Size of the public sector
There are different ways of measuring how large the public sector is as a share of Scotland’s economy.
One way is to measure economic output. This method adds up the GVA of sectors that are mostly delivered by the public sector and expresses this as a percentage of total GVA. One caveat to this method is that it assumes that all output classified under the ‘education’ sector, for example, is delivered by the public sector, when in fact there is a small amount of education provision by the private sector. The same is true of other sectors, such as healthcare.
Another way is to add up the number of people employed in the public sector as a share of total employment.
It should be noted that the public sector in Scotland includes services delivered by the UK and Scottish Governments, as well as local authorities.
| Region | Share of GVA | Share of employment |
|---|---|---|
| Scotland | 24.8% | 22.6% |
| UK | 19.5% | 18.0% |
Sources: Regional Gross Value Added, ONS
Public Sector Employment in Scotland Statistics, Scottish Government
Scotland’s public sector is relatively larger than the UK average. Furthermore, its share of the economy is expanding, in terms of both output and employment. Evidence1 tells us this is a long-term trend, likely driven by demographic change placing higher demand on sectors that are currently delivered by the public sector – healthcare in particular.
This long-term structural change in Scotland’s economy sped up during the Covid-19 pandemic. The public sector’s share of GVA and employment remains above pre-pandemic levels.
It should be noted that there is no agreed ‘ideal’ size of the public sector. Scottish Government analysis says that the size of Scotland’s public sector is “mid‑range relative to other small advanced economies”.1
However, the fact that Scotland’s public sector is, on average, larger and better paid than the UK has important implications for the Scottish Government’s fiscal policy. Scottish Government analysis points out that:
Part of the funding the Scottish Government receives is based on the size of additional spending for UK public sector pay deals. However, with relatively more public sector workers in Scotland, as well as higher average pay, matching a UK pay deal in Scotland will typically cost more than the funding received.
Source: Public sector: economic overview, Scottish Government
Scotland's regions
National statistics can sometimes obscure regional variations in economic outcomes. The different regions of Scotland have different economic profiles depending on factors such as their sectoral makeup, demography, geography, infrastructure and economic history.
The Central Belt accounts for a large share of economic activity. Edinburgh has a strong concentration of financial and professional services and the public sector, while Glasgow has a comparatively greater concentration of manufacturing, creative and health industries.
There are also distinct sectoral clusters beyond the Central Belt. The North East economy has been shaped by oil and gas and related engineering and energy services. This has supported relatively high output, but also exposes the region to volatility and the long-term challenges of the energy transition.
More rural areas, such as the Highlands and Islands, have smaller populations that are amongst the most dispersed in Europe. Their economies are often centred on tourism, agriculture, aquaculture and renewable energy. These regions face constraints including distance from markets and infrastructure challenges but benefit from natural assets that underpin key industries.
Demographic patterns also vary, with rural populations forecast to decline in contrast to urban centres.1
Regional disparities
The result of these regional variations is disparity in headline economic indicators.
GVA per capita is unequally distributed across Scotland's regions, with the City of Edinburgh's being over three times higher than East Lothian and Midlothian.
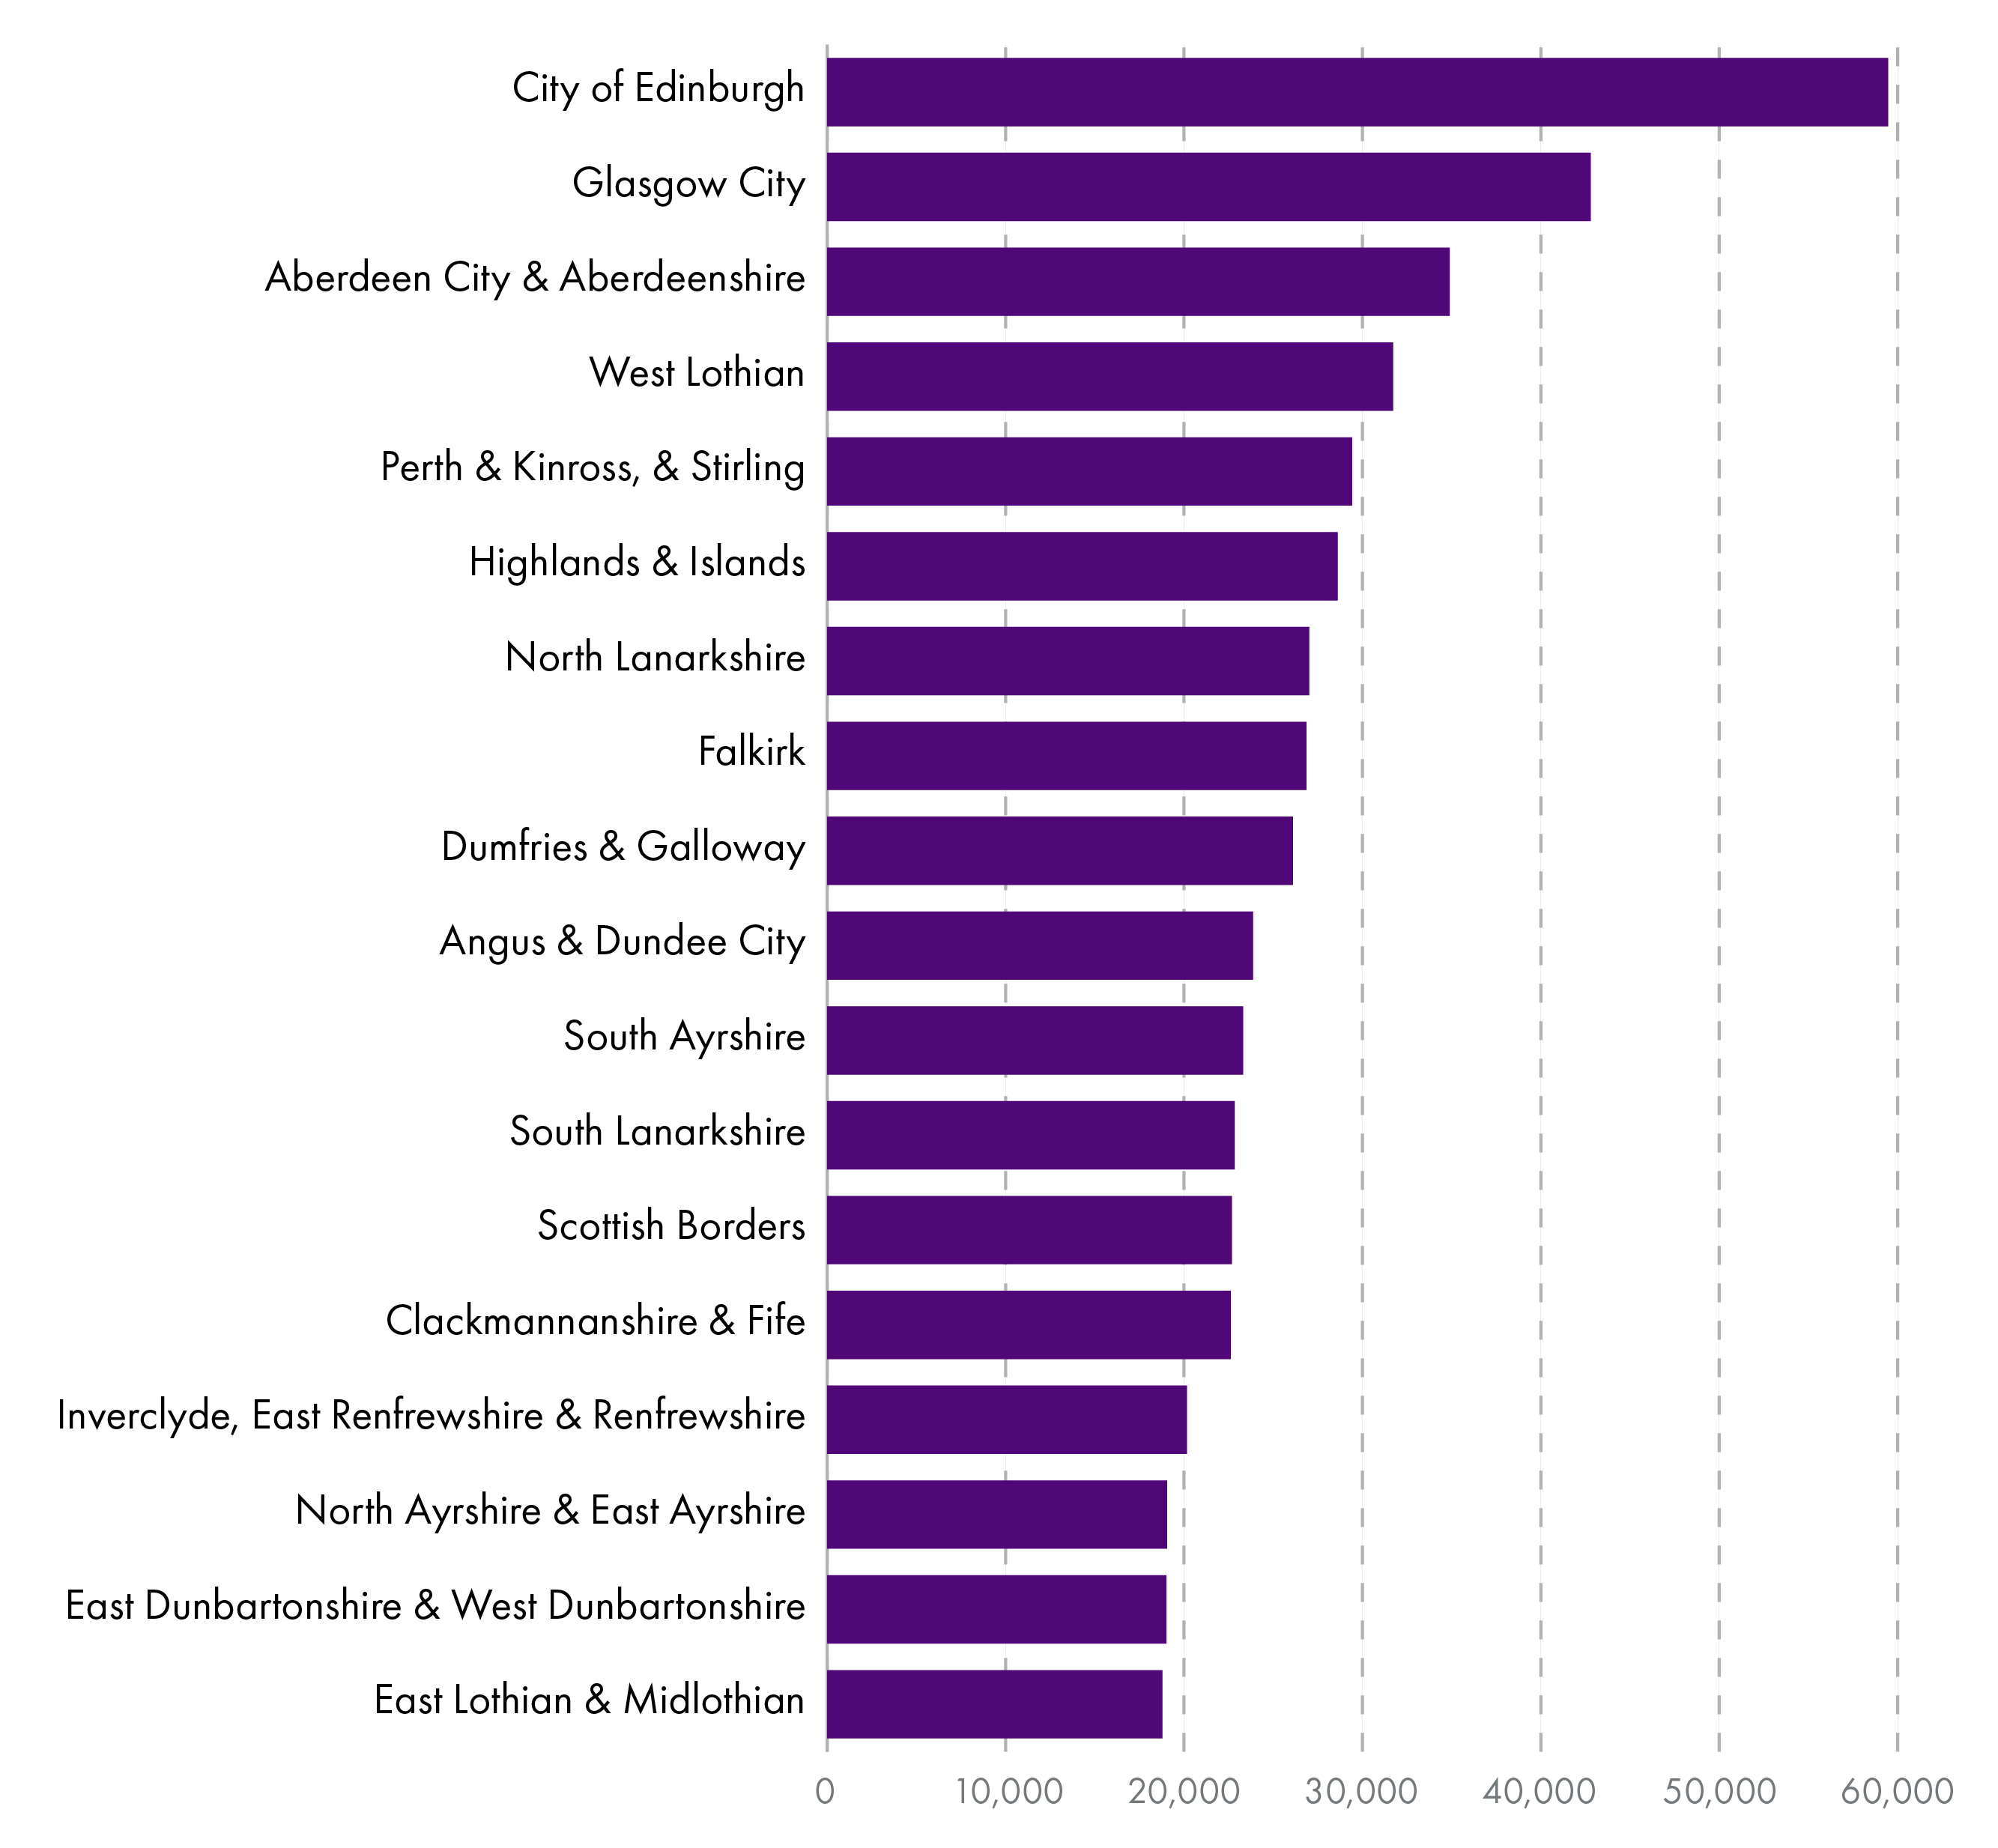
Note 1: 2022 figures have been used, as official GVA per capita estimates have been withheld for some smaller regions due to uncertainty. The ONS says this is due to "differences in the timing of census updates... some population estimates are not yet available". 2022 is therefore the most recent reliable data.
Note 2: Figures are based on place of work, not place of residence.
Data suggests that regional disparity in GVA per capita is higher in Scotland than in most EU countries.1
It is worth noting that headline statistics, such as regional GVA per capita, might not always give the best representation of economic conditions in different areas. To explore this, take East Lothian, where GVA per capita is particularly low (see Figure 7). On median employee earnings (primarily wages), it ranks 27th out of 32 local authority areas.2
This implies that economic activity in East Lothian is comparatively subdued and that jobs located there are, on average, relatively low paid. Meanwhile, neighbouring City of Edinburgh has the highest GVA per capita in Scotland and the second highest employee earnings.
However, the employee earnings figures are based on place of work. When based on place of residence, East Lothian jumps from 27th to 10th.
It seems that many East Lothian residents work in higher paying jobs in Edinburgh. Therefore, the conclusions about East Lothian’s economic conditions and living standards are perhaps more nuanced than headline statistics sometimes suggest.
This leads to an interesting factor for policy makers to consider when designing regional economic strategies.
Some regional disparity might be a good thing. It may not be possible or desirable to replicate the most affluent part of Scotland’s economy across each of Scotland’s regions. Instead, it may be preferable for each region to specialise, provided residents of poorer regions are able to access and benefit from economic opportunities in nearby areas.
Businesses in Scotland
As of March 2025, there were an estimated 384,280 private sector businesses in Scotland. 175,035 (45.5%) of these were registered for PAYE and/or VAT.
After oscillating around 350,000 for a decade, this figure has increased to its highest level on record. On a per person basis, this remains around a fifth lower than the UK average.
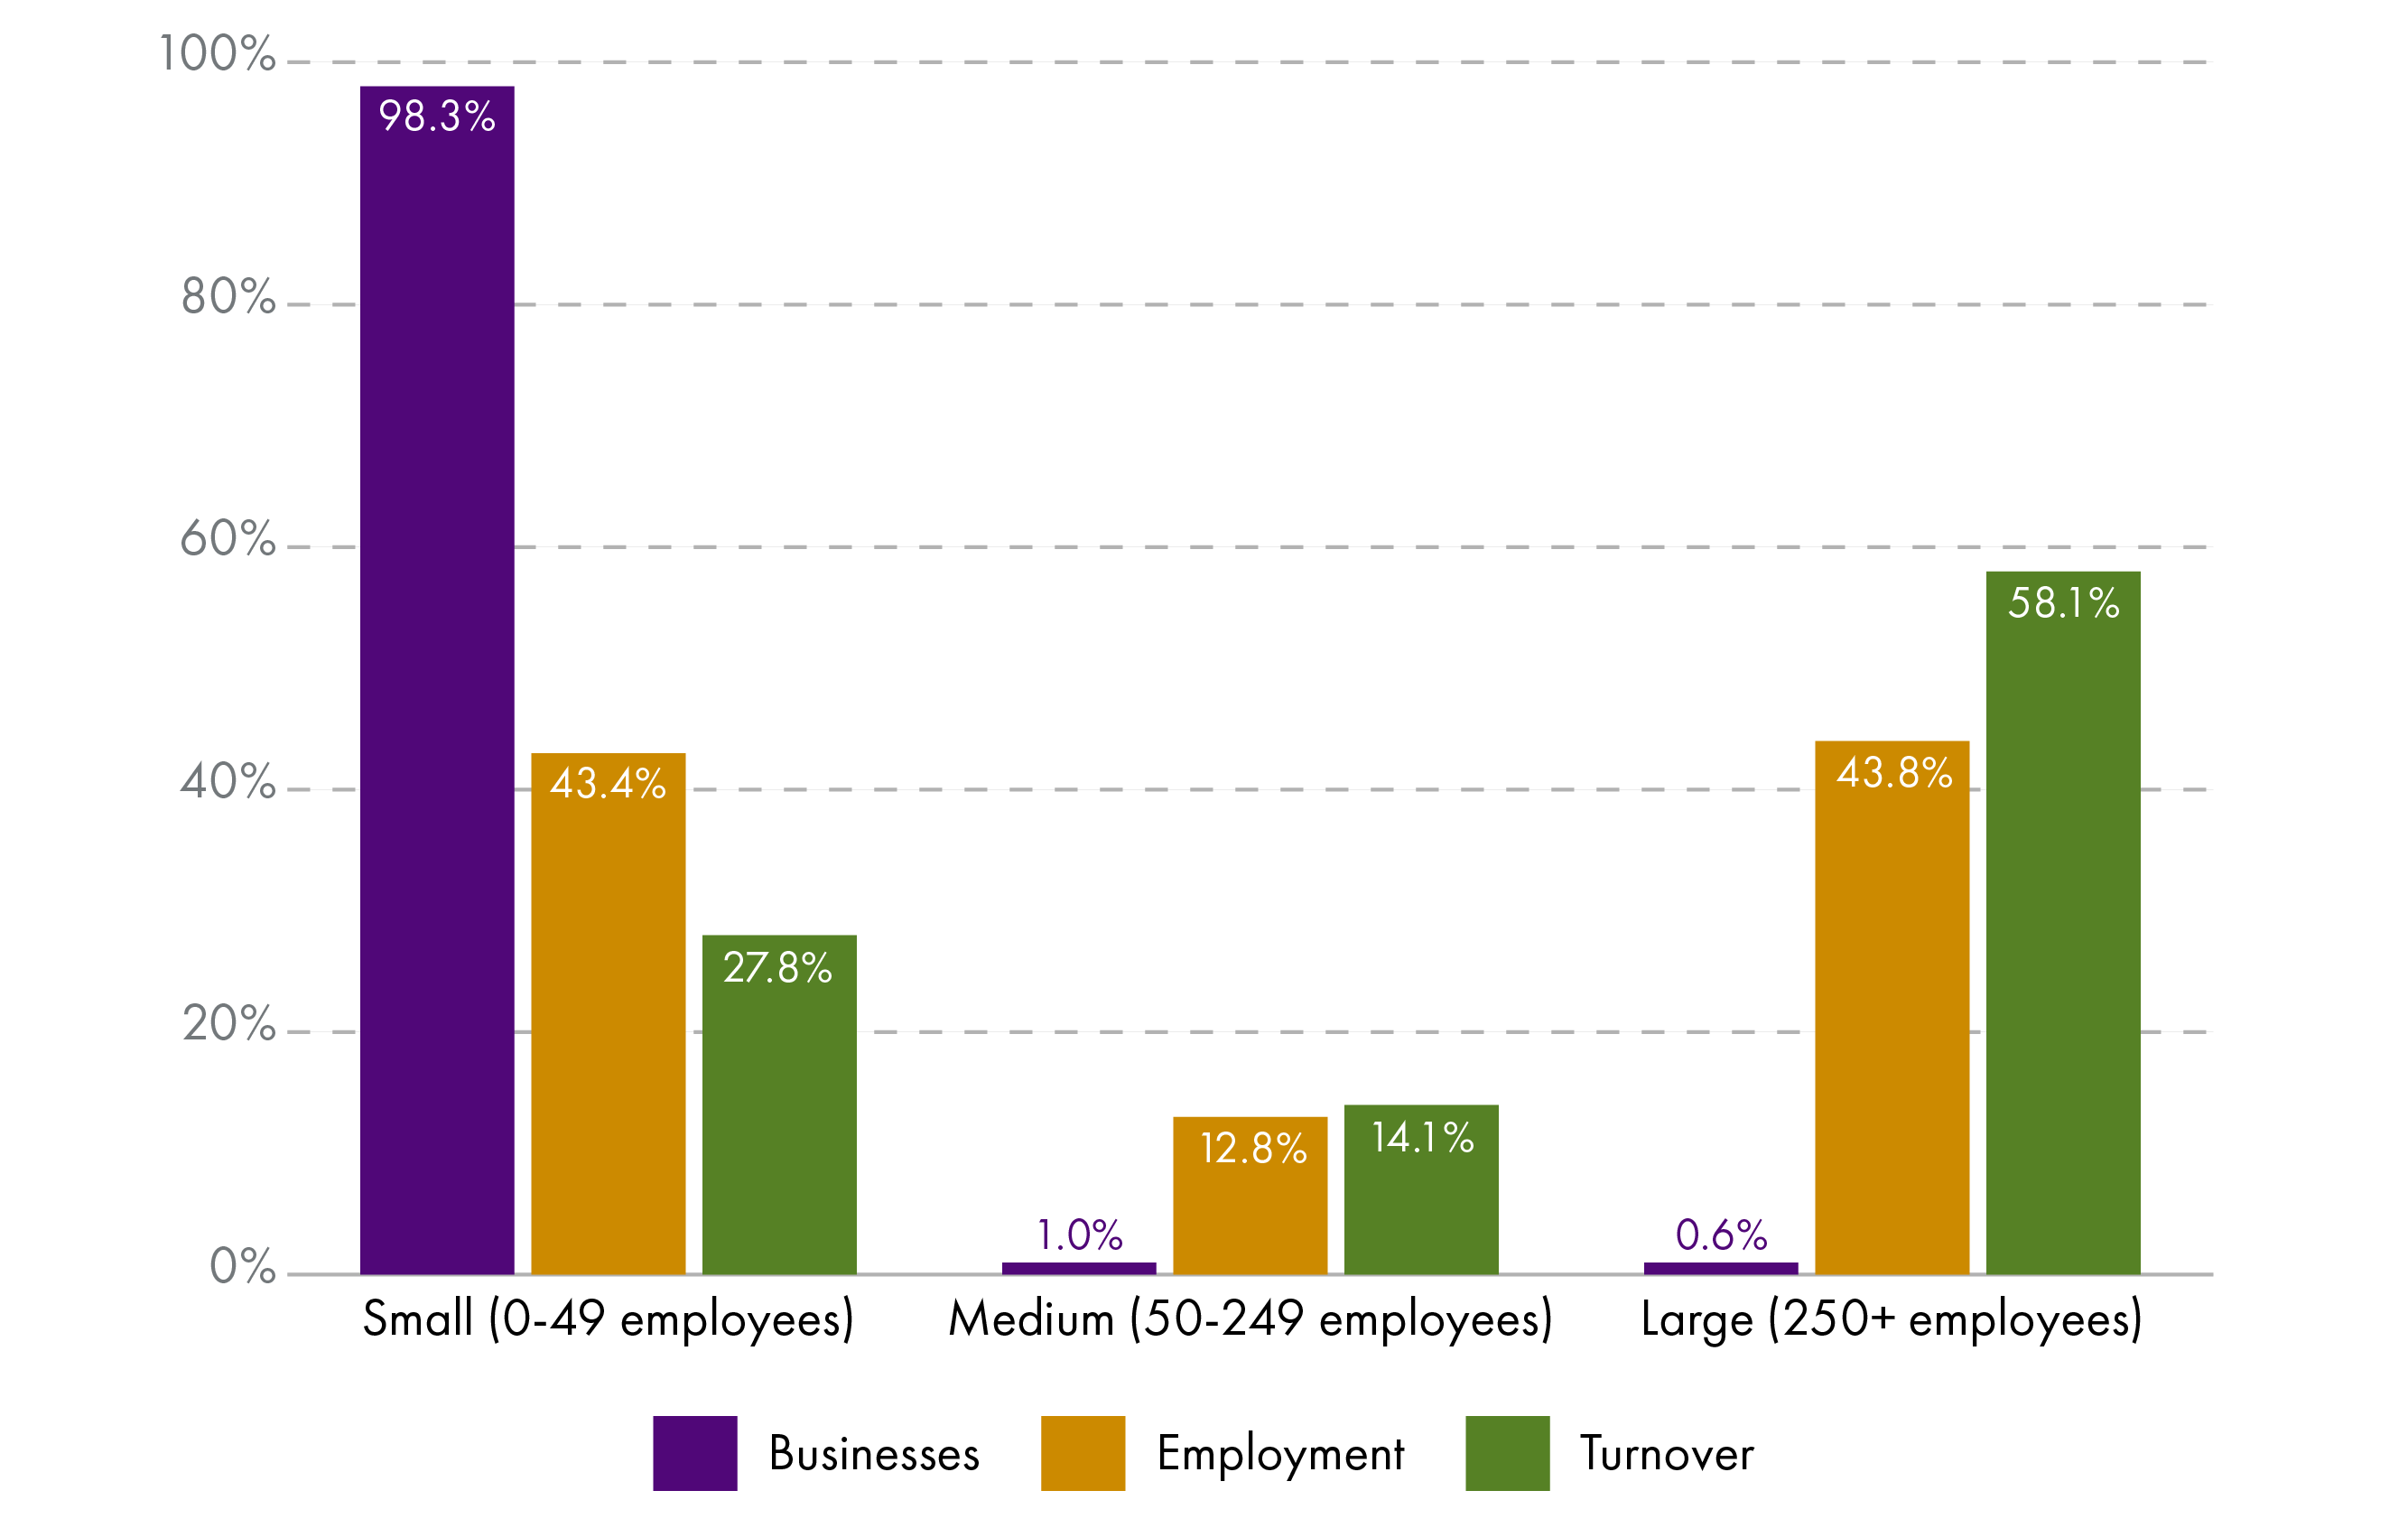
Almost all businesses in Scotland (98.3%) were small (0-49 employees). 1.0% were medium-sized (50-249 employees) and 0.6% were large businesses (250+ employees).
However, large businesses account for an outsized share of employment and turnover. The 2,425 large businesses in Scotland provided 43.8% of private sector employment and 58.1% of turnover.
It should be noted that ‘small businesses’ includes self-employed people operating as sole traders with no employees. 73% of businesses with 0-49 employees have zero employees.
Almost all of Scotland’s businesses are small but large businesses account for the majority of turnover and 43.8% of private sector employment.
A sectoral breakdown of businesses in Scotland is presented in Businesses by sector.
Information on the number of high growth businesses in Scotland is presented in High growth businesses.
Business ownership
Of the 175,035 businesses registered for PAYE and/or VAT in Scotland, 3,665 were owned abroad. These accounted for just over 400,000 jobs in Scotland. 2,570 were owned in other parts of the UK, accounting for just below 290,000 jobs in Scotland.
Information and communication, and manufacturing stand out as sectors with a high concentration of ownership in other parts of the UK or abroad.
A separate data source1 provides some information about the number of ‘inclusive and democratic business models’ (IDBMs) in Scotland. These are businesses that are owned and controlled by employees, members, or local communities.
It is reported that there are around 6,000 social enterprises in Scotland, at least 350 community-owned enterprises, around 600 co-operatives, and nearly 300 employee-owned businesses.
The Session 6 Scottish Government had a target to triple the number of IDBMs by 2034, which may be continued into Session 7.
Labour market
This section presents some statistics on outcomes in Scotland’s labour market. Statistics on employee earnings (primarily wages) are presented in Employee earnings.
Employment, unemployment and inactivity
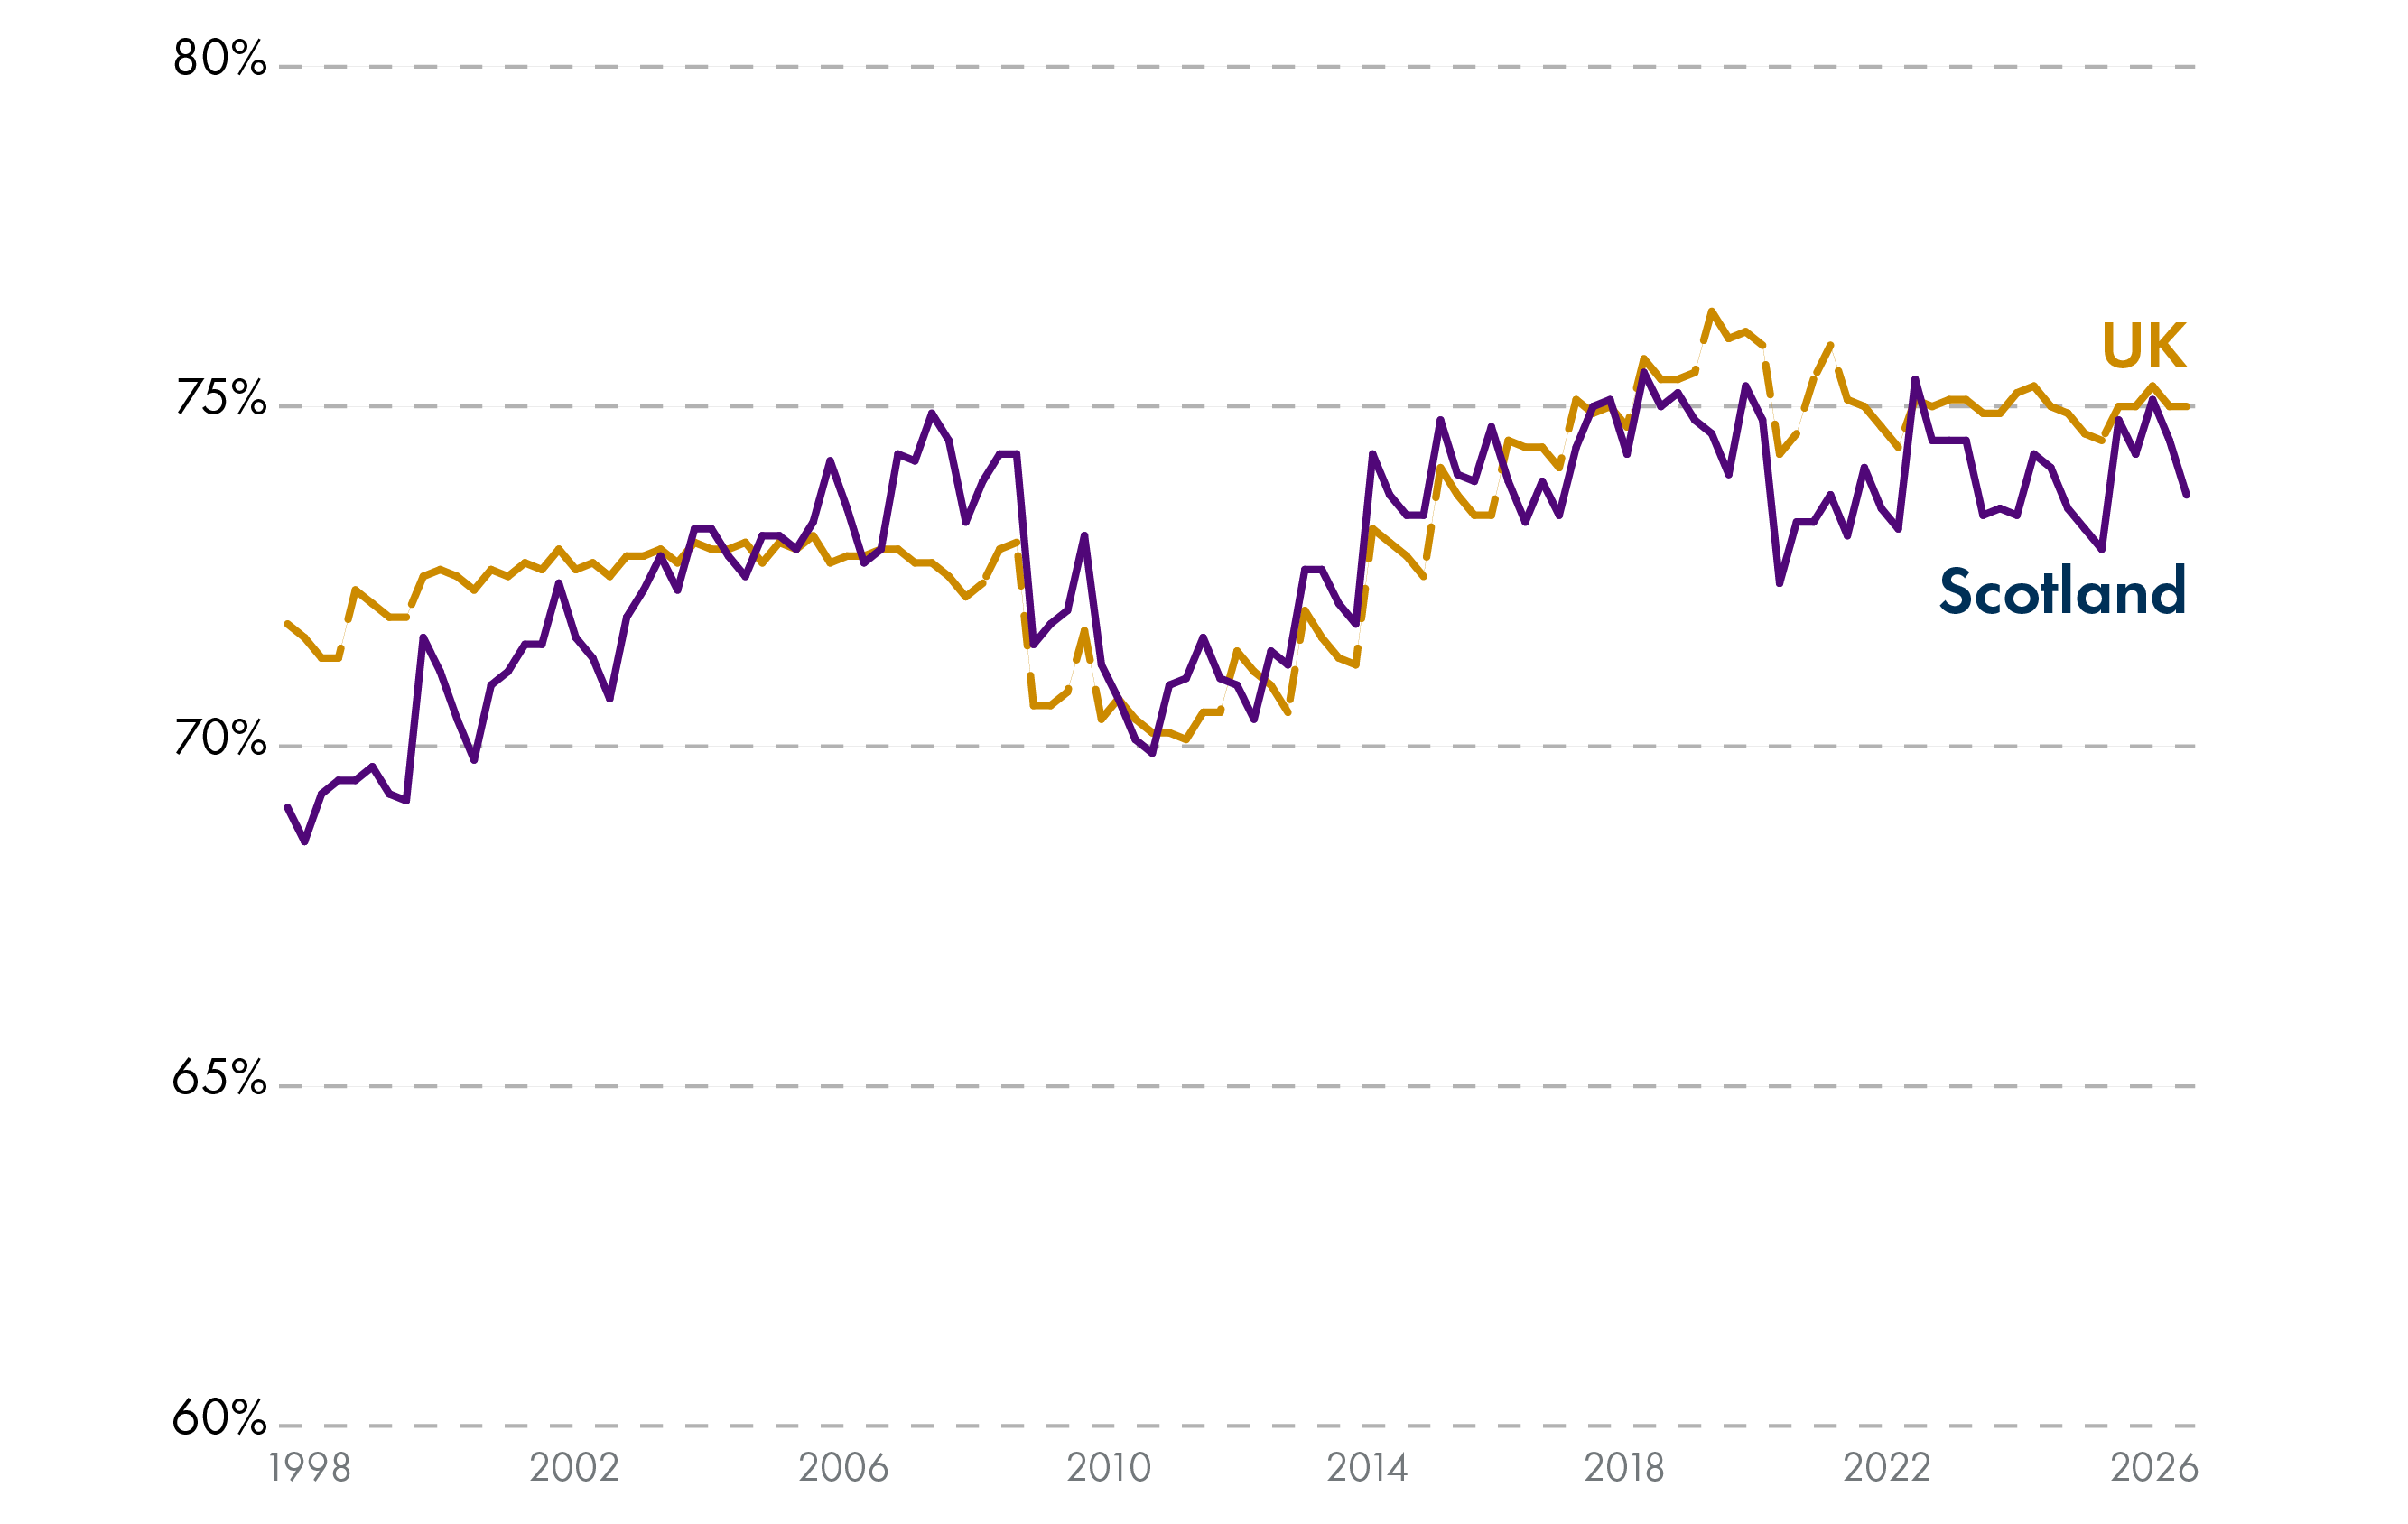
The employment rate is the share of people aged 16-64 who are in employment. The most recent (Jan-Mar 2026) employment rate in Scotland was 73.7%.
Scotland’s employment rate has been high by historic standards since 2015, but lags the UK average.
Source: ONS, see SPICe dashboard for details
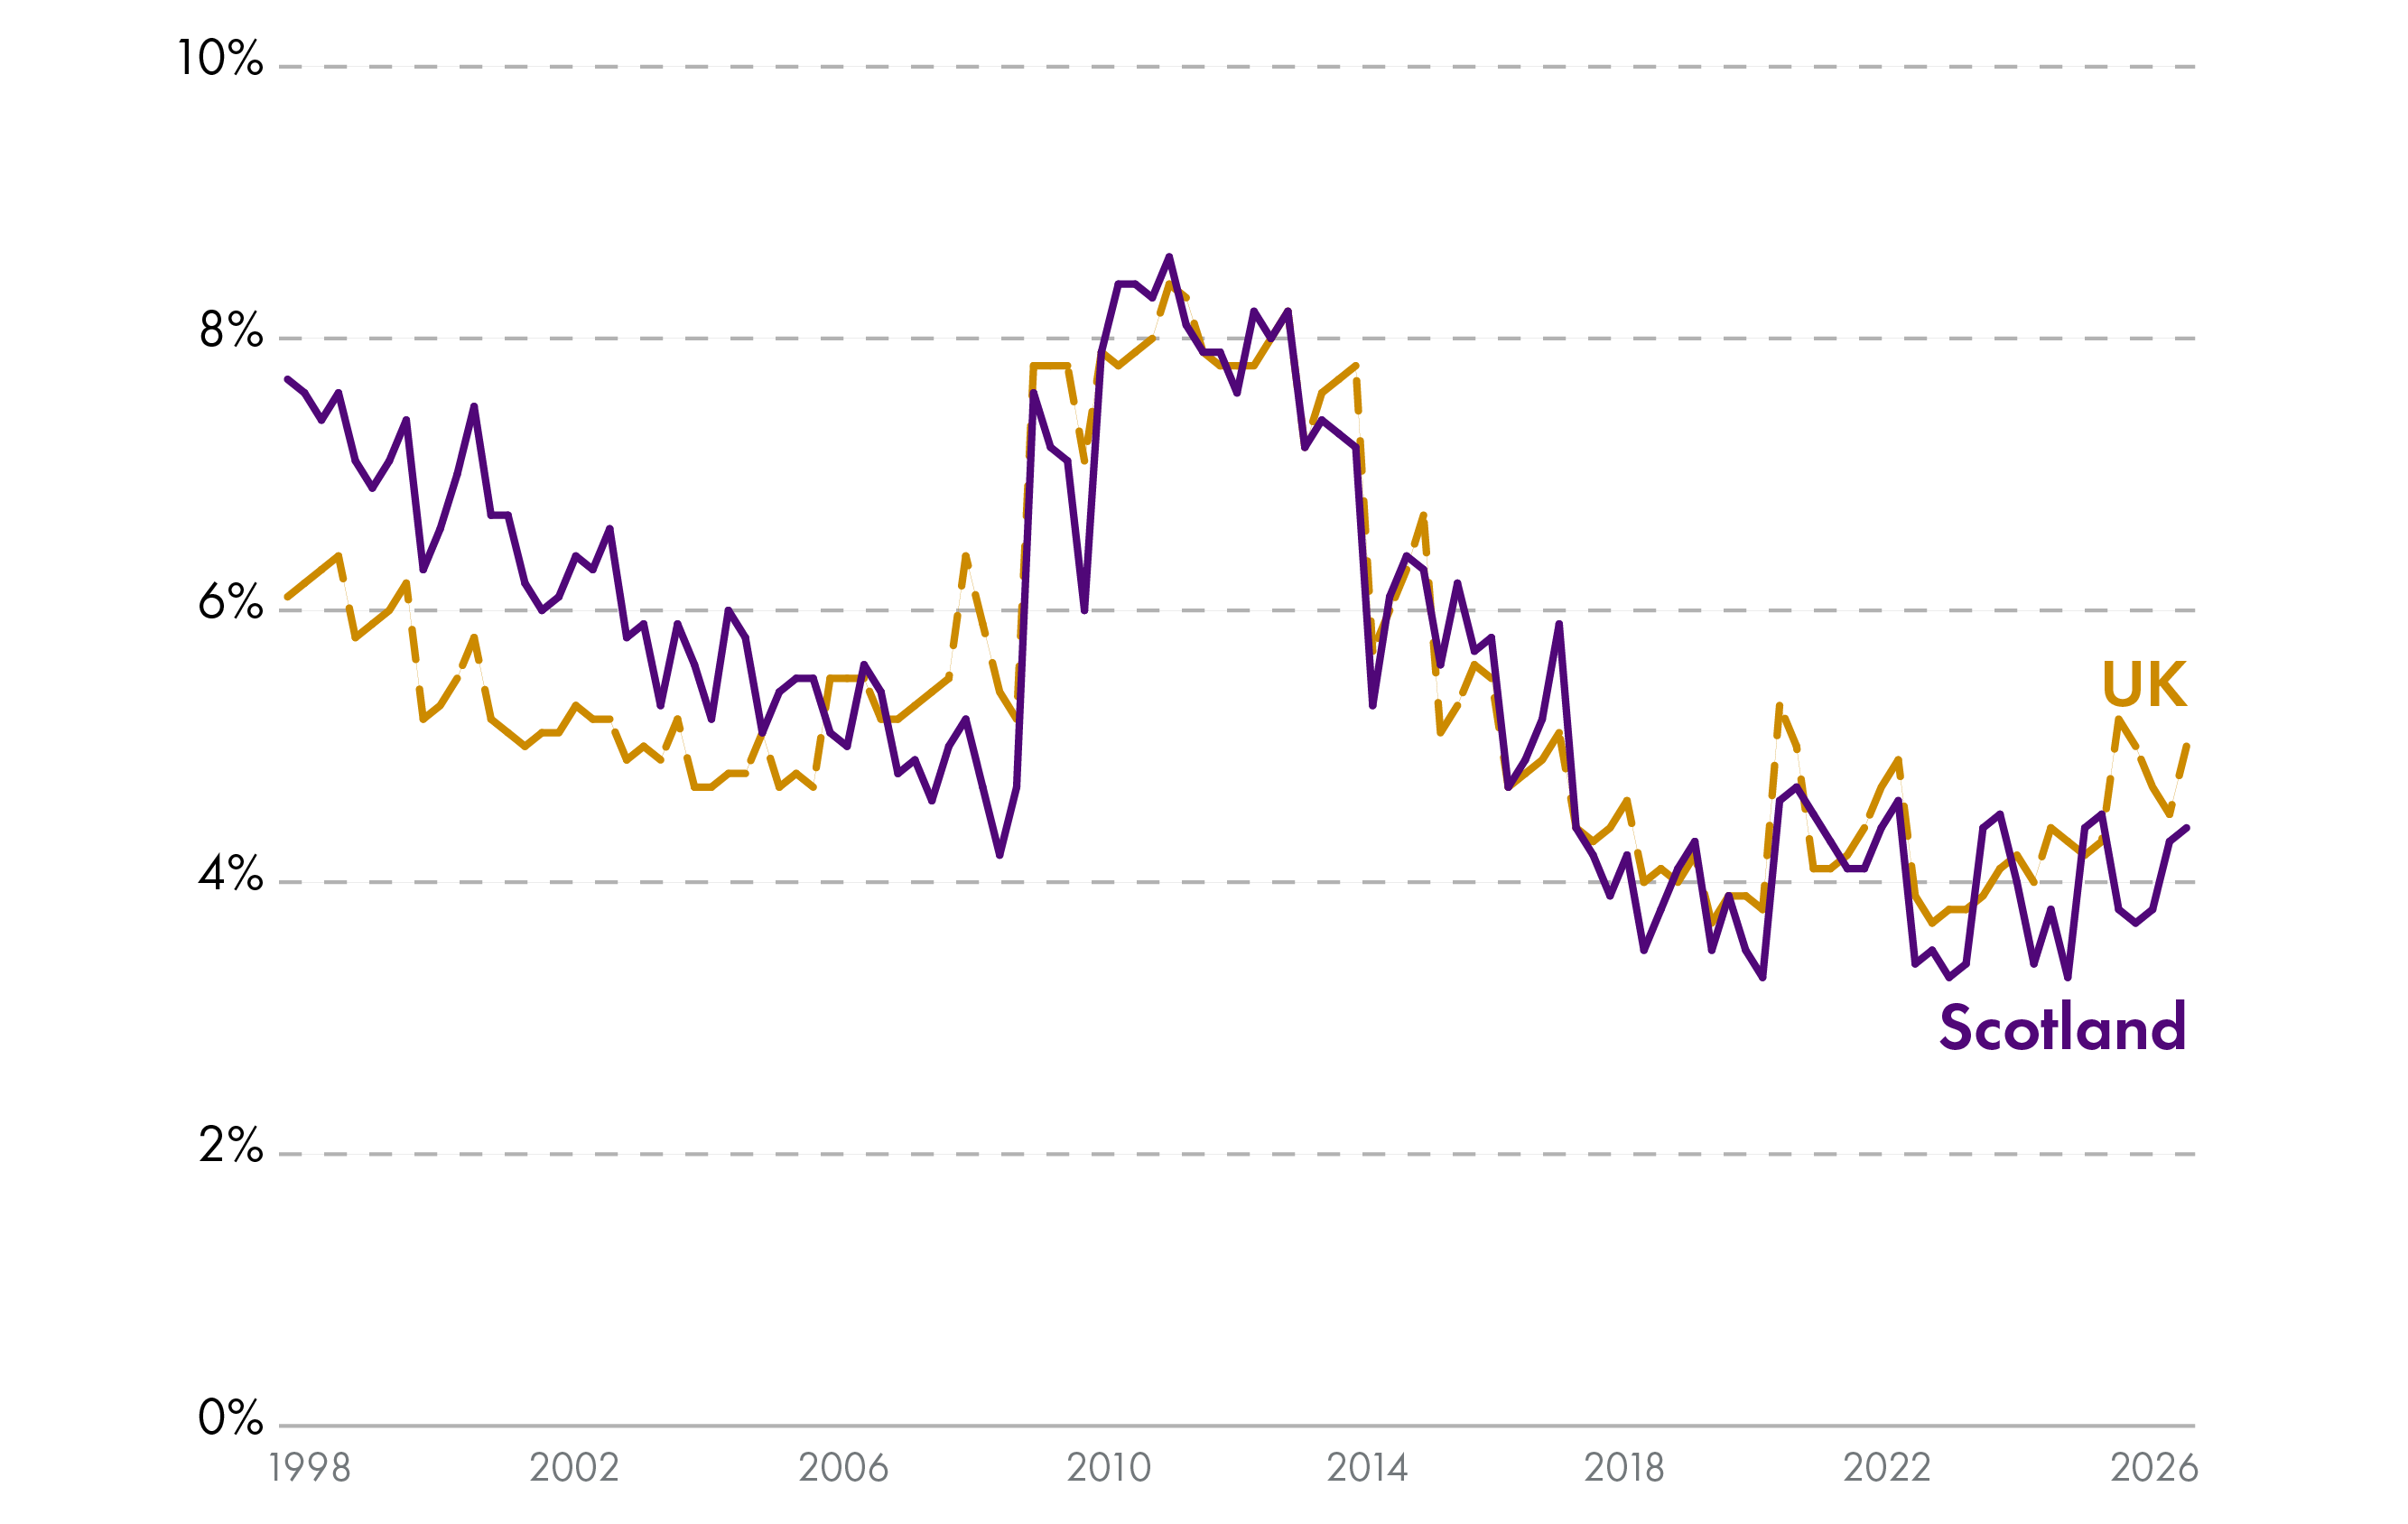
The unemployment rate is the share of the workforce aged 16+ who do not have a job but are actively looking for work. The most recent (Jan-Mar 2026) unemployment rate in Scotland was 4.4%.
The unemployment rate shows the pool of workers available to hire. 4% is generally considered a low unemployment rate. If the unemployment rate drops too low, this can be a sign that employers will struggle to recruit.
Oscillating around 4%, Scotland’s unemployment rate has stayed notably low since the Covid-19 pandemic.
Source: ONS, see SPICe dashboard for details
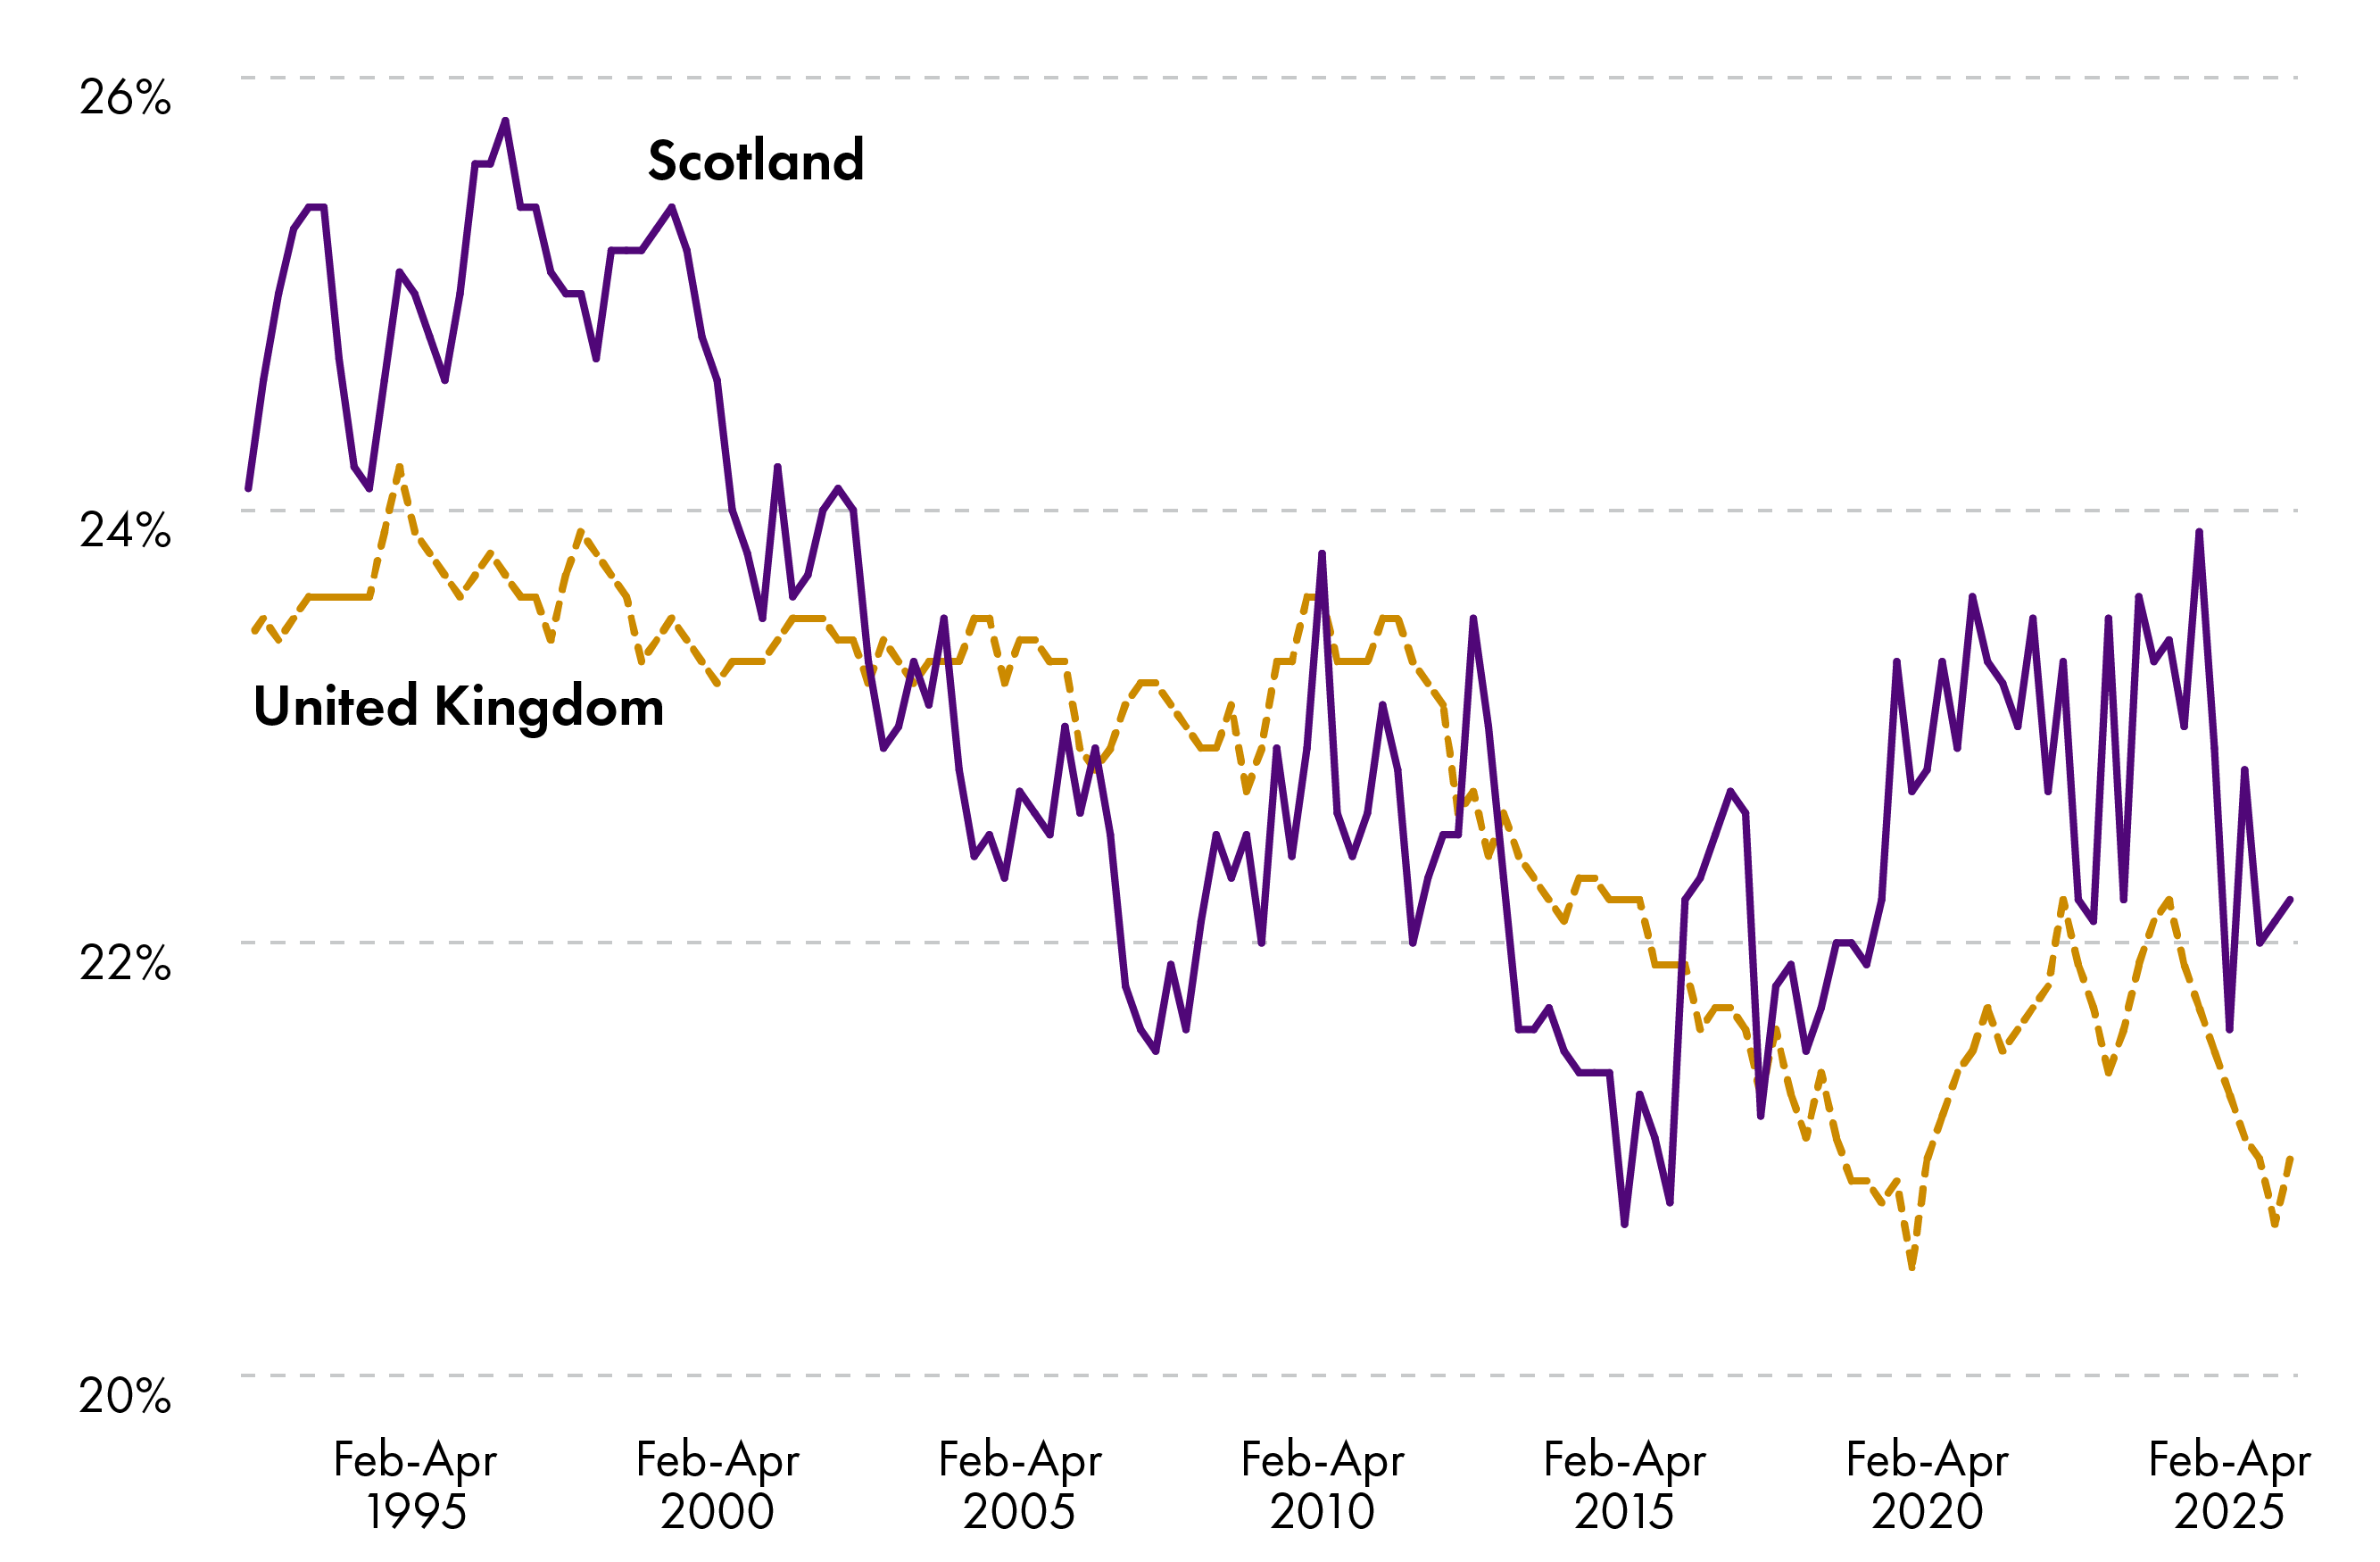
The economic inactivity rate is the proportion of people aged 16-64 who are not in work and are not actively looking for work. The most recent (Jan-Mar 2026) inactivity rate in Scotland was 22.7%.
Scotland’s inactivity rate has been consistently higher than the UK average since the Covid-19 pandemic, largely driven by long-term sickness.
Source: ONS, see SPICe dashboard for details
The most common reasons for inactivity in Scotland are long-term sickness (34.7% of the ‘inactive’ population), being a student (23.0%), looking after family/home (15.0%) and being retired (14.8%).
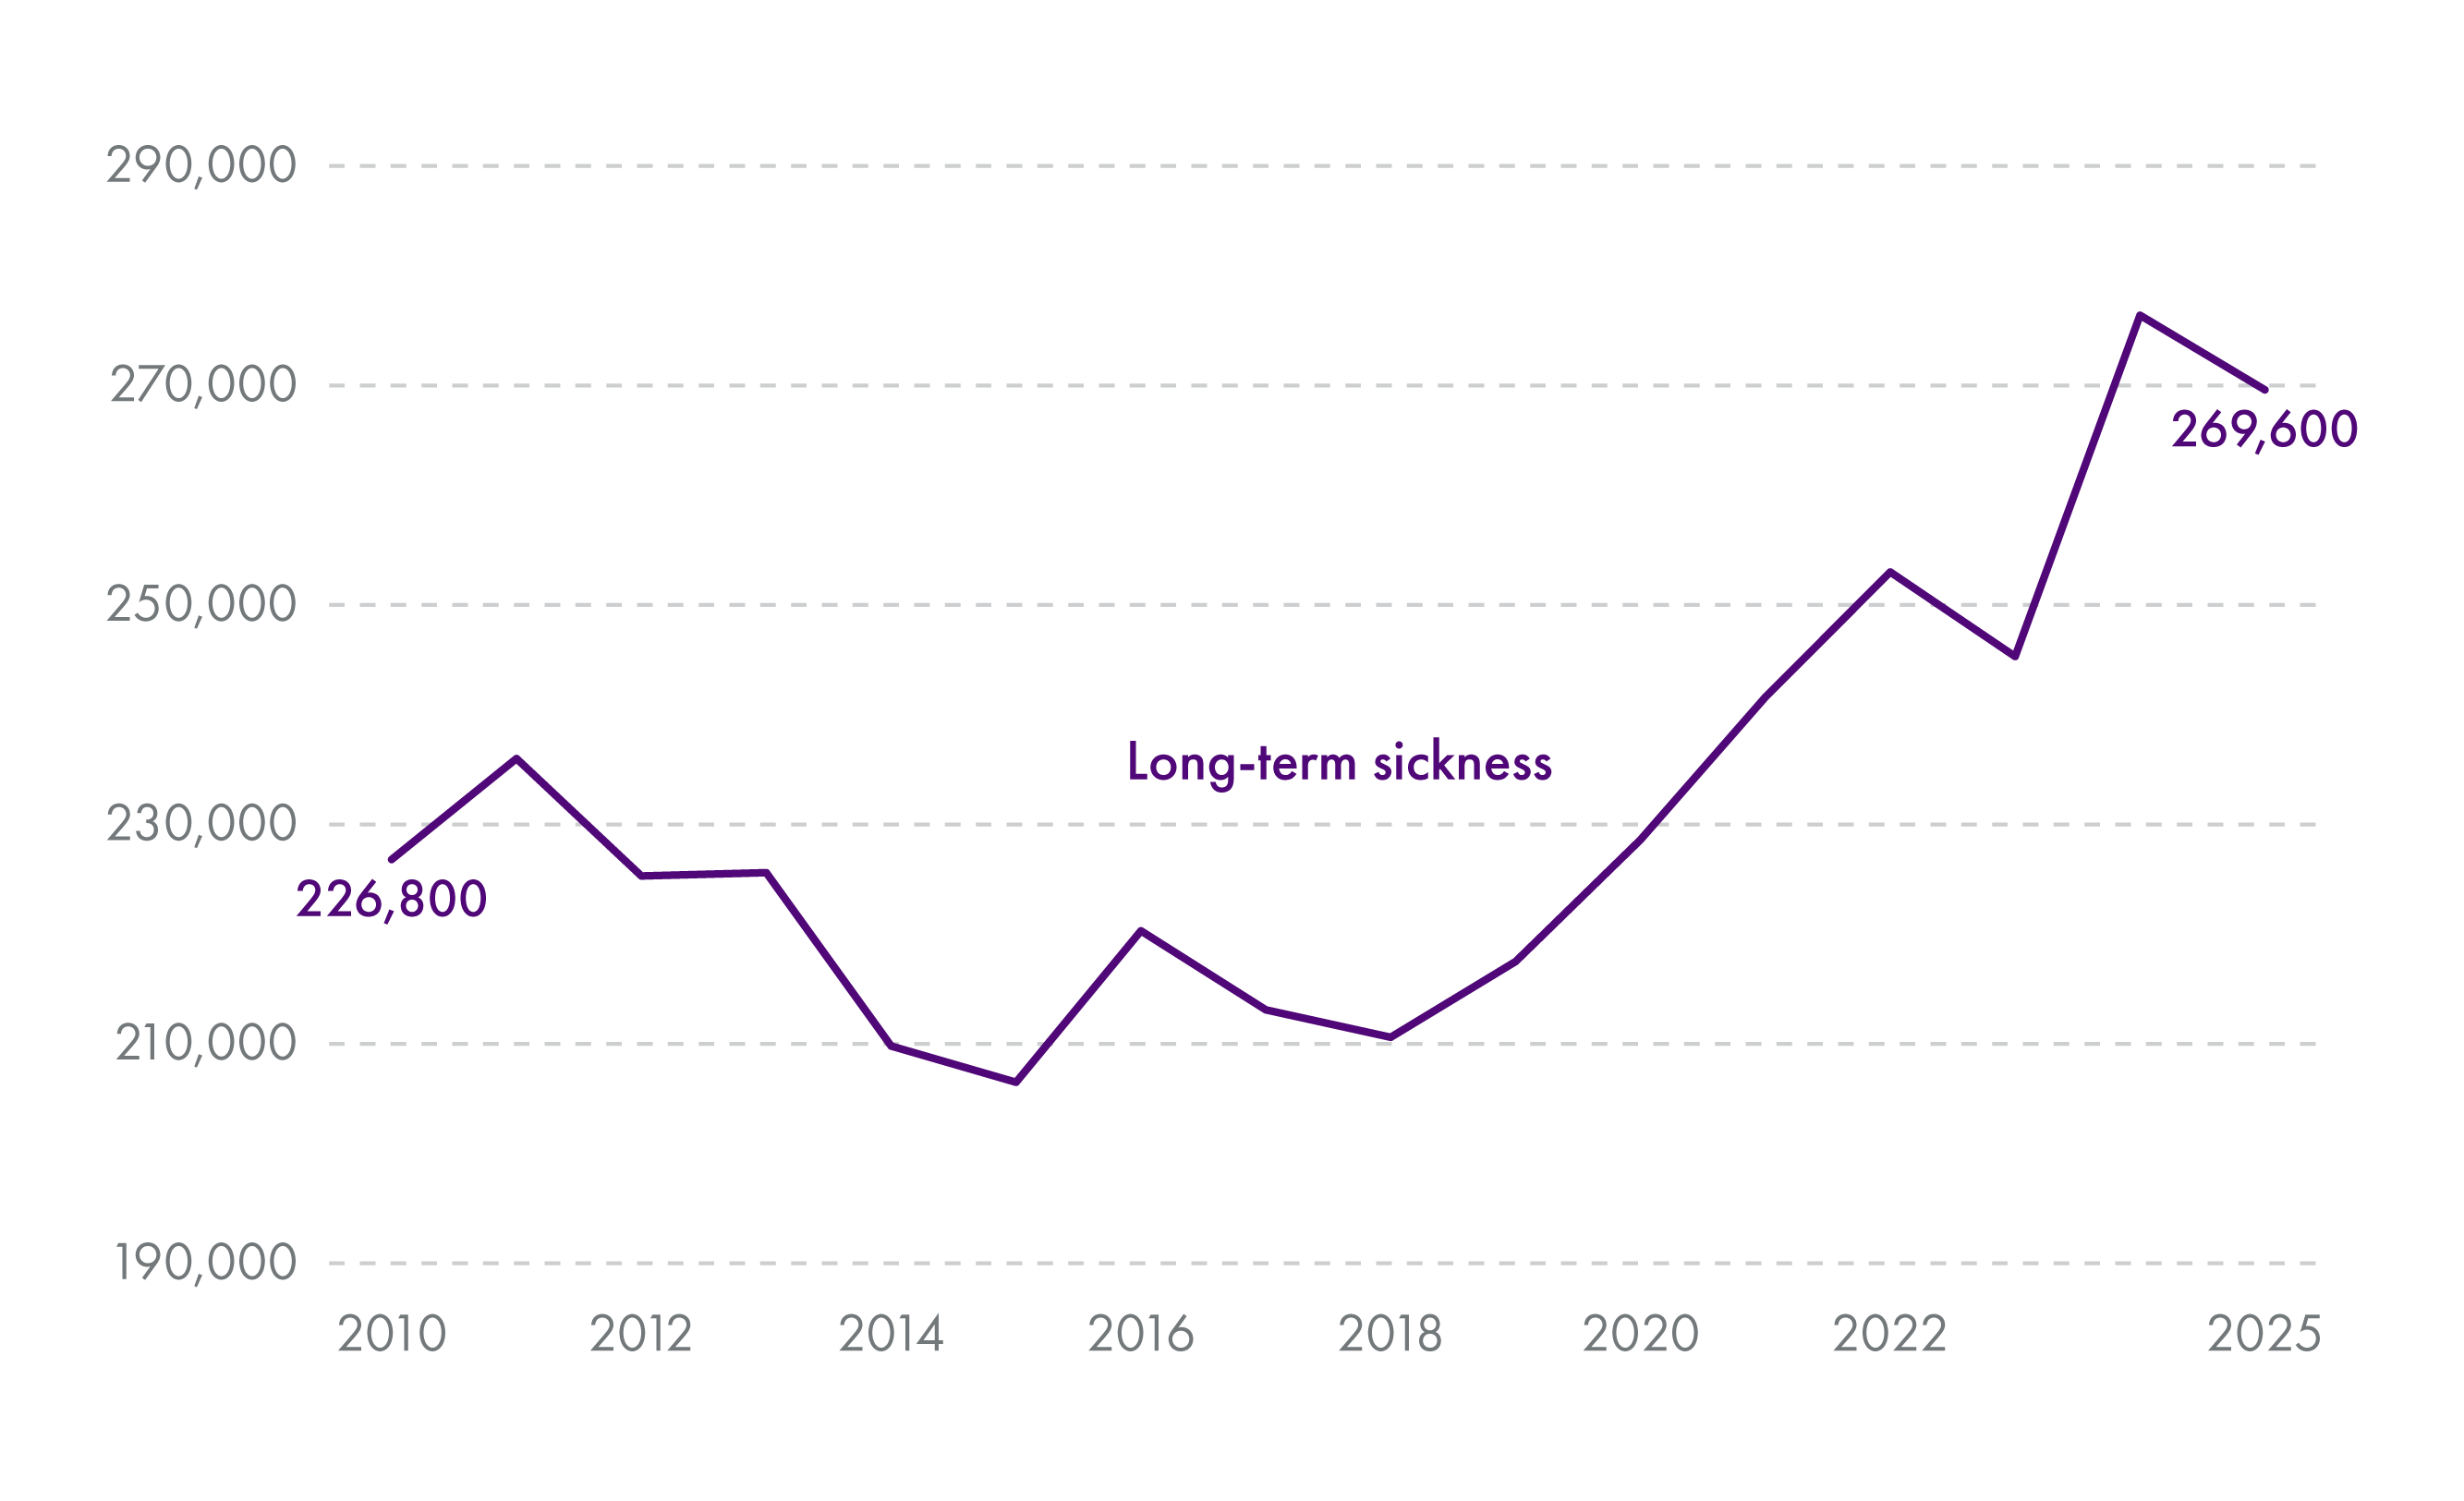
Perhaps the most striking feature of recent labour market data in Scotland has been the rise in economic inactivity due to long-term sickness since the Covid-19 pandemic.
During the 2010s, an average of roughly 220,000 people in Scotland reported long-term sickness as being their main reason for not being in work or looking for work. In 2025, this figure rose to roughly 270,000.
This has been somewhat counterbalanced by a decrease in the number of people who report looking after family/home or being retired as their main reason for not being in work or looking for work.
The number of people out of the labour force due to long-term sickness has increased since the Covid-19 pandemic.
Source: ONS Labour Force Survey, accessed through Nomis
The above charts highlight the cyclical nature of some labour market statistics. Scotland’s employment, unemployment and inactivity rates move in similar directions to the UK average, reflecting wider macroeconomic conditions. That said, economic inactivity - particularly inactivity due to ill health – has been persistently higher in Scotland than the UK average. Conversely, the employment rate has been persistently lower.
Inequality in the labour market
Some features of labour market outcomes are more structural. There are, for example, some inequality of outcomes between different groups of the population that persist over time.
For example, male employees earn more on average than their female counterparts. The gender pay gap for employees in 2025 was 9.4% in Scotland. Note that these figures exclude earnings from self-employment.
Disabled people are less likely to be in employment than non-disabled people, with the most recent statistics showing a disability employment gap of 32.5 percentage points in Scotland.
Labour market data quality
Since the Covid-19 pandemic, there have been significant issues affecting the quality of ONS labour market data. This specifically concerns the ONS’ Labour Force Survey (LFS). Issues stem from falling response rates to the ONS survey and post-pandemic practical difficulties collecting survey data.
This has resulted in the Office for Statistics Regulation (OSR) withdrawing the ‘accredited statistics’ badge for publications based on LFS and APS data.
The latest information on the quality of the LFS can be found on the ONS’ quarterly quality updates and OSR responses. As stated in these articles, the ONS recommends using LFS estimates with caution and as part of a broader range of sources including administrative data.
Workforce skills
A more highly skilled workforce can produce more output per worker, adopt new technologies more effectively, and support innovation. Skills also affect how well the labour market functions. Where workers’ skills align with employers’ needs, businesses can fill vacancies more easily and workers can access better jobs.
Skills policy is devolved to the Scottish Parliament.
Skills shortage vacancy rate
The skills shortage vacancy rate measures the percentage of workplaces that report having at least one job vacancy that is hard to fill because applicants lack the required skills, qualifications, or experience.
The survey of businesses that these figures are based on has been conducted every two years, with a break between 2017 and 2022.
The share of workplaces struggling to fill vacancies due to skills shortages increased in the 2010s in Scotland and across the UK, but declined in the most recent survey.
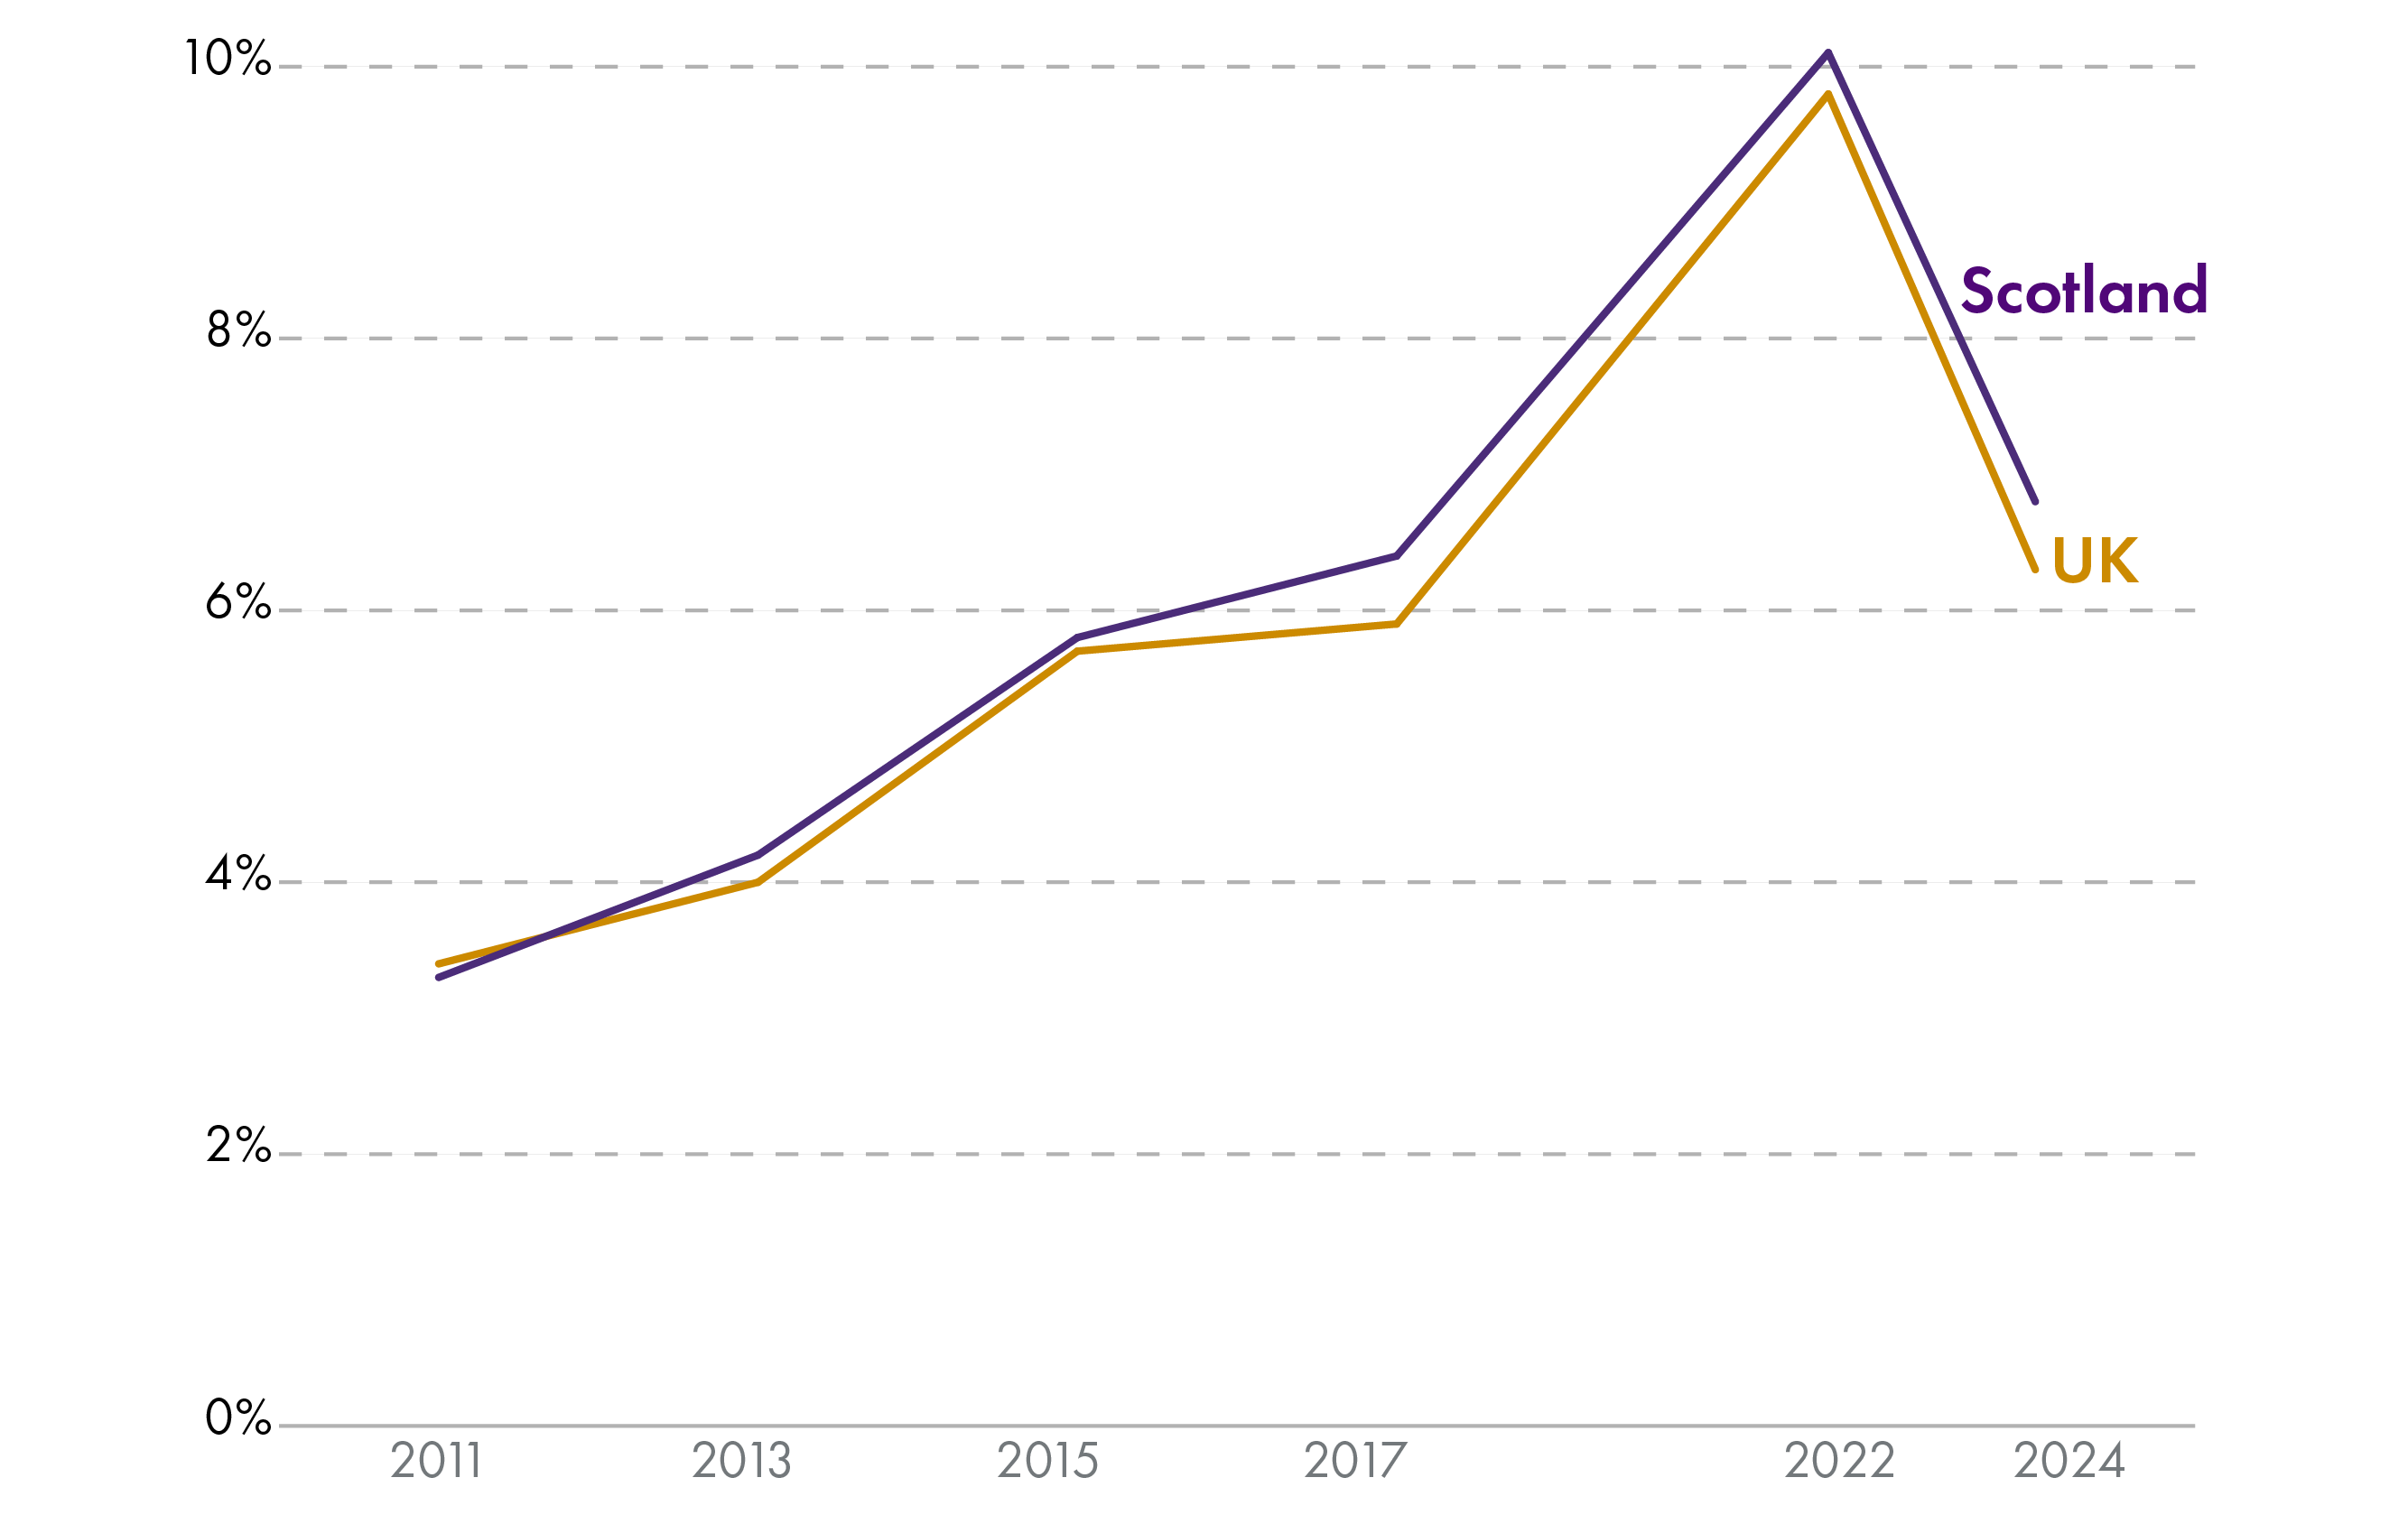
At 6.8% in 2024, Scotland’s skills shortage vacancy rate has fallen from its peak of 10.1% in 2022. It remains slightly above the UK average of 6.3%.
Skills underutilisation rate
The skills underutilisation rate measures the percentage of workplaces reporting that at least one employee had both qualifications and skills more advanced than required for their current job role.
It shows how much workforce potential is unused due to mismatches between employees’ skills and the requirements of their jobs.
It is worth noting that the survey these figures are based on can only capture skills not being fully utilised that employers are aware of and report.
| Year | Scotland | UK |
|---|---|---|
| 2017 | 35% | 34% |
| 2019 | No data | 34% |
| 2022 | 37% | 35% |
| 2024 | 33% | 31% |
Source: Employer Skills Survey research report, UK Government
Note: No data was collected in Scotland in 2019.
Scotland’s skills underutilisation rate appears to be receding, although it remains slightly higher than the UK average. However, it remains the case that a third of workplaces in Scotland report that at least one employee is more qualified and skilled than their job role requires.
Training days
Surveys of employers measure the average number of training days per employee. This tells us the typical amount of time that employees spend on formal or structured training activities. It indicates how much time employers invest in developing staff skills.
The average number of days employees in Scotland have spent in training has declined in each survey year since 2013. Differences between the UK and Scotland are negligible.
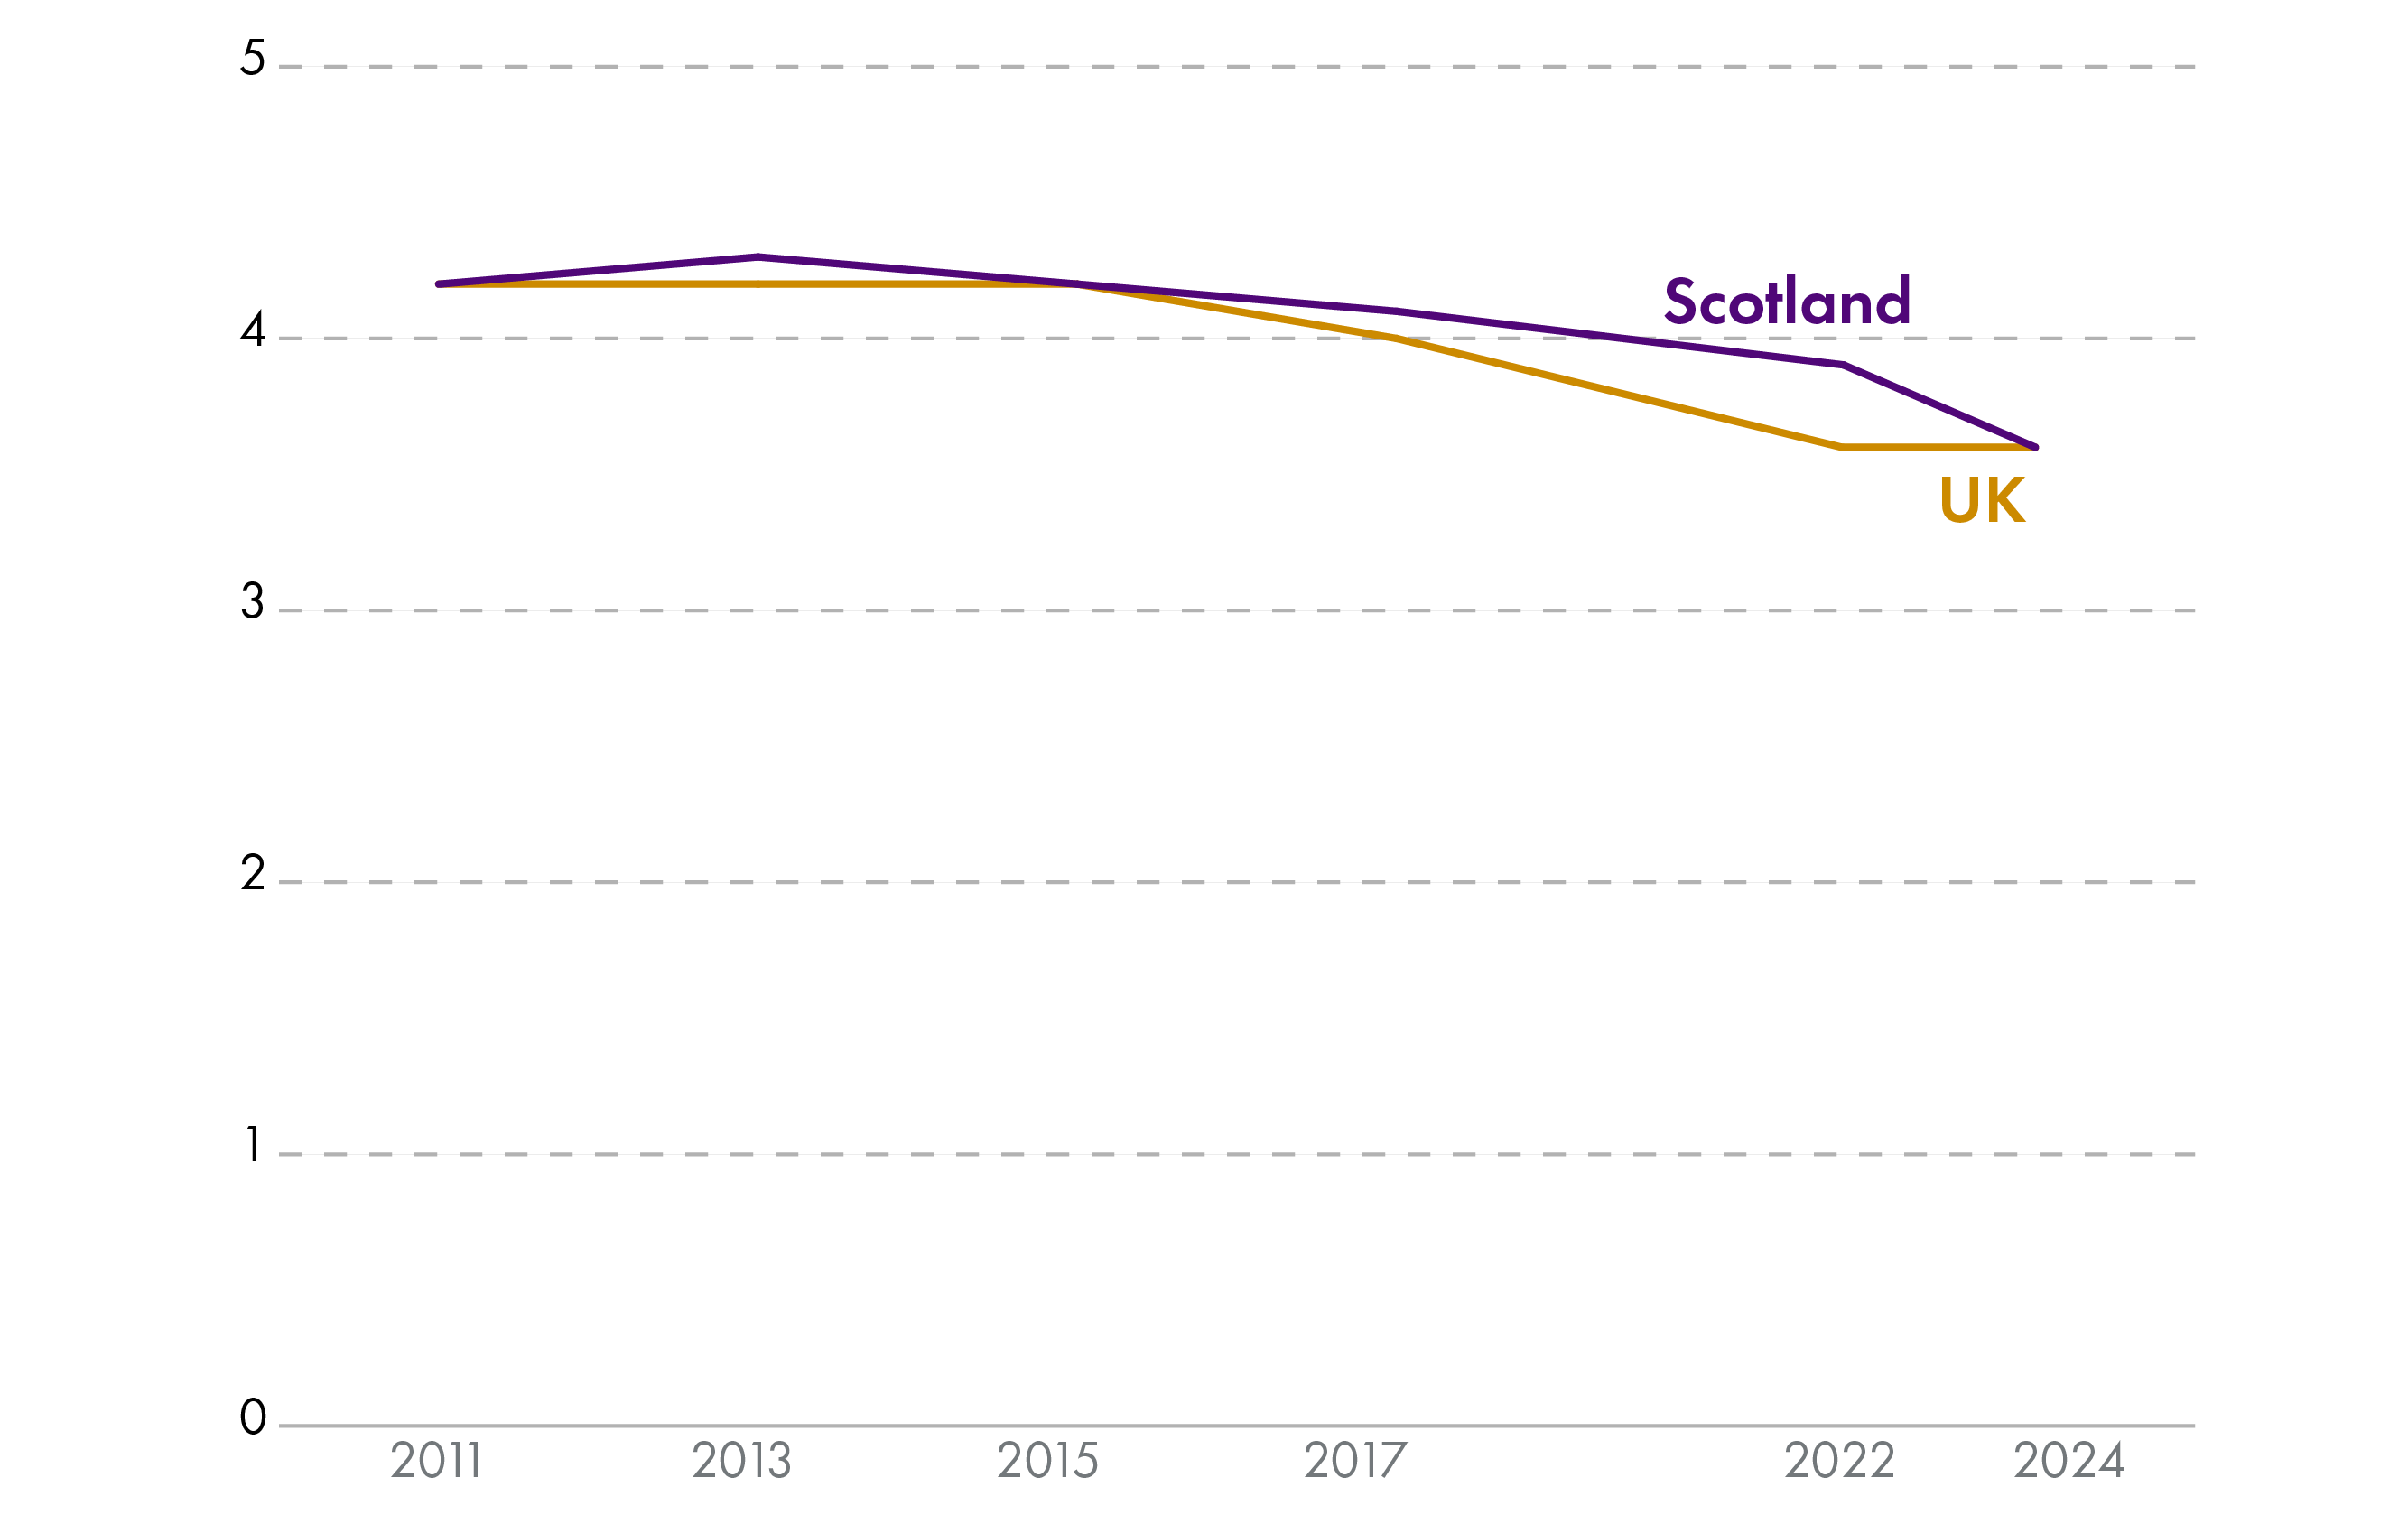
The number of days typically spent in training in Scotland is very close to the UK average. This has been on a downward trend since 2013, falling from a high of 4.3 to a low of 3.6 in 2024.
Investment
Investment is spending that generates or improves an asset.
Investment can come from the private sector, such as a business buying new machinery or software. This helps businesses to grow and become more competitive.
Investment can also come from the public sector, such as a government building a hospital or road.
There is evidence that sustained higher investment spending leads to better economic outcomes in the long-term.1
Investment spending can also facilitate other policy objectives. For example, the Climate Change Commission projects that reaching net zero will require investment in things like heat pumps, home insulation and electricity grid upgrades.2 Improved digital infrastructure in the NHS could enhance patient diagnosis and care, as well as improving efficiency.
Gross fixed capital formation
Gross fixed capital formation is the headline measure of investment spending in the economy. It is typically presented as a percentage of GDP to illustrate the share of an economy’s resources being invested towards productive assets.
When assessing measures of investment spending, such as gross fixed capital formation, it is useful to take a long-term view. Investment spending adds to the economy’s ‘capital stock’ of assets that support economic activity. The impact of low investment spending in one year can be limited. But the impact of sustained underinvestment is cumulative.
UK and Scottish investment spending has been low for decades compared to international peers
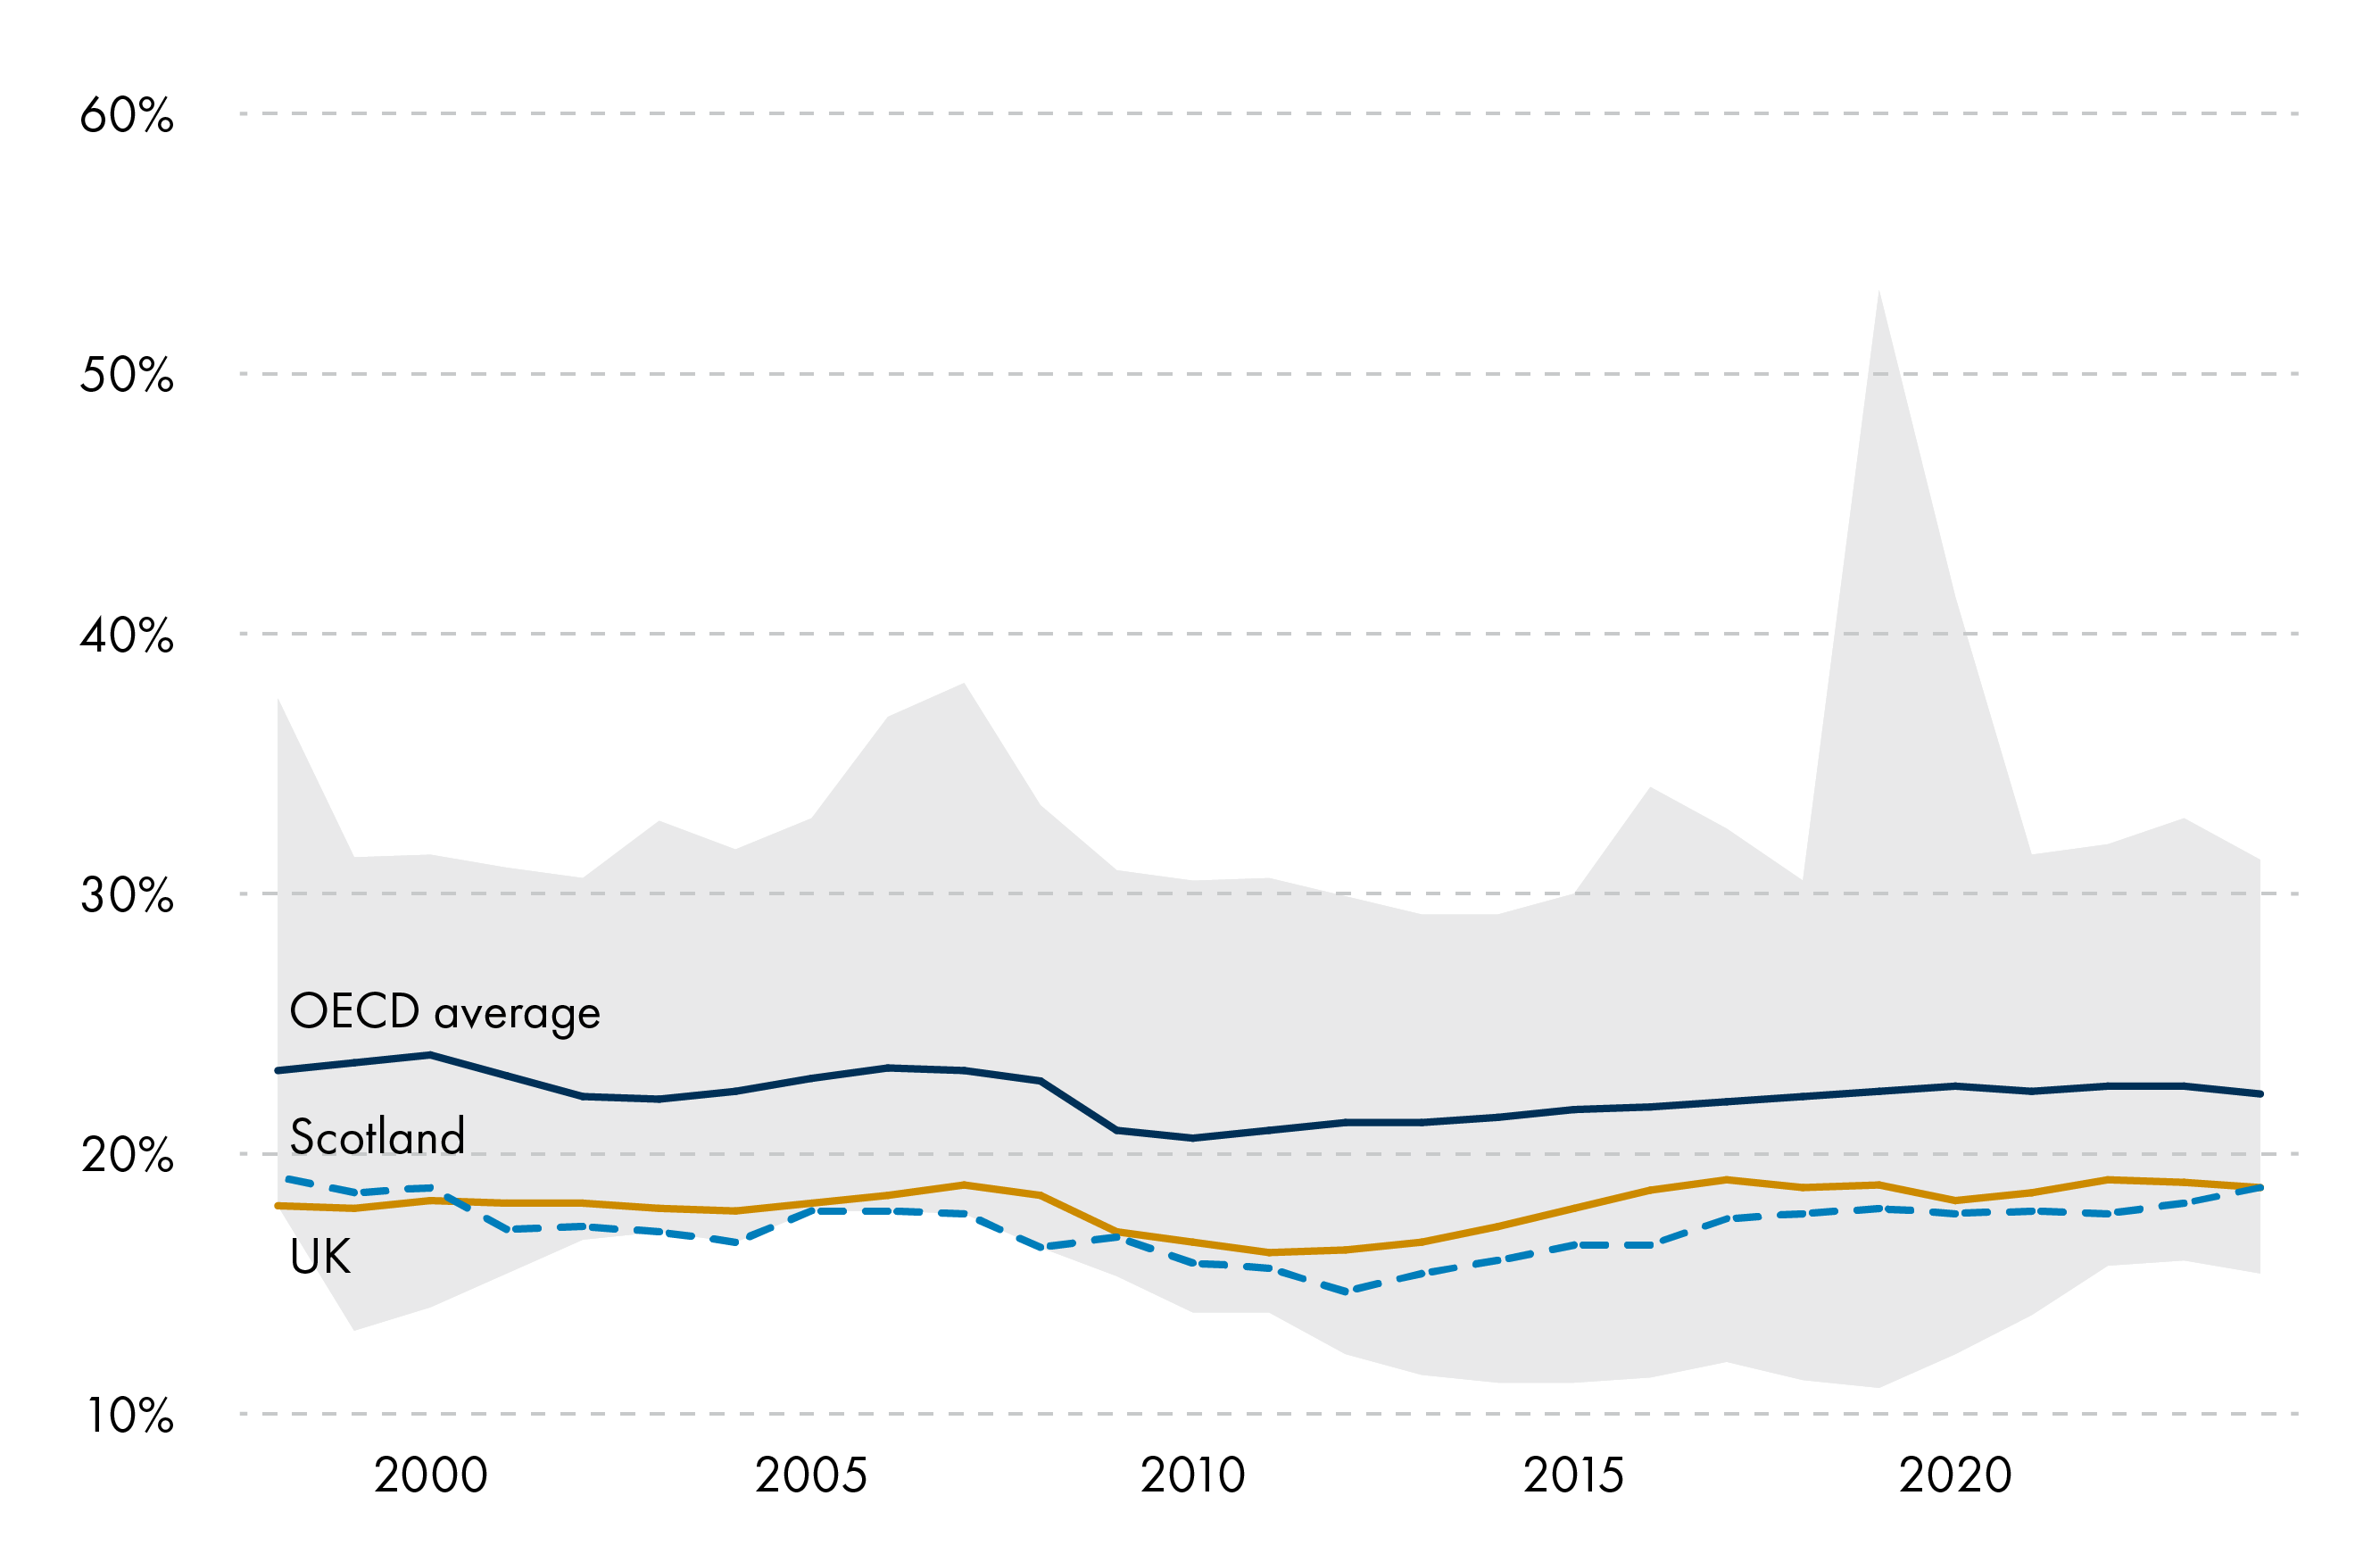
Note: The grey area shows the range of OECD countries.
Figure 15 shows that compared to international peers, the UK and Scotland have had low rates of investment spending for some time. Economists at the Resolution Foundation have characterised this as:
A country living off its past, not prioritising its future.
Source: Resolution Foundation
It is worth questioning why increasing investment is hard. If it generates prosperity in the long-term, why do governments and businesses not just increase their investment spending today? The key difficulty in raising investment spending is that it usually requires forgoing short-term consumption (spending on day-to-day activities) or must be financed through higher borrowing (which comes with interest costs). At the same time, the gains from investment spending are not guaranteed and may not materialise for many years.
A stable and improving economic outlook, low interest rates, tax incentives and access to finance can all induce higher investment spending.
Private and public sector investment
Evidence suggests that private sector investment spending (or ‘business investment’) in Scotland tends to be at the lower end of OECD rankings.1
However, there is emerging evidence that business investment may have turned a corner.2 At 10.2% of GDP, business investment in Scotland reached its highest level in 20 years in 2023, growing by 0.8 percentage points in one year. For context, the long-term trend (1998-2023) of this metric is 9.8%.
It remains to be seen if this is the start of a trend or a one-off.
UK-wide, plans for public investment have been increased by the UK Government since its election in 2024. However, this largely offsets previously planned reductions – overall public investment as a share of GDP is set to remain broadly stable.3
The Scottish Government has a capital budget of £7.6 billion in 2026-27 (around 3.5% of onshore GDP). This is largely determined by UK Government decisions. However, the Scottish Government does have some flexibility to increase its capital budget (e.g. it can transfer from its day-to-day budget) and can choose how to spend it. It also has limited borrowing powers that can be used to boost public sector investment. More information on the Scottish Government's capital budget is available in this SPICe blog, 'The Scottish Government's capital budget'.
Foreign Direct Investment (FDI)
FDI is a source of investment. It occurs in Scotland when a company or individual from overseas invests in (and gains an interest or control over) a business located in Scotland.
Evidence suggests that FDI can improve productivity and wages.1 This is because firms that invest internationally tend to be more productive and bring enhanced organisational structures, management practices and technology with their investment. This in turn can improve the attractiveness of an economy to investors and bring further investment.
The trade-off to FDI, however, is that an increasing share of ownership and control over domestic firms becomes located overseas. Also, an increasing share of profits generated by domestic firms flows to international shareholders.
Scotland tends to attract more FDI projects than other parts of the UK. In each of the last ten years, only London and the Southeast of England has attracted more.
Furthermore, Scotland’s share of UK FDI projects is increasing. In 2024, Scotland’s 135 FDI projects represented 15.8% of the UK total, which is above the decade-long trend of 11.5%.2
Note that these statistics tell us about the total number of FDI projects secured – they do not tell us about the monetary value of these projects, the number of jobs created by them, or the longer-term economic impact of such investment.
Innovation and entrepreneurship
Businesses can innovate in the products and services they sell or in their internal production processes. Innovation allows them to grow by becoming more efficient and/or competitive.
There is evidence that high quality entrepreneurship – the creation of new high growth businesses – is linked with better economic outcomes.1 Entrepreneurship can drive up innovation, intensify competition, and create new jobs, all of which can improve an economy’s dynamism.
There are different ways to measure innovation and entrepreneurship.
Research and development (R&D) spend
Expenditure on R&D is often used as a proxy for the level of innovation in an economy.
The headline measure of R&D spend is Gross Expenditure on Research and Development (GERD).
By far the two largest components of GERD are:
R&D undertaken by Business Enterprises (BERD)
R&D undertaken by Higher Education (HERD)
The remaining 7% comes from Government (GovERD) and Private Non-Profit (PNP) sectors.
In 2023, £5.02 billion of GERD took place in Scotland. This was 2.50% of GDP, placing Scotland in the second quartile of OECD countries, above the EU (2.13%) but below the UK (2.64%).1
Scotland's GERD rate is just below the UK and OECD averages but above the EU.
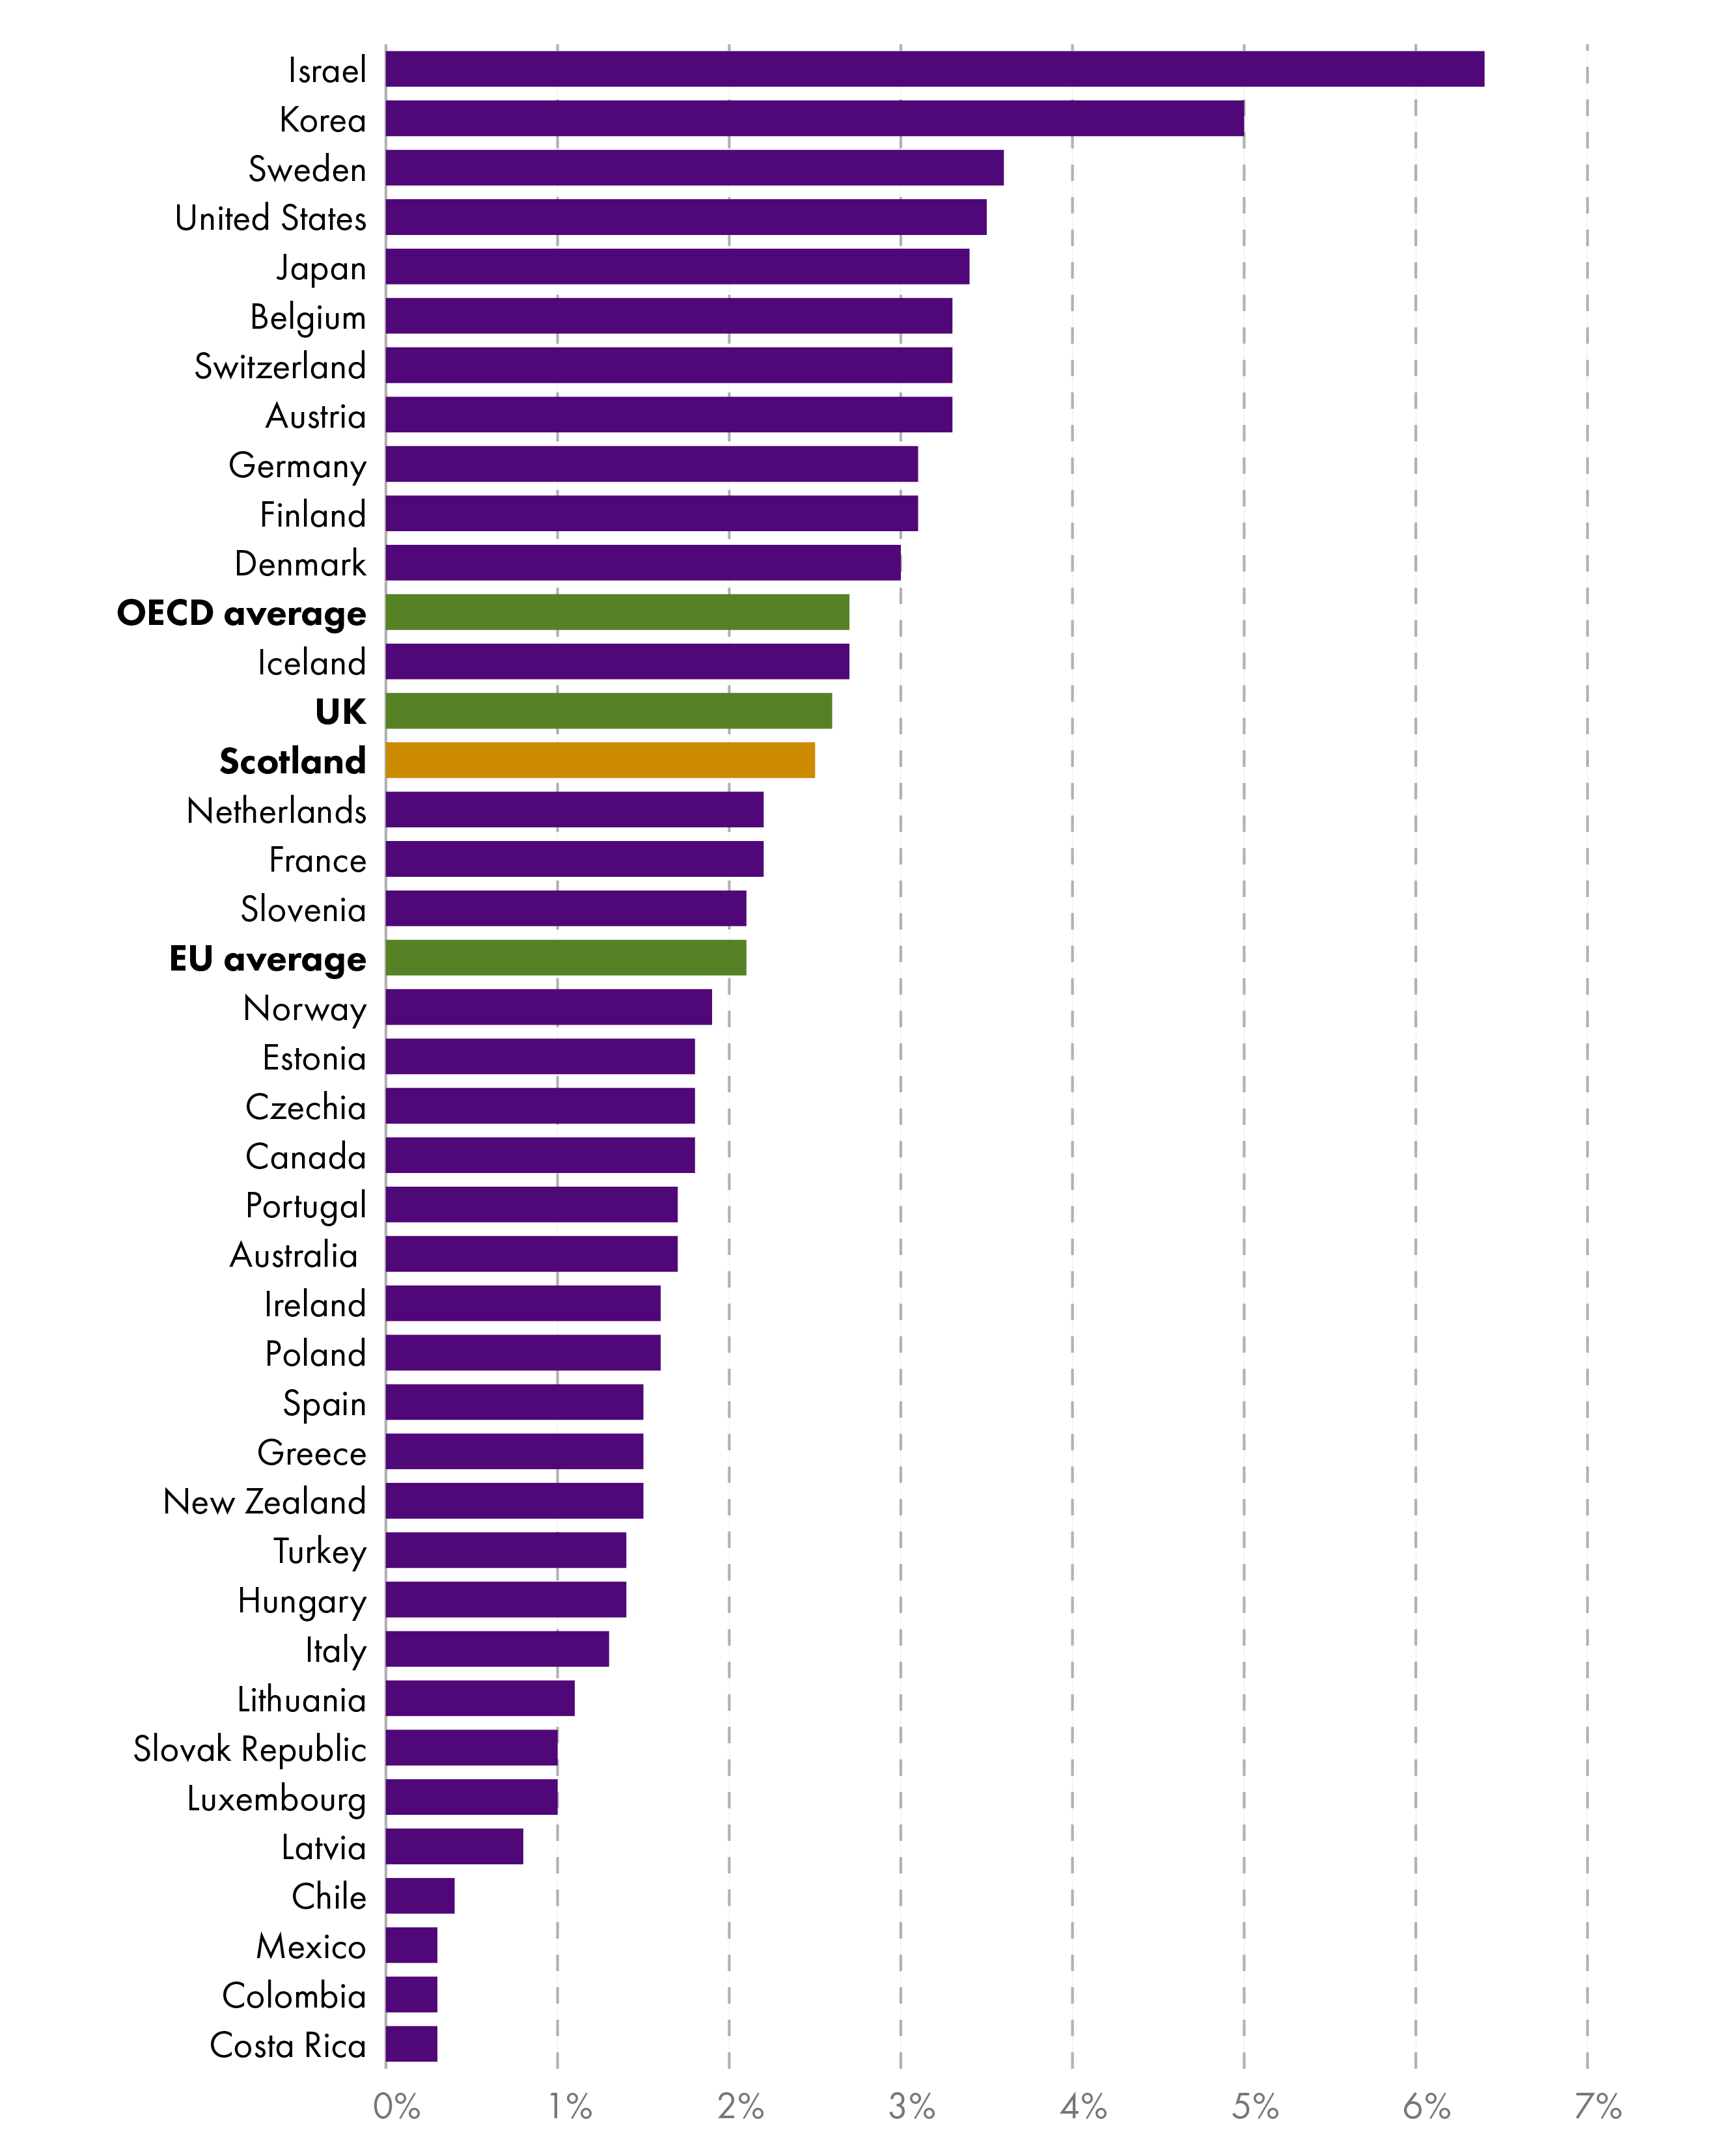
As a share of GDP, Scotland’s 2023 HERD (0.97%) was the second highest in the OECD – outperforming the UK (0.62%) and EU (0.46%).
However, Scotland’s BERD as a percentage of GDP (1.34%) was the 18th highest and in the second quartile. The equivalent figure for the EU was 1.41% and the UK 1.82%.
Scotland’s relative overperformance in HERD and underperformance in BERD suggests that Scotland’s higher education institutions provide a strong foundation of R&D infrastructure, but that this R&D activity is not fully aligned with its business base.
Innovation active businesses
The ONS’ biennial Innovation Survey asks businesses about their innovation activity.
Businesses that are innovation active are defined as having:
Introduced a new or significantly improved product (good or service) or process.
Engaged in innovation projects not yet complete, scaled back, or abandoned.
Adopted new and significantly improved forms of organisation, business structures or practices, and marketing concepts or strategies.
Source: Scotland's National Innovation Strategy, Scottish Government
The most recent Innovation Survey covered the period 2022-24.
It found that 29% of businesses in Scotland were classed as innovation active. This is down on 39% in 2018-20 and 32.4% in 2020-22. It is also below the UK-wide average of 34%.
The downward trend in innovation activity is mirrored across the UK.
Businesses were asked in the survey for their perception of barriers to innovation. The top perceived barriers to innovation in 2022-24 were:
Energy prices
Issues related to the Covid-19 pandemic
Cost and availability of finance
Direct cost of innovation activity
UK Government regulations
Lack of qualified personnel
UK’s withdrawal from the EU
Excessive perceived economic risks
Note that these are based on UK-wide survey results, as no Scotland-only figures were published for this question.
Early-stage entrepreneurial activity
Total early-stage entrepreneurial activity (TEA) is defined as the percentage of adults aged 18-64 who are either:
actively trying to start a new business (nascent entrepreneurs), or
the owner-manager of a new business (running a business that has paid wages/income for up to 42 months).1
In 2024, Scotland’s TEA rate was 10.4%. Although still below the UK average of 12%, this is Scotland’s highest TEA since the survey began in 2002.
There is a gender gap in early-stage entrepreneurial activity. In 2024, TEA for men in Scotland was 12.7%, for women it was 8.1%.
3-year business survival rate
The share of newly created businesses that survive to 3 years is an indicator of the resilience of new businesses. It also tells us about the extent to which the business environment supports young businesses and entrepreneurial activity.
Scotland's 3-year business survival rate has started to recover from a near-all time low for businesses started in 2020, but remains below the average since 2004.
High growth businesses
The Scottish Government defines high growth businesses as having an average of 20+% growth over three years in turnover and/or employees. The most recent statistics on high growth businesses in Scotland should be taken with caution. They show an increase in high growth businesses in terms of turnover from 2,685 to 5,490. However, the sharp increase is in large part because the three-year average includes 2020 as the starting point. Difficult trading conditions due to the Covid-19 pandemic mean that many of these businesses are unlikely to sustain this growth once 2020 drops out of the baseline.
In terms of employment, the number of high growth businesses fell from 870 to 840.
Looking at longer-term trends, there is evidence of Scotland having relatively fewer high growth businesses than internationally comparable economies.1
International exports
Exporting internationally can provide Scottish businesses with new sources of demand for their goods and services. This can help increase economic activity and jobs in Scotland.
Furthermore, there is evidence that exporting improves firms’ productivity and innovation, as they benefit from exposure to other ways of working and international technology diffusion.1
For this reason, the Scottish Government has set a target to increase Scottish international exports to 25% of GDP by 2029. It estimates that the impact of reaching this target would be:
To add around £3.5bn to GDP and to create around 17,500 more jobs with an increase in annual tax take of around £500m.
Source: A Trading Nation, Scottish Government
Note that these figures are in 2016 prices.
The Scottish Government publishes export statistics biannually. The latest estimate of international exports is presented in Figure 18.
Scotland’s international exports were 18.9% of GDP in 2023. The Scottish Government’s target is for this to reach 25% by 2029.
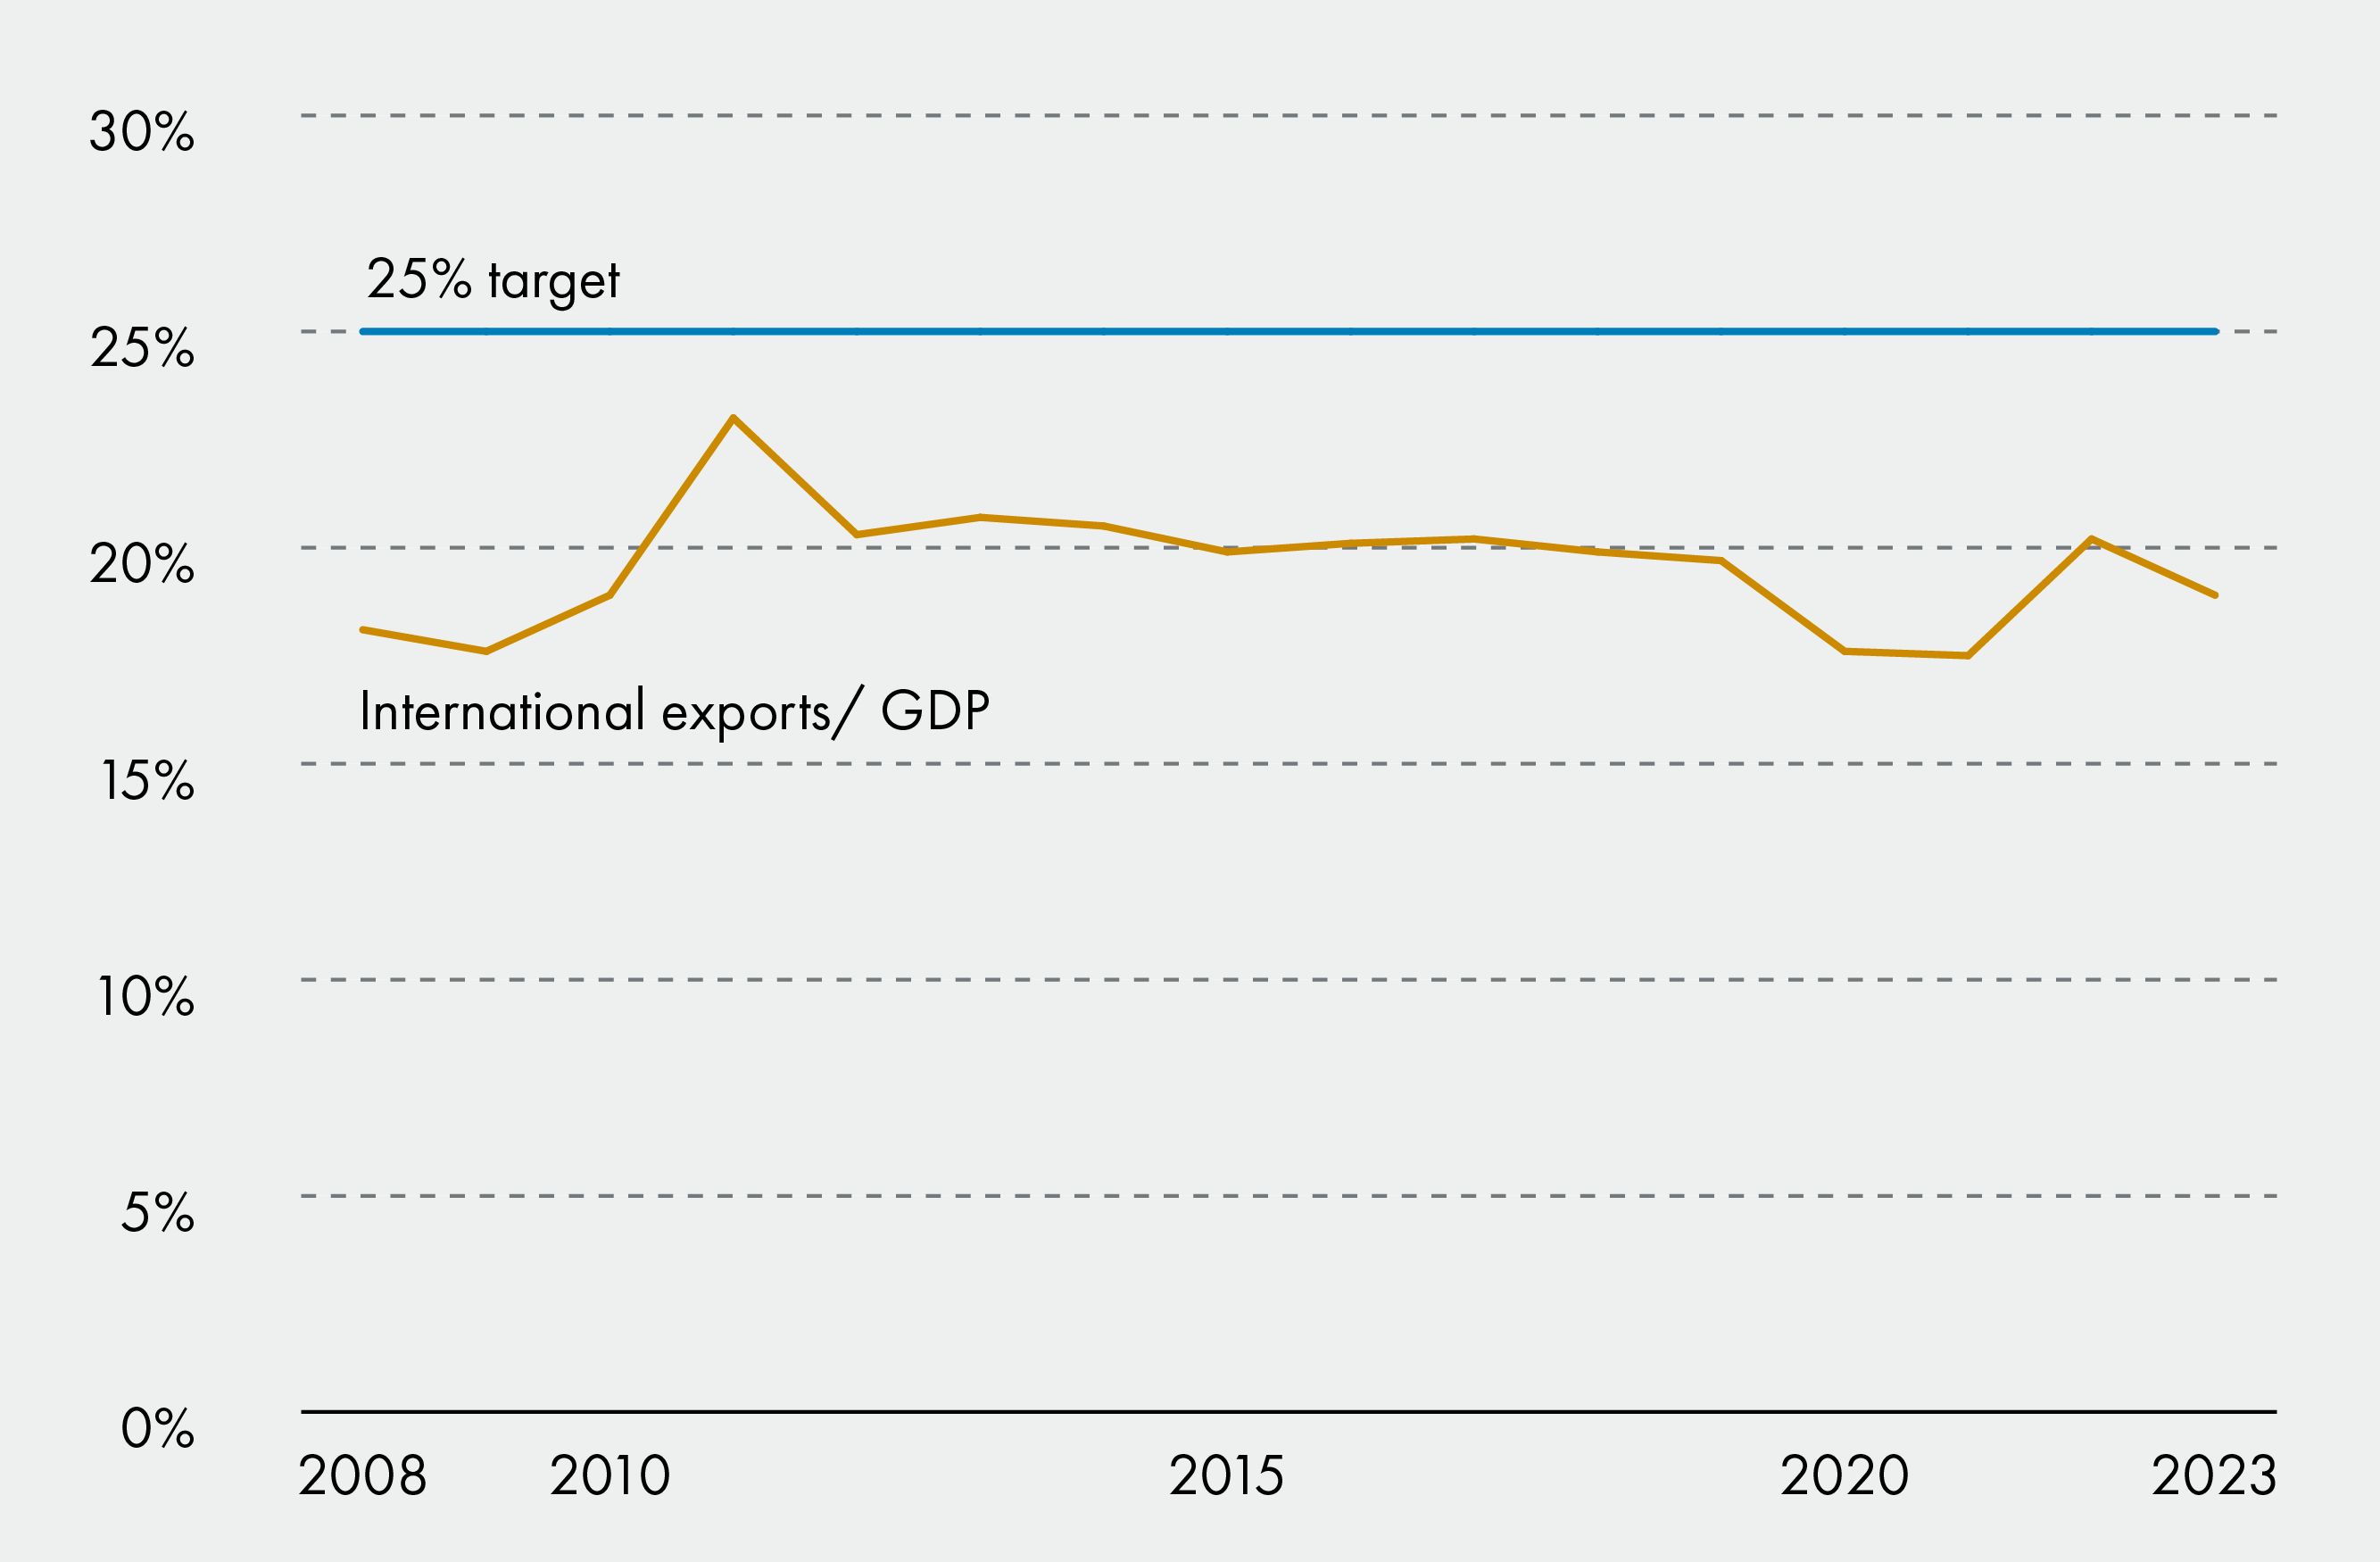
Note: Excludes exports of oil and gas but includes exports from support services to the oil and gas sector.
In 2023, Scotland exported £17.1 billion worth of goods and services to the EU and £20.6 billion to the rest of the World. In terms of individual countries, Scotland’s top export destination was the United States (£6.5 billion), followed by Netherlands (£3.0 billion), France (£2.8 billion), Germany (£2.5 billion), Ireland (£1.9 billion), China (£1.3 billion), Singapore (£1.2 billion), Norway (£1.2 billion), Belgium (£1.1 billion) and Italy (£1.0 billion).
Scotland’s exports are relatively concentrated, with over half the value of international exports coming from 5 industries.
The food and drink sector accounted for 20% of Scotland’s international exports in 2023, followed by professional, scientific and technical (12%), coke, refined petroleum, and chemicals (9%), financial and insurance (7%) and wholesale, retail and vehicle repair (6%).
The export data presented in this section comes from official statistics that are primarily based on surveys of Scottish businesses.2
Data is available on international imports to Scotland (see 'International trade in UK nations, regions and cities', ONS), but not presented in this briefing. These estimates are currently classified as ‘experimental statistics’. They are derived by apportioning UK-level trade data to Scotland using proxy indicators such as employment, rather than being based on directly observed Scotland-specific trade data.
Inequality
Inequality has many aspects, including differences in outcomes between groups of the population and regions of the country. These could be across multiple dimensions, such as economic indicators, health outcomes and educational attainment.
This section focuses on a perhaps narrower idea of economic inequality. It presents headline statistics on how economic attainment is distributed across the population.
A separate section presenting statistics on poverty is elsewhere in this briefing.
Income inequality
The Gini Index is a measure of income inequality. It shows how evenly income is distributed across the population, with 0% representing perfect equality and 100% representing complete inequality.
It provides a single headline figure that tells us about how incomes are distributed on average. However, it can mask what is happening at the extremes, such as very high incomes at the top or very low incomes at the bottom.
All sources of income are included in the measure, including employment income, pension income and social security payments.
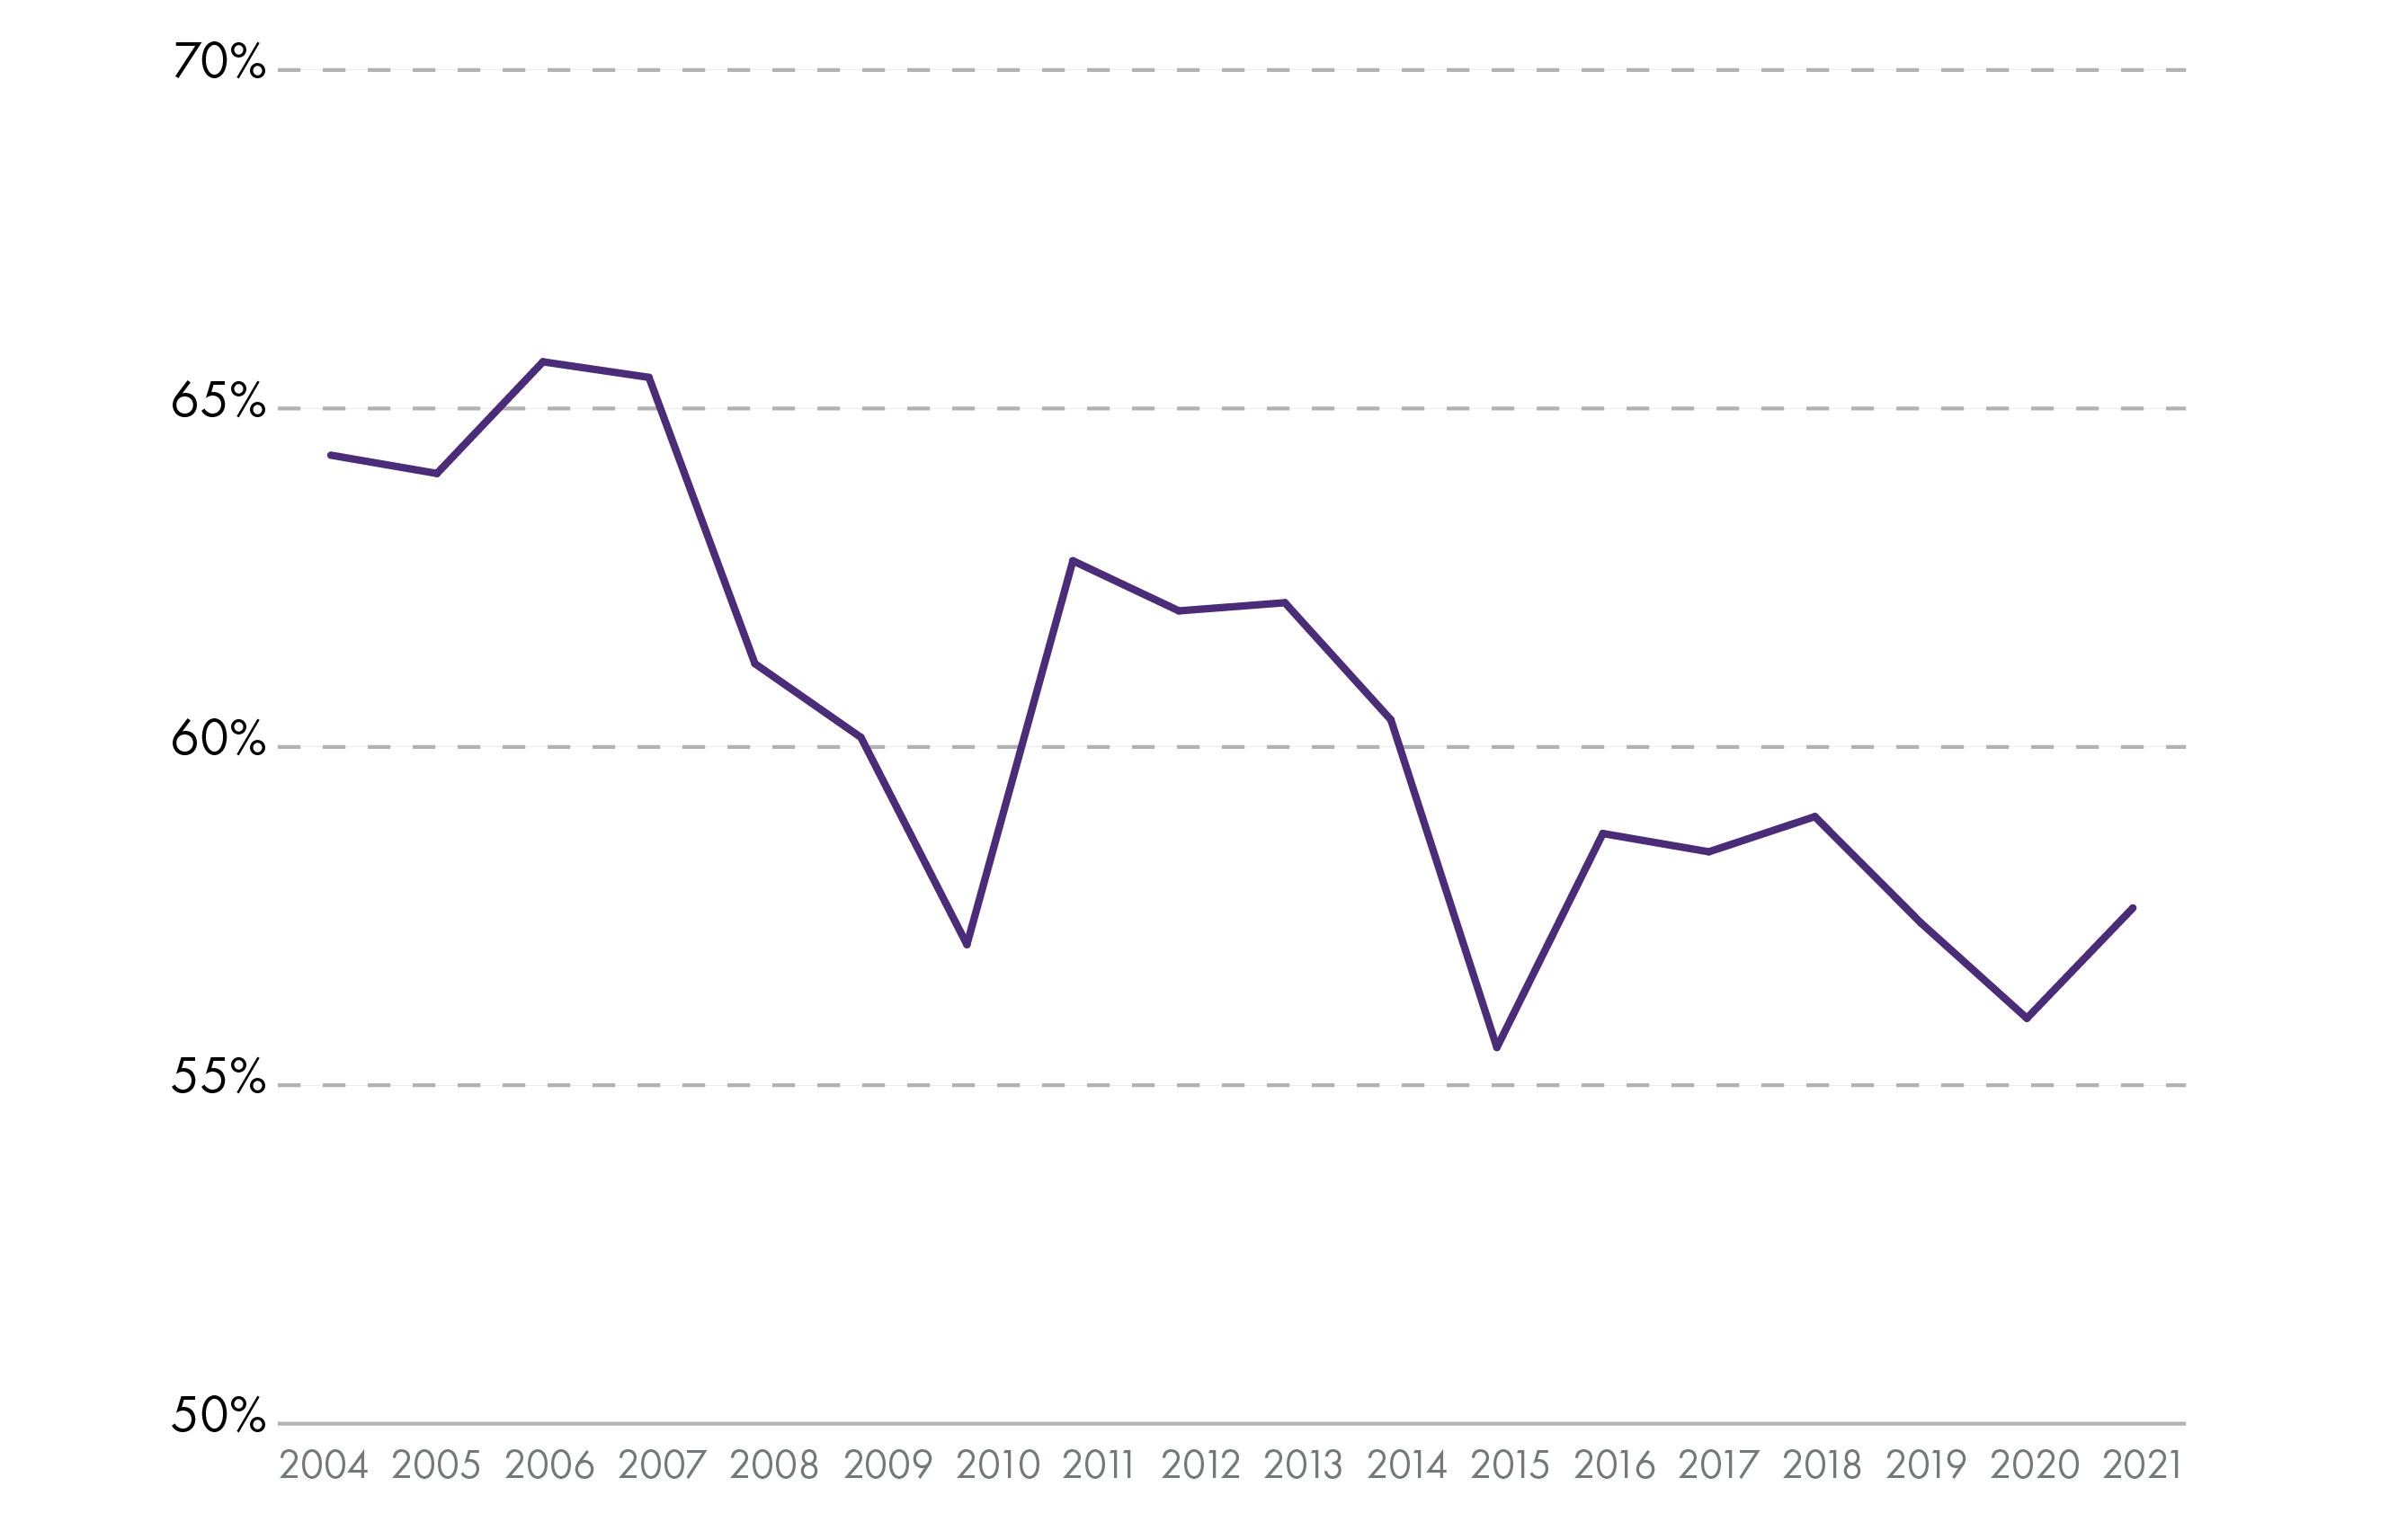
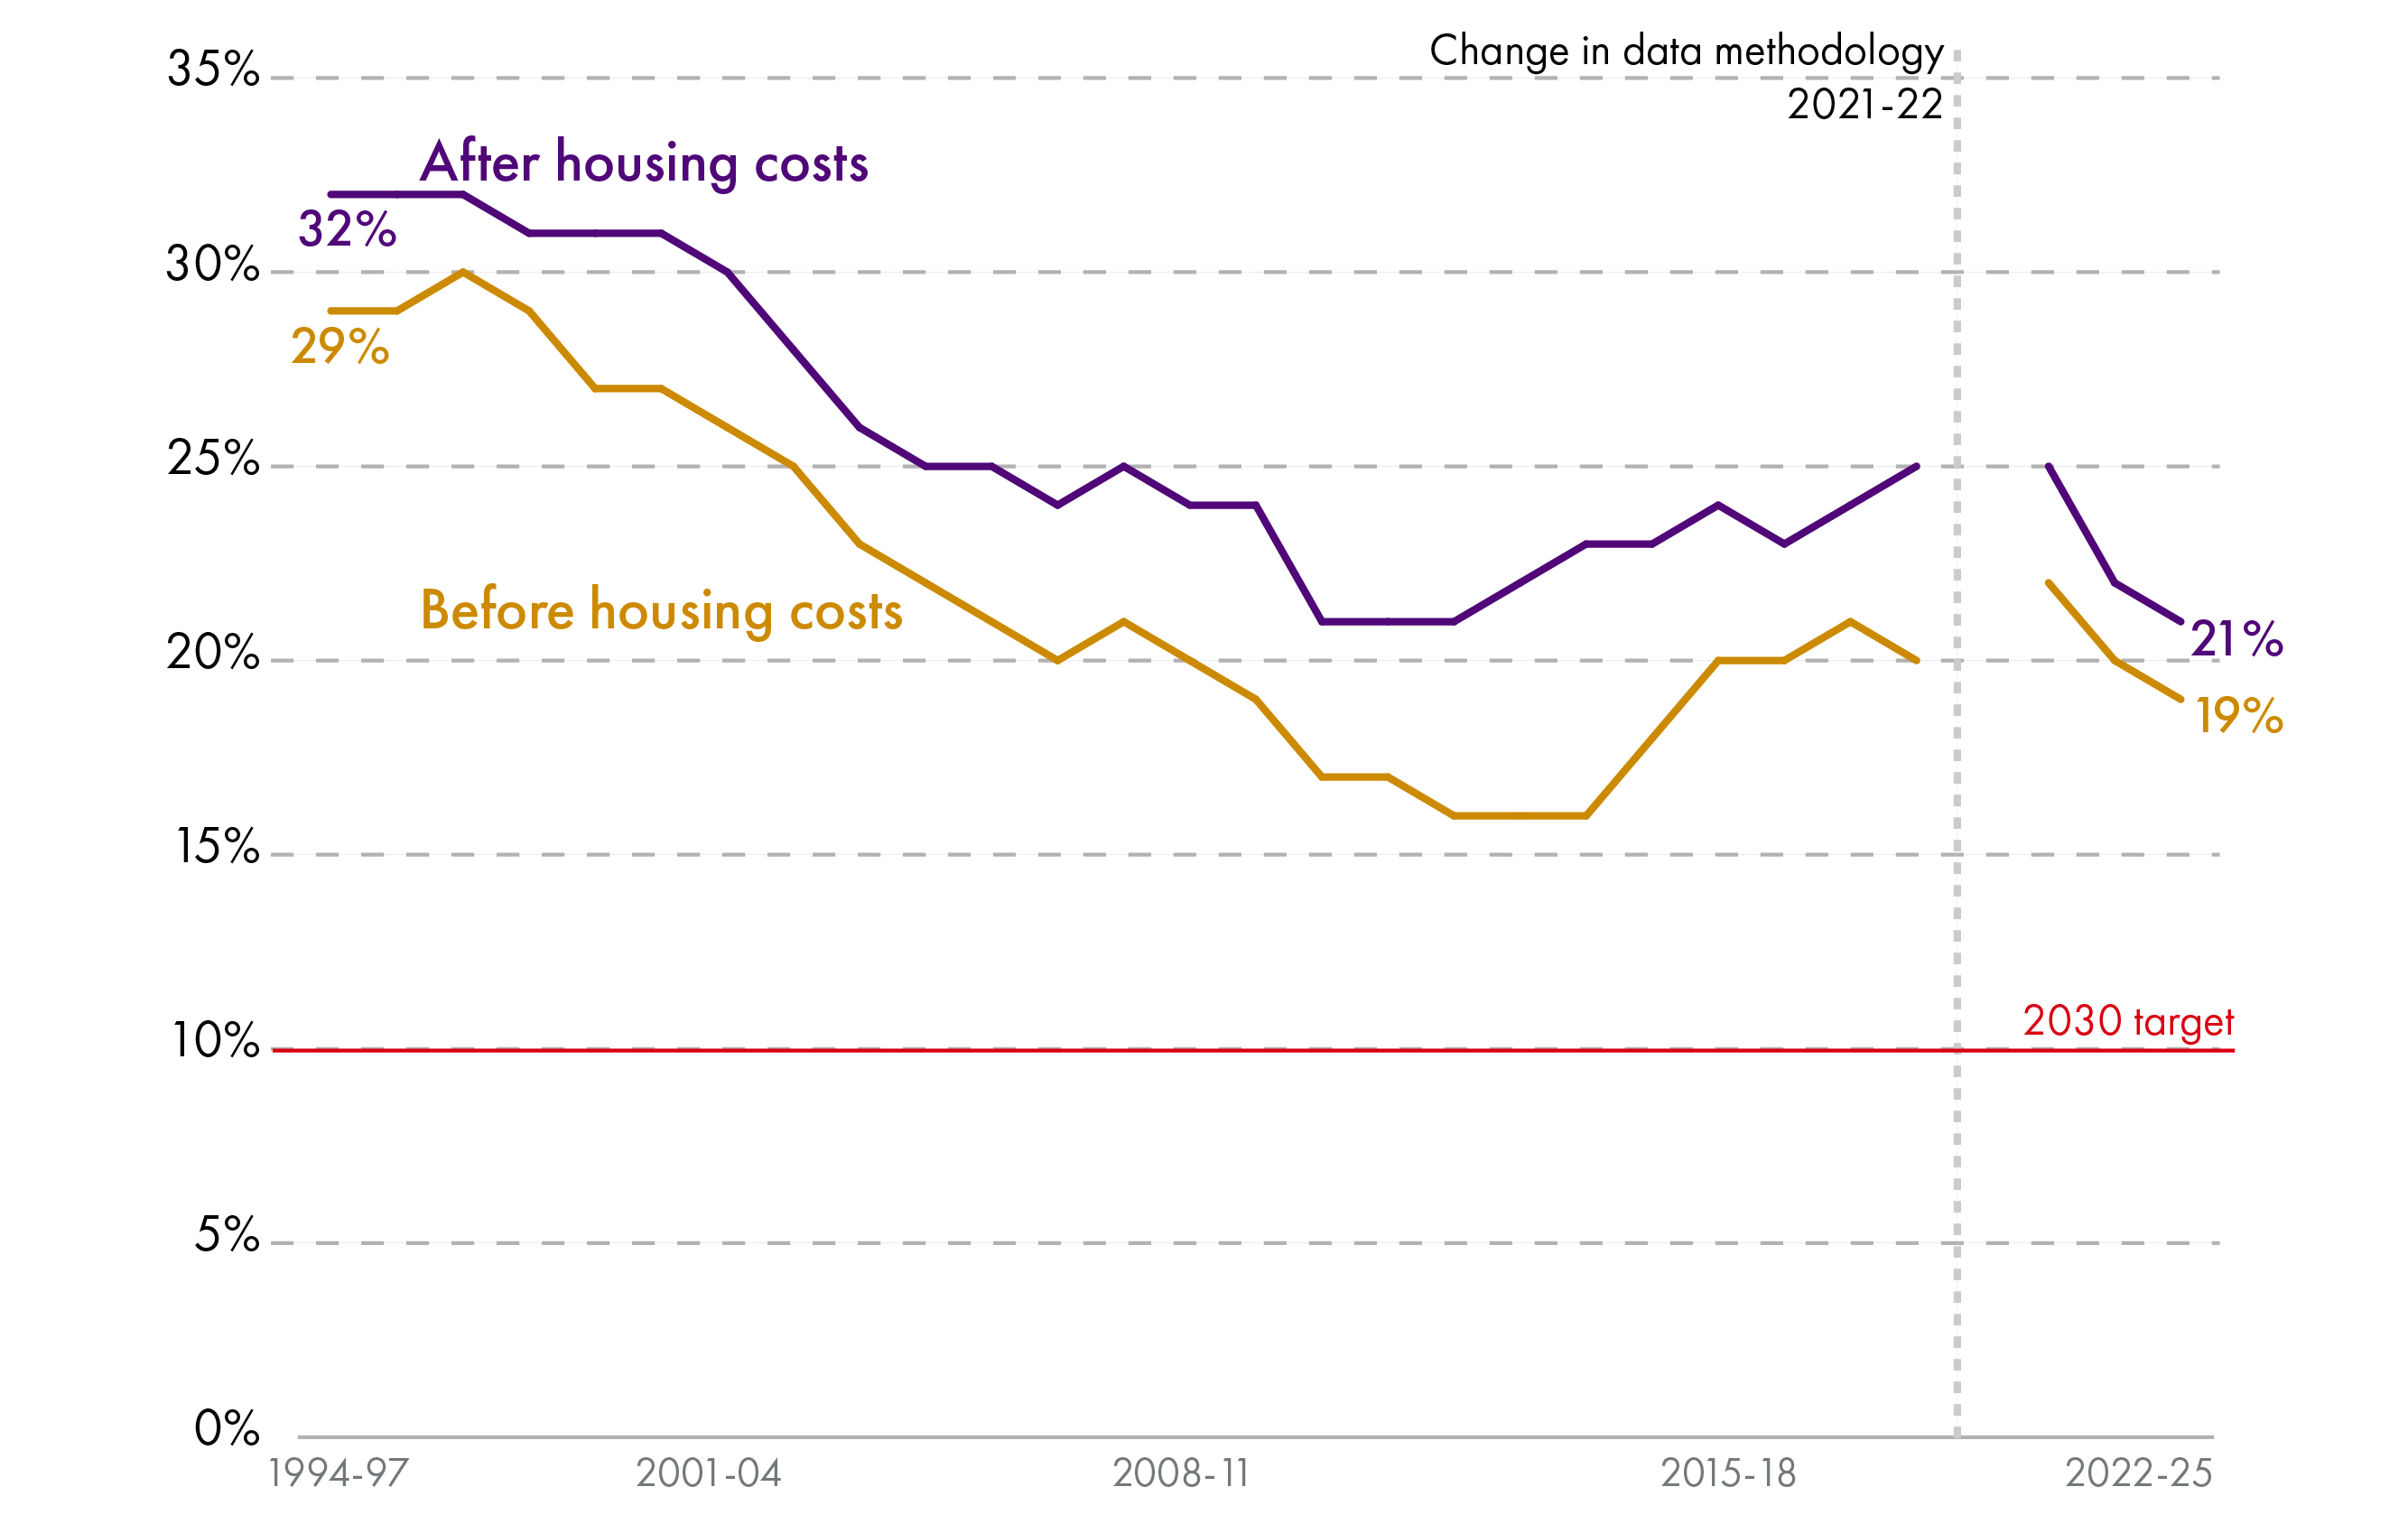
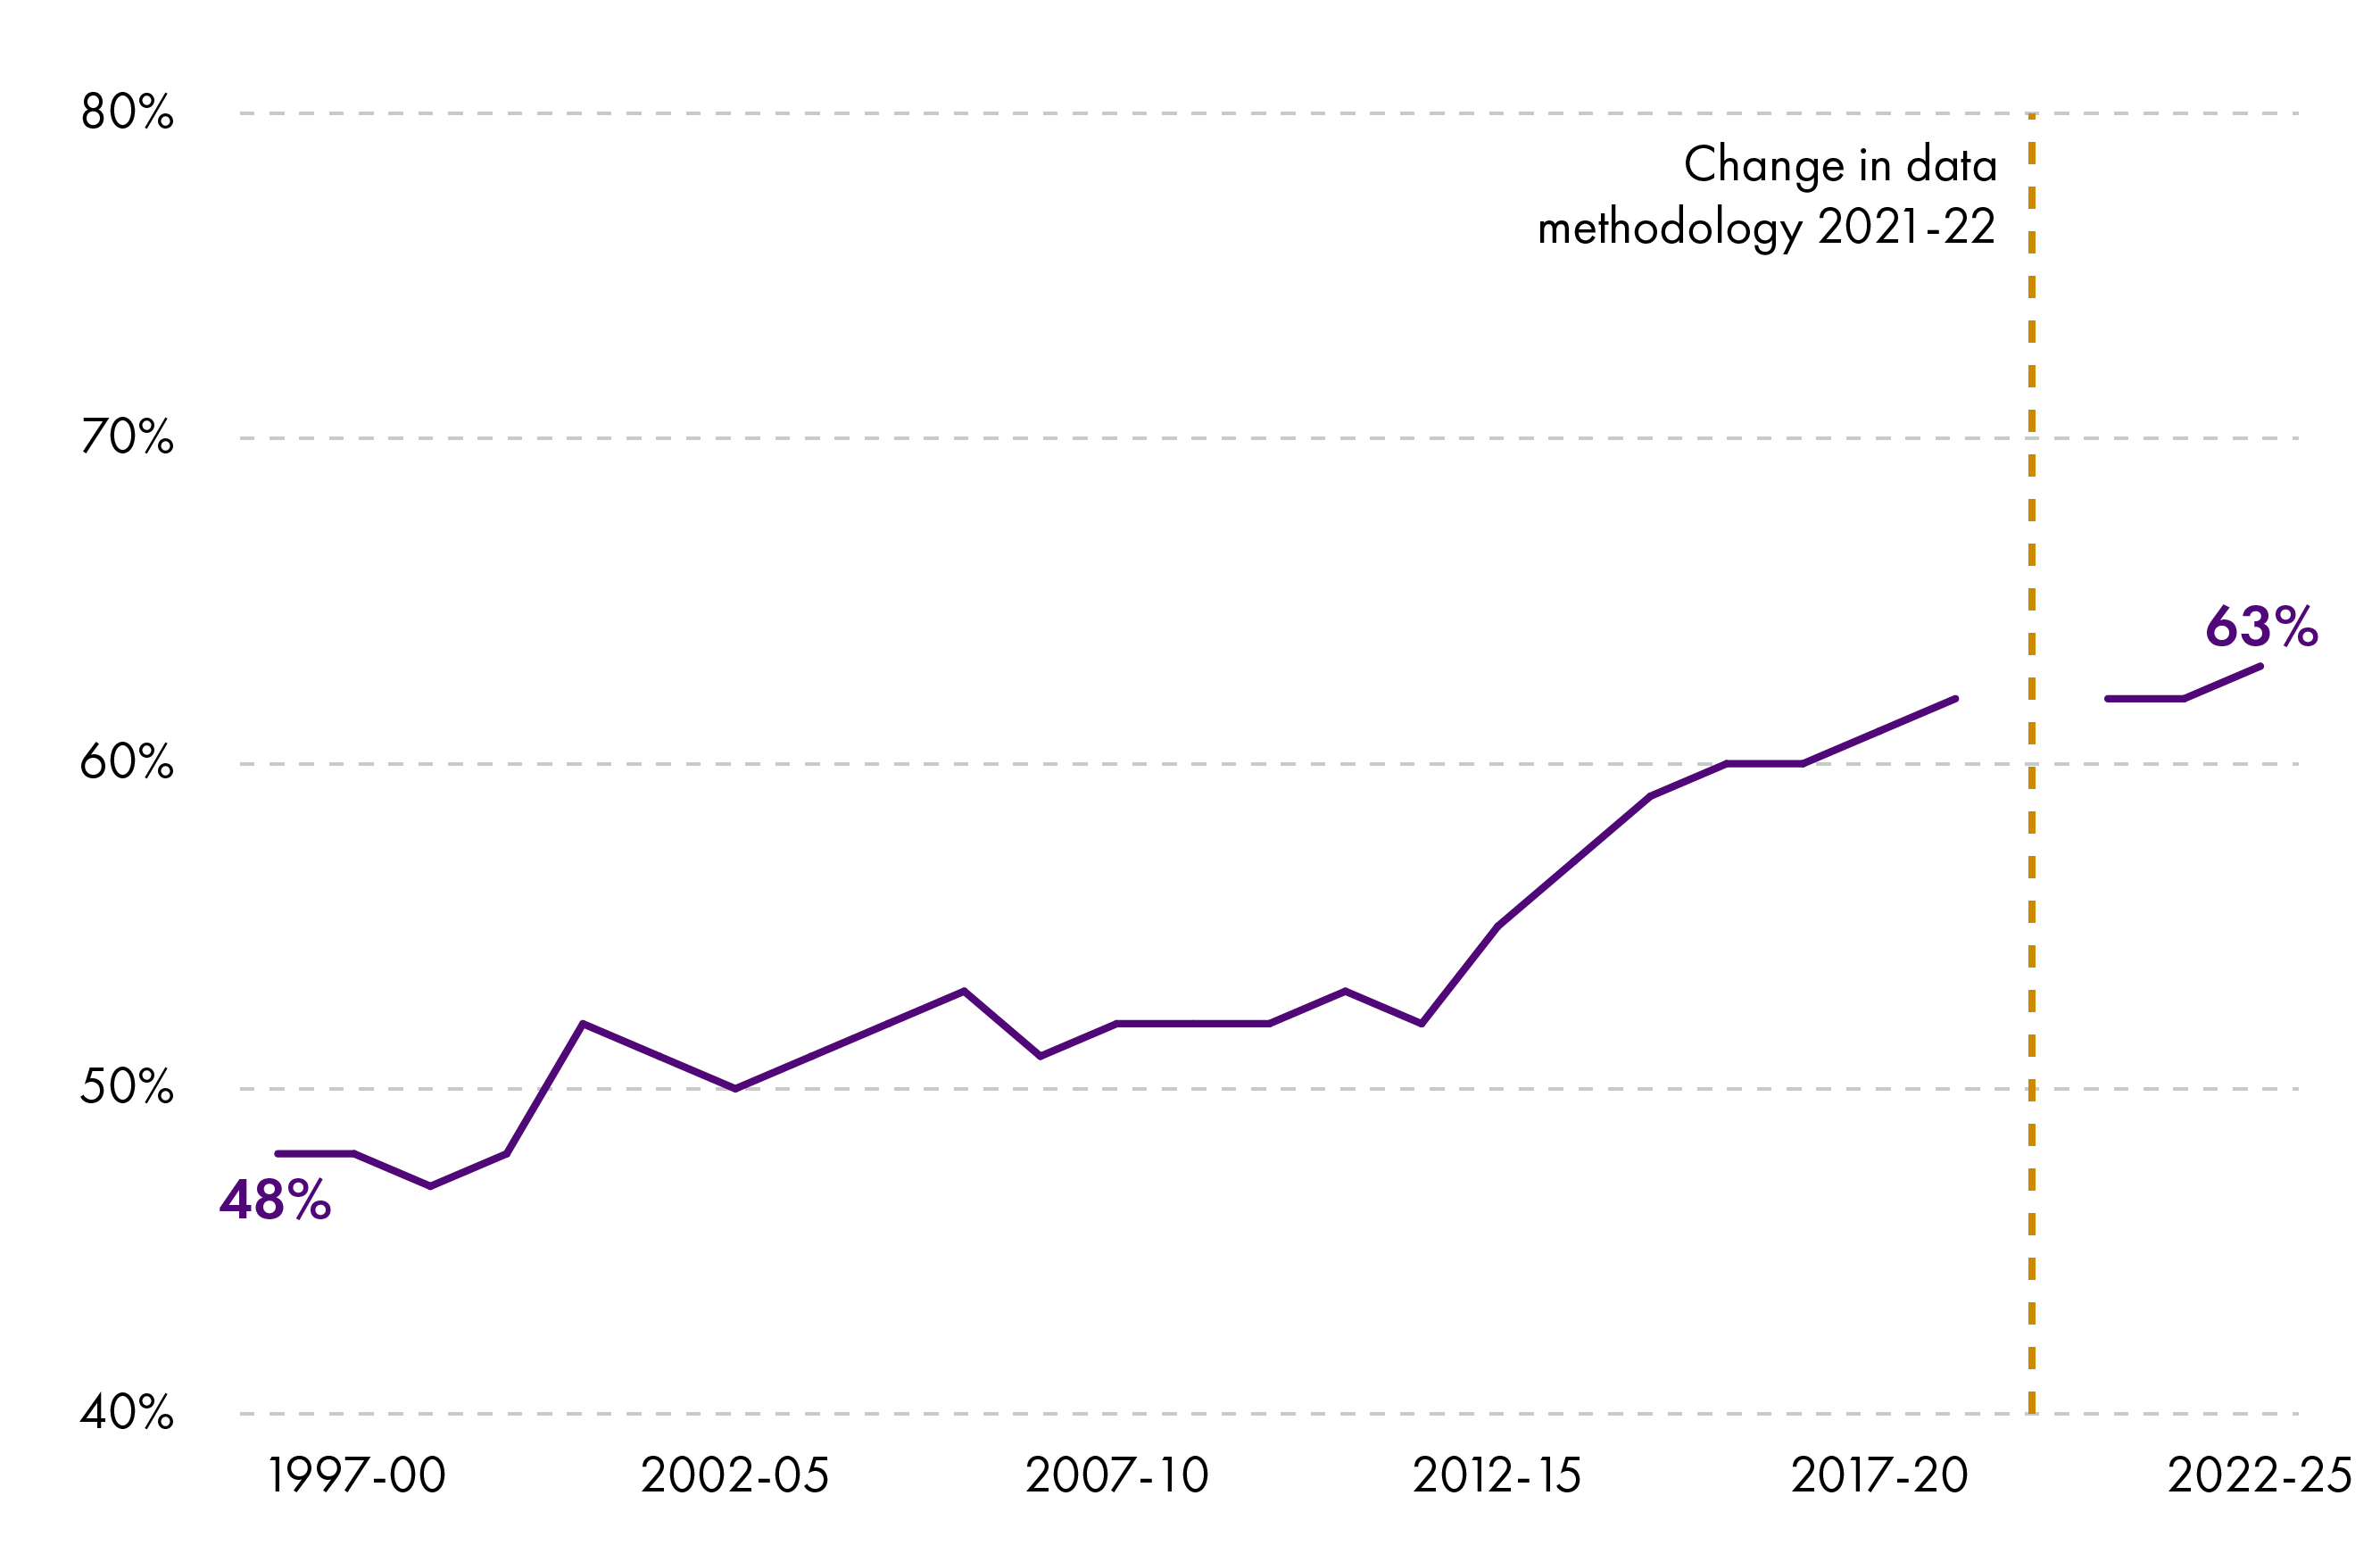
Scotland's Gini coefficient has fluctuated around similar levels since the 1990s and is on a downward trend post-pandemic.
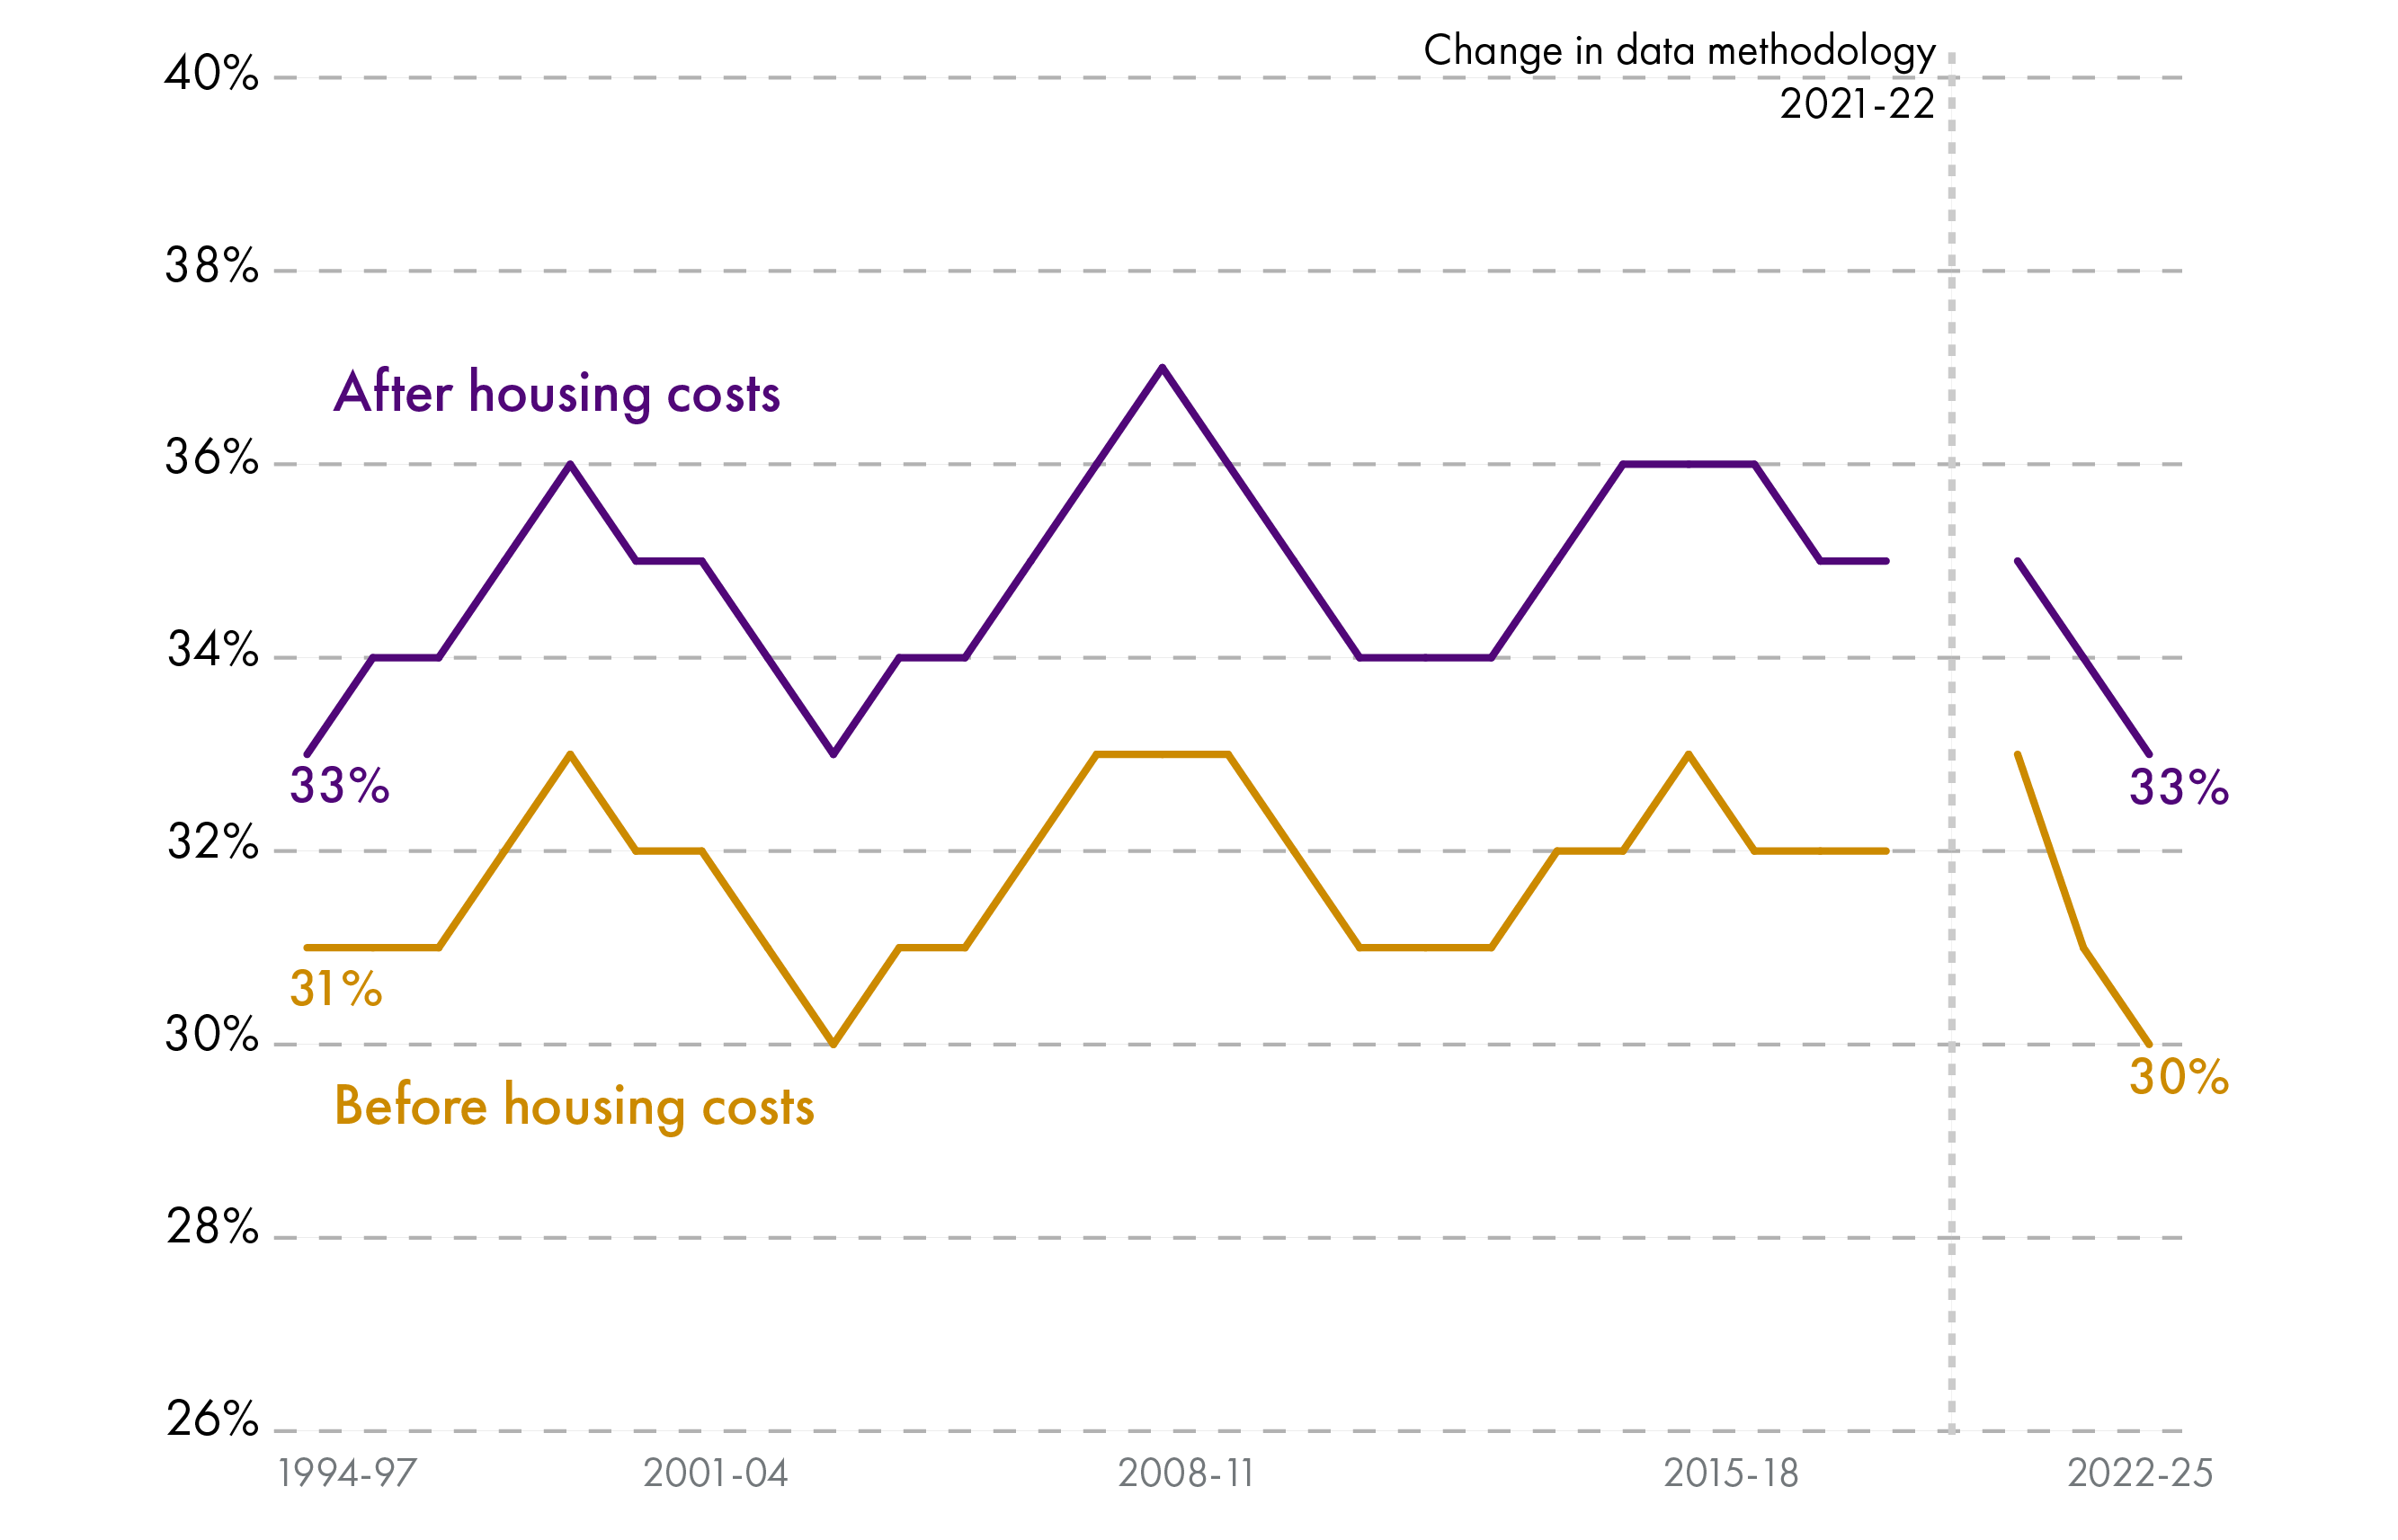
Note: There is a break in the data for 2019-22. This is due to a change in methodology in 2021-22, in which administrative data from DWP was linked with survey data. More information is available inthis House of Commons Library briefing on income inequality in the UK.
Statistics on the Gini index are presented over three-year cycles.
Scotland’s Gini coefficient is higher after housing costs. This is because housing costs make up a proportionately higher share of income for lower-income households.
Overall, the Gini coefficient has fluctuated around similar levels since at least the 1990s. However, it has fallen since the Covid-19 pandemic. In 2022-25, Scotland’s Gini coefficient after housing costs was 33%; before housing costs it was 30%. This is the lowest on record.
It is too soon to tell whether this the start of a structural decrease in income inequality or a cyclical trend that will shortly be reversed.
It is also worth noting that a change in data methodology in 2021-22 might explain some of the apparent reduction in the Gini coefficient post-pandemic.
For context, Scotland’s Gini coefficient of income inequality would place it in the third quartile of EU countries (with the first quartile being the most unequal and the fourth being the most equal).1
The UK’s most recent Gini coefficient (2024-25) was 37% after housing costs and 33% before housing costs. This would place the UK in the second quartile of income inequality of EU countries.
Wealth inequality
Household wealth in a key determinant of living standards. People use their wealth as a source of finance, to invest in opportunities like education and entrepreneurship, and as a buffer against emergencies.
Surveys of household wealth show that wealth inequality in Scotland is far higher than income inequality.
The latest results from the ONS’ Wealth and Assets Survey are for 2020-2022.
A typical household in the wealthiest 10% of households had £1.3 million in total wealth, whereas a typical household in the least wealthy 10% of households had £7,600.
The 2% of households with the highest incomes had 10% of all income, while the wealthiest 2% of households had 15% of all wealth.
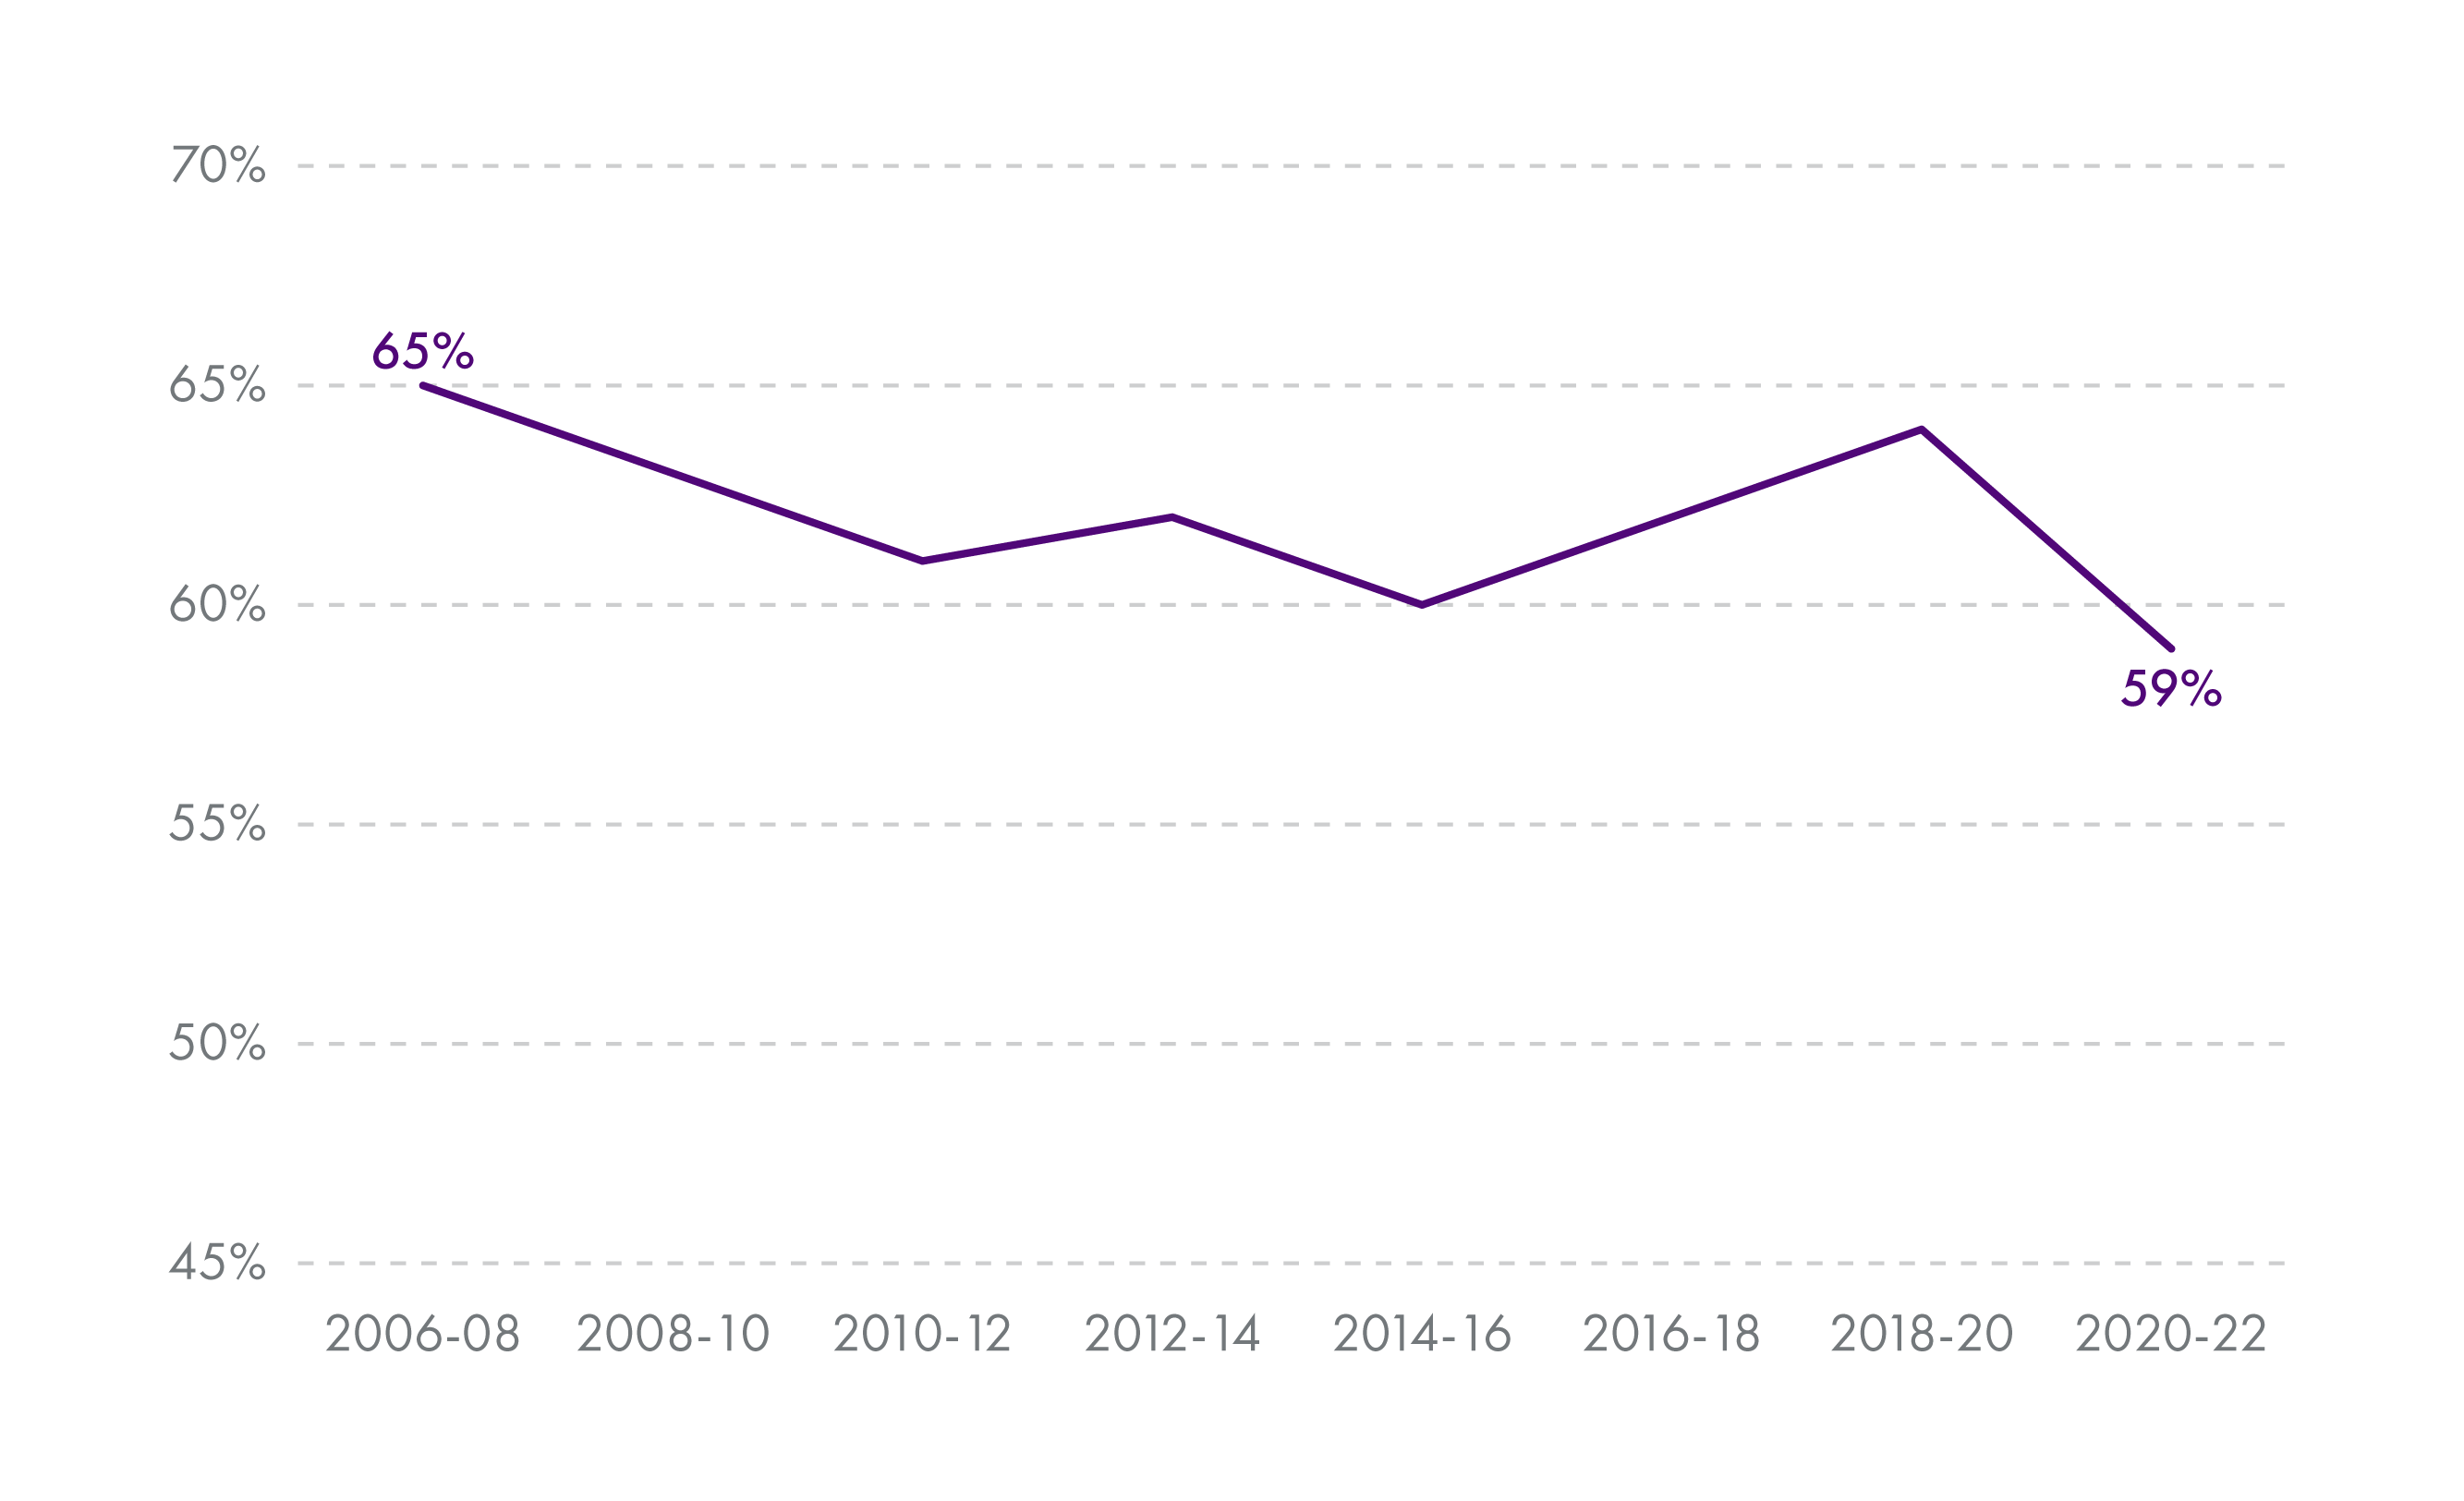
In terms of how wealth inequality has changed over time, the Gini coefficient has been relatively stable in Scotland since the survey began in the mid-2000s.
For context, Scotland’s Gini coefficient of wealth inequality would place it in the third quartile of EU countries (with the first quartile being the most unequal and the fourth being the most equal).1
Scotland's Gini coefficient of wealth inequality has remained between 60% and 65% since at least the mid-2000s. It fell to 59% in 2020-22.
Although headline measures of wealth inequality have been relatively stable, this masks an important underlying trend.
Over recent decades and particularly since the late 1980s, it has become harder for low-income households to accumulate wealth. Inherited wealth has become a more important determinant of living standards.2
This is driven by an increase in net household wealth as a share of GDP, which has almost doubled in the UK since 1991.3
With wealth and asset values rising faster than wages, it has become relatively more difficult to convert income into wealth.
Most people’s experience of this trend is in the housing market. House prices have risen faster than wages, which has pushed up net household wealth for those who own property. However, this trend has also made it relatively more difficult for those who don’t inherit wealth to get on the property ladder.
Poverty
Poverty can broadly be defined as a lack of sufficient resources to achieve a minimum acceptable standard of living.
Leaving aside moral and ethical reasons, economic arguments for reducing poverty are centred around the benefits from investing in human capital. These can include a more skilled workforce, higher productivity and innovation, and lower demands on state spending
There is no single way of measuring poverty.
This section presents some statistics on poverty in Scotland. First, it outlines some concepts in how poverty is measured.
Absolute poverty defines poverty using a fixed threshold. People are considered to be in poverty if their income falls below a threshold required to meet basic needs. It focuses on whether individuals can achieve a minimum standard of living.
However, as economies change over time, people’s perception of a minimum acceptable standard of living tends to change too. Fixed thresholds used to measure absolute poverty can therefore become out of date.
For this reason, relative poverty is also used as a headline measure of poverty, particularly in advanced economies. It defines poverty in relation to typical incomes in an economy. Measures of relative poverty reflect how far people fall behind average living standards and whether they can participate fully in normal social and economic life.
Effectively, relative poverty thresholds are just absolute poverty thresholds that change over time.
In official Scottish Government statistics, relative poverty is defined as living in a household with income below 60% of the UK median in the same year. Absolute poverty is defined as income below 60% of the UK median in a fixed reference year (2024-25), adjusted for inflation.
Poverty statistics are typically presented before and after housing costs. Housing costs significantly affect disposable income and living standards, particularly given that they make up a larger share of low-income households’ income.
Poverty statistics are based on equivalised income. This takes households’ income and adjusts it to reflect differences in household size and composition. This recognises that larger households require a different level of income to achieve the same standard of living as smaller households.
Official statistics on poverty usually average household incomes over three years to reduce sampling volatility in surveys.
Changes to poverty income data
Poverty statistics are compiled using household surveys, which includes questions about a household’s income. This includes different sources of income, such as wages and social security benefits.
However, survey respondents sometimes under-report their income from social security benefits. They might, for example, not be aware of the exact amount they receive.
To address this, the UK Government’s Department for Work and Pensions (DWP) has linked administrative data on social security payments to survey data used to compile poverty statistics. The result is more accurate statistics that are less reliant on survey respondents self-reporting income from social security benefits. However, this only applies to UK Government-administered social security benefits, meaning that incomes in Scotland are likely to be slightly under-reported, as some social security benefits are administered by the Scottish Government.
This change was introduced in 2024-25 but retrospectively applied to data going back to 2021-22. For this reason, statistics are not directly comparable before 2021-22. Furthermore, the reference year for absolute poverty levels has changed from 60% of the median income in 2010-11 to 60% of the median income in 2024-25.
Poverty across the whole population
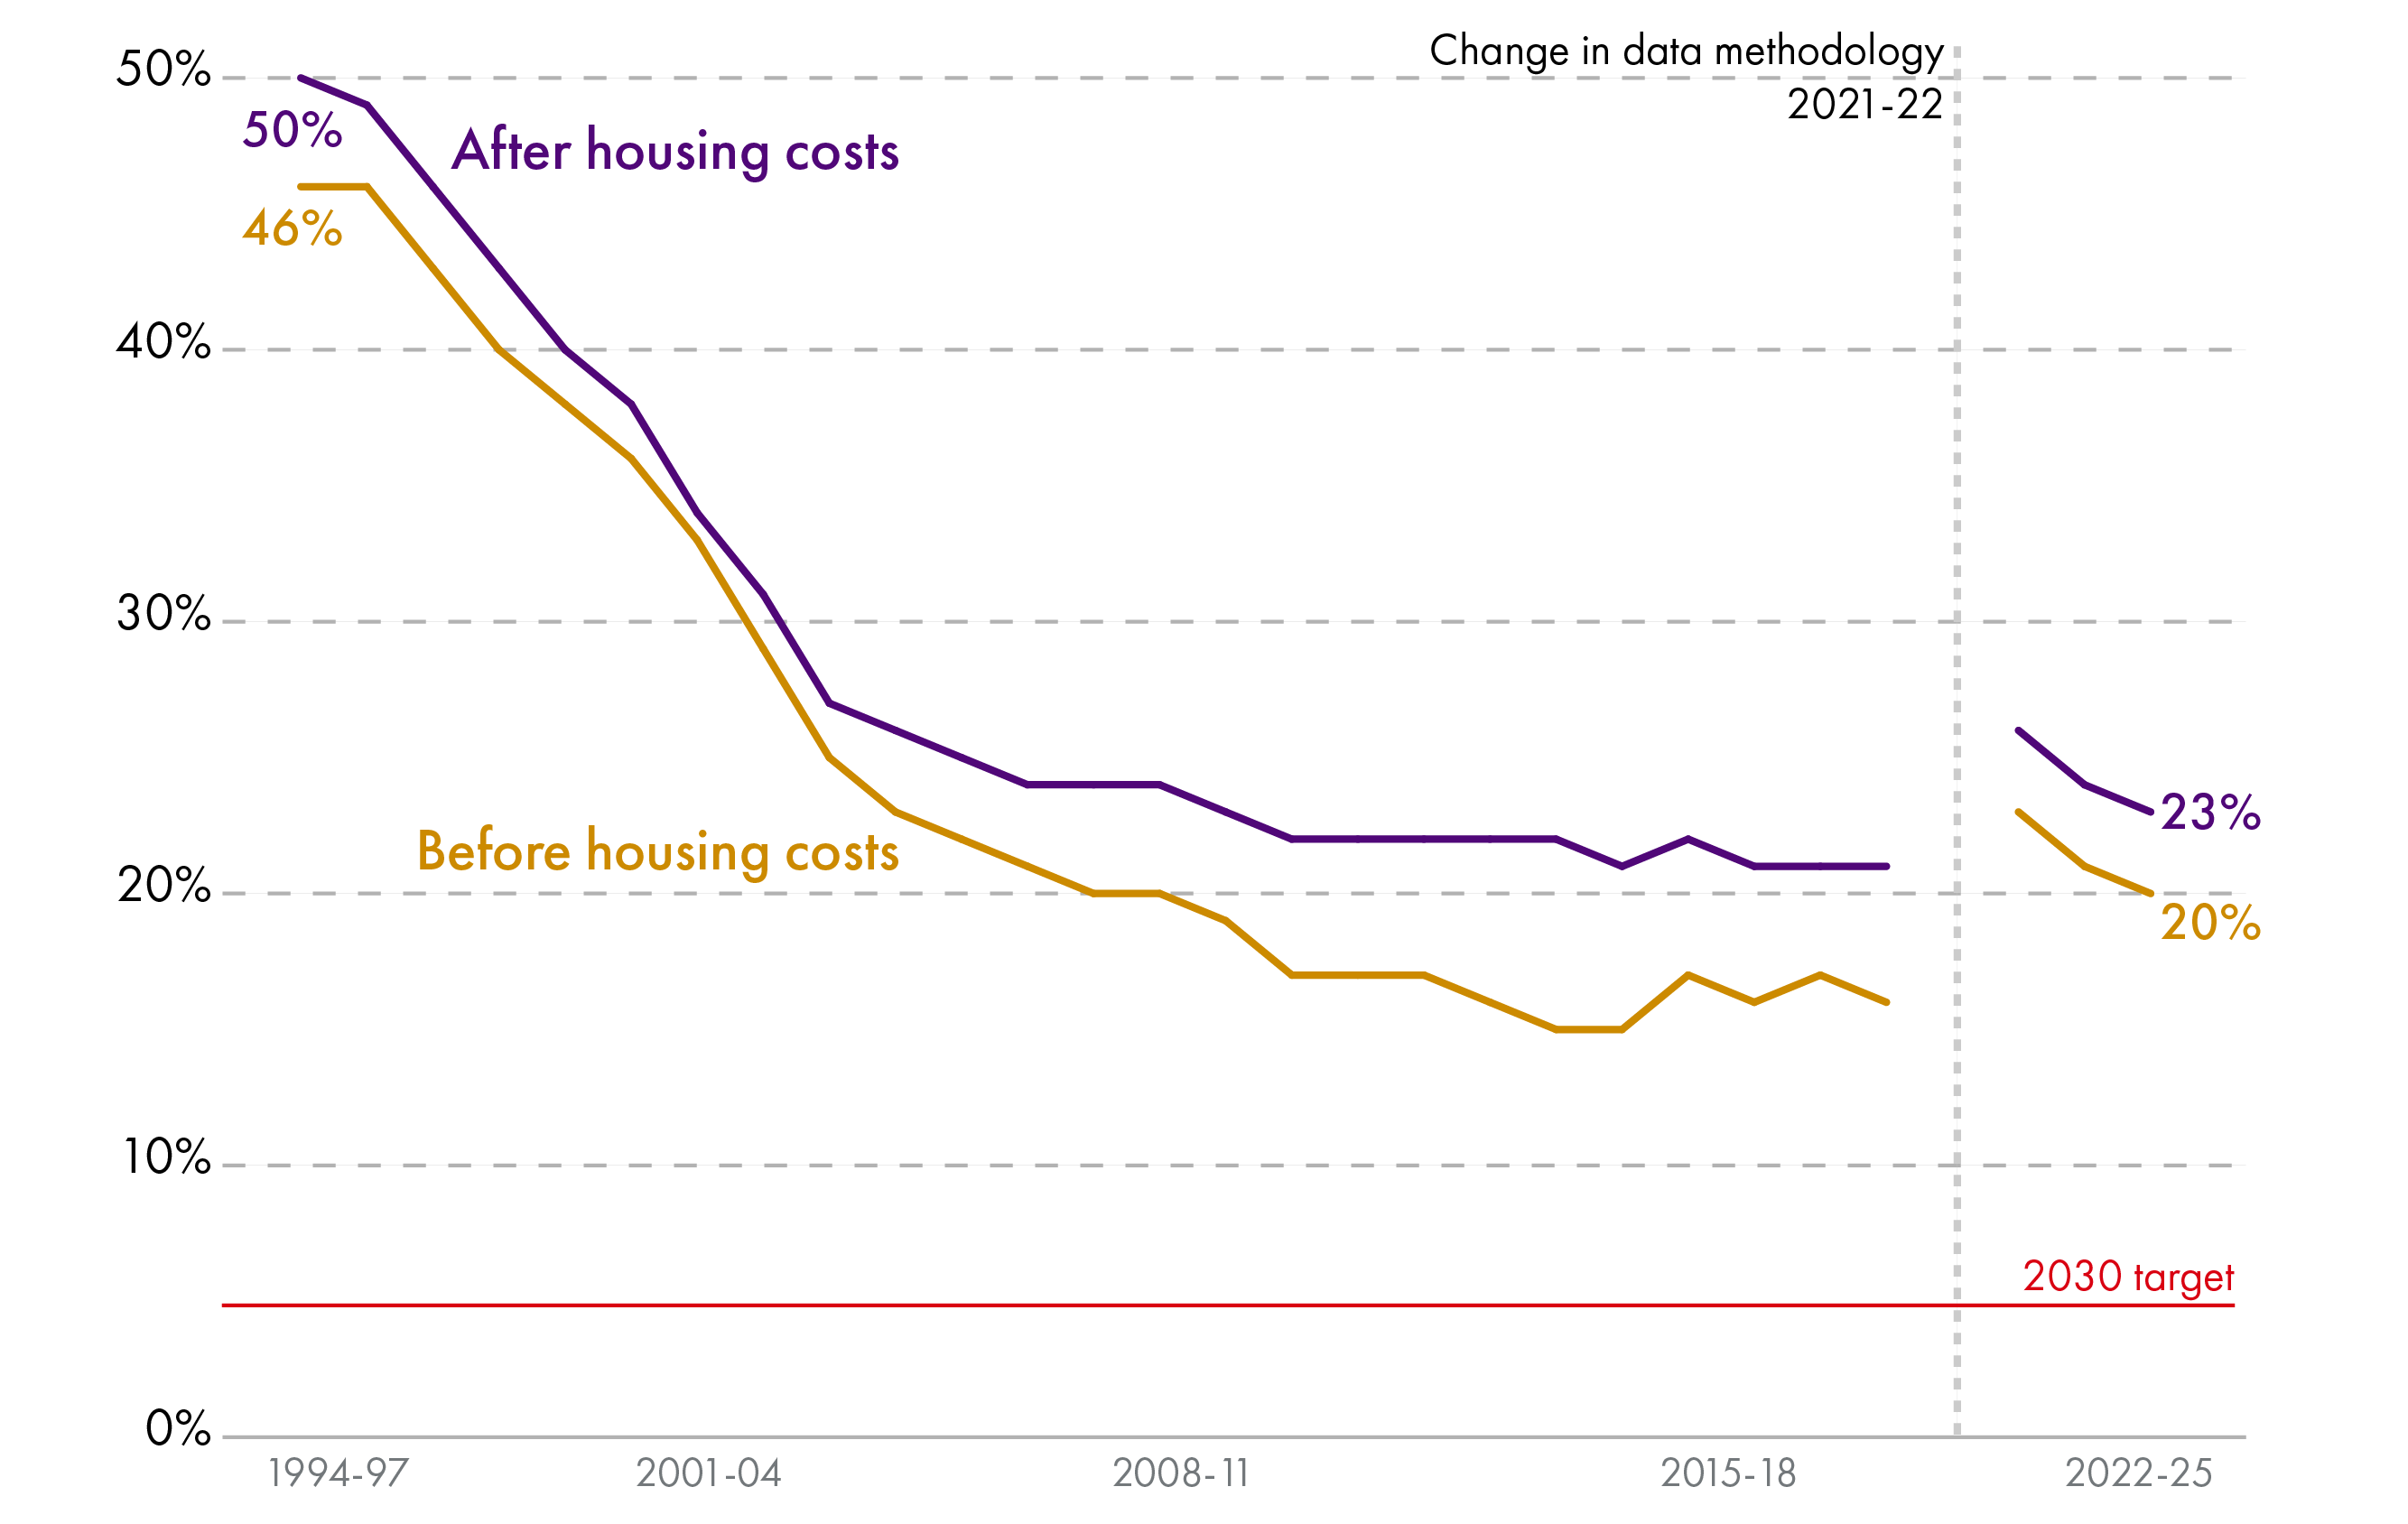
The proportion of people living in absolute poverty after housing costs in Scotland fell by more than half between 1994-97 (39%) and 2018-21 (17%). The most recent absolute poverty rate (using the new reference year of 2024-25 – see box) was 18% in 2022-25.
The proportion of people living in relative poverty after housing costs has remained broadly stable between the mid-1990s and early 2020s, at around 20%. There are signs that this is starting to fall, with the most recent relative poverty rate being 17%.1
Child poverty
Child poverty has a unique dimension in that its impacts on those affected can be lifelong.
The Child Poverty (Scotland) Act 2017 introduced statutory targets to significantly reduce child poverty in Scotland by 2030.
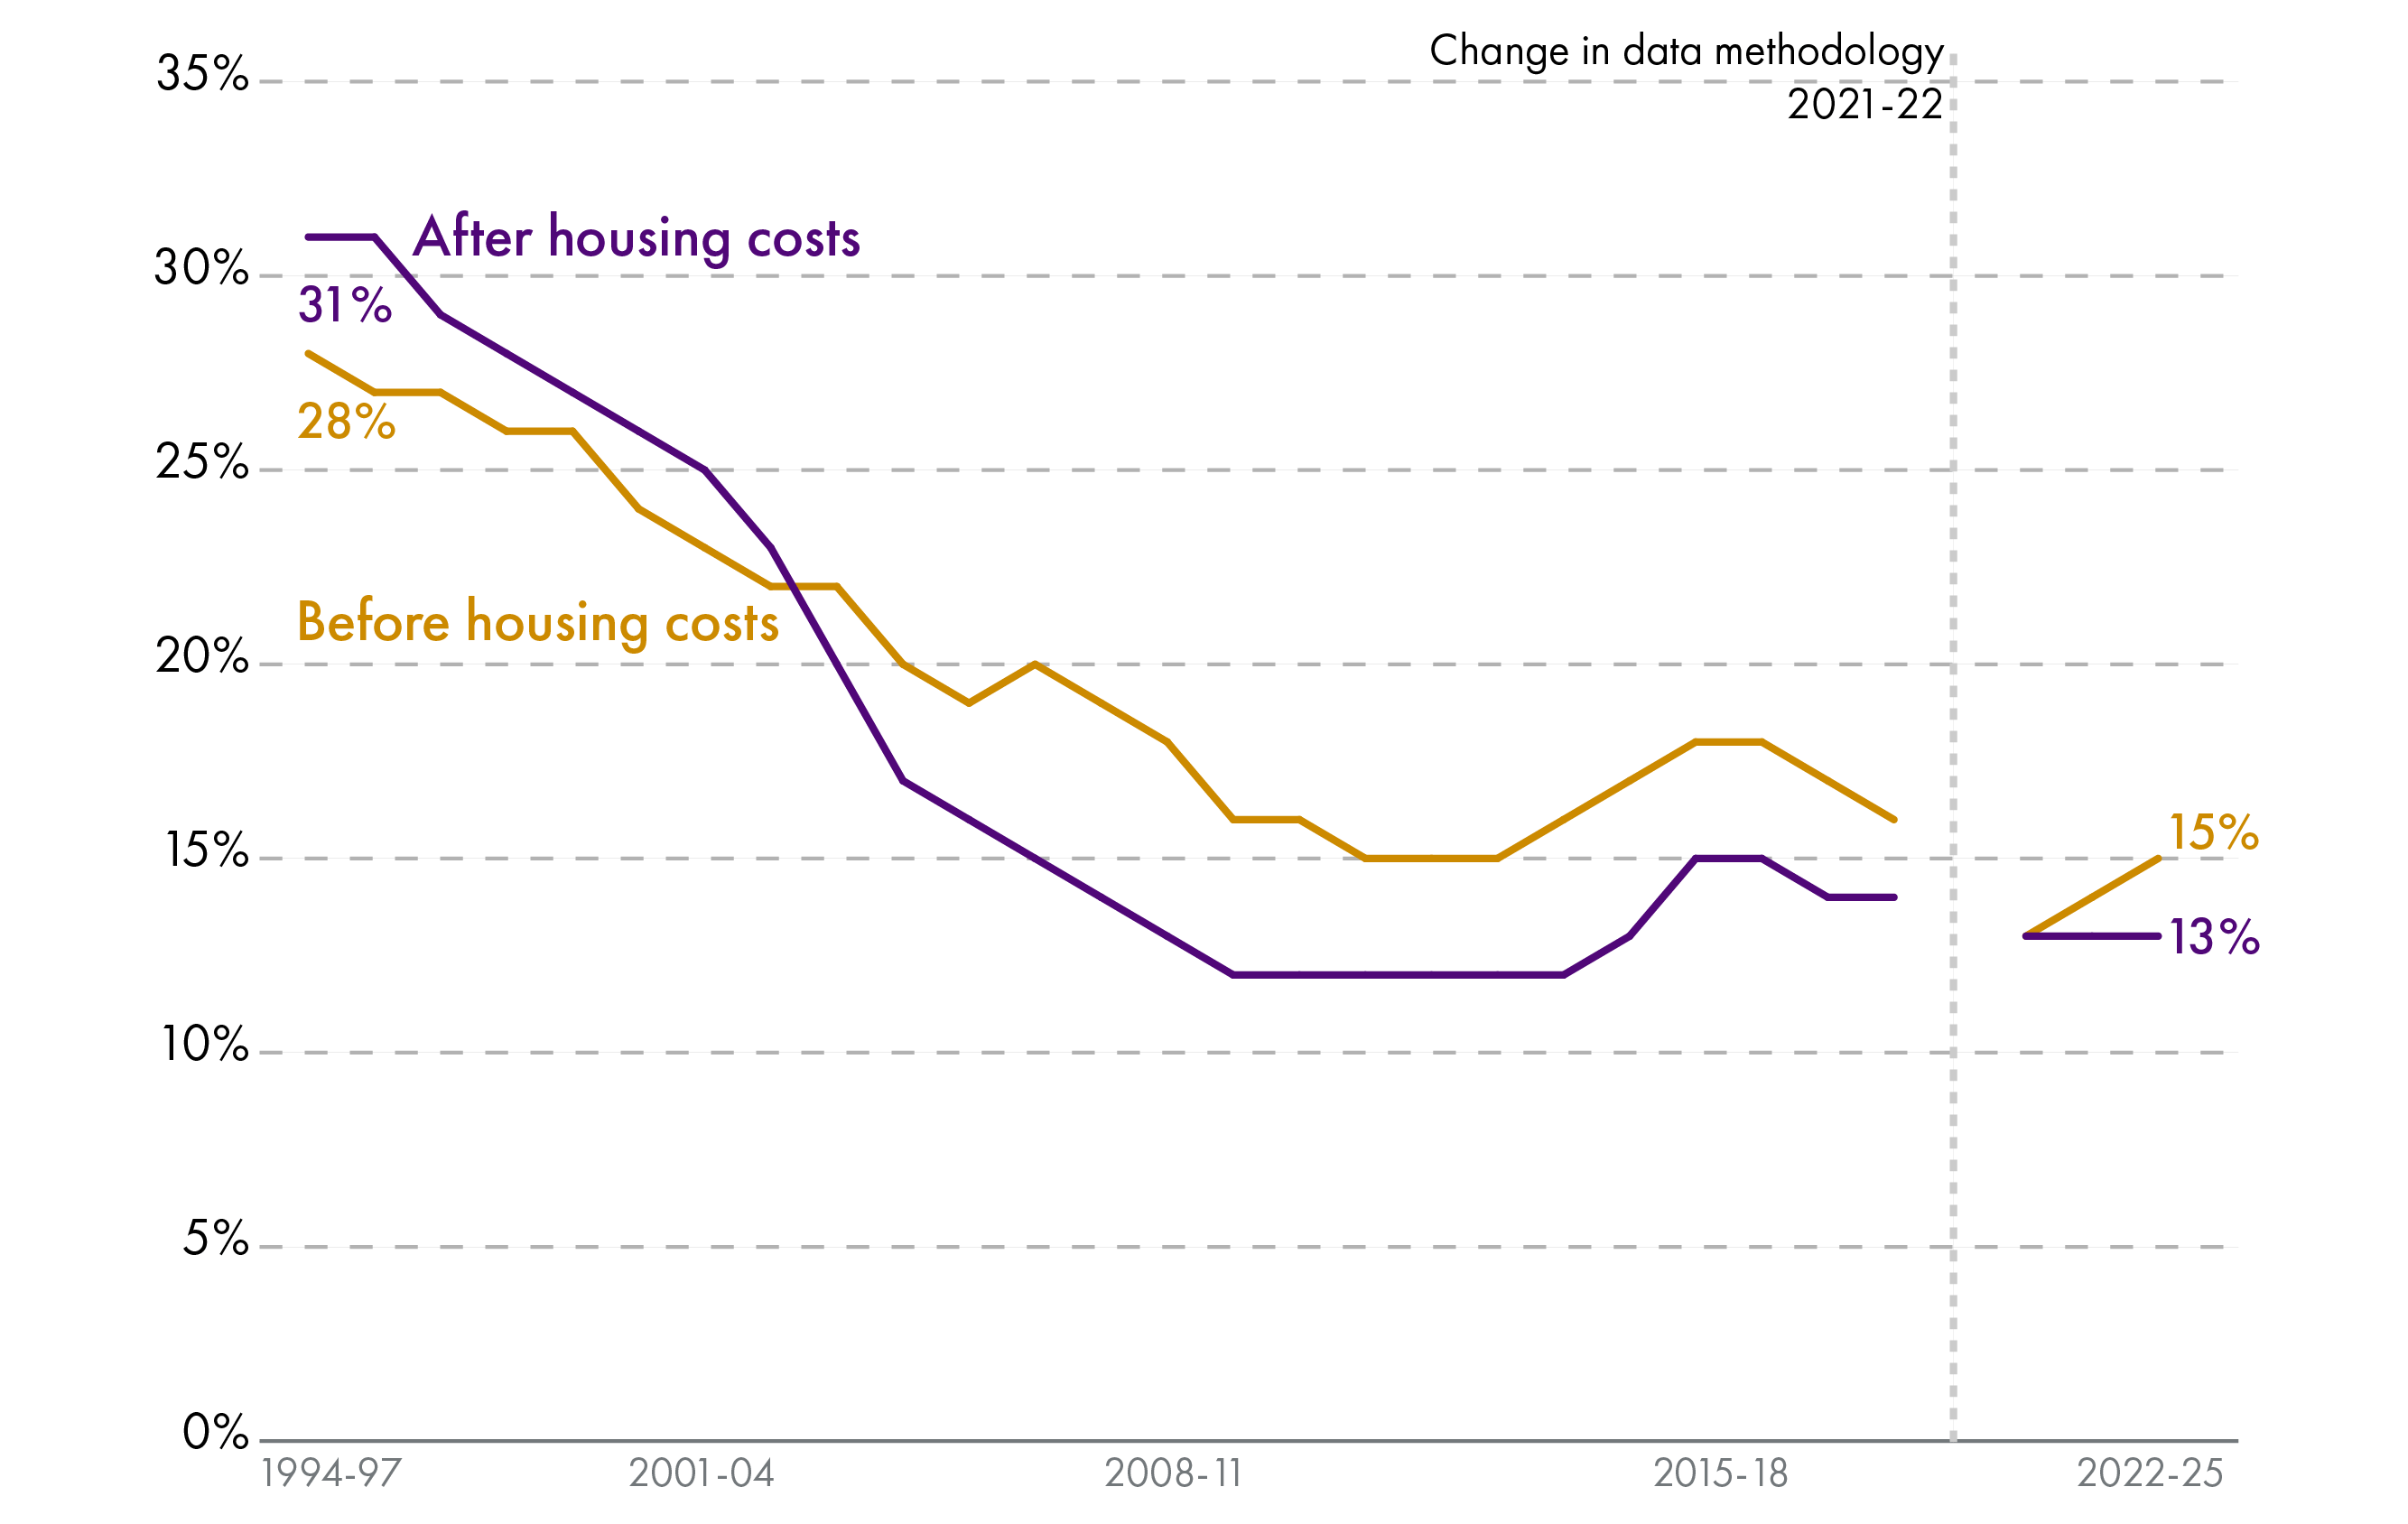
Child poverty is one area where the impact of devolved policy choices is making a notable difference. Child poverty in Scotland has been falling in the early 2020s. Evidence shows that the Scottish Child Payment is a key driver of this. The Scottish Child Payment is a devolved social security payment given to parents or carers of children under 16 who receive certain low‑income benefits, such as Universal Credit.
There is a clear gap between Scotland’s child poverty rate and the UK’s. The UK’s relative child poverty rate after housing costs 2022-25 was 28%.1 This compares with 21% in Scotland. The Institute for Fiscal Studies has noted that lower housing costs and devolved social security policy play a key role in this difference.2
However, analysis by the Fraser of Allander Institute also shows that meeting the statutory 2030 targets on child poverty will require significantly higher social security spending in Session 7. This is the case even if low-income parents’ employment outcomes improve.
Households with some characteristics are more at risk of poverty than others. For this reason, the Session 6 Scottish Government identified six ‘priority family types’ in its Tackling Child Poverty Delivery Plan. It says that 90% of all children living in poverty in Scotland live in one of these family types:
Long parent families
Minority ethnic families
Families with a disabled person
Families with younger mothers <25
Families with a child under 1
Families with 3+ children
Pensioner poverty
Pensioner poverty has a unique dimension in that pensioners are typically not in the labour market and therefore have limited scope to increase income. This can make those affected vulnerable to sustained poverty.
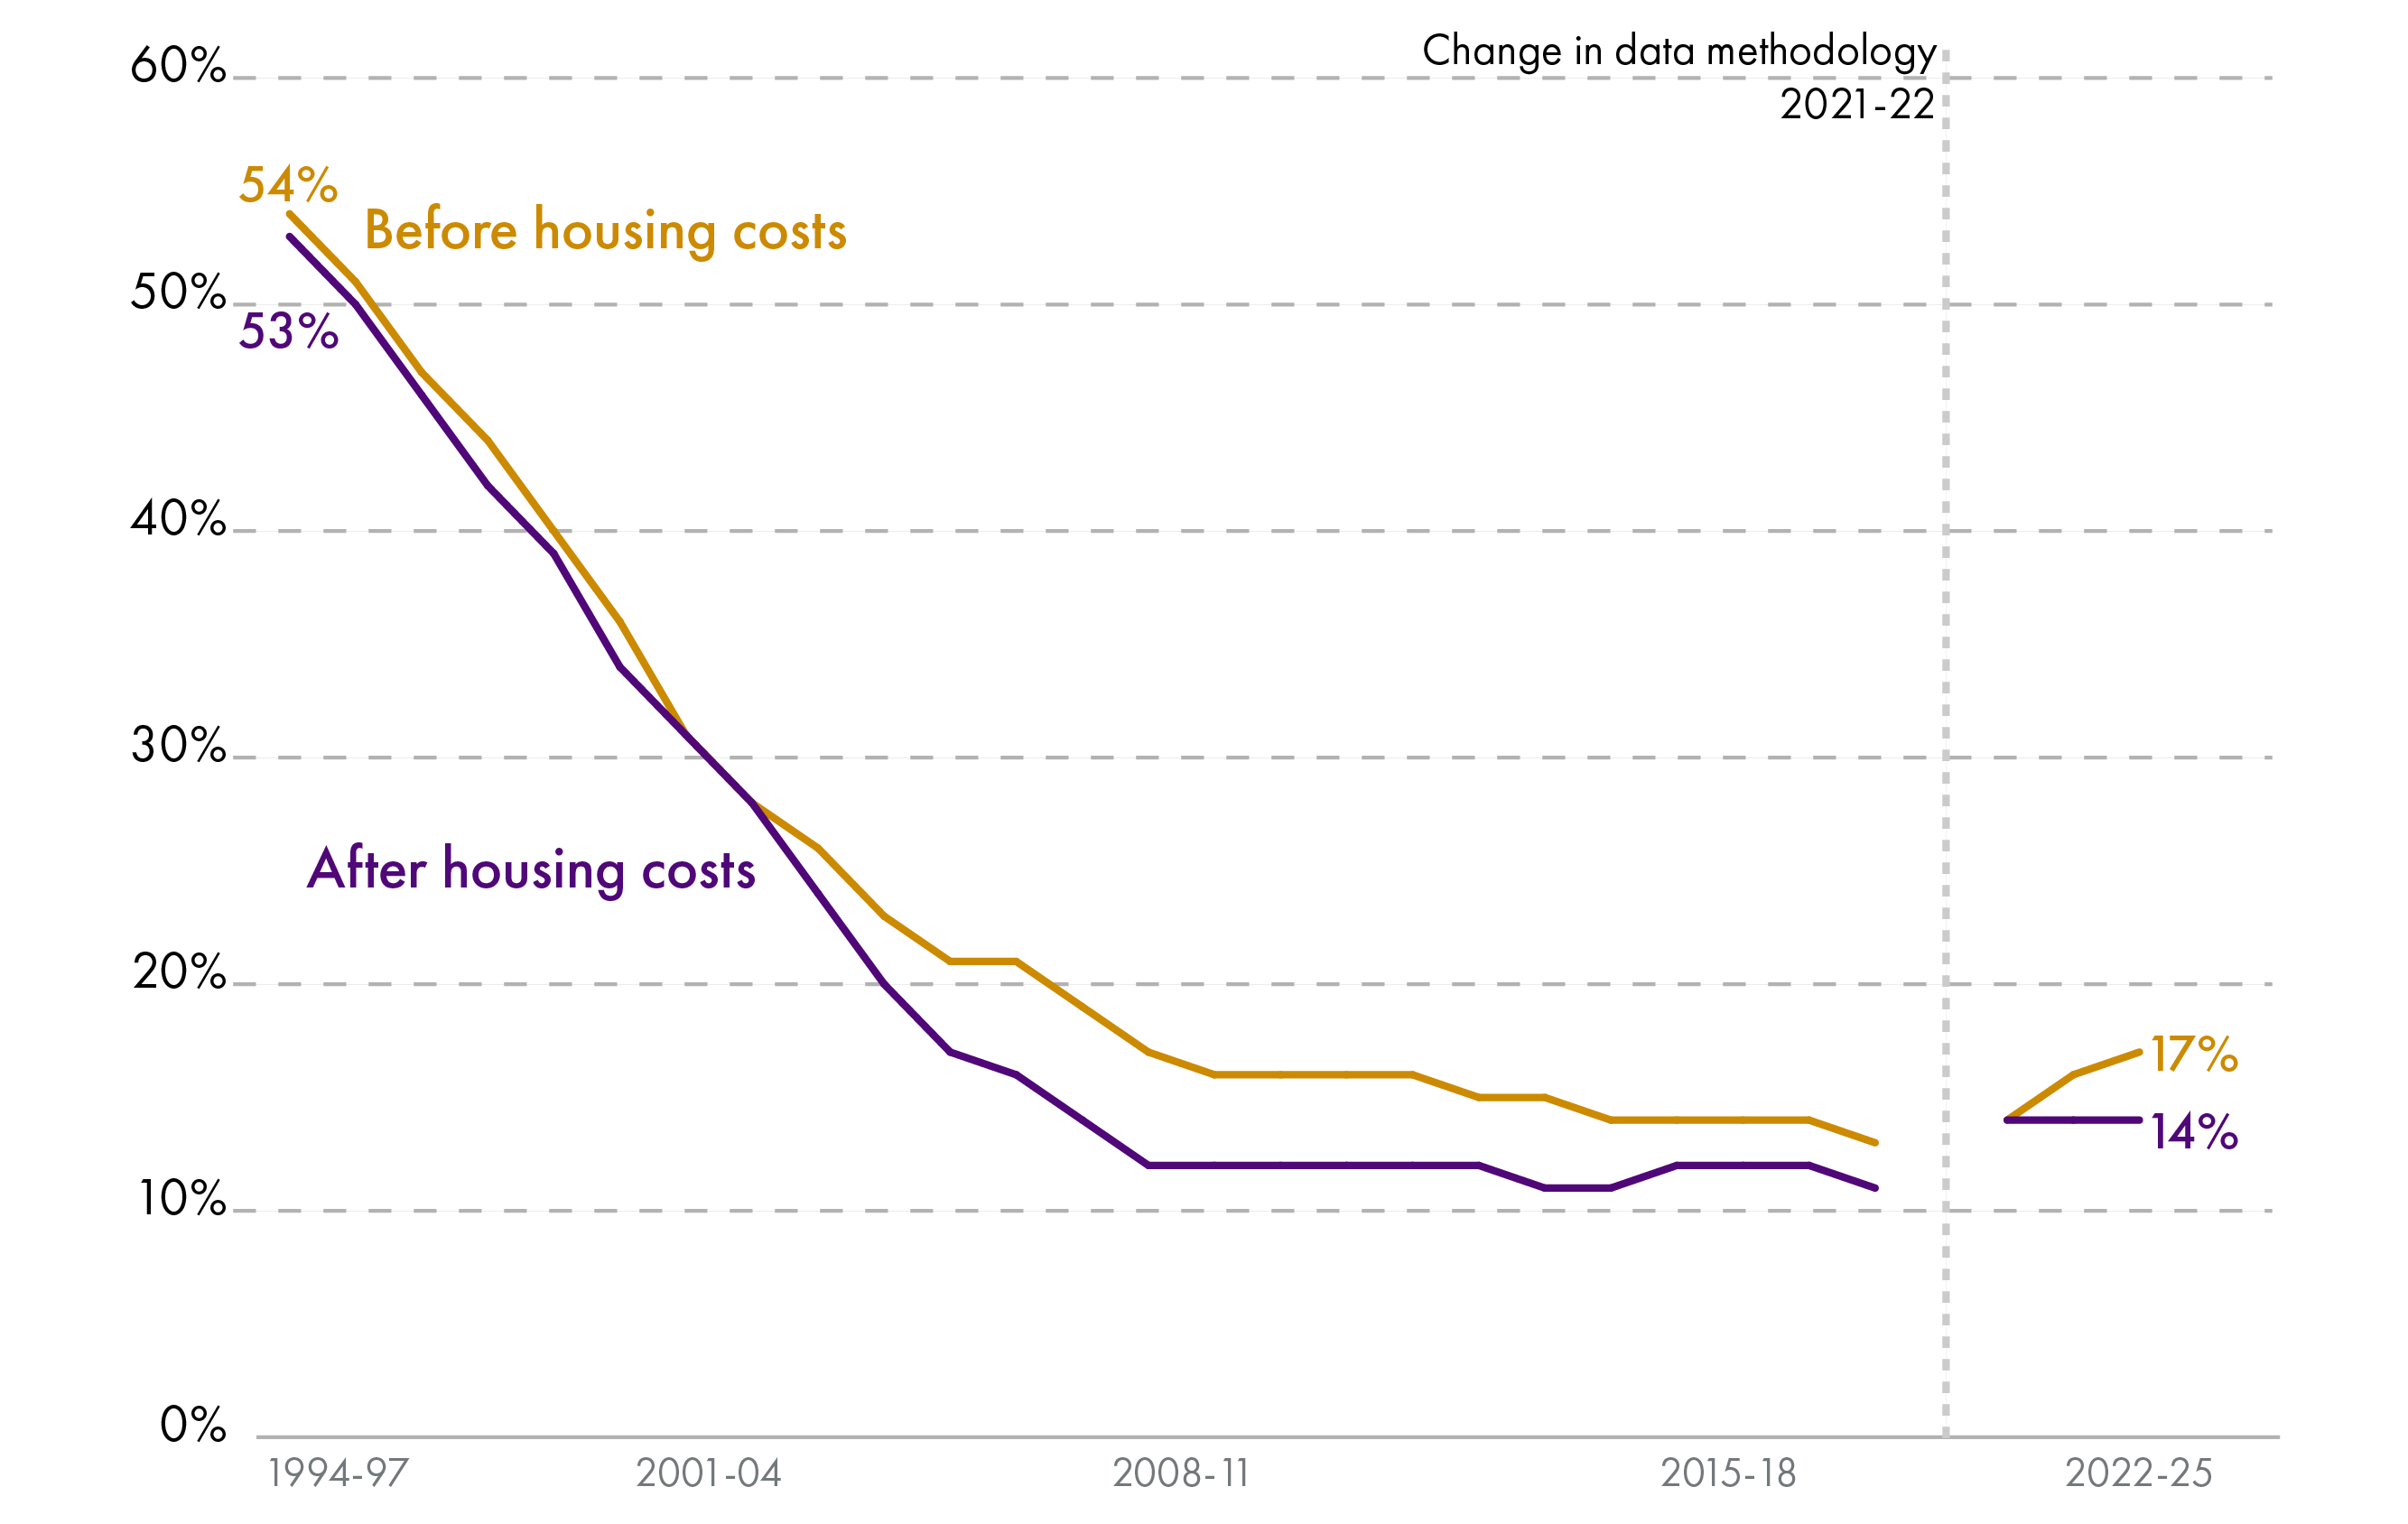
In both relative and absolute terms, pensioner poverty has markedly declined since the mid-1990s.
In-work poverty
In the mid-1990s, most people living in relative poverty were in workless households. However, in-work poverty has been increasing since the mid-2000s.
The share of working age adults in relative poverty after housing costs who live in a working household has increased from 51% in 2004-07 to 63% in 2020-23.
Of those working age households in relative poverty, a greater share are in work.
Demography and immigration
The size and makeup of Scotland’s population is changing, driven by two trends that have emerged over recent decades – an ageing population and higher immigration. Demographic change will have consequences for economic policy, particularly as the working-age share of the population shrinks.
In 2024, Scotland’s population reached a new high of 5.55 million.1 This is up from 5.06 million in 2000.2
Although the population is rising, the fertility rate is at an all-time low. There are now more deaths than births in Scotland each year.
These two seemingly counter-intuitive trends – a rising population and a falling fertility rate – are explained by higher immigration. In the year to mid-2024, approximately 56,400 more people moved to Scotland than left. Three quarters of them were from outside the UK.
However, Scotland’s population is rising more slowly than the UK average, particularly England.3
It is also worth noting that in some parts of Scotland, the population is projected to shrink. If current trends continue, over the decade to mid-2032, the population will have decreased in seven local authority areas:
Argyll and Bute
Dumfries and Galloway
East Ayrshire
Falkirk
Moray
Na h-Eileanan Siar
North Ayrshire
But perhaps the most striking feature of demographic trends is not the change in the size of the population, but the change in its composition. Since 2004, there has been a 43% increase in people aged 75 and over. This trend is set to continue due to the high number of births between the 1940s and 1960s and the fact that people now live longer.2
By 2047, the population aged 75+ is projected to rise by 341,000. The population aged 30-74 is projected to rise by 132,000, with a projected decreased of 57,000 amongst those aged 16-29.
The consequences of a relatively smaller working-age population and a much-increased pension-age population are widespread. For economic policy, it adds pressure to fiscal choices, as demand on state spending is likely to rise. Population ageing can also slow growth in labour supply, making productivity improvements and investment in skills and technology increasingly important for maintaining living standards and fiscal sustainability.
This trend is particularly challenging for the Scottish Government because much of its funding is linked to per-capita-based arrangements. For example, the bulk of the Scottish budget comes from the Block Grant, in which the Scottish Government receives a population share of changes to UK Government spending in devolved areas. This takes no account of Scotland’s population ageing more quickly than the UK average.
Sources
Scottish Government. (2026, April). GDP Quarterly National Accounts: 2025 Quarter 4 (October to December). Retrieved from <a href="https://www.gov.scot/publications/gdp-quarterly-national-accounts-2025-q4/documents/" target="_blank">https://www.gov.scot/publications/gdp-quarterly-national-accounts-2025-q4/documents/</a>
House of Commons Library. (2026, June). Gross domestic product (GDP): Economic indicators. Retrieved from <a href="https://commonslibrary.parliament.uk/research-briefings/sn02783/" target="_blank">https://commonslibrary.parliament.uk/research-briefings/sn02783/</a>
Roy, G., MacKenzie, N.G., & Stewart, S. (2026). 70 years of scottish national accounts: 1948–2018. Economic History Review, 2026, 1-25. doi: https://doi.org/10.1111/ehr.70098
Resolution Foundation. (2025, November). Black holes and consolidations: Previewing the key decisions for Budget 2025. Retrieved from <a href="https://www.resolutionfoundation.org/publications/black-holes-and-consolidations/" target="_blank">https://www.resolutionfoundation.org/publications/black-holes-and-consolidations/</a>
Economic Policy Institute. (2000, April). The link between productivity growth and living standards. Retrieved from <a href="https://www.epi.org/publication/webfeatures_snapshots_archive_03222000/" target="_blank">https://www.epi.org/publication/webfeatures_snapshots_archive_03222000/</a>
Scottish Government. (2025, September). Labour productivity statistics: 2024. Retrieved from <a href="https://www.gov.scot/publications/labour-productivity-statistics-2024/documents/" target="_blank">https://www.gov.scot/publications/labour-productivity-statistics-2024/documents/</a>
Reed, H.R., Nettle, D., Parra-Mujica, F., Stark, G., Wilkinson, R., Johnson, M.T., … Johnson, E.A. (2025). Examining the relationship between income and both mental and physical health among adults in the UK: Analysis of 12 waves (2009–2022) of Understanding Society. PLoS ONE, 20(3). doi: https://doi.org/10.1371/journal.pone.0316792
Skarda, I., Cookson, R., & Gilbert, R. (2024). Does household income predict health and educational outcomes in childhood better than neighbourhood deprivation?. Journal of Public Health, 47(1), 62-73. doi: https://doi.org/10.1093/pubmed/fdae283
Office for National Statistics. (2017, October). Guide to interpreting Annual Survey of Hours and Earnings (ASHE) estimates. Retrieved from <a href="https://www.ons.gov.uk/employmentandlabourmarket/peopleinwork/earningsandworkinghours/methodologies/guidetointerpretingannualsurveyofhoursandearningsasheestimates#what-do-the-different-components-of-pay-mean-" target="_blank">https://www.ons.gov.uk/employmentandlabourmarket/peopleinwork/earningsandworkinghours/methodologies/guidetointerpretingannualsurveyofhoursandearningsasheestimates#what-do-the-different-components-of-pay-mean-</a>
Office for National Statistics. (2025, September). Effects of taxes and benefits on household income. Retrieved from <a href="https://www.ons.gov.uk/peoplepopulationandcommunity/personalandhouseholdfinances/incomeandwealth/datasets/theeffectsoftaxesandbenefitsonhouseholdincomefinancialyearending2014" target="_blank">https://www.ons.gov.uk/peoplepopulationandcommunity/personalandhouseholdfinances/incomeandwealth/datasets/theeffectsoftaxesandbenefitsonhouseholdincomefinancialyearending2014</a>
Scottish Government. (2024, May). Public sector: economic overview. Retrieved from <a href="https://www.gov.scot/publications/economic-overview-public-sector-scotland/" target="_blank">https://www.gov.scot/publications/economic-overview-public-sector-scotland/</a>
Scottish Government. (2025, August). Supporting Scotland's Transition - Land Use and Agriculture: Technical Supporting Document. Retrieved from <a href="https://www.gov.scot/publications/supporting-scotlands-transition-land-use-agriculture-technical-supporting-document/pages/4/" target="_blank">https://www.gov.scot/publications/supporting-scotlands-transition-land-use-agriculture-technical-supporting-document/pages/4/</a>
Eurostat. (2026, February). Sustainable development goals (SDGs) and EU regions - prosperity. Retrieved from <a href="https://ec.europa.eu/eurostat/statistics-explained/index.php?title=Sustainable_development_goals_(SDGs)_and_EU_regions_-_prosperity" target="_blank">https://ec.europa.eu/eurostat/statistics-explained/index.php?title=Sustainable_development_goals_(SDGs)_and_EU_regions_-_prosperity</a>
Scottish Parliament Information Centre. (2025, October). Earnings in Scotland. Retrieved from <a href="https://spice-spotlight.scot/earnings-in-scotland/" target="_blank">https://spice-spotlight.scot/earnings-in-scotland/</a>
Scottish Government. (2024, September). Developing Scotland's Economy: Increasing The Role Of Inclusive And Democratic Business Models. Retrieved from <a href="https://www.gov.scot/publications/developing-scotlands-economy-increasing-role-inclusive-democratic-business-models/pages/6/" target="_blank">https://www.gov.scot/publications/developing-scotlands-economy-increasing-role-inclusive-democratic-business-models/pages/6/</a>
Bond, S., Leblebicioglu, A., & Schiantarelli, F. (2010). Capital accumulation and growth: A new look at the empirical evidence. Journal of Applied Econometrics, 25(7), 1073-1099. doi: 10.1002/jae.1163
Climate Change Commission. (2025, February). The Seventh Carbon Budget: Advice for the UK Government. Retrieved from <a href="https://www.theccc.org.uk/wp-content/uploads/2025/02/The-Seventh-Carbon-Budget.pdf" target="_blank">https://www.theccc.org.uk/wp-content/uploads/2025/02/The-Seventh-Carbon-Budget.pdf</a>
Scottish Government. (2022, March). Scotland’s National Strategy for Economic Transformation: Evidence paper. Retrieved from <a href="https://www.gov.scot/binaries/content/documents/govscot/publications/research-and-analysis/2022/03/scotland-national-strategy-economic-transformation-evidence-paper/documents/scotlands-national-strategy-economic-transformation-evidence-paper/scotlands-national-strategy-economic-transformation-evidence-paper/govscot%3Adocument/scotlands-national-strategy-economic-transformation-evidence-paper.pdf" target="_blank">https://www.gov.scot/binaries/content/documents/govscot/publications/research-and-analysis/2022/03/scotland-national-strategy-economic-transformation-evidence-paper/documents/scotlands-national-strategy-economic-transformation-evidence-paper/scotlands-national-strategy-economic-transformation-evidence-paper/govscot%3Adocument/scotlands-national-strategy-economic-transformation-evidence-paper.pdf</a>
CBI, Addleshaw Goddard and Fraser of Allander Institute. (2025, December). Scottish Productivity Index 2025. Retrieved from <a href="https://www.cbi.org.uk/media/ferlmp0o/cbi-addleshaw-goddard-productivity-index-2025.pdf" target="_blank">https://www.cbi.org.uk/media/ferlmp0o/cbi-addleshaw-goddard-productivity-index-2025.pdf</a>
Office for Budget Responsibility. (2026, March). Economic and Fiscal Outlook - March 2026, Chapter 3. Retrieved from <a href="https://obr.uk/economic-and-fiscal-outlooks/#chapter-3" target="_blank">https://obr.uk/economic-and-fiscal-outlooks/#chapter-3</a>
Keller, W., & Yeaple, S. (2009). Multinational Enterprises, International Trade, and Productivity Growth: Firm-Level Evidence from the United States. The Review of Economics and Statistics, 91(4), 821-831.
EY. (2025, June). EY UK Attractiveness Survey Scotland. Retrieved from <a href="https://www.ey.com/content/dam/ey-unified-site/ey-com/en-uk/newsroom/2025/06/ey-uk-attractiveness-survey-scotland-06-2025.pdf" target="_blank">https://www.ey.com/content/dam/ey-unified-site/ey-com/en-uk/newsroom/2025/06/ey-uk-attractiveness-survey-scotland-06-2025.pdf</a>
Lundin, J. (2015, August). Entrepreneurship and Economic Growth: Evidence from GEM Data. Retrieved from <a href="https://lup.lub.lu.se/luur/download?func=downloadFile&recordOId=7792084&fileOId=7792093" target="_blank">https://lup.lub.lu.se/luur/download?func=downloadFile&recordOId=7792084&fileOId=7792093</a>
Scottish Government. (2025, September). Gross expenditure on research and development Scotland 2023. Retrieved from <a href="https://www.gov.scot/publications/gross-expenditure-on-research-and-development-scotland-2023/pages/key-points/" target="_blank">https://www.gov.scot/publications/gross-expenditure-on-research-and-development-scotland-2023/pages/key-points/</a>
University of Edinburgh Business School. (2025, September). Global Entrepreneurship Monitor, Scotland 2024/25 Report. Retrieved from <a href="https://www.enterpriseresearch.ac.uk/wp-content/uploads/2025/09/GEM-scotland-24-25-1.pdf" target="_blank">https://www.enterpriseresearch.ac.uk/wp-content/uploads/2025/09/GEM-scotland-24-25-1.pdf</a>
London School of Economics Trade Policy Hub. (2023, September). The relationship between trade and productivity: a feasibility study. Retrieved from <a href="https://assets.publishing.service.gov.uk/media/650b0c0ffbd7bc000dcb521c/the-relationship-between-trade-and-productivity-a-feasbility-study.pdf" target="_blank">https://assets.publishing.service.gov.uk/media/650b0c0ffbd7bc000dcb521c/the-relationship-between-trade-and-productivity-a-feasbility-study.pdf</a>
Scottish Government. (2023, November). Export Statistics Scotland: methodology. Retrieved from <a href="https://www.gov.scot/publications/export-statistics-scotland-methodology/" target="_blank">https://www.gov.scot/publications/export-statistics-scotland-methodology/</a>
World Bank. (2026, June). Gini Index - European Union. Retrieved from <a href="https://data.worldbank.org/indicator/SI.POV.GINI?locations=EU" target="_blank">https://data.worldbank.org/indicator/SI.POV.GINI?locations=EU</a>
Eurofound. (2025, September). Net wealth inequality, EU Member States, 2010 and 2021 (Gini index). Retrieved from <a href="https://www.eurofound.europa.eu/en/surveys-and-data/data-catalogue/net-wealth-inequality-eu-member-states-2010-and-2021-gini-index-" target="_blank">https://www.eurofound.europa.eu/en/surveys-and-data/data-catalogue/net-wealth-inequality-eu-member-states-2010-and-2021-gini-index-</a>
Krutikova, S., Macmillan, L., Sturrock, D., & van der Erve, L. (2023, September). Intergenerational mobility in the UK IFS Deaton Review of Inequalities. Retrieved from <a href="https://ifs.org.uk/publications/intergenerational-mobility-uk" target="_blank">https://ifs.org.uk/publications/intergenerational-mobility-uk</a>
Bourquin, P., Brewer, M., & Wernham, T. (2022, November). Trends in income and wealth inequalities. Retrieved from <a href="https://www.nuffieldfoundation.org/wp-content/uploads/2022/11/Trends-in-income-and-wealth-inequalities-IFS-Deaton-Review-of-Inequality.pdf" target="_blank">https://www.nuffieldfoundation.org/wp-content/uploads/2022/11/Trends-in-income-and-wealth-inequalities-IFS-Deaton-Review-of-Inequality.pdf</a>
Scottish Government. (2026, March). Poverty and Income Inequality in Scotland 2022-25. Retrieved from <a href="https://www.gov.scot/publications/poverty-and-income-inequality-in-scotland-2022-25/pages/key-points/" target="_blank">https://www.gov.scot/publications/poverty-and-income-inequality-in-scotland-2022-25/pages/key-points/</a>
Department for Work and Pensions, UK Government. (2026, March). Households below average income: for financial years ending 1995 to 2025. Retrieved from <a href="https://www.gov.uk/government/statistics/households-below-average-income-for-financial-years-ending-1995-to-2025" target="_blank">https://www.gov.uk/government/statistics/households-below-average-income-for-financial-years-ending-1995-to-2025</a>
Institute for Fiscal Studies. (2026, April). Scotland’s child poverty rate lower than in the rest of the UK – but ambitious 2030 targets set to be missed. Retrieved from <a href="https://ifs.org.uk/news/scotlands-child-poverty-rate-lower-rest-uk-ambitious-2030-targets-set-be-missed" target="_blank">https://ifs.org.uk/news/scotlands-child-poverty-rate-lower-rest-uk-ambitious-2030-targets-set-be-missed</a>
National Records of Scotland. (2025, December). Unprecedented changes in Scotland’s population. Retrieved from <a href="https://www.nrscotland.gov.uk/latest-news/unprecedented-changes-in-scotland-s-population/" target="_blank">https://www.nrscotland.gov.uk/latest-news/unprecedented-changes-in-scotland-s-population/</a>
National Records of Scotland. (2025, December). Scotland's Population 2024 - The Registrar General's Annual Review of Demographic Trends. Retrieved from <a href="https://www.nrscotland.gov.uk/publications/scotlands-population-2024-the-registrar-generals-annual-review-of-demographic-trends/" target="_blank">https://www.nrscotland.gov.uk/publications/scotlands-population-2024-the-registrar-generals-annual-review-of-demographic-trends/</a>
Office for National Statistics. (2025, September). Population estimates for the UK, England, Wales, Scotland and Northern Ireland: mid-2024. Retrieved from <a href="https://www.ons.gov.uk/peoplepopulationandcommunity/populationandmigration/populationestimates/bulletins/annualmidyearpopulationestimates/mid2024" target="_blank">https://www.ons.gov.uk/peoplepopulationandcommunity/populationandmigration/populationestimates/bulletins/annualmidyearpopulationestimates/mid2024</a>