Earnings in Scotland 2022 - Real Living Wage
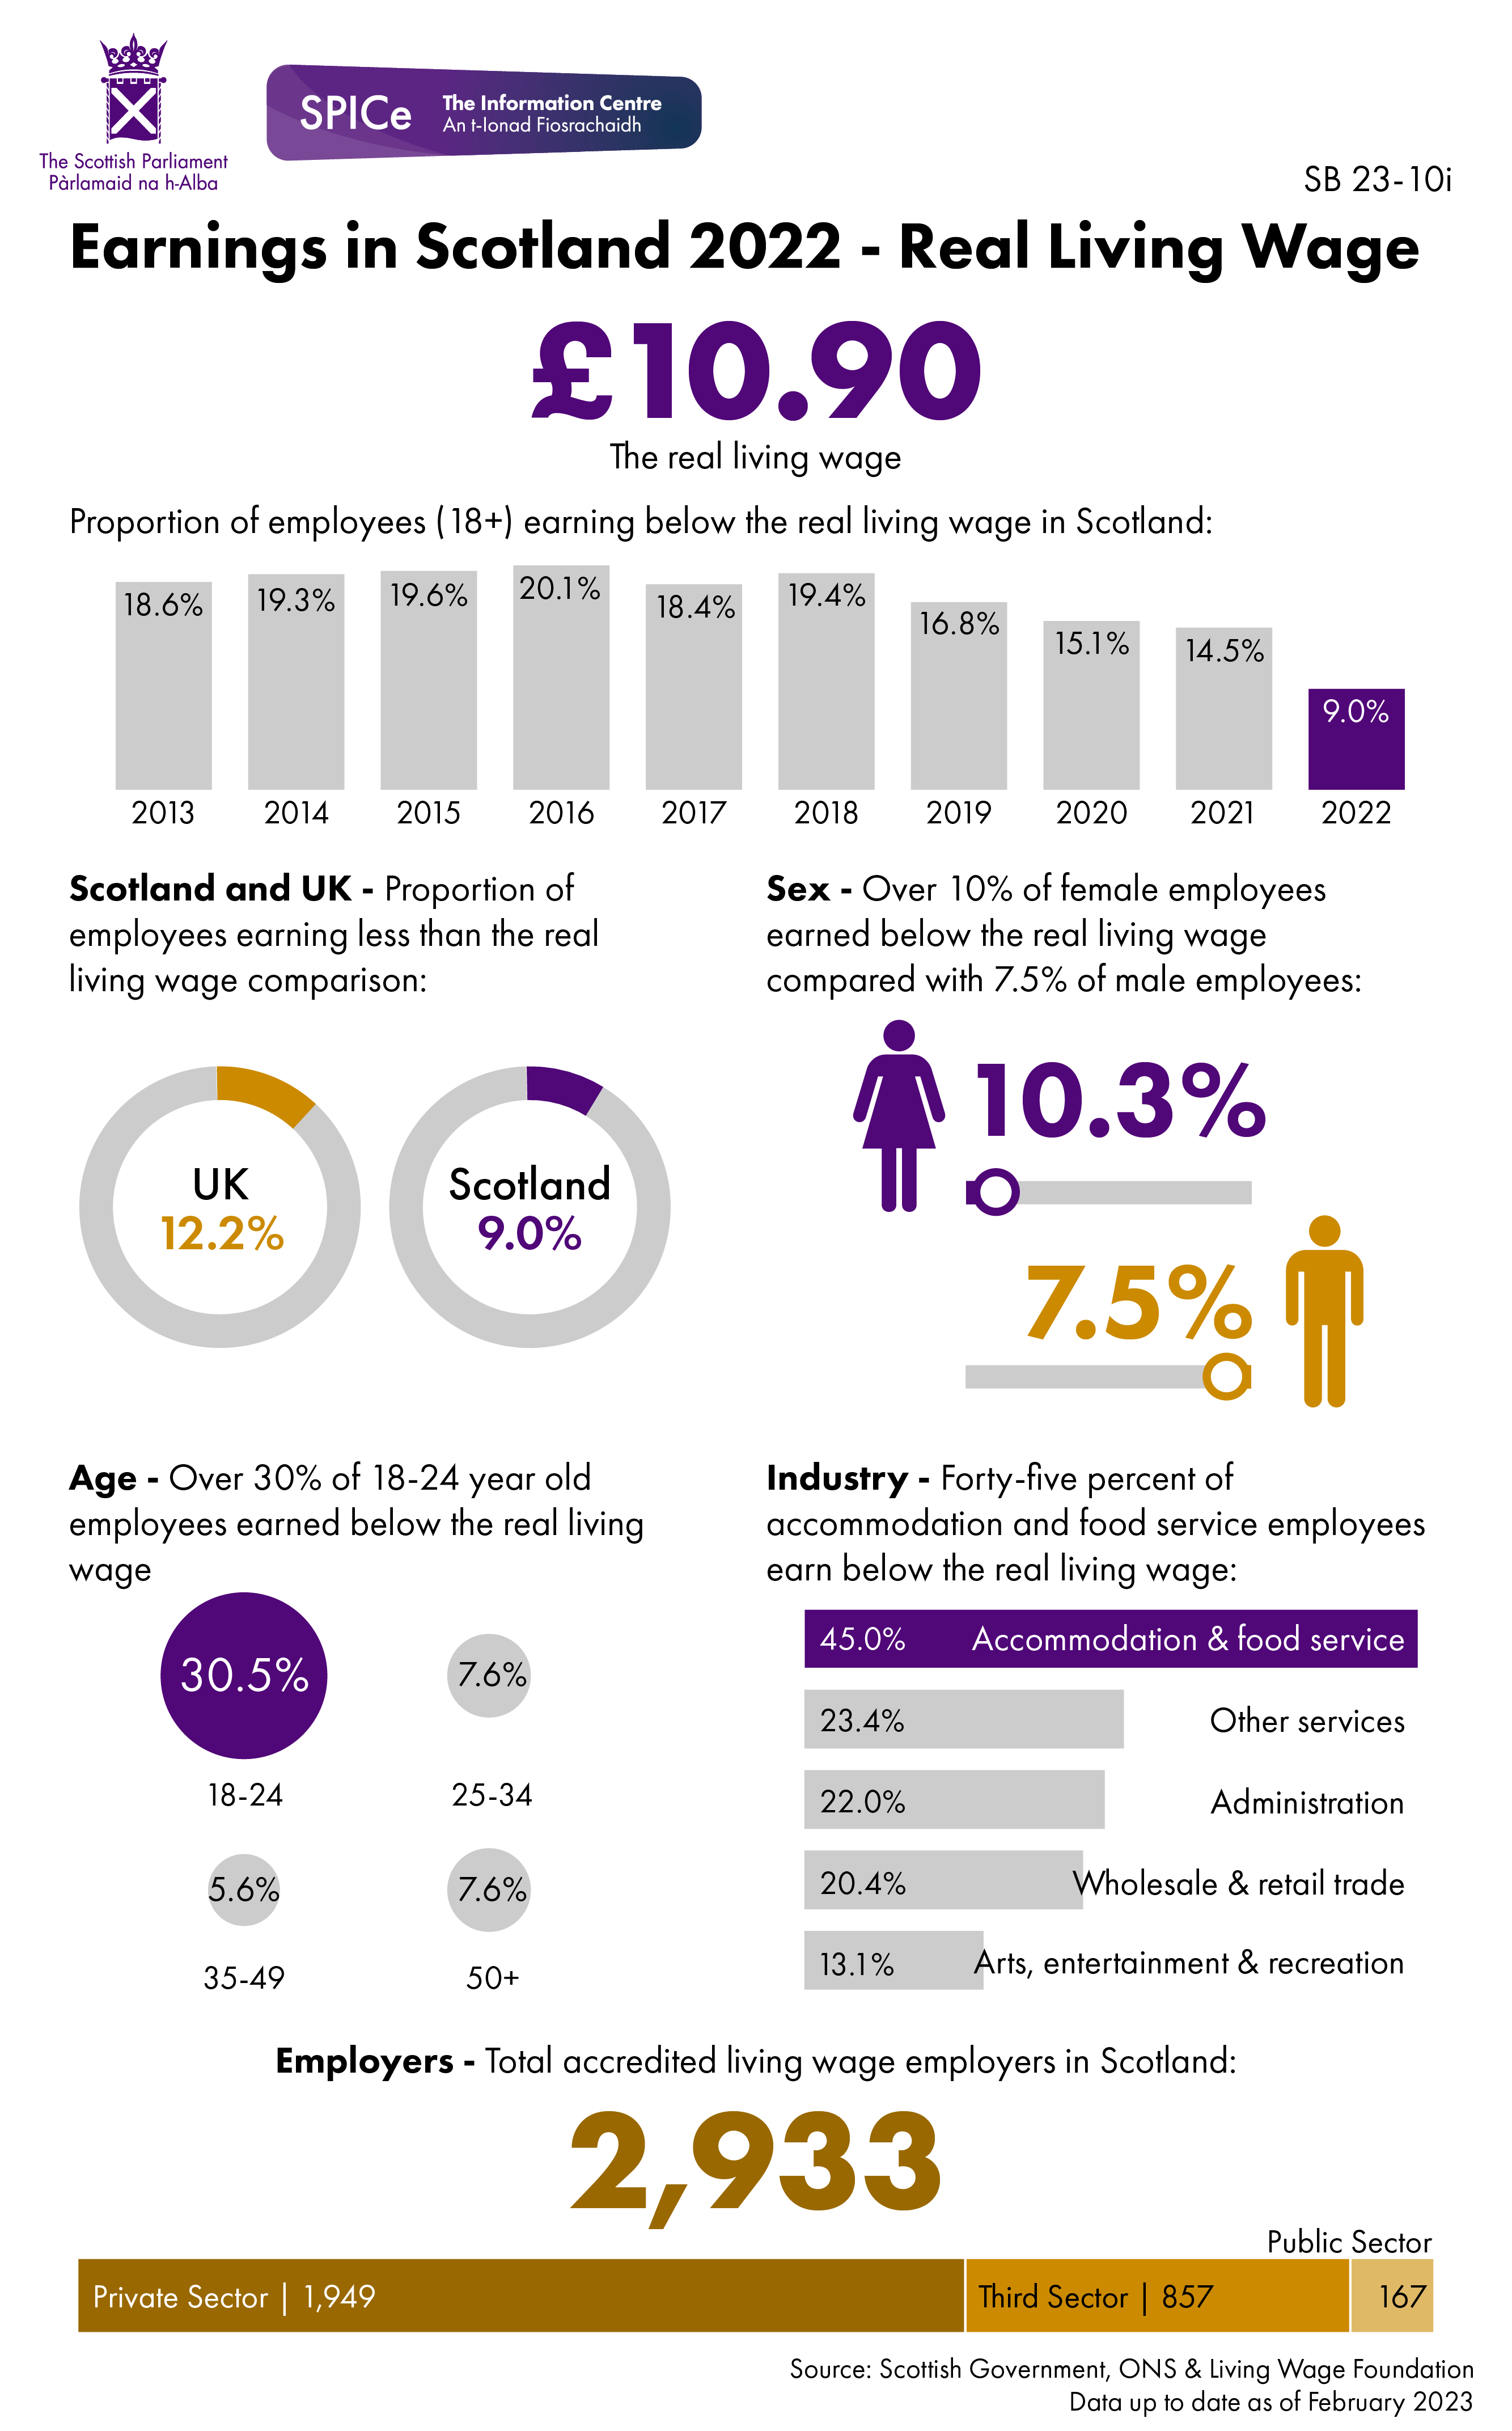
This infographic looks at the latest real living wage data for Scotland from the Scottish Governments Earnings in Scotland briefing and Living Wage Scotland.
Data
| 2013 | 2014 | 2015 | 2016 | 2017 | 2018 | 2019 | 2020 | 2021 | 2022 |
|---|---|---|---|---|---|---|---|---|---|
| 18.6 | 19.3 | 19.6 | 20.1 | 18.4 | 19.4 | 16.8 | 15.1 | 14.5 | 9 |
| UK | Scotland | |
|---|---|---|
| Percentage | 12.2 | 9 |
| Sex | Percentage |
|---|---|
| Female | 10.3 |
| Male | 7.5 |
| Age | Percentage |
|---|---|
| 18-24 | 30.5 |
| 25-34 | 7.6 |
| 35-49 | 5.6 |
| 50+ | 7.6 |
| Industry | Percentage |
|---|---|
| Accommodation & food service | 45 |
| Other services | 23.4 |
| Administration | 22 |
| Wholesale & retail trade | 20.4 |
| Arts, entertainment & recreation | 13.1 |
| Sector | Number of employers |
|---|---|
| Private | 1949 |
| Third | 857 |
| Public | 167 |
Source: Living Wage Scotland