Labour market update: November 2020
An overview of the latest labour market statistics for Scotland.
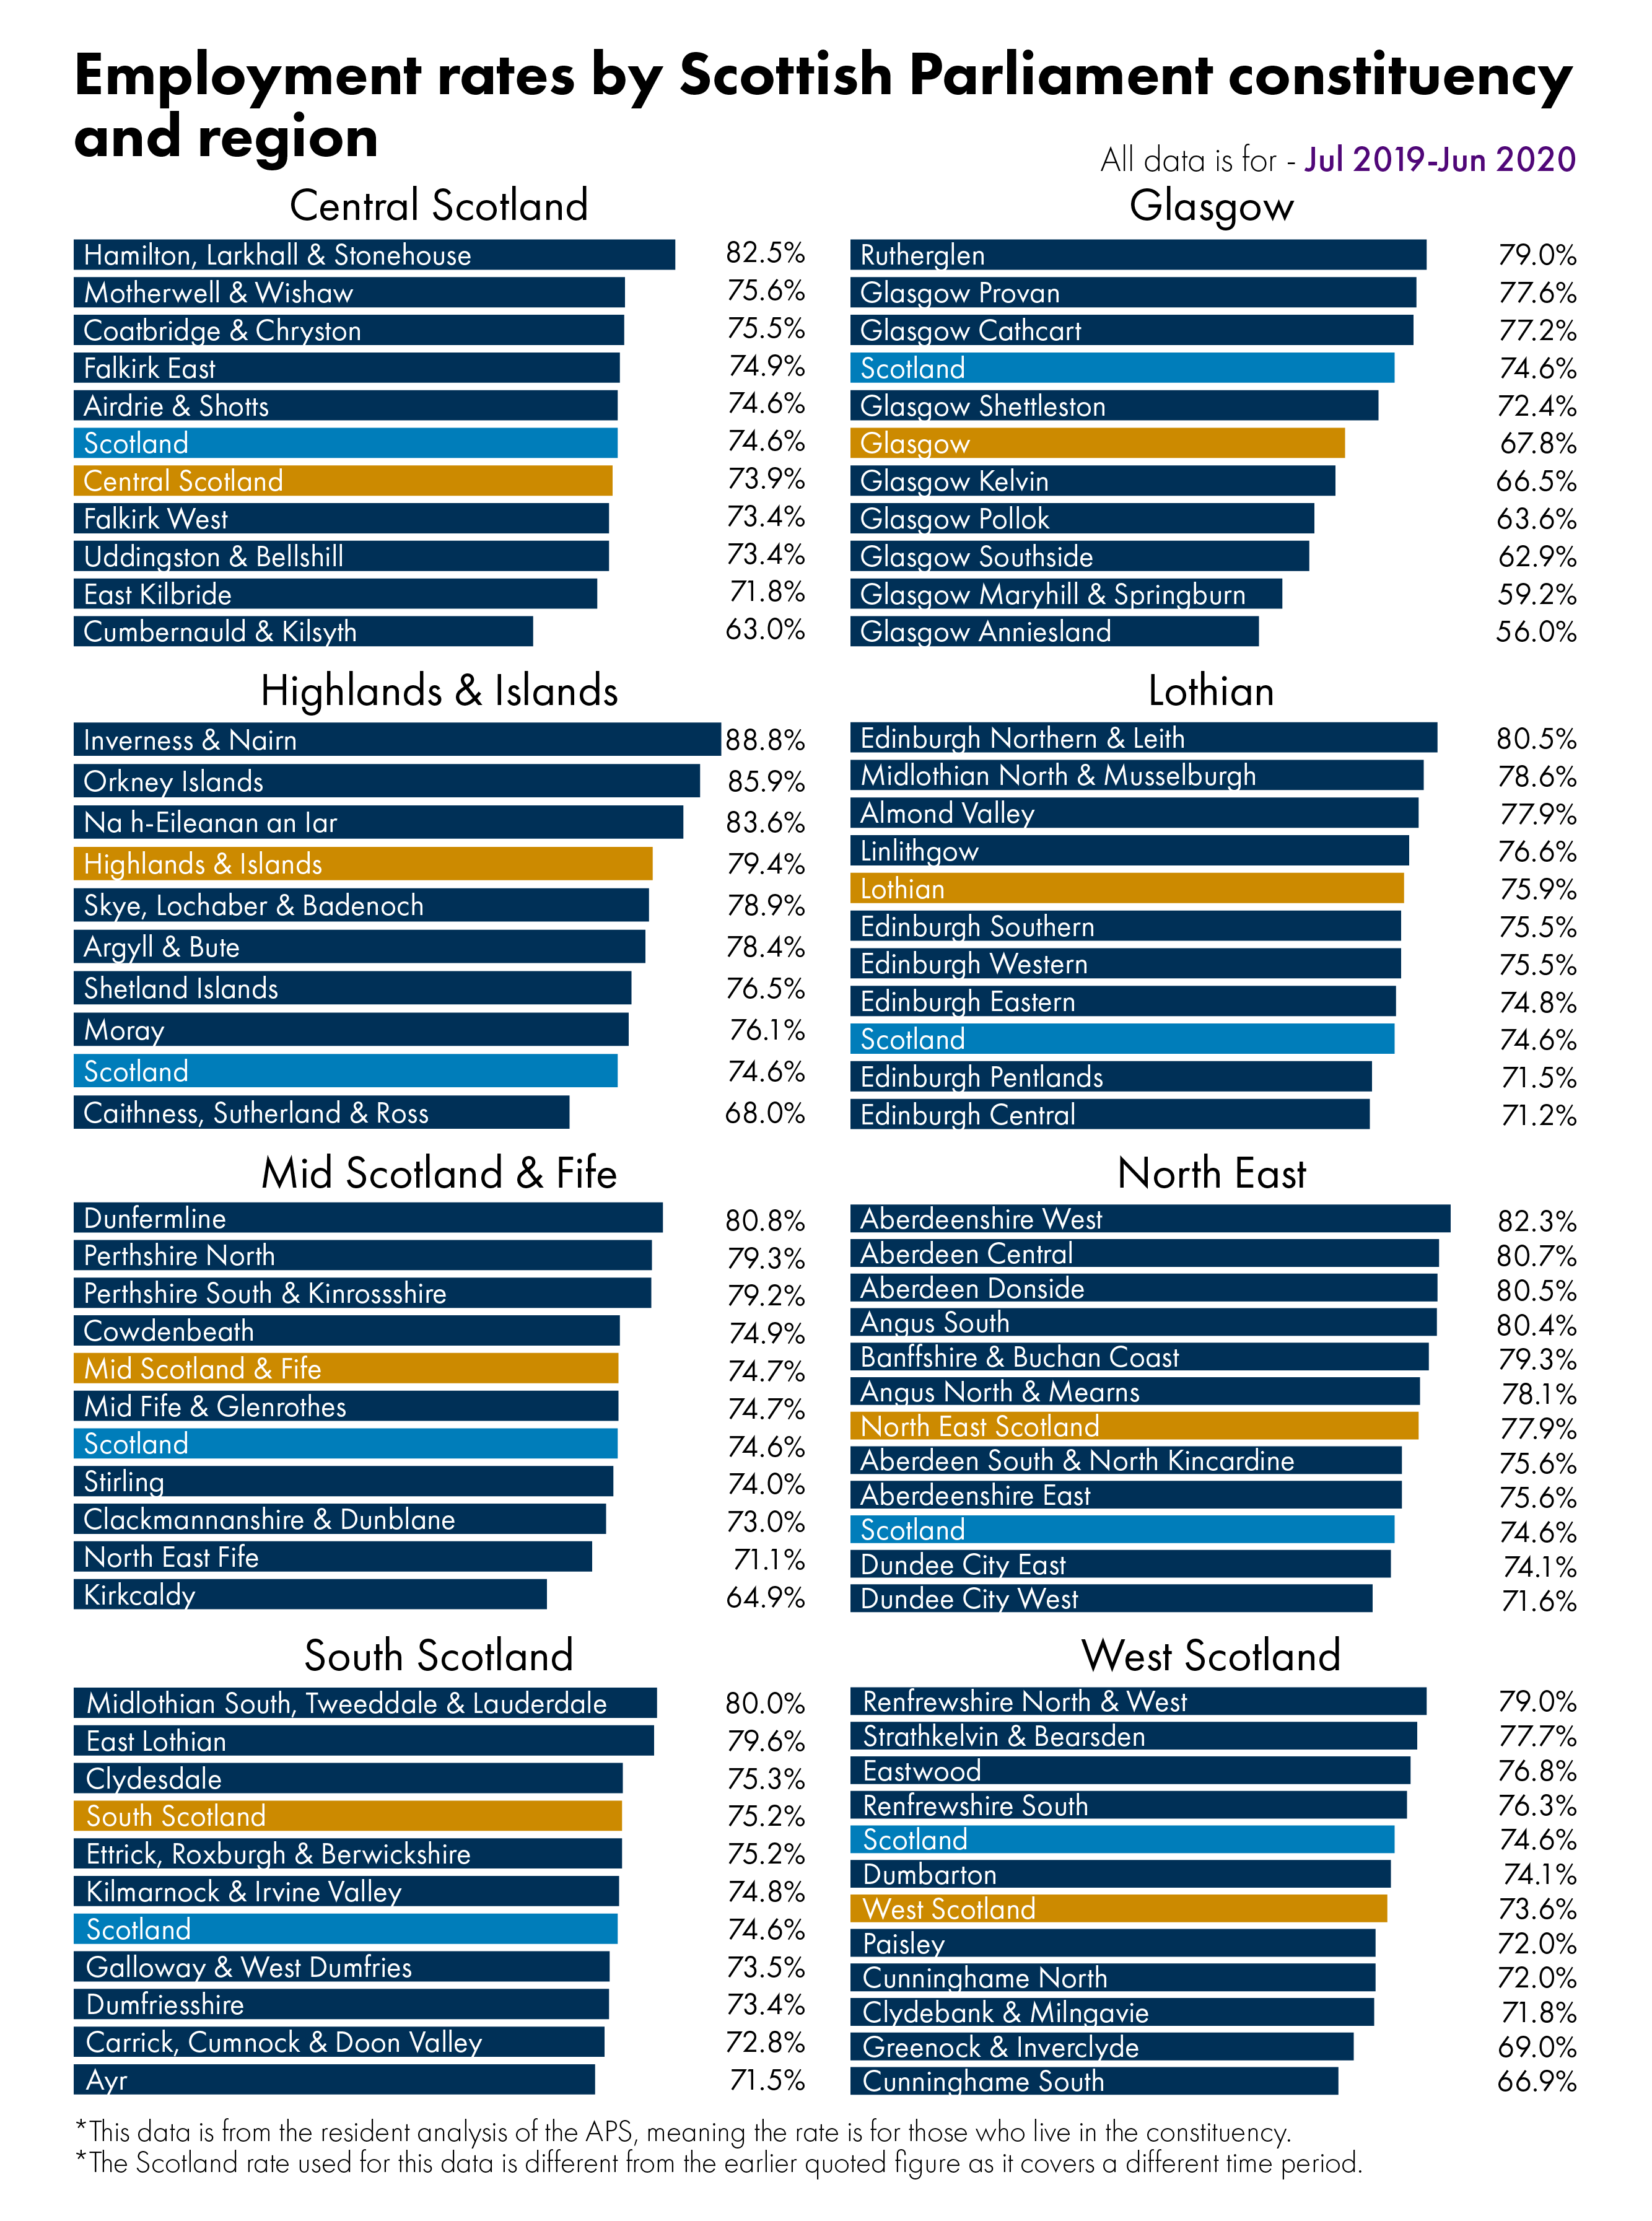
The constituency data is available on the Scottish Parliament website.
Data
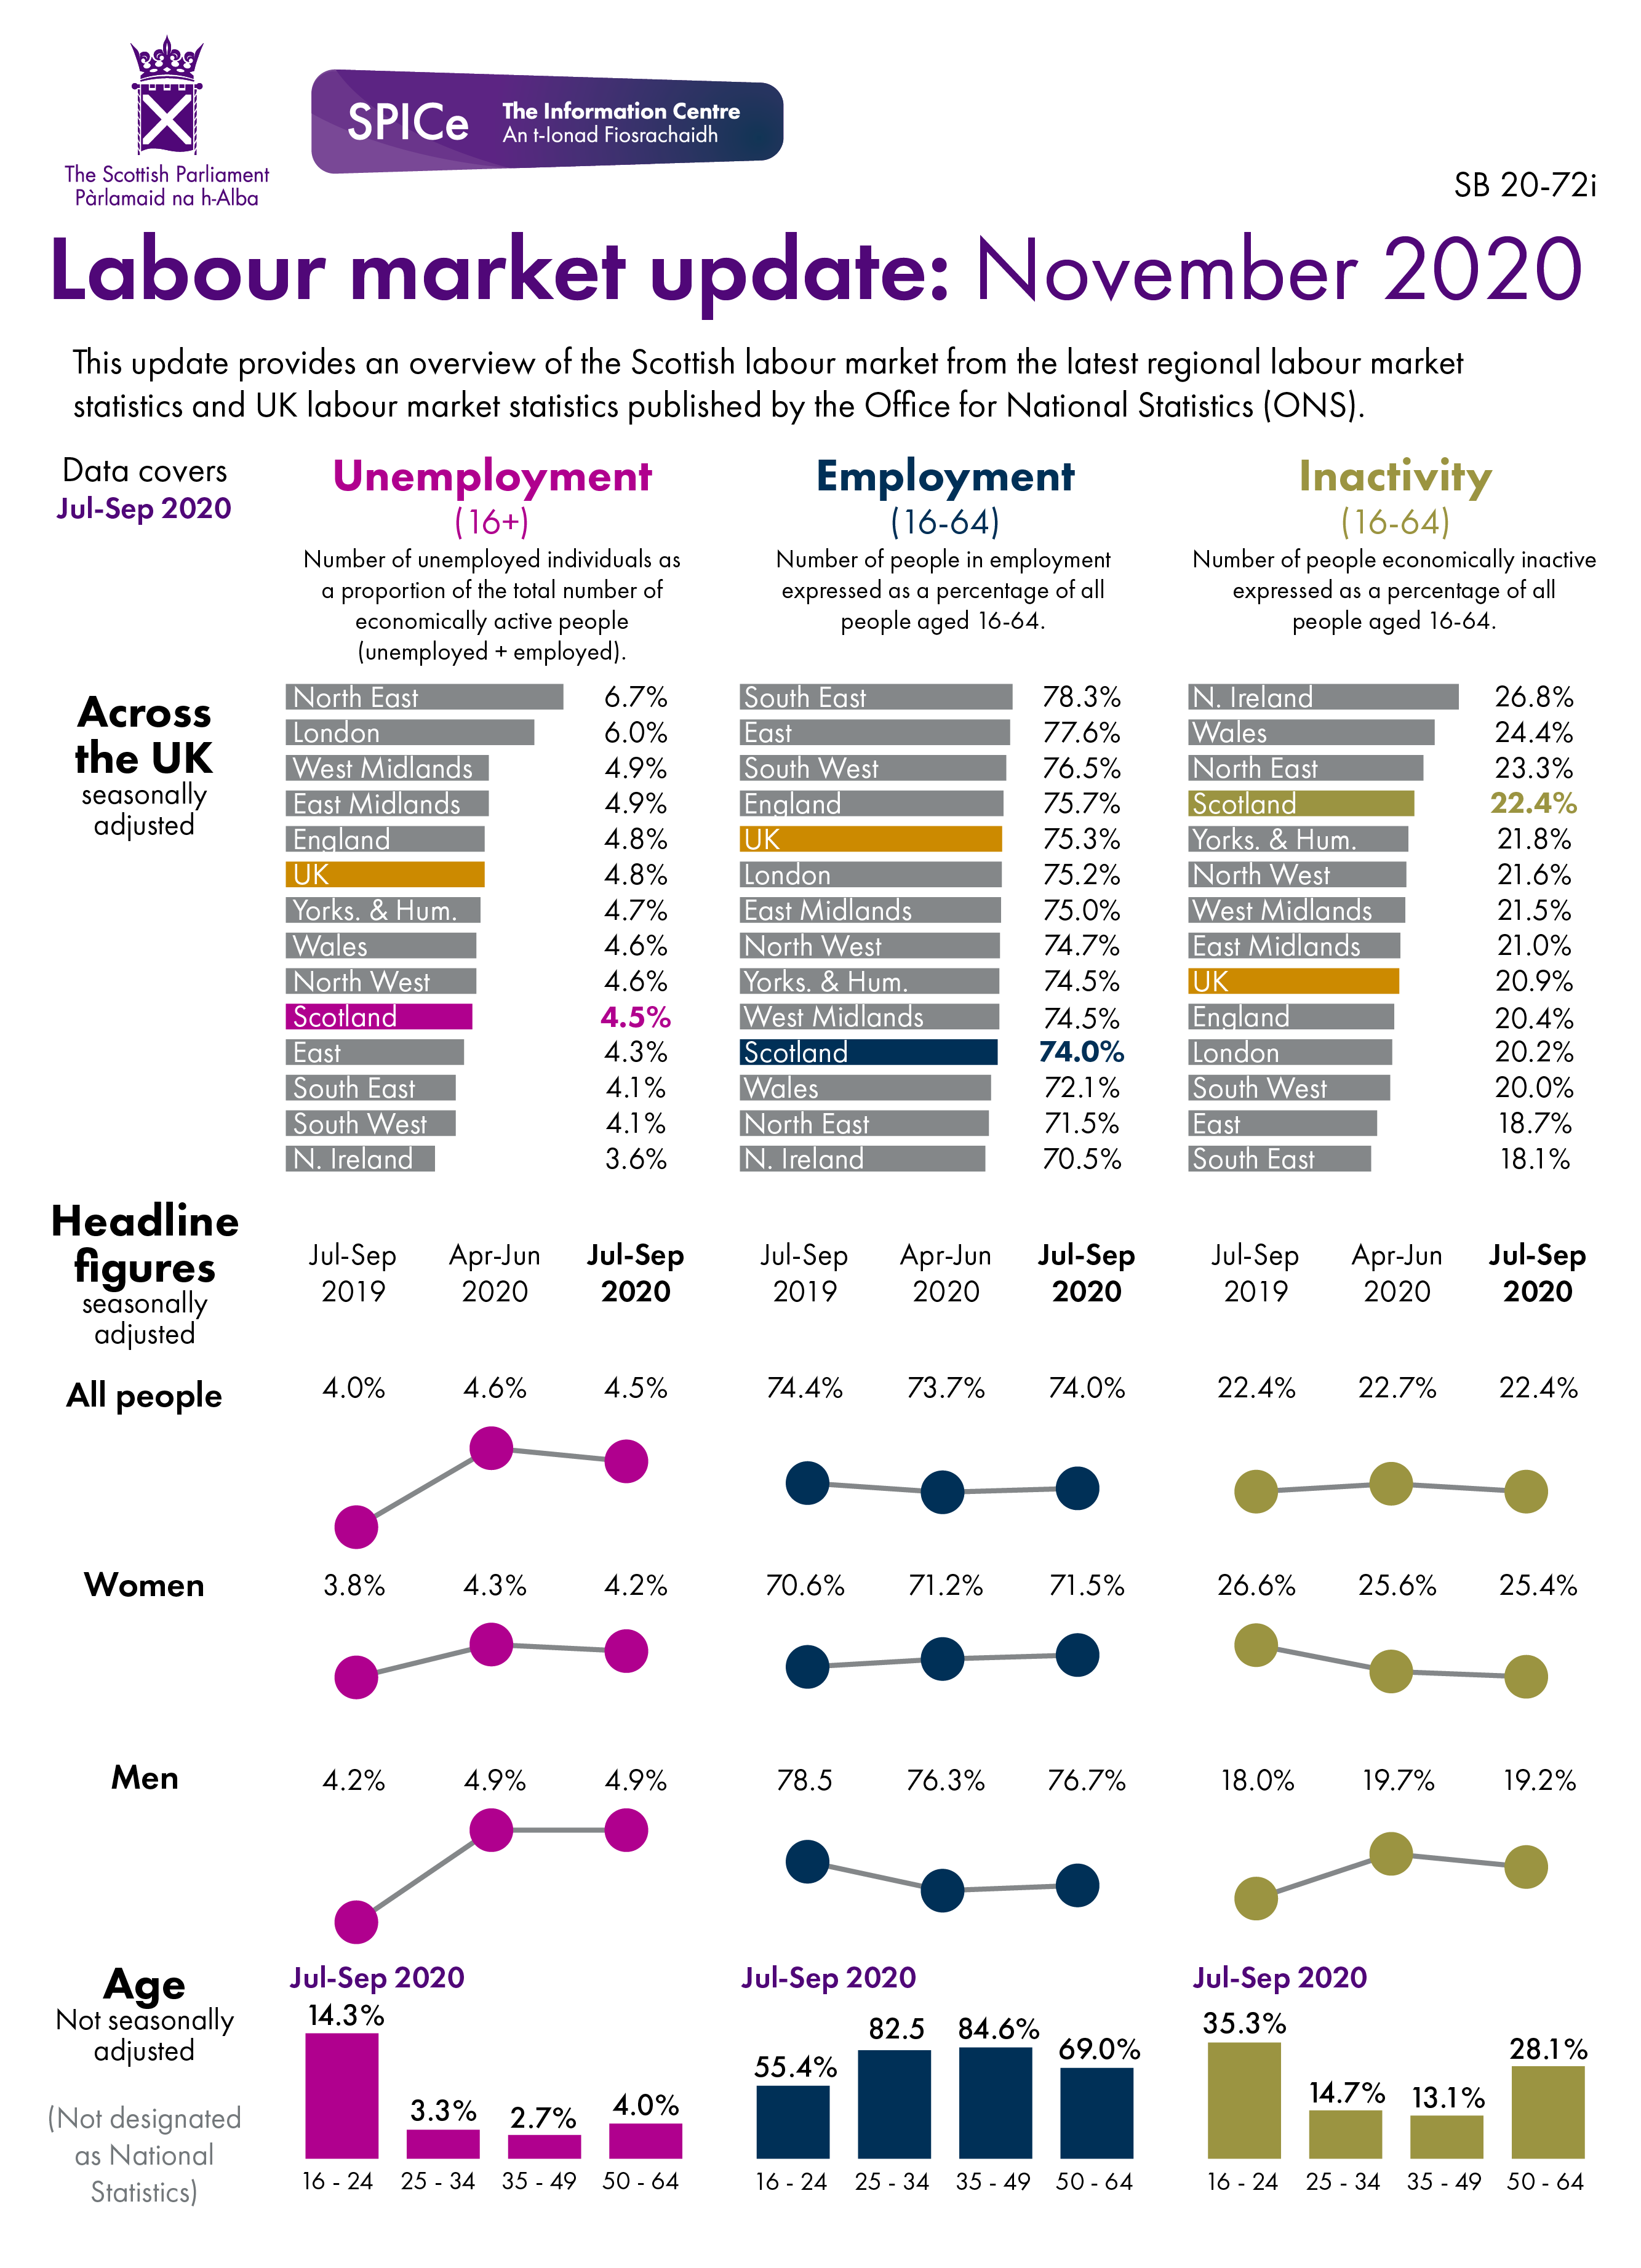
| Area | Employment | Unemployment | Economically inactive |
|---|---|---|---|
| East | 77.6 | 4.3 | 18.7 |
| East Midlands | 75.0 | 4.9 | 21.0 |
| England | 75.7 | 4.8 | 20.4 |
| London | 75.2 | 6.0 | 20.2 |
| North East | 71.5 | 6.7 | 23.3 |
| North West | 74.7 | 4.6 | 21.6 |
| Northern Ireland | 70.5 | 3.6 | 26.8 |
| Scotland | 74.0 | 4.5 | 22.4 |
| South East | 78.3 | 4.1 | 18.1 |
| South West | 76.5 | 4.1 | 20.0 |
| United Kingdom | 75.3 | 4.8 | 20.9 |
| Wales | 72.1 | 4.6 | 24.4 |
| West Midlands | 74.5 | 4.9 | 21.5 |
| Yorkshire and The Humber | 74.5 | 4.7 | 21.8 |
| Current quarter | Previous quarter | Same quarter last year | |
|---|---|---|---|
| Unemployment (16+) | 4.5 | 4.6 | 4.0 |
| Employment (16-64) | 74.0 | 73.7 | 74.4 |
| Inactivity (16-64) | 22.4 | 22.7 | 22.4 |
| Current quarter | Previous quarter | Same quarter last year | |
|---|---|---|---|
| Unemployment (16+) | 4.2 | 4.3 | 3.8 |
| Employment (16-64) | 71.5 | 71.2 | 70.6 |
| Inactivity (16-64) | 25.4 | 25.6 | 26.6 |
| Men | Current quarter | Previous quarter | Same quarter last year |
|---|---|---|---|
| Unemployment (16+) | 4.9 | 4.9 | 4.2 |
| Employment (16-64) | 76.7 | 76.3 | 78.5 |
| Inactivity (16-64) | 19.2 | 19.7 | 18.0 |
| 16 - 24 | 25 - 34 | 35 - 49 | 50 - 64 | |
|---|---|---|---|---|
| Unemployment | 14.3 | 3.3 | 2.7 | 4.0 |
| Employment | 55.4 | 82.5 | 84.6 | 69.0 |
| Inactivity | 35.3 | 14.7 | 131 | 28.1 |