The declining disability employment gap in Scotland:Understanding the reasons behind the increasing number of disabled people in employment
This briefing has been prepared by Allison Catalano and Chirsty McFadyen from the Fraser of Allander Institute through an academic fellowship with SPICe. The authors have replicated a Department of Work and Pensions study which set out the drivers of change in disabled employment in the UK, and used statistical data from the ONS to apply this to Scotland's labour market.
Executive Summary
Both Scotland and the UK have similar goals to reduce the difference between the employment rate of disabled people and non-disabled people (the disability employment gap). In recent years there has been an increase in the disabled employment rate, which has contributed to a reduction in the disability employment gap. In order to understand why more disabled people are moving into work, the UK Department for Work and Pensions (DWP) published a report in 2023 which modelled four possible reasons behind this rise. Looking back to 2013, when the earliest data on disability was released, they ultimately found that the change is primarily due to an increase in disability prevalence – that is to say, the increase in disabled employment is largely due to adults already in work moving into disability, rather than disabled adults moving into work1.
However, there are several other factors at play – employment levels overall have been rising, there is evidence that disabled adults are moving into work at a faster rate than non-disabled adults, and the size of the working age population has changed over these nine years.
Scotland, furthermore, has unique population challenges within the UK, and it's likely that a study on the UK would fail to capture these nuances. This paper therefore seeks to replicate the DWP's model to see the reasons behind the changing disability employment rates for Scotland between Q3 2013 and Q3 2022. We also delve further into these reasons, looking at disability prevalence, employment rates, and demography between 2014 and 2022. The key findings from our analysis are:
The employment rate for disabled people in Scotland has increased by 9 percentage points since 2014. Non-disabled employment rates also increased by 3 percentage points during this time period. This increase in the employment rate has been larger in Scotland compared to the rest of the UK, although the employment rate remains lower.
The employment rate has largely increased due to an increase in disability prevalence (70% of the total change), meaning that this change is primarily due to working people becoming disabled. A small portion of the change (10%) was due to a change in working patterns among disabled people.
On average, Scotland's disabled working age population grew by about 4.6% each year between 2014 and 2022, while Scotland's total working age population grew by less than 0.1%.
Over half of the change in disability prevalence is due to an increase in reporting mental health-related disabilities and learning difficulties. In 2014, over a third of disabled people in Scotland reported musculoskeletal conditions as their main issue, and around a quarter reported a mental health condition or learning difficulty. These proportions have now switched.
Employment rates for all types of disability have increased since 2014. Musculoskeletal conditions – those affecting arms, legs, feet, neck, and back – had significant increases in employment rates, without significant increases in disability prevalence. By comparison, rates of reported mental illness grew substantially in both employment rates and in total prevalence, although the change in employment outpaced the change in population size.
Disabled people are disproportionately less likely to work in manufacturing; professional, scientific, and technical activities; or construction, and are more likely to work in education, retail, and health and social work.
Introduction
Disabled adults are significantly less likely to be in work compared to adults without disabilities. In Scotland, 82.5% of working aged adults without disabilities had jobs in 2022, compared to just over 50% of adults with disabilities. This discrepancy of 32 percentage points – called the “employment gap” – is larger in Scotland compared to the rest of the UK.
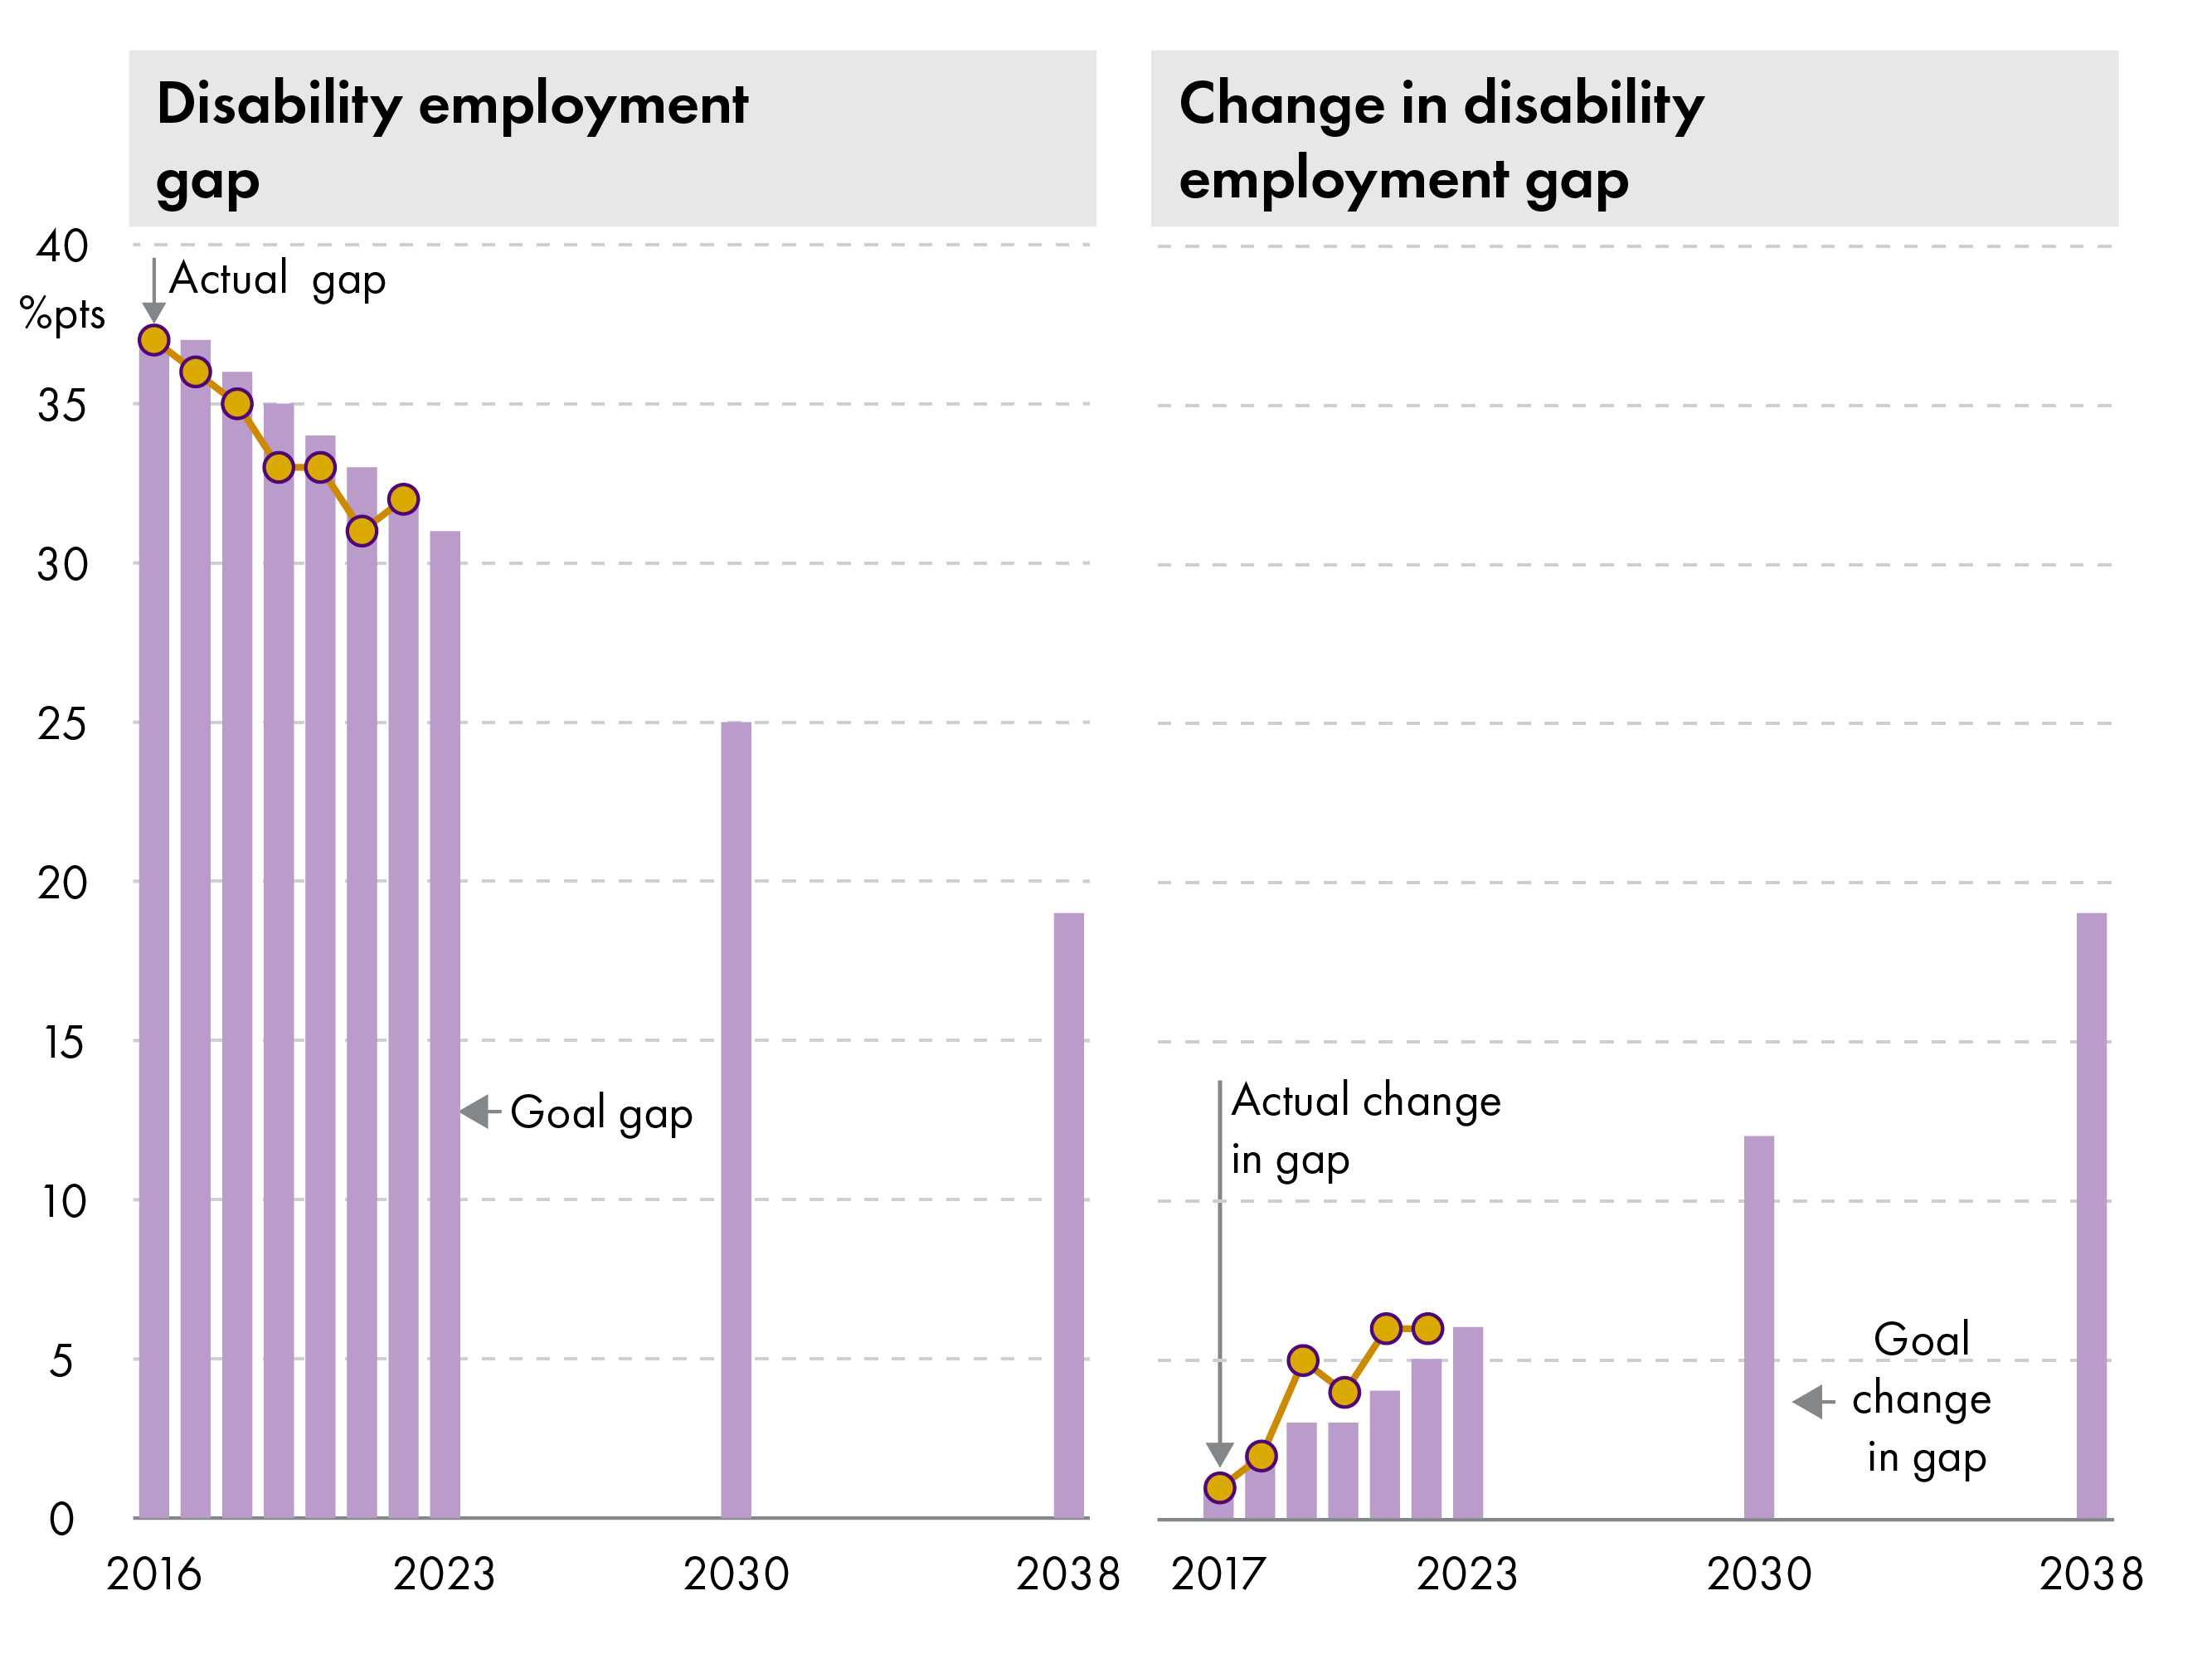
Scotland has a goal of reducing the employment gap by half between 2016 and 2038, from 37.4 percentage points to 18.7 percentage points. If this progress were linear, this would represent a change of a little under 1 percentage point each year. Chart 1 shows this linear progression towards the target, and the data we have so far measuring progress1.
Annual Population Survey, 2016 to 2022Office For National Statistics. (2023). ‘Annual Population Survey, January - December, 2014-2022’ UK Data Service. Retrieved from https://doi.org/10.5255/UKDA-SN-9069-3
So far, these results are promising – Scotland's employment gap has declined more quickly than the goal. It is not clear, however, why this has happened, nor if it is sustainable. This briefing will explore factors which have contributed to the progress so far against reducing the disability employment gap in Scotland.
About the authors
Allison Catalano and Chirsty McFadyen are economists at the Fraser of Allander Institute.
Allison and Chirsty have been working with the Scottish Parliament Information Centre (SPICe) as part of its Academic Fellowship programme. This aims to build links between academic expertise and the work of the Scottish Parliament.
The views expressed in this briefing are the views of the authors, not those of SPICe or the Scottish Parliament.
Contents
The gap in employment between disabled and non-disabled people
This section will set out the latest data we have on the employment rates for the disabled and non-disabled workforce in Scotland and the UK, introduces the four factors which have driven changes in the UK in recent years according to the DWP analysis, explains how the modelling will be applied to data on the Scottish labour market, and presents an overview of the findings. .
Employment rates for Scotland and the rest of the UK
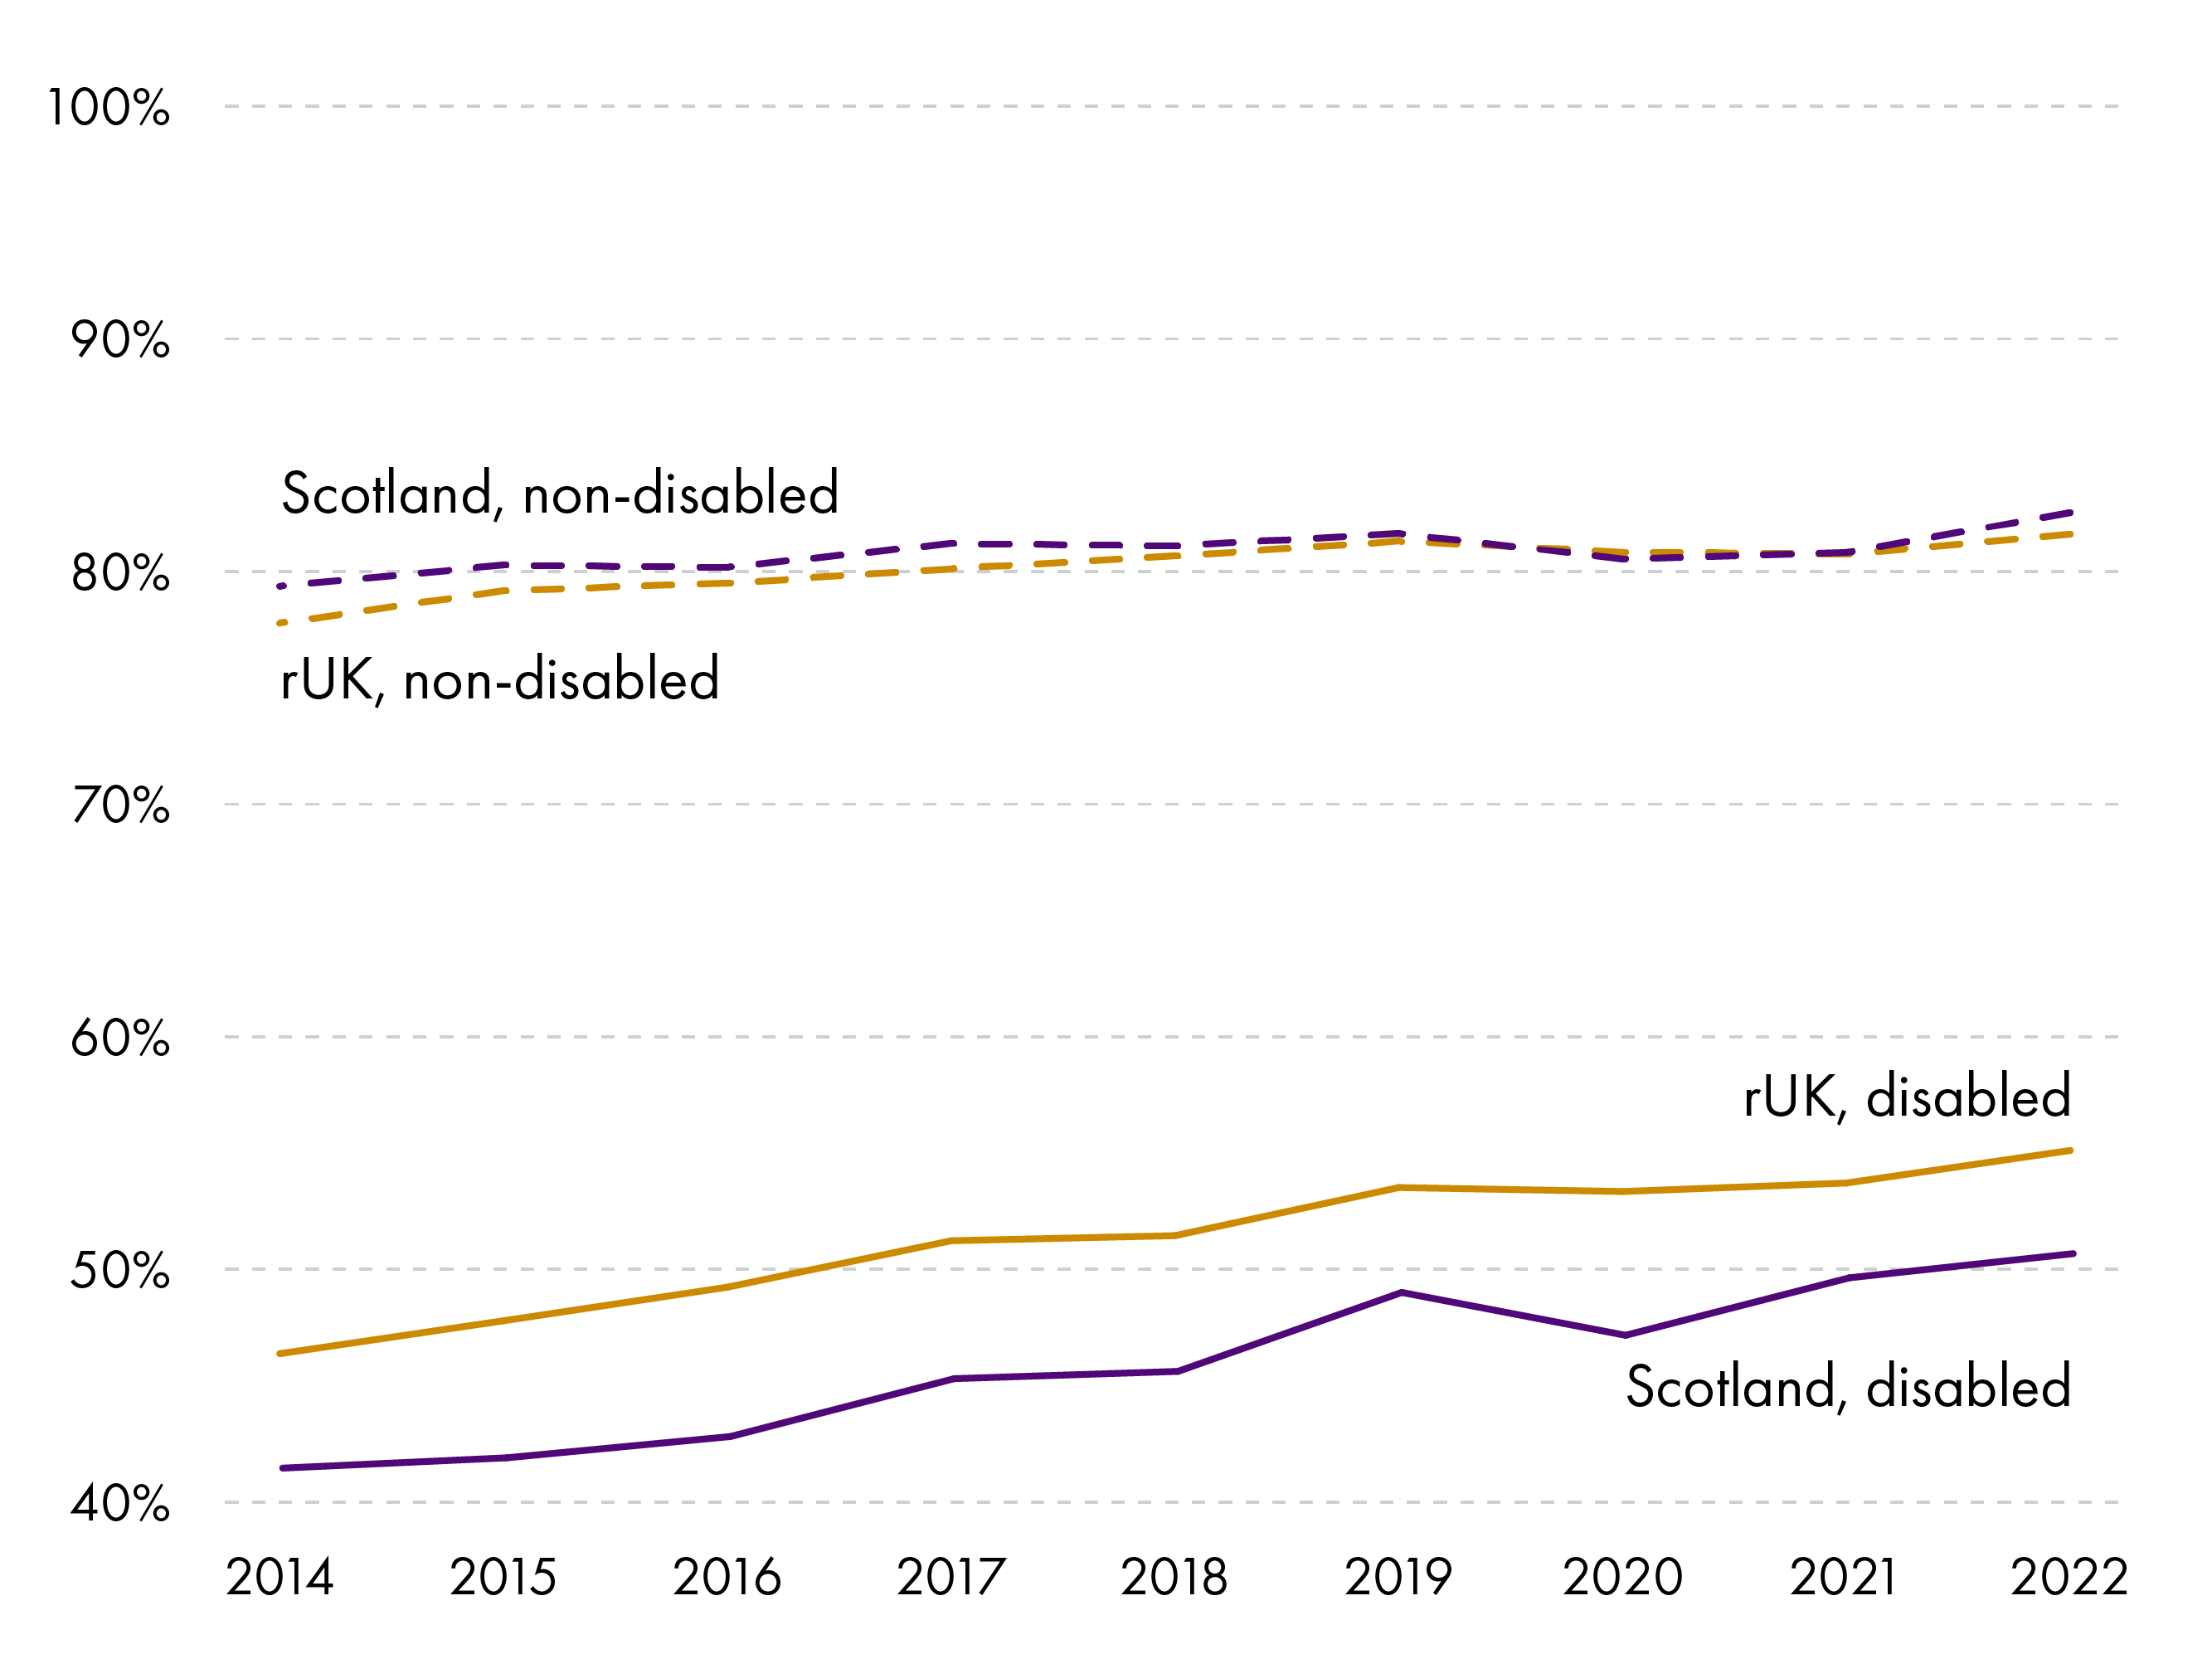
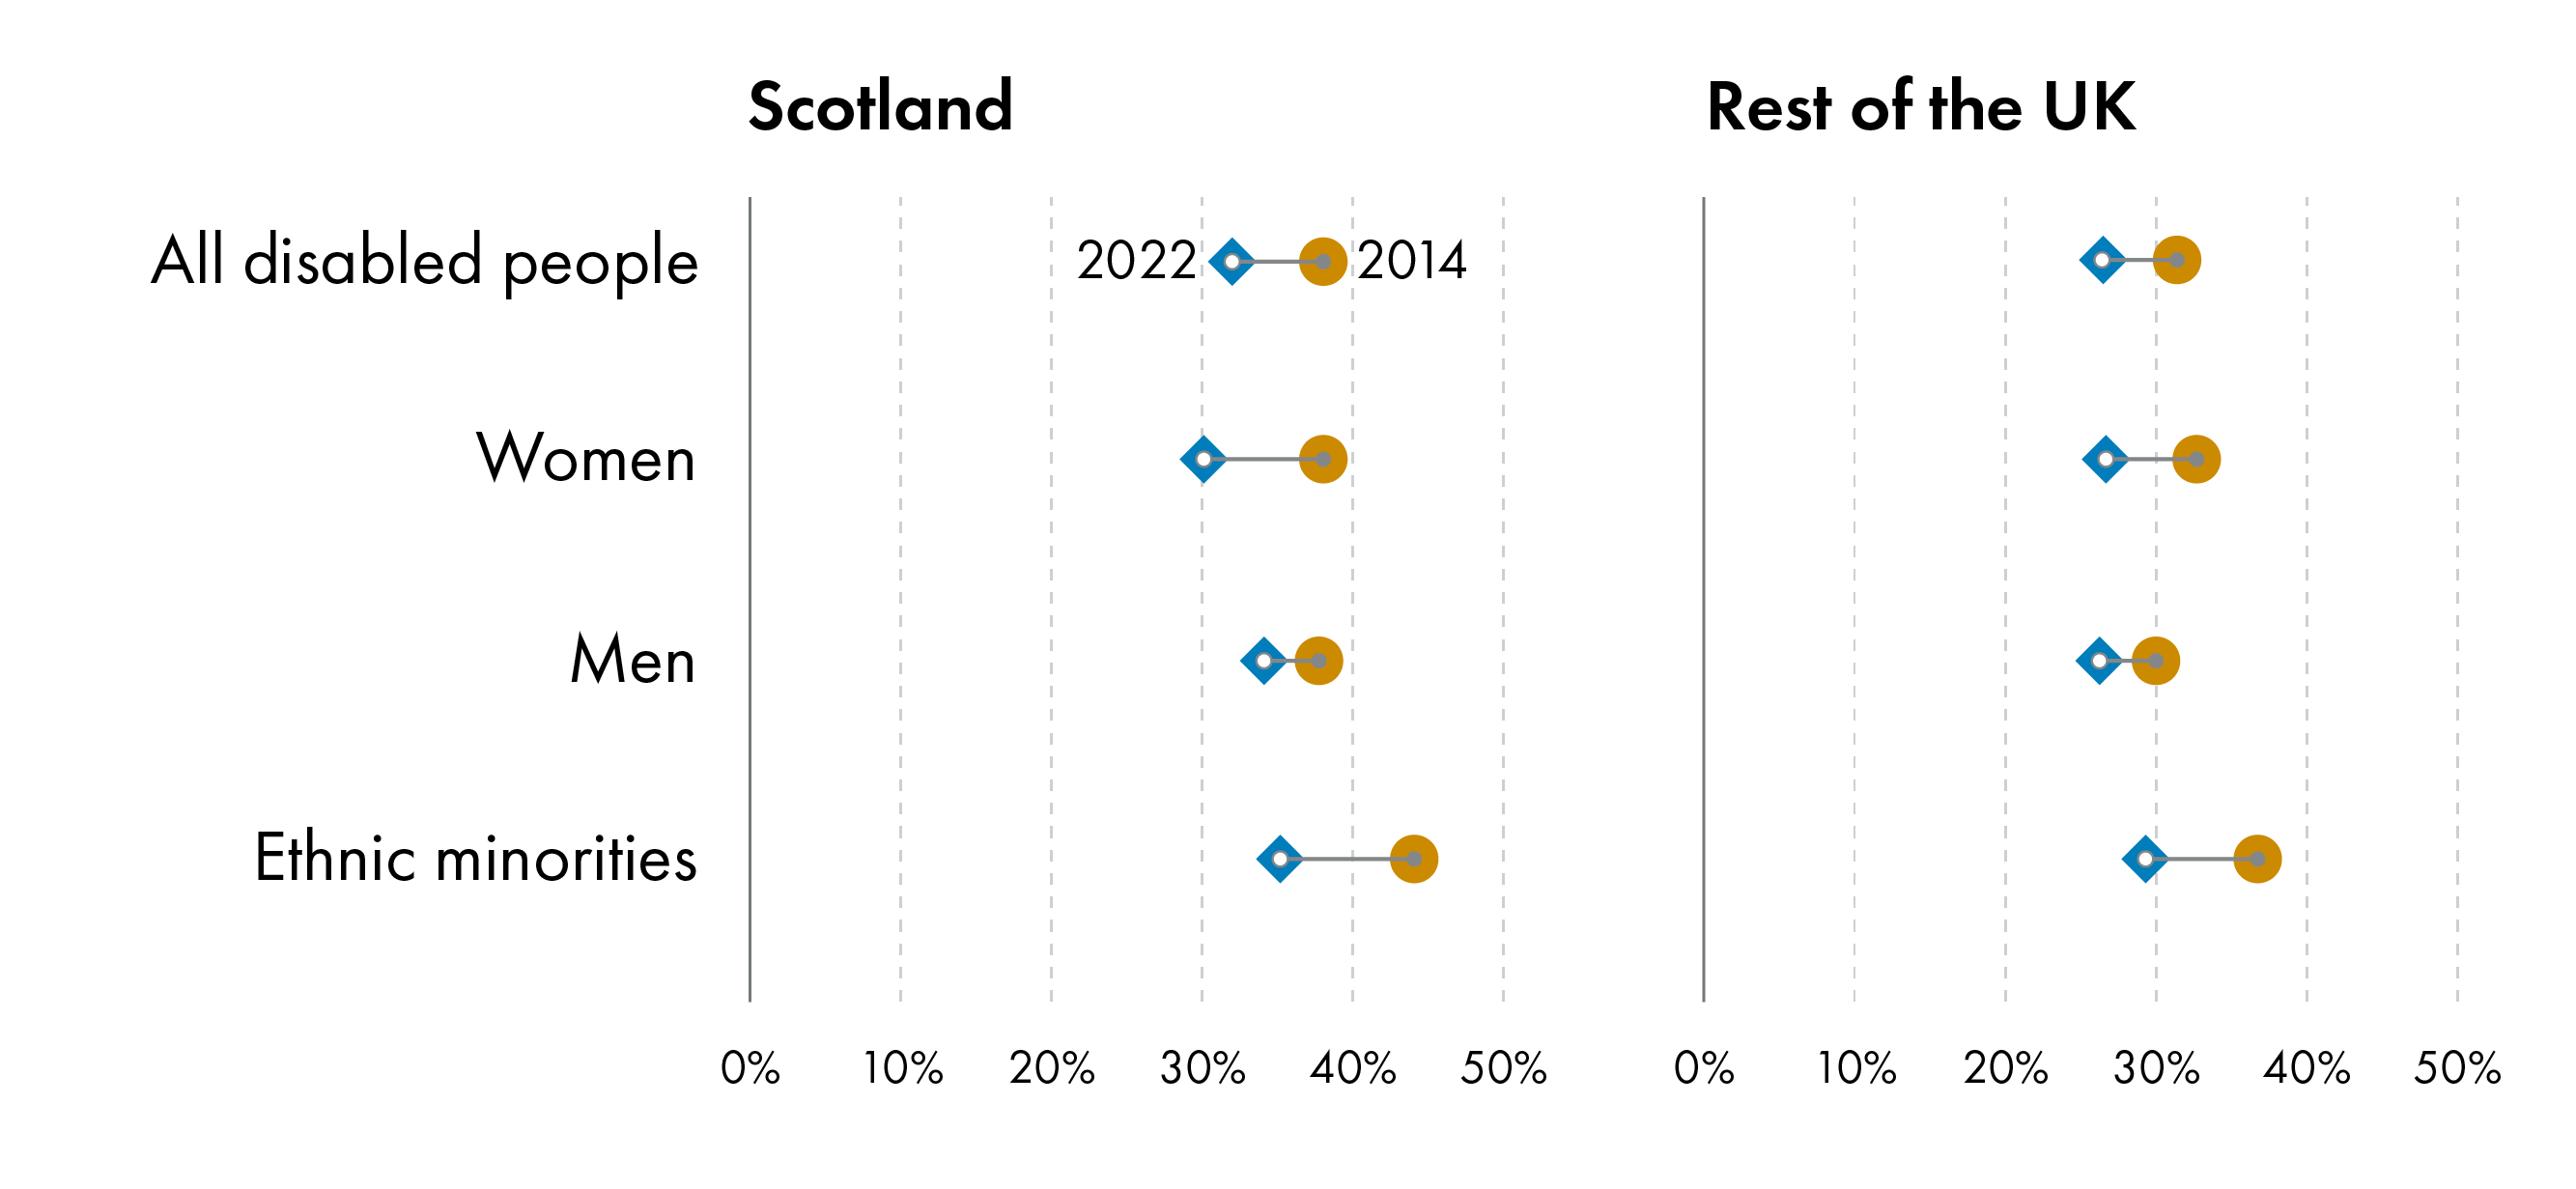
In 2014, around 41% of disabled people in Scotland were in work. This has grown to nearly 51% as of 2022. Employment rates have also increased for non-disabled people over this time period, but not as quickly as for disabled people. In total, the gap between disabled people and non-disabled people improved by 6 percentage points over this time frame.
This is a greater drop in the disability employment gap in Scotland than the rest of the UK (rUK) experienced over these eight years. However ,while progress has been quicker in Scotland, the disability employment rate has nonetheless been persistently lower in Scotland while non-disabled employment rates are broadly comparable, meaning that the disability employment gap remains higher than for the rest of the country (Chart 2).
Annual Population Survey, 2014 to2022Office For National Statistics. (2023). ‘Annual Population Survey, January - December, 2014-2022’ UK Data Service. Retrieved from https://doi.org/10.5255/UKDA-SN-9069-3
Modelling contributing factors to the change in disability employment
In 2022, there were almost 200,000 more disabled people in the Scottish workforce compared to 2013, and around 2 million more disabled people in the workforce across the entire UK1. There are four factors which could have contributed to this increase in employment:
Disability prevalence: More people are qualifying as disabled.
A change in the non-disabled employment rate: This also allows us to examine the gap between disabled and non-disabled employment rates. An increase in non-disabled employment rates may also indicate that there are overall more jobs available in the economy.
An increase in disabled employment: The gap in employment between disabled and non-disabled workers has decreased due to something beyond the scope of this model which has allowed more disabled people to gain access to work. For example, a work-related policy has had a direct impact on the number of disabled people entering work in Scotland.
An increase in the overall working-age population: An increase in the total number of potential workers implies a change in the overall number of jobs available to people regardless of disability status.
Model methodology
Understanding the way these four factors interacted with each other involved modelling the differences between them in June-September 2013 and June-September 2022 using the Quarterly Labour Force survey. The methodology used replicates analysis created by the DWP at a Scotland level instead of at a UK-wide level.
Investigating how each factor interacted with the overall volume of disability employment involved creating 14 hypothetical scenarios:
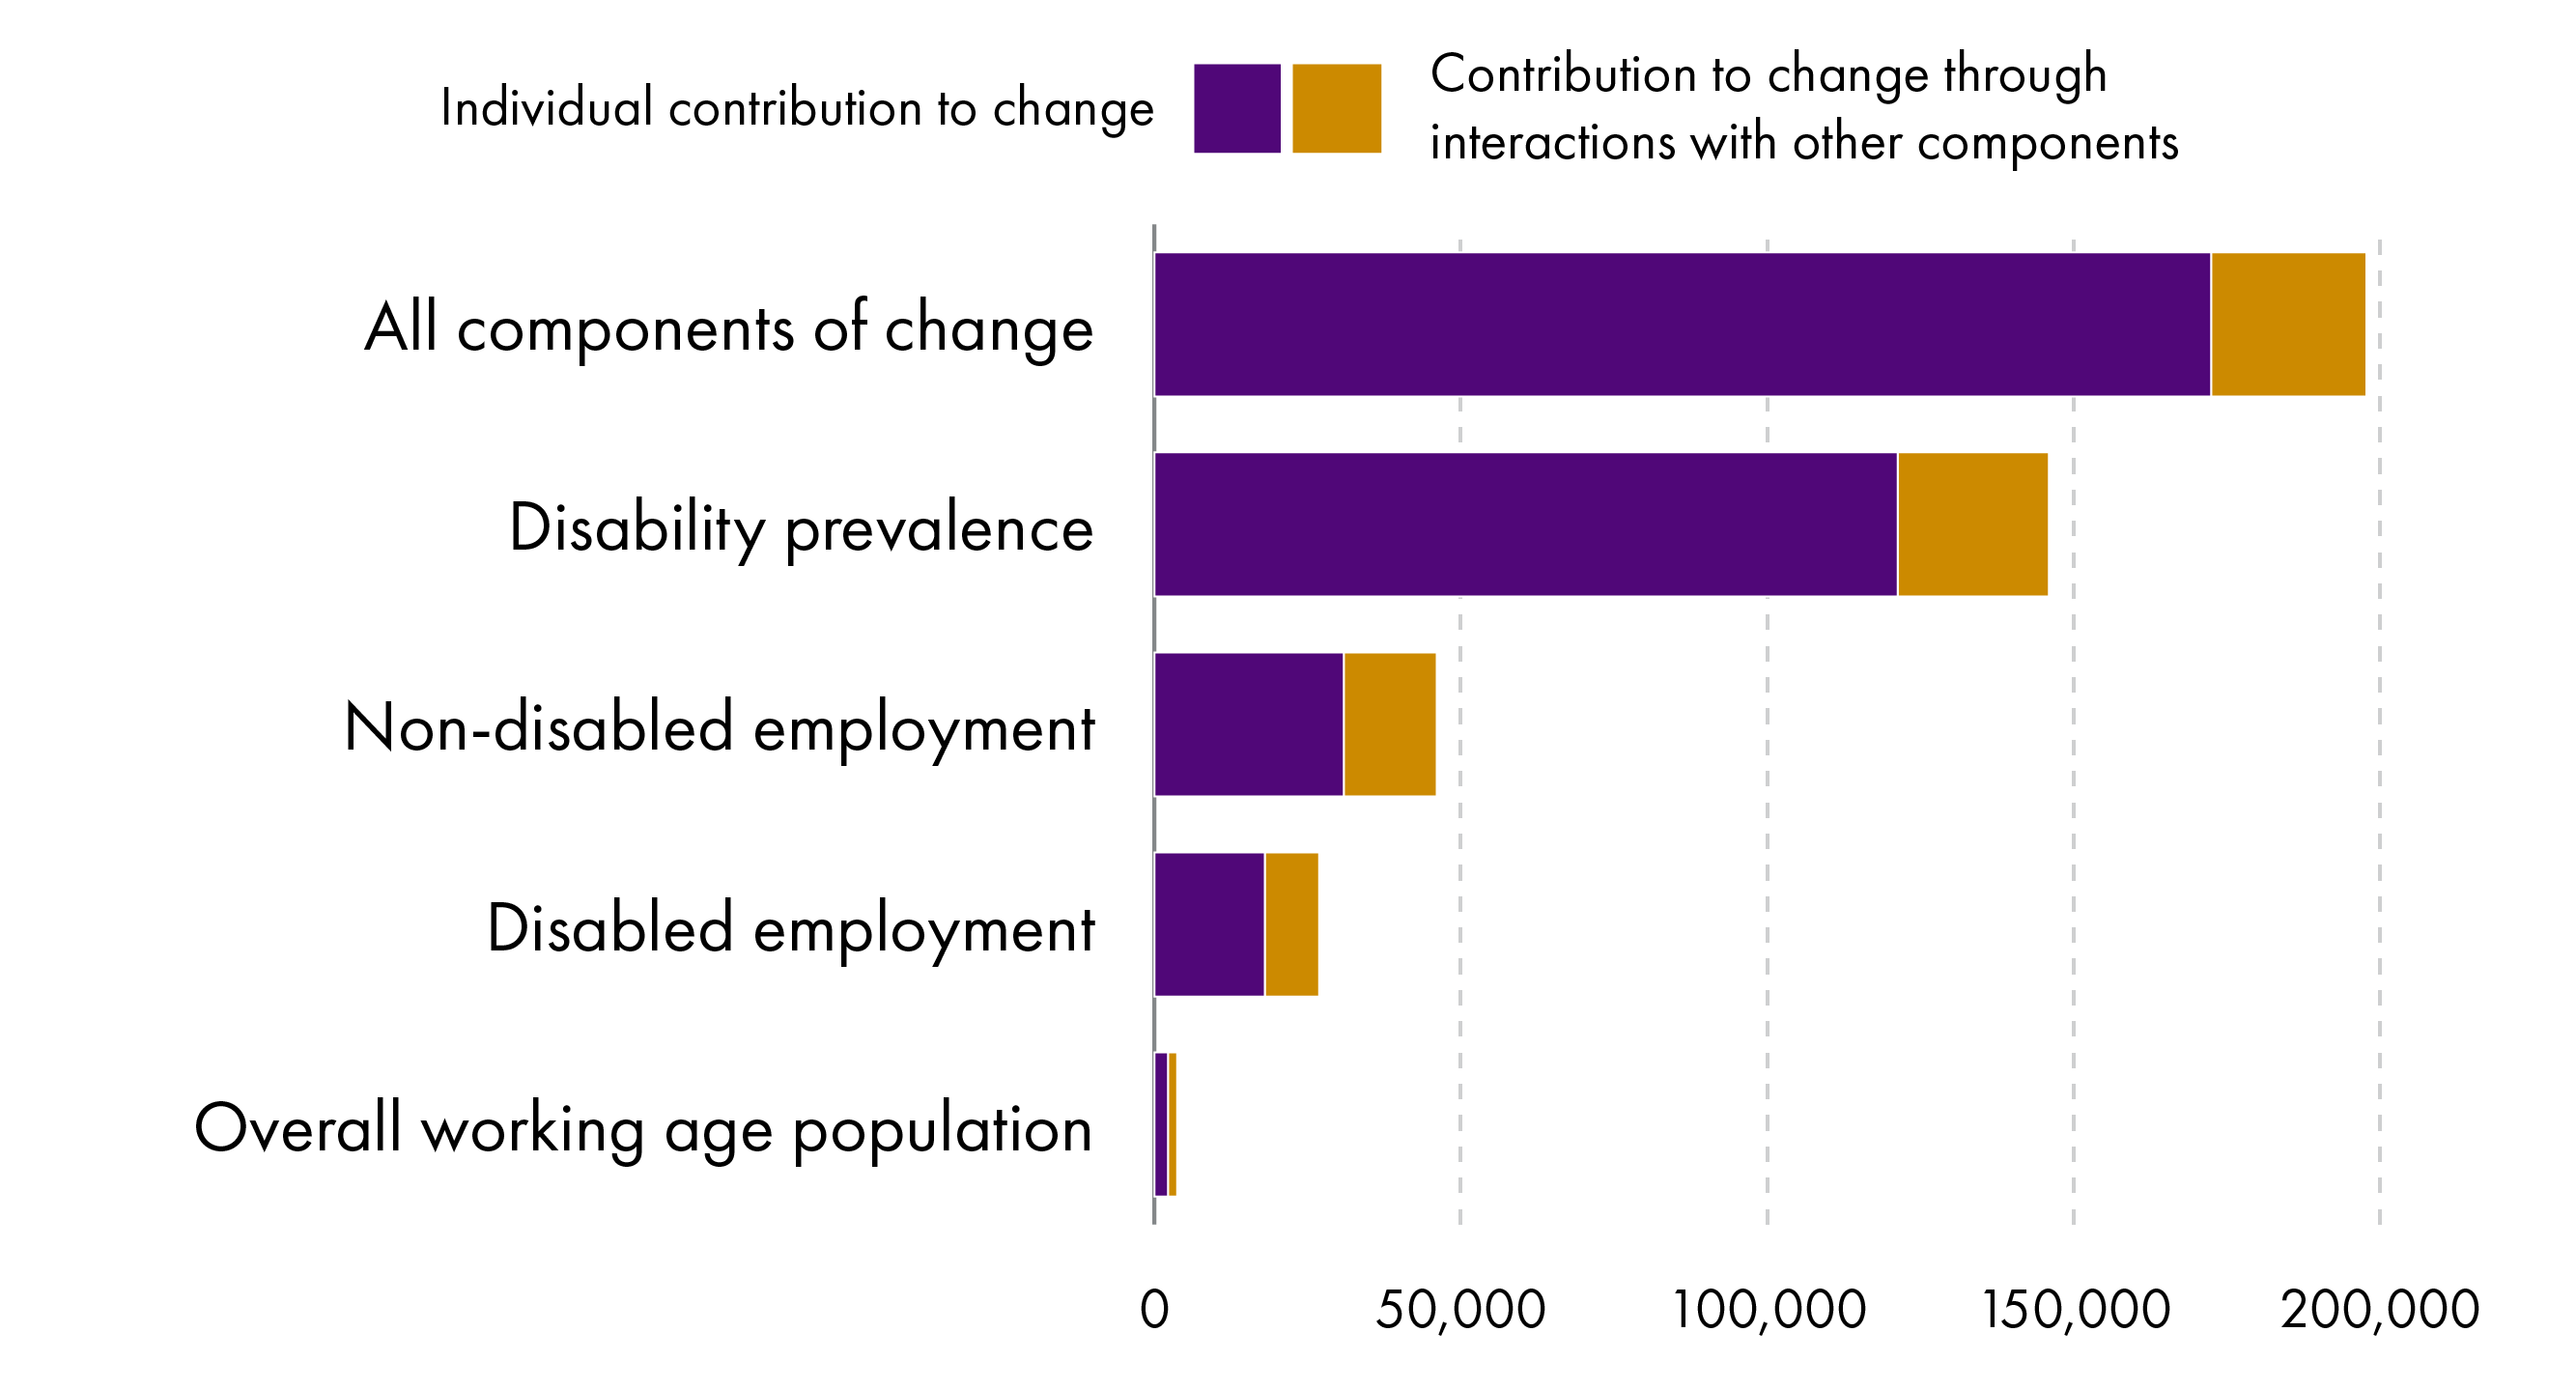
Four scenarios wherein all but one factors were held constant at 2013 levels. This figure gave us an approximation for the individual contribution to the change in employment levels, as given in Chart 3.
Six scenarios wherein two factors remained at 2013 levels and two factors changed to 2022 levels. These figures show a potential additional contribution to change due to an interaction between two factors.
Four scenarios wherein all but one factor changed from 2013 levels. This showed how much employment could not be contributed to the factor left unchanged.
The DWP provides a full methodology used in scenario in in this document under ‘Analysing Components of Change’ which accompanied the DWP report entitled Employment of Disabled People 20221.
Model outcomes
While all four factors affected the Scottish and the rUK labour markets, there were some differences in each factor's contribution. The most significant contributor, for both the UK and for Scotland, was an increase in overall disability prevalence. This factor had a great impact on Scottish employment rates, however, due to a higher rate of people in Scotland moving into a disability. Although Scotland's improvement in the disability employment gap has been more substantial, it appears that this is due to a higher proportion of the population claiming a disability, rather than a higher rate of workless disabled people moving into employment (Table 1).
The impact of an increase in disabled employment made a smaller contribution in Scotland compared to the rUK. This does not mean that no external factors contributed to disabled Scots moving into employment, but rather reinforces how much of the change is due, simply, to an increase in disability rates.
| Component of change in disability employment | Proportion of change in UK | Proportion of change in Scotland | Approximate range of disabled people added to the UK workforce | Approximate range of disabled people added to the Scottish workforce |
|---|---|---|---|---|
| Total change in disability employment | 100% | 100% | 2,000,000 | 198,000 |
| Change due to disability prevalence | 61% | 70% | 1,080,000 to 1,340,000 | 121,000 to 146,000 |
| Change due to an increase in non-disabled employment | 18% | 18% | 320,000 to 450,000 | 31,000 to 46,000 |
| Change due to an increase in disabled employment | 17% | 10% | 290,000 to 410,000 | 18,000 to 27,000 |
| Change due to an increase in the overall working-age population | 4% | 1% | 70,000 to 110,000 | 2,200 to 3,700 |
Quarterly Labour Force Survey, June - September 2013; June to September 2022Office For National Statistics. (2023). Quarterly Labour Force Survey, 1992-2023. UK Data Service.. Retrieved from https://doi.org/10.5255/UKDA-SN-9069-3
Quarterly Labour Force Survey, June - September 2013; June to September 2022Office For National Statistics. (2023). Quarterly Labour Force Survey, 1992-2023. UK Data Service.. Retrieved from https://doi.org/10.5255/UKDA-SN-9069-3
The total changes for each factor between June-September 2013 and June-September 2022 are telling. The Scottish working-age population remained relatively stable, although the number of non-disabled people shrunk significantly (Table 2).
| 2013 | 2022 | Change | |
|---|---|---|---|
| Number of disabled people | 599,000 | 896,000 | 297,000 |
| Number of disabled people in employment | 252,000 | 449,000 | 197,000 |
| Number of non-disabled people | 2,800,000 | 2,540,000 | -260,000 |
| Number of non-disabled people in employment | 2,230,000 | 2,150,000 | -80,000 |
Quarterly Labour Force Survey, June – September 2013; June – September 2022. Based on rounded figuresOffice For National Statistics. (2023). Quarterly Labour Force Survey, 1992-2023. UK Data Service.. Retrieved from https://doi.org/10.5255/UKDA-SN-9069-3
This leads us to two questions:
Why did disability prevalence change so significantly?
Why are more disabled people in work?
Why has disability prevalence increased?
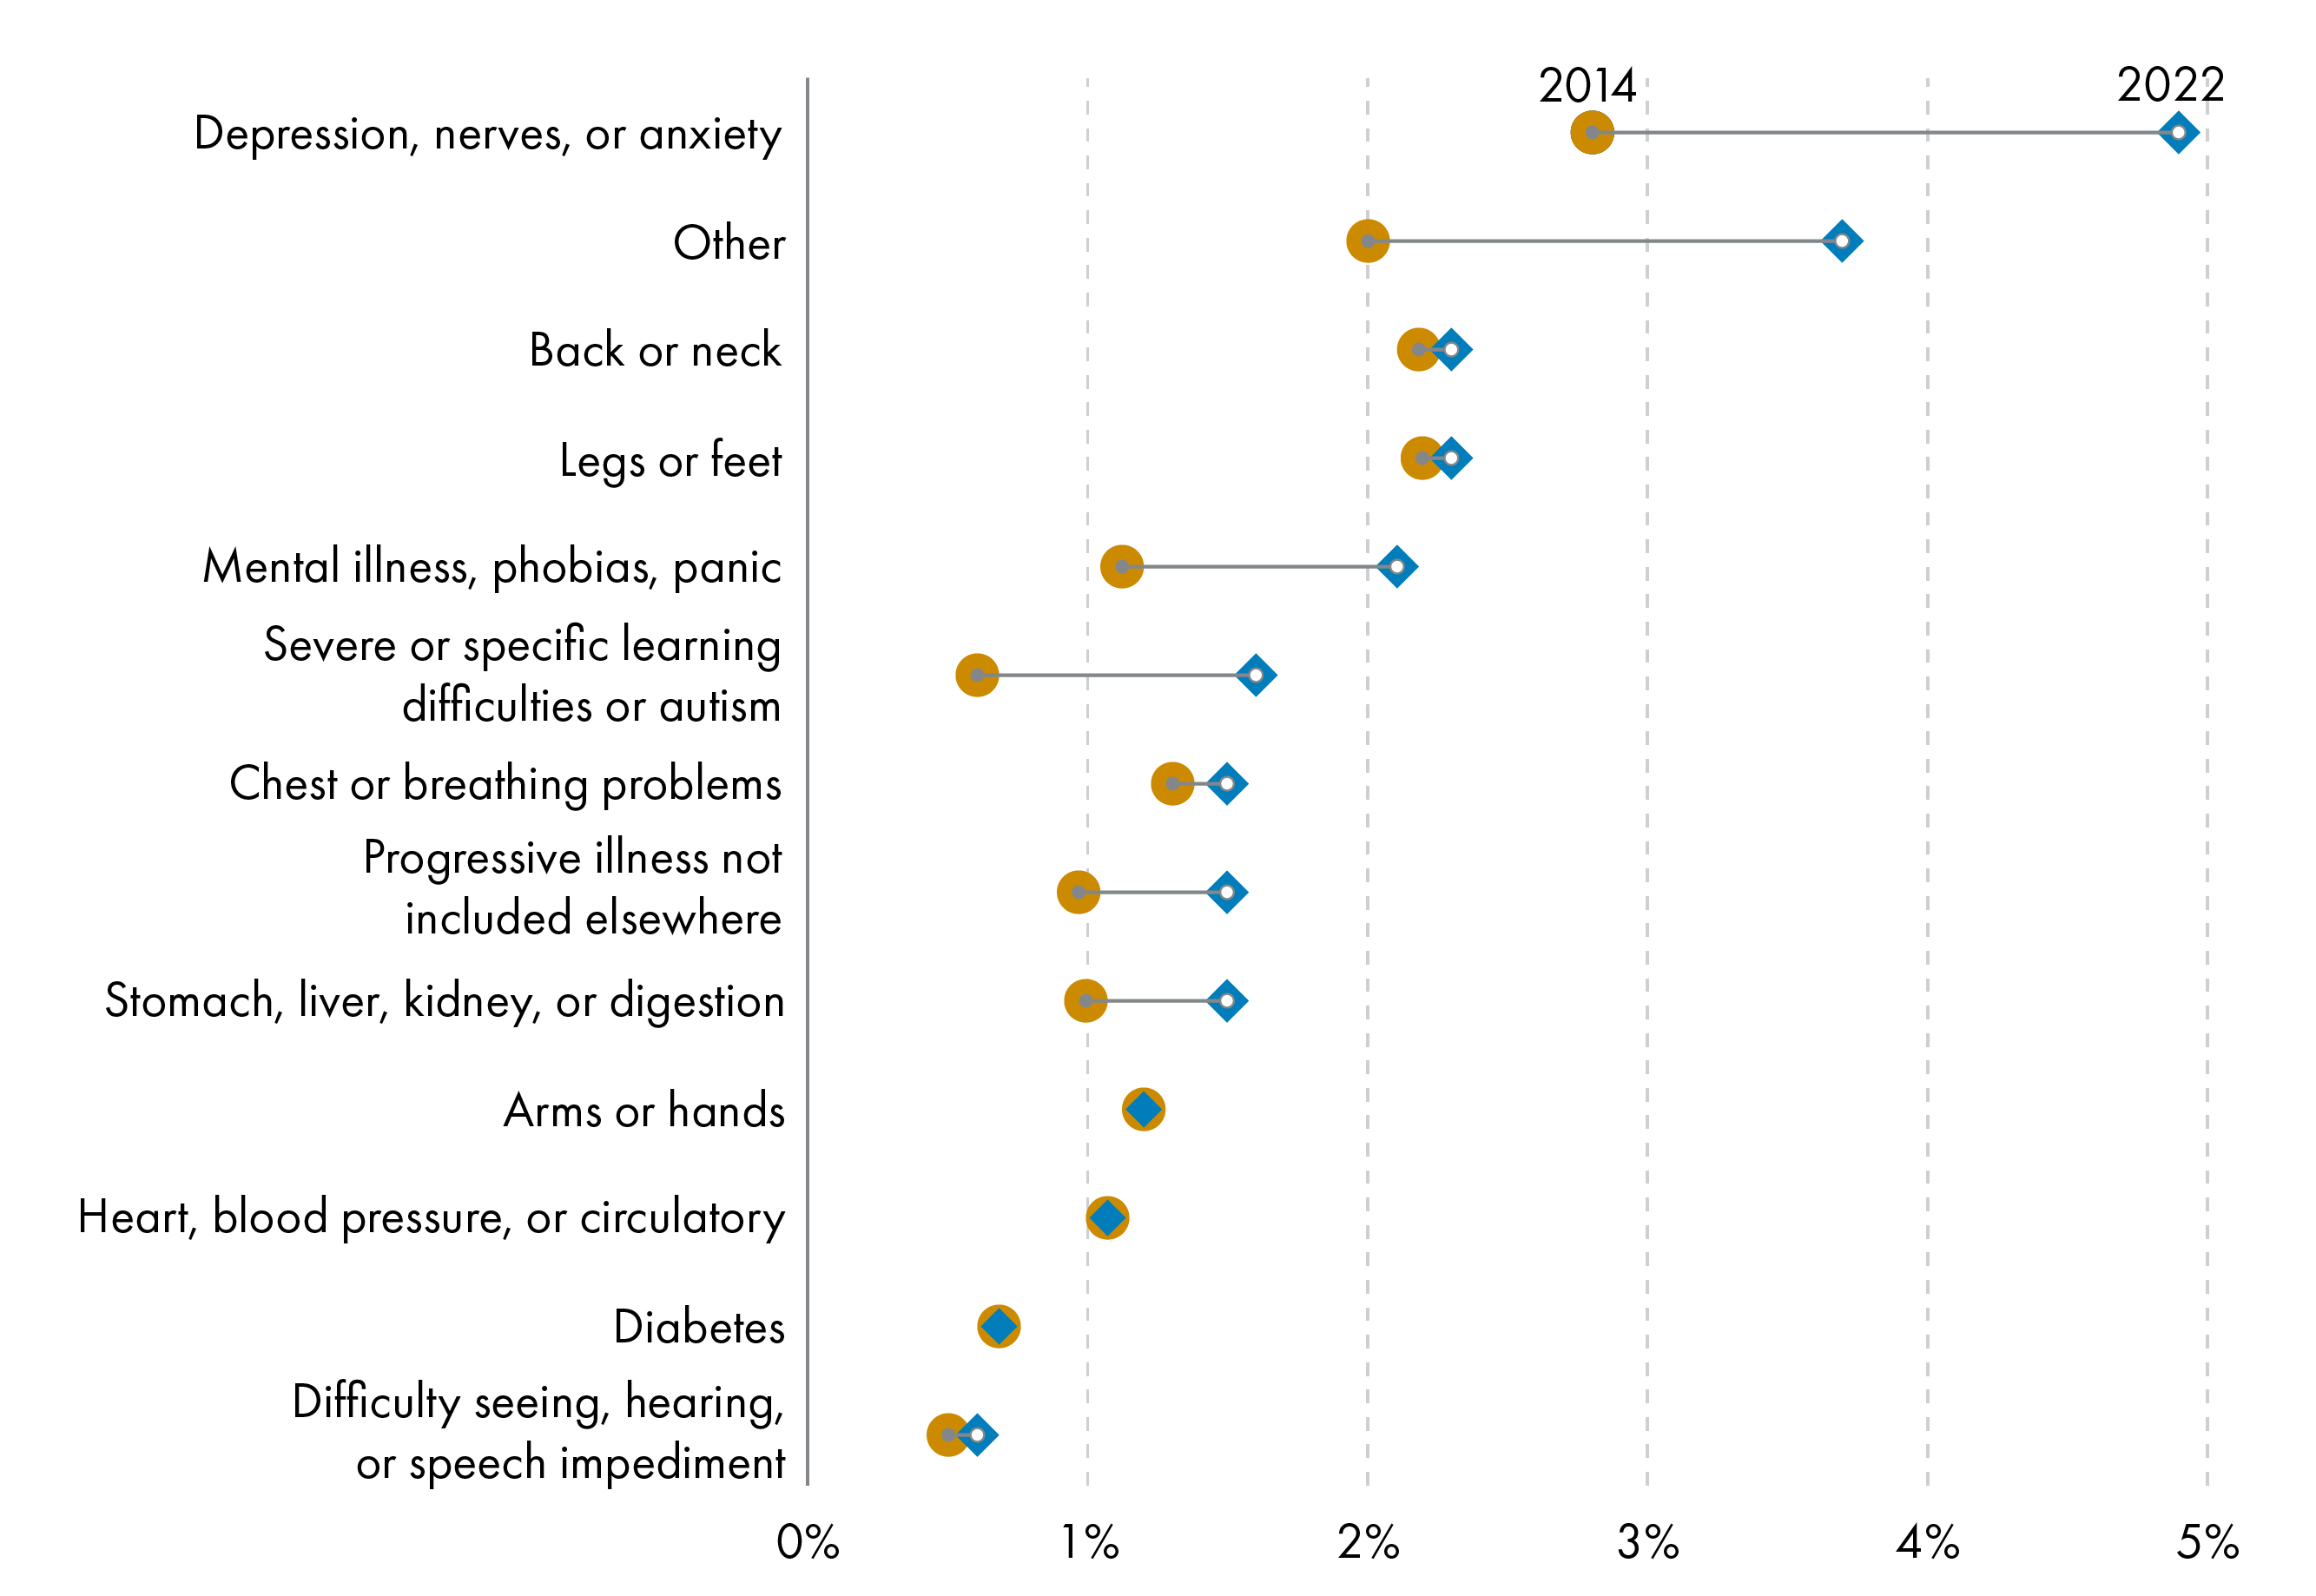
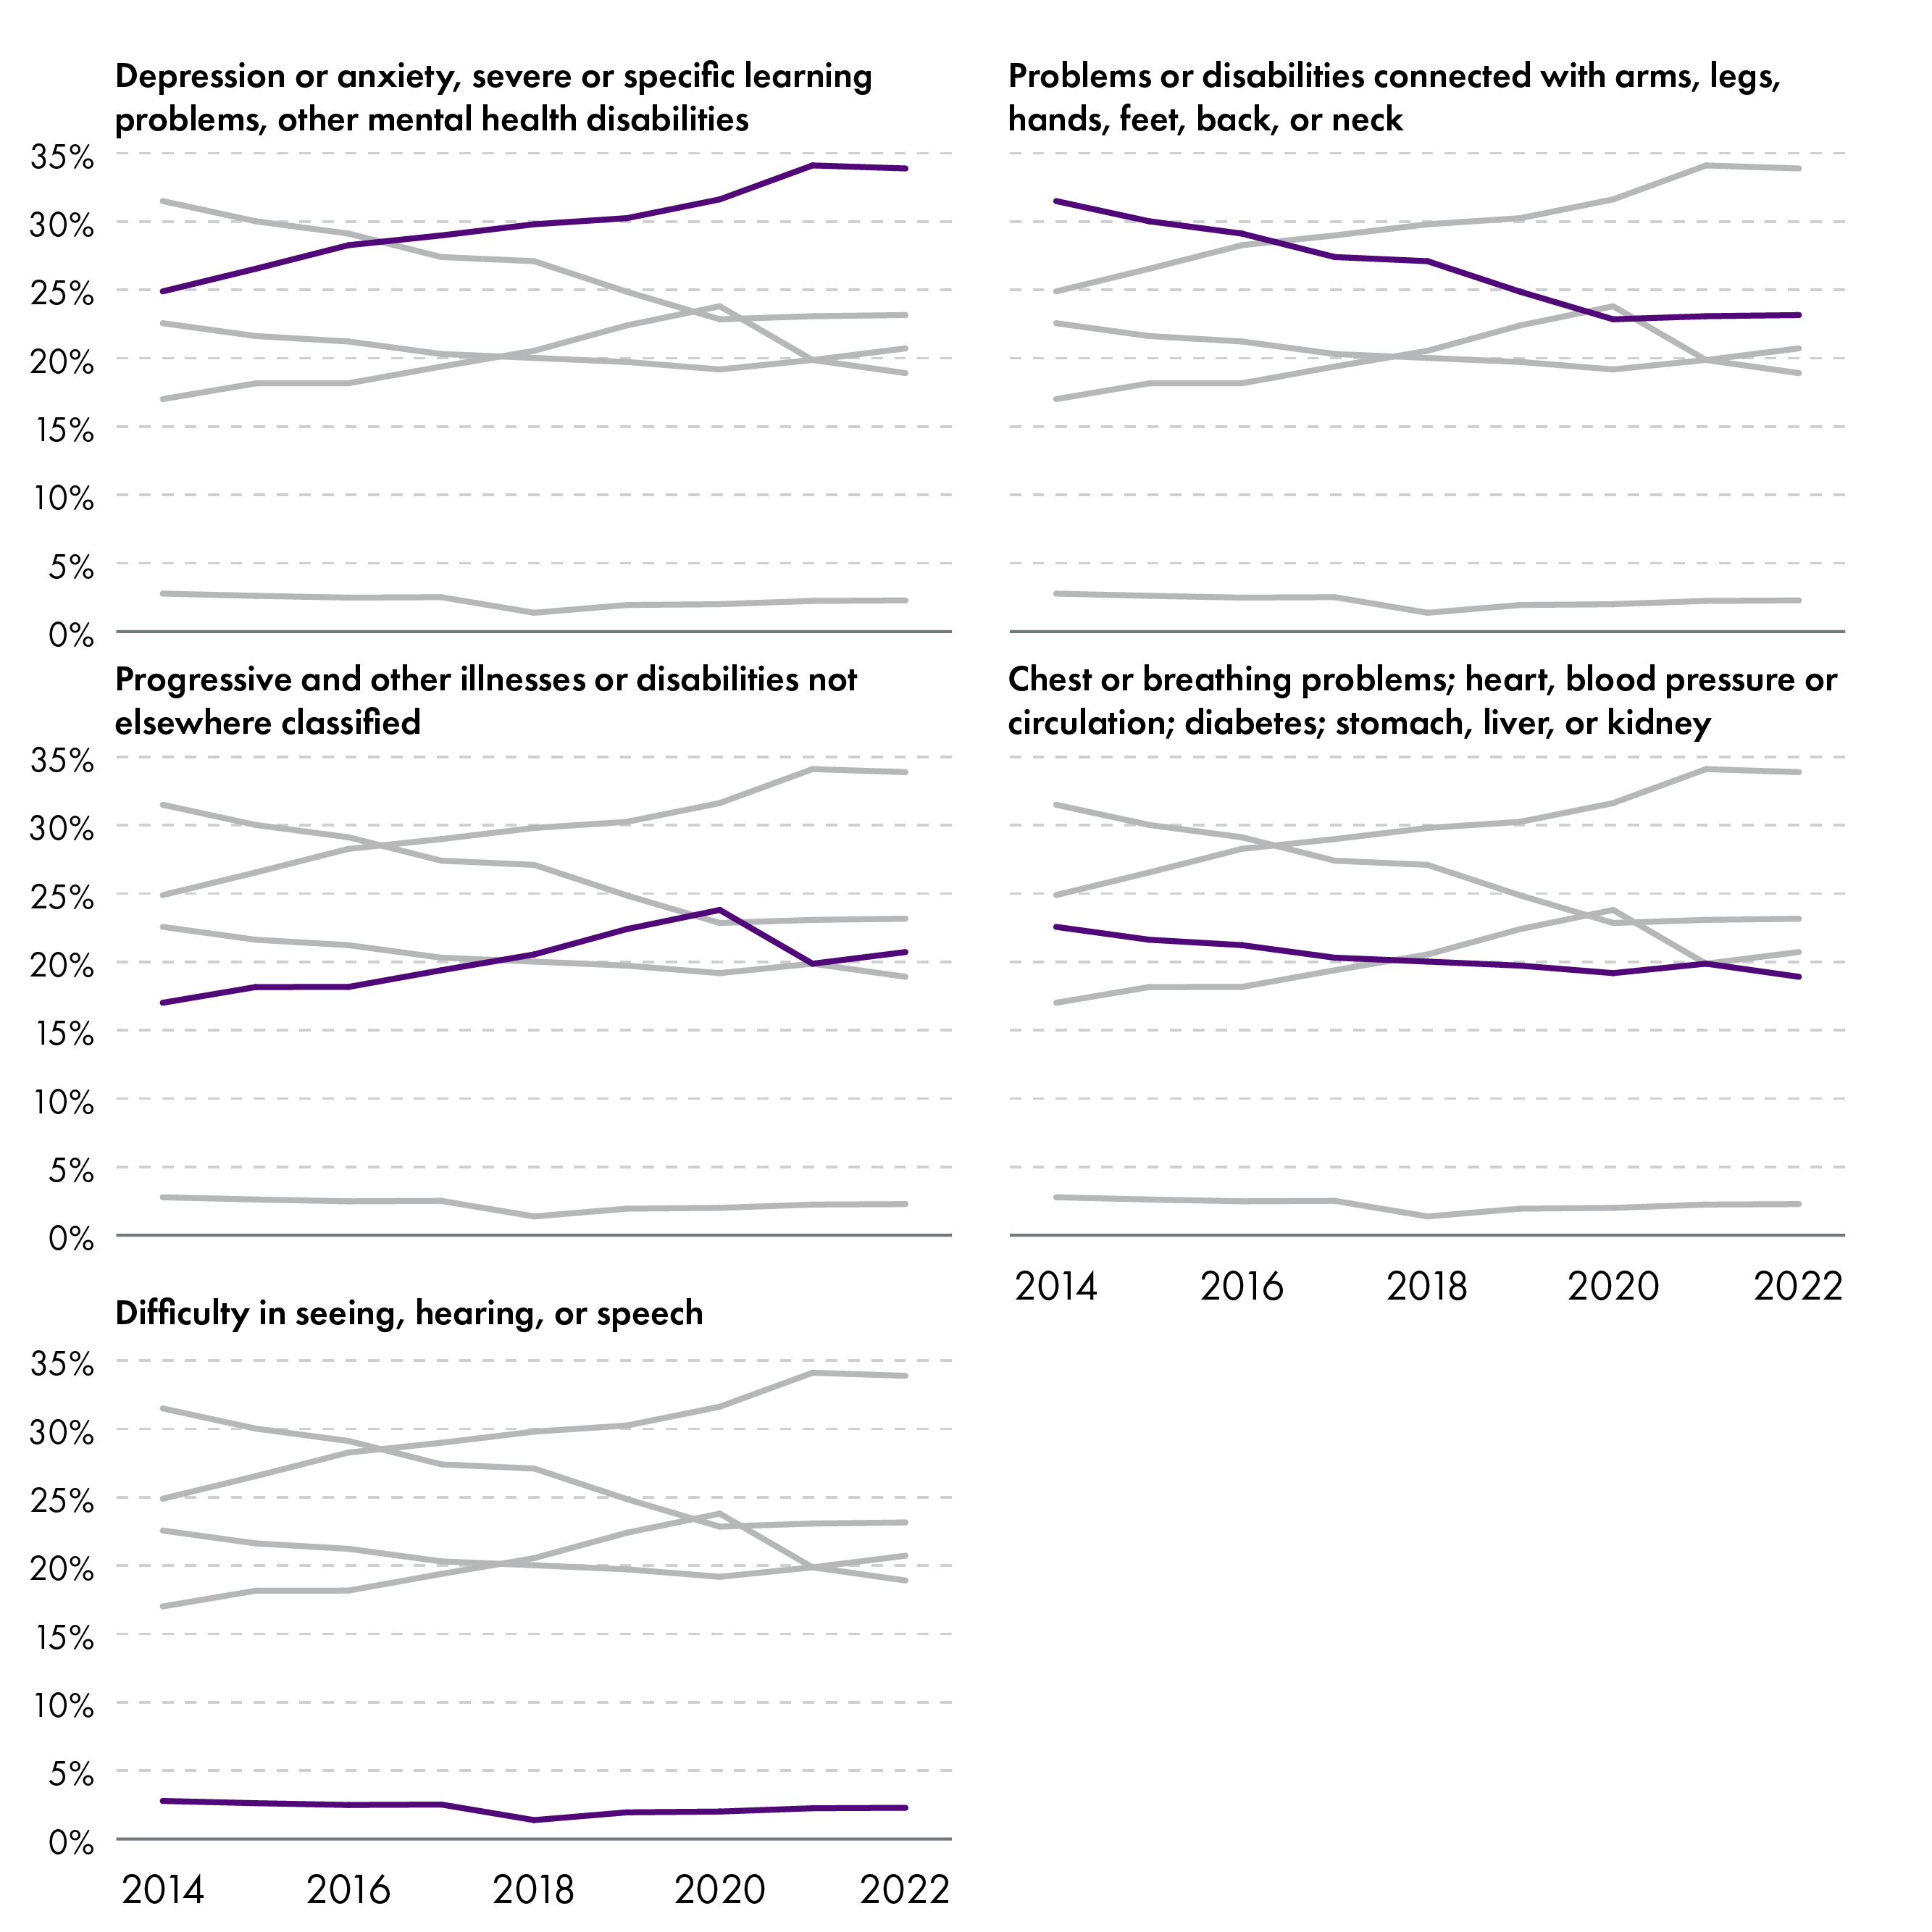
Rates of depression, mental illness, and learning difficulties among the Scottish population have increased dramatically since 2014 (Chart 4). Around a third of the disabled population was comprised of people with musculoskeletal conditions in 2014; this has now dropped to less than a quarter of the disabled population. People with mental illnesses and learning difficulties are now the largest proportion of the disabled population, with over 35% of disabled people claiming mental health issues as their main disability (Chart 5). In fact, changes in rates of mental health disabilities are the largest reason for this increase in disability prevalence. Of the 250,000 people who were added to the disabled population between 2014 and 2022, over half of them cited a mental health disability or learning difficulty as their main health concern.
Annual Population Survey, 2014-2022Office For National Statistics. (2023). ‘Annual Population Survey, January - December, 2014-2022’ UK Data Service. Retrieved from https://doi.org/10.5255/UKDA-SN-9069-3
Annual Population SurveyOffice For National Statistics. (2023). ‘Annual Population Survey, January - December, 2014-2022’ UK Data Service. Retrieved from https://doi.org/10.5255/UKDA-SN-9069-3
It is not clear why mental health conditions have been increasing steadily over the past decade. It is likely due to an increase in reporting mental health conditions, however, rather than an increase in people experiencing mental health conditions. Scotland is not alone in this trend – the Covid-19 pandemic contributed to increases in mental health issues worldwide, but mental health problems had been on the rise prior to 20203.
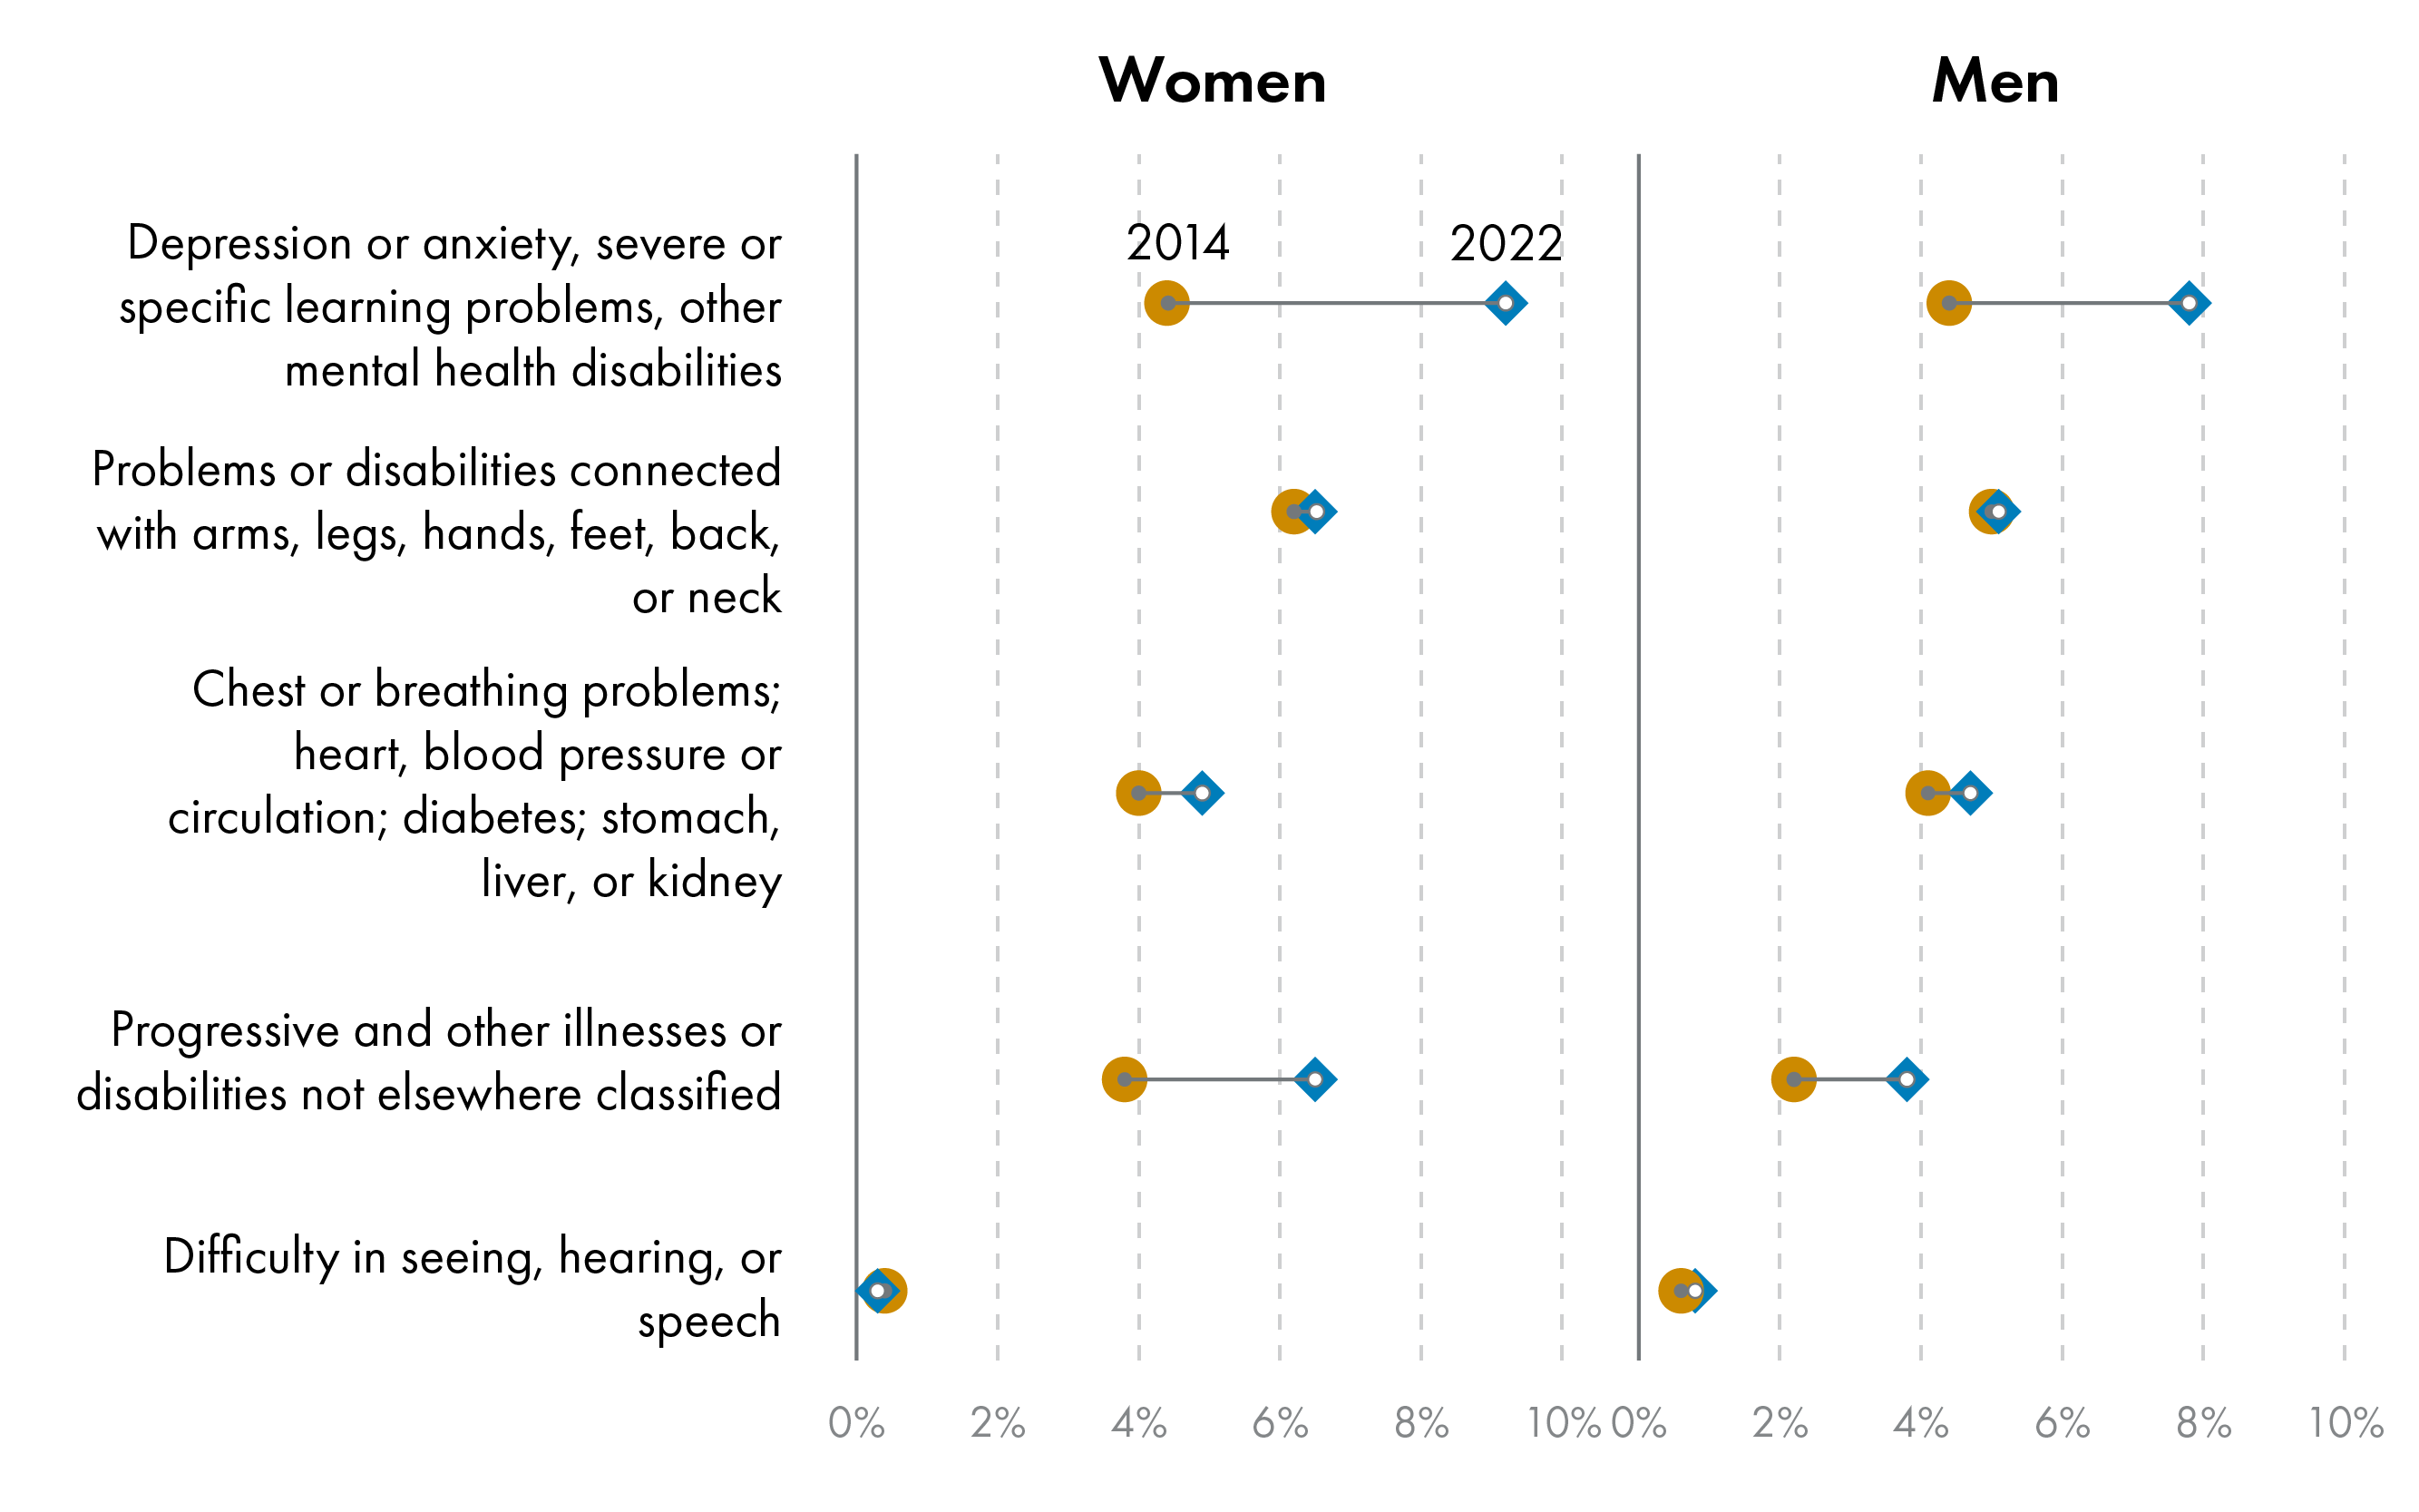
Looking to demographic differences, mental health conditions increased dramatically for both men and women. Interestingly, men in Scotland have lower rates of reporting almost all disabilities compared to women, with the exception of seeing, hearing, or speech-related disabilities (Chart 6).
Annual Population Survey, 2014 to 2022
Change in employment rates
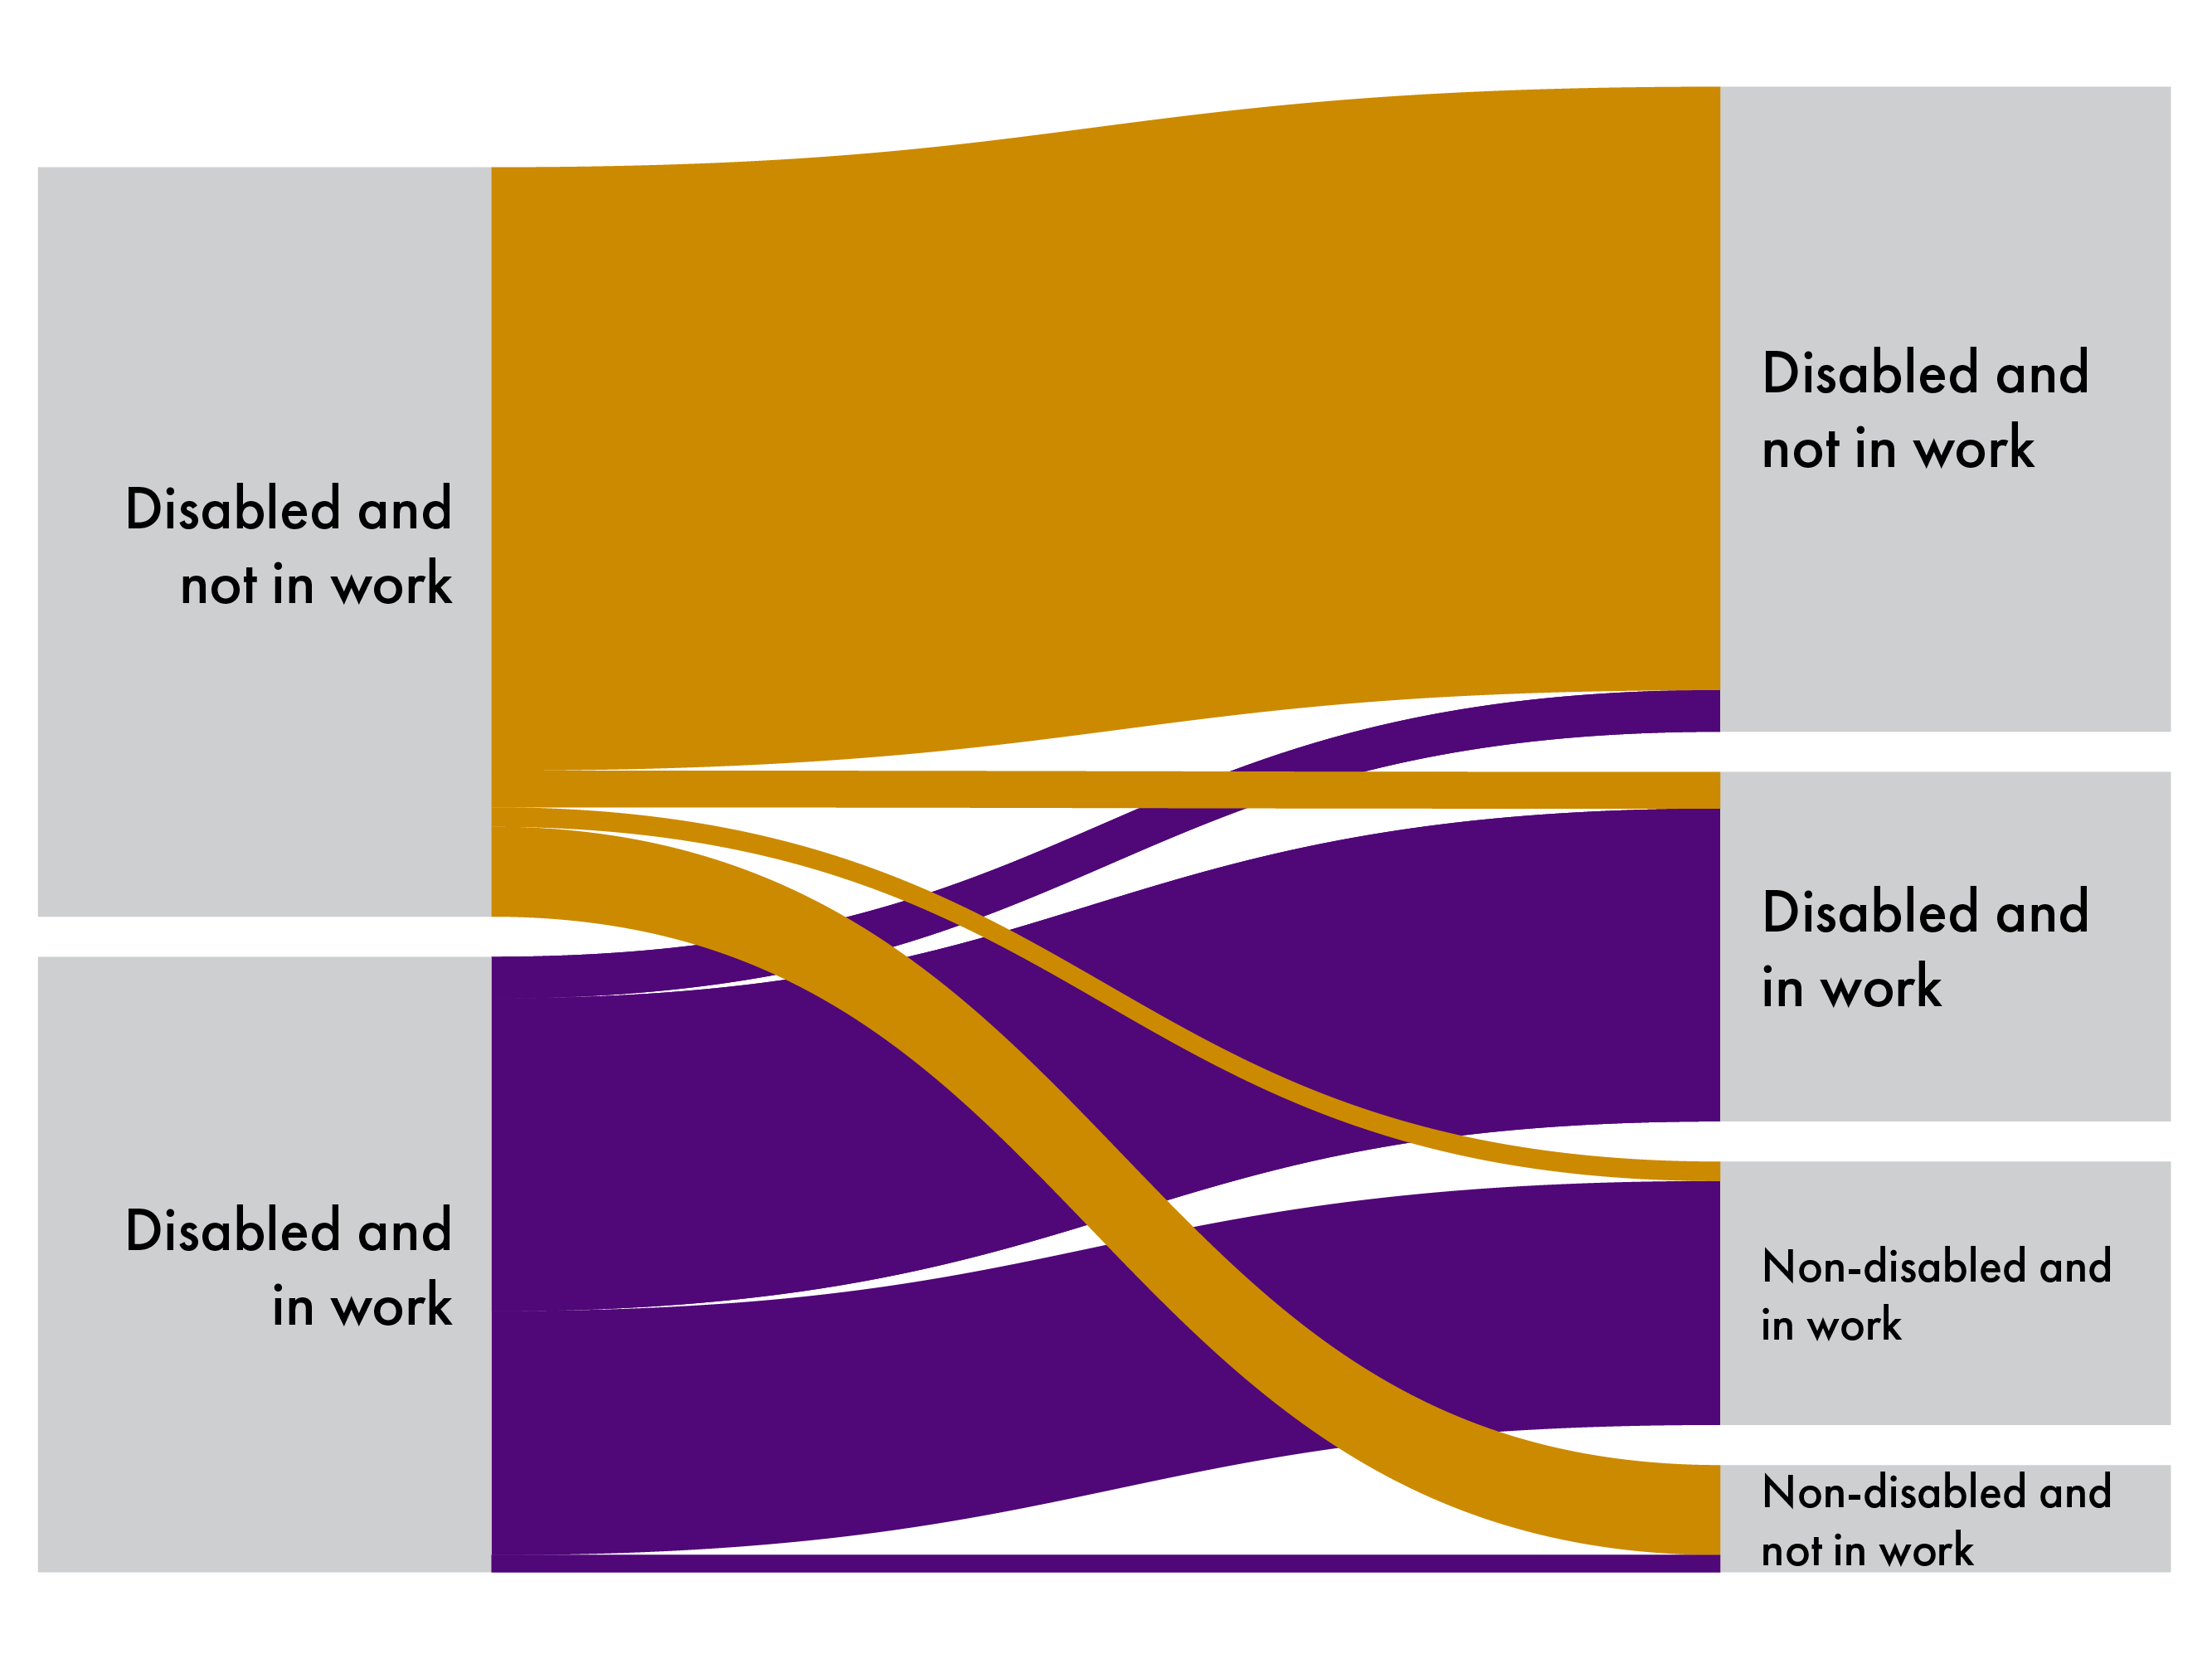
Given that the changes in disability prevalence impacted disabled employment more than any other factor, it would stand to reason that, in Scotland, people in work were likely to stay in work over this nine-year period, regardless of how their disability status changed over time. We can evaluate this by using the 2-wave Annual Population Survey to look at disabled people's transitions between year 1 and year 2. When examining pooled transitions between year 1 and year 2 from 2014/15 to 2020/21, it appears that the vast majority of disabled people who were out of work in one year remained out of work in the second year, even if their disability status changed (Figure 1).
Longitudinal Annual Population Survey, 2014/15 to 2020/21Office For National Statistics. (2023). ‘Annual Population Survey, January - December, 2014-2022’ UK Data Service. Retrieved from https://doi.org/10.5255/UKDA-SN-9069-3
However, some progress has been made. Had all other factors remained constant, we estimate that approximately 18,000 disabled people would still have moved into work due to an external change in work access among disabled people.
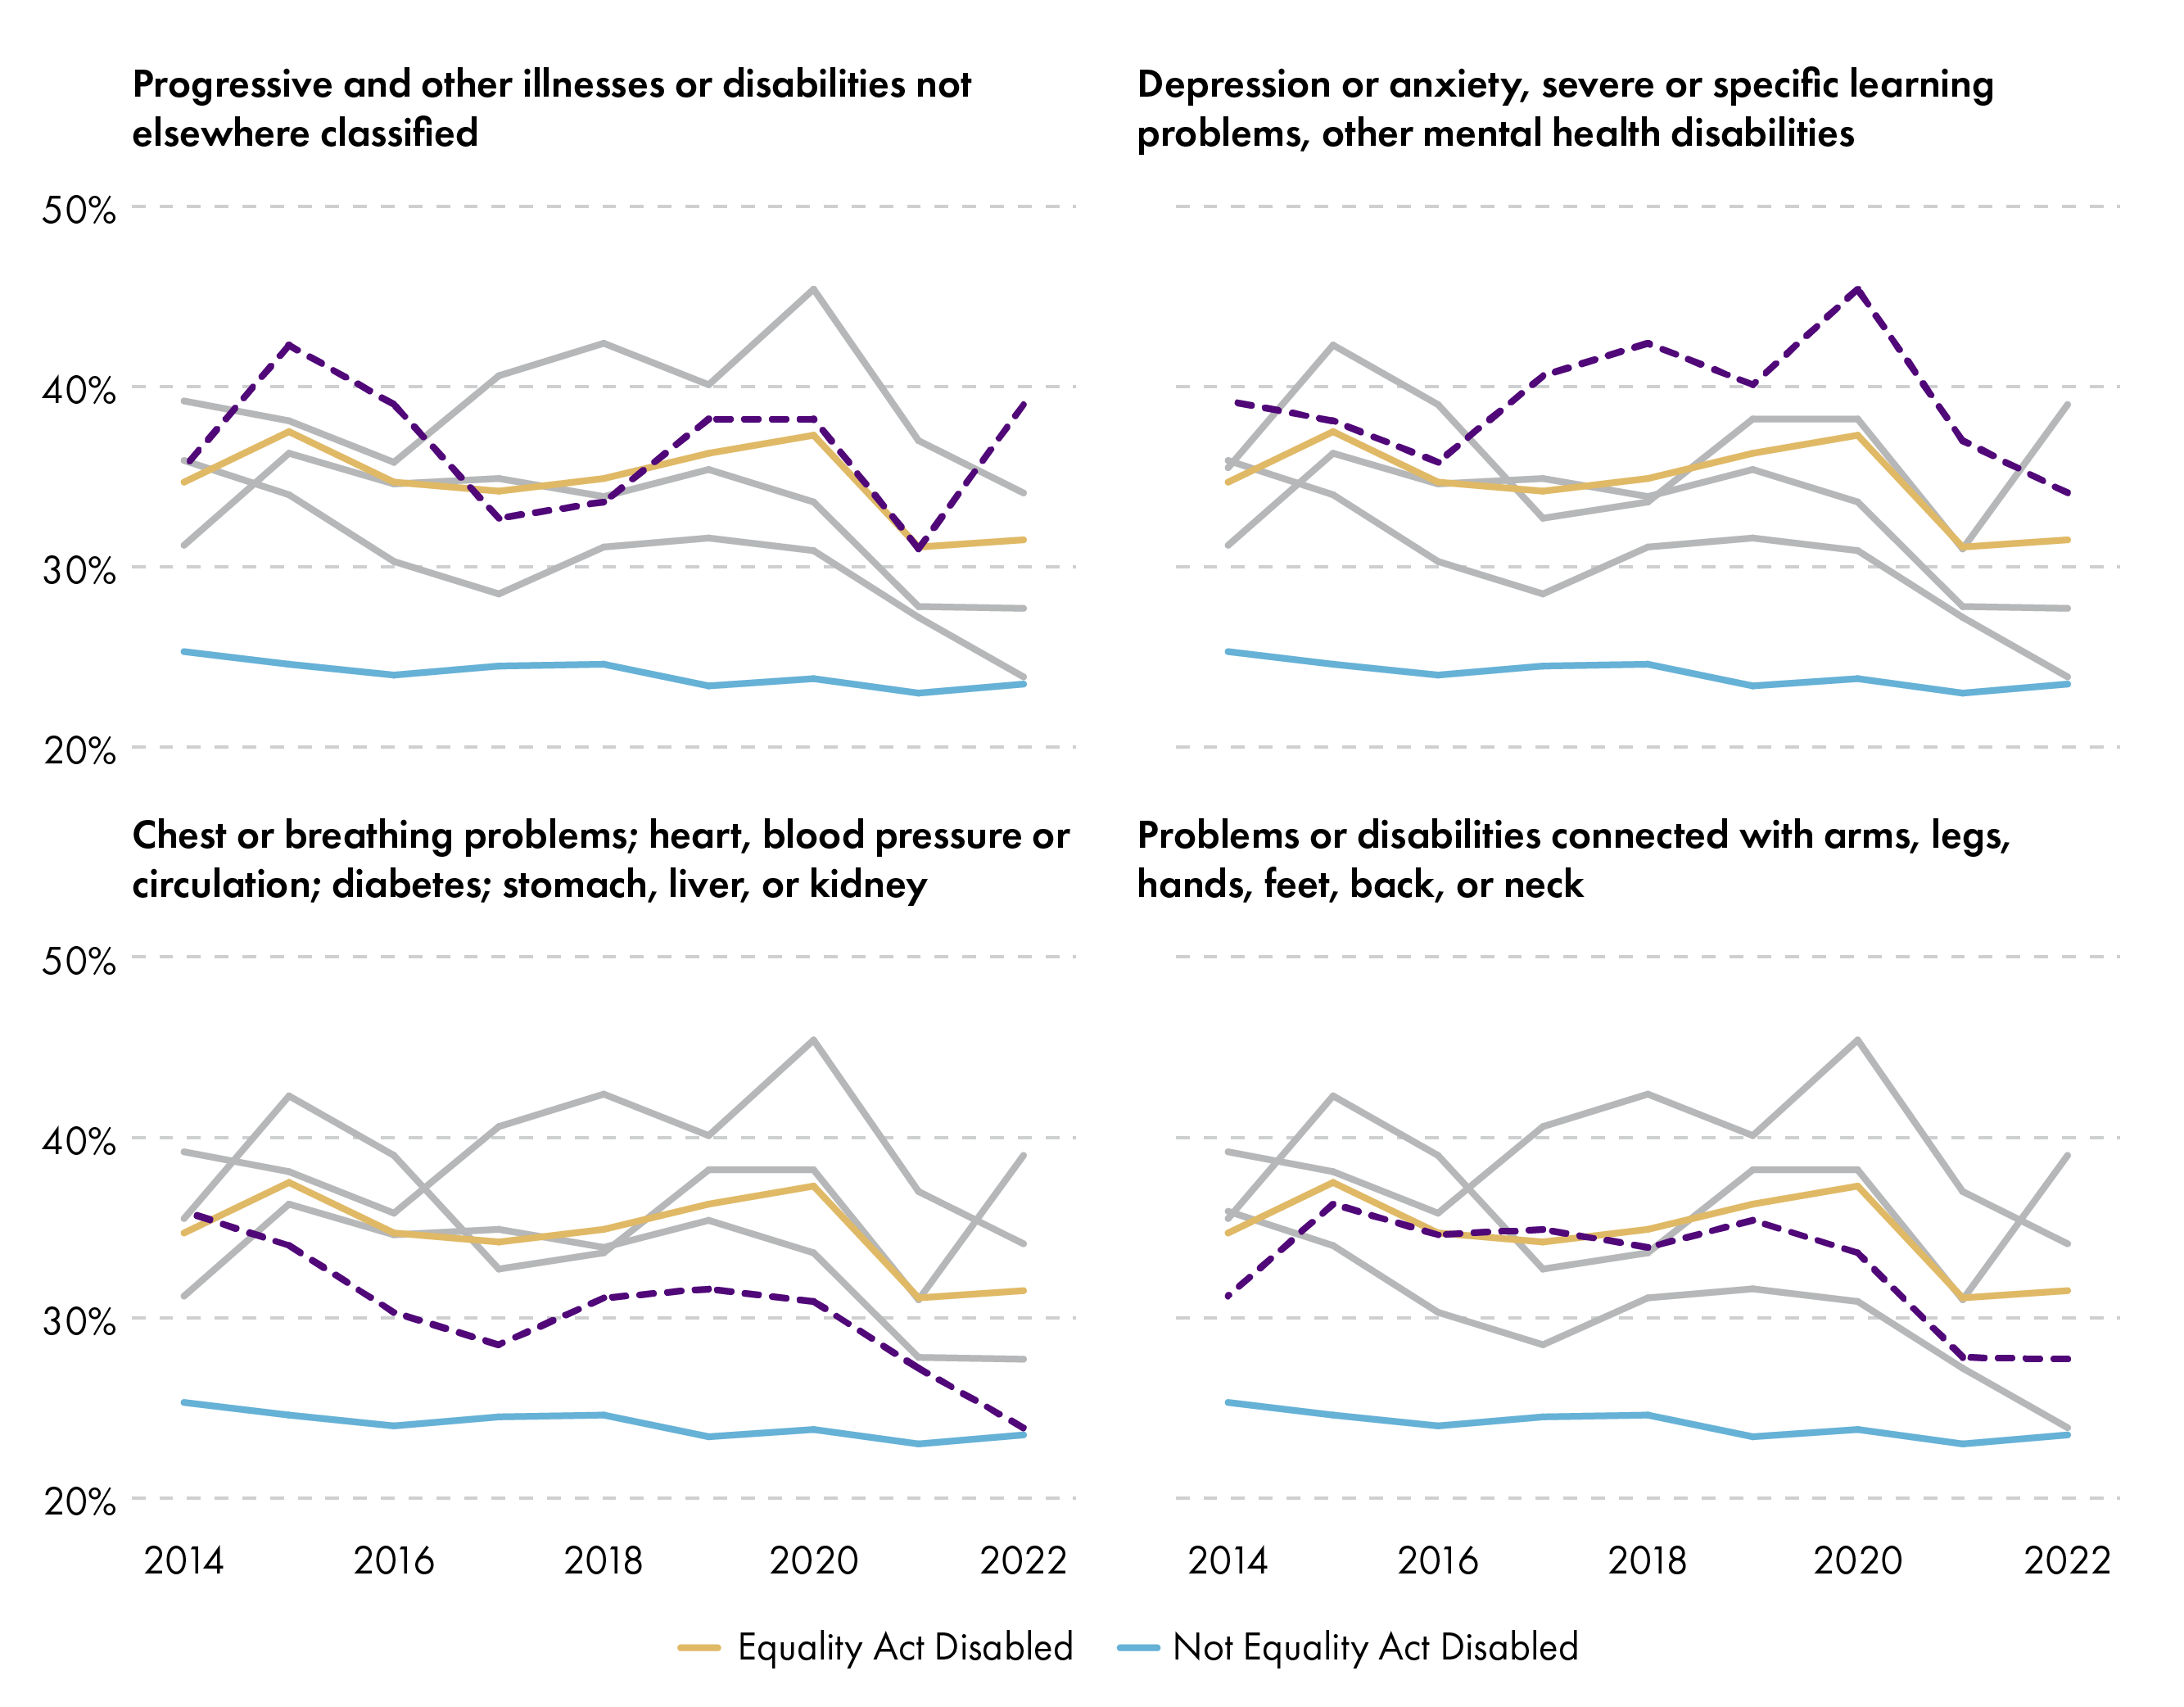
Looking at disaggregated types of disability, we find that musculoskeletal conditions – those affecting arms, legs, feet, neck, and back – had significant increases in employment rates, without significant increases in disability prevalence. This indicates that some external factor allowed people with musculoskeletal conditions to access work (Chart 7).
Annual Population Survey, 2014 to 2022Office For National Statistics. (2023). ‘Annual Population Survey, January - December, 2014-2022’ UK Data Service. Retrieved from https://doi.org/10.5255/UKDA-SN-9069-3
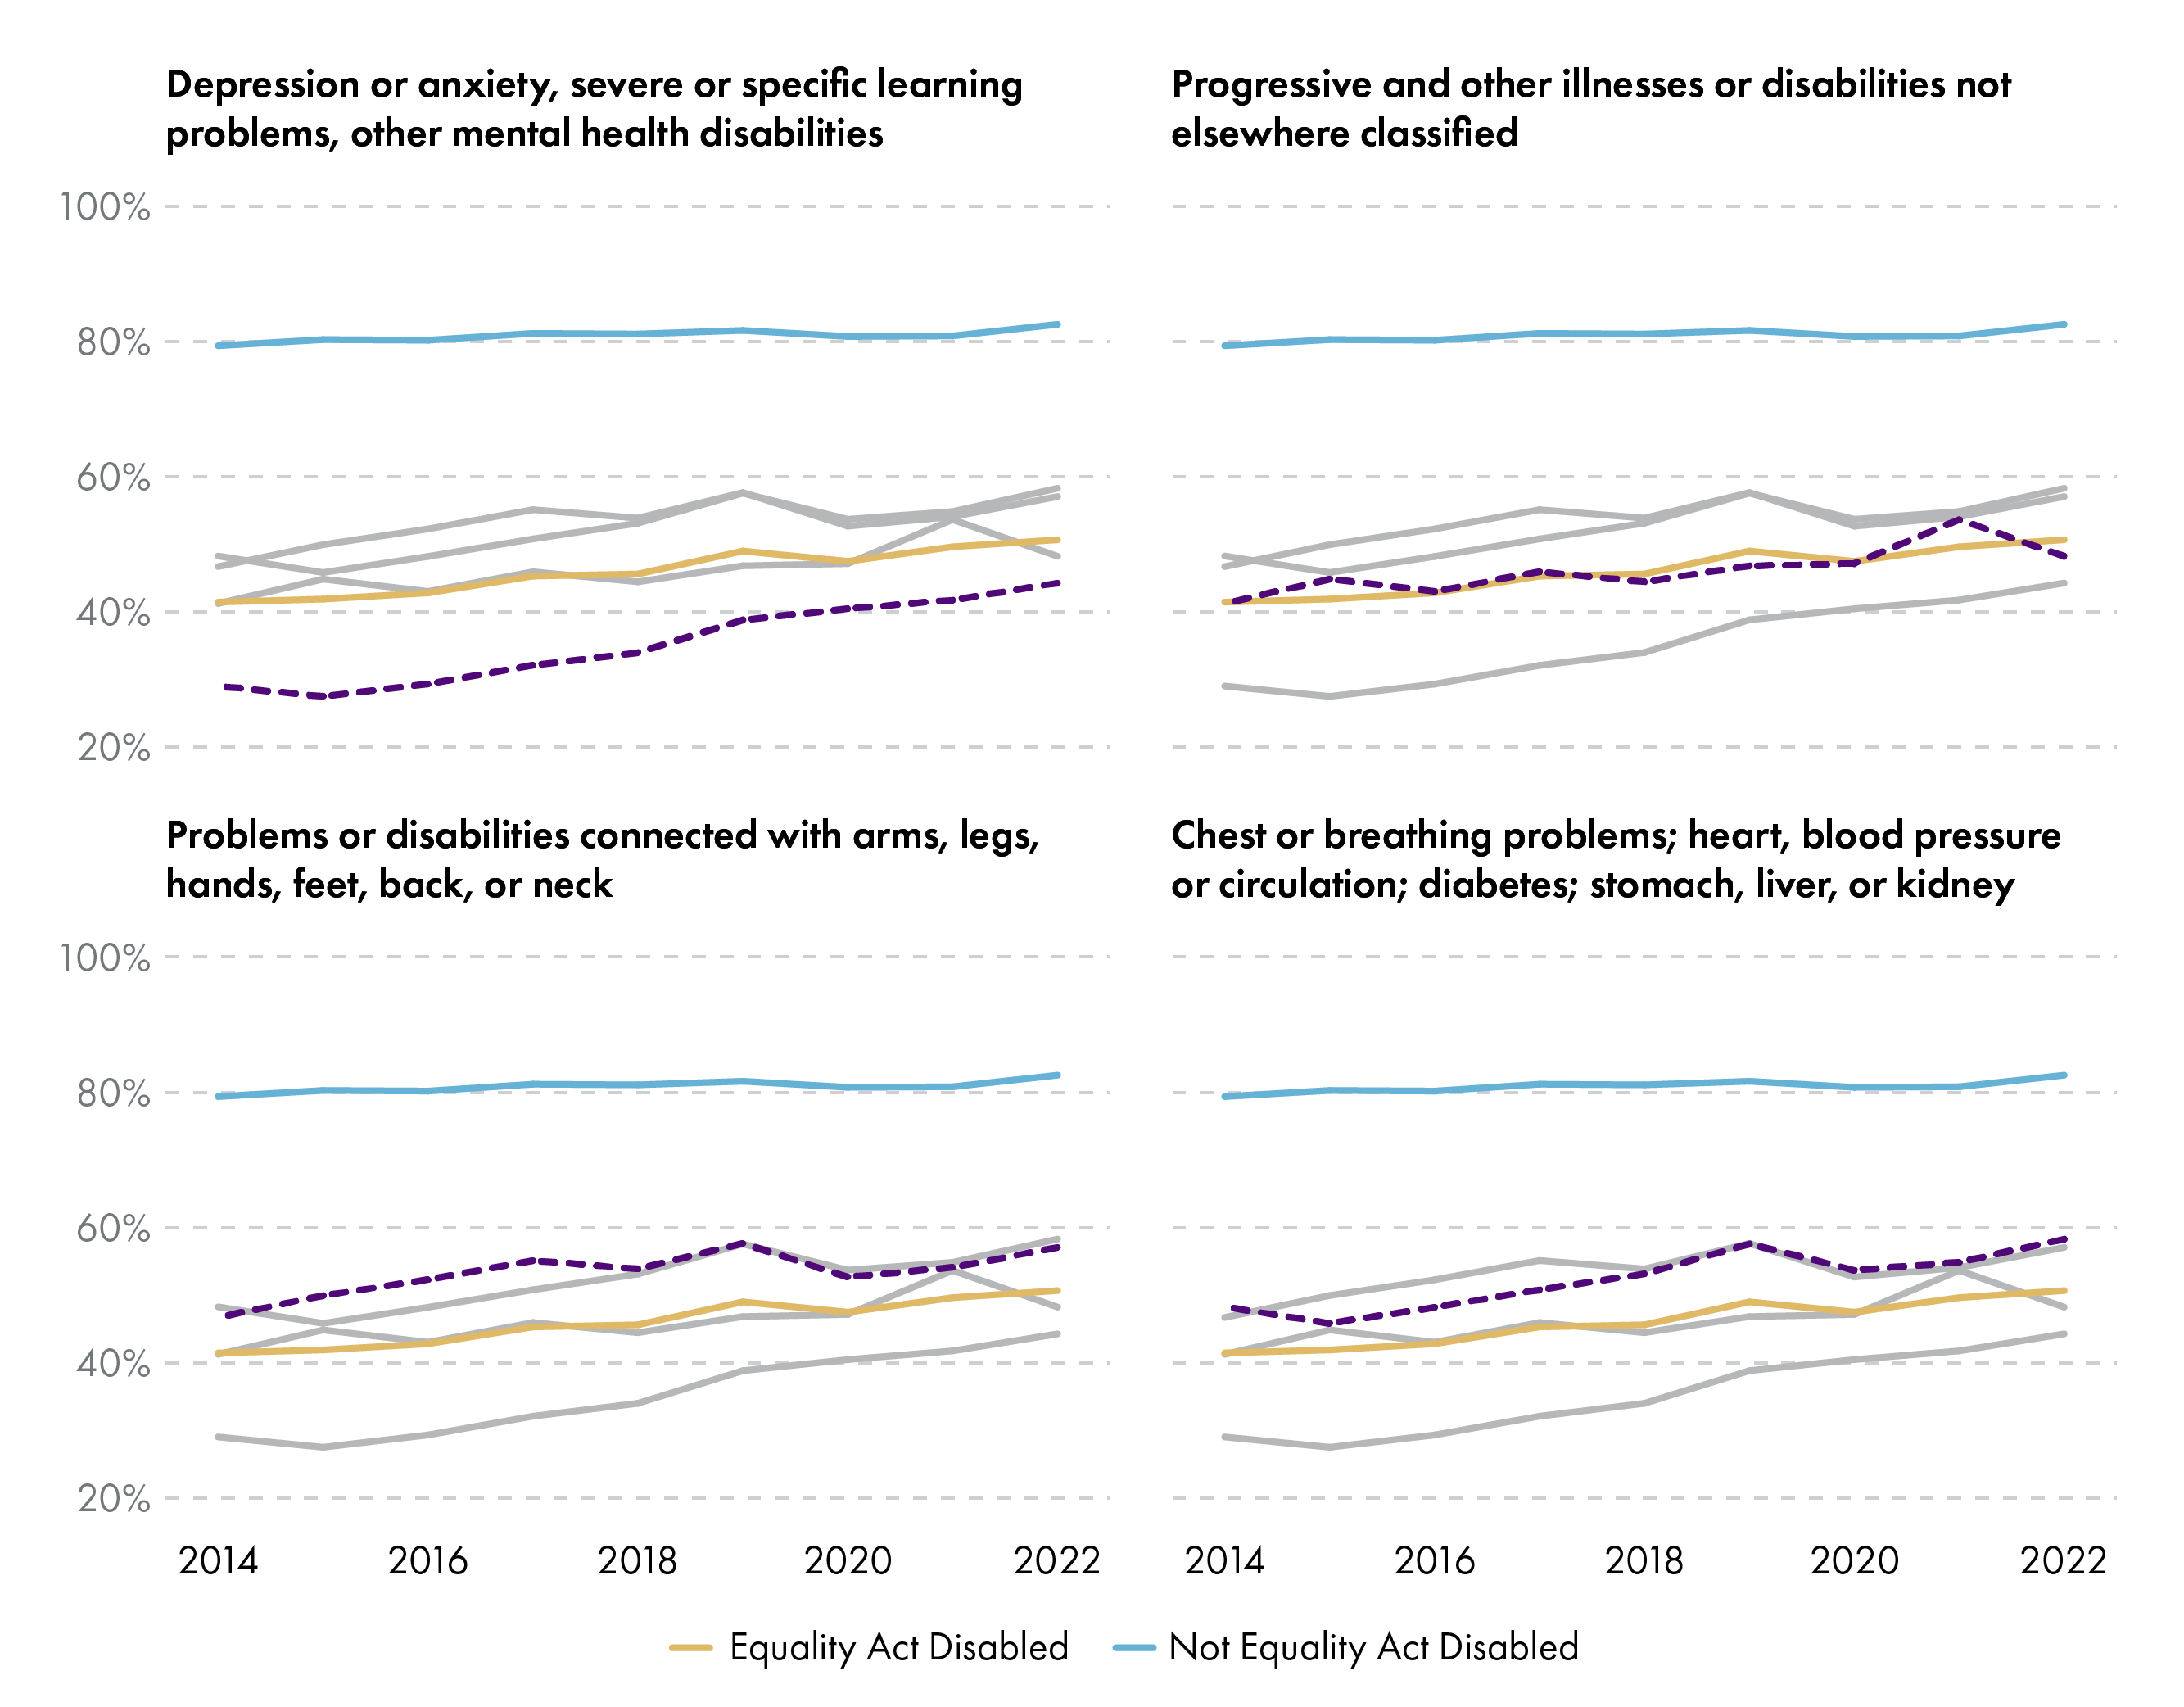
Mental illness is a more complex situation. The employment rate of people with mental illness-related disabilities grew by 15 percentage points between 2014 and 2022, which is significantly more than employment rates for other disabilities. Mental illnesses also had the highest growth in prevalence among all disabilities, changing by 9 percentage points over this time period (Chart 8). In total, there were approximately 141,000 more people with disabilities related to mental illness in 2022 compared to 2014, and 85,000 more people with mental illness in employment (See Appendix 2).
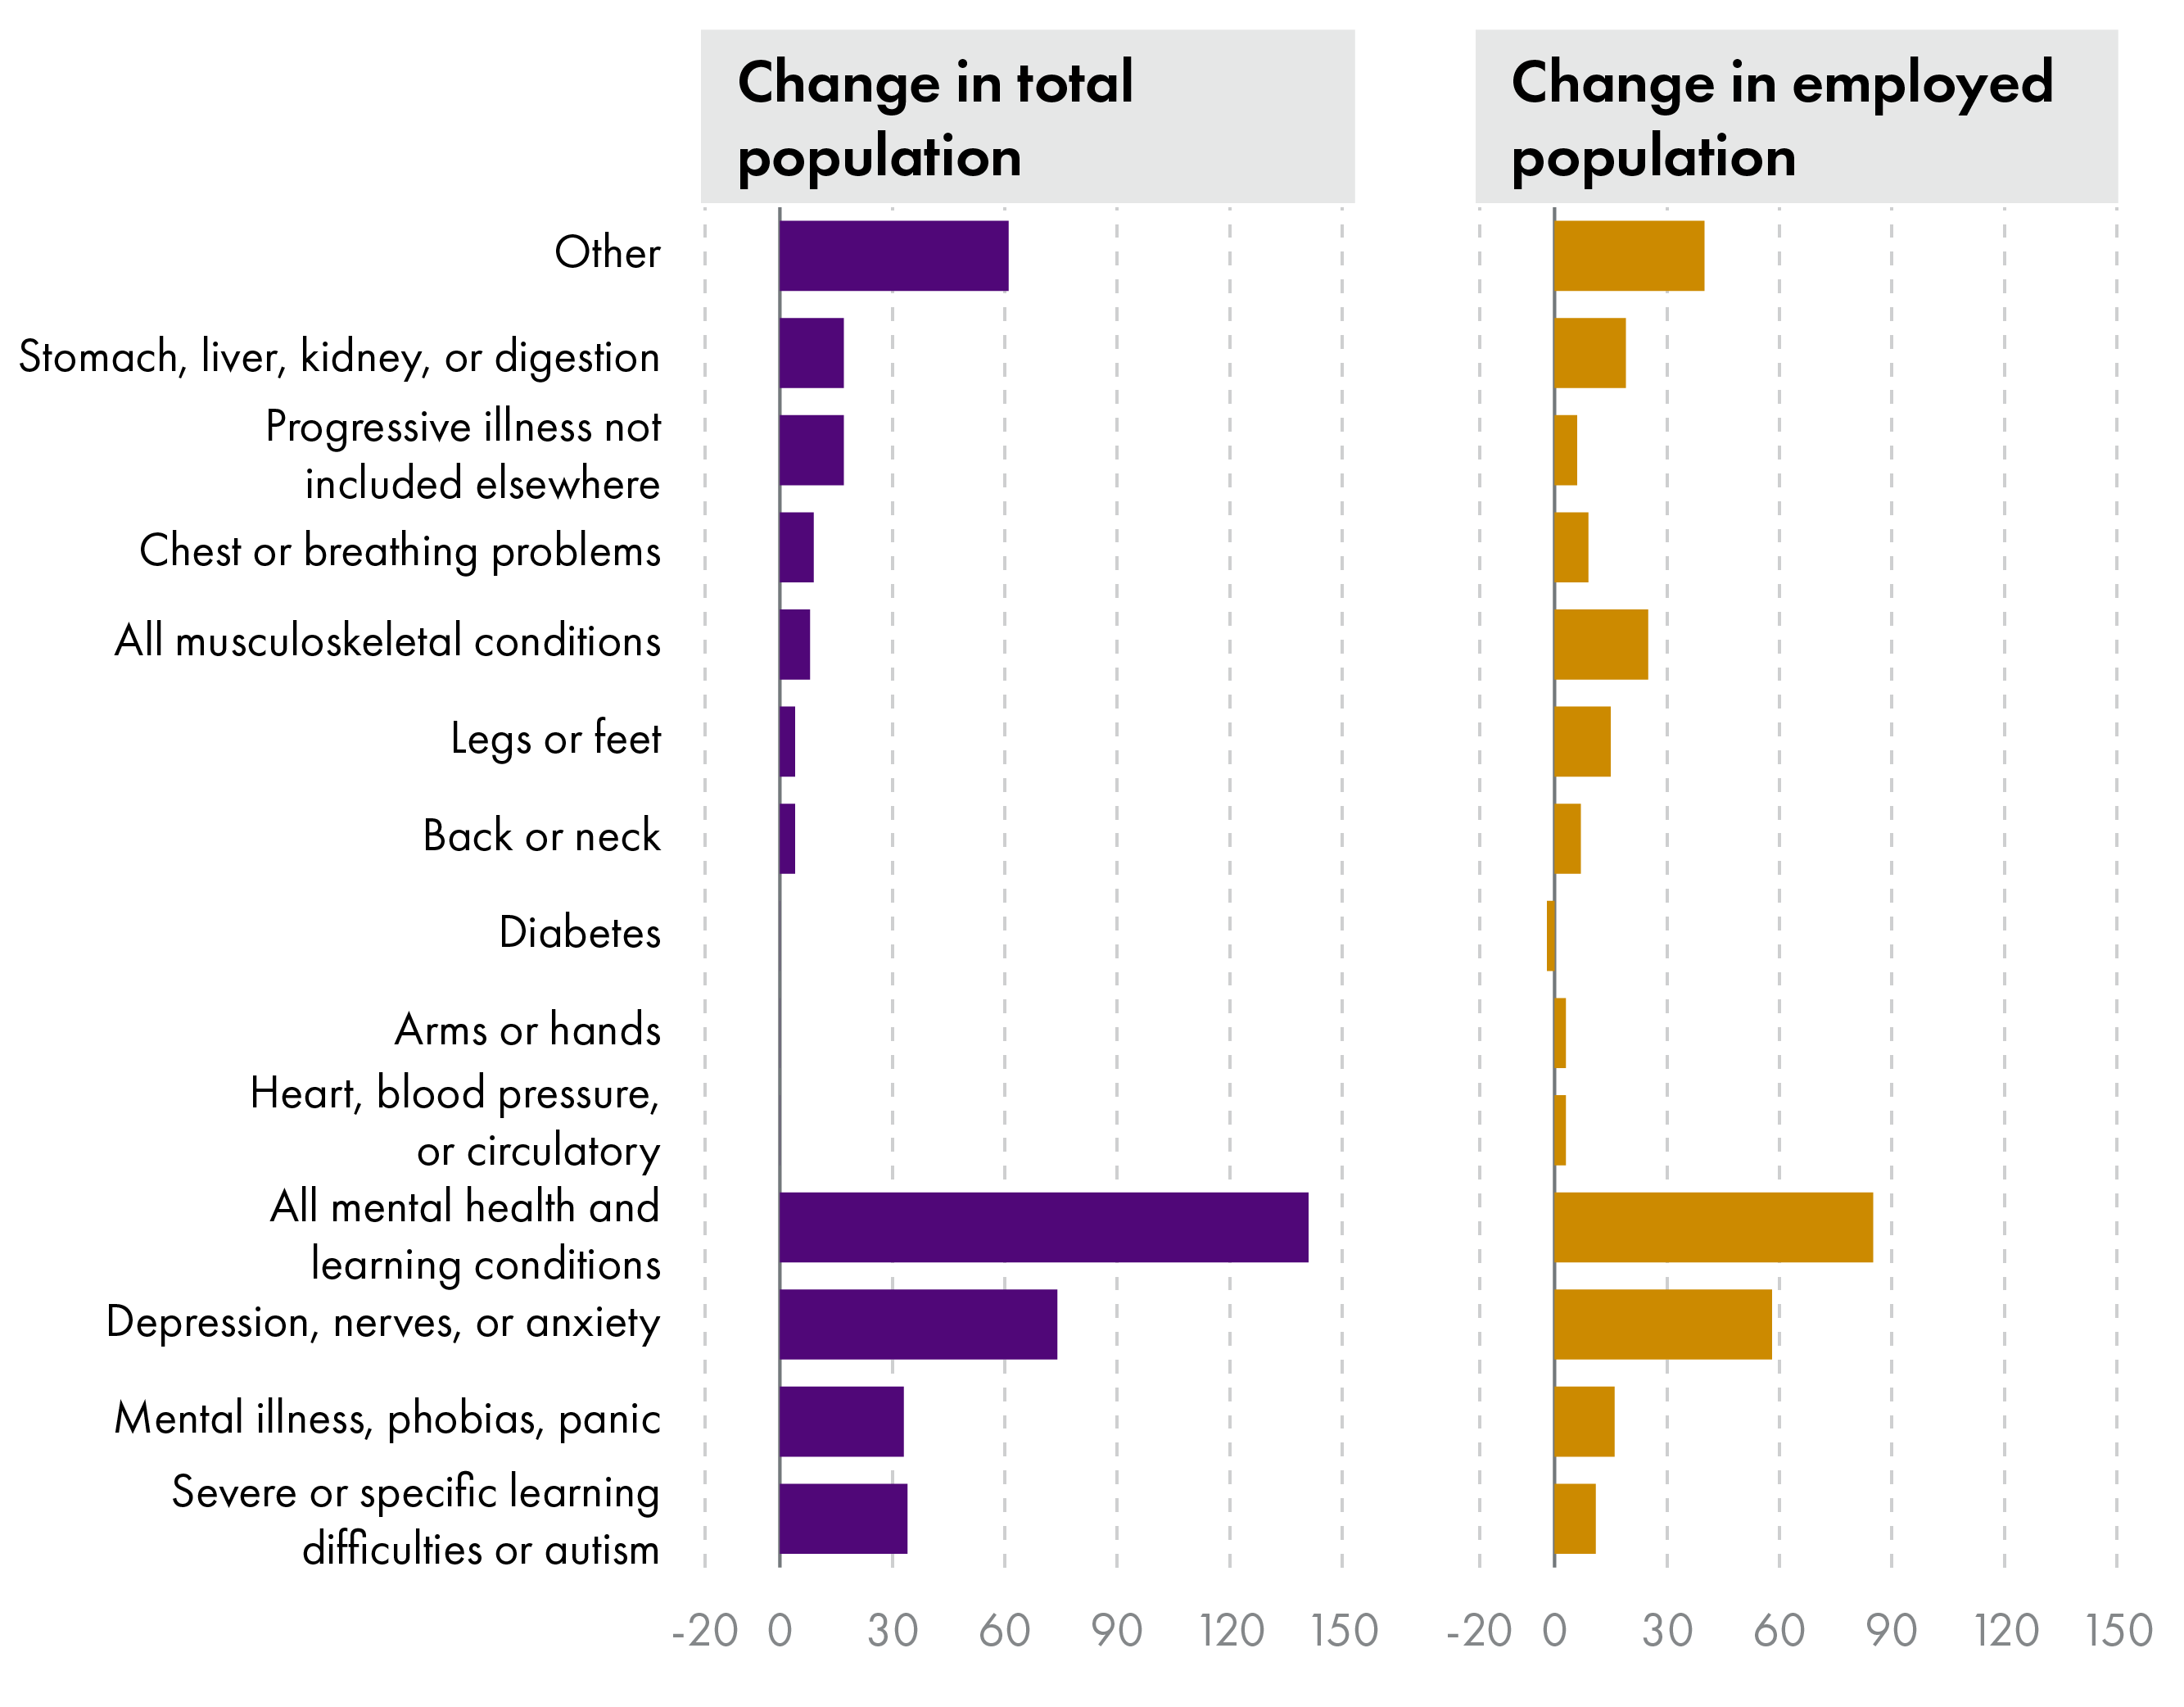
Annual Population Survey, 2014 to 2022Office For National Statistics. (2023). ‘Annual Population Survey, January - December, 2014-2022’ UK Data Service. Retrieved from https://doi.org/10.5255/UKDA-SN-9069-3
Economic inactivity and part-time work
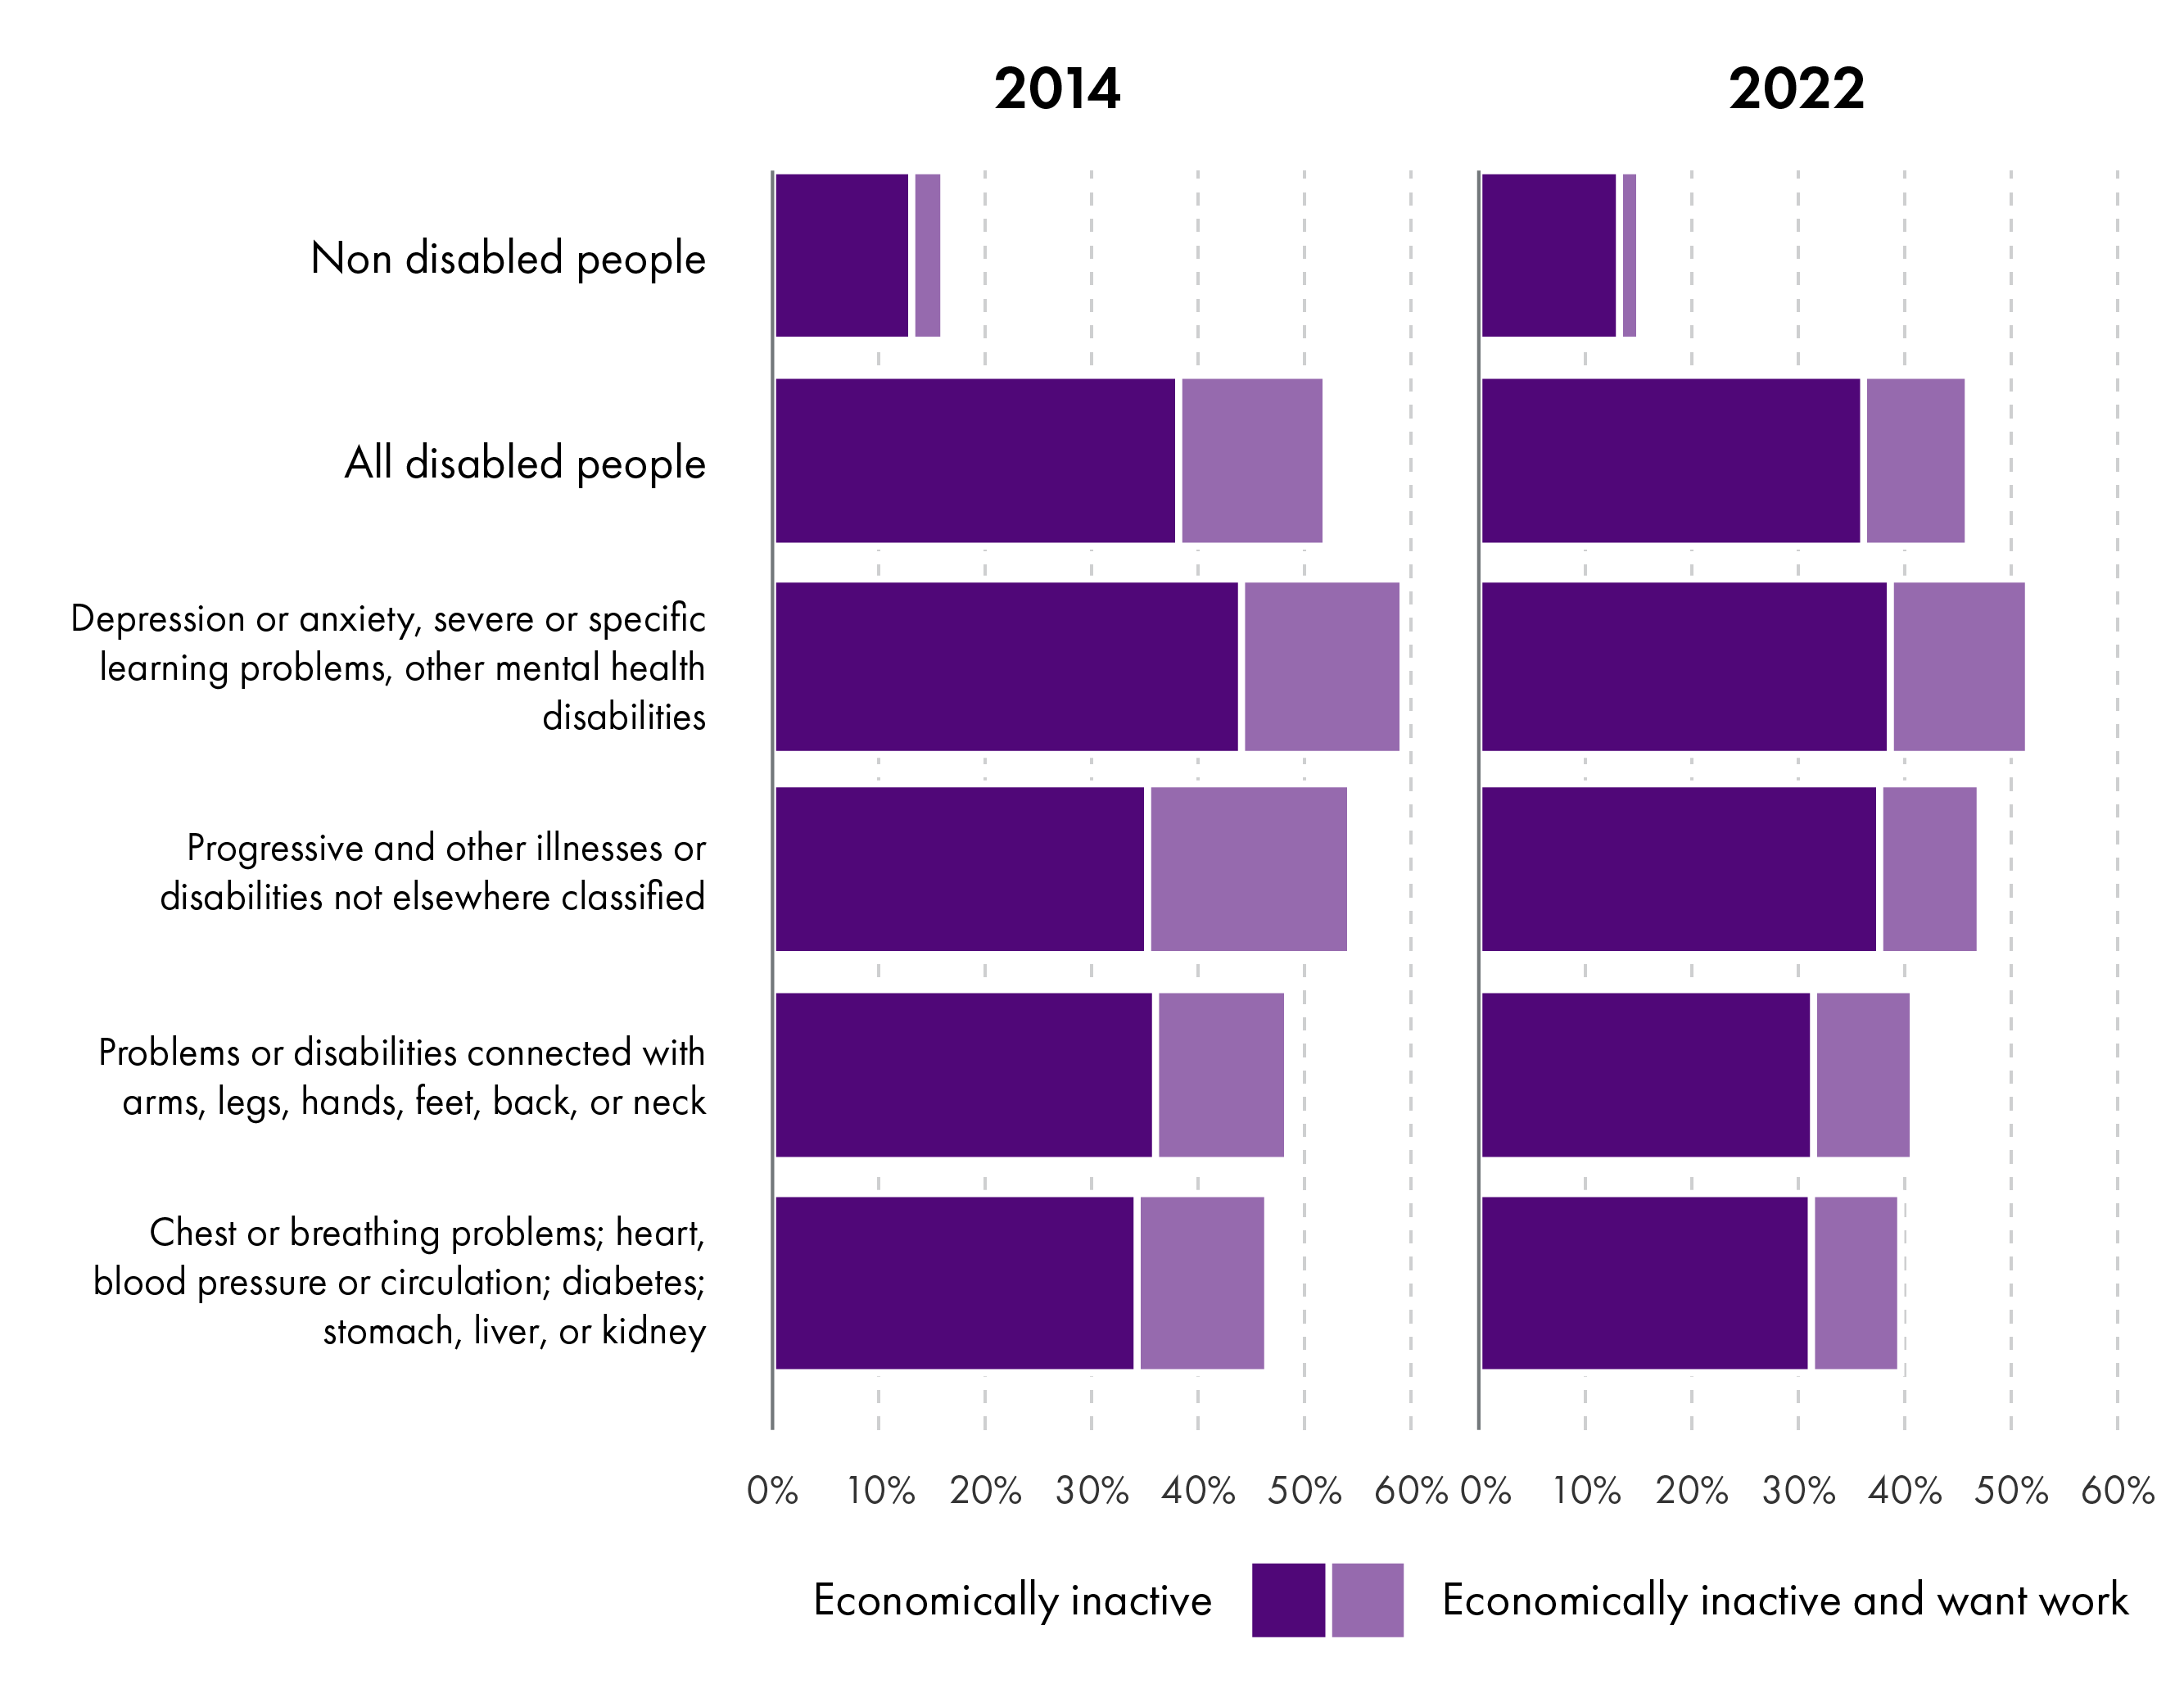
People with depression and anxiety are both less likely to be in work, and more likely to be in part-time work than other people with disabilities. They also have higher rates of economic inactivity than other types of disability, and those that are inactive are less likely to say that they want work (Chart 9).
Annual Population SurveyOffice For National Statistics. (2023). ‘Annual Population Survey, January - December, 2014-2022’ UK Data Service. Retrieved from https://doi.org/10.5255/UKDA-SN-9069-3
Rates of economic inactivity among both disabled and non-disabled people have decreased since 2014, but inactive people are now less likely to want work. This is potentially due to the increase in work opportunities for people in Scotland – those that want employment have greater access to it (Chart 10).
Annual Population Survey, 2014 to 2022Office For National Statistics. (2023). ‘Annual Population Survey, January - December, 2014-2022’ UK Data Service. Retrieved from https://doi.org/10.5255/UKDA-SN-9069-3
What sort of work do disabled people participate in?
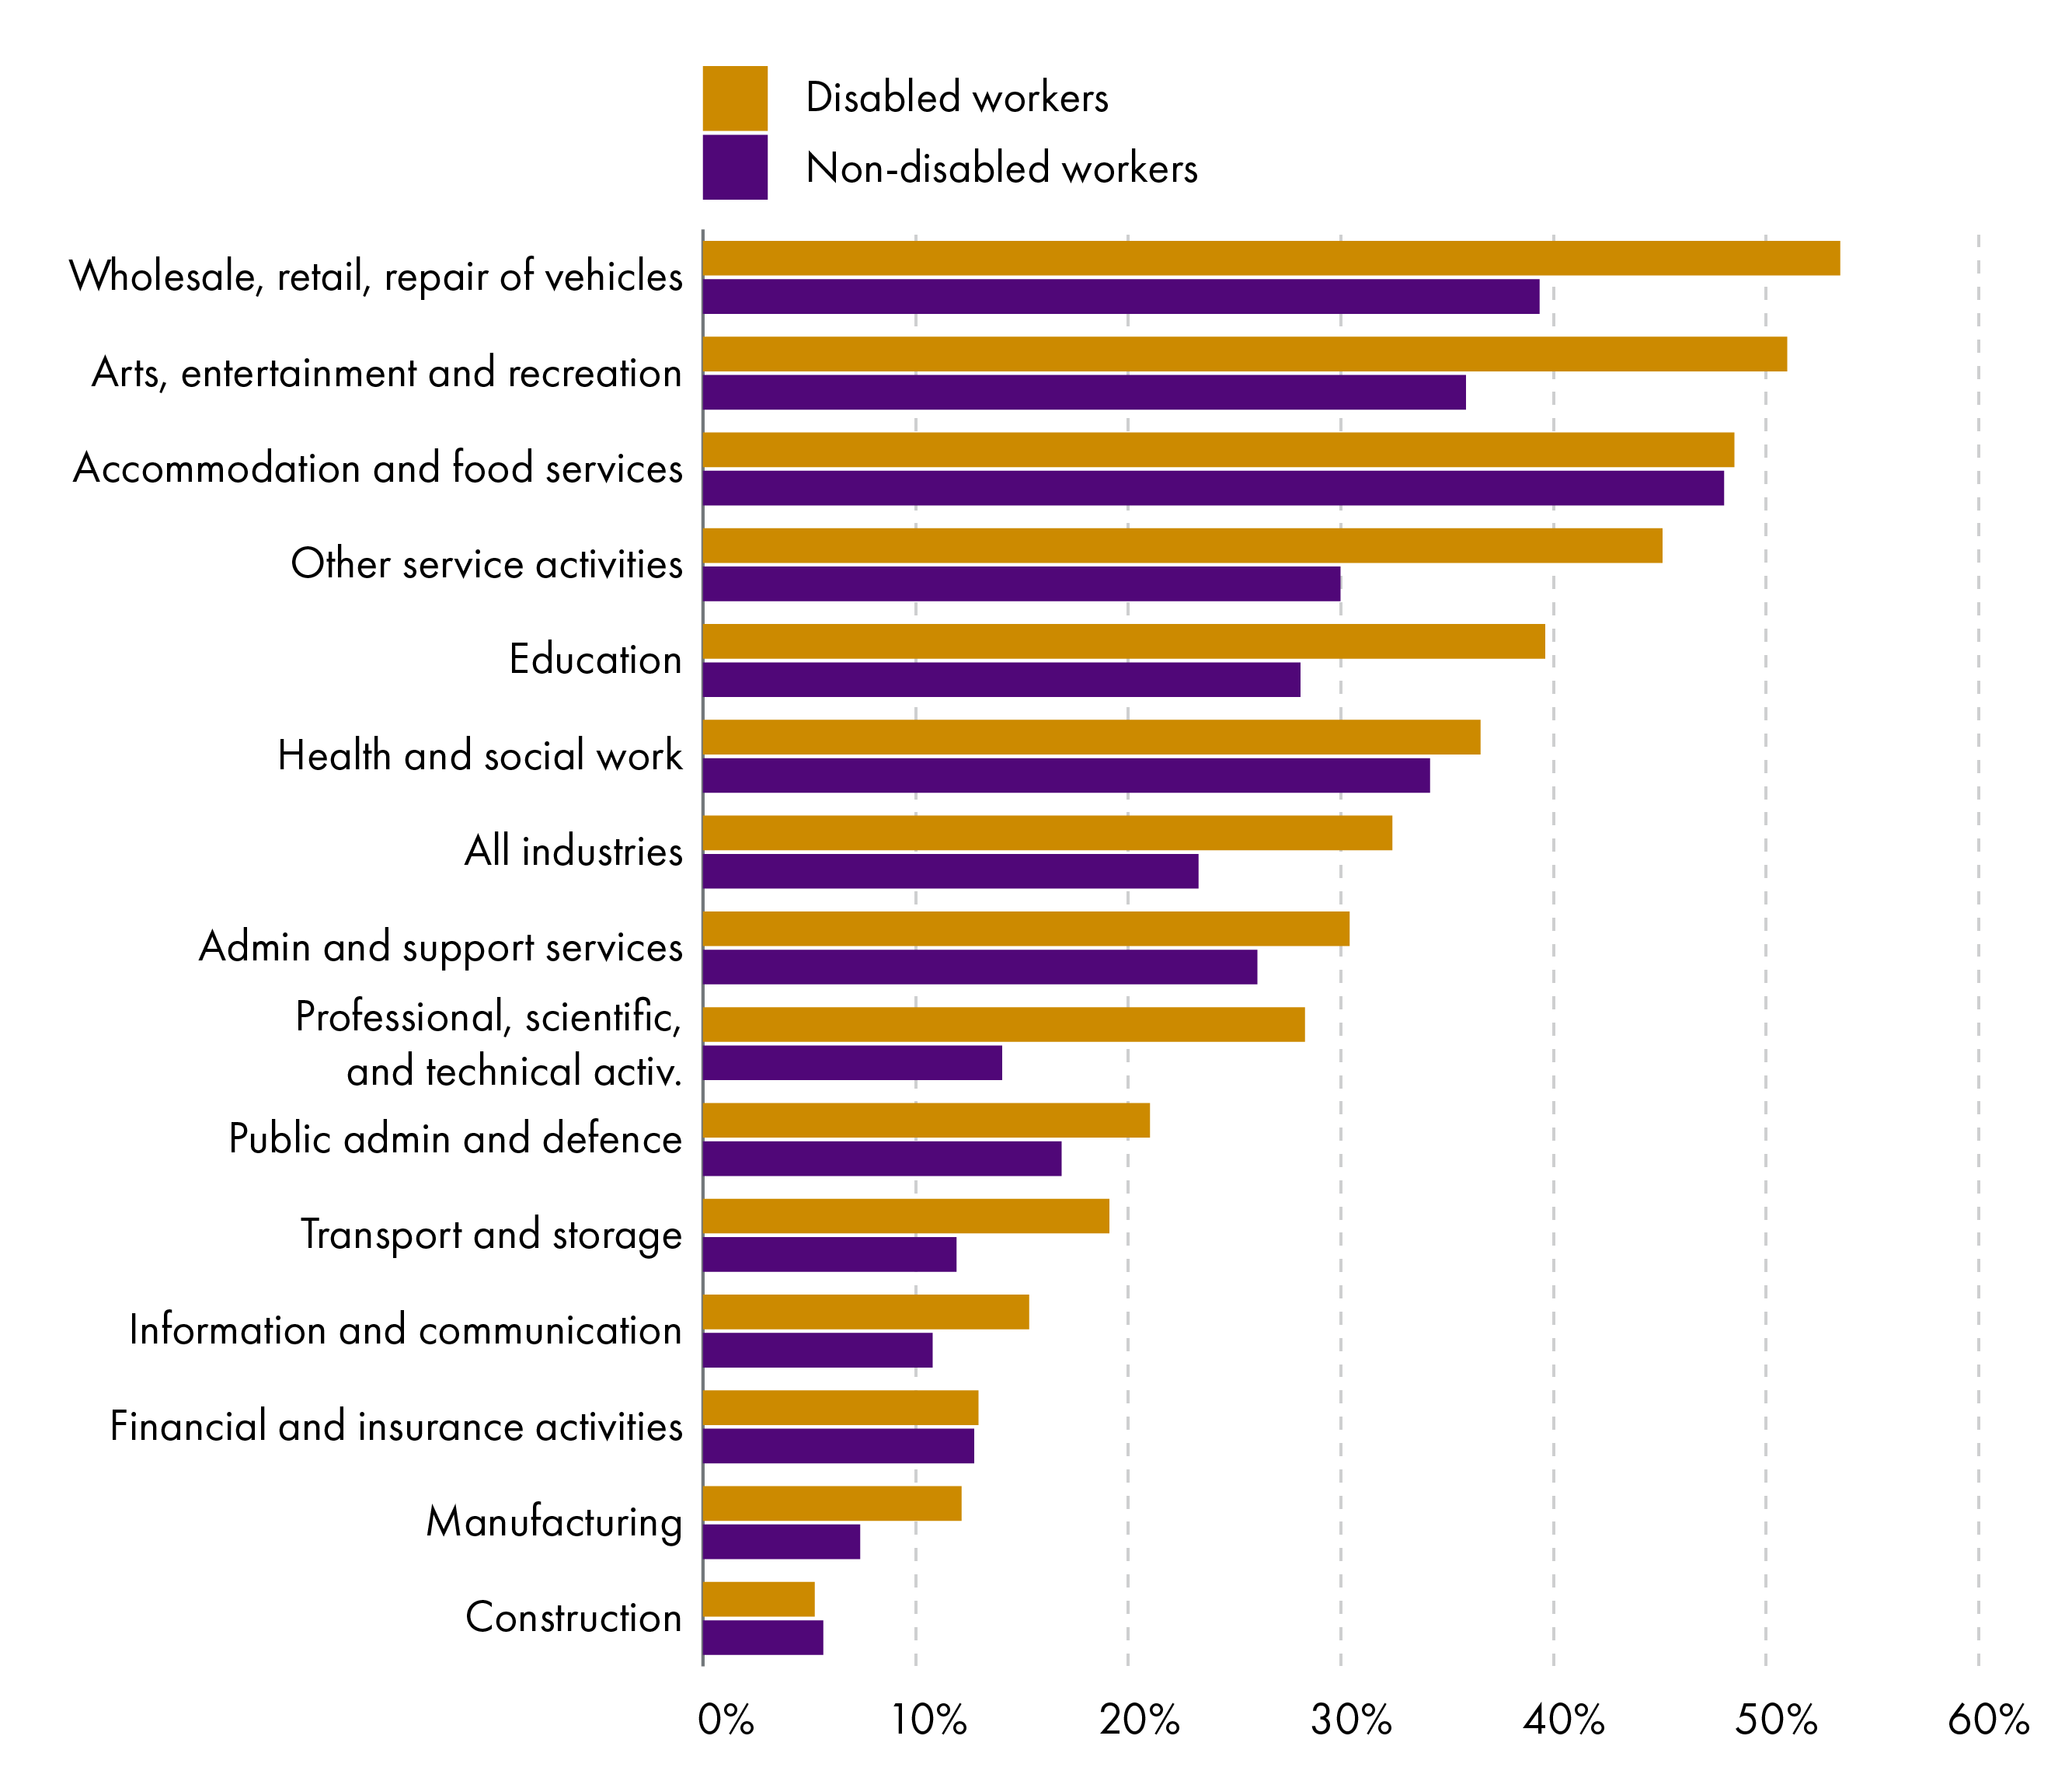
Around 42% of disabled workers in Scotland work in three sectors: education, retail, and health and social work. These three sectors are also the largest employers across Scotland, although disabled workers are disproportionately more likely to participate in them. Disabled people are also disproportionately less likely to work in manufacturing; professional, scientific, and technical activities; or construction (Chart 11).
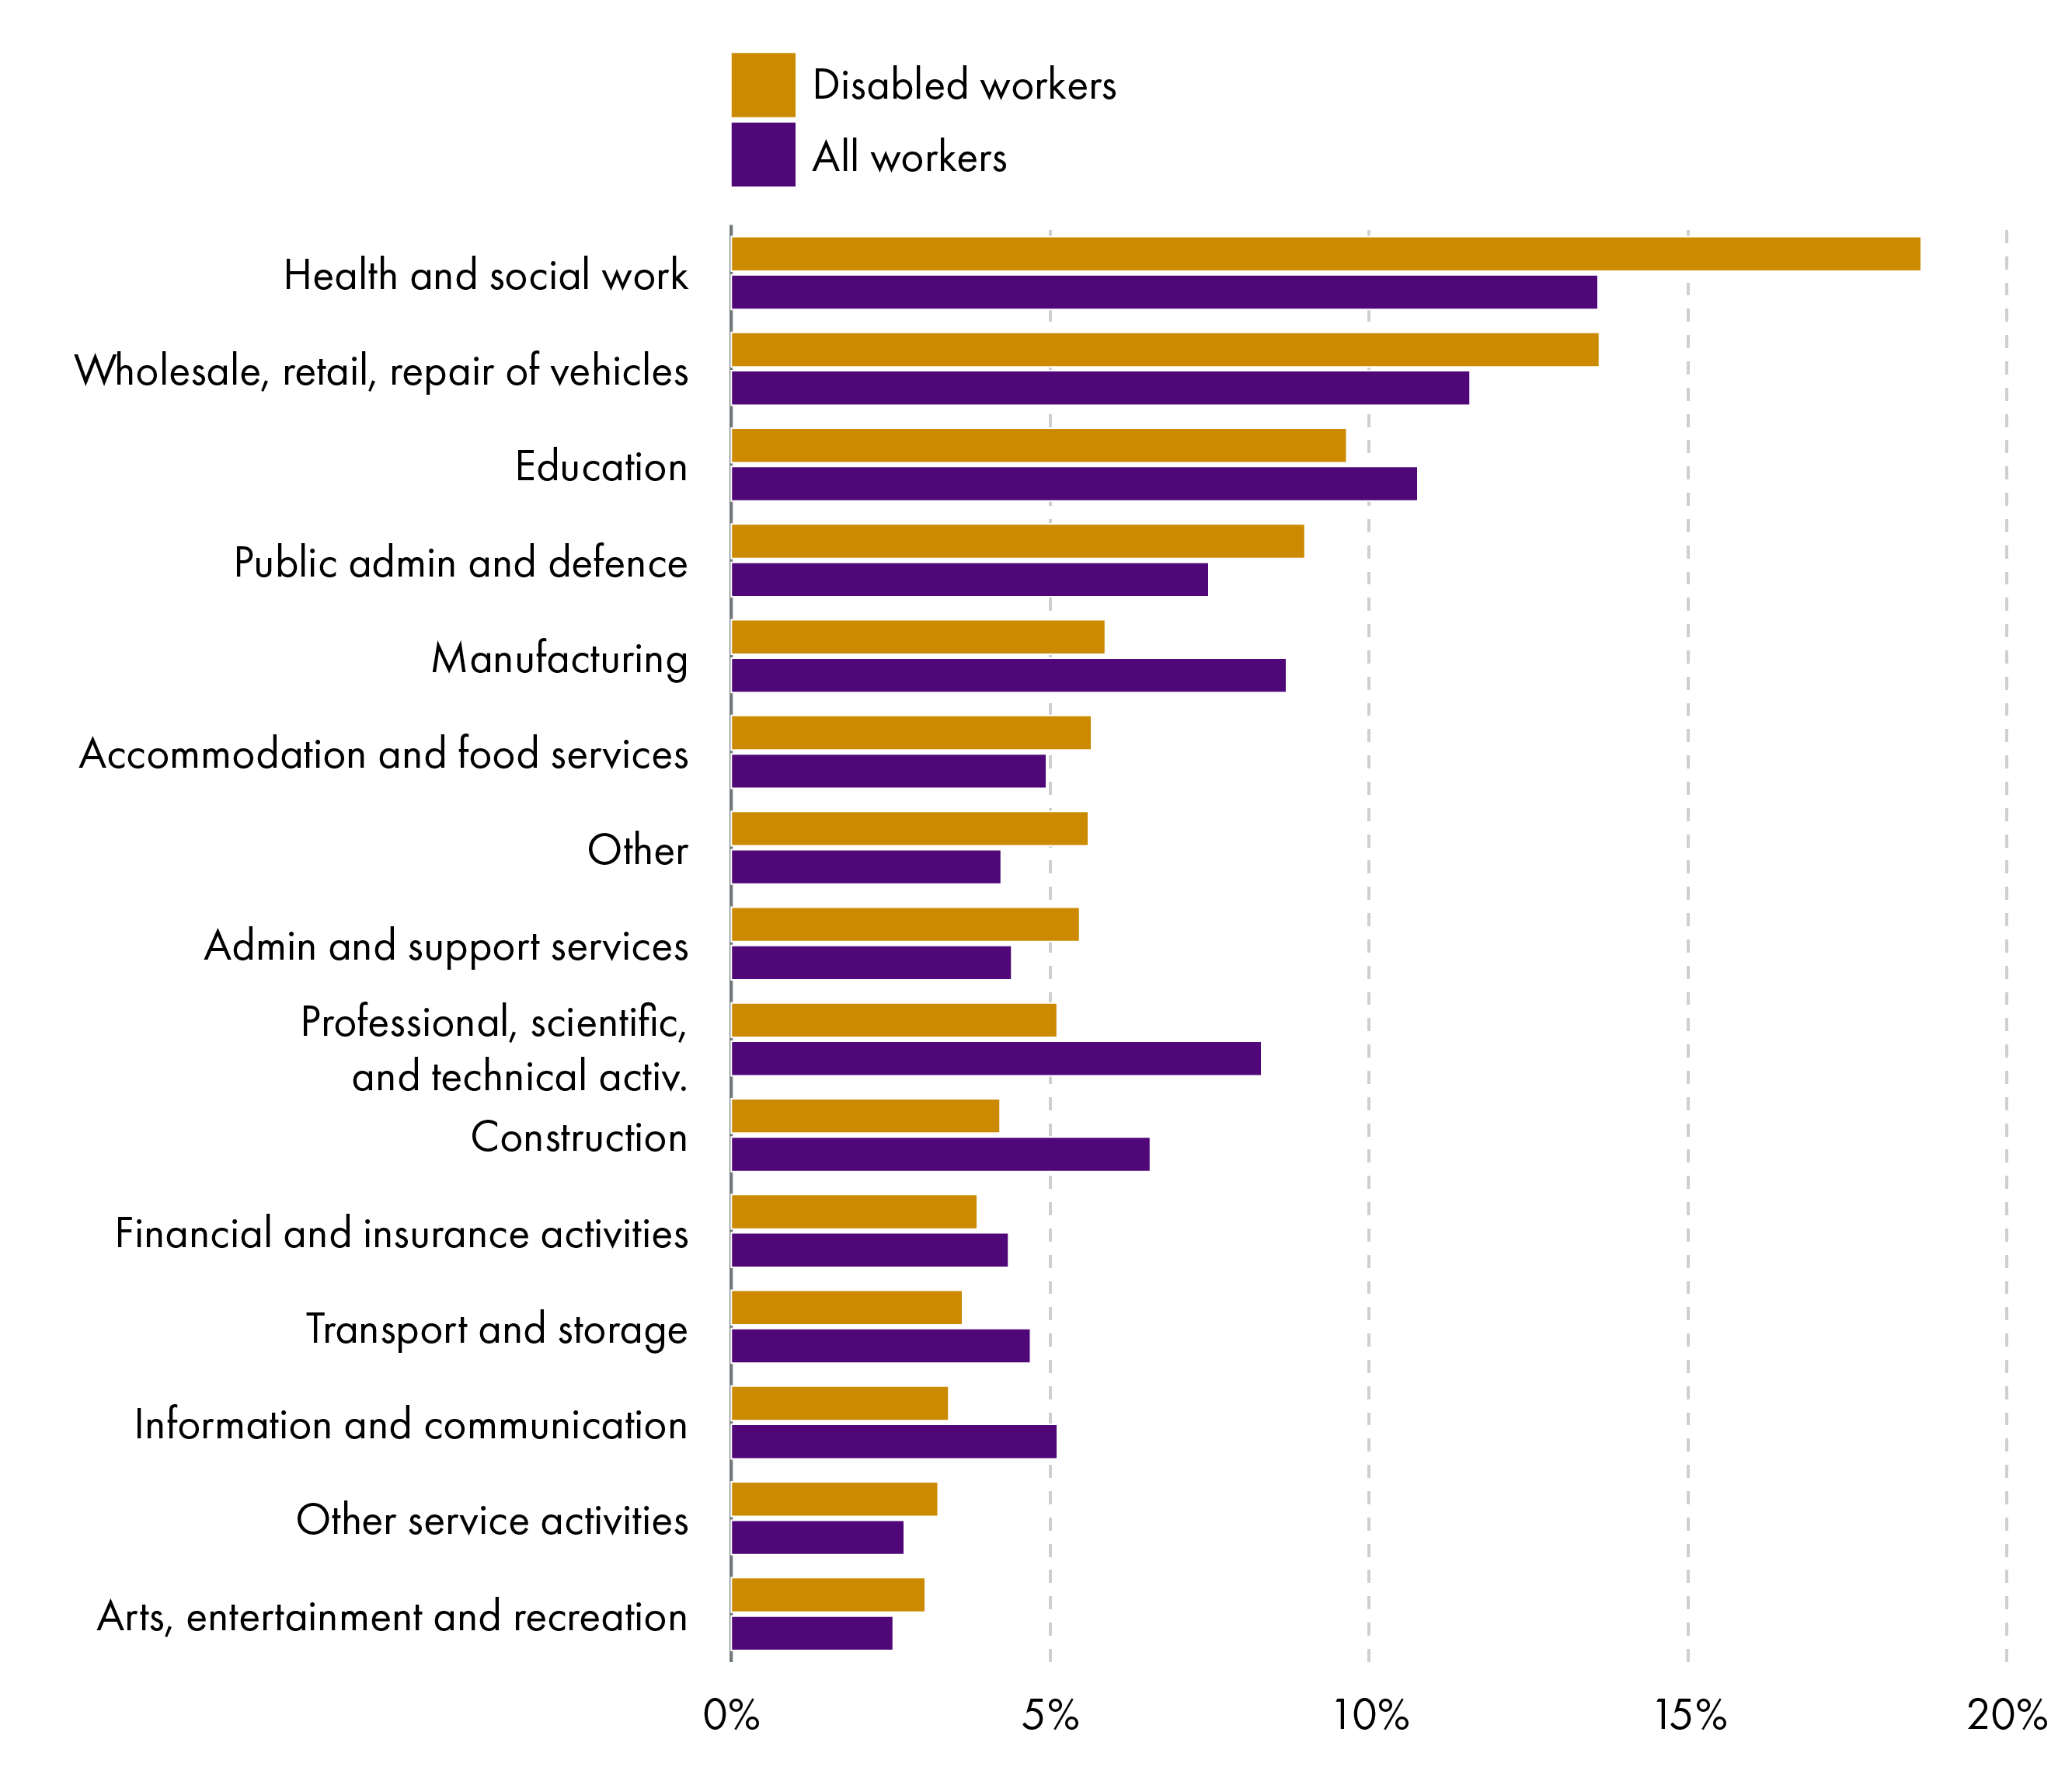
Annual Population Survey, 2020 to 2022Office For National Statistics. (2023). ‘Annual Population Survey, January - December, 2014-2022’ UK Data Service. Retrieved from https://doi.org/10.5255/UKDA-SN-9069-3
The hospitality and health and social work industries have similar rates of disabled people and non-disabled people working part-time, but otherwise, disabled people are much more likely to be in part time work. In the retail sector, for instance, over half of all disabled workers are working part-time (Chart 12).
Annual Population Survey, 2020 to 2022Office For National Statistics. (2023). ‘Annual Population Survey, January - December, 2014-2022’ UK Data Service. Retrieved from https://doi.org/10.5255/UKDA-SN-9069-3
Examining the types of disability within the six industries which employ the most disabled workers, workers in wholesale and retail and hospitality are significantly more likely to have mental health and learning conditions relative to the general population. Physical industries, like manufacturing, have much higher rates of workers with musculoskeletal conditions compared to average (Chart 13).
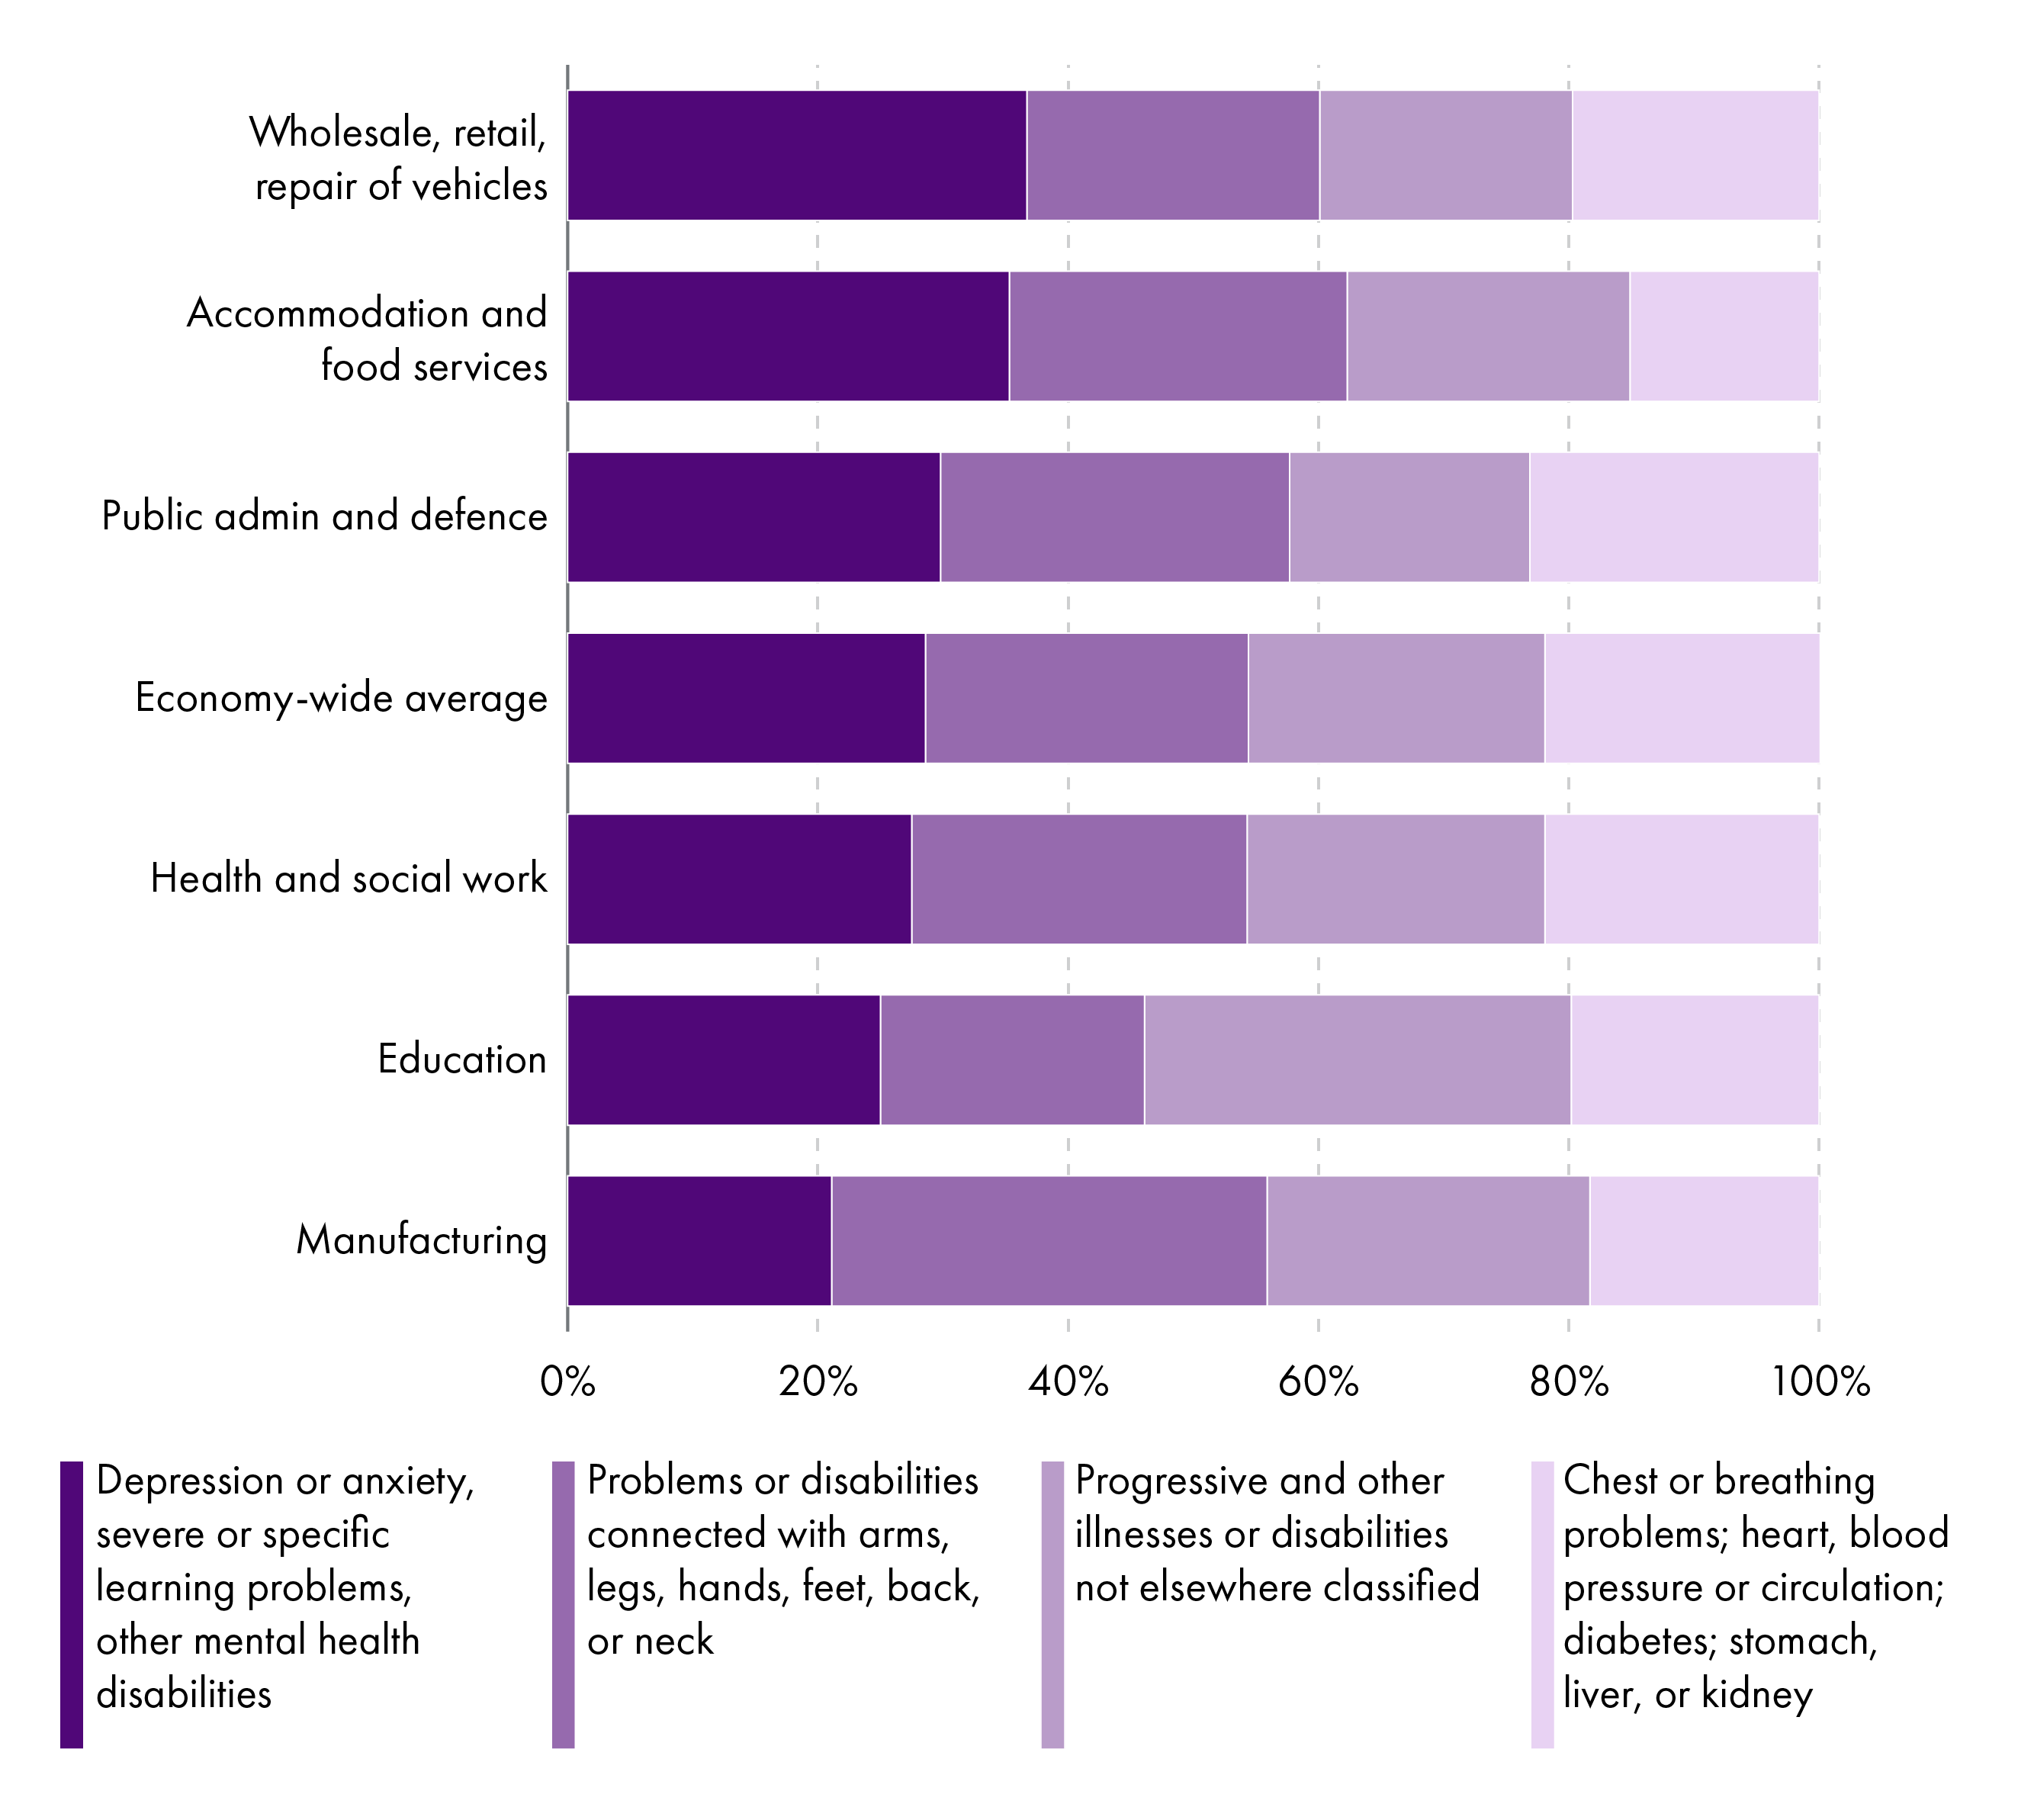
Annual Population Survey, 2020 to 2022Office For National Statistics. (2023). ‘Annual Population Survey, January - December, 2014-2022’ UK Data Service. Retrieved from https://doi.org/10.5255/UKDA-SN-9069-3
Differences in disability employment by local authority
Employment rates for disabled people on average between 2020 and 2022 were lowest in Shetland and Dumfries and Galloway. Shetland historically had a very high rate of disabled employment, similar to rates in Orkney and Na h-Eileanan Siar (over 60%) until the pandemic, although it is worth noting that these are based on a relatively small sample size and so are subject to relatively wide confidence intervals (Figure 2). Rates of disabled and non-disabled employment do not appear to be correlated, either – East Renfrewshire, for instance, has an above-average rate of employment for disabled people, in spite of having one of the lowest non-disabled employment rates in Scotland (51.9% versus 78.4% on average from 2020-2022).
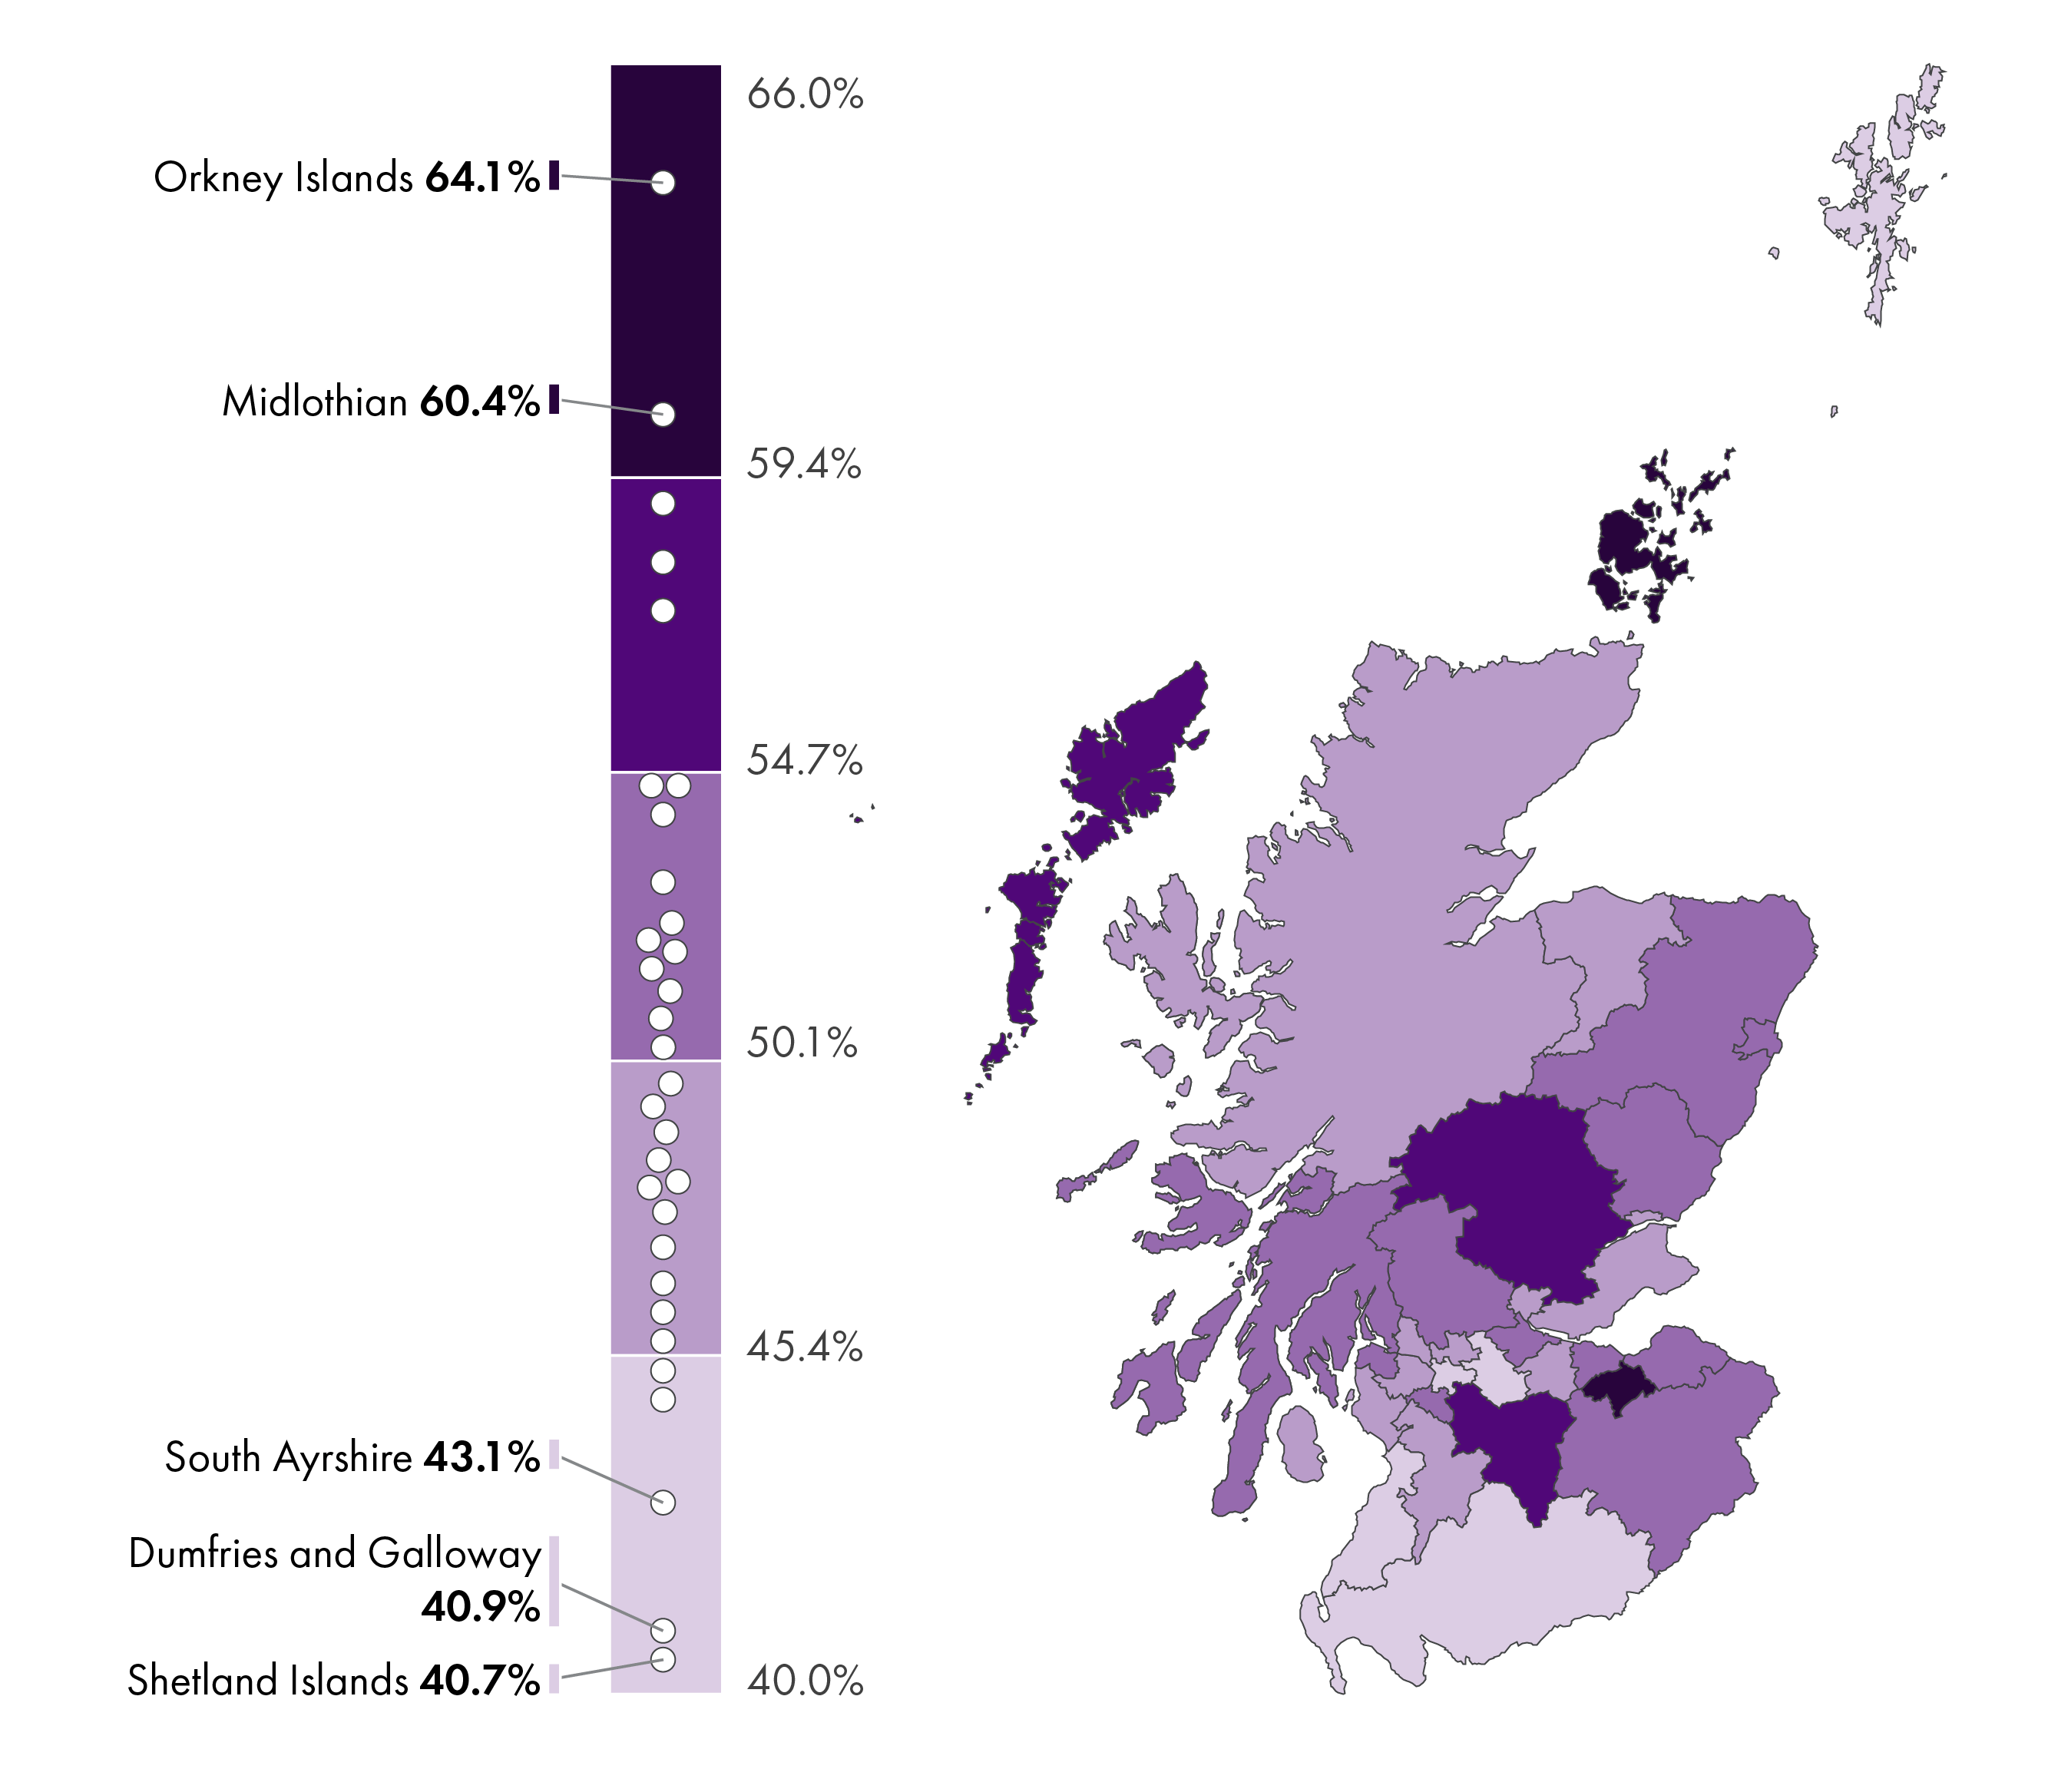
Annual Population Survey, 2020 to 2022Office For National Statistics. (2023). ‘Annual Population Survey, January - December, 2014-2022’ UK Data Service. Retrieved from https://doi.org/10.5255/UKDA-SN-9069-3
Disabled employment demographics
Examining the overall rates of disabled employment for different demographics shows where significant progress has been made, and where there are still important areas of opportunity.
Ethnic minorities have the largest disability employment gaps in Scotland, with only around 47% of disabled minority workers in employment. This disability employment rate has grown more substantially than the Scottish average, however – by 12.1 percentage points since 2014. Disability prevalence and non-disabled employment among ethnic minorities is lower than the population on average. (Chart 14).
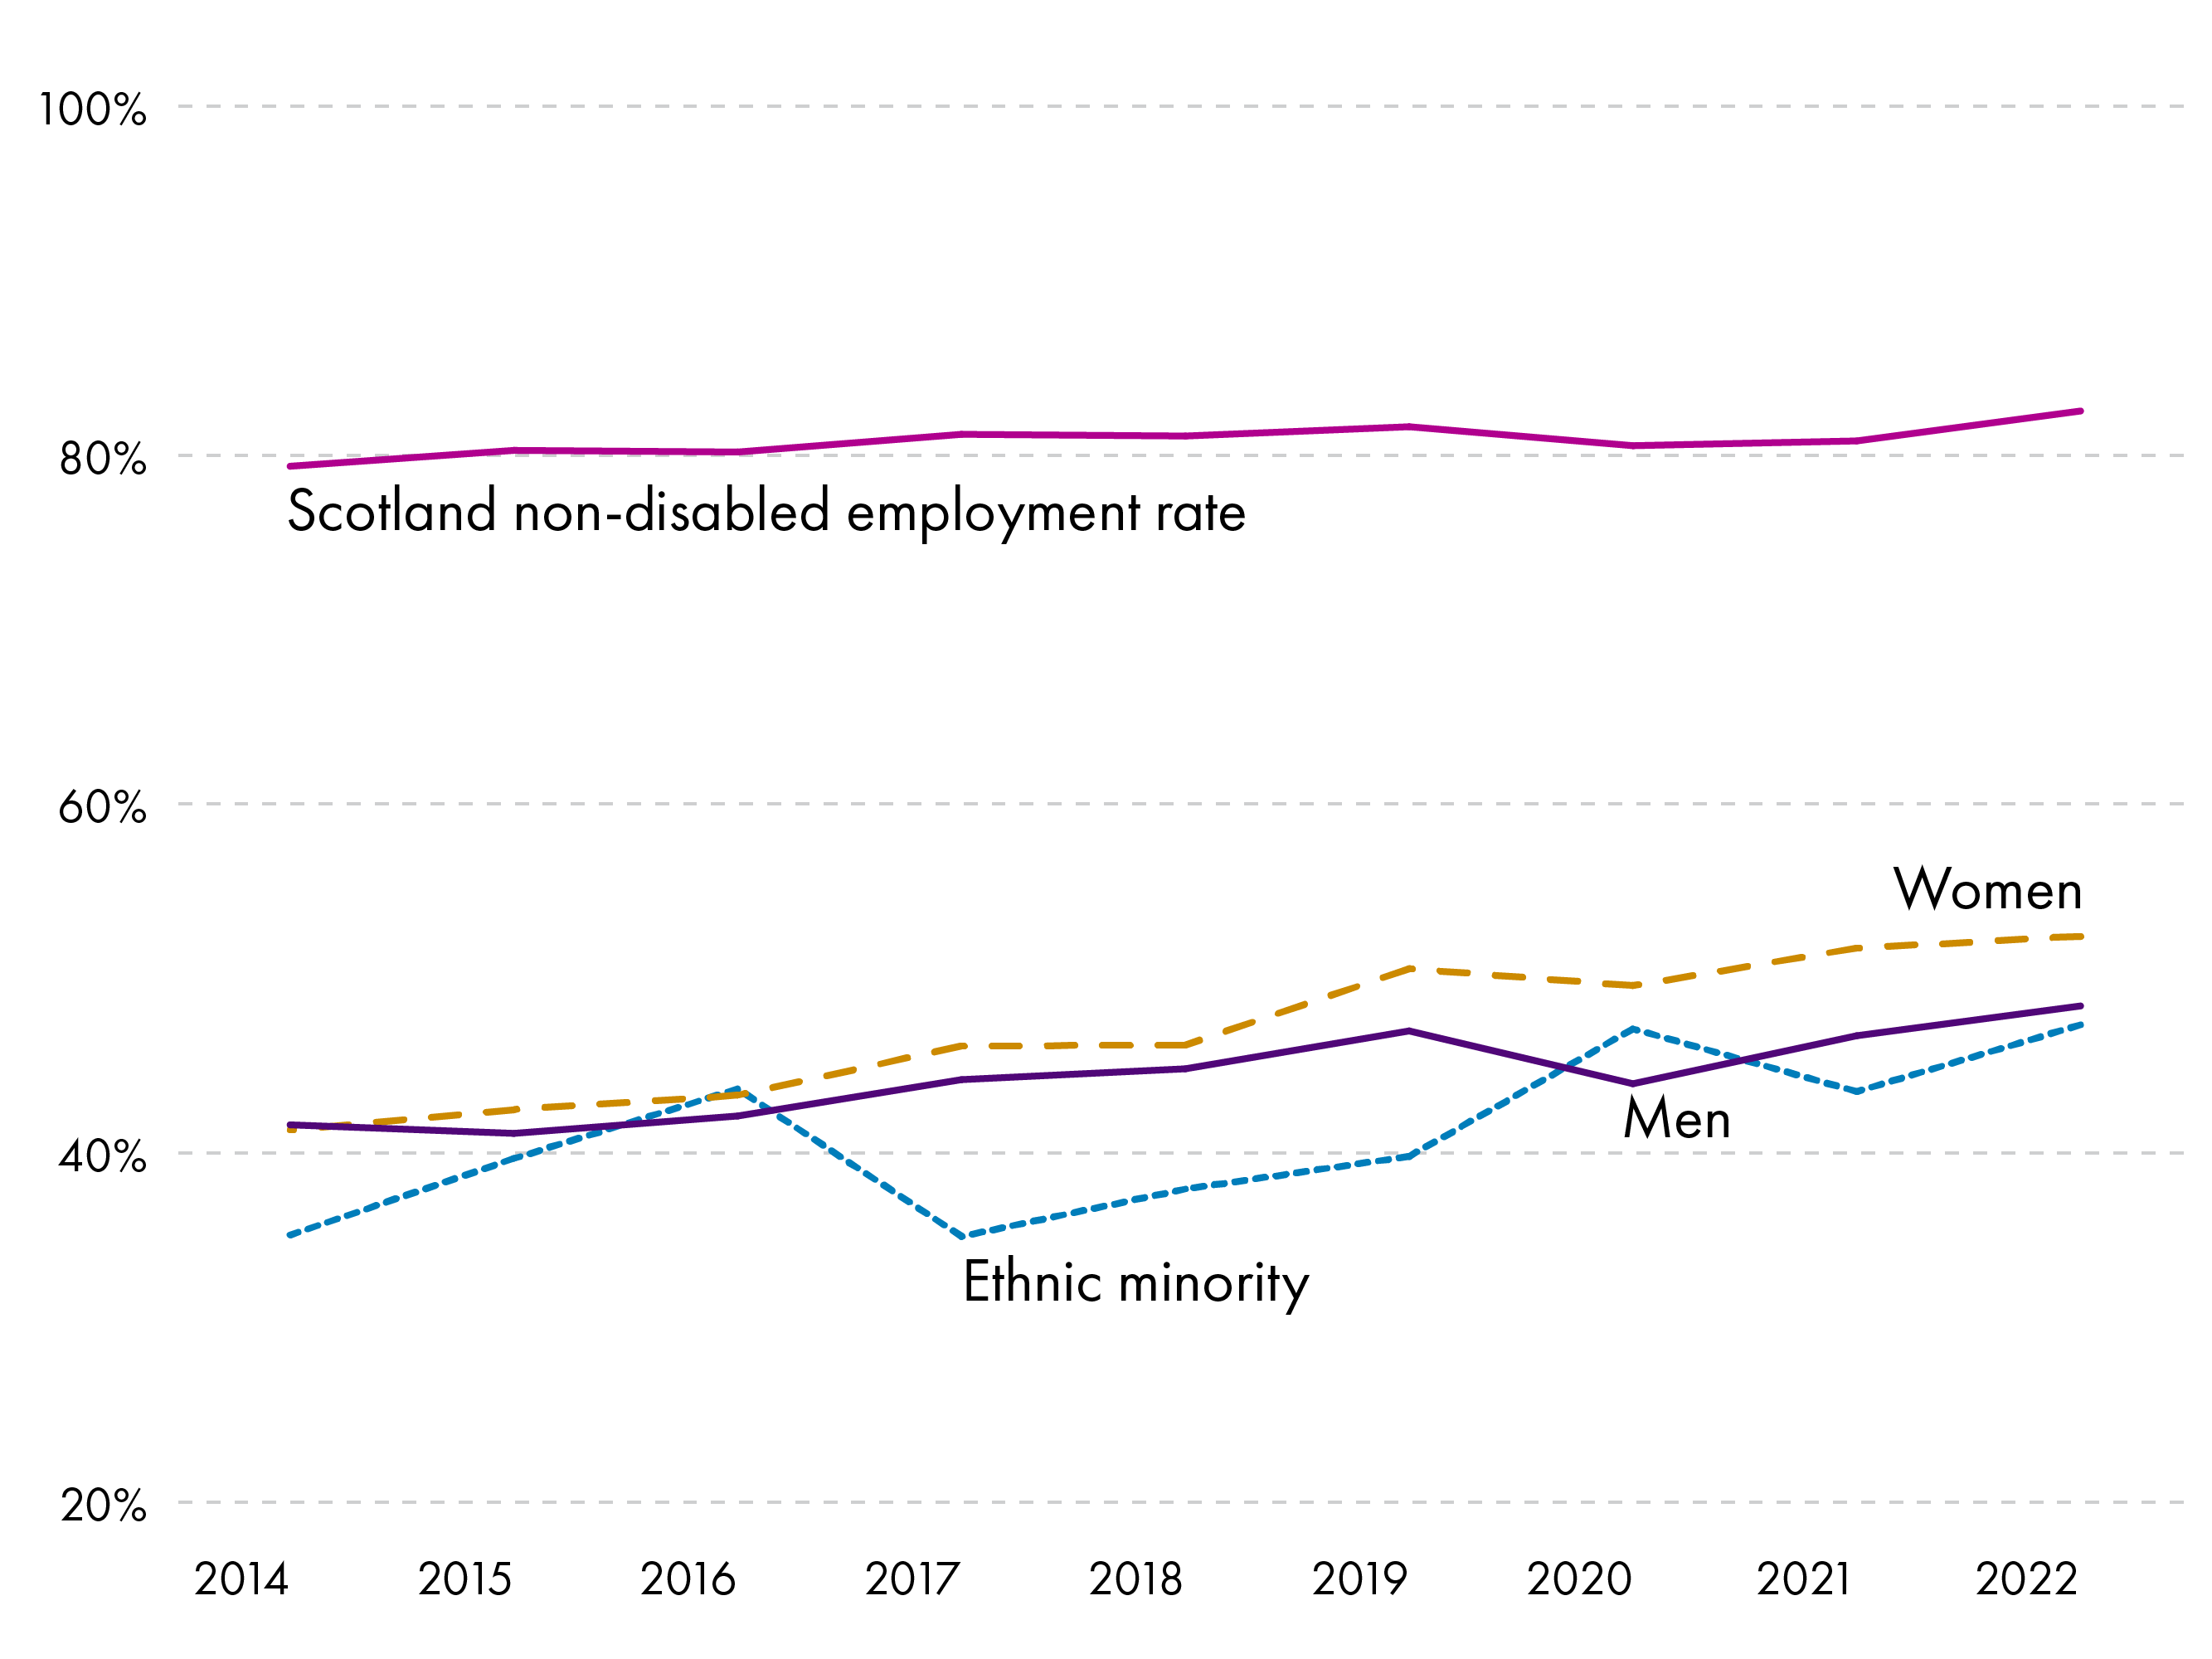
Annual Population Survey, 2014-2022Office For National Statistics. (2023). ‘Annual Population Survey, January - December, 2014-2022’ UK Data Service. Retrieved from https://doi.org/10.5255/UKDA-SN-9069-3
In contrast, disabled men in Scotland have seen the smallest changes in disability employment, with an increase of 6.8 percentage points since 2014. Disabled men in Scotland also have much lower rates of employment on average. This is unusual – in the rest of the UK, disabled men are more likely to be in work. It's not clear why this is. Possible mechanisms could include women's employment prospects improving regardless of disability over this period, or perhaps a difference in the way men report disability (for example, only reporting when it affects their ability to work). (Chart 15).
Annual Population Survey, 2014 to 2022Office For National Statistics. (2023). ‘Annual Population Survey, January - December, 2014-2022’ UK Data Service. Retrieved from https://doi.org/10.5255/UKDA-SN-9069-3
Conclusions
Scotland has a goal of reducing the employment gap by half between 2016 and 2038. If this progress were linear, this would represent a change of a little under 1 percentage point each year. So far, Scotland's employment gap has declined more quickly than this goal. However, 49% of disabled adults in Scotland are still out-of-work. This remains a higher proportion than the rest of the UK experiences, although the employment gap has fallen faster in Scotland than it has for the rest of the UK.
We find that people in work are likely to stay in work, regardless of their disability status, and people out of work were likely to remain out-of-work across a two-year period. The reason for the influx of disabled people in the work force is largely due to adults in work increasingly identifying a disability, rather than disabled adults moving into work. Increases in the overall employment rate has also contributed to the increase in disabled employment.
More and more people are specifically identifying mental health conditions, which has accounted for a majority of the increase in disability prevalence since 2014. People with mental illnesses are less likely to be in work than people with other health conditions, although the employment rate for people with mental illness grew at a higher rate than for other conditions. This is again because people in work who identified a mental health condition remained in work.
People with mental illnesses are also more likely to participate in part-time work and are more likely to be economically inactive.
Mental illness reporting has increased for both men and women in Scotland, although men are much less likely to report a disability on average. Disabled men are also much less likely to be in work than disabled women, which may indicate that men are not likely to report a disability until it actively affects their work.
Acknowledgements
This work was produced using statistical data from Office of National Statistics (ONS). The use of the ONS statistical data in this work does not imply the endorsement of the ONS in relation to the interpretation or analysis of the statistical data. This work uses research datasets which may not exactly reproduce ONS aggregates.
Appendix
Disability definition
The current definition used in UK (and Scottish) surveys comes from the Government Statistical Service and the 2010 Equality Act. This change came about on surveys beginning in mid-2013, meaning that it’s not possible to compare current data to data before 2013. The Labour Force Survey (LFS) began using this definition on Q3 2013, making 2014 the first calendar year with the current disability definition in the Annual Population Survey (Department for Work & Pensions, 2023b).
This definition covers people who report “current physical or mental health conditions of illnesses lasting or expected to last 12 months or more; and that these conditions or illnesses reduce their ability to carry out day-to-day activities.” Previously, the definition was based on the Disability Discrimination Act (2005) (DDA), which applied to “all people with a long-term health problem or disability that limits their day-to-day activities.” The slight difference in these terms means that some people may qualify as DDA disabled but not as Equality Act disabled1.
Change in disability employment rates and prevalence, 2014 to 2022
| Disability | Proportion of the disabled population citing disability as their main health concern in 2014 | Proportion of the disabled population citing disability as their main health concern in 2022 | Change (in p.p.) | Employment rates for individuals with listed disability as main health concern in 2014 | Employment rates for individuals with listed disability as main health concern in 2022 | Change (in p.p.) |
|---|---|---|---|---|---|---|
| Depression or anxiety, severe or specific learning problems, other mental health disabilities | 25% | 24% | 9.0 | 29% | 44% | 15.2 |
| Problems or disabilities connected with arms, legs, hands, feet, back, or neck | 31% | 23% | -8.3 | 47% | 57% | 10.4 |
| Progressive and other illnesses or disabilities not elsewhere classified | 17% | 21% | 3.7 | 41% | 48% | 7.0 |
| Chest or breathing problems; heart, blood pressure or circulation; diabetes; stomach, liver, or kidney | 23% | 19% | -3.6 | 48% | 58% | 10.0 |
| Difficulty in seeing, hearing, or speech | 3% | 2% | -0.5 | [X] | [X] | [X] |
| 2014 | 2015 | 2016 | 2017 | 2018 | 2019 | 2020 | 2021 | 2022 | Percentage point change, 2014 to 2022 | |
|---|---|---|---|---|---|---|---|---|---|---|
| Stomach, liver, kidney, or digestion | 52% | 51% | 54% | 56% | 55% | 71% | 64% | 65% | 72% | 20.0 |
| Legs or feet | 43% | 47% | 50% | 57% | 54% | 55% | 49% | 56% | 60% | 17.0 |
| Arms or hands | 50% | 54% | 48% | 54% | 52% | 60% | 48% | 60% | 57% | 6.9 |
| Back or neck | 49% | 51% | 56% | 54% | 55% | 59% | 58% | 50% | 54% | 5.7 |
| Depression, nerves, or anxiety | 34% | 35% | 34% | 40% | 40% | 46% | 49% | 51% | 54% | 20.0 |
| Chest or breathing problems | 45% | 44% | 47% | 51% | 51% | 59% | 57% | 54% | 54% | 9.3 |
| Diabetes | 60% | 51% | 52% | 60% | 56% | 59% | 52% | 55% | 51% | -9.0 |
| Heart, blood pressure, or circulatory | 43% | 40% | 41% | 39% | 52% | 43% | 42% | 44% | 51% | 8.6 |
| Other | 39% | 43% | 42% | 46% | 44% | 47% | 48% | 52% | 49% | 10.0 |
| Difficulty seeing, hearing, or speech impediment | 57% | 61% | 51% | 49% | 44% | 45% | 38% | 65% | 41% | -16.0 |
| Mental illness, phobias, panic | 18% | 19% | 23% | 19% | 23% | 28% | 28% | 27% | 32% | 14.0 |
| Severe or specific learning difficulties or autism | 24% | 11% | 20% | 16% | 14% | 16% | 15% | 28% | 30% | 5.7 |
Sources
Department for Work and Pensions. (2023). Employment of disabled people 2022. Retrieved from <a href="https://www.gov.uk/government/statistics/the-employment-of-disabled-people-2022/employment-of-disabled-people-2022" target="_blank">https://www.gov.uk/government/statistics/the-employment-of-disabled-people-2022/employment-of-disabled-people-2022</a> [accessed 1 July 2023]
Scottish Government. (2021). Fairer Scotland for disabled people - employment action plan: progress report - year 2. Retrieved from <a href="http://www.gov.scot/publications/fairer-scotland-disabled-people-employment-action-plan-year-2-progress-report/" target="_blank">http://www.gov.scot/publications/fairer-scotland-disabled-people-employment-action-plan-year-2-progress-report/</a> [accessed 2 October 2023]
Office For National Statistics. (2023). ‘Annual Population Survey, January - December, 2014-2022’ UK Data Service. Retrieved from <a href="https://doi.org/10.5255/UKDA-SN-9069-3" target="_blank">https://doi.org/10.5255/UKDA-SN-9069-3</a>
Department for Work & Pensions. (2023). The employment of disabled people: background information and methodology. Retrieved from <a href="https://www.gov.uk/government/publications/the-employment-of-disabled-people-background-information-and-methodology/the-employment-of-disabled-people-background-information-and-methodology" target="_blank">https://www.gov.uk/government/publications/the-employment-of-disabled-people-background-information-and-methodology/the-employment-of-disabled-people-background-information-and-methodology</a> [accessed 2 October 2023]
Office For National Statistics. (2023). Quarterly Labour Force Survey, 1992-2023. UK Data Service.. Retrieved from <a href="https://doi.org/10.5255/UKDA-SN-9069-3" target="_blank">https://doi.org/10.5255/UKDA-SN-9069-3</a>
World Health Organisation. (2022). COVID-19 pandemic triggers 25% increase in prevalence of anxiety and depression worldwide. Retrieved from <a href="https://www.who.int/news/item/02-03-2022-covid-19-pandemic-triggers-25-increase-in-prevalence-of-anxiety-and-depression-worldwide" target="_blank">https://www.who.int/news/item/02-03-2022-covid-19-pandemic-triggers-25-increase-in-prevalence-of-anxiety-and-depression-worldwide</a> [accessed 9 October 2023]
University of St Andrews. (n.d.) Definition of a Disability. Retrieved from <a href="https://www.st-andrews.ac.uk/hr/edi/disability/definition/" target="_blank">https://www.st-andrews.ac.uk/hr/edi/disability/definition/</a> [accessed 2 October 2023]