Labour market update: February 2019
This briefing provides an overview of the Scottish labour market from the latest regional labour market statistics from the Office for National Statistics (ONS).
Executive Summary
This briefing provides an overview of the Scottish labour market from the latest regional labour market statistics1 and UK labour market statistics2 published by the Office for National Statistics (ONS). The majority of the data is for Oct-Dec 2018, unless otherwise stated.
In Scotland, the unemployment rate fell over the quarter to a record low of 3.5% with employment increasing by 0.6 percentage points to 75.5%, just below the UK wide figure of 75.8%. Despite falling by 0.3 percentage points over the quarter, inactivity is still higher than the UK.
The unemployment rate for the 16 to 24(8.4%), 25 to 34 (2.7%) and 35 to 49 (2.5%) age groups are the lowest since comparable records began in 2001.
The employment rate for women has increased by a higher rate than for men, while also seeing higher reductions in unemployment and inactivity. Over the year the employment rate increased while the number was unchanged. As the rate relates to those aged 16-64 and the level relates to those aged 16+ it would suggest there has been a decrease in the number of women aged 65 and over in employment.
The ONS have highlighted that the number of unfilled vacancies in the economy has increased which indicates that employers may be facing challenges recruiting workers3. This sentiment has been echoed by the Royal bank of Scotland stating that:
Firms looking to hire face difficulties amid low candidate availability and strong competition for staff.4
Figure 1 shows the change in unemployment, employment and inactivity rates over the quarter by gender.
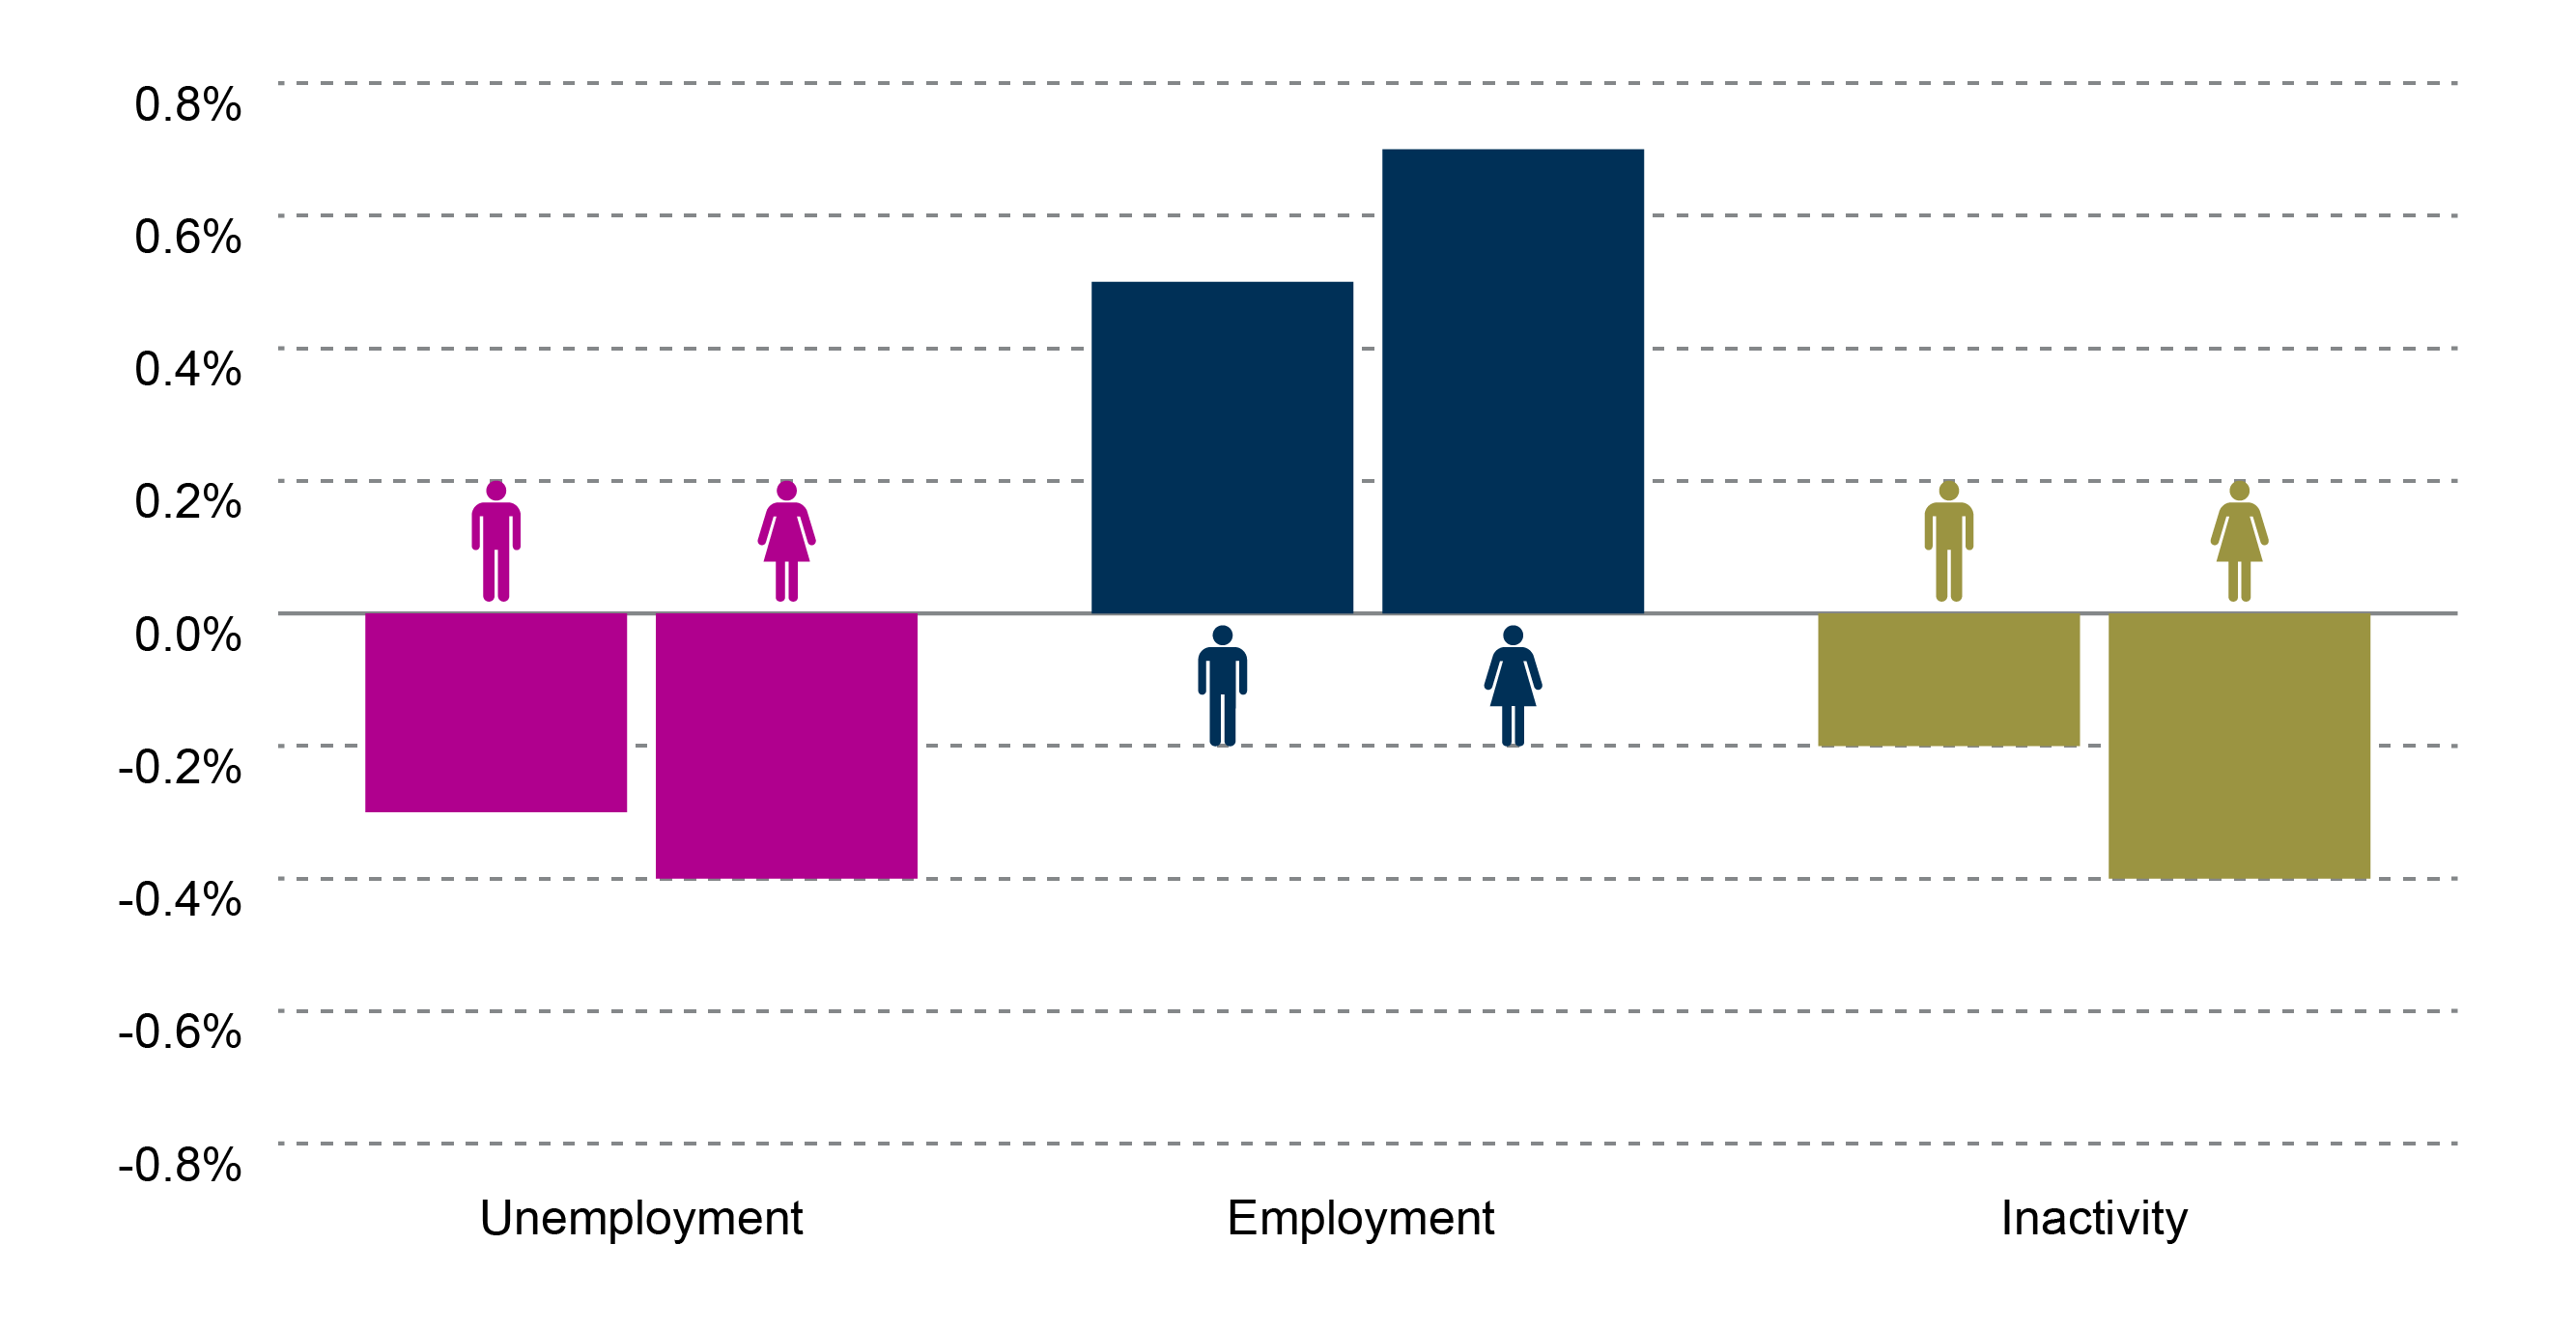
Table 1 shows the unemployment, employment and inactivity rates and the change on the previous quarter.
| Overall | Men | Women | ||||
|---|---|---|---|---|---|---|
| Rate (%) | Change over the qtr (% pts) | Rate (%) | Change over the qtr (% pts) | Rate (%) | Change over the qtr (% pts) | |
| Unemployment | 3.5% | -0.4 | 4.1% | -0.3 | 2.8% | -0.4 |
| Employment | 75.5% | +0.6 | 79.5% | +0.5 | 71.8% | +0.7 |
| Economic Inactivity | 21.7% | -0.3 | 17.1% | -0.2 | 26.1% | -0.4 |
What are the labour market measurements?
The International Labour Organisation provides the official definition of labour market statistics.
What is unemployment?
Level: Any individual aged 16 and over without a job who has been actively seeking work within the last four weeks and is available to start work within the next two weeks.
Rate: Number of unemployed individuals as a proportion of the total number of economically active people, which includes both the unemployed and those in work.
What is employment?
Level: Any individual aged 16 and over who is undertaking one hour or more a week of paid work.
Rate: Number of people in employment expressed as a percentage of all people aged 16-64.
What is economic inactivity?
Level: Any individual aged 16 to 64 who is not in employment, has not looked for work in the last four weeks, and/or is unable to start work within the next two weeks.
Rate: Number of people economically inactive expressed as a percentage of all people aged 16-64.
The main reasons for economic inactivity are:
being a student and not having or looking for a job
looking after the family and/or home
being sick (temporary and long-term)
being retired
being discouraged.
You can find out more in formation on labour market statistics in the SPICe Labour market statistics briefing.
Unemployment
The number of unemployed people in Scotland decreased by 10,000 over the quarter and by 26,000 over the year.
The unemployment rate for Scotland is 3.5%, whilst for the UK as a whole it is 4.0%. it has not been lower since December 1974 to February 1975 while the Scottish rate is the lowest since comparable records began in 1992.
The unemployment rate in Scotland fell over the quarter and the year at a faster rate the the UK.
| Level ('000) | Quarter change ('000) | Year change ('000) | Rate (%) | Quarter change (% pts) | Year change (% pts) | |
|---|---|---|---|---|---|---|
| Scotland | 96 | -10 | -26 | 3.5% | -0.4 | -1.0 |
| UK | 1,363 | -14 | -100 | 4.0% | -0.1 | -0.3 |
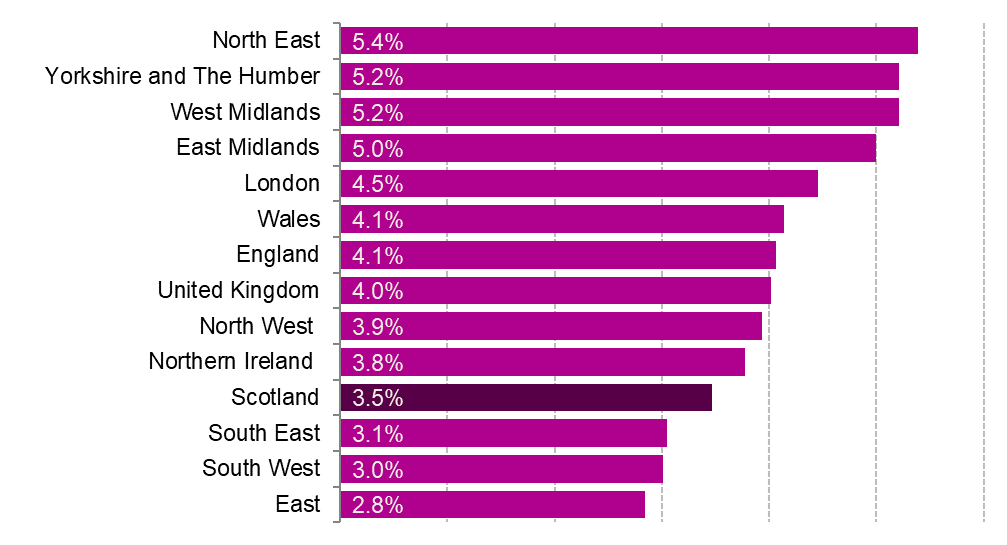
Looking at unemployment across the UK, the East of England has the lowest rate at 2.8%, whilst the North East has the highest at 5.4%. The rate in Scotland is the fourth lowest across the UK.
Unemployment by gender
Over the quarter the unemployment level decreased by 9,000 in Scotland (4,000 men and 5,000 women).
Over the year the unemployment level fell by 26,000 in Scotland (17,000 women and 9,000 men)
The unemployment rate for both men and women in Scotland fell over the quarter and the year. The unemployment rate for both men and women are the lowest since comparable records began in 1992.
The unemployment rate for women is lower in Scotland that the UK while the rate for men is the same.
| Level ('000) | Quarter change ('000) | Year Change ('000) | Rate (%) | Quarter change (% pts) | Year change (% pts) | ||
|---|---|---|---|---|---|---|---|
| Scotland | Men | 59 | -4 | -17 | 4.1% | -0.3 | -1.2 |
| Women | 37 | -5 | -9 | 2.8% | -0.4 | -0.7 | |
| UK | Men | 746 | -2 | -32 | 4.1% | 0.0 | -0.2 |
| Women | 617 | -12 | -68 | 3.9% | -0.1 | -0.5 |
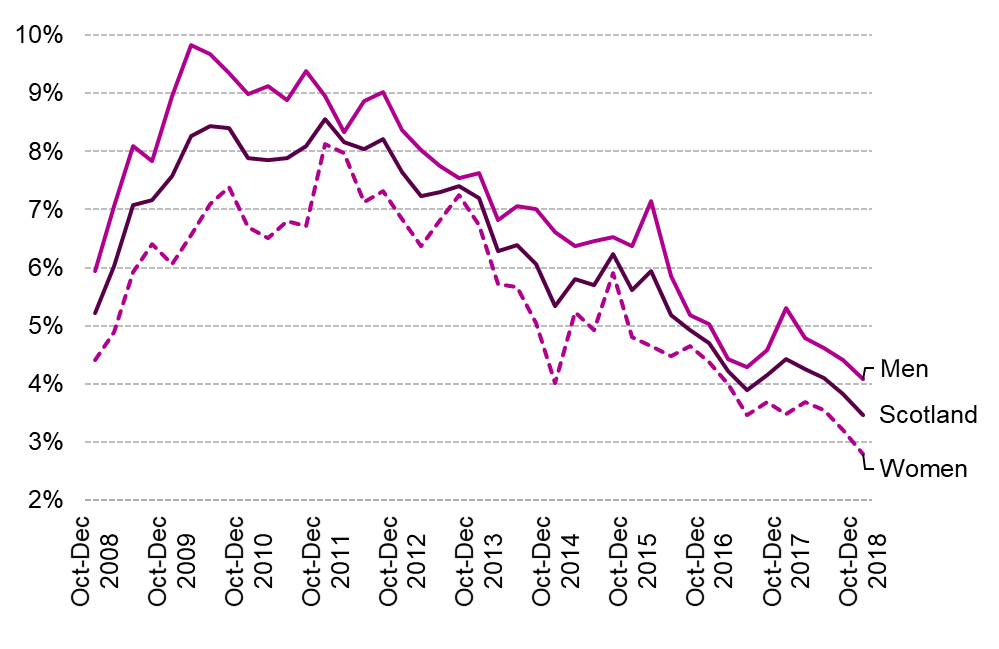
Figure 3 shows how unemployment rates by gender in Scotland have changed over the past 10 years.
The unemployment rate for men peaked at 9.8% in the first quarter of 2010. Since then it has fallen by 5.7 percentage points and is the lowest since comparable records began in 1992
The unemployment rate for women peaked at 8.1% in Oct-Dec 2011. Since then it has fallen by 5.3 percentage points to the current rate of 2.8%. This is the lowest rate since comparable records began.
Unemployment by age
This data is not seasonally adjusted and is compared with the same quarter in previous years.
The unemployment rate for the 16 to 24(8.4%), 25 to 34 (2.7%) and 35 to 49 (2.5%) age groups are the lowest since comparable records began in 2001.
The only age group in Scotland that deviates significantly from the UK is 16-24 year olds, at 3.9 percentage points lower that the UK.
| Age group | Scotland | UK | |
|---|---|---|---|
| 16-24 | Rate | 7.6% | 11.5% |
| Year change (% pts) | -2.6 | -0.6 | |
| 25-34 | Rate | 3.3% | 3.4% |
| Year change (% pts) | -0.4 | -0.4 | |
| 35-49 | Rate | 2.2% | 2.5% |
| Year change (% pts) | -1.3 | -0.2 | |
| 50-64 | Rate | 3.1% | 2.8% |
| Year change (% pts) | -0.3 | -0.2 |
Employment
The number of people aged 16 and over in employment in Scotland increased by 21,000 over the quarter and by 27,000 over the year.
The rate in Scotland increased over both the quarter and the year at a faster rate than the UK.
The current employment rate, of 75.5%, is the highest since comparable records began in 1992. While for the UK it is the the joint-highest since comparable estimates began in 1971.
| Level ('000) | Quarter change ('000) | Year change ('000) | Rate (%) | Quarter change (% pts) | Year change (% pts) | |
|---|---|---|---|---|---|---|
| Scotland | 2,685 | +21 | +27 | 75.5% | +0.6 | +1.1 |
| UK | 32,597 | +167 | +444 | 75.8% | +0.3 | +0.7 |
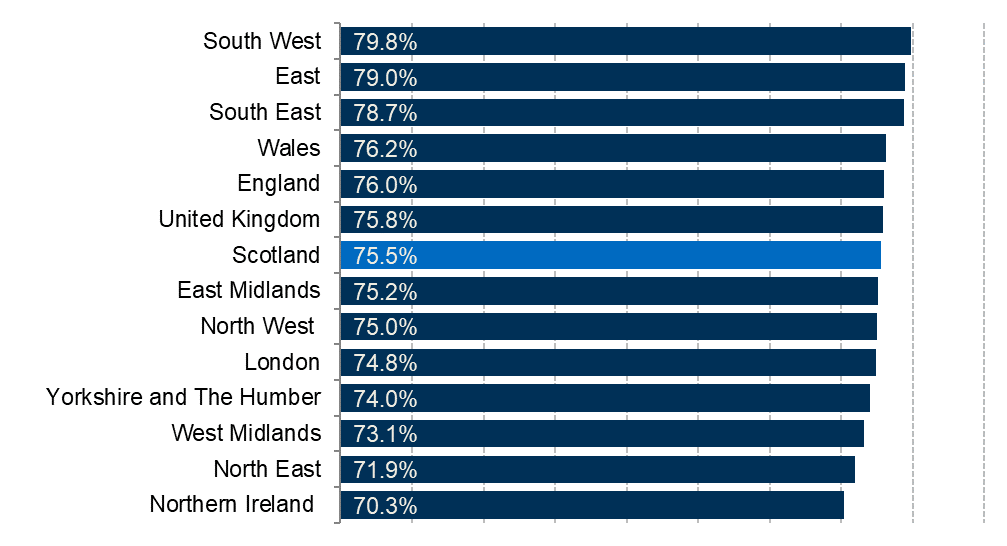
Looking at employment across the UK, the Scottish rate is just below the UK. The South West has the highest rate at 79.8%, whilst Northern Ireland has the lowest at 70.3%.
Employment by gender
Employment levels and rates are higher for men than for women at both Scottish and UK levels.
Over the year the number of men in employment increased by 27,000 while there was no change in the number of women.
The number of men in employment ins currently the highest since comparable record began in 1992.
The rate for both men and women increase over the quarter and the year.
The annual increase in the rate for men is the highest since between Jan-Mar 2011 and 2012.
The employment rate for women is higher in Scotland than the UK, while it is lower for men in Scotland than the UK.
| Level ('000) | Quarter change ('000) | Year change ('000) | Rate (%) | Quarter change (% pts) | Year change (% pts) | ||
|---|---|---|---|---|---|---|---|
| Scotland | Men | 1,387 | +9 | +27 | 79.5% | +0.5 | +1.8 |
| Women | 1,298 | +12 | 0 | 71.8% | +0.7 | +0.4 | |
| UK | Men | 17,290 | +89 | +255 | 80.3% | +0.2 | +0.7 |
| Women | 15,308 | +78 | +188 | 71.4% | +0.3 | +0.6 |
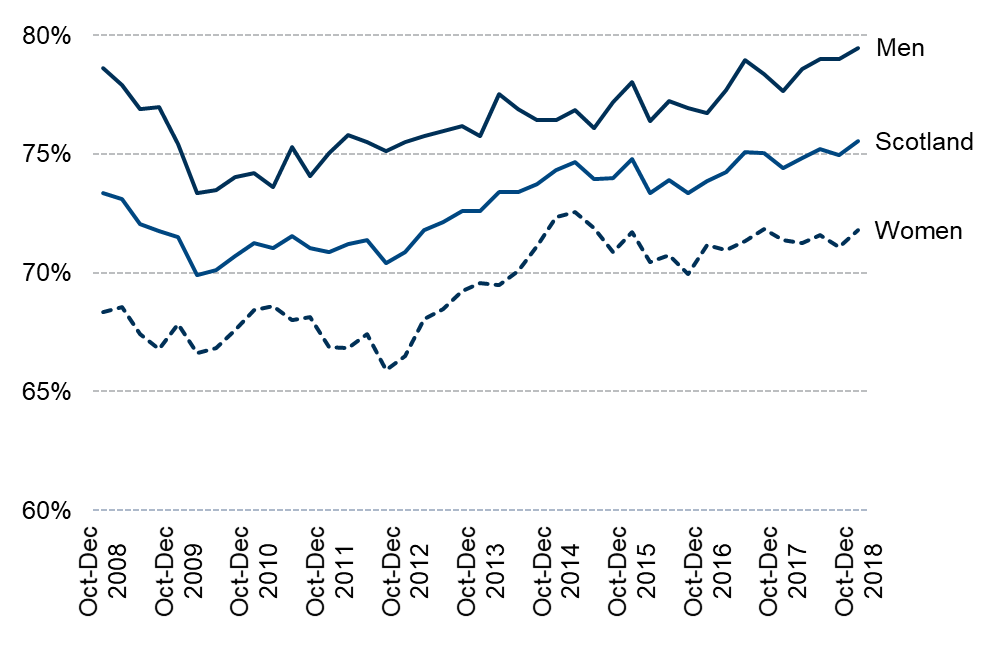
Figure 5 shows how employment rates by gender in Scotland have changed over the past 10 years.
The employment rate for women has increased by 5.9 percentage points since Jul-Sep 2012, when it was its lowest in the last 10 years, at 65.9%. It is, however, slightly below its peak of 72.6% in Jan-Mar 2015.
The men's employment rate has increased by 6.1 percentage points since Jan-Mar 2010, when it was its lowest in the last 10 years, at 73.3%. The rate is currently the highest it has been for the last 10 years.
Employment by age
This data is not seasonally adjusted and is compared with the same quarter in previous years.
Despite a slight decrease, the employment rate for 50-64 year olds has increased by 9.4 percentage points since 2001.
The employment rate for the 25 to 34 year old age group is the highest since comparable records began.
The youth employment rate (16-24) is the only age group where Scotland deviates from the UK, with the rate in Scotland 5.8 percentage points higher.
| Age group | Scotland | UK | |
|---|---|---|---|
| 16-24 | Rate (%) | 61.6% | 55.8% |
| Year change (% pts) | +4.4 | +0.9 | |
| 25-34 | Rate (%) | 84.4% | 84.0% |
| Year change (% pts) | +1.8 | +0.5 | |
| 35-49 | Rate (%) | 84.7% | 85.4% |
| Year change (% pts) | +3.2 | +0.5 | |
| 50-64 | Rate (%) | 68.0% | 72.0% |
| Year change (% pts) | -3.1 | +0.6 |
Economic inactivity
The number of people economically inactive in Scotland fell over the quarter by 11,000 and by 13,00 over the year.
Over both the quarter and the year the inactivity rate fell in Scotland.
| Level ('000) | Quarter change ('000) | Year change ('000) | Rate (%) | Quarter change (% pts) | Year change (% pts) | |
|---|---|---|---|---|---|---|
| Scotland | 747 | -11 | -13 | 21.7% | -0.3 | -0.4 |
| UK | 8,632 | -94 | -153 | 20.9% | -0.2 | -0.4 |
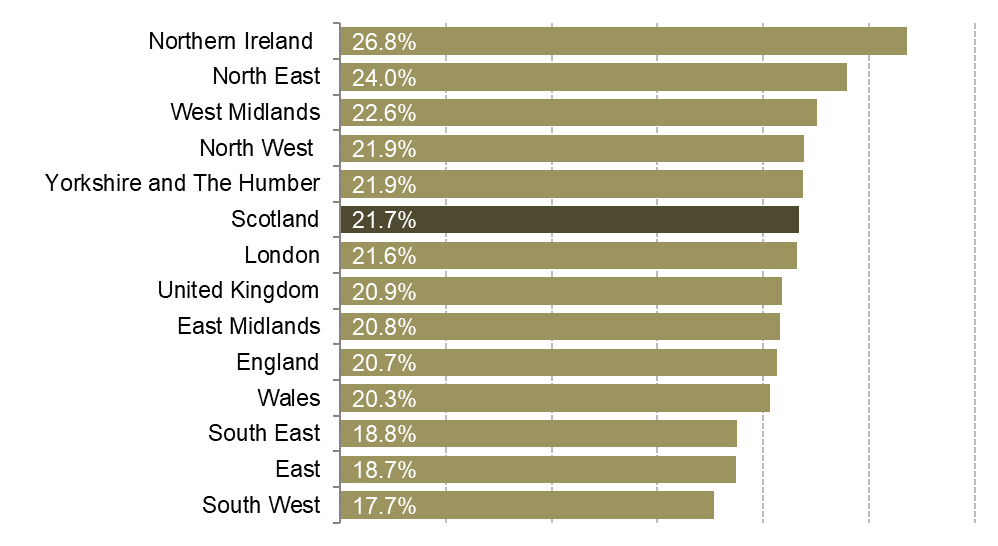
Looking at economic inactivity across the UK, the Scottish rate is higher than the UK average. Northern Ireland has the highest rate at 26.8%, whilst the South West has the lowest at 17.7%.
Economic inactivity by gender
Economic inactivity rates are higher for women than for men.
Over the quarter the number of inactive men fell by 4,000, whilst the number of inactive women fell by 8,000.
Over the the year the number of inactive men fell by 15,000 while the number of inactive women increased by 2,000.
The inactivity rates for men and women are higher in Scotland than in the UK overall.
| Level ('000) | Quarter change ('000) | Year change ('000) | Rate (%) | Quarter change (% pts) | Year change (% pts) | ||
|---|---|---|---|---|---|---|---|
| Scotland | Men | 287 | -4 | -15 | 17.1% | -0.2 | -0.9 |
| Women | 460 | -8 | +2 | 26.1% | -0.4 | +0.1 | |
| UK | Men | 3,307 | -41 | -101 | 16.1% | -0.2 | -0.5 |
| Women | 5,325 | -52 | -52 | 25.7% | -0.3 | -0.3 |
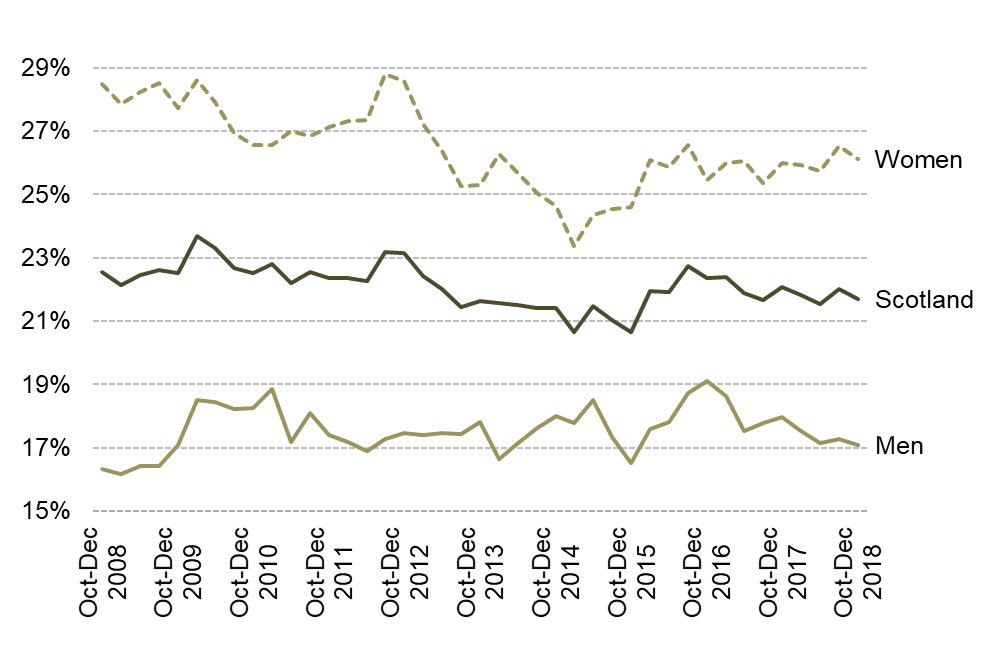
Figure 7 shows how inactivity rates by gender in Scotland have changed over the past 10 years.
The inactivity rate for men peaked in Oct-Dec 2016, at 19.1%. Since then it has fallen by 2.0 percentage points. The lowest rate for men was in Jan-Mar 2009, at 16.2%.
The inactivity rate for women peaked at 28.8% in Jul-Sep 2012, it then fell to 23.4% by the first quarter of 2015 and now sits 2.7 percentage points higher, at 26.1%.
Economic inactivity by age
This data is not seasonally adjusted and is compared with the same quarter in previous years.
The rise of 3.5 percnetage points over the year in the inactivity rate for the 50-64 year old age group is the largest since comparable records began in 1992, despite this overall it has fallen by 8.9 percentage points since 2001.
The inactivity rate for the 25-34 year old age group is the lowest since comparable records began in 1992.
| Age Group | Scotland | UK | |
|---|---|---|---|
| 16-24 | Rate (%) | 33.3% | 37.0% |
| Year change (% pts) | -2.9 | -0.6 | |
| 25-34 | Rate (%) | 12.7% | 13.1% |
| Year change (% pts) | -1.5 | -0.2 | |
| 35-49 | Rate (%) | 13.4% | 12.4% |
| Year change (% pts) | -2.2 | -0.4 | |
| 50-64 | Rate (%) | 29.8% | 26.0% |
| Year change (% pts) | +3.5 | -0.5 |
Claimant Count
The Claimant Count figures presented here are experimental statistics from the ONS for Jobseekers Allowance, plus Universal Credit claimants who are out of work.
Under Universal Credit, a broader span of claimants are required to look for work than under Jobseekers Allowance. As Universal Credit Full Service is rolled out in particular areas, the number of people recorded as being on the Claimant Count is therefore likely to rise.
This is not an official measure of unemployment, but it does provide accurate information on the labour market at a local level.
Scotland and UK comparison
The seasonally adjusted claimant count rate for January in Scotland increased by 0.1 percentage points while it was unchanged from for the UK.
The Scottish claimant count rate is higher than the UK rate.
| Level | Month Change | Year Change | Rate (%) | Month Change (% pts) | Year Change (% pts) | |
|---|---|---|---|---|---|---|
| Scotland | 100,300 | +1,100 | +17,600 | 2.9% | +0.1 | +0.5 |
| UK | 1,010,700 | +14,200 | +189,100 | 2.4% | 0.0 | +0.4 |
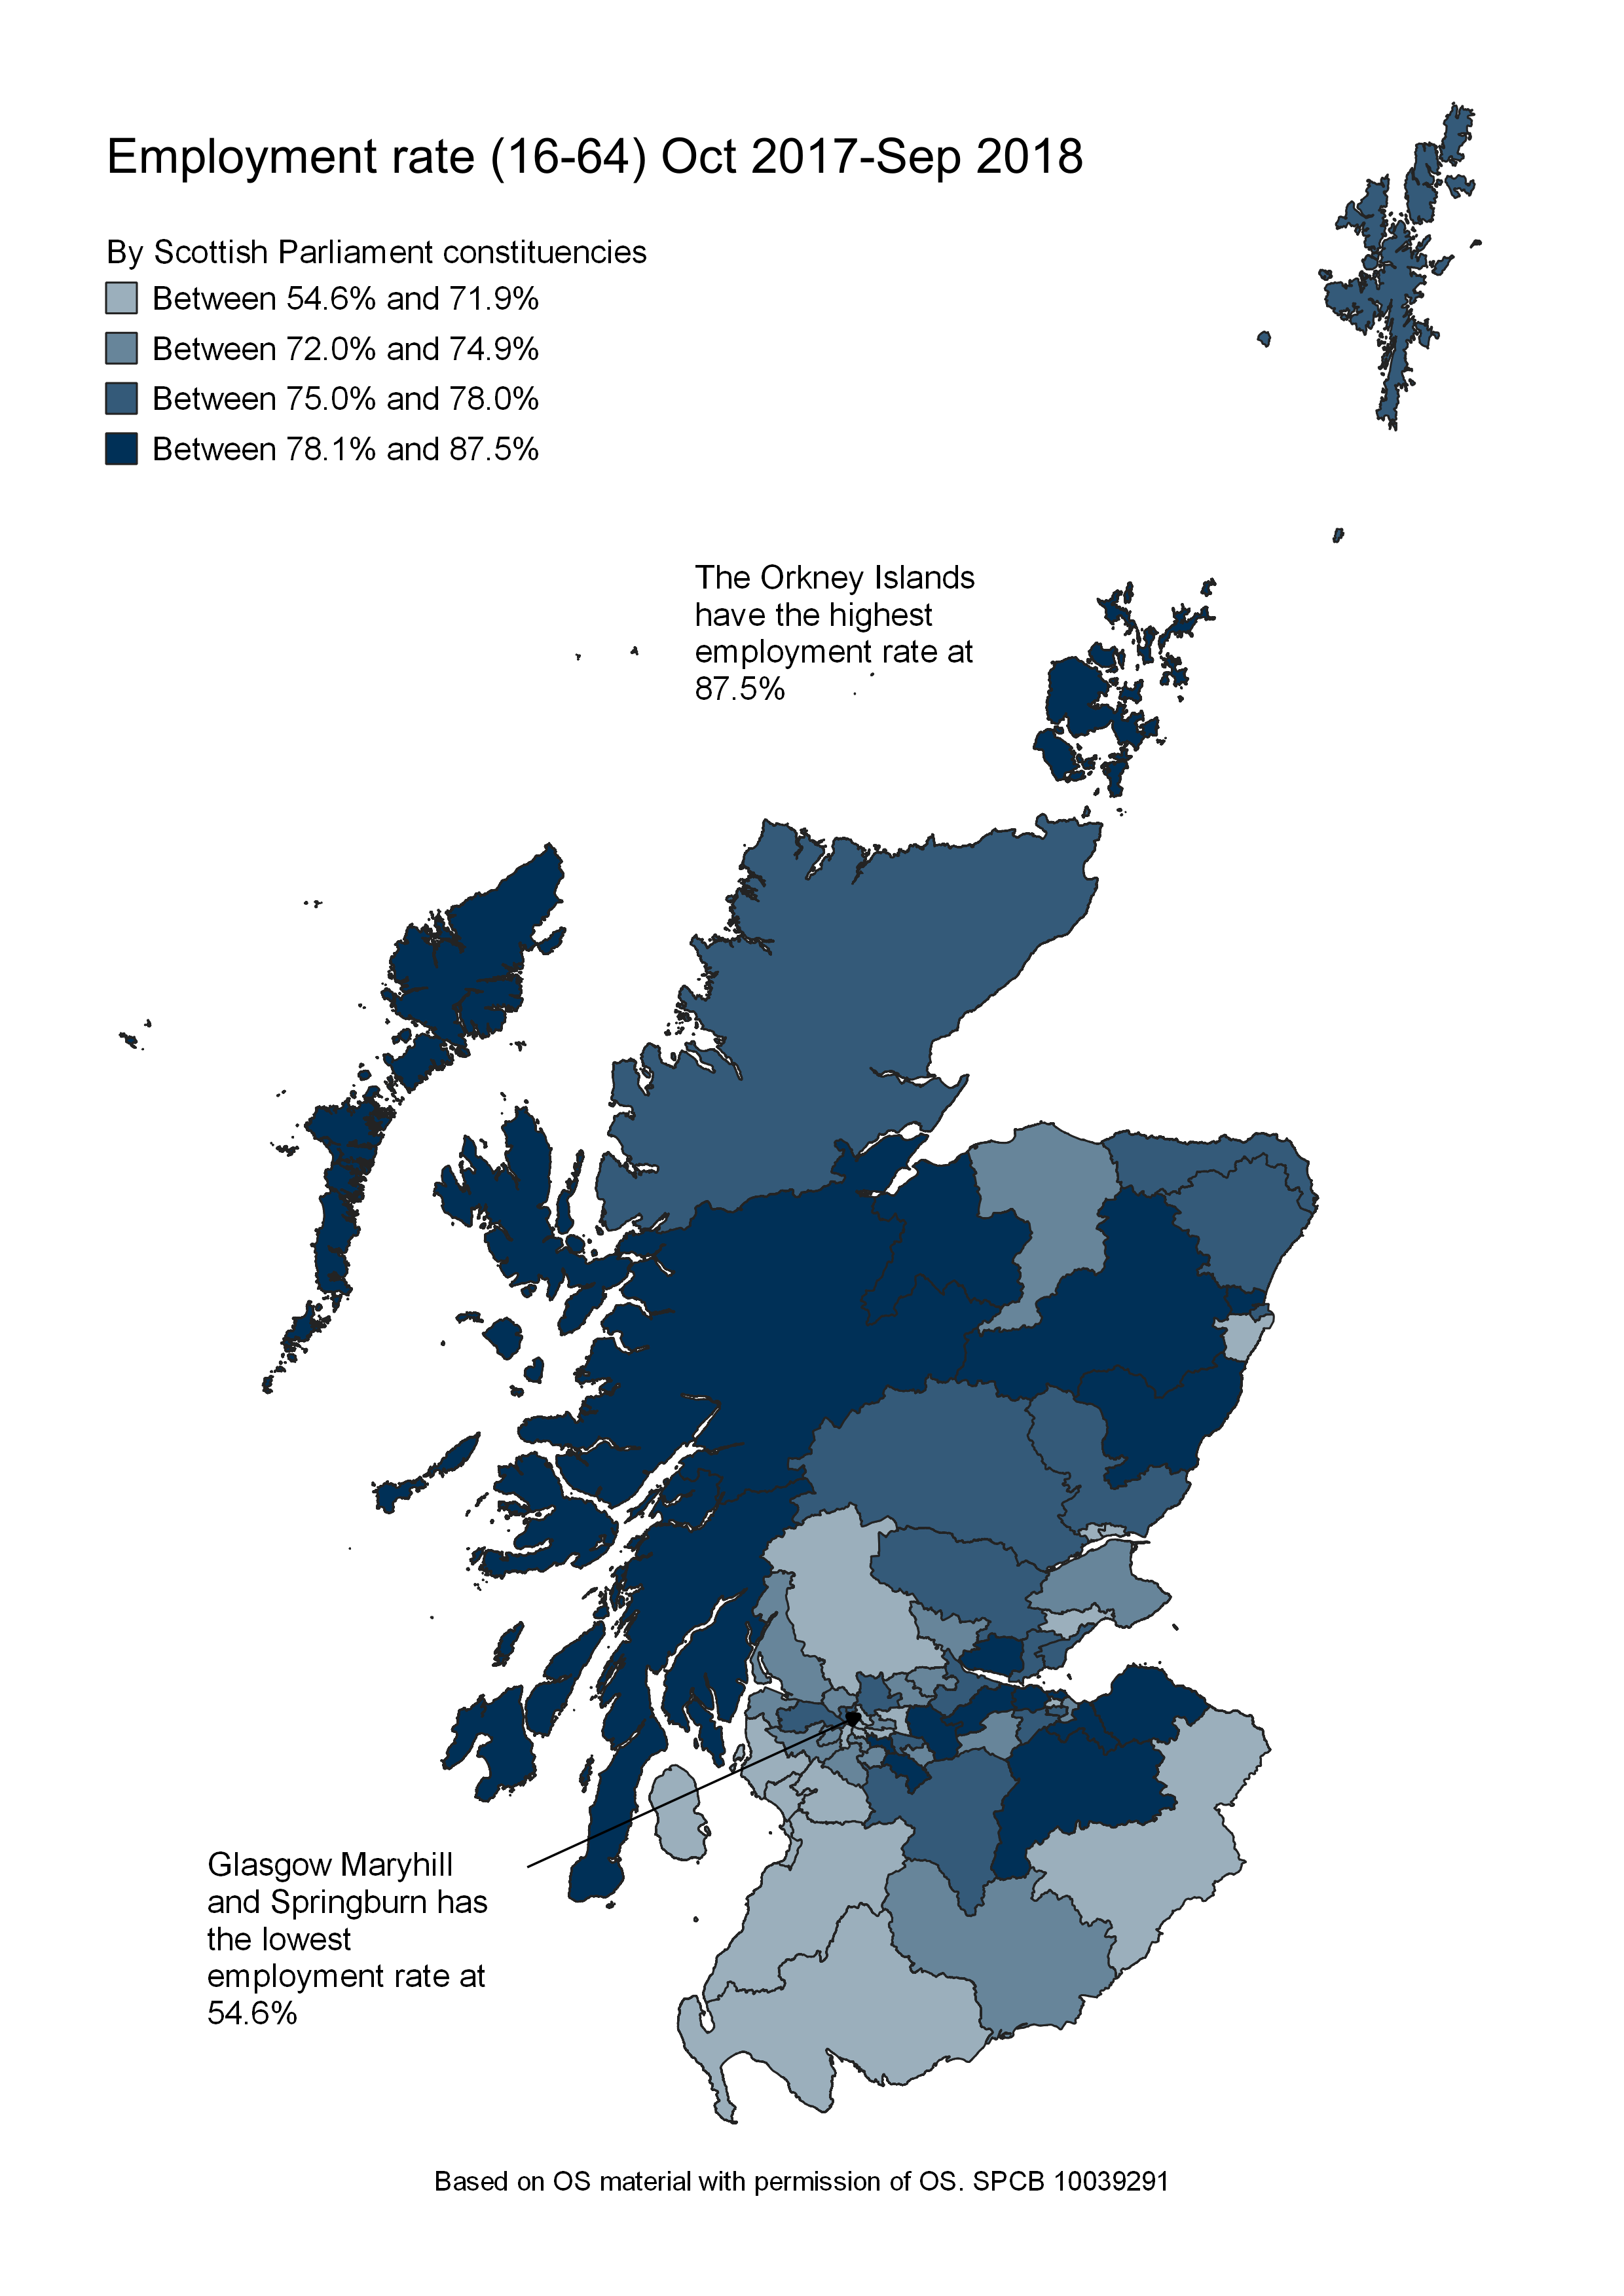
Constituency data: employment
The constituency data for Scotland comes from the Annual Population Survey (APS). The APS datasets are produced quarterly, with each dataset containing 12 months of data. This data is based on residence analysis of the APS.
The latest APS data is for Oct 2017-Sep 2018.
Glasgow Maryhill and Springburn has the lowest employment rate at 54.6%, whilst the Orkney Islands have the highest at 87.5%. Airdrie and Shotts saw the biggest increase over the year, whilst Glasgow Maryhill and Springburn saw the largest decrease.
This data is from the resident analysis of the APS, meaning the rate is for those who live in the constituency.
Find out the latest labour market data for your constituency.
Sources
Office for National Statistics. (2019, January 21). Regional labour market statistics in the UK: January 2019. [accessed 21 January 2019]
Office for National Statistics. (2019, January 21). UK labour market: January 2019. Retrieved from <a href="https://www.ons.gov.uk/employmentandlabourmarket/peopleinwork/employmentandemployeetypes/bulletins/uklabourmarket/january2019" target="_blank">https://www.ons.gov.uk/employmentandlabourmarket/peopleinwork/employmentandemployeetypes/bulletins/uklabourmarket/january2019</a> [accessed 21 January 2019]
Office for National Statistics. (2019, February 19). Labour market economic commentary: February 2019. Retrieved from <a href="https://www.ons.gov.uk/employmentandlabourmarket/peopleinwork/employmentandemployeetypes/articles/labourmarketeconomiccommentary/february2019" target="_blank">https://www.ons.gov.uk/employmentandlabourmarket/peopleinwork/employmentandemployeetypes/articles/labourmarketeconomiccommentary/february2019</a> [accessed 19 February 2019]
Royal Bank of Scotland. (2019, February 8). Royal Bank of Scotland Report on Jobs. Retrieved from <a href="https://www.markiteconomics.com/Survey/PressRelease.mvc/9b004945ea9d4725b1682d61cee49a15" target="_blank">https://www.markiteconomics.com/Survey/PressRelease.mvc/9b004945ea9d4725b1682d61cee49a15</a> [accessed 20 February 2019]