A Guide to Gross Value Added (GVA) in Scotland
This paper provides an introduction to GVA covering methodology, approaches, and sources. Building on this overview, it looks at how GVA relates to Scotland's policy landscape and it then provides an overview of GVA trends in Scotland since 1998. It explores the GVA contribution of Scotland's sectors and provides insights on the geographical spread of GVA in Scotland. Finally, it analyses the income components of GVA.
Executive Summary
GVA is a key indicator of the state of the whole economy and gives a picture of the state of economic activity from the supply side perspective.
GVA measures the contribution to the economy of each individual producer, industry or sector in Scotland and is used in the estimation of GDP. GVA is the difference between the value of goods and services produced and the cost of raw materials and other inputs, which are used up in production. GVA is useful in that it can add important quantitative economic detail to inform the assessment of a policy intervention, help policymakers decide which sectors and geographies need incentives or stimulus, and accordingly formulate specific policies.
Scotland's GVA performs relatively well when longer time periods are considered but ranks lower when looking at more recent years.
In 2016 almost a quarter (23%) of the UK's GVA was generated in London, whilst London and the South East accounted for 38% of UK GVA. Scotland's GVA totalled £134 billion in 2016, which was 8% of the UK total. In current basic prices, the Scottish GVA total represented annual growth of 3%. However, in real terms with the effect of inflation removed, annual growth was 1.2%, which was 0.4 percentage points below the UK growth rate of 1.6%. In terms of GVA growth relative to elsewhere in the UK, Scotland performs relatively well when longer time periods are considered, but ranks lower when looking at more recent years.
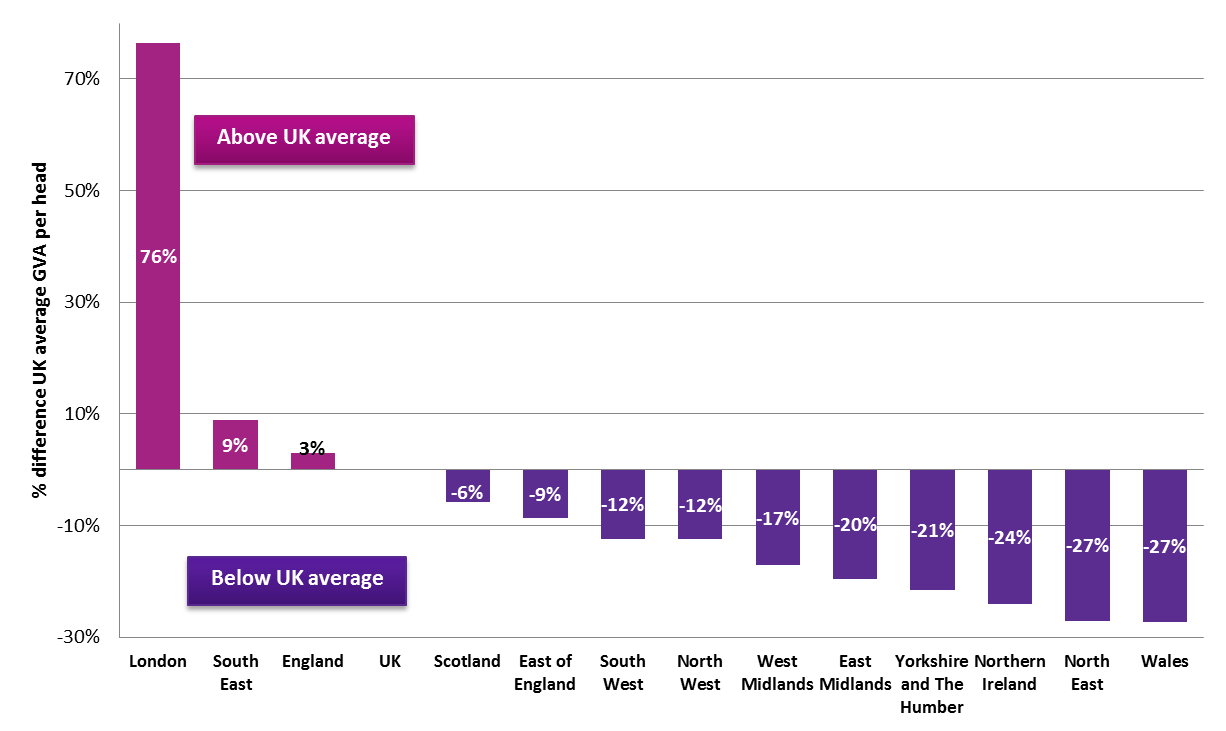
Scotland's annual GVA per head growth rate was also 0.4 percentage points below the UK growth rate of 2.8%. With regard to UK averages, one could ask how reflective these are given the extent of skew caused by London and the South East average ratios. For example in the UK, at one end of the spectrum GVA per head in London was 76% above the UK average, whilst Wales on the other end was 27% below the UK average. Relative to UK GVA per head, Scotland was the best performing region outside of London and the South East. However, significant regional variations were contained in the average Scottish GVA per head figure when drilled-down.
Since 1998, in the almost two decades to 2016, in current prices Scotland's GVA grew by 91% (versus 96% at a UK level). However, in real terms with the effect of inflation removed, growth over this period was 41% (40% at a UK level). Regular observers and commentators of economic data will notice that this real terms growth looks quite different to the regularly used Scottish Government estimates - in these Scotland underperforms relative to the UK. This reflects different approaches to deflation and volume estimation, as discussed in more detail in the Annex of this paper.
Since 1998 there has been little change or rebalance in the distribution of GVA across Scotland's economy.
Approximately 30% of Scotland's GVA was generated in its two largest cities (Glasgow 15.2%, Edinburgh 14.9%). Aberdeen City (7.9%) and Fife (5.6%) were the next largest local authority areas in terms of economic output. Since 1998 there has been little change or rebalance in the distribution of GVA across Scotland's economy.
Aberdeen City had the highest GVA per head ratio at £46,151 and East Renfrewshire had the lowest at £13,877, illustrating the range of GVA per head ratios across Scotland's local authorities. In this context, it is important to note that GVA per head can be subject to distortion due to the effects of commuting and variations in the age distribution of the resident population.
The largest industry in the Scottish economy (as is true elsewhere in the UK) is owner-occupiers unknowingly letting their own houses to themselves.
Scotland's three largest sectors in terms of GVA contribution were: real estate activities (11.6% of total Scottish GVA), manufacturing (10.7%), and wholesale and retail trade; repair of motor vehicles (10.7%). Here it needs to be highlighted that the majority of real estate activities are "imputed rental of owner occupiers". It is striking that the largest industry in the Scottish economy (as is true elsewhere in the UK) is owner-occupiers unknowingly letting their own houses to themselves.
The greatest industry change over the 18 year period to 2016 has been the decline in the contribution of manufacturing to the economy. In 1998 manufacturing represented 17% of Scotland's GVA, this had decreased to 11% in 2016. This decline had been counterbalanced by moderate growth in the GVA contribution of a number of sectors, namely human health and social work activities, professional, scientific and technical activities, and financial and insurance activities.
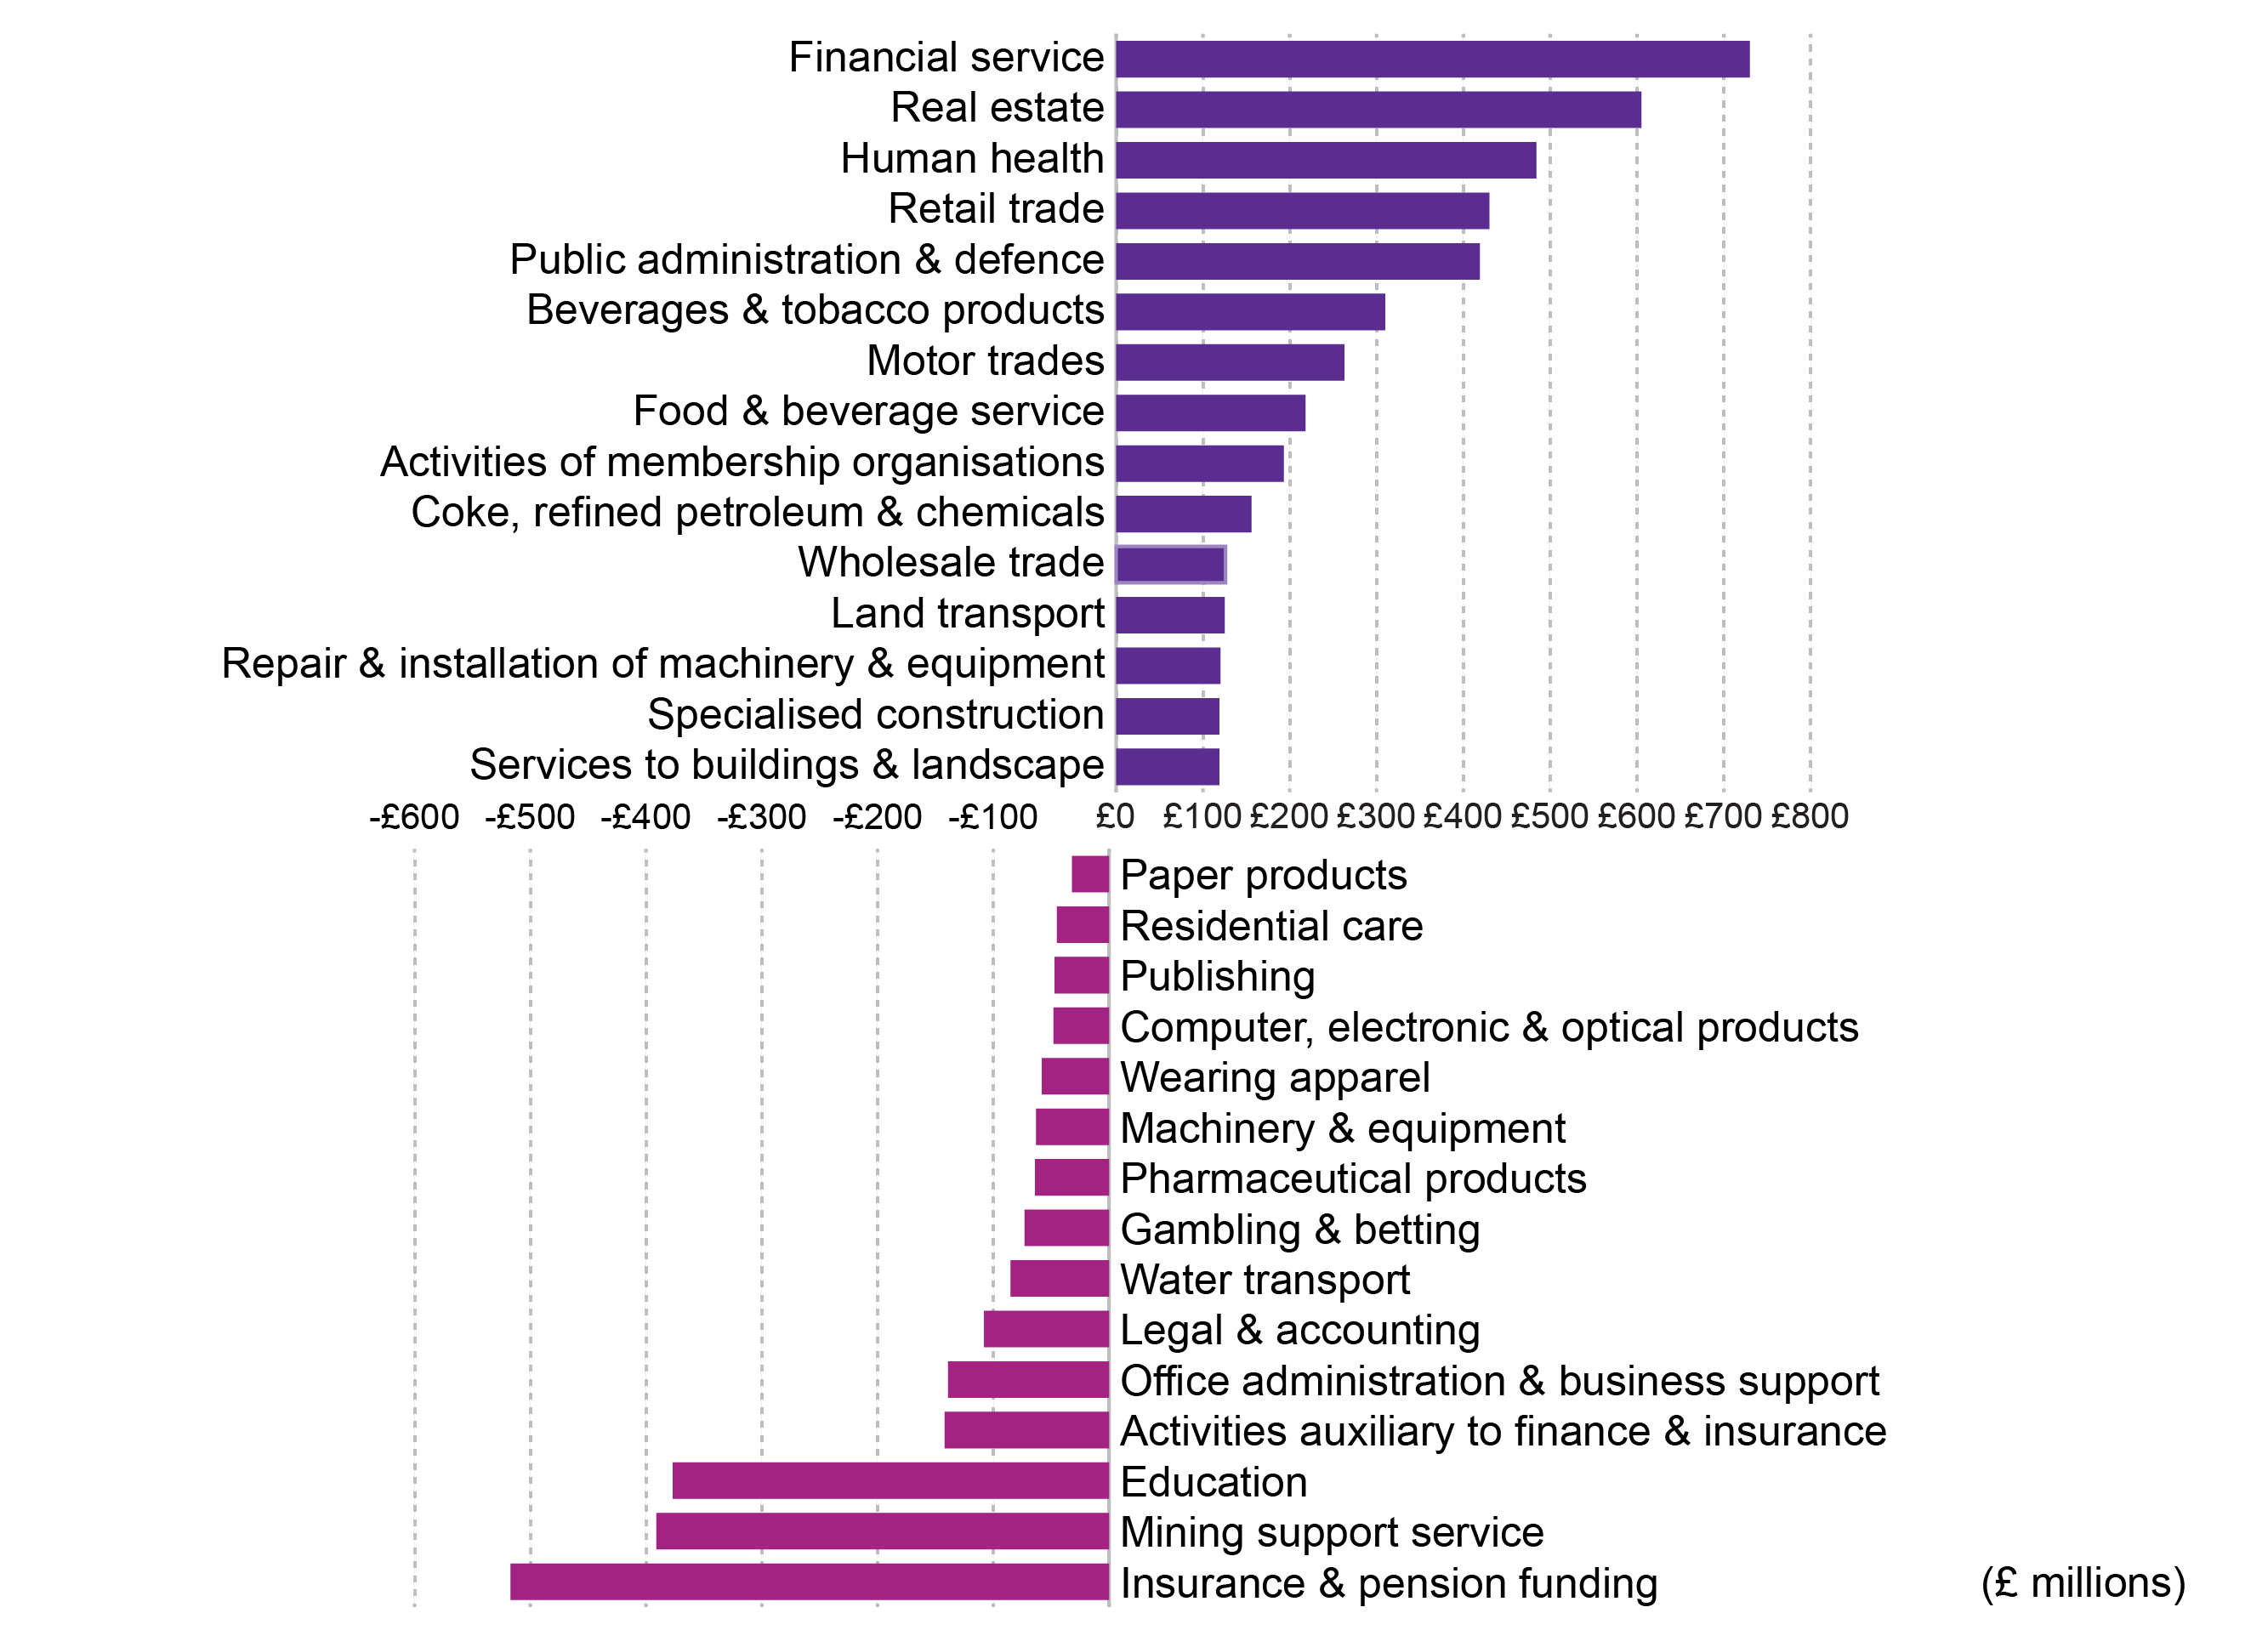
Financial service activities recorded the largest increase in GVA in the year to 2016 (£730 million), whilst insurance and pension funding had the greatest decrease, declining by £517 million. GVA for mining support service activities declined by £391 million in the year to 2016, reflecting the decline of this sector in North East Scotland. As well as the already highlighted decline in insurance and pension fund activities, there were declines in other finance linked support activities, such as activities auxiliary to finance and insurance (-£142 million), office administration and business support activities (-£139 million), and legal and accounting activities (-£108 million).
Some sectors more naturally lend themselves to higher valued added activity than others.
Looking at sector turnover to GVA ratios, it is clear some sectors more naturally lend themselves to higher valued added activity than others. This variation in economic value added and the sectoral mix of the economy, all have knock on impacts for productivity and ultimately economic growth.
The sector with the highest turnover to GVA ratio was sewerage at £1: 0.90p (noting sewerage is a relatively small sector with limited scale-up opportunities) and the lowest was the wholesale and retail trade at £1:0.16p. Other sectors on the top end of scale were legal and accounting activities (0.81), real estate activities (0.74), and advertising and market research (0.74). Examples of lower valued sectors were gambling and betting activities (0.18),manufacture of coke and refined petroleum (0.27), and creative, arts and entertainment activities (0.29). Whilst the solution to achieving a high growth economy is not as simple as investing in the high value added sectors, these ratios should be borne in mind when making sector policy decisions with the objective of economic growth.
The greatest industry change over the 18 year period to 2016 has been the decline in the contribution of manufacturing to the economy.
In 2016 manufacturing GVA in real terms was 6% below its 2011 peak, and only 2% above its 1998 value. However, Scotland's 2% real terms increase in manufacturing GVA since 1998 ranks higher than many other regions of the UK. London and every region along England's east coast (South East, North East, East of England, Yorkshire & the Humber) experienced a decline in real manufacturing output since 1998.
Compensation of employees was the largest component of income-based GVA.
Compensation of employees (CoE) was the largest component of income-based GVA and represented the total remuneration payable to employees in cash or in kind, including the value of social contributions payable by the employer. In 2016, this represented 57% of Scottish GVA at £76,320 million.
Recent GVA trends prompt questions about the sectors policy invests in and regional impact of policy.
Scotland's Economic Strategy is important in the context of GVA, especially given the objectives around regional inequalities, rebalancing the economy, business investment around the targeted growth sectors, and place and regional cohesion. The analysis in this paper shows there has been minor changes in terms of rebalancing the regional economy and achieving regional cohesion. The proportionate share of GVA had held constant in most local authorities over the 18 year period, apart from Edinburgh which increased its share of the Scottish GVA total by 2 percentage points. Whilst Renfrewshire (-1.1 pp), North Ayrshire (-0.6 pp), South Lanarkshire (-0.4 pp), and West Lothian (-0.4 pp) all saw there share of Scottish GVA decline.
The figures explored in this paper, in terms of the National Performance Framework and GDP growth targets, suggest that the ability of policy to influence GVA growth is more challenging than acknowledged in successive economic strategies. In reality it is difficult to isolate how successive strategies may have influenced economic performance. It can take several years for policies to take full effect and numerous external factors are also at play which impact Scotland's economy.
Some of the most recent GVA trends prompt questions about the sectors policy invests in and regional impact of policy. Scotland's GVA performance over recent years has been credible, yet relatively sluggish. Although it is worth recognising lacklustre growth rates are not a Scotland only phenomenon, and there has been much recent economic debate about whether slow growth is the new normal.
Introduction
Gross Value Added (GVA) is a key indicator of the state of the whole economy, an important performance metric, and helps inform economic, regional, and sector policy decisions. GVA gives a picture of the state of economic activity from the producers’ side or supply side perspective.
This briefing paper firstly provides a plain English overview of GVA covering the importance of GVA, methodology, approaches, issues and sources.
Building on this introduction to GVA, the briefing paper then looks at how GVA relates to Scotland's policy landscape, particularly Scotland's Economic Strategy. It then provides a snapshot of Scotland's current GVA of £134 billion, and an overview of GVA trends in Scotland since 1998. The briefing then moves on to explore the GVA contribution of Scotland's sectors and structural changes in the economy over the last two decades. Following this it provides insights on the geographical spread and regional balance of GVA in Scotland. Finally, it analyses the income components of GVA.
It should be noted that the analysis in this paper is based on ONS Regional GVA estimates, not Scottish Government GVA estimates. The differences in these estimates are explained in Annex A of this paper, in particular growth rates are different between the methodologies.
What is Gross Value Added (GVA)?
GVA measures the contribution to the economy of each individual producer, industry or sector in Scotland and is used in the estimation of GDP. GVA therefore is the difference between output and intermediate consumption for any given sector/industry. That is the difference between the value of goods and services produced and the cost of raw materials and other inputs, which are used up in production.
GVA is also known as GDP at basic prices, and is a measure of the total value added by all industries in the economy, but does not include the value of taxes or subsidies on products (such as VAT and excise duties), which are paid by the consumer. Whereas total GDP at market prices includes these taxes and subsidies on products (GDP = GVA + taxes - subsidies).
Essentially, GVA captures what accrues to the producer, before a product is sold. While GVA gives a picture of the state of economic activity from the producers’ side or supply side, GDP gives the picture from the consumers’ side or demand perspective. Both measures need not match because of the difference in treatment of net taxes.
It is worth highlighting that in real terms there is rarely any significant difference between growth rates of GVA and GDP. This allows real change in GVA (using the production approach) to be used to estimate real change in GDP by proxy (e.g. ONS flash estimate of GDP growth, and Scottish Government estimates of GDP growth).
Understanding GVA
A simple way to explain GVA is to think of it in the context of the manufacturing process. During a manufacturing process goods, energy, and services are changed or consumed. The associated costs are termed 'intermediate consumption'. At the end of the process the business has a product(s) (or "Output") for sale or for its own use.
For example, if Output comprises a wooden chair then:
Intermediate Consumption includes the cost of wood, glue, screws, and other materials used in its manufacture, plus the cost of rental, utilities, transport, legal and business services, insurance, marketing, and other consumables.
Selling the product (Output) generates revenue from which costs associated with the production of the product (Intermediate Consumption) can be met.
The balance of Output less Intermediate Consumption is the firm’s GVA.
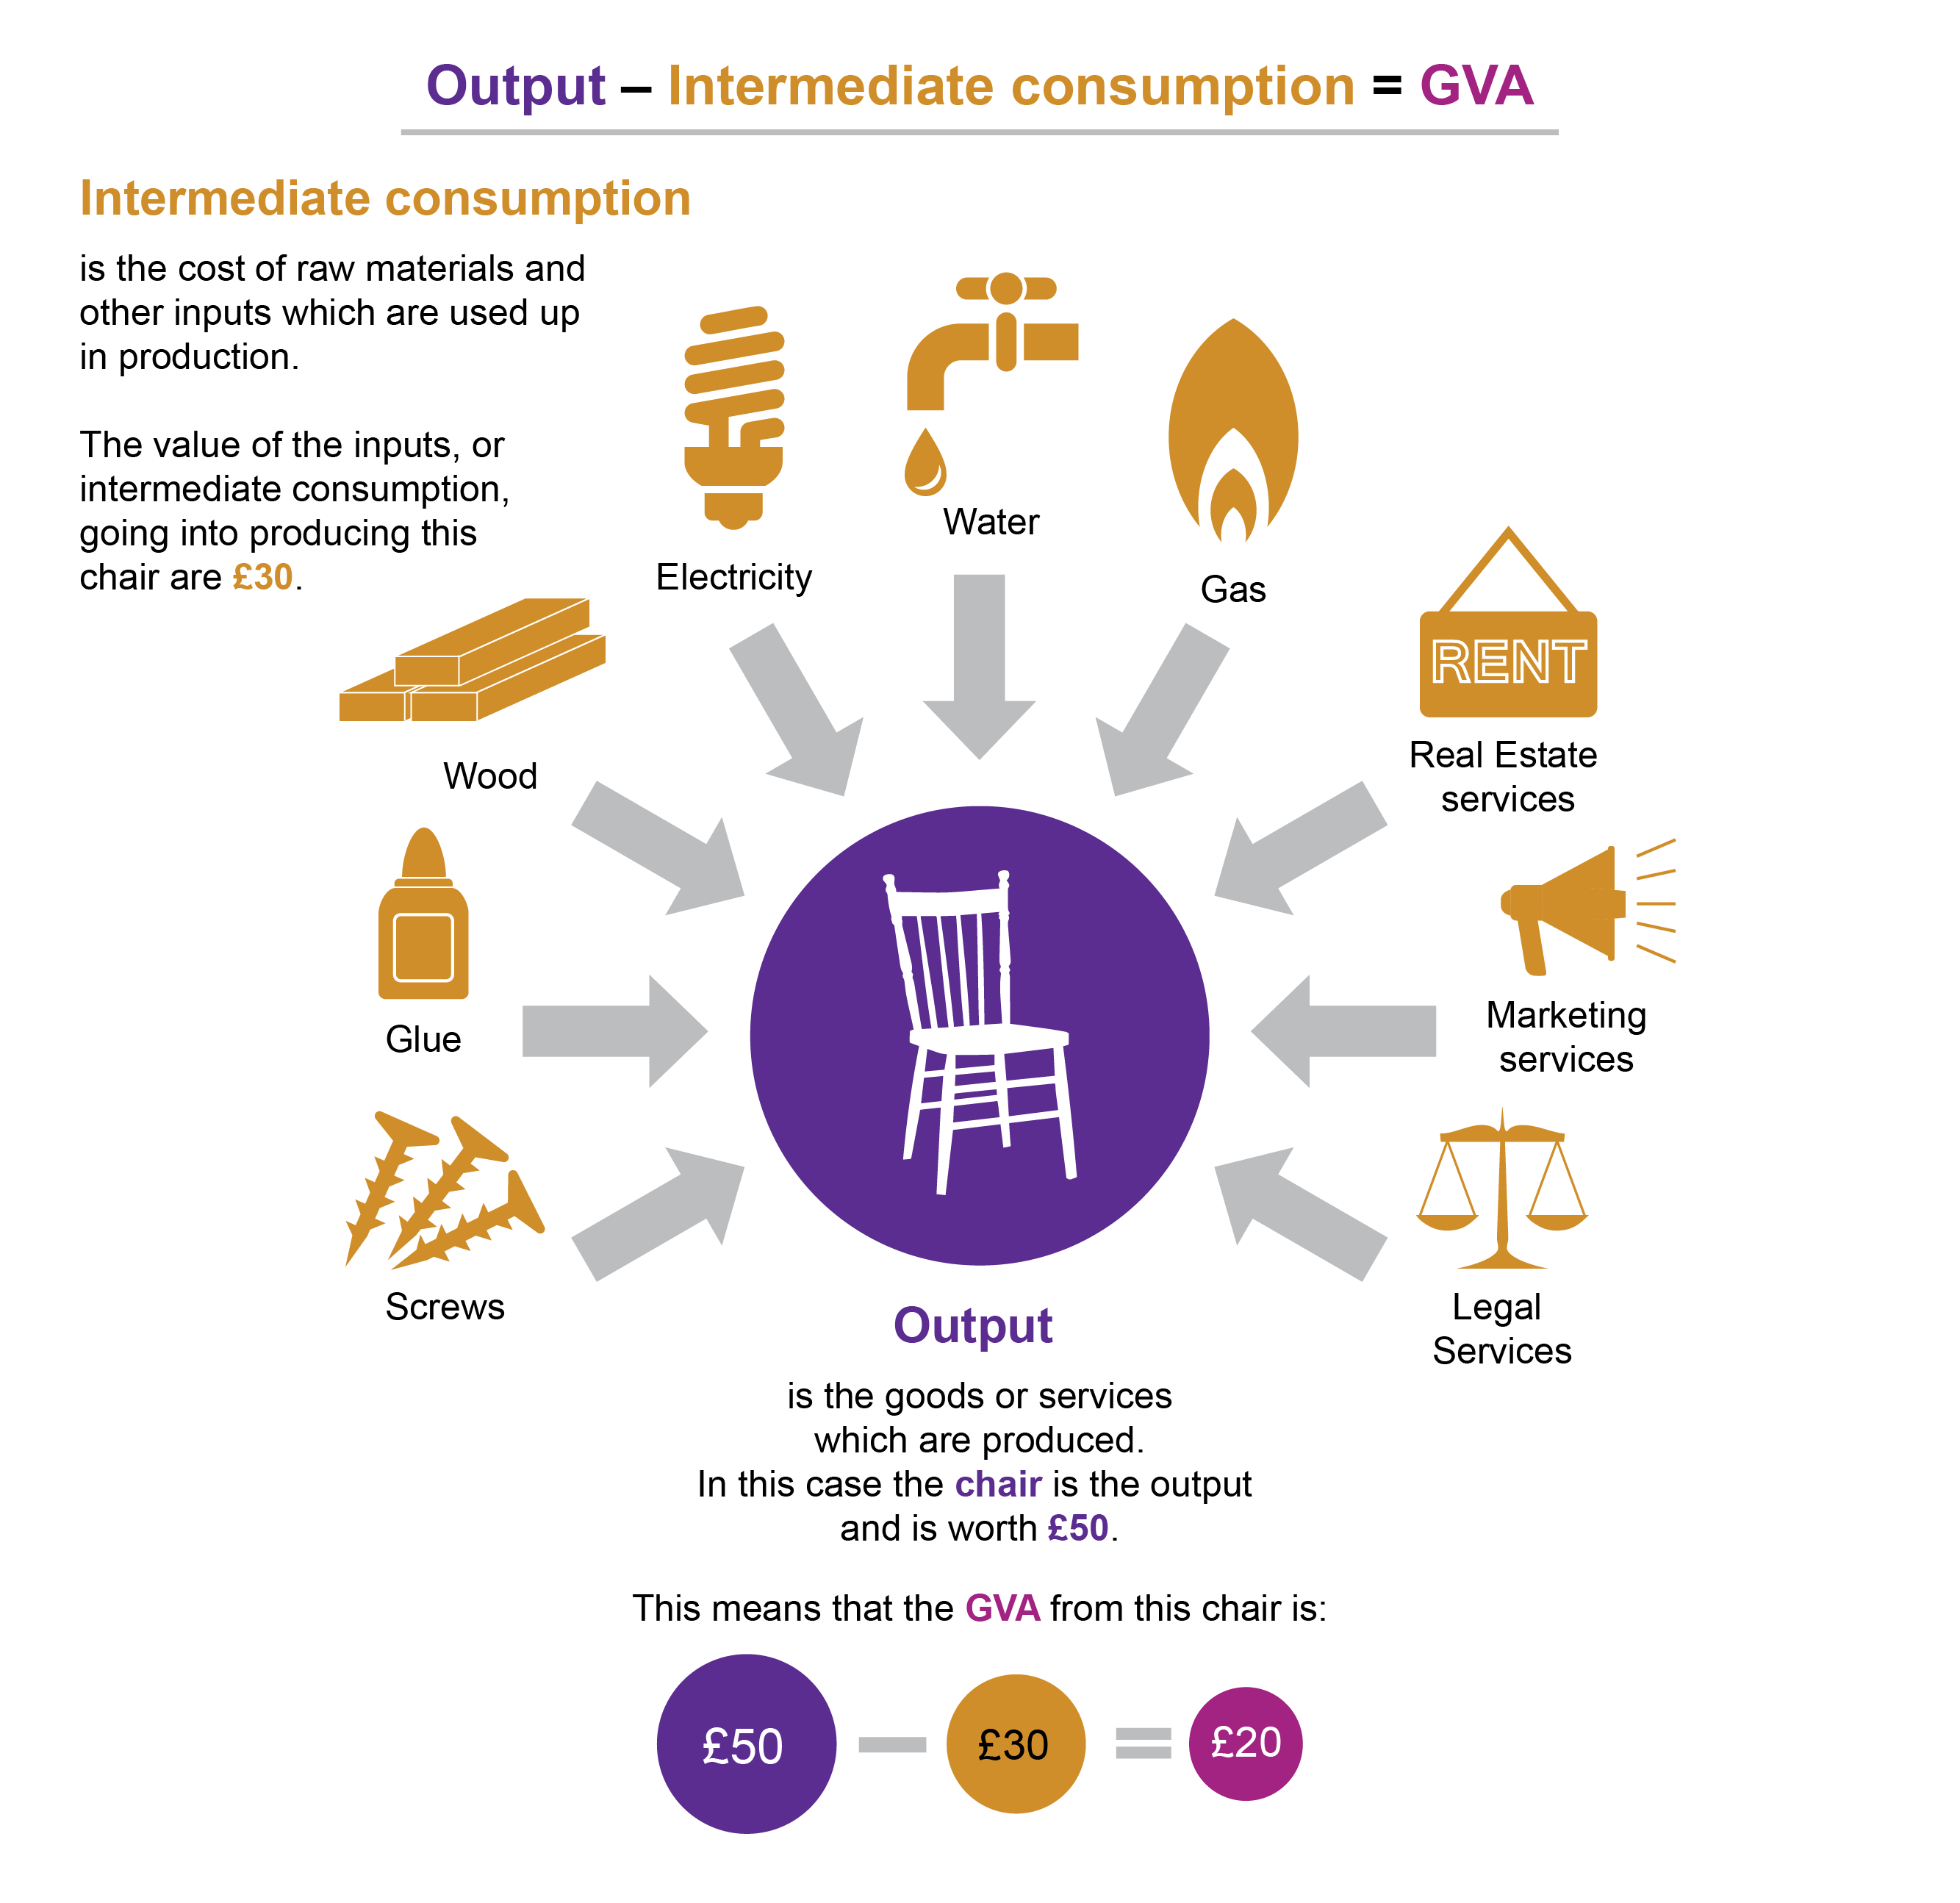
Out of GVA, the firm will likely pay wages, salaries, national insurance contributions, and other costs associated with employment such as redundancy (collectively these employee related costs are known as Compensation of Employment (CoE)). Firms also pay taxes on production, such as business rates, motor vehicle duties and regulatory fees. Subtracting Intermediate Consumption, Taxes (less Subsidies) and CoE from Output leaves a residual that can broadly be described as profit/loss (technically known as Gross Operating Surplus (GoS)). More details on Scotland's CoE and GoS are discussed in a later section of this report.
Adapted from ONS (2010) 1. This is a simplified explanation of GVA using the production approach and does not reflect some of the conceptual complexities involved in its measurement (e.g. treatment of inventories of materials and unsold finished goods, product taxes, or own-account production).
Why is GVA important?
GVA represents the amount that individual businesses, industries or sectors contribute to the economy. Generally, this is estimated by looking at the income received by the business, industry or sector minus any intermediate consumption used to produce its output.
The sector and regional breakdown provided by the GVA measure helps policymakers decide which sectors and geographies need incentives or stimulus, and accordingly formulate specific policies. Whereas GDP is a key measure when it comes to making cross-country analysis and comparing the incomes of different economies.
GVA is useful in that it can add important quantitative economic detail to inform the assessment of a policy intervention’s actual or potential economic value. Net GVA, for example, indicates the scale of wealth generated by an intervention above that which would have been generated by beneficiaries anyway.
GVA information can be used to:
explore the contribution of Scotland's sectors and industry to the economy
analyse the regional spread of economic output at different geography levels
produce productivity statistics, in conjunction with other datasets
highlight the absolute impact of a policy intervention (at both gross & net levels)
calculate the 'impact investment ratio' - an indicator of the relative effectiveness of an intervention
help assess the ‘quality’ of jobs generated (either through comparisons of the wage component of GVA or through comparisons of GVA per employee).
Measuring GVA
At a micro-level GVA is the contribution of each individual producer, industry or sector to the economy. At an aggregate macro-level it provides a summary measure of the complex interactions of the economy1. GVA for the UK is estimated and published by ONS and estimates feed into the calculation of GDP
GVA can be measured in a number of ways.
Micro firm level
GVA = Turnover (or sales) less the cost of bought in goods & services (excl. employee costs)
GVA = Operating Profit (before tax) + Employee Costs + Depreciation + Amortisation
Macro economy level
Scottish Government and ONS produce balanced estimates of Scottish and UK GVA at current basic prices on an internationally consistent basis using all approaches in the National Accounts Supply and Use Tables (SUTs ).
Income approach
Production approach
Data from many surveys and certain administrative sources feed into those estimates.
Issues with GVA
Recently GDP and GVA have come under some close scrutiny as measures of economic growth. GDP or GVA are useful but increasingly viewed as fundamentally flawed statistics. For example, a recent ONS blog1 highlighted the inadequacies of GDP for failing to capture unpaid work and the impact of economic growth on the environment.
Some examples of the deficiencies of GDP and GVA as measures of economic development are detailed below.
GDP and GVA measure market-based economic activity within a defined production boundary, where the primary purpose is to measure an economy's production, income and expenditure. This means ‘home production’ activities such as caring for your own children or volunteering to help a charity are not includedi.
There is no adjustment for leisure time in measurement.
GVA and GDP count 'bads' as well as 'goods'. For example, when an earthquake hits and infrastructure requires rebuilding, GDP and GVA increase.
There is no adjustment for equality of distribution, or for pollution costs and other negative externalities.
In 2009 a report commissioned by former French President Nicolas Sarkozy, and chaired by Joseph Stiglitz, called for an end to “GDP fetishism” in favour of a “dashboard” of measures to capture human welfare2.
The Independent Review of UK Economic Statistics by Professor Sir Charles Bean showed how the economy was becoming more challenging to measure. The growth in services, globalisation and technological change are all phenomena that the ONS are grappling with, as reflected in a recent ONS blog1 . In this digital age standard GDP and GVA statistics miss many of technology's benefits, so governments and statistical institutions need to rethink how the typical person's well-being is measured.
These limitations in economic data measurement were also reflected in the Scottish Parliament's recent Economy, Jobs and Fair Work Committee inquiry into the economic data. At a UK level 1, the ONS is working to overcome these challenges and build a suite of measures that capture the important issues that GDP and GVA cannot include. They stated:
At the Office for National Statistics, and across the Government Statistical Service, we are aiming to do just that through our ‘beyond GDP’ initiative, this includes: natural capital, human capital, distributional analysis of income and wealth, measuring the production value of non-market activities, and increased analysis of personal well-being.
Data sources and glossary
The primary data source used in this briefing paper is the ONS's balanced measure of regional gross value added (GVA(B)). This and other sources of Scottish GVA are discussed in Annex A of this paper. Annex A also contains technical notes related to data interpretation.
Below is a glossary of technical terms used in this briefing paper.
Glossary
Current prices: sometimes called nominal prices measure value of a product at the time it was produced. There is no adjustment for inflation. Thus, changes in current prices reflect at least in part the effect of inflation.
Extra-Regio: this term is applied to economic activity that cannot be assigned to any specific region within the UK. It captures the off-shore and overseas GVA.
GDP: Gross domestic product (GDP) is a monetary measure of the market value of all final goods and services produced in a period of time. The OECD defines GDP as "an aggregate measure of production equal to the sum of the GVA of all resident and institutional units engaged in production (plus any taxes, and minus any subsidies, on products not included in the value of their outputs).
GVA: Gross Value Added (GVA) is a key indicator of the state of the whole economy and measures. It is the difference between the value of goods and services produced and the cost of raw materials and other inputs, which are used up in production. It is used in the estimation of GDP.
Imputed rental: this represents the economic value per period to home owners of their dwellings, equivalent to if they were to rent out their properties. By definition, however, a homeowner does not receive payment on their property, and so the payment must be "imputed".
Intermediate consumption: is a national accounts concept which measures the value of the goods and services consumed as inputs by a process of production. It excludes fixed assets whose consumption is recorded as consumption of fixed capital.
Production boundary: in national accounts this is essential for defining the coverage of the accounting system.Production is an activity carried out under the control and responsibility of an institutional unit that uses inputs of labour, capital and goods and services to produce goods and services. Production does not cover purely natural processes without any human involvement or direction, like the unmanaged growth of fish stocks in international waters (but fish farming is production).
Real terms: prices have been adjusted for inflation, enabling comparison of quantities as if prices had not changed. Changes in real terms therefore exclude the effect of inflation.
Negative externalities: Negative externalities occur when production and/or consumption impose external costs on third parties outside of the market for which no appropriate compensation is paid. This causes social costs to exceed private costs. Examples include pollution or cigareet smoking.
NUTS: The Classification of Territorial Units for Statistics (NUTS; French: Nomenclature des unités territoriales statistiques) is a geocode standard for referencing the subdivisions of countries for statistical purposes across the European Union.
UK SIC codes: The UK standard industrial classification of economic activities (UK SIC 07) provides a framework for the collection, tabulation, presentation and analysis of data that allow industry classifications to be drilled into at different levels - from broad sectors to the more detailed digit SIC codes. In addition, it can be used for administrative purposes and by non-government bodies as a convenient way of classifying industrial activities into a common structure.
GVA and the policy landscape
In this section, the GVA facts and figures presented throughout the remainder of this briefing are aligned with the policy landscape context. Most relevant to GVA is Scotland's Economic Strategy1 and interlinked to this is the National Performance Framework2. Also of relevance is regional economic development policy, such as City Region Deals and the role of Scottish Government agencies (many of which measure impact via GVA).
Scotland's Economic Strategy
Relevant themes
There are many aspects of Scotland's Economic Strategy1 relevant to the GVA trends explored throughout this paper. Here we highlight some of the most relevant aspects in light of the previous chapters around regional GVA and the sector contributions of GVA.
The Strategy targets regional inequalities with the objective of ensuring that all regions and communities can prosper, noting it "is important for both overall economic performance and ensuring that all areas have the opportunity to fulfil their potential". It recognises that significant variations exist in levels of GVA levels across Scotland. It states that these variations reflect:
...part, the nature of growth in cities, which benefit from a concentration of economic activity, also drawing in workers from surrounding areas. In addition, some areas of Scotland still suffer the legacy of past industrial decline – for example, the management of the decline in industry and manufacturing in the 1980s by the UK Government which has contributed to concentrations of deprivation in some parts of Scotland.
It states that progress is needed to have smaller regional differences in GDP per person.
The Strategy aims to rebalance the economy and move Scotland onto a more balanced growth path, with a greater contribution to economic growth from investment and net trade, rather than consumption. It states that key challenges for Scotland in this regard are the need to continue to grow and to diversify the business base, reindustrialise, strengthen the role of export-generating sectors and focus on encouraging firms to invest and to export. It notes that rebalancing the economy will require a stronger role for exporting sectors and a strengthened role for manufacturing. It notes that
increasing the scale of the manufacturing sector can help with wider equality objectives in terms of addressing regional imbalances through local spillovers, while providing jobs that are typically high skilled and well paid.
Business investment is a key theme where it states that "the success of Scotland’s economy depends upon the growth and competitiveness of Scotland’s businesses". The Strategy notes that interventions will be targeted at sectors and companies where there is a distinct comparative advantage. These are identified as Food and Drink, Financial and Business Services, Life Sciences, Energy, Tourism and Creative Industries.
Place and regional cohesion are a key objective of the Strategy where regional growth considers the dynamic of Scotland’s cities, wider regions, and rural areas, to encourage success and opportunity shared across the whole of Scotland. It states that the size and scale of Scotland’s cities drives the agglomeration of business and creates a dynamic environment for knowledge sharing and innovation. Alongside this it is important to recognise the diverse nature of the rural economy, with areas subject to a number of challenges relating to their geography.
Previous economic strategies
Here it is worth highlighting past economic strategies, the predecessors of the current 2015 Strategy that builds on both the 20111 and 20072 Government Economic Strategies. Both these had regional equity as a priority to "achieve more balanced growth across all of Scotland to give all across Scotland the chance to succeed".
In total since devolution, there have been eight strategies, plans and frameworks to develop Scotland’s economy. The first economic strategy for Scotland since devolution was the Scottish Executive's A Smart, Successful Scotland (2001) which drew on the Framework for Economic Development in Scotland (2000). The aforementioned strategy and framework were refreshed three years later. These were followed by the Scottish Government's Government Economic Strategy in both 2007 and 2011, as already referenced.
The coverage of Scotland’s economic strategies has widened with each iteration. The first strategy, following devolution, started out as direction for the enterprise networks. Successive strategies gradually tackled wider social challenges and offered direction for the wider public sector eventually arriving at the “One Scotland Approach” in the current Scotland’s Economic Strategy. More information on Scotland's economic strategies is available in SPICe's 2015 briefing paper3 on Scotland's Economic Strategy.
Working with others
The current 2015 Strategy 1sets out that the Scottish Government, its agencies and partners in Scotland, will work together to implement this strategy. It states that the Scottish Government’s agencies play an integral part in the delivery of the Strategy under existing devolved powers. For example:
Scottish Enterprise and Highlands and Islands Enterprise (HIE) work to support business and economic development across Scotland
VisitScotland helps attract visitors to Scotland and provides advice and support to Scotland’s tourism industry
The Scottish Funding Council is responsible for funding teaching and learning provision, research and other activities in Scotland’s colleges, universities and higher education institutions
Skills Development Scotland is responsible for supporting Scotland’s people and businesses to develop and apply their skills.
The Strategy notes that each of the Scottish Government's partners’ activities will be aligned with the priorities laid out in the Economic Strategy. Many of the Scottish Government's agencies and partners in Scotland use GVA as a performance measure, as demonstrated in some below examples. Thus, for Parliament understanding GVA and its components is important for scrutiny of public agencies.
Scottish Enterprise commissioned a strategic evaluation of SDI international activities. It found trade support (2012/13 and 2015/16) generated between £465m and £730m of additional GVA and for inward investment support (2011/12 to 2015/16) the GVA impact was estimated to be £1,600m increasing to £2,700m if attributable jobs were assumed to last for a further two years.
HIE commissioned an evaluation of their Entrepreneurship Support Programme (ESP) 2013-16. The results imply a total (direct, indirect and induced) impact per participant company of 5 direct FTE jobs and £524,000 direct GVA, including future forecast benefits.
VisitScotland prioritise GVA in measurement, as highlighted in their Economic Measurement Framework.
GVA performance
The National Performance Framework1 is linked to Scotland's Economic Strategy and contains targets and indicators, which measure and report progress towards improving Scotland’s performance. Two of the high level purpose targets from the framework are linked to GVA (remembering that GVA is equivalent to GDP less taxes on production (net of subsidies) as outlined in the first chapter of this paper). The two relevant targets are:
To raise the GDP growth rate to the UK level
To match the GDP growth rate of the small independent EU countries by 2017
The figures explored in this paper, in terms of the UK target, suggest that the ability of policy to influence GVA growth is more challenging than acknowledged in successive economic strategies. In reality it is difficult to isolate how successive strategies may have influenced economic performance. It can take several years for policies to take full effect and numerous external factors are also at play which impact Scotland’s economy.
A recent Fraser of Allander blog2 suggests that far from narrowing in Scotland and the wider UK measures of regional inequality in terms of economic output are widening. It states that:
There has been much debate about inclusive growth and regional re-balancing both from the Scottish Government (through its inclusive growth strategy) and the UK Government (through its industrial strategy)....Policymakers often significantly over-estimate their potential to influence growth rates and it is unrealistic to expect that either the UK or Scottish Governments can implement a quick-fix policy that would eliminate regional disparities.
The data explored throughout this paper shows there has been minor changes in terms of rebalancing the regional economy and achieving regional cohesion. Table 3 showed that the proportionate share of GVA had held constant in most local authorities over the 18 year period, apart from Edinburgh which increased its share of the Scottish GVA total by 2 percentage points. Whilst Renfrewshire (-1.1 pp), North Ayrshire (-0.6 pp), South Lanarkshire (-0.4 pp), and West Lothian (-0.4 pp) all saw there share of Scottish GVA decline.
Some of the most recent GVA trends prompt questions about the sectors policy invests in and regional impact of policy. Scotland's GVA performance over recent years has been credible yet relatively sluggish. Although it is worth recognising lacklustre growth rates are not a Scotland only phenomenon, and there has been much recent economic debate about whether slow growth is the new normal.
Other policy
Other policies of note in the context of GVA and Scotland's Economic Strategy include:
City and regional policy - the main delivery mechanisms are City Region Deals and implementing the measures set out in Scotland's Agenda for Cities to support economic growth
the Enterprise and Skills Review, which is about improving support for students, workers and businesses. The Review is now in its implementation phase, and the Enterprise and Skills Strategic Board has been established to align and co-ordinate the activities of Scotland's enterprise and skills agencies. A Strategic Plan will be developed during 2018.
Scotland - big picture GVA
Current GVA snapshot
In 2016, Scotland's GVA totalled £134 billion, which was 8% of the UK total. In current basic prices, the Scottish GVA total represented annual growth of 3%. However, in real terms with the effect of inflation removed annual growth was 1.2%. GVA per head (based on the total resident population) was £24,800, an increase of 2.4% on the previous year.
| Countries and regions | Total GVA (£ million)1 | Y-o-Y growth in total GVA (%)1 | Y-o-Y growth in ‘real’ GVA (%)2 | GVA per head (£)3,4 | Y-o-Y growth in GVA per head (%)4 |
|---|---|---|---|---|---|
| Scotland | 134,038 | 3.0 | 1.2 | 24,800 | 2.4 |
| UK | 1,747,647 | 3.7 | 1.6 | 26,339 | 2.8 |
| England | 1,498,221 | 3.7 | 1.6 | 27,108 | 2.8 |
| Wales | 59,585 | 4.0 | 1.9 | 19,140 | 3.5 |
| Northern Ireland | 37,237 | 3.4 | 1.1 | 19,997 | 2.8 |
| North East | 50,675 | 1.2 | -1.0 | 19,218 | 0.7 |
| North West | 166,542 | 3.5 | 1.3 | 23,068 | 2.9 |
| Yorkshire and The Humber | 112,194 | 2.1 | 0 | 20,678 | 1.4 |
| East Midlands | 100,087 | 3.1 | 0.8 | 21,185 | 2.1 |
| West Midlands | 126,589 | 3.9 | 1.8 | 21,823 | 3 |
| East of England | 147,382 | 3.9 | 1.6 | 24,041 | 3 |
| London | 408,479 | 5.1 | 3.0 | 46,482 | 3.7 |
| South East | 258,902 | 2.8 | 0.8 | 28,683 | 1.9 |
| South West | 127,372 | 4.1 | 2.0 | 23,091 | 3.3 |
| Extra-Regio5 | 18,565 | 9.1 | 1.1 | n/a | n/a |
Notes: 1) GVA in current prices 2) GVA in chained volume measures 3) Figures may not sum due to rounding in totals; per head (£) figures are rounded to the nearest pound sterling 4)Per head figures exclude Extra-Regio: the off-shore contribution to GVA that cannot be assigned to any region 5) The term Extra-Regio is applied to economic activity that cannot be assigned to any specific region within the UK. Source: Office for National Statistics. (2017, December 20). Regional gross value added (balanced), UK: 1998 to 2016. Retrieved from https://www.ons.gov.uk/economy/grossvalueaddedgva/bulletins/regionalgrossvalueaddedbalanceduk/1998to2016 [accessed 2018 January 8]
The data in Table 1 indicates that almost a quarter (23%) of the UK's GVA was generated in London in 2016, whilst London and the South East accounted for 38% of UK GVA. In the year to 2016, Scotland's real GVA growth was 0.4 percentage points below the UK growth rate of 1.6%. London and the South West recorded the highest rates of real growth over the year.
The territorial definition of the Scottish economy used in the analysis here of ONS data, excludes any share of UK extra-regio activity. The Quarterly National Accounts Scotland (QNAS) produced by the Scottish Government include alternative estimates of GDP for Scotland including illustrative shares of UK extra-regio (offshore and overseas) activities attributable to Scotland.
Scotland's annual GVA per head growth rate was also 0.4 percentage points below the UK growth rate of 2.8%. Figure 1 illustrates the extent to which London and the South East skew average UK GVA ratios. On one end of the spectrum GVA per head in London was 76% above the UK average, whilst Wales on the other end was 27% below the UK average. Relative to UK GVA per head, Scotland was the best performing region outside of London and the South East. However, Figure 14 in a later section of this report shows that significant regional variations were contained in the average Scottish GVA per head figure when drilled-down.
Source: Office for National Statistics. (2017, December 20). Regional gross value added (balanced), UK: 1998 to 2016. Retrieved from https://www.ons.gov.uk/economy/grossvalueaddedgva/bulletins/regionalgrossvalueaddedbalanceduk/1998to2016 [accessed 2018 January 8]
GVA trends overtime
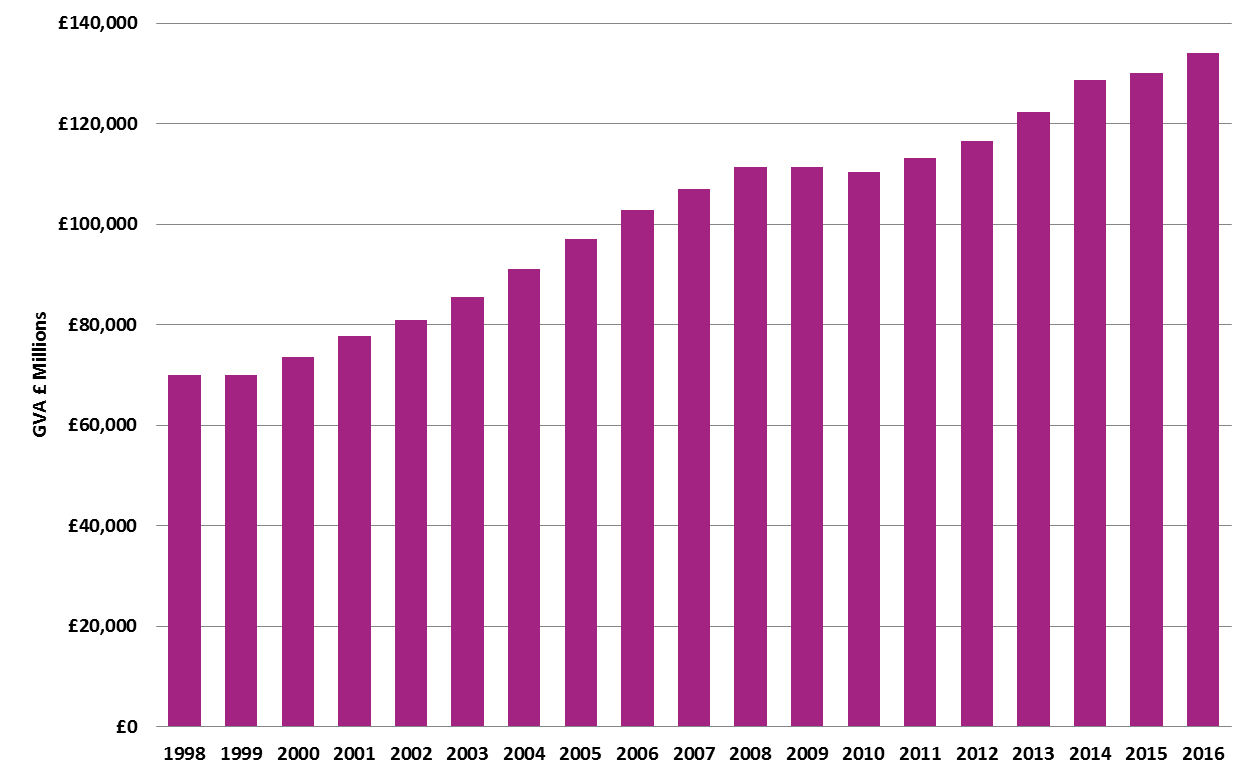
Over the 18 year period to 2016, Scottish GVA in current prices has generally displayed a positive upward trend (see Figure 2), with just a few periods of stagnation or decline. In the year to 1999, GVA growth was flat. This was followed by a 9 year period to 2008 of unprecedented growth, averaging 5% annually (current terms). The global financial crisis and downturn was evident in Scotland's GVA performance in both 2009 and 2010. Growth picked-up again in 2011, and to-date an upward trend has continued annually up to 2016. However, the rate of growth has not been at the same accelerated rate seen in the early 2000's. Apart from impressive GVA growth of over 5% in the year to 2014, generally Scotland's current GVA growth could be described as lacklustre.
Source:Office for National Statistics. (2017, December 20). Regional gross value added (balanced), UK: 1998 to 2016. Retrieved from https://www.ons.gov.uk/economy/grossvalueaddedgva/bulletins/regionalgrossvalueaddedbalanceduk/1998to2016 [accessed 2018 January 8]
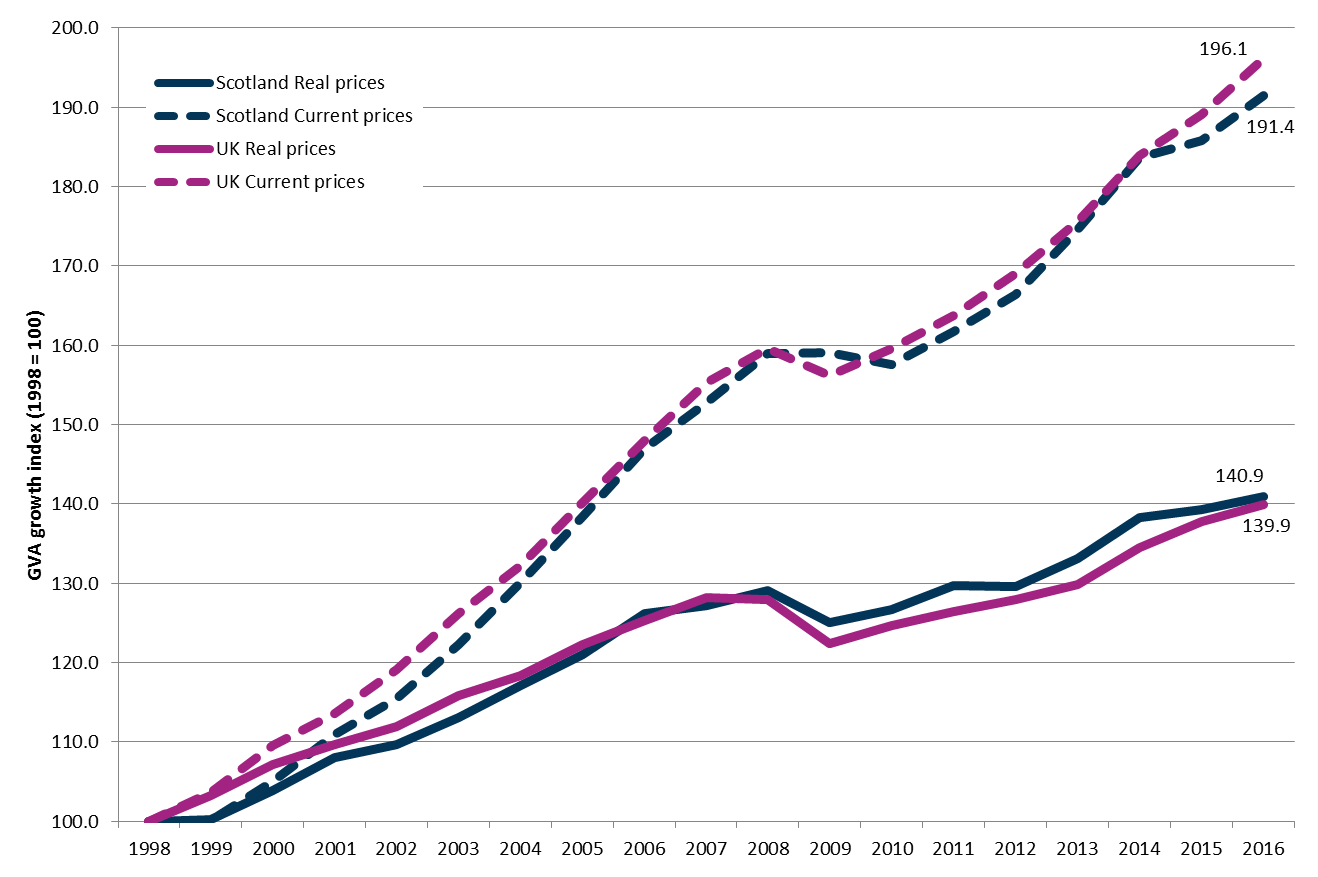
Figure 3 shows since 1998, in the almost two decades to 2016, in current prices Scotland's GVA grew by 91% (versus 96% at a UK level). However, in real terms with the effect of inflation removed, growth over this period was 41% (40% at a UK level). In real terms, growth in Scotland's GVA has been much more sluggish since 2014 than is obvious in current price terms.
Regular observers and commentators of economic data will notice that the real terms growth in Figure 3 looks quite different to the regularly used Scottish Government estimates (in these Scotland underperforms relative to the UK). This reflects different approaches to deflation or volume estimation, as discussed in more detail in the Annex of this paper. A recent Fraser of Allander blog2 also discussed these differences.
Source: Office for National Statistics. (2017, December 20). Regional gross value added (balanced), UK: 1998 to 2016. Retrieved from https://www.ons.gov.uk/economy/grossvalueaddedgva/bulletins/regionalgrossvalueaddedbalanceduk/1998to2016 [accessed 2018 January 8]
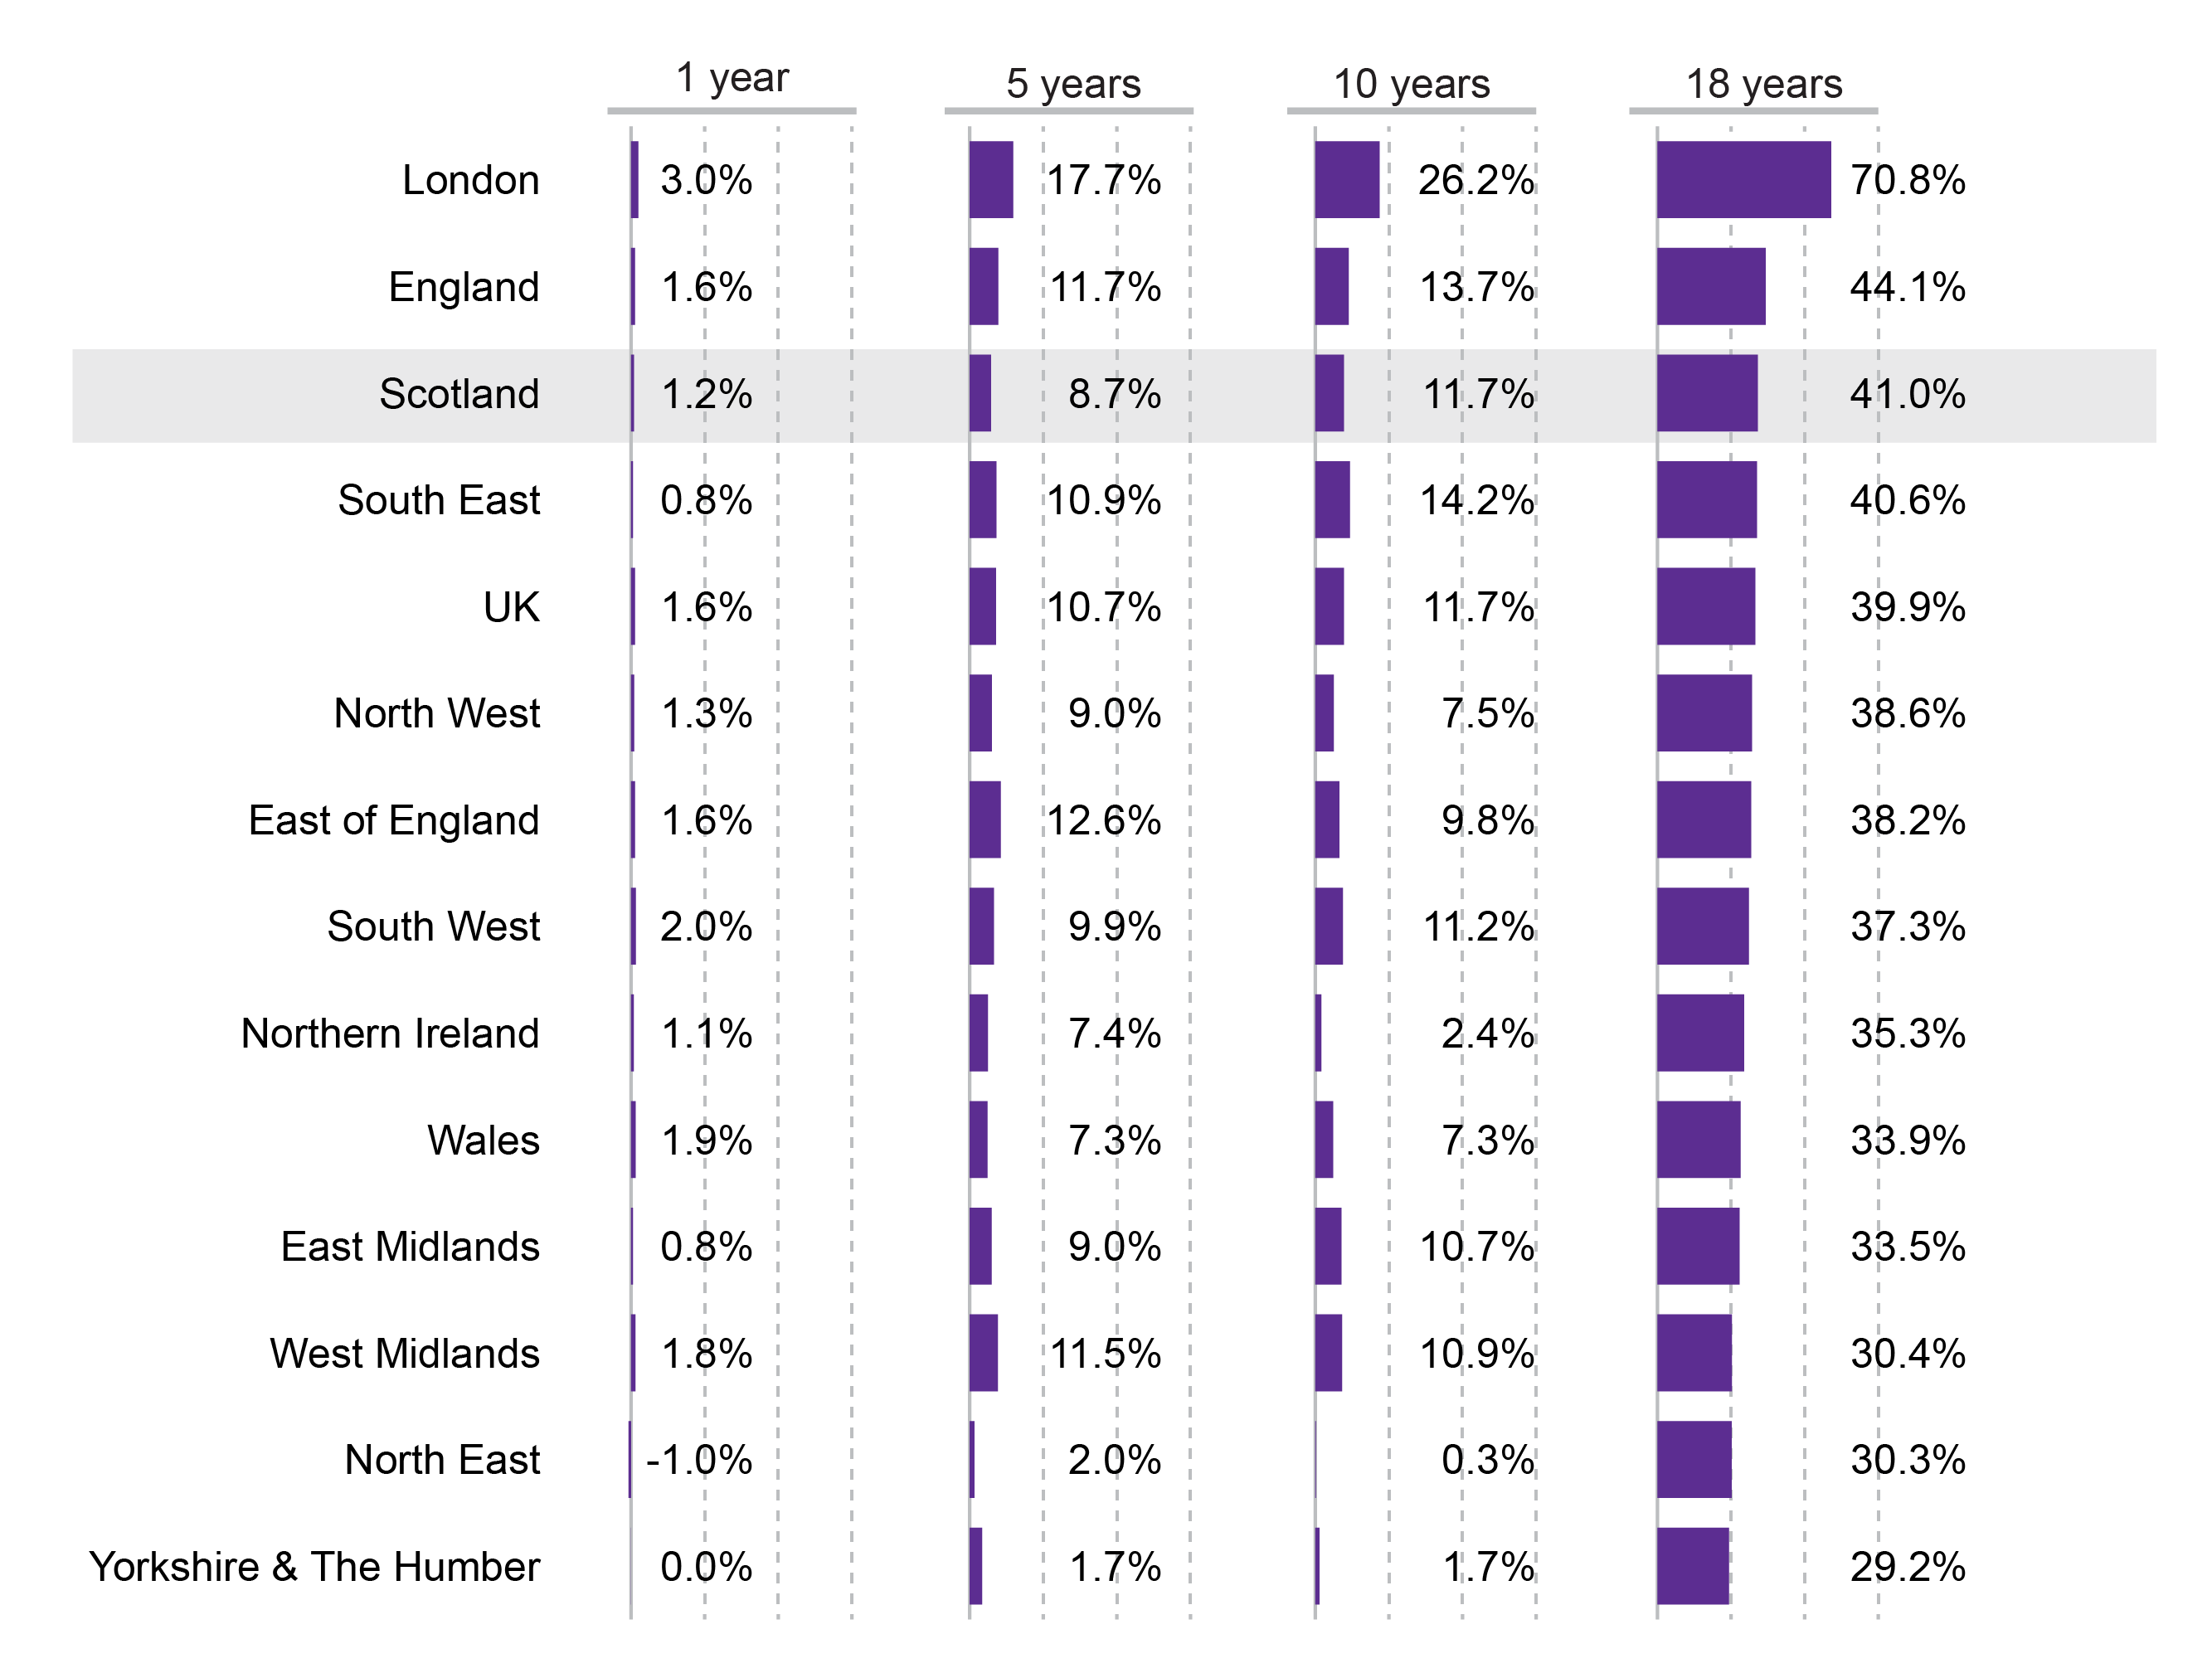
Figure 4 provides a comparison of GVA growth rates (1 year, 5 year, 10 year, 18 year) in real prices at national and regional geographies.
London ranks highest, in terms of GVA growth performance, across all time periods considered. Since 1998, real GVA in London grew by 71%, significantly above growth rates elsewhere in the UK.
North East England recorded some of the lowest GVA growth rates over the years analysed. In the year to 2016, the North East was the only part of the UK to see a real GVA decline.
Source: Office for National Statistics. (2017, December 20). Regional gross value added (balanced), UK: 1998 to 2016. Retrieved from https://www.ons.gov.uk/economy/grossvalueaddedgva/bulletins/regionalgrossvalueaddedbalanceduk/1998to2016 [accessed 2018 January 8]
In terms of GVA growth relative to elsewhere in the UK, Scotland performs relatively well when longer time periods are considered but ranks lower when looking at more recent years.
Over the 18 years to 2016, in real terms Scotland's GVA growth surpassed all regions of the UK apart from London. Scotland also ranks well when looking at the 10 year period to 2016, where real GVA growth was 12%, with only the regions of London and the South East having higher rates of growth. Scotland ranked above the UK average growth rate for both the 10 and 18 years time periods.
Scotland ranks below the UK average when 5 year (9% versus the UK rate of 11%) and 1 year (1% versus the UK rate of 2%) real GVA growth rates are explored.
Focus on industry GVA
Top level sector overview
Scotland's three largest sectors in terms of GVA contribution were: real estate activities (11.6% of total Scottish GVA), manufacturing (10.7%), and wholesale and retail trade; repair of motor vehicles (10.7%) - see Table 2. Here it needs to be highlighted that the majority of real estate activities are imputed rental of owner occupiers (see the imputed rent discussion box at the end of this section for more detail).
In the year to 2016, GVA decreased in real terms in a number of sectors. These were: mining and quarrying (-19%), arts, entertainment and recreation (-4%), education (-3%), electricity and gas (-1%), transport and storage (-0.6%), and administrative and support activities (-0.3%).
The sectors with the highest real terms growth in 2016 were: wholesale and retail trade (5%), information and communication (4%), and accommodation and food (4%). Also other service activities and activities of households recorded significantly high annual rates of growth. However, as these are proportionately smaller industries it should be noted that they have minimal impact on total GVA.
Table 2 shows information on the broad sector GVA make up of the economy in both 2016 and 1998. The greatest change over this 18 year period has been the decline in the contribution of manufacturing to the economy. In 1998 manufacturing represented 17% of Scotland's GVA, this had decreased to 11% in 2016, as demonstrated in Figure 5. This decline had been counterbalanced by moderate growth in the GVA contribution of a number of sectors, namely human health and social work activities, professional, scientific and technical activities, and financial and insurance activities.
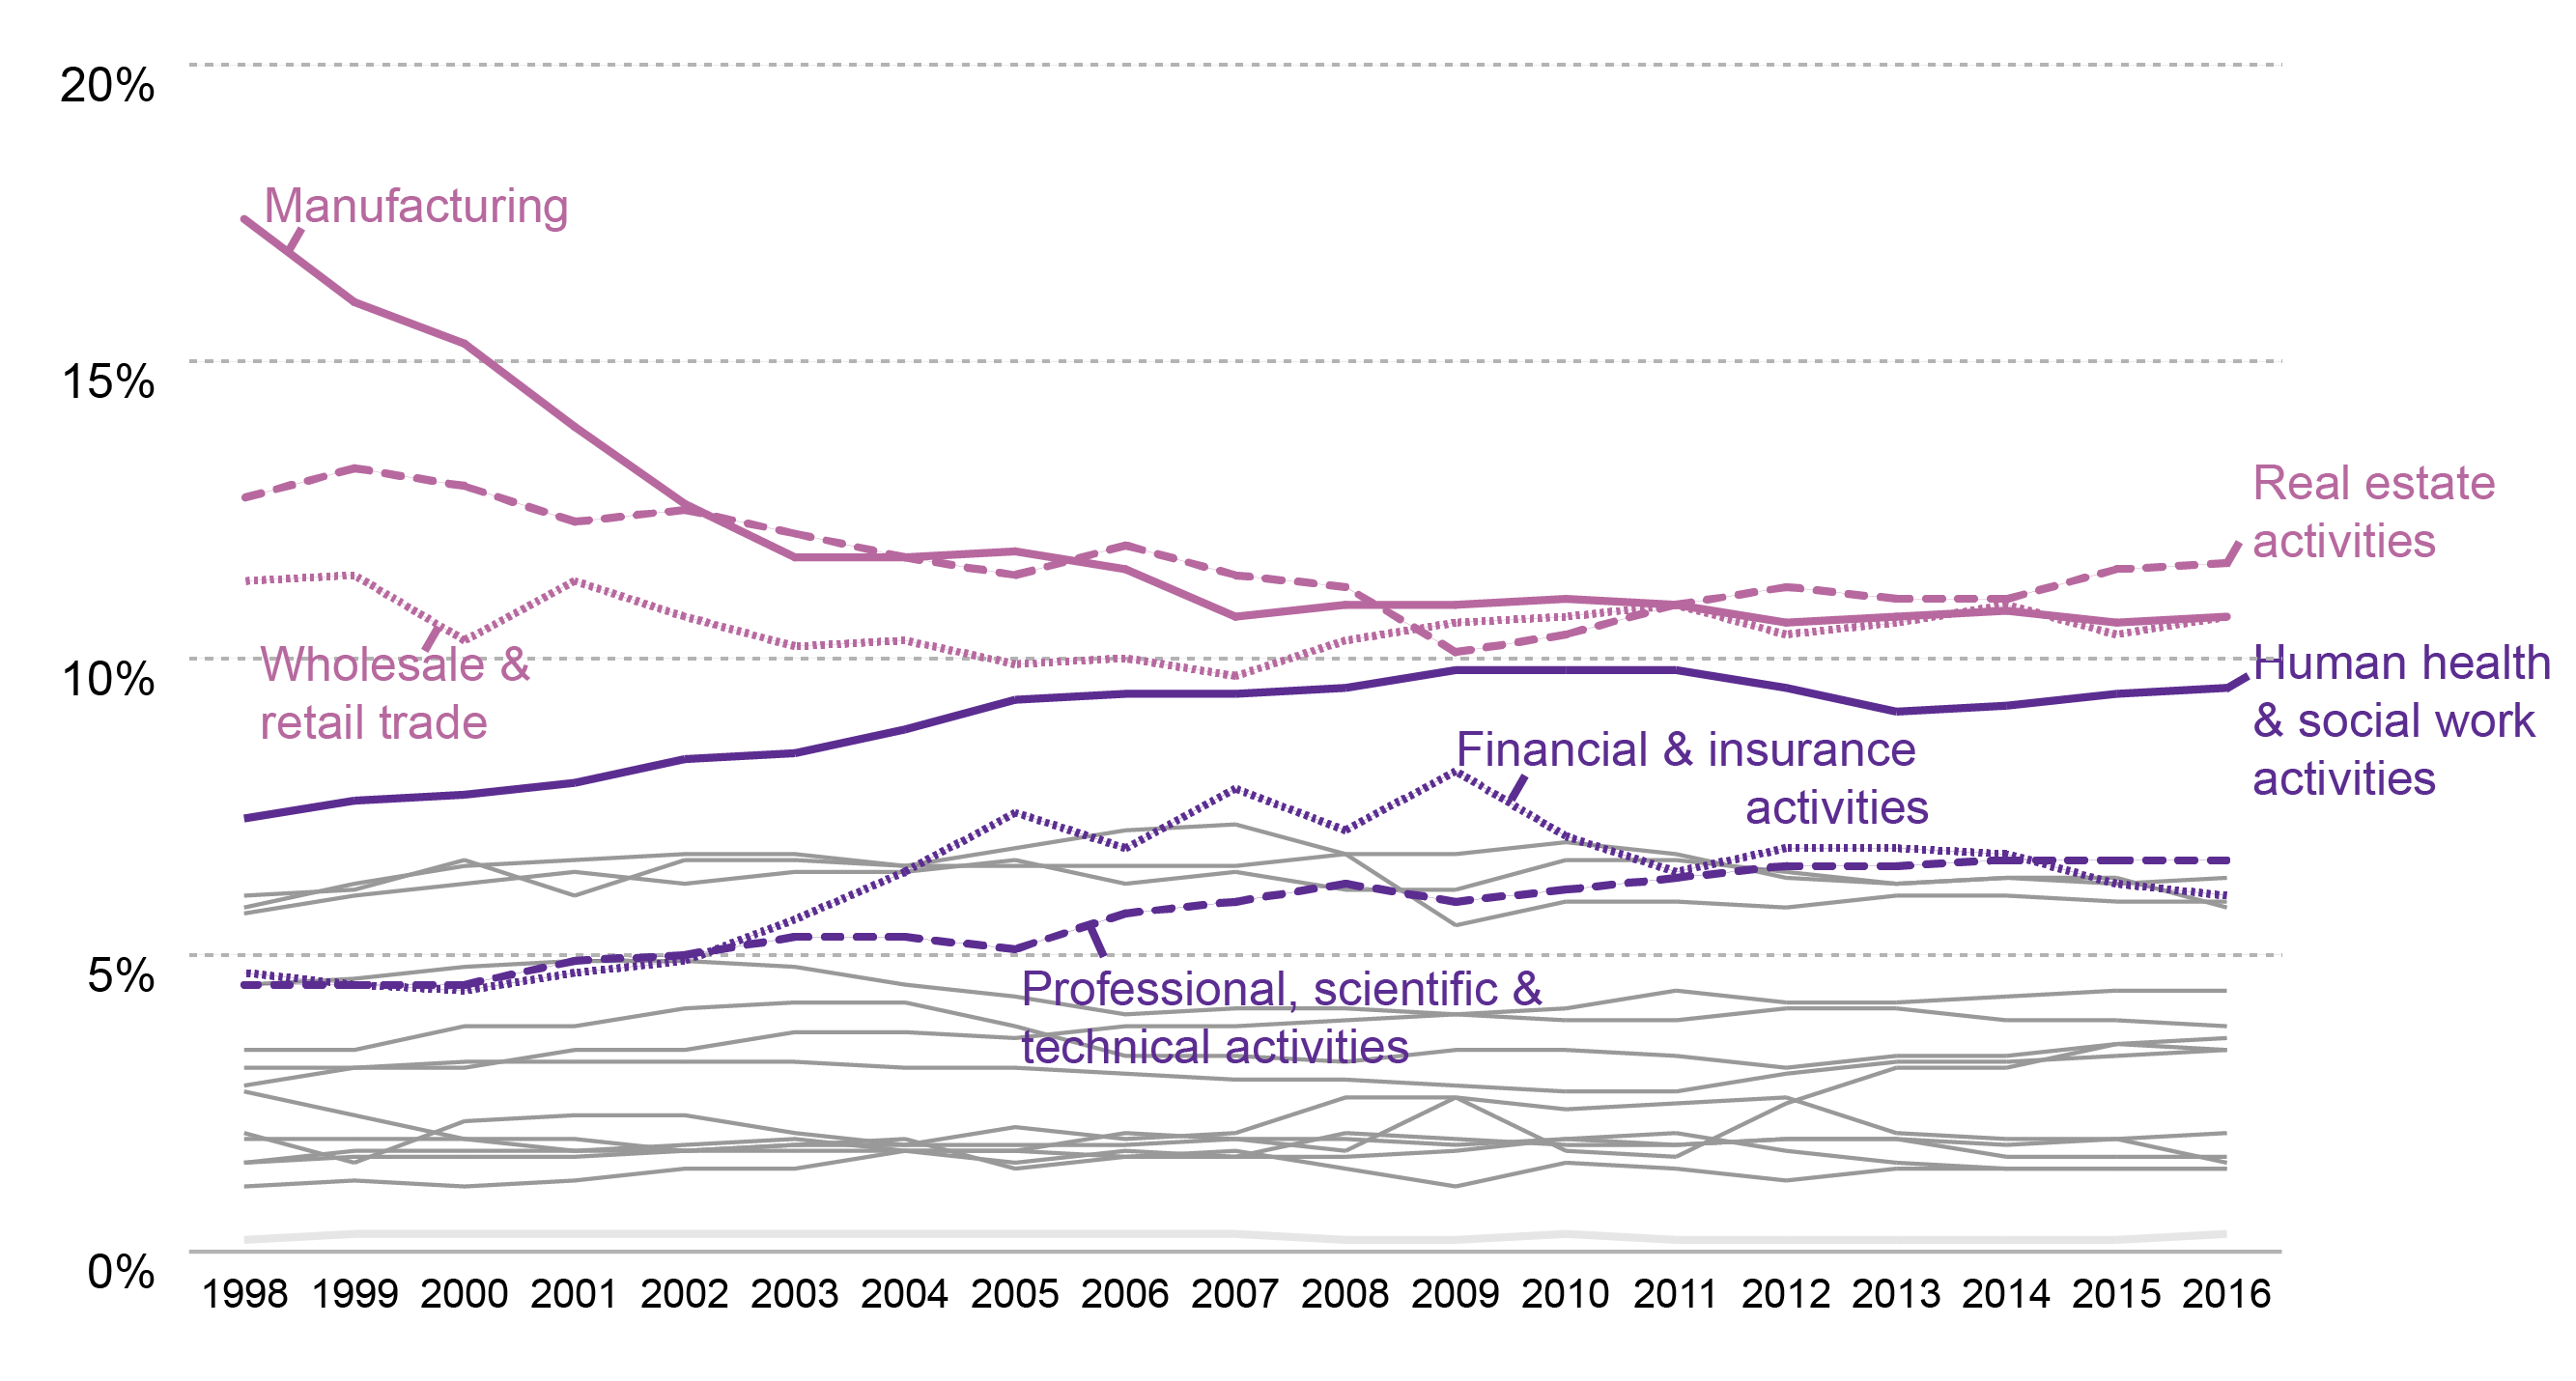
All 20 broad sectors are plotted here and the sectors with the most significant movement have been highlighted. Source: Office for National Statistics. (2017, December 20). Regional gross value added (balanced), UK: 1998 to 2016. Retrieved from https://www.ons.gov.uk/economy/grossvalueaddedgva/bulletins/regionalgrossvalueaddedbalanceduk/1998to2016 [accessed 2018 January 8]
| Total GVA (£ million)1 | % of total Scottish GVA 2016 | % of total Scottish GVA 1998 | Y-o-Y current growth (%)1 | Y-o-Y real growth (%)2 | |
|---|---|---|---|---|---|
| Agriculture, forestry and fishing | 1,889 | 1.4% | 1.9% | 4.8% | 2.3% |
| Mining and quarrying | 2,076 | 1.5% | 2.0% | -15.9% | -19.4% |
| Manufacturing | 14,386 | 10.7% | 17.4% | 4.5% | 0.8% |
| Electricity, gas, steam and air conditioning supply | 4,504 | 3.4% | 2.7% | -0.2% | -1.2% |
| Water supply; sewerage and waste management | 1,831 | 1.4% | 1.5% | 3.4% | 4.1% |
| Construction | 7,907 | 5.9% | 6.0% | 3.1% | 0.2% |
| Wholesale and retail trade; repair of motor vehicles | 14,382 | 10.7% | 11.3% | 6.0% | 5.1% |
| Transportation and storage | 5,850 | 4.4% | 4.5% | 2.3% | -0.6% |
| Accommodation and food service activities | 4,508 | 3.4% | 3.1% | 6.3% | 4.1% |
| Information and communication | 4,779 | 3.6% | 3.4% | 4.0% | 4.3% |
| Financial and insurance activities | 8,088 | 6.0% | 4.7% | 0.9% | 0.2% |
| Real estate activities | 15,536 | 11.6% | 12.7% | 4.1% | 1.5% |
| Professional, scientific and technical activities | 8,882 | 6.6% | 4.5% | 2.8% | 2.4% |
| Administrative and support service activities | 5,104 | 3.8% | 2.8% | 1.6% | -0.3% |
| Public administration and defence | 8,508 | 6.3% | 5.7% | 5.2% | 0.8% |
| Education | 7,809 | 5.8% | 5.8% | -4.6% | -3.1% |
| Human health and social work activities | 12,763 | 9.5% | 7.3% | 4.0% | 2.9% |
| Arts, entertainment and recreation | 2,148 | 1.6% | 1.1% | 1.6% | -3.9% |
| Other service activities | 2,732 | 2.0% | 1.5% | 10.5% | 7.6% |
| Activities of households | 356 | 0.3% | 0.2% | 38.0% | 33.1% |
| Scotland total | 134,038 | 100% | 100% | 3.0% | 1.2% |
Notes: 1) GVA in current prices 2) GVA in chained volume measures Source: Office for National Statistics. (2017, December 20). Regional gross value added (balanced), UK: 1998 to 2016. Retrieved from https://www.ons.gov.uk/economy/grossvalueaddedgva/bulletins/regionalgrossvalueaddedbalanceduk/1998to2016 [accessed 2018 January 8]
Figure 6 shows broad sector 'real terms' GVA growth rates over a number of time periods (1 year, 5 years, 10 years, 18 years). A number of sectors have shown consistent growth over the time periods measured, these were:
wholesale and retail trade; repair of motor vehicles
accommodation and food service activities
information and communication
real estate activities
professional, scientific and technical activities
human health and social work activities
other service activities.
The majority of these sectors grew in line with national trends. However, three sectors showed particularly high rates of real GVA growth: professional, scientific and technical activities (real GVA growth of 146% since 1998), information and communication (137% since 1998), and administrative and support service activities (135% since 1998).
Two sectors were lower in real GVA value now compared to 18 years previous.
Education had decreased by 2% since 1998.
Activities of households fell by 1%.
Manufacturing and construction showed considerably lower real GVA growth rates relative to the national average of 41% since 1998, at 2% and 7% perspectively. This shift in growth from traditional production and manufacturing sectors towards service and digital sectors reflects wider global trends as global economies shift from the third industrial revolution to Industry 4.0.
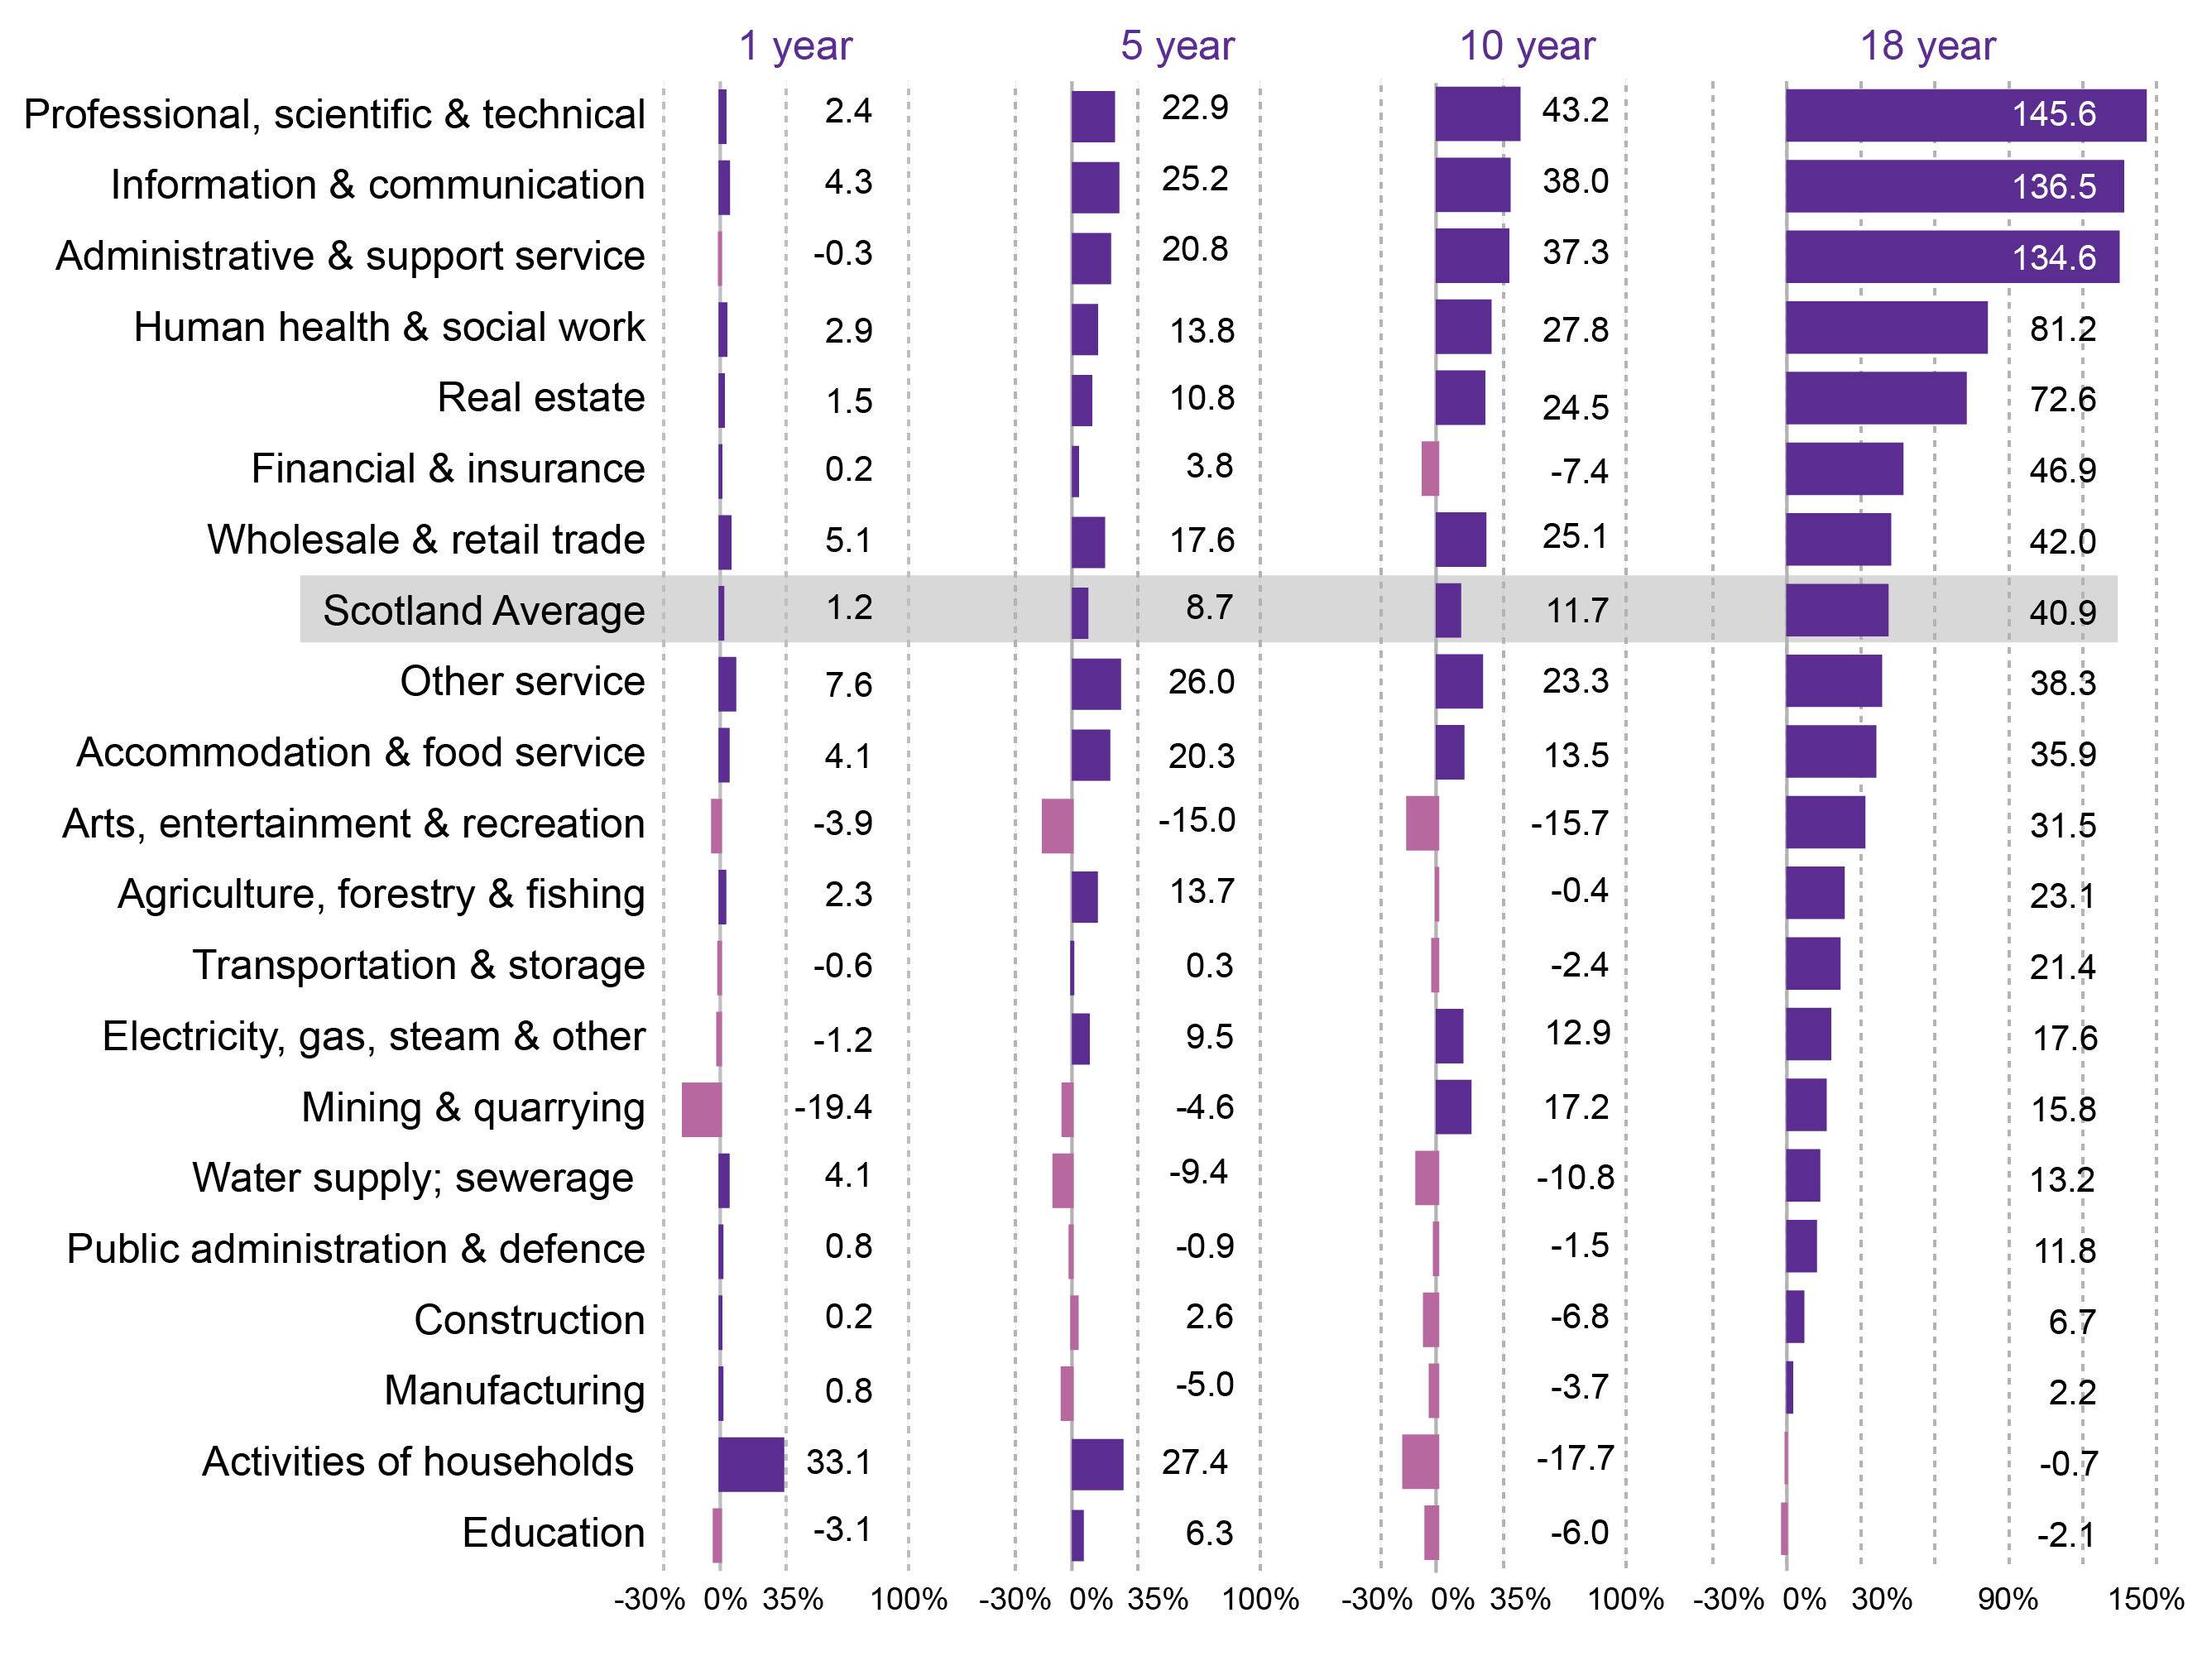
Source: Office for National Statistics. (2017, December 20). Regional gross value added (balanced), UK: 1998 to 2016. Retrieved from https://www.ons.gov.uk/economy/grossvalueaddedgva/bulletins/regionalgrossvalueaddedbalanceduk/1998to2016 [accessed 2018 January 8]
Imputed rent
Real estate activity appears throughout this paper as the largest sector. However, as noted this is mostly made-up of owner-occupiers’ imputed rental. Owner-occupiers’ imputed rental is an estimate of the housing services consumed by households who are not actually renting their residence. It can be thought of as the value that owner-occupiers effectively pay themselves to rent their own homes.
Thus, imputed rental should represent the economic value per period to home owners of their dwellings, equivalent to if they were to rent out their properties. By definition, however, a homeowner does not receive payment on their property, and so the payment must be "imputed". In 2016, ONS introduced improvements to data sources and methods in the calculation of owner-occupied imputed rental. The population is stratified by region and dwelling type. Within each of these strata, imputed rental is calculated as the average price of a privately rented unfurnished dwelling, multiplied by the number of dwellings.
To give an idea of scale, inclusion of how much home-owners would pay if they actually rented boosts UK and Scottish GDP by on average 10% over recent years. Longer term UK trends show a growing proportion of GDP is nothing more than earnings from property. Since 1985 rent and imputed rent have more than doubled as a share of GDP, from 6% to 14% of the UK’s measured GVA in 2016. It is striking that the largest industry in the Scottish economy (as is true elsewhere in the UK) is owner-occupiers unknowingly letting their own houses to themselves.
Adapted from ONS 4
Detailed sector insight
In this section, the analysis focuses on the more detailed 2-digit SIC sectors rather than the broad sector categories explored above. The UK standard industrial classification of economic activities (UK SIC 07) provides a framework for the collection, tabulation, presentation and analysis of data that allow industry classifications to be drilled into at different levels - from broad sectors to the more detailed digit SIC codes. In addition, it can be used for administrative purposes and by non-government bodies as a convenient way of classifying industrial activities into a common structure. Due to the more comprehensive nature of 2-digit SIC sectors resulting in smaller sector bases, much of the analysis in this section looks at change in absolute terms rather than percentage change, to avoid any misrepresentation.
Source: Office for National Statistics. (2017, December 20). Regional gross value added (balanced), UK: 1998 to 2016. Retrieved from https://www.ons.gov.uk/economy/grossvalueaddedgva/bulletins/regionalgrossvalueaddedbalanceduk/1998to2016 [accessed 2018 January 8]
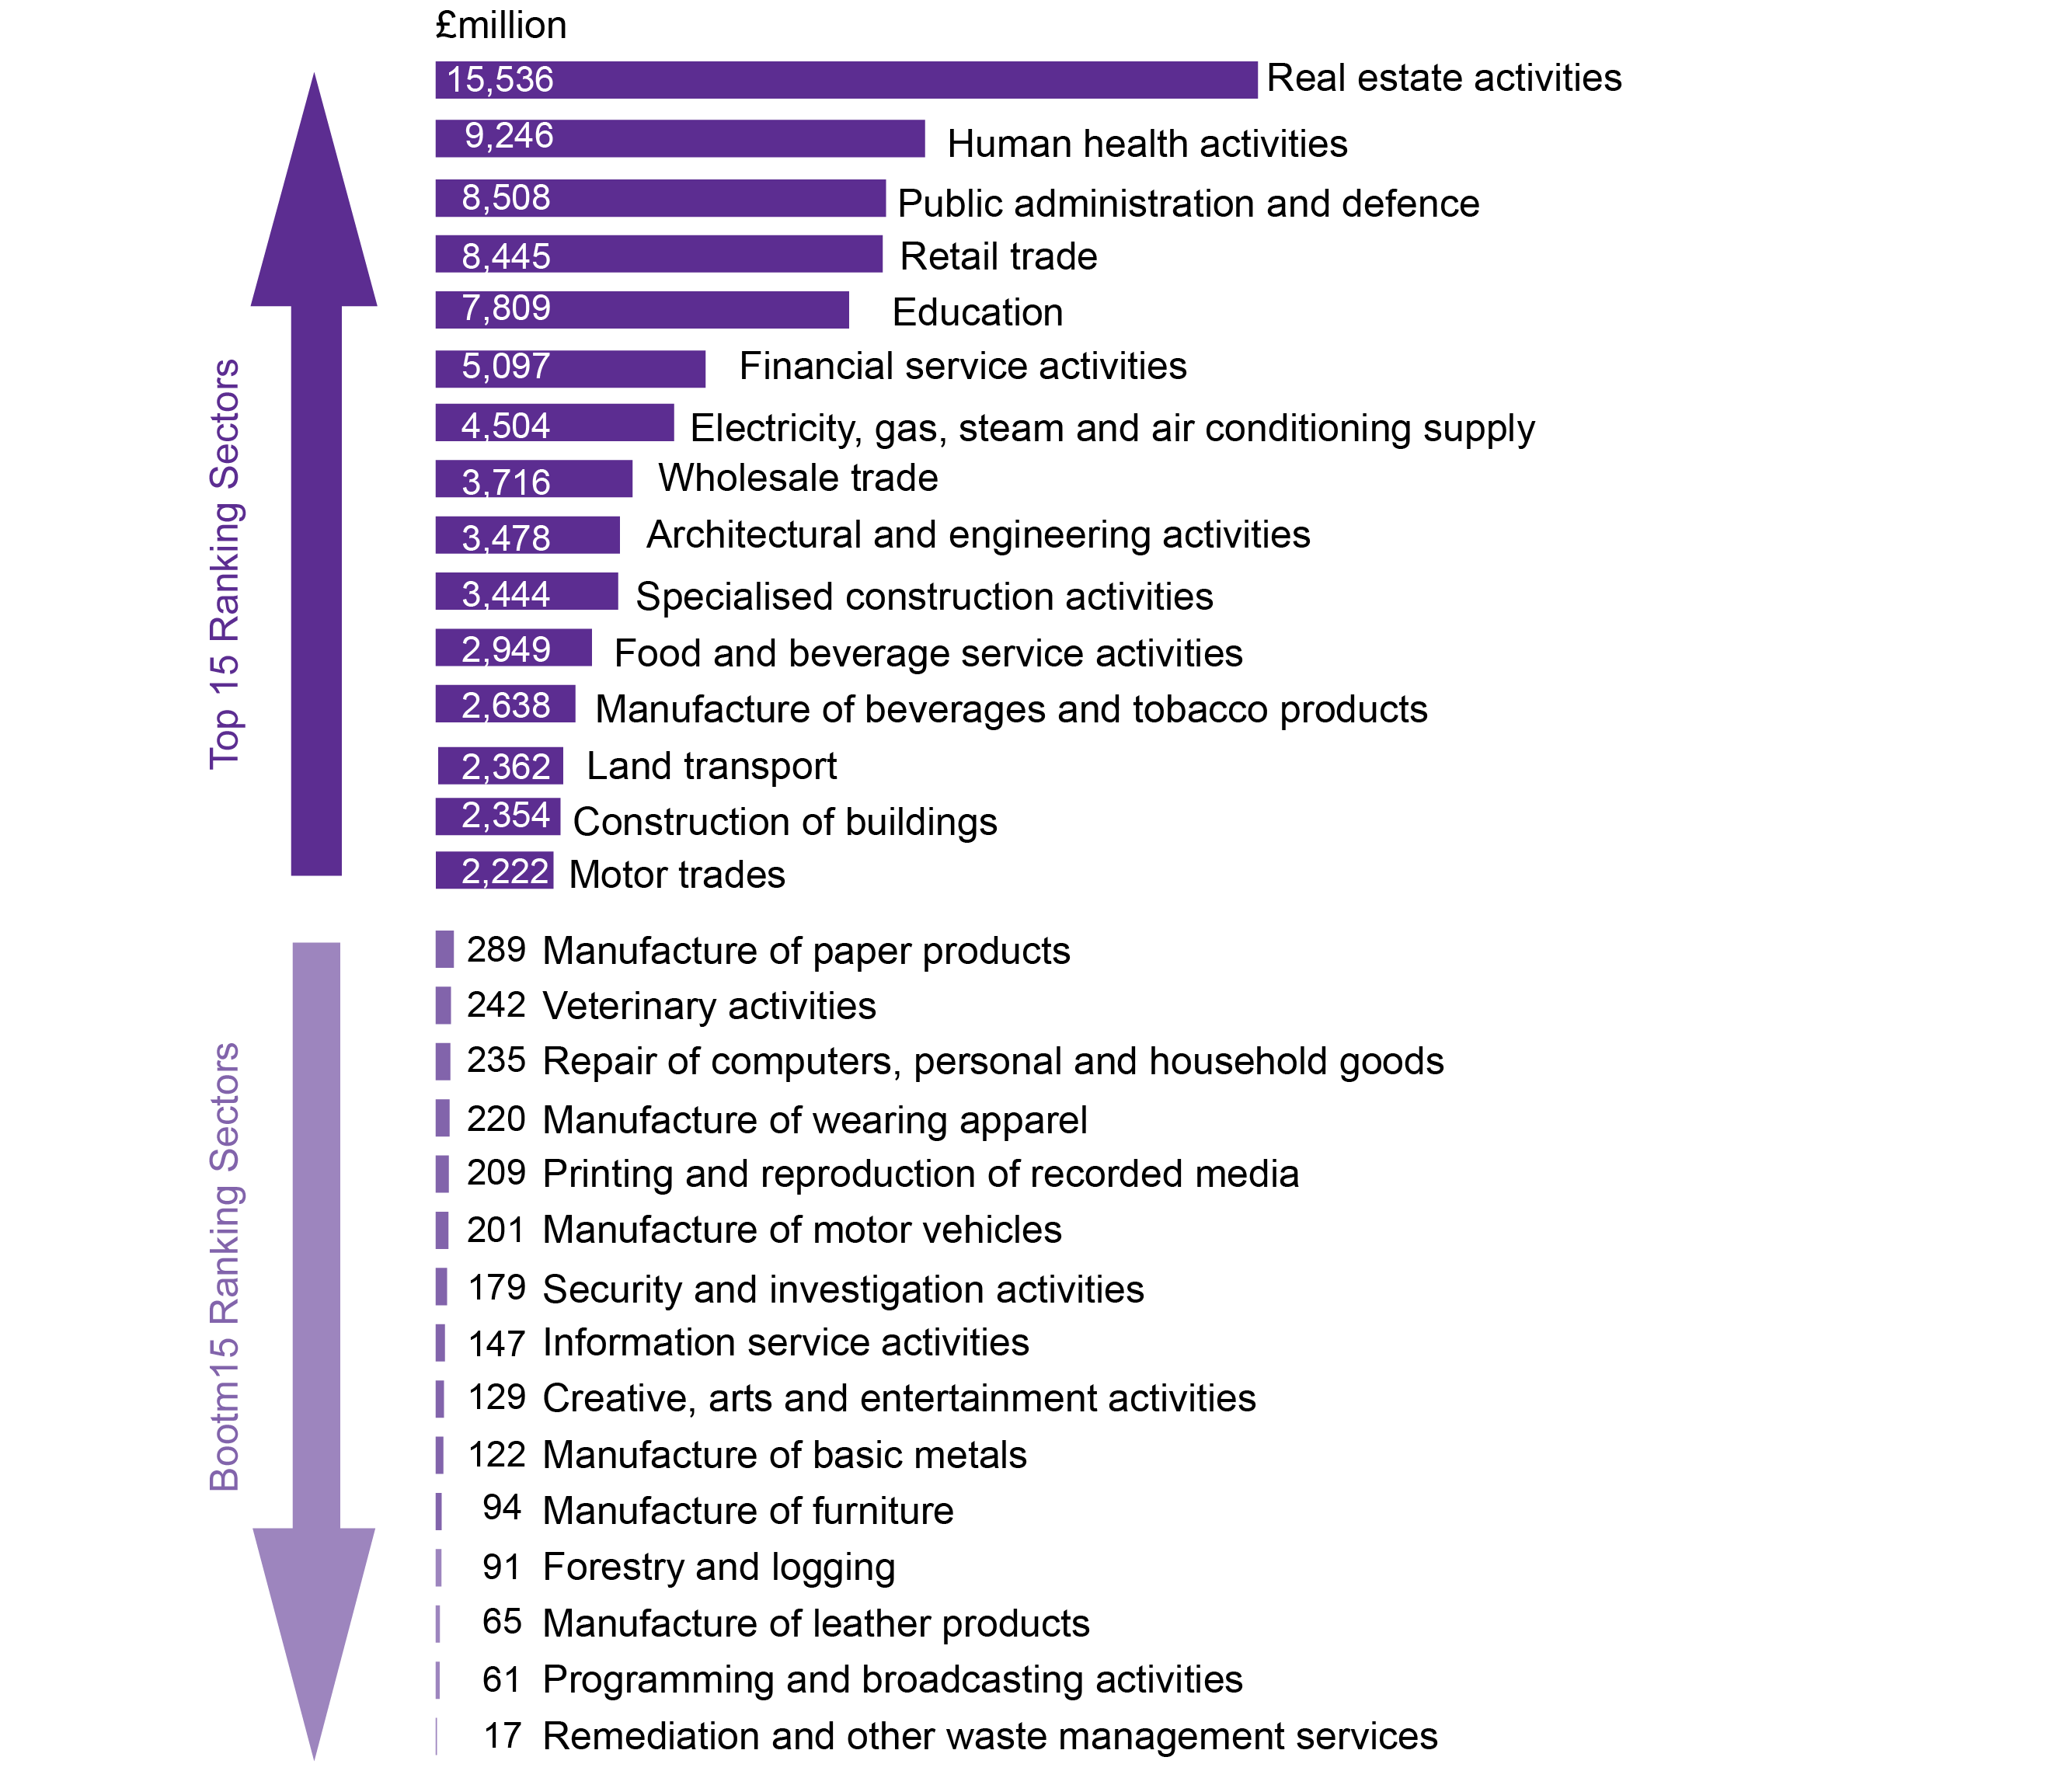
Figure 7 shows the top 15 and bottom 15 detailed sectors in terms of total GVA contribution to the Scottish economy. In total ONS information is available for 80 detailed sectors, thus Figure 7 represents a subset of these.
Real estate activity was by far the largest sector (mostly imputed rental), in terms of GVA contribution, with a £6,300 million difference to the second largest sector of human health activities. There were three construction related sub-sectors in the top 15: architectural and engineering activities, specialised construction activities, and construction of buildings. Manufacture of beverages was the only manufacturing sub-sector in the top 15.
Remediation and other waste management services was the lowest sector in terms of GVA contribution. Other sectors which contributed relatively smaller proportions of GVA were programming and broadcasting activities, manufacture of leather products, forestry and logging, and manufacture of furniture.
Source: Office for National Statistics. (2017, December 20). Regional gross value added (balanced), UK: 1998 to 2016. Retrieved from https://www.ons.gov.uk/economy/grossvalueaddedgva/bulletins/regionalgrossvalueaddedbalanceduk/1998to2016 [accessed 2018 January 8]
Figure 8 shows the top 15 and bottom 15 detailed sectors in terms of the absolute change in GVA to the year 2016. Financial service activities recorded the largest increase in GVA in the year to 2016 (£730 million), whilst insurance and pension funding had the greatest decrease, declining by £517 million. In the top level broad sector figures financial and insurance activities are aggregated together, thus these large scale changes were concealed.
Food and drink related activities performed well over the year to 2016 with both manufacturing of beverages (£310 million increase) and food and beverage serving activities (£218 million increase) seeing signifiant increases in GVA. Other sectors with noteworthy increases in GVA were: activities of membership organisations (£193 million increase); land transport (£125 million increase) which includes passenger and freight rail and taxis; specialised construction (£119 million increase); and services to buildings and landscaping (£119 million increase).
GVA for mining support service activities declined by £391 million in the year to 2016, reflecting the decline of this sector in North East Scotland. As well as the already highlighted decline in insurance and pension fund activities, there were declines in other finance linked support activities, such as activities auxiliary to finance and insurance (-£142 million), office administration and business support activities (-£139 million), and legal and accounting activities (-£108 million). There were five manufacturing sectors in the bottom 15 in terms of GVA decline. These were pharmaceutical products, machinery and equipment, wearing apparel, computer, electronic and optical products, and paper products.
Sector snapshots
This section provides some specific sector insights, particularly around the variation in GVA returns across Scotland's sectors and how the sub-sectors that make up the manufacturing industry perform.
Sectoral turnover to GVA ratios
Using approximate GVA (see discussion in Annex) and related turnover data from the Scottish Annual Business Statistics (SABS)1, it is possible to develop turnover to GVA ratios for 72 division sectors of the Scottish economy. These ratios, as illustrated in Figure 9, show the average sector GVA return for every £1 of turnover. For example, on average every £1 of turnover across the civil engineering sector generates £0.42p of GVA. The range of values in Figure 9 demonstrate that some sectors more naturally lend themselves to higher valued added activity than others. Factors contributing to this variation relate to the mix of intermediate consumption components and final output prices. This variation in economic value added and the sectoral mix of the economy, all have knock on impacts for productivity and ultimately economic growth.
Using the most recently available SABS data, the sector with the highest turnover to GVA ratio was sewerage at £1: 0.90p (noting sewerage is a relatively small sector with limited scale-up opportunities) and the lowest was the wholesale and retail trade at £1:0.16p.
Other sectors on the top end of scale were security and investigation activities (0.87), legal and accounting activities (0.81), real estate activities (0.74), and advertising and market research (0.74).
Examples of lower valued sectors were gambling and betting activities (0.18), activities of membership organisations (0.22), manufacture of coke and refined petroleum (0.27), and creative, arts and entertainment activities (0.29).
The concept of turnover to GVA ratios is important in illustrating how the permutation of sectors in an economy can impact on economic growth. Whilst the solution to achieving a high growth economy is not as simple as investing in the high growth sectors, these ratios should be borne in mind when making sector policy decisions with the objective of economic growth.
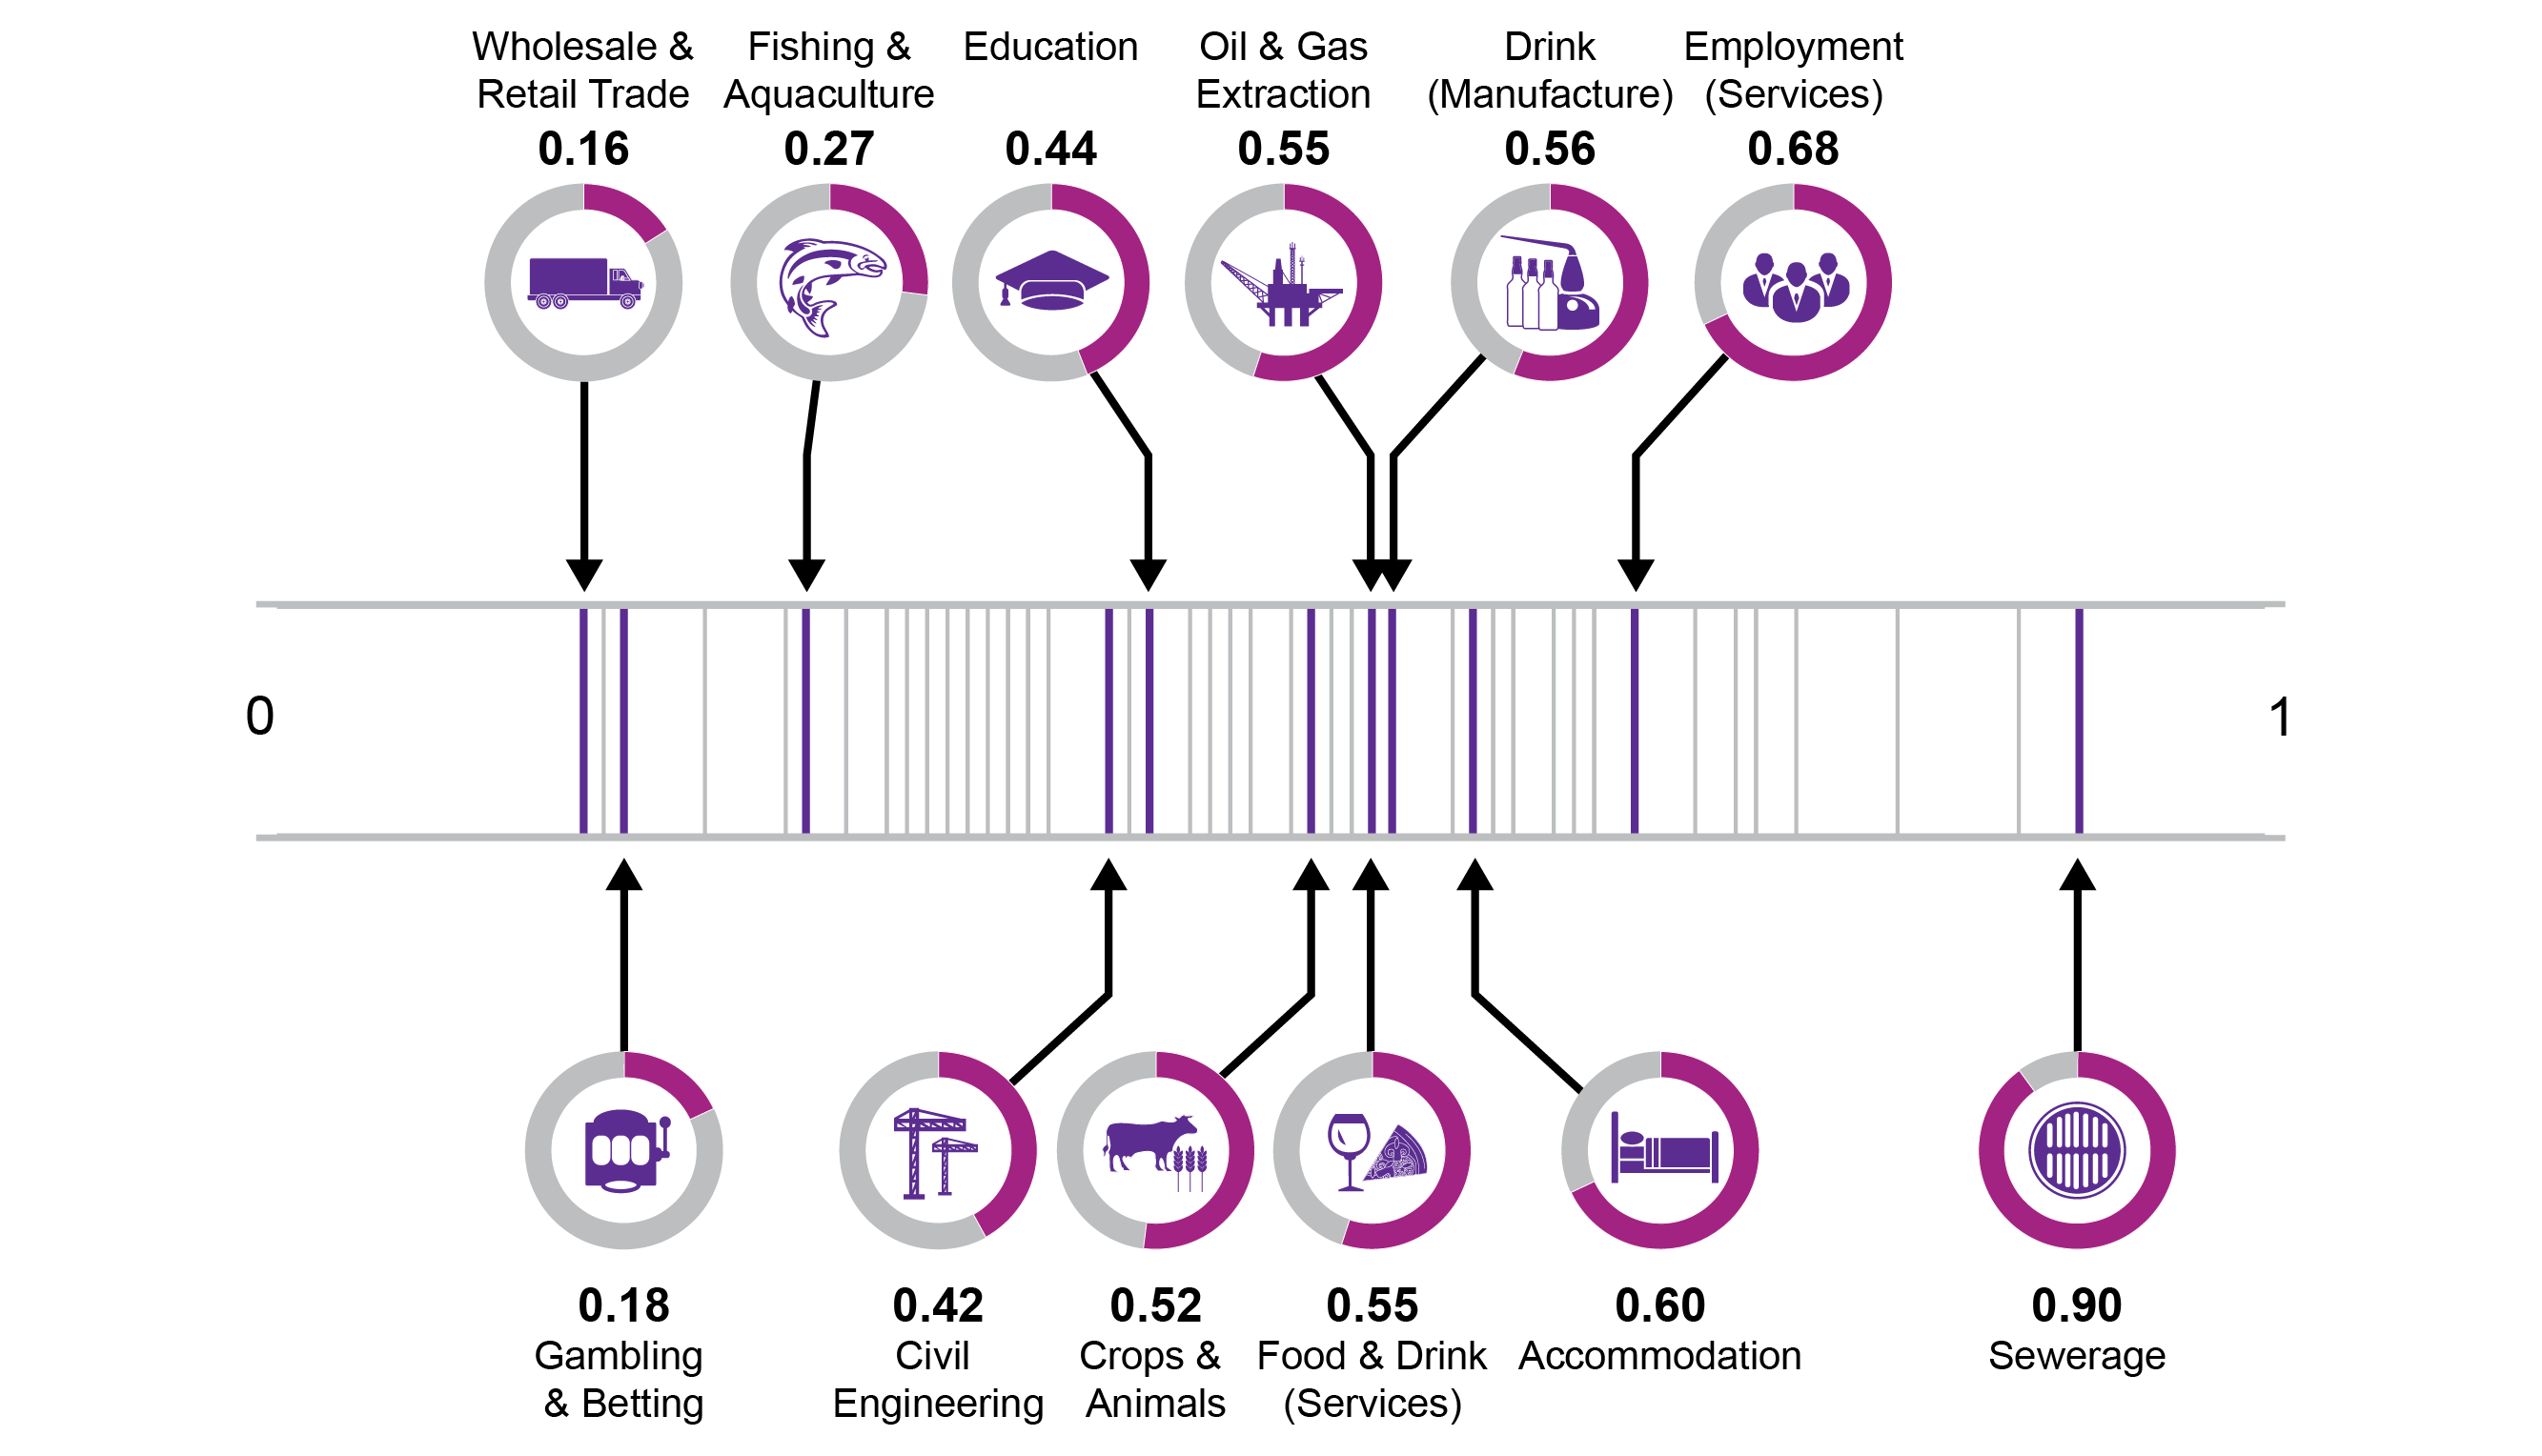
The turnover to GVA ratios for 72 sectors have been plotted on this chart. A selection have been labelled and highlighted. The remainder are represented by the grey scaled lines due to size constraints. Source: Scottish Government. (2017, August). Scottish Annual Business Statistics (SABS). Retrieved from http://www.gov.scot/Topics/Statistics/Browse/Business/SABS [accessed 1 February 2018]
Manufacturing
Scotland has a proud manufacturing heritage. Yet manufacturing's share of Scotland's economic output has been in steady decline over recent decades as illustrated in Figure 5. Scotland is not alone in experiencing this declining trend as highlighted in a recent House of Commons Library report1 which notes:
Manufacturing’s declining share of the economy in the last 30 years is the result of growth in other industries, particularly the services sector, rather than falls in manufacturing output.....This is mainly because UK manufactured goods have become less attractive to industries and consumers for the following reasons including relatively high production costs in the UK; other manufacturing centres are closer to raw materials; and consumer markets far from the UK have been the fastest growing in recent decades (notably China and India). Other countries where these factors are not present have absorbed most of the global growth in demand for manufacturing.
To provide some international comparison, it worth noting that over 20% of Germany’s economic output is from manufacturing, which is unusual among major Western economies. In France it is 11%, USA 12% and Italy 16%1.
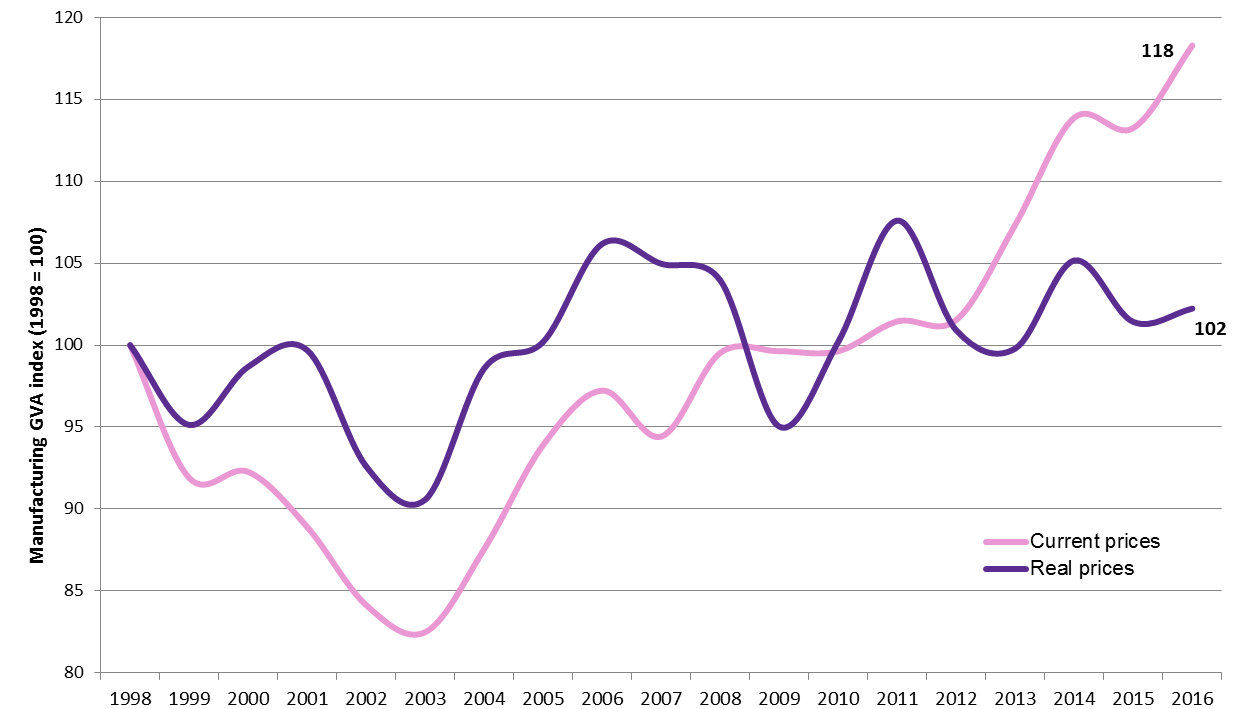
Figure 10 shows the economic value of Scotland's manufacturing sector indexed to 1998 in both current and real prices. In both real and current terms, there was a significant dip in manufacturings GVA in the early 2000's reflecting the decline of 'Silicon Glen' with its heavy dependency on electronics manufacturing after the global collapse of the hi-tech economy in 2000. Many global companies laid off substantial numbers of employees or closed factories completely. The impact of the 2008/09 recession on manufacturing is much more obvious in real prices rather than current prices. The initial recovery in real manufacturing output stalled in 2012 and declined for the following two years. Output in the most recent years has been erratic with growth in 2014, followed by decline in 2015 and almost flat growth in 2016. Current manufacturing GVA in real terms is still 6% below its 2011 peak, and only 2% above its 1998 value.
Source: Office for National Statistics. (2017, December 20). Regional gross value added (balanced), UK: 1998 to 2016. Retrieved from https://www.ons.gov.uk/economy/grossvalueaddedgva/bulletins/regionalgrossvalueaddedbalanceduk/1998to2016 [accessed 2018 January 8]
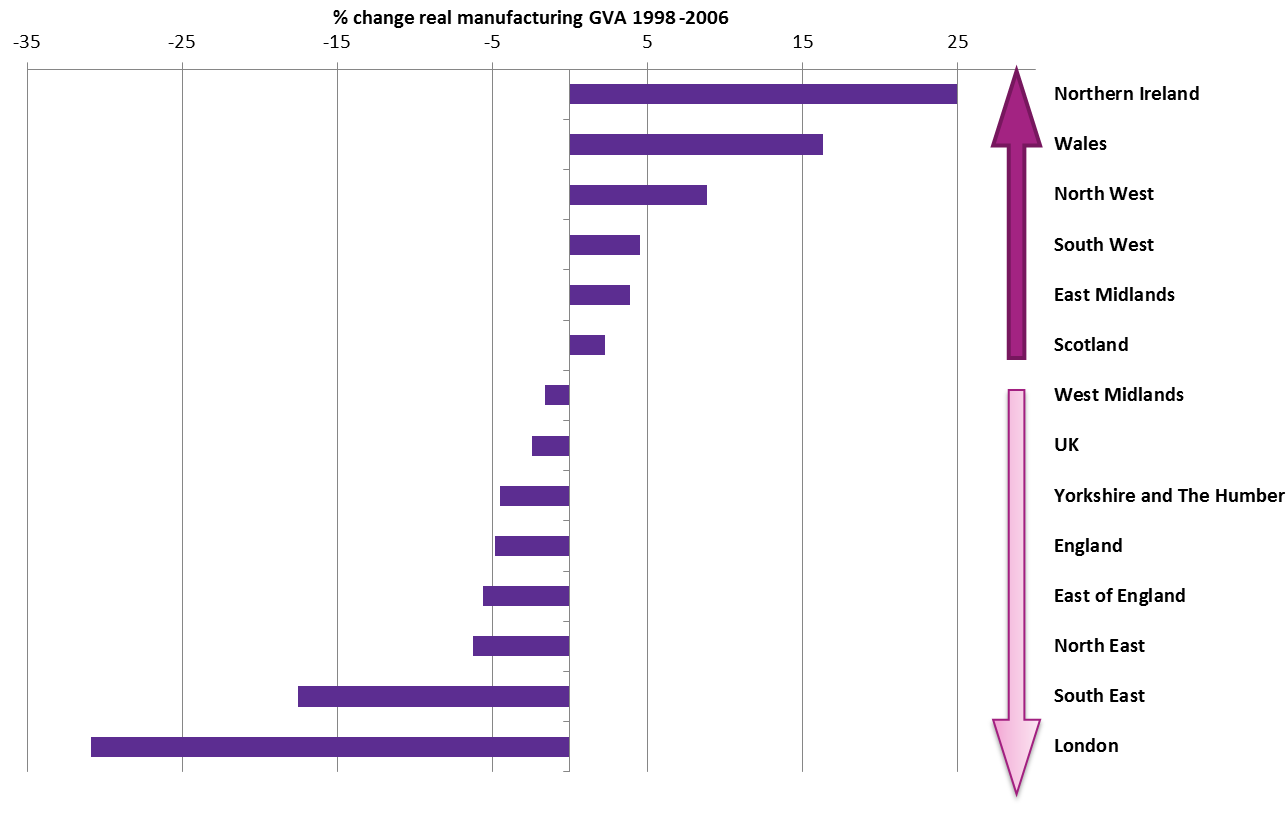
Figure 11 shows that Scotland's 2% real terms increase in manufacturing GVA since 1998 ranks higher than many other regions of the UK.
London and every region along England's east coast (South East, North East, East of England, Yorkshire & the Humber) experienced a decline in real manufacturing output since 1998.
Northern Ireland saw the largest real terms (25%) manufacturing output increase driven by the manufacturing of machinery, transport equipment and fabricated metal. Wales also saw a notable increase in value . However, it should be noted these are relatively small geographies and have minimal impact on total UK GVA.
Source: Office for National Statistics. (2017, December 20). Regional gross value added (balanced), UK: 1998 to 2016. Retrieved from https://www.ons.gov.uk/economy/grossvalueaddedgva/bulletins/regionalgrossvalueaddedbalanceduk/1998to2016 [accessed 2018 January 8]
Manufacturing sub-sectors
This section looks at the sub-sectors that make up manufacturing, exploring the winners and losers in terms of GVA contribution over the last two decades.
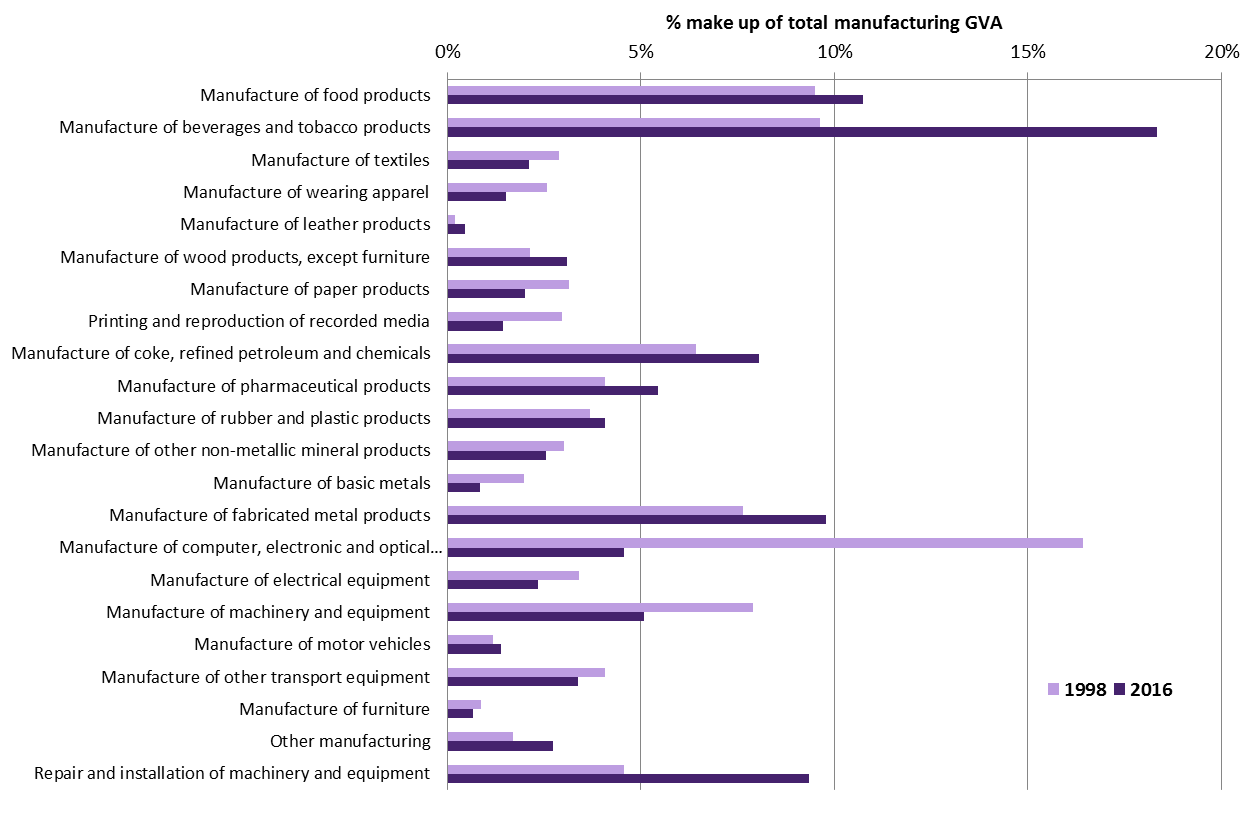
Figure 12 shows beverage manufacturing contributed almost a fifth (18%) of Scotland's manufacturing GVA in 2016, up from 10% in 1998. The next largest sectors were food products (11%) and fabricated metal production (10%). Notable also was repair and installation of machinery and equipment, which has seen its contribution almost double over the period in question (although it most be noted that this sector was only formally defined in SIC 2007 and much of the increase might reflect the improved classification). Computer, electronic and optical products manufacturing has seen the greatest decline in its percentage share, falling by 11 percentage points. This decline to now only represent 5% of total manufacturing output mirrors the story of the demise of Scotland's 'Silicon Glen'.
Source: Office for National Statistics. (2017, December 20). Regional gross value added (balanced), UK: 1998 to 2016. Retrieved from https://www.ons.gov.uk/economy/grossvalueaddedgva/bulletins/regionalgrossvalueaddedbalanceduk/1998to2016 [accessed 2018 January 8]
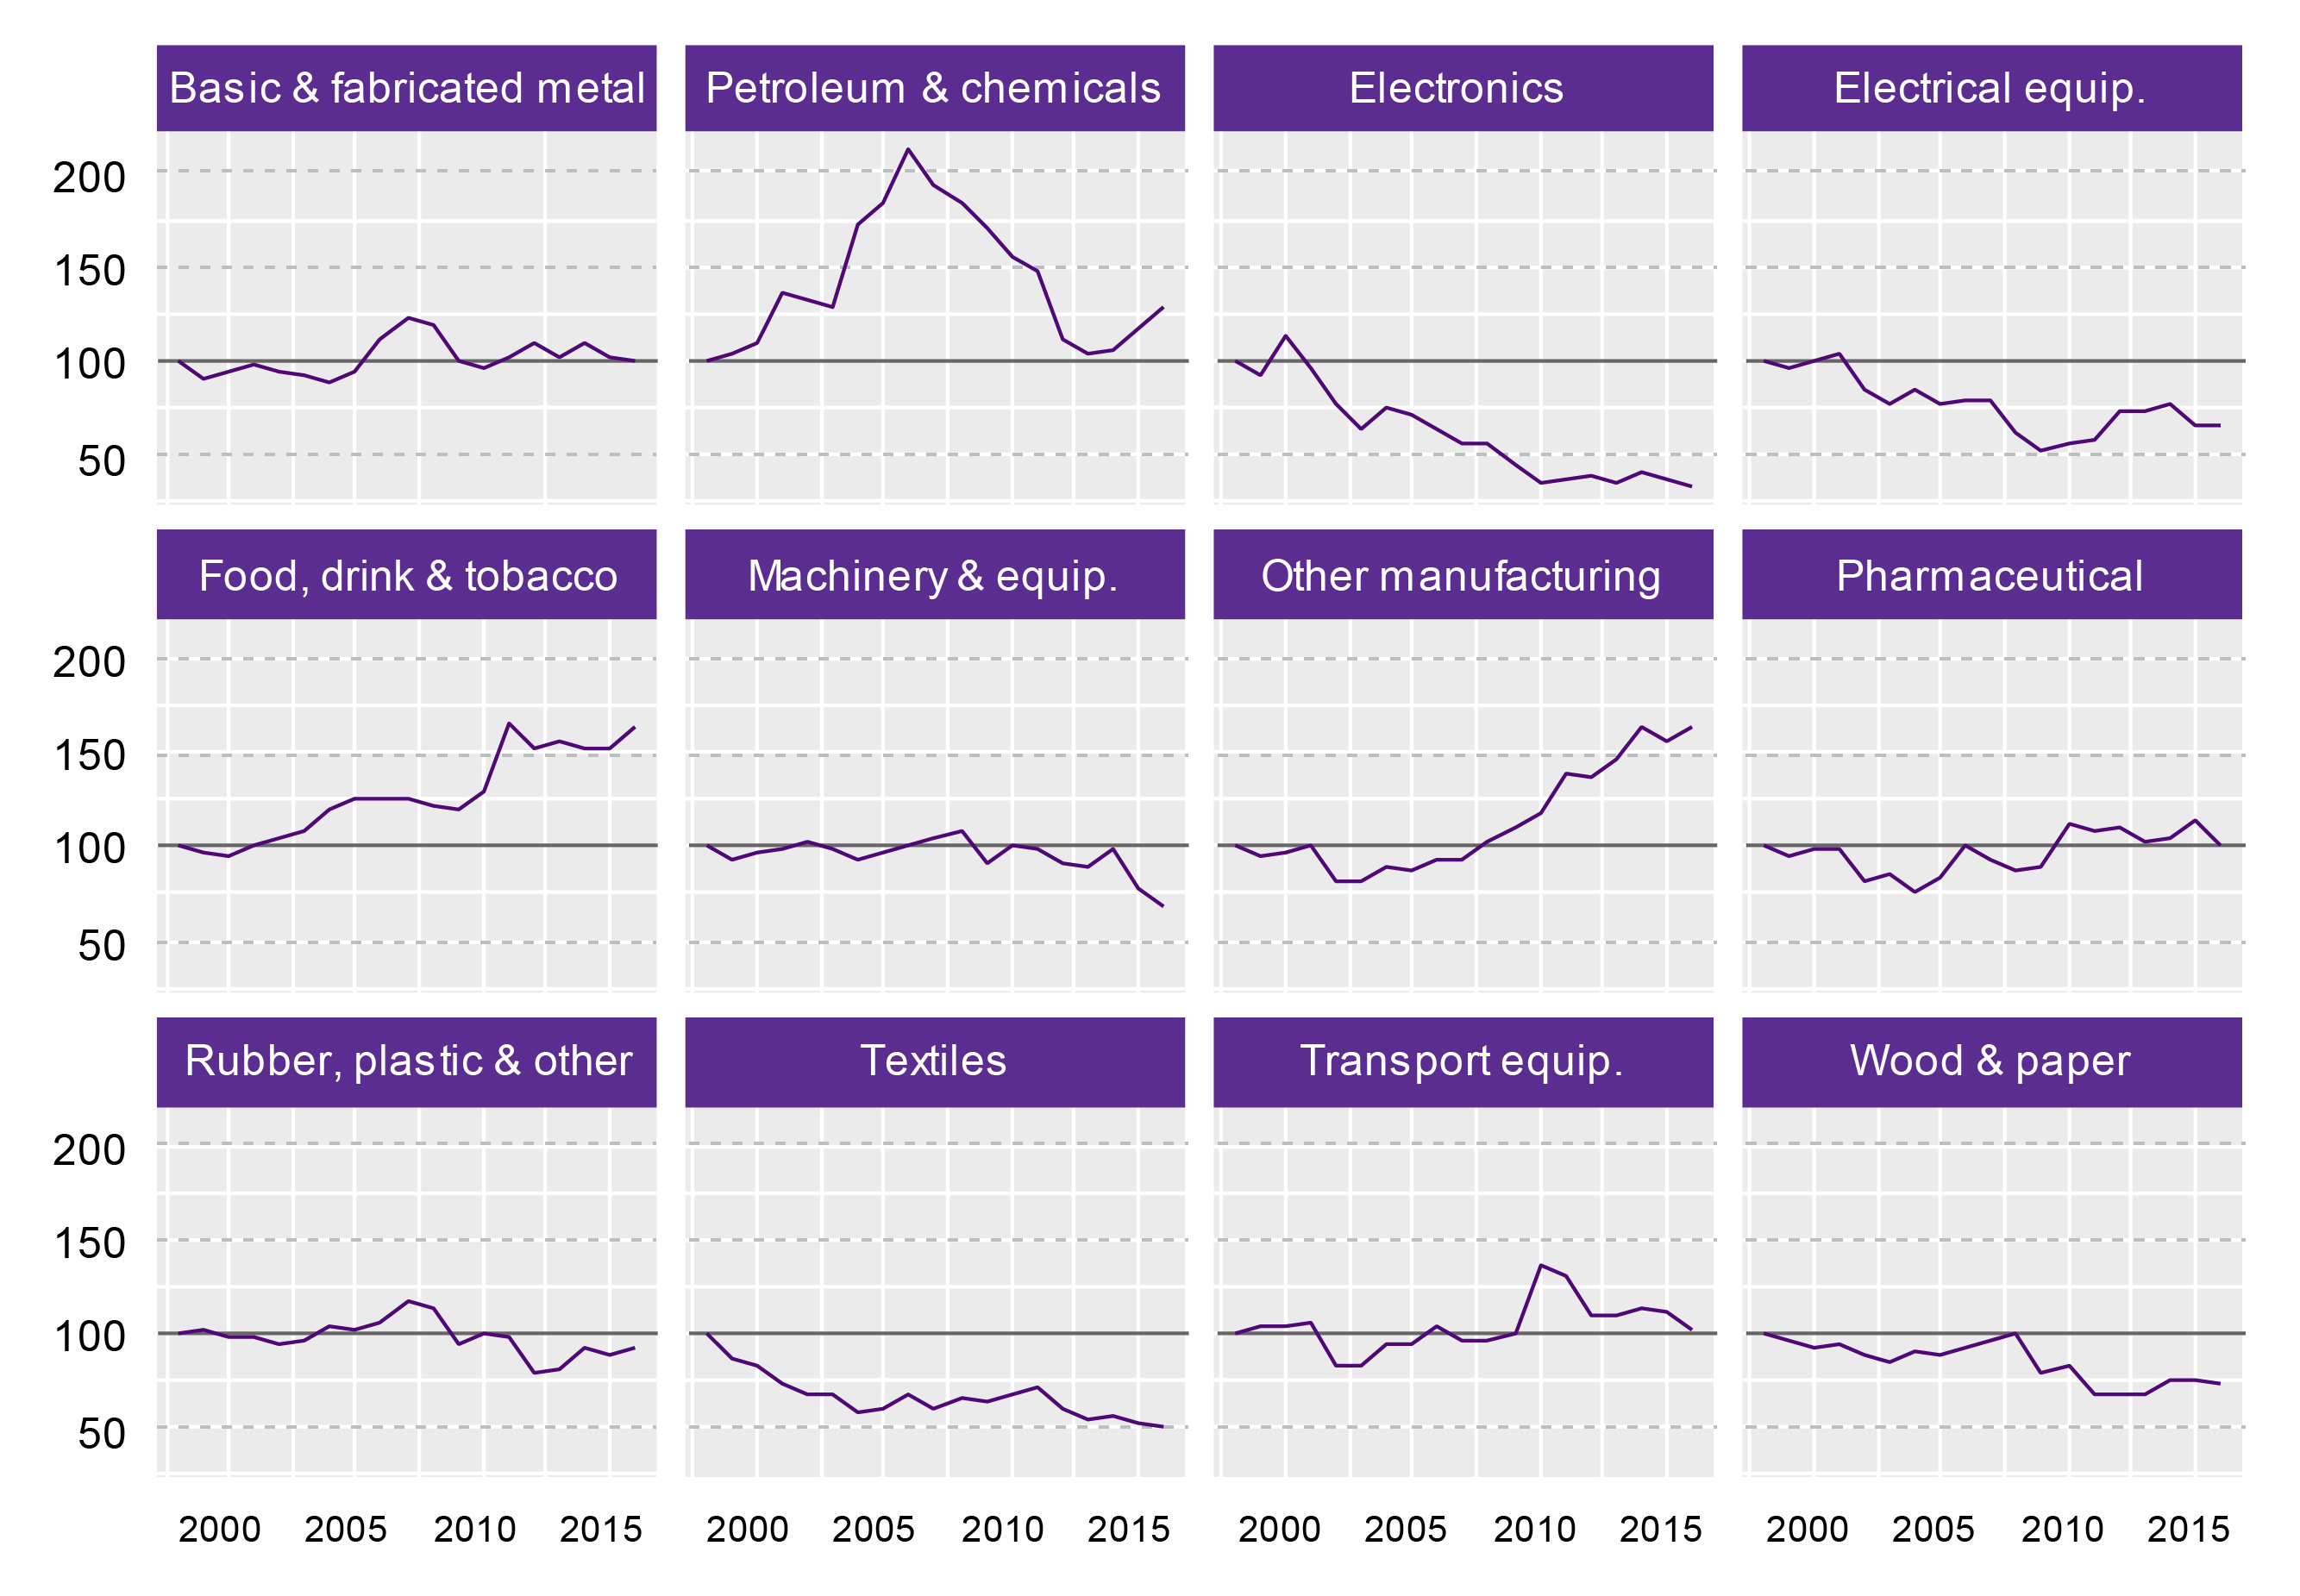
The fortunes of Scotland's manufacturing sub-sectors have varied since 1998, as demonstrated in Figure 13 with the wide dispersal of 2016 values. Data points above 100 indicate increased GVA since 1998, whereas data points under 100 represent decreasing GVA.
The story of economic output in coke, refined petroleum and chemicals manufacturing is the most striking in Figure 13. This sector experienced substantial rapid growth between 1998 and 2006, peaking in 2006 at 112 percentage points above the 1998 baseline. This was followed by a period of steep decline between 2007 and 2013. Since 2014 there has been an upturn in GVA and most recently 2016 GVA was 28 percentage points above 1998 levels. However, this is a significant fall from the peak of the previous decade.
Food and beverage manufacturing was the only sector to show a positive upward trend over the majority of the 18 year period. GVA in the sector peaked in 2011 and the recent 2016 GVA results are only 2 percent points under this peak.
The decline of computer, electronic and optical products, as already referenced, is evident. Since 1998 the economic output of the sector has declined by 68 percentage points.
Textile and wearing apparel (50 pp), electrical equipment (35 pp), machinery and equipment (31 pp), and wood, paper and printing (27 pp) have all seen relatively large declines in economic value since 1998.
Source: Office for National Statistics. (2017, December 20). Regional gross value added (balanced), UK: 1998 to 2016. Retrieved from https://www.ons.gov.uk/economy/grossvalueaddedgva/bulletins/regionalgrossvalueaddedbalanceduk/1998to2016 [accessed 2018 January 8]
Scotland's regional spread of GVA
Local authority GVA
Table 3 shows that approximately 30% of Scotland's GVA was generated in its two largest cities (Glasgow 15.2%, Edinburgh 14.9%). Aberdeen City (7.9%) and Fife (5.6%) were the next largest local authority areas in terms of economic output. Since 1998 there has been little change or rebalance in the distribution of GVA across Scotland's economy. The proportionate share of GVA has held constant in most local authorities over the 18 year period, apart from:
Edinburgh increased its share of the Scottish GVA total by 2 percentage points (pp) (12.9% to 14.9%)
Renfrewshire (-1.1 pp), North Ayrshire (-0.6 pp), South Lanarkshire (-0.4 pp), and West Lothian (-0.4 pp) all saw there share of Scottish GVA decline.
In the year to 2016, all but four local authorities saw economic output increase (see Table 3).
The largest increases were in Falkirk (7.1%), Inverclyde (7.1%), Dundee City (5.8%), Midlothian (5.6%) and East Lothian (5.6%). However, as these local authority areas represent a small proportion of the total Scotland figure, it should be noted they have a minimal impact on total GVA.
Aberdeen City (-2.2%), Aberdeenshire (-1.4%), Na h-Eileanan Siar (-1.1%), and West Dunbartonshire (-0.7%) all saw economic output decline.
Over the decade to 2016, all local authorities increased economic output in current price terms (please note real term GVA data is not available at a local authority level). Aberdeenshire, Shetland Islands, Perth and Kinross, Clackmannanshire, and the Orkney Islands had the highest levels of GVA growth since 2006.
| Total GVA (£ millions) | % of total Scottish GVA 2016 | % of total Scottish GVA 1998 | 1 year growth | 10 year growth | GVA per head £ | |
|---|---|---|---|---|---|---|
| Aberdeen City | 10,607 | 7.9% | 7.5% | -2.2% | 34.5% | 46,151 |
| Aberdeenshire | 6,931 | 5.2% | 4.7% | -1.4% | 48.6% | 26,433 |
| Angus | 2,167 | 1.6% | 1.9% | 3.0% | 22.2% | 18,597 |
| Argyll and Bute | 1,897 | 1.4% | 1.5% | 4.2% | 25.7% | 21,774 |
| City of Edinburgh | 19,942 | 14.9% | 12.9% | 4.6% | 35.4% | 39,321 |
| Clackmannanshire | 916 | 0.7% | 0.7% | 3.0% | 43.6% | 17,846 |
| Dumfries and Galloway | 2,915 | 2.2% | 2.2% | 3.2% | 32.1% | 19,494 |
| Dundee City | 3,574 | 2.7% | 2.8% | 5.8% | 31.7% | 24,104 |
| East Ayrshire | 1,889 | 1.4% | 1.8% | 2.9% | 13.6% | 15,460 |
| East Dunbartonshire | 1,561 | 1.2% | 1.3% | 3.9% | 26.0% | 14,515 |
| East Lothian | 1,765 | 1.3% | 1.4% | 5.6% | 24.8% | 16,957 |
| East Renfrewshire | 1,302 | 1.0% | 1.2% | 5.5% | 25.0% | 13,877 |
| Falkirk | 3,260 | 2.4% | 2.7% | 7.1% | 13.7% | 20,457 |
| Fife | 7,509 | 5.6% | 5.4% | 4.6% | 35.5% | 20,276 |
| Glasgow City | 20,371 | 15.2% | 15.2% | 3.5% | 30.2% | 33,120 |
| Highland | 5,472 | 4.1% | 3.8% | 3.6% | 31.6% | 23,307 |
| Inverclyde | 1,518 | 1.1% | 1.3% | 7.1% | 20.5% | 19,173 |
| Midlothian | 1,488 | 1.1% | 1.0% | 5.6% | 32.3% | 16,790 |
| Moray | 2,083 | 1.6% | 1.4% | 4.8% | 30.3% | 21,683 |
| Na h-Eileanan Siar | 465 | 0.3% | 0.4% | -1.1% | 4.5% | 17,276 |
| North Ayrshire | 2,078 | 1.6% | 2.2% | 0.7% | 13.8% | 15,294 |
| North Lanarkshire | 6,522 | 4.9% | 4.2% | 2.2% | 31.1% | 19,216 |
| Orkney Islands | 462 | 0.3% | 0.4% | 3.6% | 41.7% | 21,164 |
| Perth and Kinross | 3,882 | 2.9% | 2.8% | 4.6% | 43.9% | 25,765 |
| Renfrewshire | 4,051 | 3.0% | 4.1% | 3.3% | 20.4% | 23,024 |
| Scottish Borders | 2,096 | 1.6% | 1.6% | 1.2% | 27.8% | 18,298 |
| Shetland Islands | 673 | 0.5% | 0.6% | 0.7% | 48.2% | 29,027 |
| South Ayrshire | 2,629 | 2.0% | 2.1% | 4.7% | 30.0% | 23,375 |
| South Lanarkshire | 6,224 | 4.6% | 5.0% | 2.5% | 18.3% | 19,629 |
| Stirling | 2,370 | 1.8% | 1.6% | 4.3% | 38.9% | 25,280 |
| West Dunbartonshire | 1,635 | 1.2% | 1.4% | -0.7% | 19.9% | 18,198 |
| West Lothian | 3,784 | 2.8% | 3.2% | 2.7% | 20.2% | 21,005 |
Source: Office for National Statistics. (2017, December 20). Regional gross value added (balanced), UK: 1998 to 2016. Retrieved from https://www.ons.gov.uk/economy/grossvalueaddedgva/bulletins/regionalgrossvalueaddedbalanceduk/1998to2016 [accessed 2018 January 8]
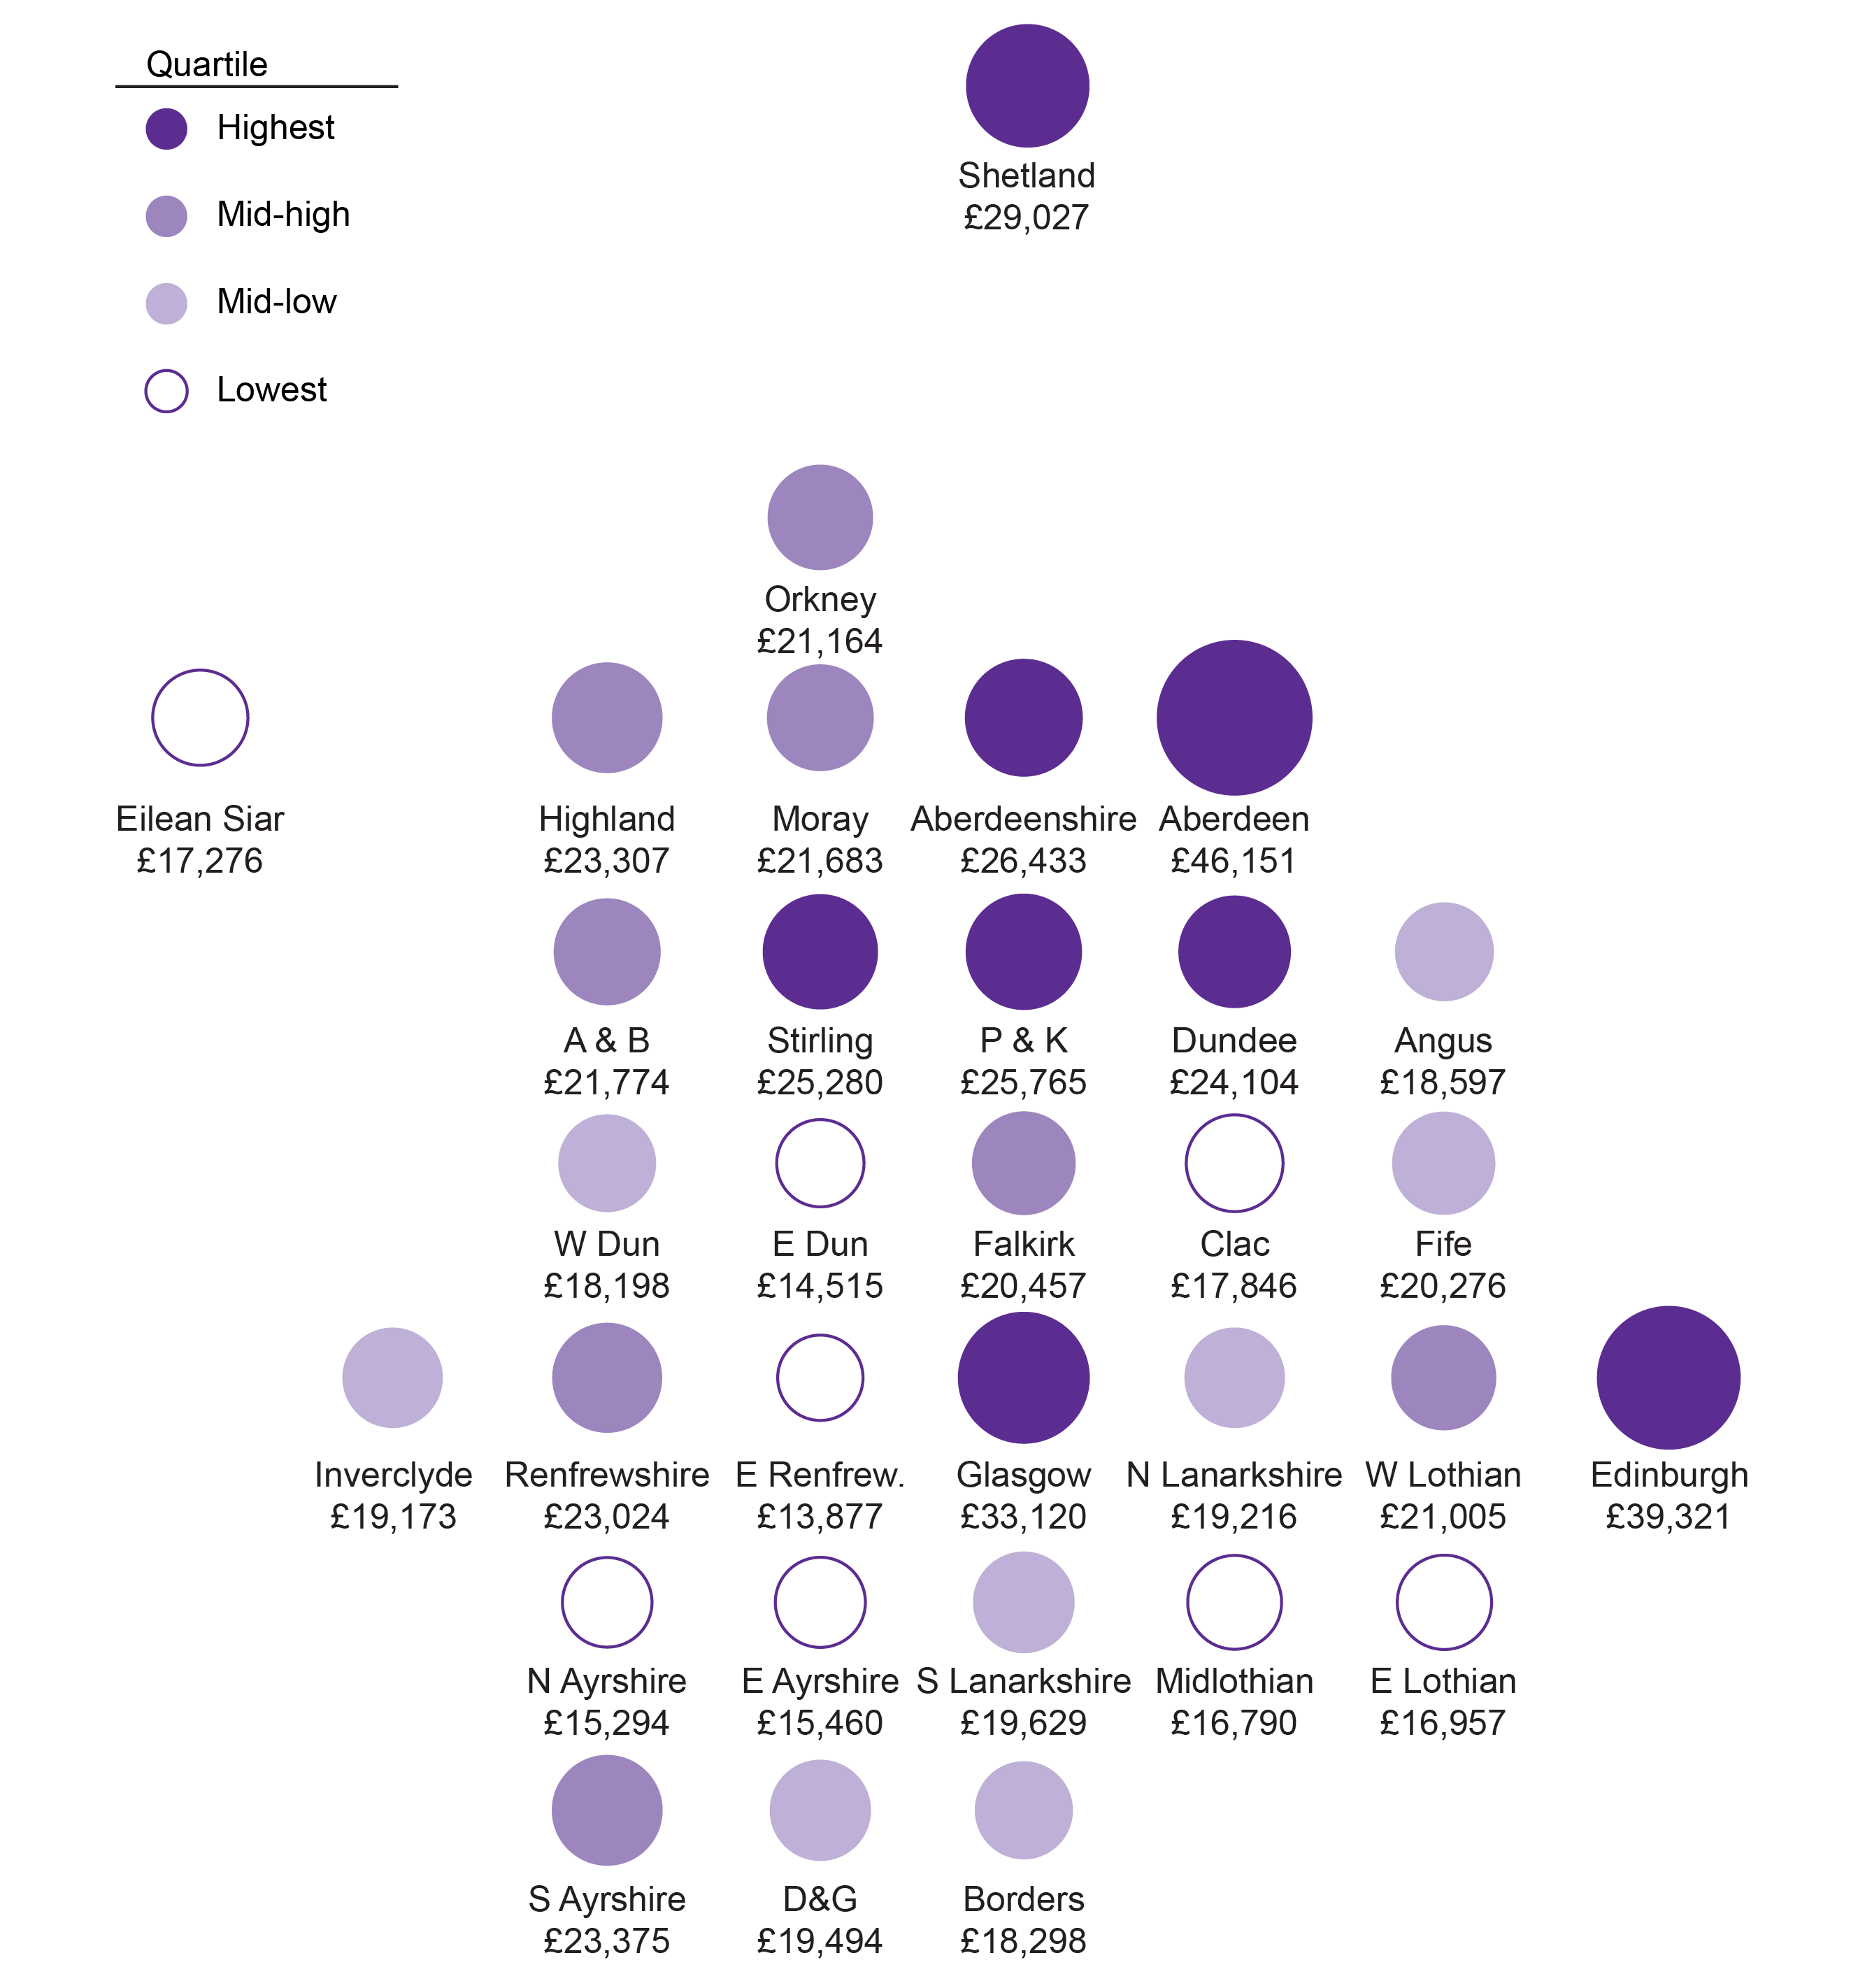
Aberdeen City had the highest GVA per head ratio at £46,151 and East Renfrewshire had the lowest at £13,877. Figure 14 illustrates the range of GVA per head ratios across Scotland's local authorities. In this context, it is important to note that GVA per head relates the value added by production activity in a region to the resident population of that region, and it can therefore be subject to distortion due to the effects of commuting and variations in the age distribution of the population. This is particularly true in small geographies such as local authorities, which can be subject to very large distortions.
Source: Office for National Statistics. (2017, December 20). Regional gross value added (balanced), UK: 1998 to 2016. Retrieved from https://www.ons.gov.uk/economy/grossvalueaddedgva/bulletins/regionalgrossvalueaddedbalanceduk/1998to2016 [accessed 2018 January 8]
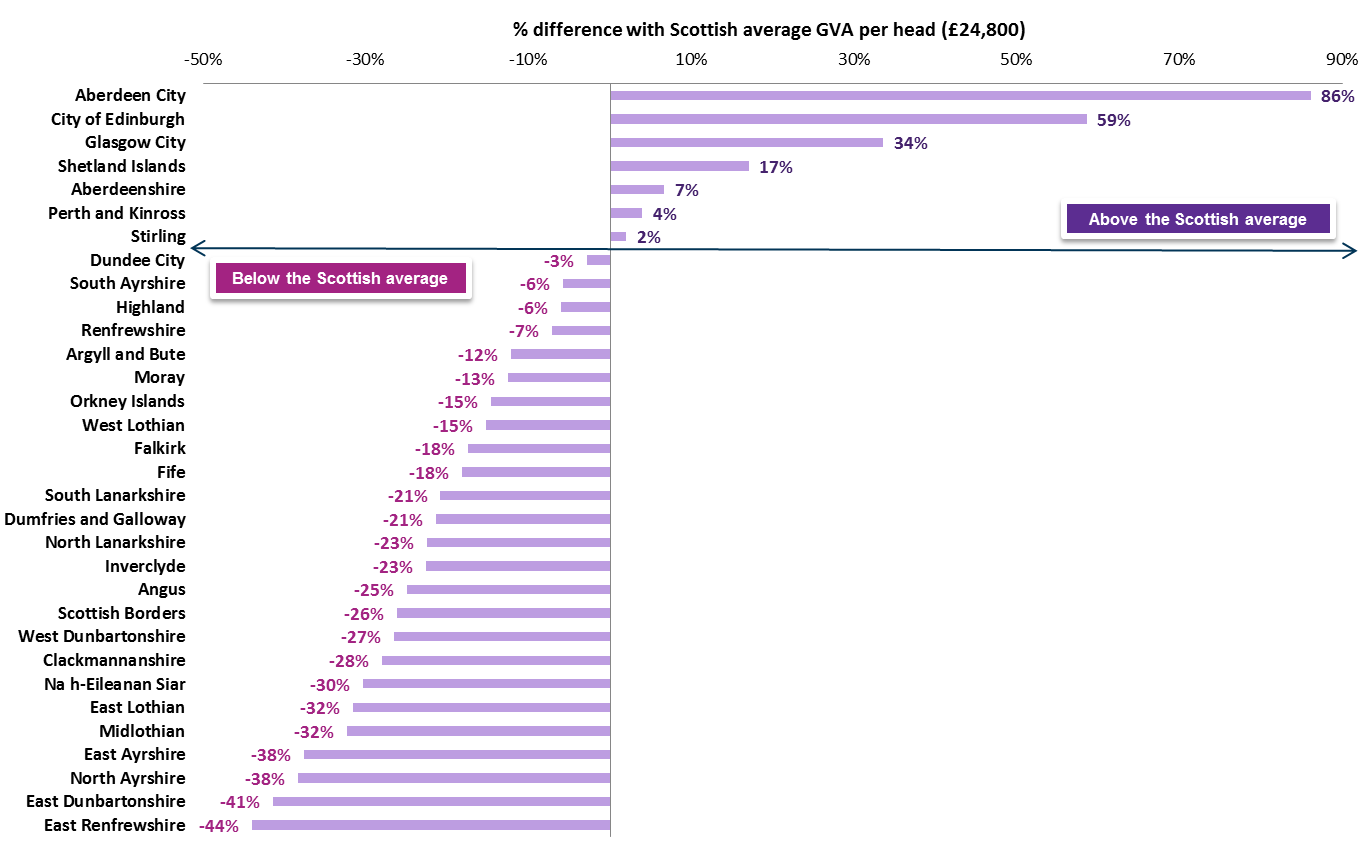
Figure 15 showing local authority GVA per head relative to Scottish average of £24,800, illustrates the above point on distortion due to the effects of commuting. Many of the areas furthest away from the Scottish average contain high levels of commuting outside of the local authority area, such East Renfrewshire, East Dunbartonshire, Midlothian, and East Lothian.
Source: Office for National Statistics. (2017, December 20). Regional gross value added (balanced), UK: 1998 to 2016. Retrieved from https://www.ons.gov.uk/economy/grossvalueaddedgva/bulletins/regionalgrossvalueaddedbalanceduk/1998to2016 [accessed 2018 January 8]
NUTS 3 level
Table 4 shows economic output for Scotland's NUTS 3 regions at current price estimates. NUTS are the abbreviated form of Nomenclature of territorial units for statistics, and are the geographical levels for subdividing the economic territory of the European Union into regions at three different levels (NUTS 1, 2 and 3 respectively, moving from larger to smaller geographic units).
The top three Scottish NUTS 3 areas for total GVA were Glasgow, Edinburgh, and Aberdeen City and Aberdeenshire. The next largest area was Clackmannanshire and Fife, which was less than half the value of the preceding area of Aberdeen City and Aberdeenshire, illustrating the scale of divergence.
At a NUTS 3 level, Edinburgh had the highest level of GVA per head at £39,320, and East Ayrshire and North Ayrshire mainland the lowest at £15,380. GVA per head in Edinburgh was 49% above the UK average. The majority of NUTS 3 regions (all but four) in Scotland had GVA per head rates below the UK average - see Table 4.
In the year to 2016, Falkirk (6.5%), Angus and Dundee City (4.8%), South Ayrshire (4.6%), and East Lothian & Midlothian (4.3%) had the highest GVA per head growth rates. Eilean Siar (-0.5%) and Aberdeen City and Aberdeenshire (-1.8%) were the only NUTS 3 areas to see a decline.
| Total GVA (£ millions) | GVA per head of population | GVA per head indicies (UK=100) | GVA per head growth % (2015-16) | |
|---|---|---|---|---|
| Aberdeen City and Aberdeenshire | 17,538 | 35,644 | 135.3 | -1.8 |
| Angus and Dundee City | 5,741 | 21,681 | 82.3 | 4.8 |
| Caithness & Sutherland and Ross & Cromarty | 1,875 | 19,956 | 75.8 | 3.4 |
| Clackmannanshire and Fife | 8,425 | 19,980 | 75.9 | 3.9 |
| Dumfries & Galloway | 2,915 | 19,494 | 74 | 3.3 |
| East Ayrshire and North Ayrshire mainland | 3,878 | 15,376 | 58.4 | 1.7 |
| East Dunbartonshire, West Dunbartonshire and Helensburgh & Lomond | 3,661 | 16,359 | 62.1 | 1.5 |
| East Lothian and Midlothian | 3,253 | 16,880 | 64.1 | 4.3 |
| Edinburgh, City of | 19,942 | 39,321 | 149.3 | 2.9 |
| Eilean Siar | 465 | 17,276 | 65.6 | -0.5 |
| Falkirk | 3,260 | 20,457 | 77.7 | 6.5 |
| Glasgow City | 20,371 | 33,060 | 125.5 | 2 |
| Inverclyde, East Renfrewshire and Renfrewshire | 6,870 | 19,691 | 74.8 | 4 |
| Inverness & Nairn and Moray, Badenoch & Strathspey | 4,943 | 24,237 | 92 | 3.7 |
| Lochaber, Skye & Lochalsh, Arran & Cumbrae and Argyll & Bute | 2,258 | 22,690 | 86.1 | 3.7 |
| North Lanarkshire | 6,522 | 19,279 | 73.2 | 1.9 |
| Orkney Islands | 462 | 21,164 | 80.4 | 2.8 |
| Perth & Kinross and Stirling | 6,252 | 25,579 | 97.1 | 3.8 |
| Scottish Borders | 2,096 | 18,298 | 69.5 | 0.7 |
| Shetland Islands | 673 | 29,027 | 110.2 | 0.8 |
| South Ayrshire | 2,629 | 23,375 | 88.7 | 4.6 |
| South Lanarkshire | 6,224 | 19,629 | 74.5 | 2.2 |
| West Lothian | 3,784 | 21,005 | 79.7 | 1.8 |
Source: Office for National Statistics. (2017, December 20). Regional gross value added (balanced), UK: 1998 to 2016. Retrieved from https://www.ons.gov.uk/economy/grossvalueaddedgva/bulletins/regionalgrossvalueaddedbalanceduk/1998to2016 [accessed 2018 January 8]
City region example
Figure 16 illustrates GVA per head for some of the UK's NUTS 3 city areas. The dominance of London is very visible. It shows that Edinburgh and Glasgow rank relatively well in terms of economic output performance for city areas. Edinburgh is highest performing city outside of London in the UK. And Glasgow has output levels in line with Manchester, with the latter just marginally above.
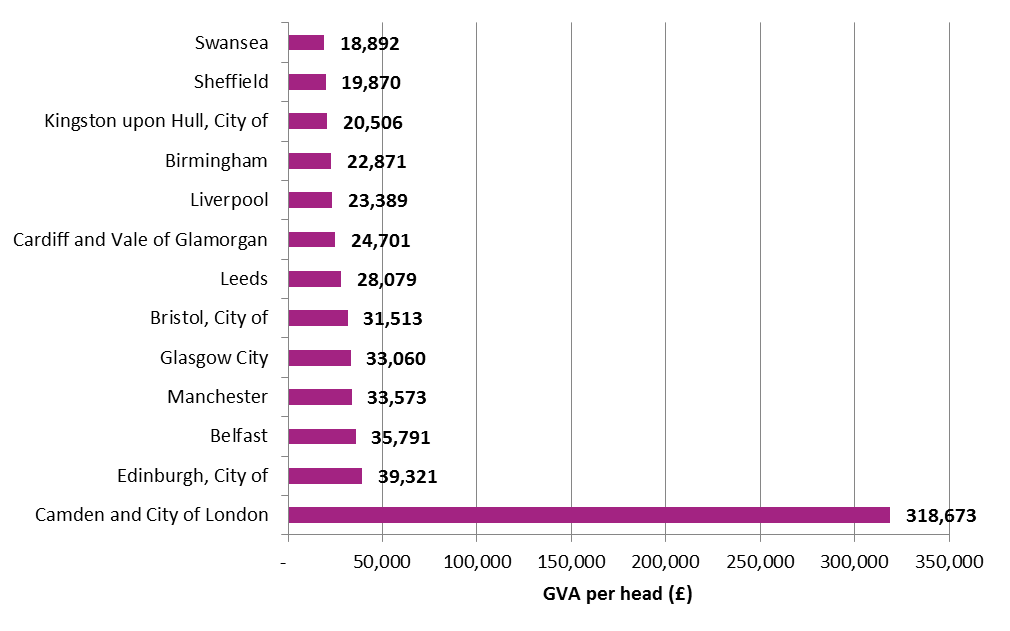
Source:Office for National Statistics. (2017, December 20). Regional gross value added (balanced), UK: 1998 to 2016. Retrieved from https://www.ons.gov.uk/economy/grossvalueaddedgva/bulletins/regionalgrossvalueaddedbalanceduk/1998to2016 [accessed 2018 January 8]
Industry variation by region
In this section, NUTS 3 GVA by those broad sectors where there was a large variation across Scotland's regions is explored. These variations depict some unique characteristics that define local geographies away from national average. The broad sectors with the most regional variations were: production activities, manufacturing, financial and insurance activities, and public administration.
Analysing GVA from the production activities of agriculture, mining, electricity, gas, water and waste by NUTS 3 region. It shows rural areas have a higher intensity of this type of GVA from production activity, reflecting the natural assets of these areas. Almost a fifth (18% of total areas GVA) of GVA on the Shetland Islands came from production activities. Also Aberdeen City and Aberdeenshire (16%), Perth & Kinross and Stirling (16%), and the Orkney Islands (14%) all had a high intensity of GVA from production activities. Those areas with the lowest intensity of GVA from production activities were clustered around the Glasgow region - these were Inverclyde, East Renfrewshire and Renfrewshire (2% of total area GVA), East Dunbartonshire, West Dunbartonshire and Helensburgh & Lomond (2%), and South Ayrshire (3%).
Over a fifth of GVA in both Falkirk and Clackmannanshire & Fife was generated through manufacturing related activities - this was the highest of all NUTS 3 areas in Scotland. South Ayrshire (18% of total area GVA), Inverness & Nairn and Moray, Badenoch & Strathspey (18%), Caithness & Sutherland and Ross & Cromarty (16%), and Angus and Dundee City (14%) all depended on manufacturing activities to generate a signifiant proportion of the respective area's economic value. Edinburgh's economy had the lowest intensity of manufacturing GVA across Scotland, at just 3% of the total Edinburgh GVA.
There were significantly high levels of GVA generated by financial and insurance activities in Edinburgh relative to elsewhere in Scotland. Just over a fifth of the capital's economic value added came from financial and insurance activities. Glasgow is a distant second with financial and insurance activities representing 9% of its GVA. On average the sector represented two percent of GVA elsewhere in Scotland.
The intensity of the GVA contribution of public administration; education; and health activities varied across Scotland's regions. It made up 29% of economic value added in both Eilean Siar and Angust & Dundee City, where as it was only half this proportion in both Aberdeen City & Aberdeenshire and Caithness & Sutherland, Ross & Cromarty.
Components of GVA
This section looks at economic activity for Scotland at current prices estimates by the income components of GVA and industry group insights related to these components.
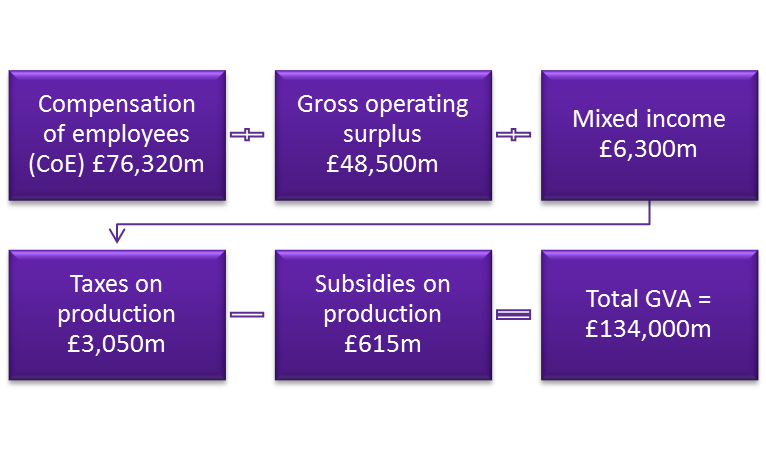
The income components of GVA comprise compensation of employees, plus gross operating surplus, plus mixed income, plus taxes on production, less subsidies on production.
Income components of GVA
Please note totals may differ due to rounding Source: Office for National Statistics. (2017, December 20). Regional gross value added (balanced), UK: 1998 to 2016. Retrieved from https://www.ons.gov.uk/economy/grossvalueaddedgva/bulletins/regionalgrossvalueaddedbalanceduk/1998to2016 [accessed 2018 January 8]
Figure 17 sets out the elements of the income approach to GVA as produced for the balanced GVA approach. There are five key elements as now described, as per ONS terminology.
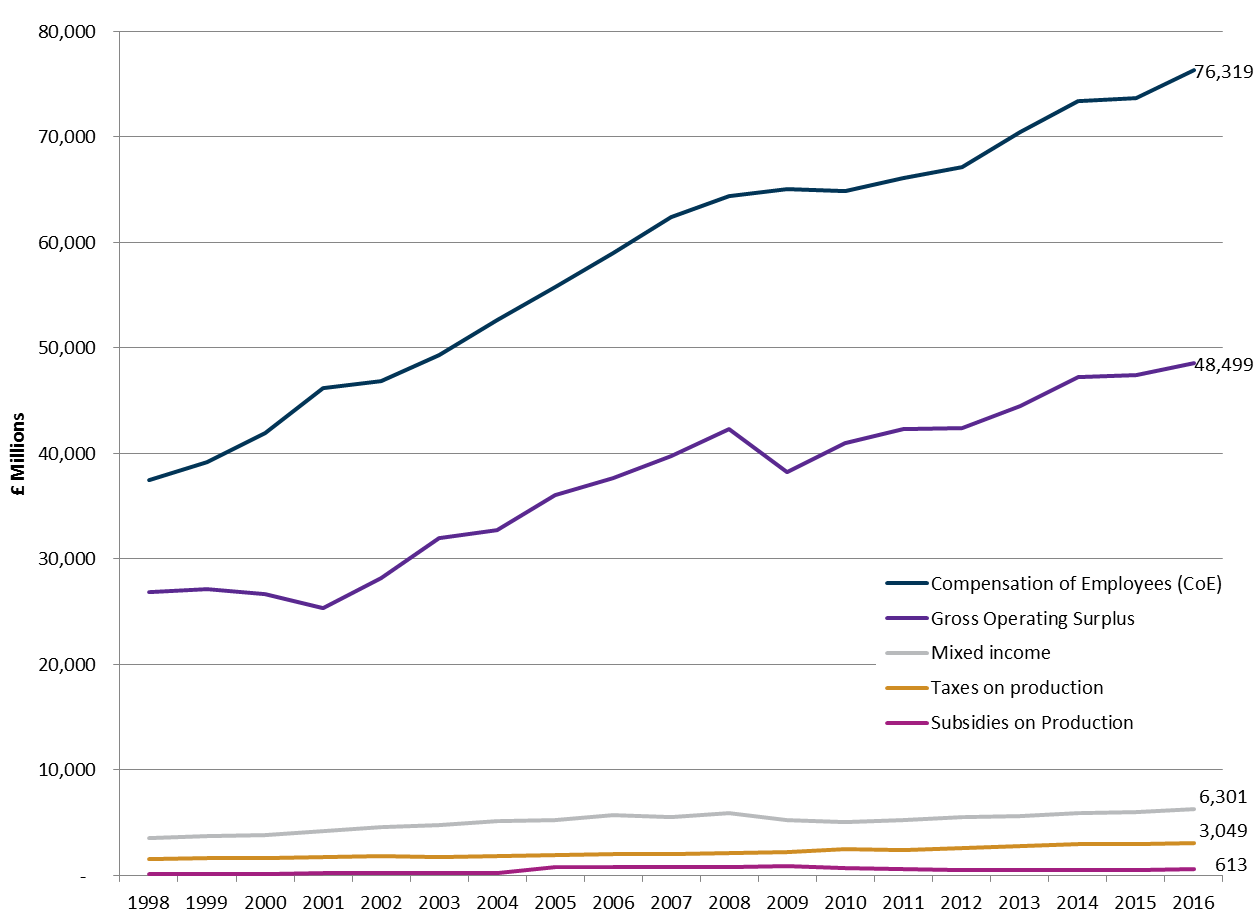
Compensation of employees (CoE) is the largest component of income-based GVA and represents the total remuneration payable to employees in cash or in kind, including the value of social contributions payable by the employer. In 2016, this represented 57% of Scottish GVA at £76,320 million. Figure 18 shows that the value of CoE has grown steadily since 1998 (please note the effects of inflation are not accounted for in Figure 22).
Gross operating surplus comprises gross trading profits and surpluses, plus non-market capital consumption, plus rental income, less holding gains. In 2016, this represented 36% of Scottish GVA at £48,500 million. Figure 18 shows that following a period of steady growth in gross operating surpluses in the early 2000's, there was a dip in 2009 and 2010 reflecting the global financial crisis. Since 2011 there has been fixed but moderate growth. More details on gross operating surplus are discussed below.
Mixed income is the income generated by sole traders (self-employed people not registered as partners). In national accounts their income is considered a mixture of profits and self-paid wages. This represented 5% of total GVA in 2016 at £6,300 million. High proportions of mixed income came from the construction sector (22%), other service activities (15%), wholesale & retail trade (14%), transport (7%), and agriculture (5%) - all sectors with relatively high levels of self-employment. Apart from 2009 and 2010 when mixed income levels dipped, there has been a continued trend of moderate growth.
Taxes on production are compulsory taxes levied by the government or by institutions of the European Union, relating to the production and import of goods and services, the employment of labour, or the ownership or use of land, buildings or other assets in production. They are payable whether or not a profit is made e.g. business rates. This represented 2% of GVA in 2016 at £3,050 million. Approximately a third of taxes on production originated form the wholesale and retail sector, 8% from accommodation and food services, 8% from financial and insurance activities, and 7% from professional, scientific and technical activities.
Subsidies on production are unrequited payments made by general government or the European Union to enterprises. They include subsidies to farmers for land set-aside, as well as government incentives to promote research and development. In 2016, these subsidies totalled £615 million. Over half the subsidies (56%) went to the agriculture, forestry, and fishing sectors. A further fifth of the subsidies went towards real estate activities, and 7% to professional, scientific and technical activities.
Source: Office for National Statistics. (2017, December 20). Regional gross value added (balanced), UK: 1998 to 2016. Retrieved from https://www.ons.gov.uk/economy/grossvalueaddedgva/bulletins/regionalgrossvalueaddedbalanceduk/1998to2016 [accessed 2018 January 8]
Gross operating surplus
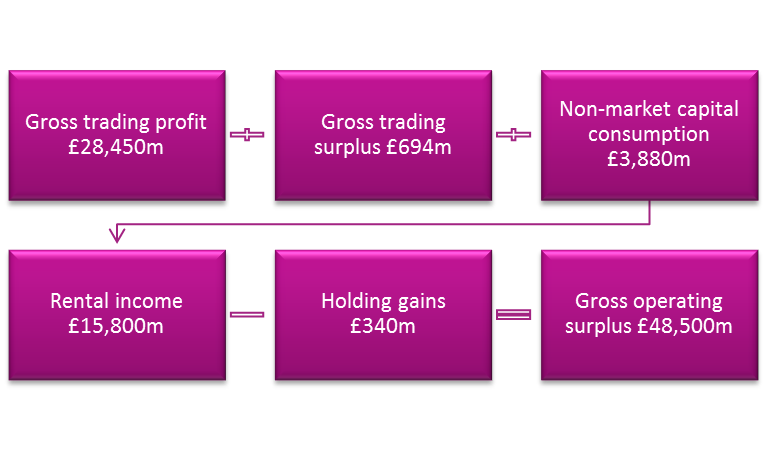
As previously mentioned, gross operating surplus comprises gross trading profits and surpluses, plus non-market capital consumption, plus rental income, less holding gains.
Please note totals may differ due to rounding Source: Office for National Statistics. (2017, December 20). Regional gross value added (balanced), UK: 1998 to 2016. Retrieved from https://www.ons.gov.uk/economy/grossvalueaddedgva/bulletins/regionalgrossvalueaddedbalanceduk/1998to2016 [accessed 2018 January 8]
Here we take a look at the factors that contribute to gross operating surplus.
Gross trading profit is the operating profit of private market entities other than sole traders. It is gross (i.e. with no deduction) of capital consumption. In 2016 at £28,450 million, it made up 57% of total gross operating surplus. The top three sectors that contributed to gross trading profit were wholesale and retail (13%), electricity and gas supply (11%), and professional, scientific and technical activities (10%).
Gross trading surplus is the trading surplus earned by local authorities, central government, public corporations and non-profit institutions serving households (NPISH). It contributed just 1% to total gross operating surplus at £694 million in 2016. Approximately 40% of gross trading surplus was generated in the information and communication sector and a further 26% in the water supply & sewerage sector.
Non-market capital consumption: there are a number of non-market bodies in local and central government, as well as in the NPISH sector, which do not generate a profit or surplus but do consume capital, and this needs to be added back into the accounts. In 2016, this made up 8% of total gross operating surplus at £3,880 million. The majority of this related to public administration (51%), education (33%), and human health activities (10%).
Rental income comprises rental income of local authorities; financial corporations, non-financial corporations; and households and non-profit institutions serving households (NPISH). Rental income makes up about a third of total gross operating surplus. The contribution of rental income to gross operating surplus has declined over the last two decades from a peak of 42% in the early 2000's. The majority of rental income comes from real estate activities which includes imputed rental (88%), then followed by finance and insurance activities (5%), and construction (2%).
Holding gains and losses result from changes in the value of assets and liabilities and occur on all kinds of financial and non-financial assets. In 2016, the level of holding gains was £340 million. The wholesale and retail sector accounted for a large proportion of these at 44%. Other notable sectors were manufacturing of food and beverages at 13% of the total and the construction sector (10%).
Annex A: Data and technical notes
Data sources
The primary data source used in this briefing paper is the ONS's balanced measure of regional gross value added (GVA(B)). Publication of this balanced measure was first introduced in December 2017. These estimates of balanced GVA provide far more detailed industrial breakdown than ever provided before by the ONS. This was made possible by the additional reliability and stability that came from combining the two existing measures (income and production) into a single balanced estimate. All of this extra detail is available in both value and volume terms. It should be noted that the Scottish Government has produced a balanced measure of detailed annual GVA in its Supply & Use (Input-Output) tables for many years.
The ONS Statistical Bulletin states that the balanced GVA estimates have:
been produced using a ground-breaking method. To the best of our knowledge nobody has ever done this before, using weighted quality metrics to inform an automated balancing process. The improvement in the reliability and stability of regional GVA estimates underpins an expansion in the level of industrial detail for which we can provide estimates. As a by-product of this development, we have also improved by one year the timeliness of our provision of “real” GVA indices with the effect of price inflation removed.
The balanced GVA release is currently classed as an Experimental Statistics publication. These are defined in the Code of Practice for Official Statistics as new official statistics undergoing evaluation. They are published in a manner to involve users and stakeholders in their development and to build in quality at an early stage. Prior to the most recent publication of balanced GVA, there were two pre-existing GVA publications.
GVA calculated via the income approach 1is measured at current basic prices, which include the effect of inflation, excluding taxes (less subsidies) on products (for example, Value Added Tax). This involves adding up the income generated by UK resident individuals or corporations in the production of goods and services. It is calculated gross of deductions for consumption of fixed capital, which is the amount of fixed assets used up in the process of production in any period.
GVA calculated via the production approach1, here GVA is measured at both current prices and in chained volume measures (CVM). It is calculated for a given reference period as the total value of all goods and services produced (output), less goods and services used up or transformed in the production process, such as raw materials and other inputs (intermediate consumption).
ONS bulletins for GVA income and GVA production have been discontinued. However, ONS will continue to produce and publish the individual datasets for income and production approaches to allow users access to the data in an unbalanced form.
Other GVA data sources
The Scottish Government produce a range of statistics related to GVA and GDP that are generally used for monitoring the economy in Scotland.
Annual Supply and Use Tables (currently 1998-2014, based on ONS Regional GVA(I) December 2016).
Quarterly National Accounts Scotland (QNAS), current price quarterly and annual estimates of GVA and GDP by all three approaches, consistent with Supply and Use Tables.
Quarterly GDP volume index, estimated as real GVA by industry.
The ONS balanced GVA results used in this paper, particularly for real GVA growth, are quite different to Scottish Government statistics, and this has been noted by some users already (for example see recent Fraser of Allander blog1). The differences appear even more stark when viewed in terms of productivity .
Reasons for differences between Scottish Government and ONS GVA data
The differences between Scottish Government (SG) and ONS statistics on real growth in GVA reflect different methodology approaches and data sources. In current prices (nominal terms) there is generally very little difference between the SG and ONS statistics , meaning that the differences in real growth are reflected in the implied deflators.
SG real GDP statistics are produced using a mostly-bottom-up approach which aims to closely replicate the methods used by ONS for UK quarterly real GDP. This includes a variety of data sources and methods, including both the deflation of nominal growth estimates and the use of direct volume measures. Where deflation is used, in the absence of regional prices SG generally assume that detailed product prices are uniform across the UK. However, where direct volume estimates are used there is no assumption that prices are uniform, and therefore the implied deflators can be quite different between Scotland and the UK. This approach has been established over the last few decades and requires considerable resources to produce for Scotland. Consistent data sources may not be available for all parts of the UK, such as the English regions, although similar statistics are produced for Northern Ireland and Wales.
The ONS Regional Accounts approach is quite different, reflecting the need to produce statistics simultaneously for all parts of the UK. The approach is more top-down in nature, with UK nominal GVA apportioned between the regions – the traditional regional accounts – and then deflated for each industry using UK implied deflators to produce volume estimates.
The ONS regional volume estimates are a relatively new development and are currently classed as experimental statistics. SG statisticians work closely with ONS and are engaged in the ongoing development of the regional accounts. The current differences between the two sets of statistics underlines the importance of these processes.
Source: Adapted from Scottish Government correspondence
Scottish Annual Business Statistics (SABS)2, published by the Scottish Government, is another source of GVA data for the Scottish economy. SABS is based on data from the Annual Business Survey (ABS) (formerly Annual Business Inquiry (ABI)) conducted by the ONS. SABS is produced under partnership procedures agreed between ONS and the Scottish Government.
The GVA measure produced by ABS, and used in SABS, is best described as approximate GVA3 as it is outside of the National Accounts framework. It can be used as an approximation to the ONS's balanced GVA, or in its own right as a measure of business performance. There are differences between the two measures of GVA in terms of coverage. For example, balanced GVA covers the whole of the UK economy, while approximate GVA covers the UK NonFinancial Business Economy, a subset of the whole economy that excludes large parts of agriculture, all of public administration and defence, publicly provided healthcare and education, and the financial sector.
Balanced GVA can be thought of as a 'top-down' approach to estimating regional GVA, starting with the national balanced estimate of GVA and then apportioning down to regions. On the other hand, regional approximate GVA can be thought of as a 'bottom-up approach', starting with survey responses from individual businesses and then aggregating up to regions. This difference in starting position is the fundamental reason both the balanced GVA and approximate GVA will not result in the same answer.
The ONS state3 that:
If the user is interested in activity within the economy as a whole, then ideally [balanced] GVA should be used for analysis. On the other hand, if the primary interest is solely the performance or structure of businesses, then approximate GVA may in fact be the preferred measure.
Methodology and data interpretation notes
Balanced GVA is measured at current basic prices, which include the effect of inflation. For larger geographies, it is also presented in 'real' terms in chained volume measures, with the effect of inflation removed.
GVA per head of population is a useful way of comparing regions of different size and is an important indicator for both domestic and European policy purposes. In the ONS data used in this briefing paper, balanced GVA estimates in millions of pounds sterling (£ million) are divided by the total resident population of a region (including the economically inactive) to give GVA per head in pounds sterling (£). While GVA per head can be a useful way of comparing regions of different size, it is not such a good indicator for those areas with high net in- or out-commuting. This is because it compares a workplace measure of economic output (GVA), which includes the contribution of in-commuters, with a residence-based denominator (population). For such areas it is advisable to refer to ONS sub-regional productivity data for a direct measure of economic performance.
While regional balanced GVA estimates provide an indication of the economic activity happening within regions, they are not an indicator of wealth. For this, ONS produce estimates of regional gross disposable household income (GDHI) to explore wealth trends.
In producing the balanced GVA estimates, the ONS have used the annual growth in turnover between 2015 and 2016, as measured by the Value Added Tax (VAT) administrative data that they receive from HM Revenue and Customs (HMRC), to project forward one year from the survey-based estimates for 2015. Turnover is a reasonable proxy for output and is also used in the quarterly measures of UK gross domestic product. This is the first ONS publication to make use of this new HMRC administrative data source1.
To produce the balanced GVA data at a local authority level a simplified methodology process was used, in which seven aggregated components of balanced GVA at NUTS3 are broken down to local authorities according to proportions calculated from a range of regional ONS datasets. It is important to note that in each of the proportion datasets, data were only available at LA level for the latest years. The proportions calculated from these available years are used to apportion the back series. Calculated this way, the time series assumes a lack of change in the regional distribution of LAs within a NUTS3 region. Going forward, each subsequent year will be apportioned using the latest available LA level data.
Sources
Office for National Statistics. (2010, December). Measuring the economic impact of an intervention or investment. Retrieved from <a href="https://www.ons.gov.uk/ons/rel/regional-analysis/measuring-the-economic-impact-of-an-intervention-or-investment/measuring-the-economic-impact-of-an-intervention-or-investment/economic-impact--paper-one.pdf" target="_blank">https://www.ons.gov.uk/ons/rel/regional-analysis/measuring-the-economic-impact-of-an-intervention-or-investment/measuring-the-economic-impact-of-an-intervention-or-investment/economic-impact--paper-one.pdf</a> [accessed 10 January 2018]
Athow, J. (2018, January 25). GDP: a worthwhile, but incomplete, measure. Retrieved from <a href="https://blog.ons.gov.uk/2018/01/25/gdp-a-worthwhile-but-incomplete-measure/" target="_blank">https://blog.ons.gov.uk/2018/01/25/gdp-a-worthwhile-but-incomplete-measure/</a> [accessed 26 January 2018]
The Economist. (2016, April 30). The Trouble with GDP. Retrieved from <a href="https://www.economist.com/news/briefing/21697845-gross-domestic-product-gdp-increasingly-poor-measure-prosperity-it-not-even" target="_blank">https://www.economist.com/news/briefing/21697845-gross-domestic-product-gdp-increasingly-poor-measure-prosperity-it-not-even</a> [accessed 26 January 2018]
Scottish Government. (2015, March 3). Scotland’s Economic Strategy. Retrieved from <a href="https://beta.gov.scot/publications/scotlands-economic-strategy/" target="_blank">https://beta.gov.scot/publications/scotlands-economic-strategy/</a> [accessed 5 February 2018]
Scottish Government. (2007). Scotland Performs. Retrieved from <a href="http://www.gov.scot/About/Performance/scotPerforms" target="_blank">http://www.gov.scot/About/Performance/scotPerforms</a> [accessed 20 October 2017]
Scottish Government. (2011). Government Economic Strategy. Retrieved from <a href="http://www.gov.scot/Publications/2011/09/13091128/0" target="_blank">http://www.gov.scot/Publications/2011/09/13091128/0</a> [accessed 10 November 2017]
Scottish Government. (2007, November). Government Economic Strategy 2007. Retrieved from <a href="http://www.gov.scot/Publications/2007/11/12115041/0" target="_blank">http://www.gov.scot/Publications/2007/11/12115041/0</a> [accessed 8 February 2018]
SPICe. (2015, September 2). Scotland's Economic Strtegy Briefing. Retrieved from <a href="http://www.parliament.scot/ResearchBriefingsAndFactsheets/S4/SB_15-52_Scotlands_Economic_Strategy.pdf" target="_blank">http://www.parliament.scot/ResearchBriefingsAndFactsheets/S4/SB_15-52_Scotlands_Economic_Strategy.pdf</a> [accessed 12 February 2018]
Scottish Govenment. (2007). National Performance Framework (NPF). Retrieved from <a href="http://www.gov.scot/About/Performance/scotPerforms/NPFChanges" target="_blank">http://www.gov.scot/About/Performance/scotPerforms/NPFChanges</a> [accessed 25 October 2017]
Fraser of Allander Institute. (2018, January 25). UK regional performance – an increasingly unbalanced picture?. Retrieved from <a href="https://fraserofallander.org/2018/01/25/uk-regional-performance-an-increasingly-unbalanced-picture/" target="_blank">https://fraserofallander.org/2018/01/25/uk-regional-performance-an-increasingly-unbalanced-picture/</a> [accessed 26 January 2018]
Office for National Statistics. (2017, December 20). Regional gross value added (balanced), UK: 1998 to 2016. Retrieved from <a href="https://www.ons.gov.uk/economy/grossvalueaddedgva/bulletins/regionalgrossvalueaddedbalanceduk/1998to2016" target="_blank">https://www.ons.gov.uk/economy/grossvalueaddedgva/bulletins/regionalgrossvalueaddedbalanceduk/1998to2016</a> [accessed 2018 January 8]
Fraser of Allander. (2018, February 20). Data on Scotland’s economic growth- what’s the difference?. Retrieved from <a href="https://fraserofallander.org/2018/02/20/data-on-scotlands-economic-growth-whats-the-difference/" target="_blank">https://fraserofallander.org/2018/02/20/data-on-scotlands-economic-growth-whats-the-difference/</a> [accessed 20 February 2018]
Office for National Statistics. (2016, March 23). Changes to National Accounts: Imputed Rental. Retrieved from <a href="https://www.ons.gov.uk/economy/nationalaccounts/uksectoraccounts/articles/changestonationalaccounts/imputedrental" target="_blank">https://www.ons.gov.uk/economy/nationalaccounts/uksectoraccounts/articles/changestonationalaccounts/imputedrental</a> [accessed 20 February 2018]
Scottish Government. (2017, August). Scottish Annual Business Statistics (SABS). Retrieved from <a href="http://www.gov.scot/Topics/Statistics/Browse/Business/SABS" target="_blank">http://www.gov.scot/Topics/Statistics/Browse/Business/SABS</a> [accessed 1 February 2018]
Rhodes, C. (2018, January 2). Manufacturing: statistics and policy. Retrieved from <a href="http://researchbriefings.parliament.uk/ResearchBriefing/Summary/SN01942" target="_blank">http://researchbriefings.parliament.uk/ResearchBriefing/Summary/SN01942</a> [accessed 1 February 2018]
Office for National Statistics. (2014, April 24). A Comparison between ABS and National Accounts Measures of Value Added. Retrieved from <a href="http://webarchive.nationalarchives.gov.uk/20160106210631/http://www.ons.gov.uk/ons/rel/abs/annual-business-survey/a-comparison-between-abs-and-national-accounts-measures-of-value-added/index.html" target="_blank">http://webarchive.nationalarchives.gov.uk/20160106210631/http://www.ons.gov.uk/ons/rel/abs/annual-business-survey/a-comparison-between-abs-and-national-accounts-measures-of-value-added/index.html</a> [accessed 10 January 2018]