Disposable Household Income in Scotland 2015
This briefing looks at the Office for National Statistics' publication, Regional Gross Disposable Household Income from 1997 to 2015.
Executive Summary
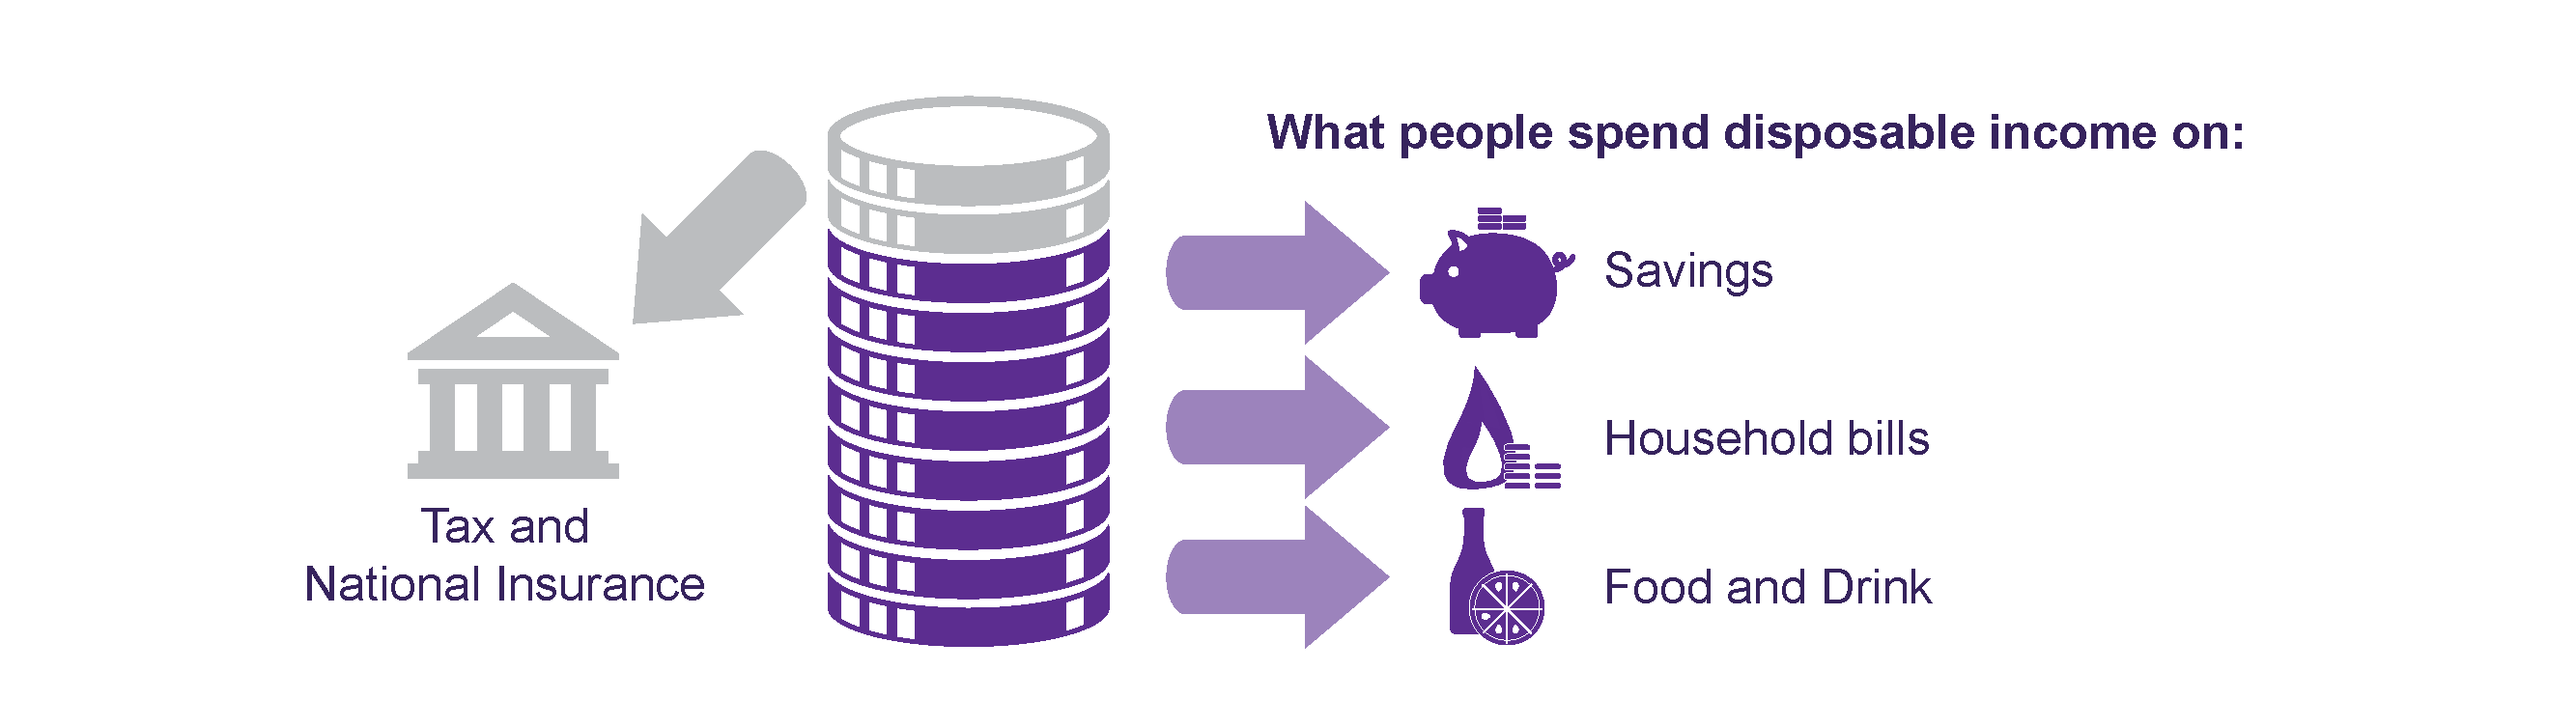
Gross Disposable Household Income (GDHI) is the total amount of money households have available for spending or saving after tax and National Insurance contributions. This is the money individuals have to spend on household bills, food and other items.
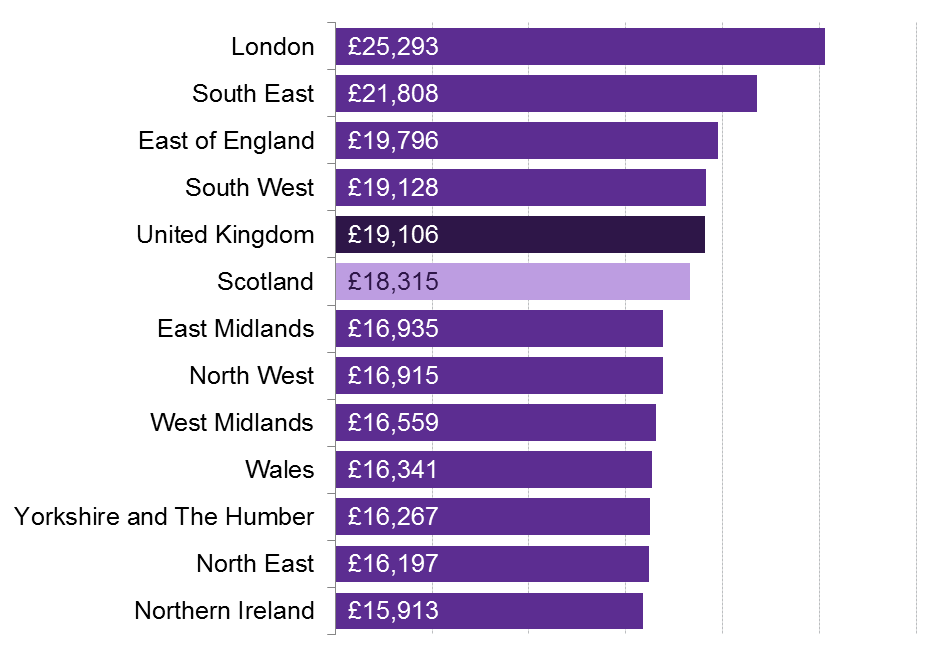
Scotland currently has the fifth highest level of GDHI per person at £18,315, which is just below the UK average of £19,106 per person. Figure 1 outlines some more of the key information from the latest release from the Office for National Statistics (ONS), Regional Gross Disposable Household Income from 1997 to 2015.1
What is Gross Disposable Household Income?
Gross Disposable Household Income (GDHI) is the total amount of money households have available for spending or saving after paying tax and National Insurance contributions and other outgoing such as interest paid on mortgages or loans. This is therefore the money that individuals have to spend on household bills, food and other items.
GDHI is seen to reflect the “material welfare” of the household sector.1
What is disposable income?
Regional Gross Disposable Household Income from 1997 to 2015
This briefing focuses on overall GDHI and the income element. There are two type of income involved in calculating GDHI:
Primary: income from wages and salaries, rental income and interest on savings (private and occupational pensions).
Secondary: mostly made up from social benefits such as state pensions and unemployment allowance. It also includes monetary gifts and insurance pay-outs.
What is the definition of a household?
The GDHI is made up of all households within a region. It includes all individuals living within an area including people in institutions such as retirement homes or prisons.
This briefing provides information on both total GDHI and GDHI per head of population for areas across the UK and Scotland.
What areas are the data available for?
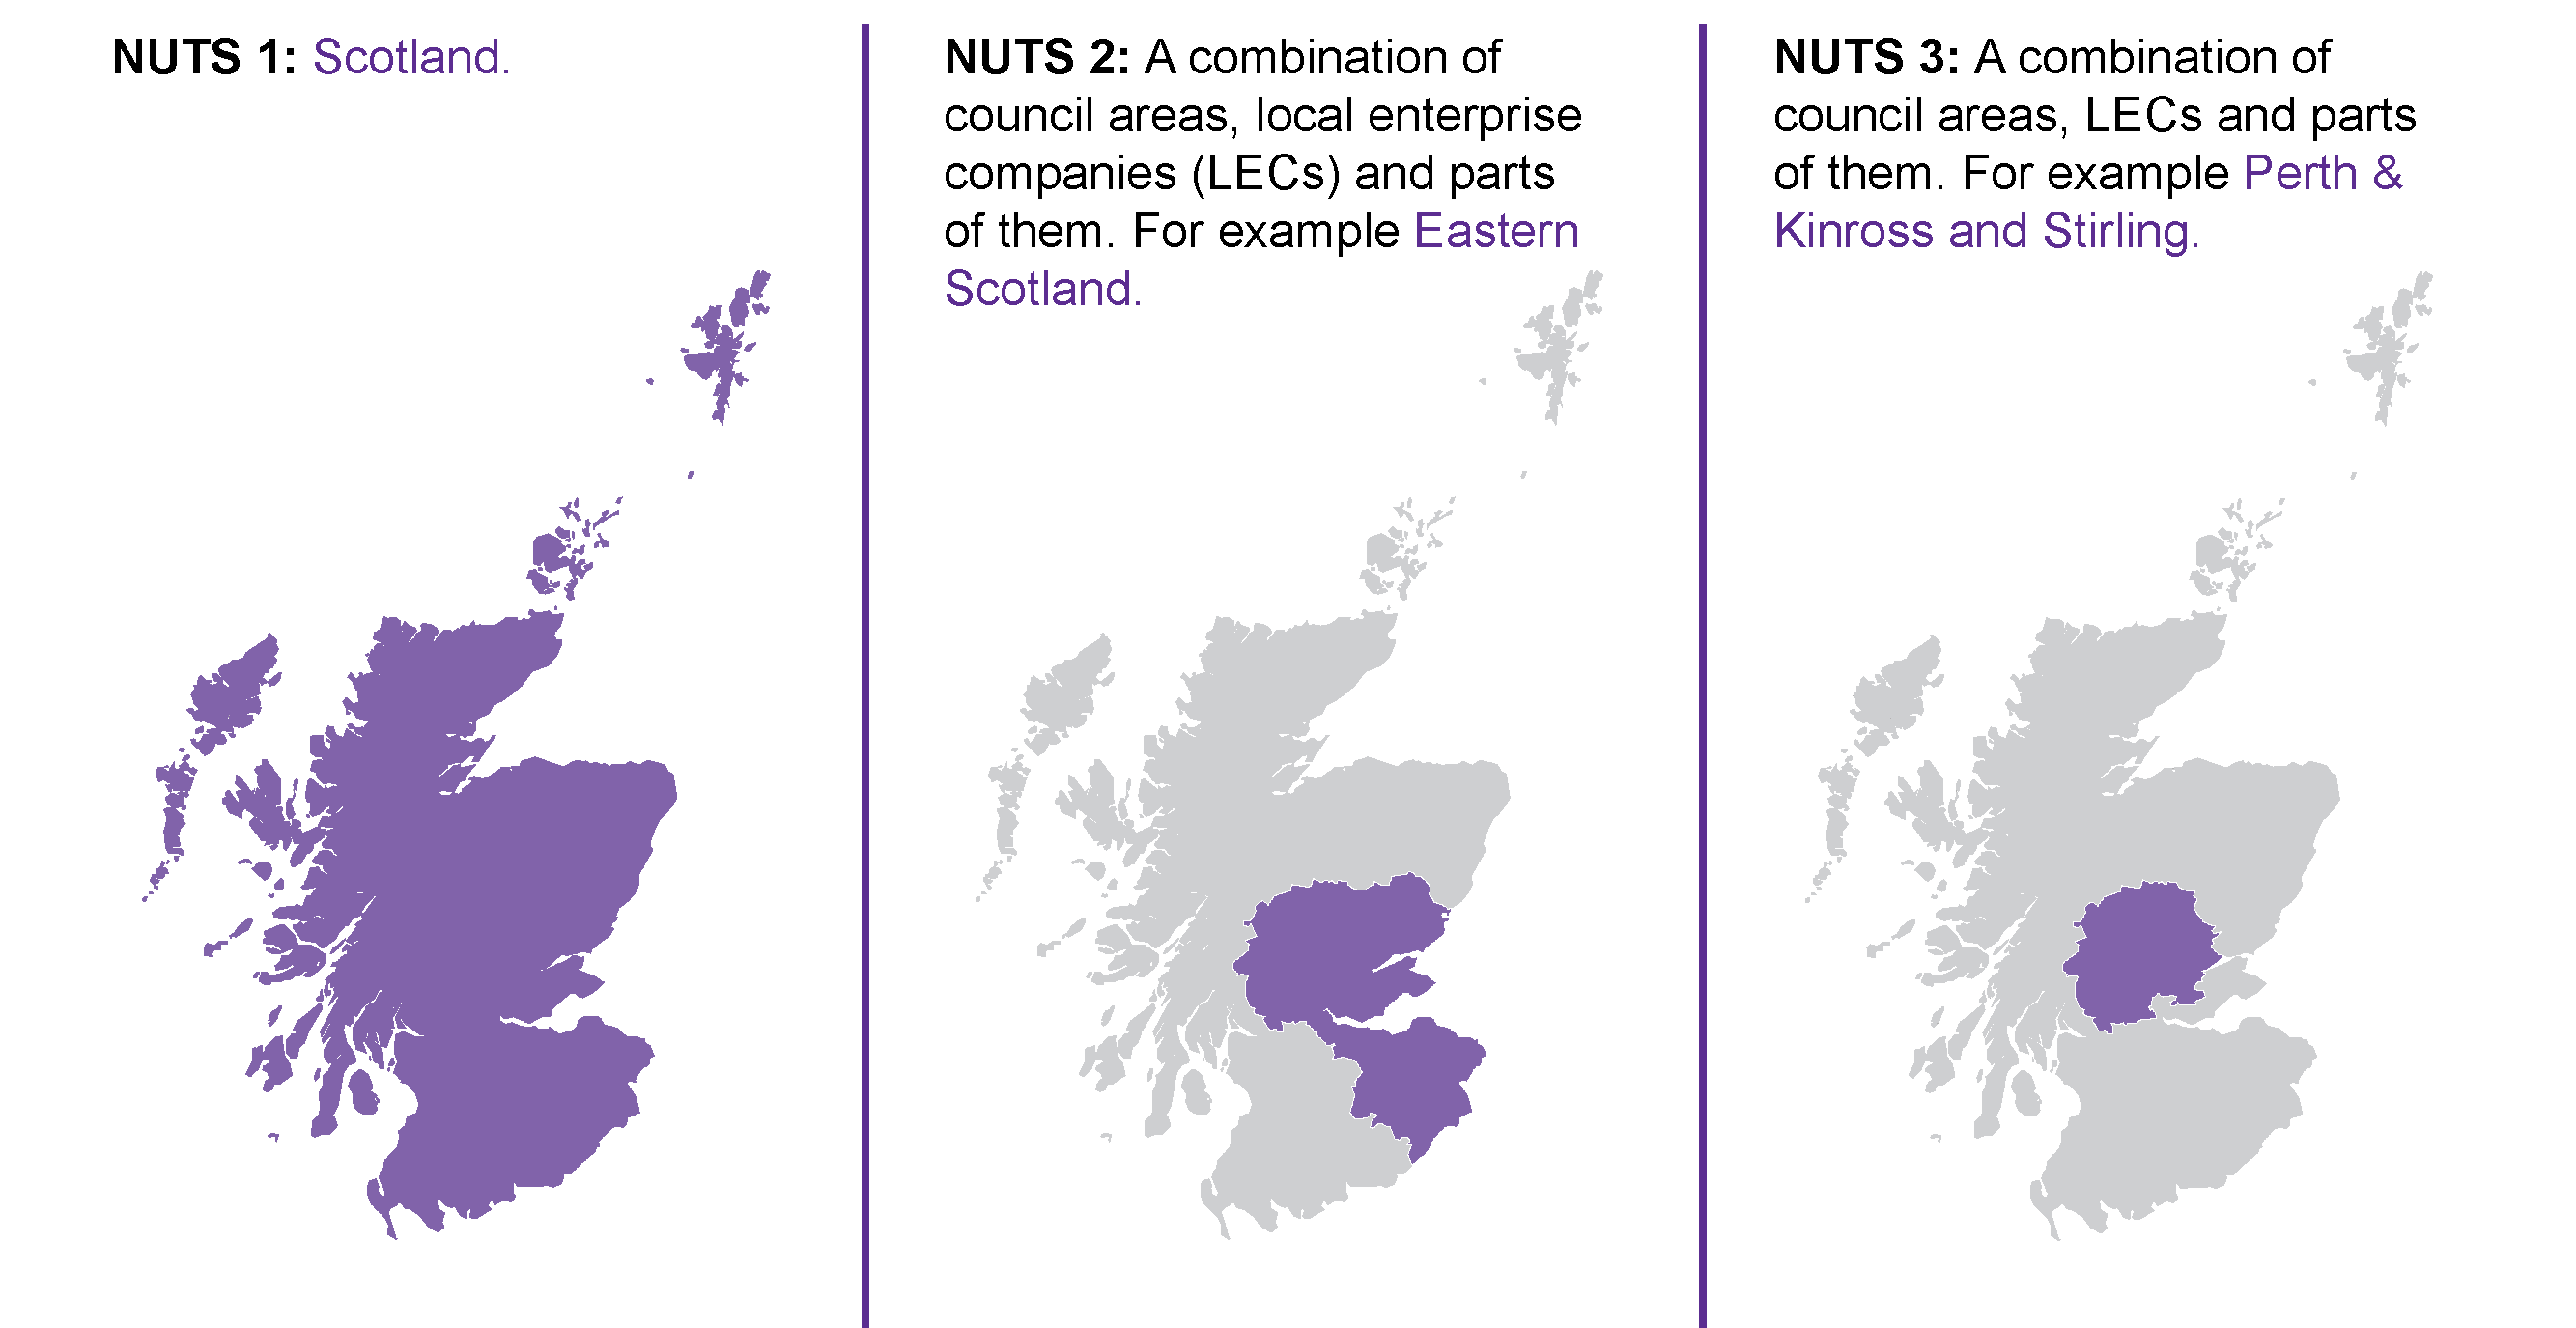
GDHI data is based on estimates of disposable income that are submitted to Eurostat, the statistical office of the EU, as a legal requirement. As a result GDHI is broken down by European Nomenclature of Units for Territorial Statistics (NUTS) regions.
Comparing the data over time
The briefing looks at how GDHI has changed over time. It also provides figures adjusted for inflation to provide real terms figures. These calculations are based on the latest implied deflators for Households and Non-profit institutions serving households (NPISH) expenditure2. As this deflator is for the UK, real terms figures are only provided for NUTS1 regions.
How does disposable income compare across the UK?
In order to provide meaningful comparisons between areas, GDHI is divided by population. Disposable income per person in Scotland is currently £18,315. This is just below the UK figure of £19,106. Scotland has the 5th highest GDHI per person of all UK NUTS1 regions.
Figure 4: GDHI per person across the NUTS1 Regions of the UK - 2015
How has disposable household income changed over time across the UK?
Since 1997 Scotland has seen the second highest increase in GDHI per person, with only London seeing a greater increase. Figure 5 compares the growth in GDHI per person across the NUTS1 regions of the UK.
Figure 5: Growth in GDHI per person across the NUTS1 Regions of the UK between 1997 and 2015
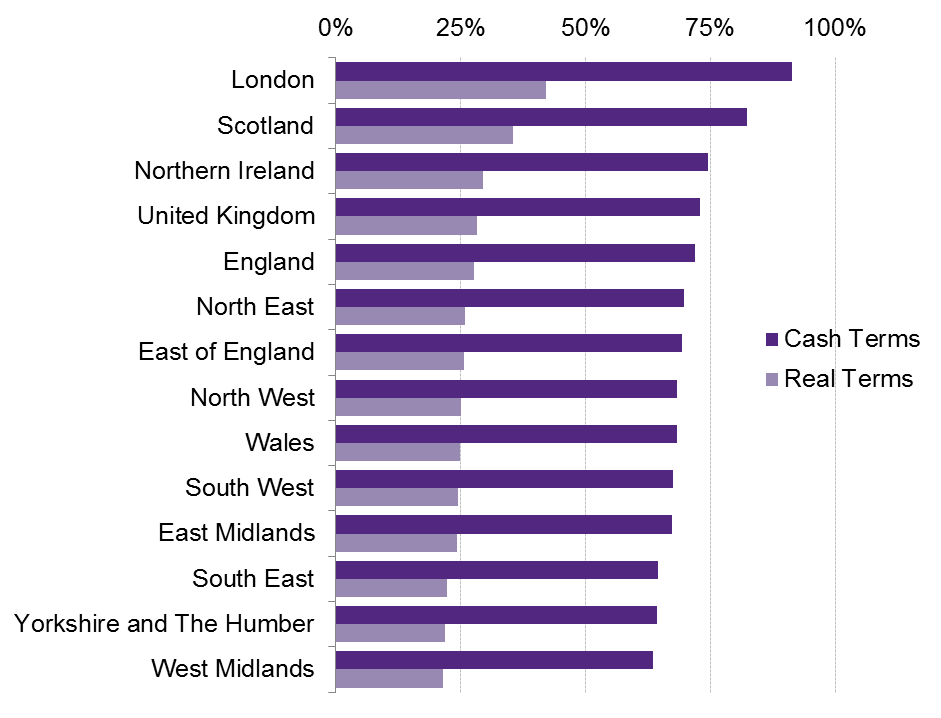
It should be noted that while Scotland has seen the second highest increase in GDHI per person, this can in part be attributed to Scotland's relatively low population growth. Between 1997 and 2015 Scotland saw the third lowest population increase of the NUTS 1 regions of the UK at 5.7%. Total GDHI over the same period increased by 93.8% which was the fourth highest across the UK NUTS1 region (See table 1 in the annex).
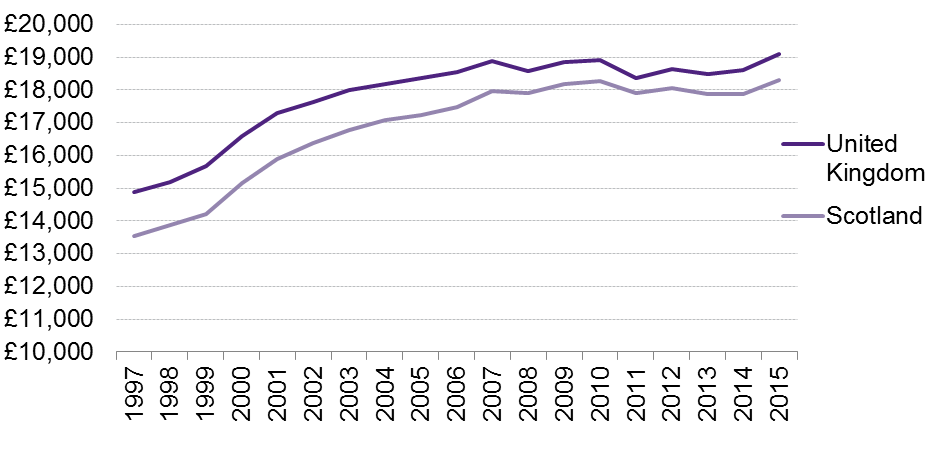
Figure 6 shows how GDHI per person has changed in Scotland and the UK between 1997 and 2015 in real terms. In 1997 GDHI per person in Scotland was 9.2% less than the UK average, but by 2011 the gap was 2.5%. This is because between 1997 and 2011 the growth rate in Scotland was on average +2.0% a year while it was +1.5% for the UK. Since 2011 the gap has increased to 4.1%.
Figure 6: GDHI in real terms for Scotland and the UK - 1997 to 2015
What does the difference between the highest and lowest disposable household incomes look like across the UK?
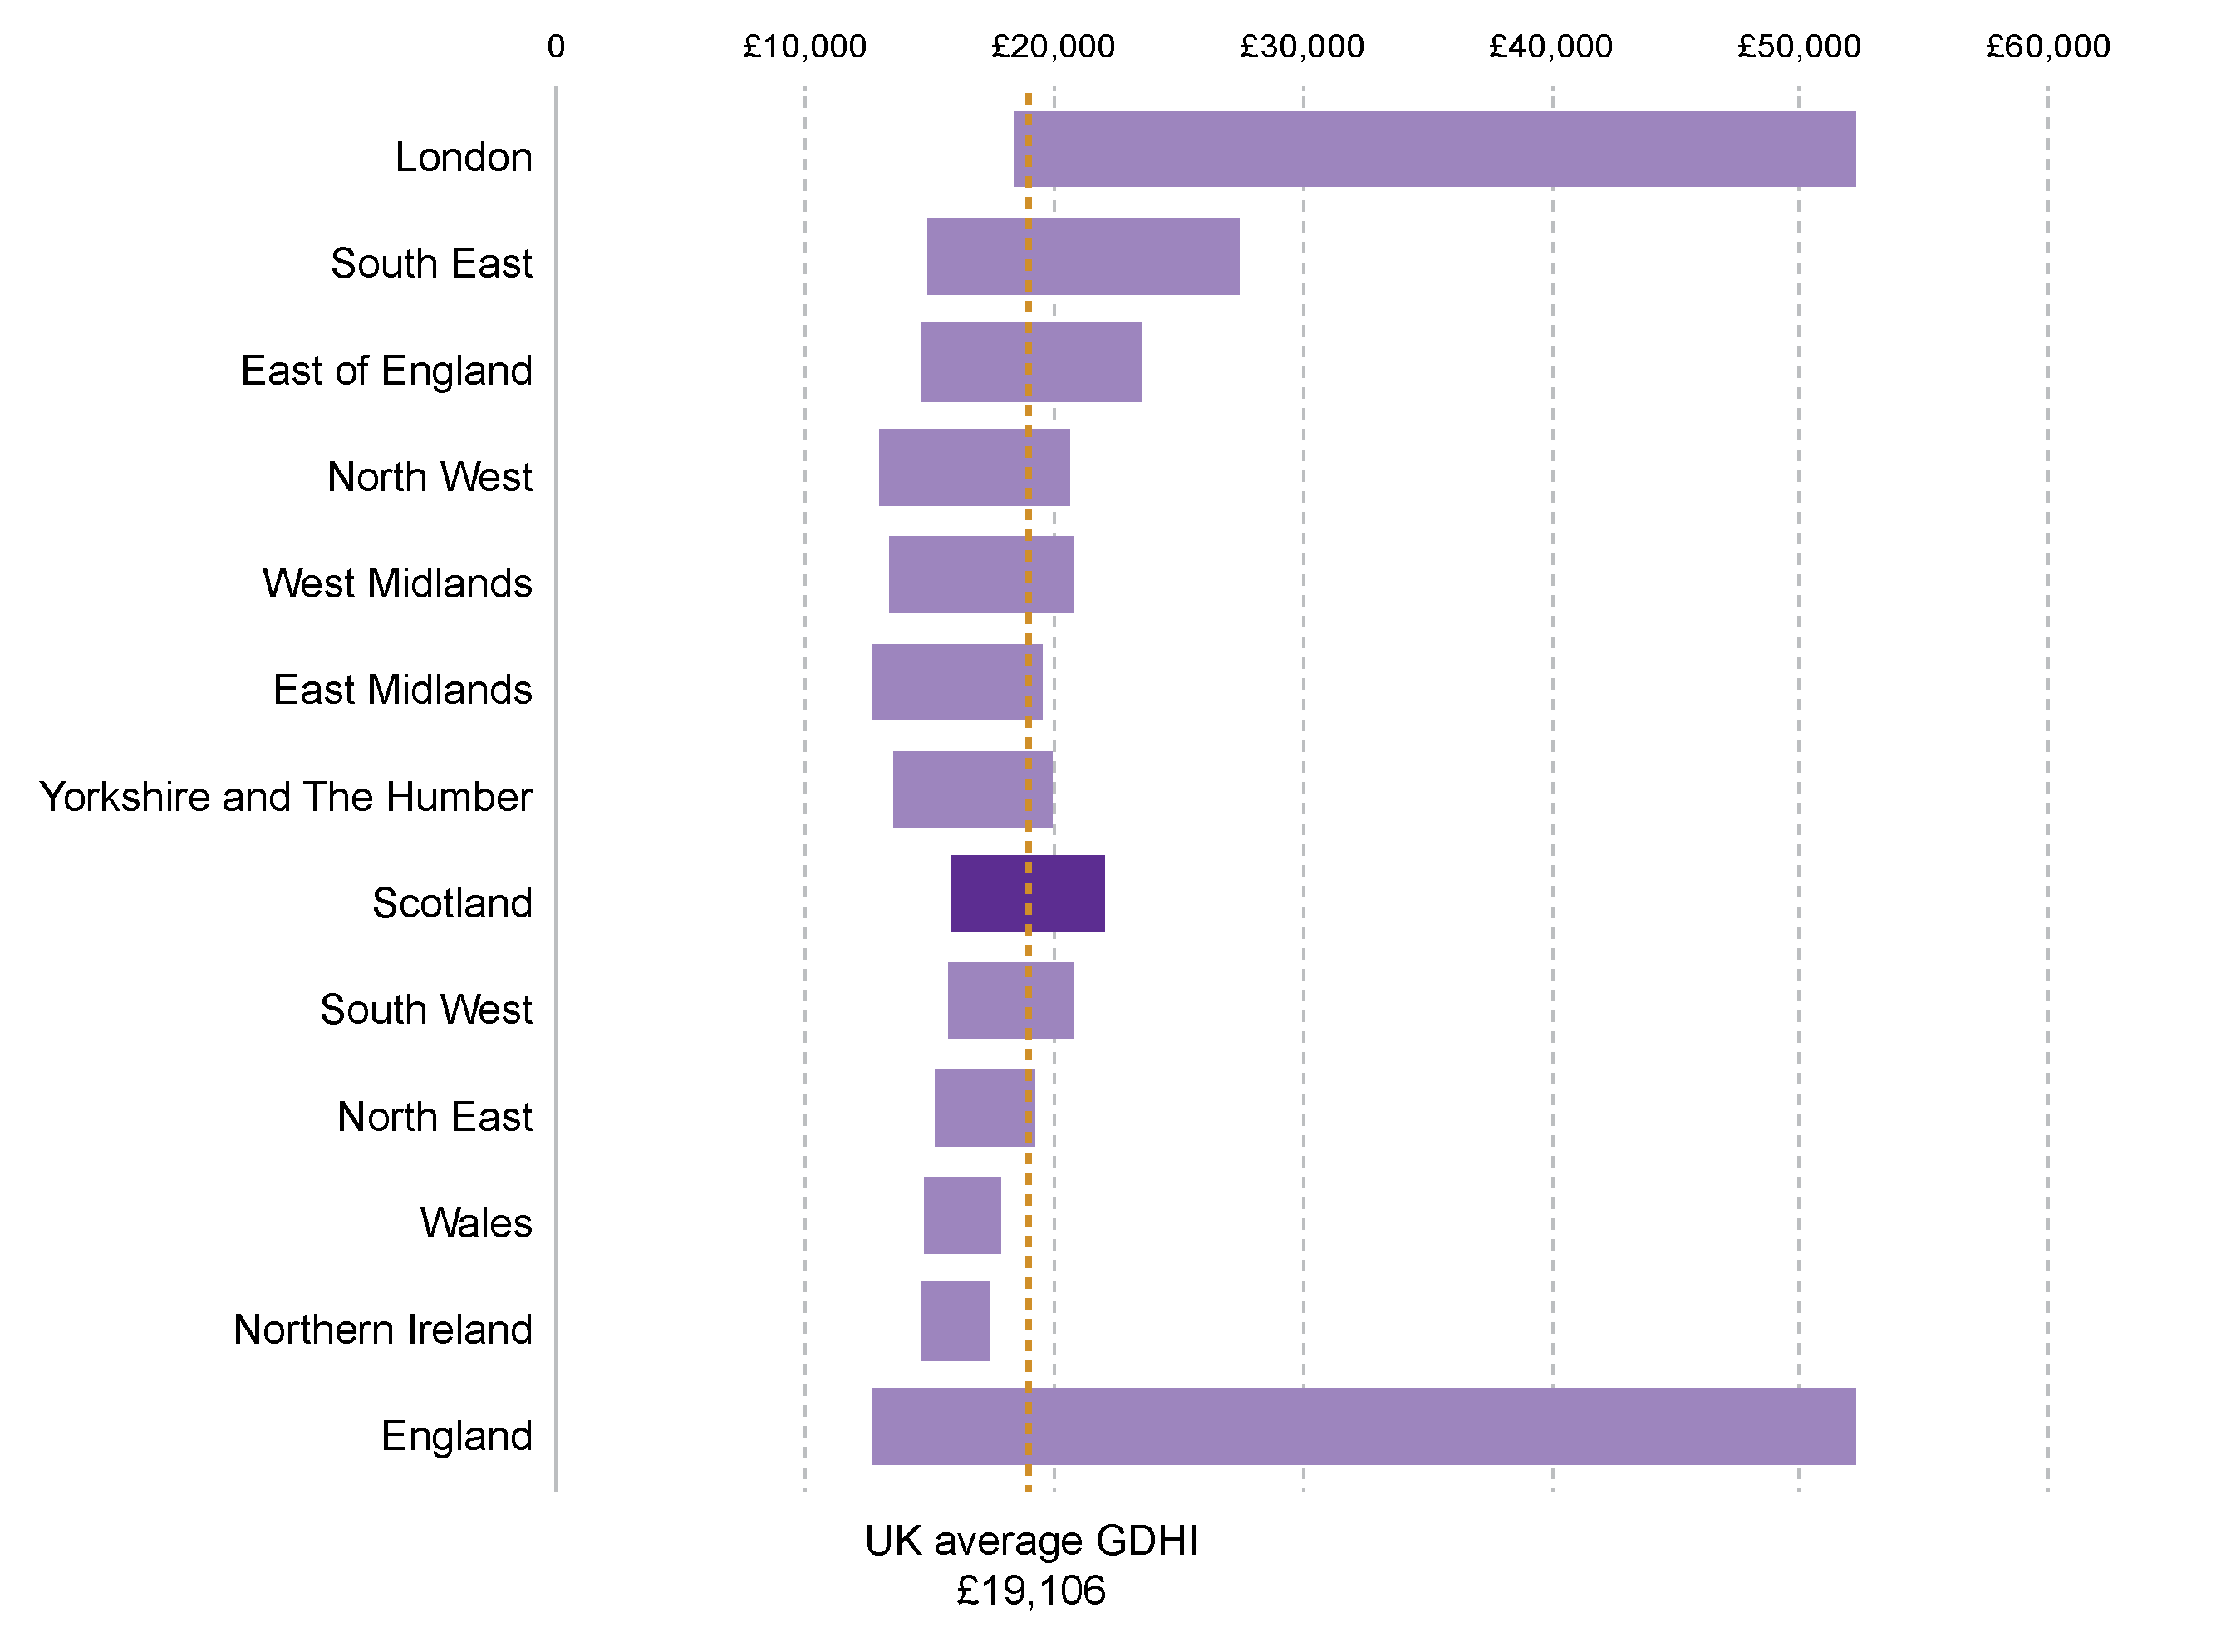
Figure 7 shows the variation in GDHI per head at NUTS3 level within each of the NUTS1 regions of the UK. London has the highest disparity between the highest and lowest GDHI per person in the UK.
Figure 7: Difference between NUTS 3 areas with the highest and lowest levels of GDHI per person by NUTS 1 Region of the UK - 2015
How does disposable income compare across Scotland?
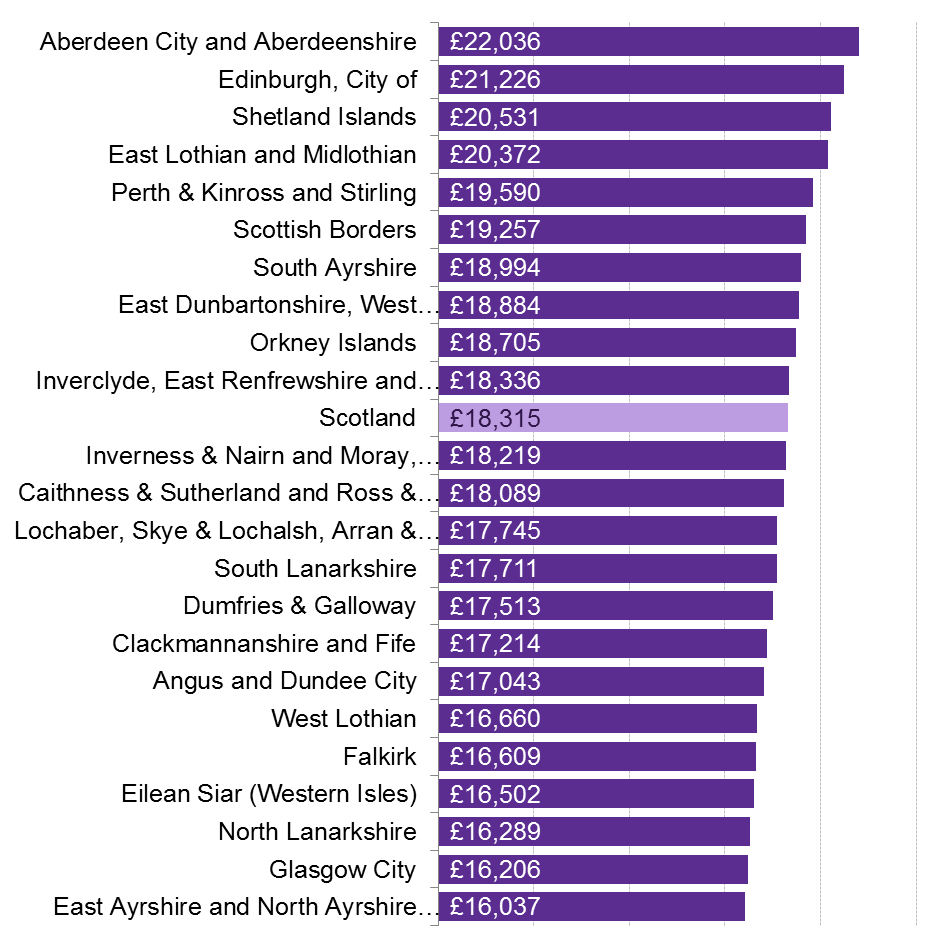
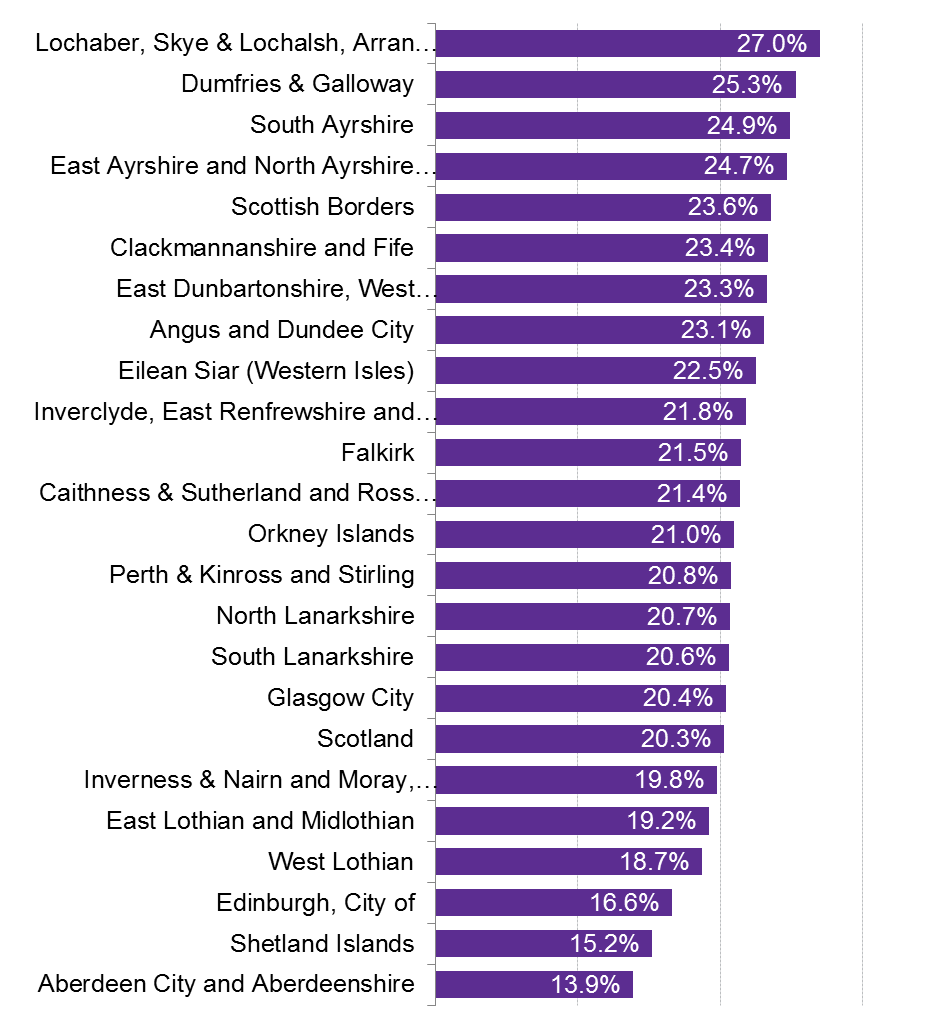
NUTS3 are the smallest NUTS classified areas. The UK has 173 NUTS 3 areas, with 23 in Scotland. Figure 8 shows the level of GDHI per person for each NUTS 3 area across Scotland.
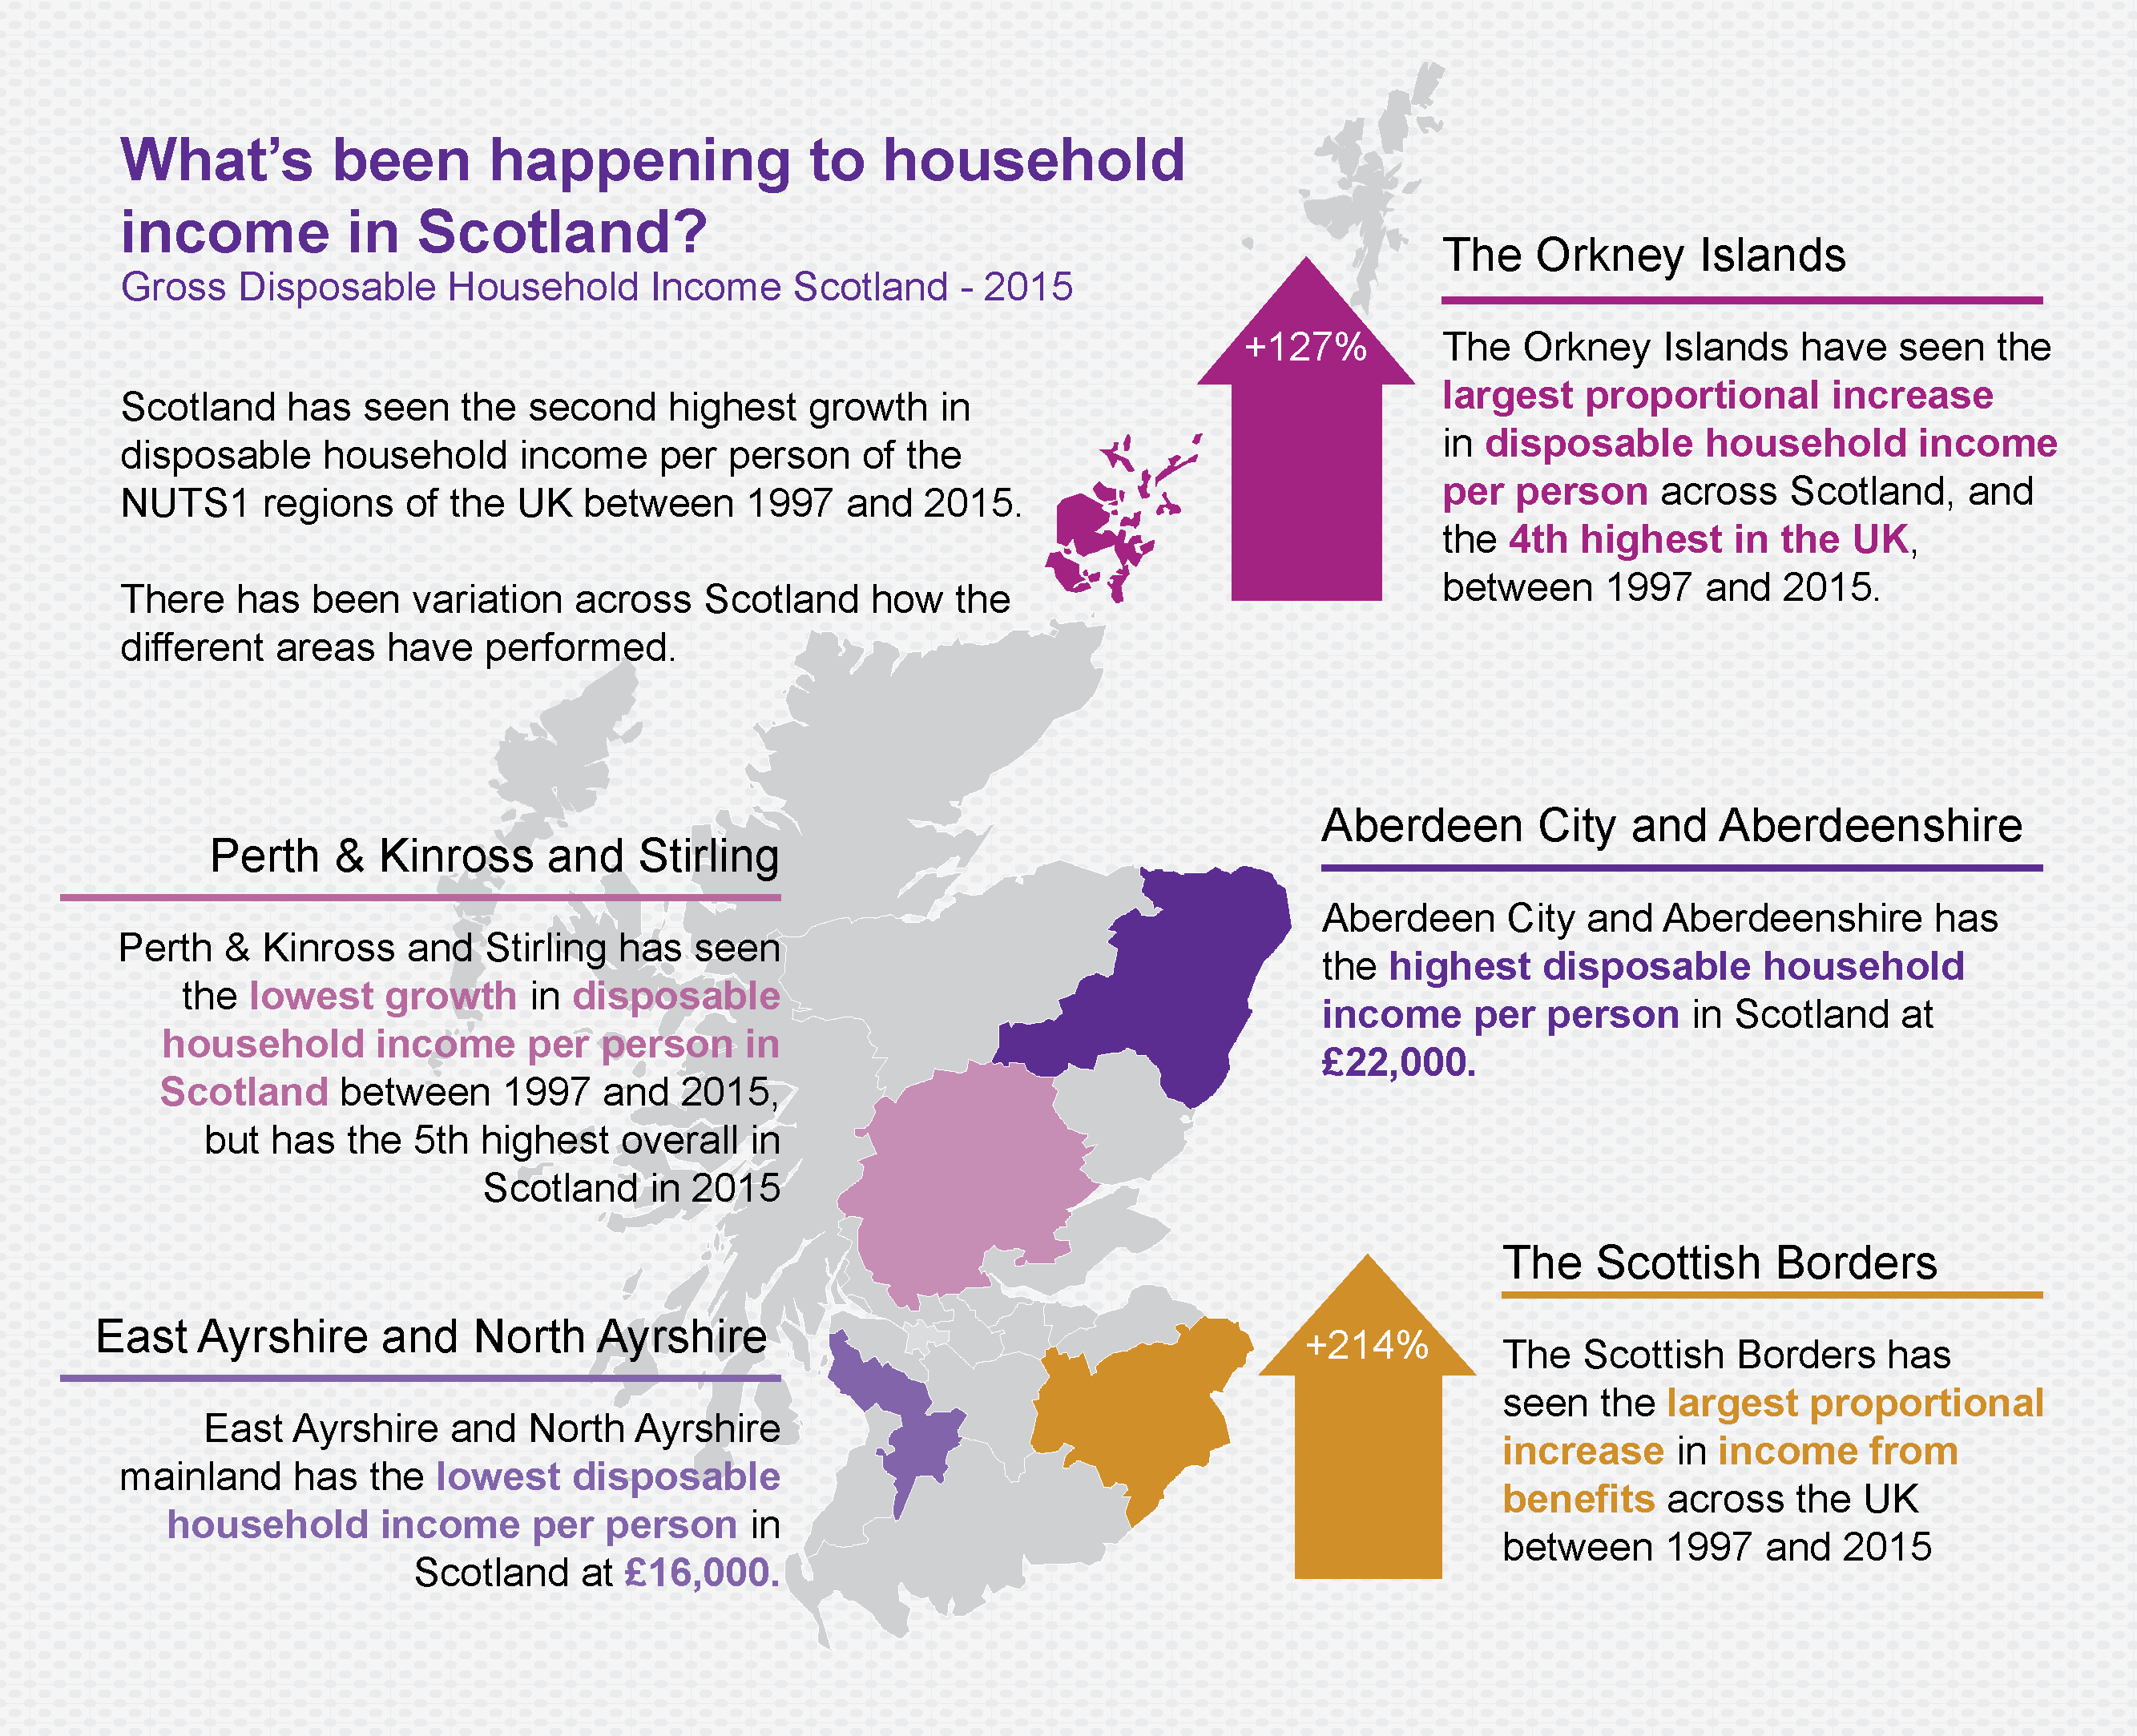
For the third year running Aberdeen and Aberdeenshire has the highest GDHI in Scotland. East Ayrshire and North Ayrshire Mainland has replaced Glasgow as the area of Scotland with the lowest GDHI per person. This is because over the year Glasgow, along with the Shetland Islands, saw the highest increase in GDHI per person in Scotland while East Ayrshire and North Ayrshire Mainland saw no growth.
Aberdeen City and Aberdeenshire and Edinburgh were the only Scottish areas in the UK's top 30 areas for the highest levels of GDHI per person in 2015.
Figure 8: GDHI per person across the NUTS3 Regions of Scotland - 2015
How has disposable household income changed over time across Scotland?
Scotland has seen the second highest increase in GHDI of the UK NUTS1 regions between 1997 and 2015, with only London seeing higher growth. There has, however, been wide variations across Scotland.
Proportionally Orkney and Shetland have seen the largest increases in disposable household income per person. Perth & Kinross and Stirling and Edinburgh have seen the smallest proportional increases.
The relativity low growth in GDHI per person in Edinburgh can in part be explained by Edinburgh having one of the highest proportional increases in population of the NUTS 3 regions in Scotland, while seeing an average growth in income from wages.
Figure 9: GDHI per person across the NUTS3 Regions of Scotland - 2015
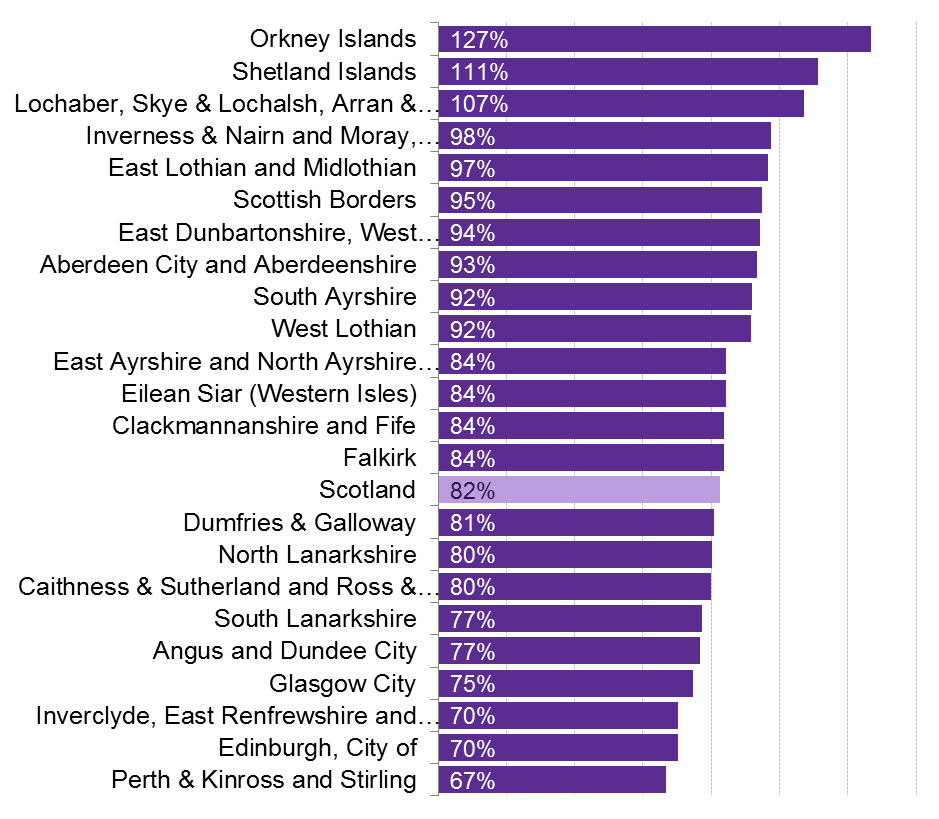
Across the UK as a whole Scotland has two NUTS3 regions in the top 30 for GDHI per person. However when looking at growth since 1997 Scotland has 12 of the top 30 regions with the highest increase in GDHI per person across the UK.
The Orkney Islands have seen the 4th highest increase in GDHI per person in the UK with only Hackney and Newham, Wandsworth, and Camden and City of London seeing higher proportional increases.
How does primary household income compare across the UK?
This section looks at the four components of primary income:
Rental income - income from people renting out properties. (ONS definition - Operating Surplus)
Self-employment - Income earned through self-employment (ONS definition - Mixed Income)
Wages - Income earned through employment (ONS definition - Compensation of Employees )
Financial Assets - income from interest, dividends, property income attributed to insurance policyholders and rent on land. (ONS definition - Property income)
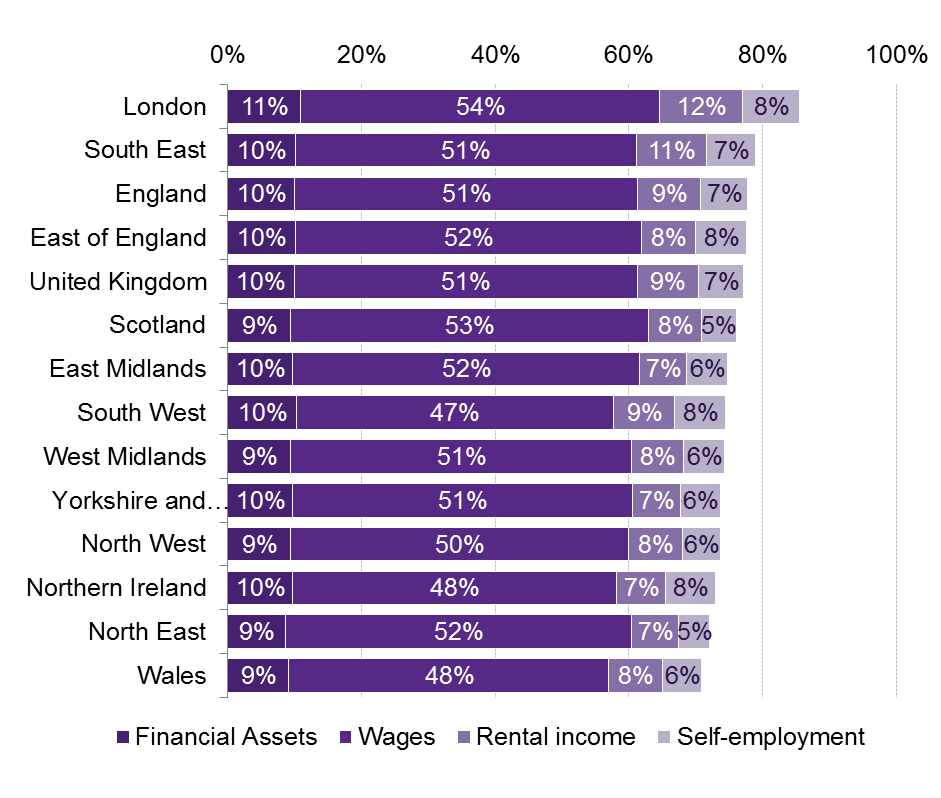
76% of total income in Scotland comes from primary sources, just below the UK average of 77%. Figure 10 shows what proportion of total income comes from primary income sources for each NUTS1 region of the UK.
Scotland has the second highest proportion of income from wages and the second lowest from self-employment.
Figure 10: Proportion of primary income by type for the NUTS1 regions of the UK - 2015
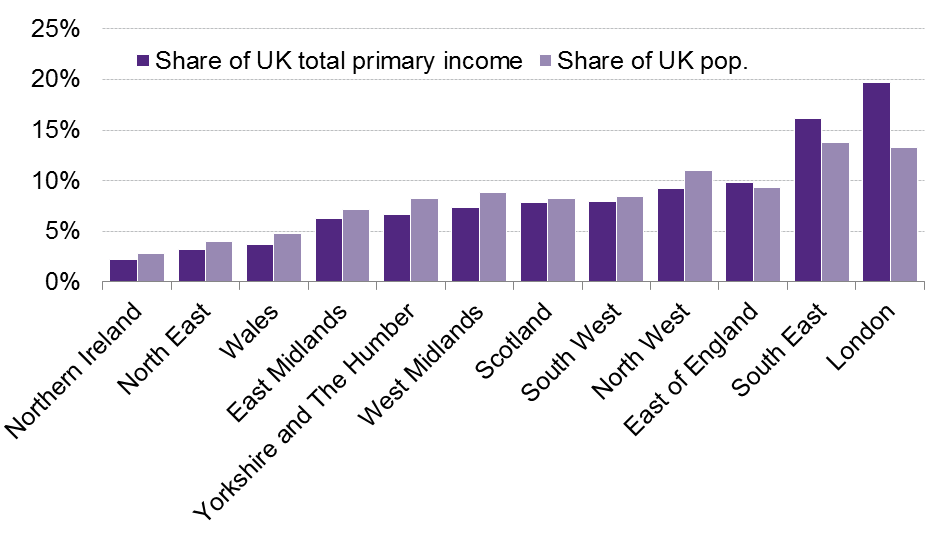
How does share of primary income compare to population share across the UK?
Figure 11 compares total share of the UK's primary income and the share of the total UK population for each NUTS1 region. London and the South East combined contribute 36% of the UK's primary income but only account for 27% of the population. The East of England is the only other region which has a higher share of contribution to primary income than population share.
In 2015 Scotland accounted for 8.4% of the population and 7.9% of primary income.
How does primary income compare across Scotland?
Looking at the figures for total income in Scotland by component it shows that 34% of total primary income is accounted for by Edinburgh, Aberdeen and Aberdeenshire, and Glasgow, while they account for 29% of the population (See table 2 in the annex). Figure 12 shows primary income across Scotland broken down by component.
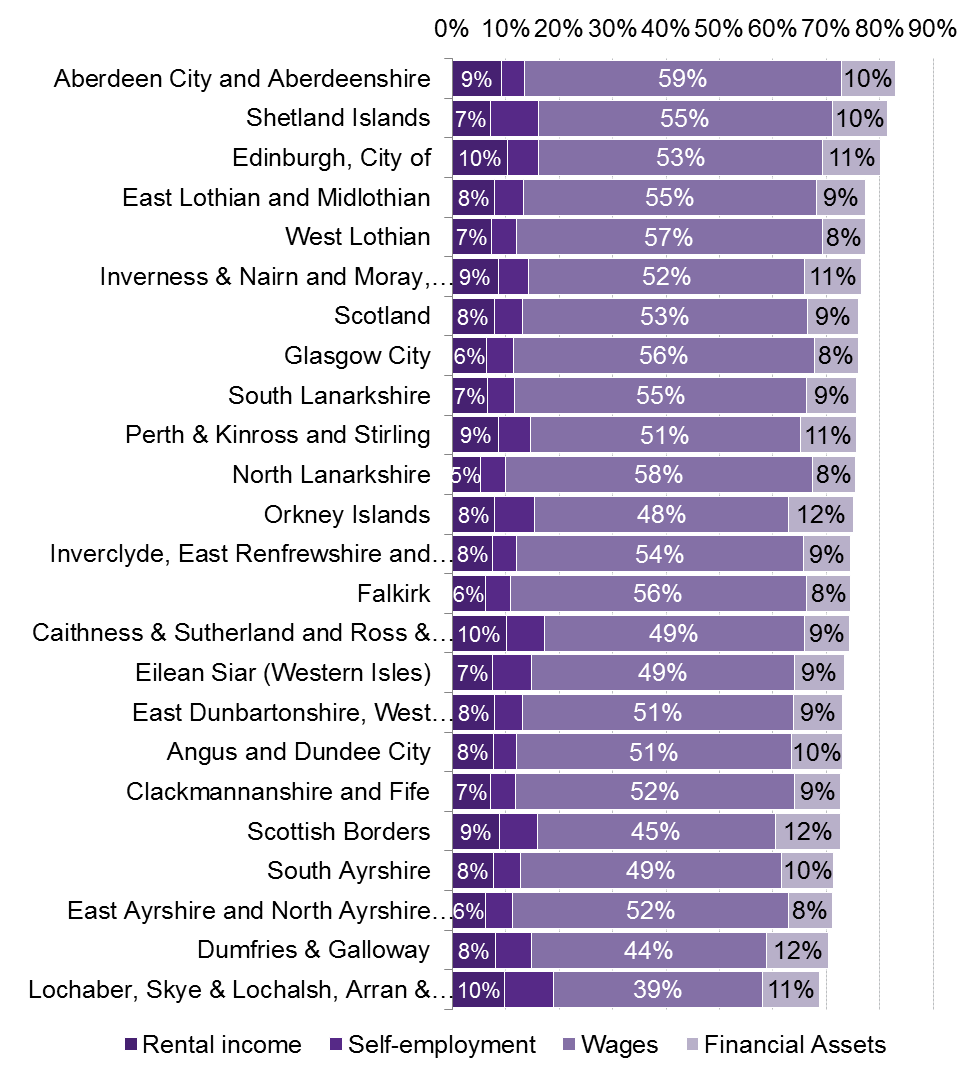
Rental Income:
The areas with the highest proportion of total income from rent are:
Edinburgh
Caithness & Sutherland and Ross & Cromarty
Lochaber, Skye & Lochalsh, Arran & Cumbrae and Argyll & Bute,
In 2015 Edinburgh had the second highest average rental prices for a 2 bedroom flat, the most common type of property in the private rented sector in Scotland.1 Lochaber, Skye & Lochalsh, Arran & Cumbrae and Caithness & Sutherland and Ross & Cromarty have some of the lowest proportional income from wages meaning that rental income makes up a higher proportion.
Self-employment:
Rural areas have higher proportions of income from self-employment. Rural Scotland Key Facts 2015 shows that there are a higher proportion of people who are self employed in remote rural (29%) and accessible rural (21%) areas than in urban areas (13%). This can in part be explained by the higher proportion of people working in the accommodation and food service and agriculture, forestry and fishing industries combined with a significantly higher proportion of small businesses (0-49 employees) in rural areas (56% in remote rural and 47% in accessible rural compared to 24% in urban areas).
Wages
The areas in Scotland which have the highest proportion of income from wages and salaries are the areas which have high levels of outward commuting such as West Lothian, North Lanarkshire and Aberdeenshire.2
Financial Assets:
The areas which have higher proportions of income from ownership of financial assets are the rural areas of Scotland. This can be partly explained by age profile. The Scottish Household Survey in 2015 shows that the 60 and overs are not just likely to have savings but are likely to have higher amounts of savings.
How has primary income changed over time?
Figure 13 shows the change in the real term value of Scotland's primary income by components between 1997 and 2007 and 2007 and 2015.
Figure 13: Change in the value of Scotland's primary income by component in real terms
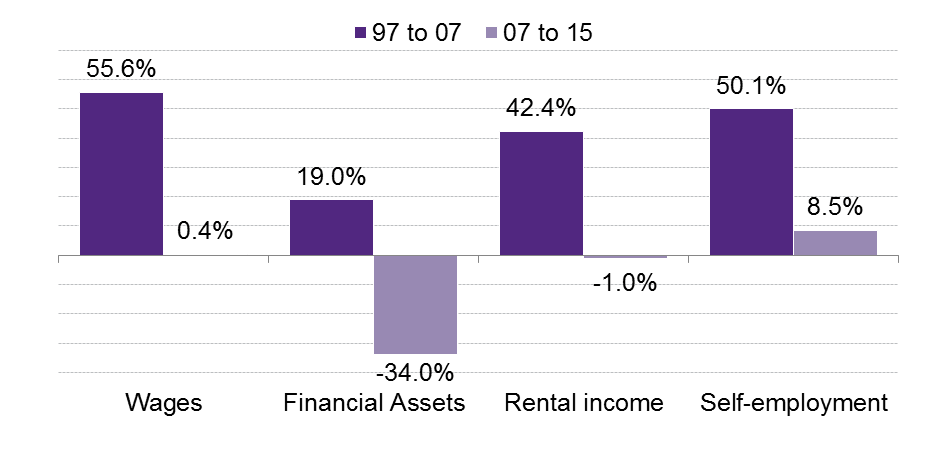
Between 1997 and 2015 primary income in Scotland saw the second highest increases of all the NUTS 1 regions of the UK. However, when figures are adjusted for inflation it shows that total primary income levels in Scotland are currently below 2007 levels.
Total primary income in Scotland grew by 46% in real terms between 1997 and 2007, however since then it has decreased by 5%. Growth in wages income was the major contributor to the growth between 97 and 07, growing by 56%. Since then wages income has increased by only 0.4% in real terms, exceeding 2007 levels in 2015.
Only income from self employment has seen a significant increase since 2007, in real terms. However it has increased at a lower rate than the UK average which increased by 19%
The total value of income from financial assets in UK fell in every region of the UK except London between 1997 and 2015 in real terms. This fall has happened since 2007, with every region seeing a decrease in income from financial assets. Between 1997 and 2007 Scotland saw some of the lowest growth in the value of financial assets with only the South West and North West of England seeing smaller growth in real terms. However since 2007 only the East of England and London has seen smaller proportional decreases in real terms income from financial assets.
How does secondary income compare across the UK?
This section looks at the two components of secondary income:
Benefits-
Social security benefits - for example the state pension, and Jobseeker’s Allowance.
Privately funded benefits - for example private pensions.
Social assistance benefits - for example Child Benefit, War Pensions, Tax Credits and Attendance Allowance.
Other secondary income - Non‐life insurance claims and income from gifts and grants
Figure 14 show how total income from secondary income compares across the UK NUTS1 regions. 20% of household income in Scotland came from benefits in 2015.
Figure 14: Proportion of secondary income by type for the NUTS1 regions of the UK -2015
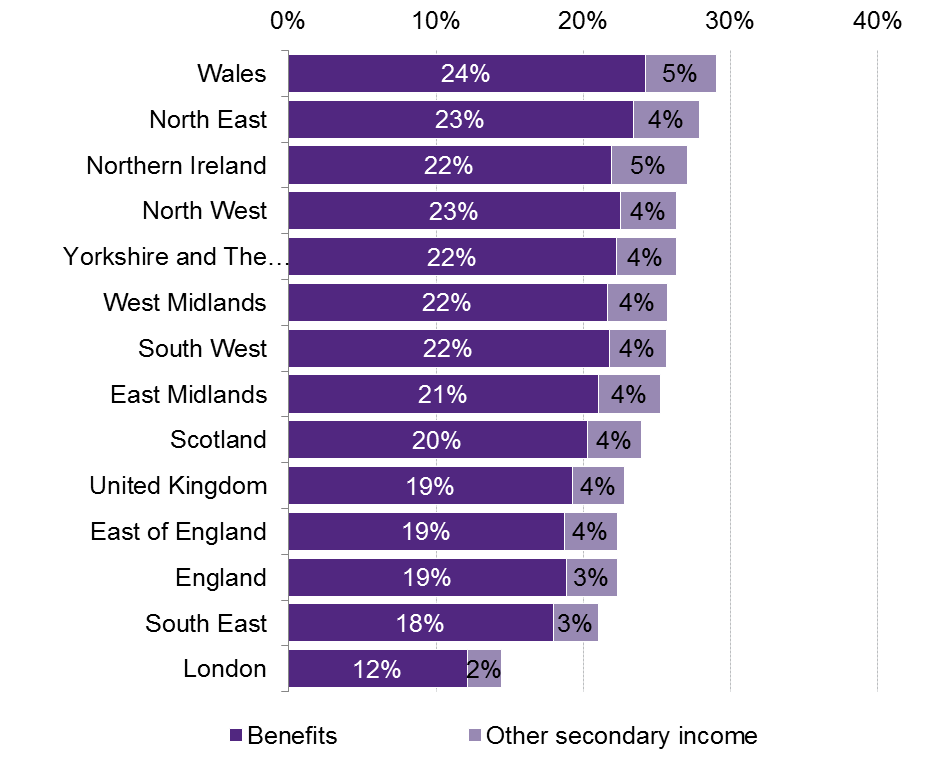
Benefits make up the majority of secondary income. Scotland has the fourth lowest level of income from secondary income. In 2015 Scotland accounted for 8.4% of the total income from benefits while accounting for 8.4% of the UK's population. The South East was the NUTS1 region which accounted for the highest proportion of benefits income in at 14.7% of the UK total while accounting for 13.7% of the population.
How does secondary income compare across Scotland?
Figure 15 show how the proportion of total income from benefits compares across the NUTS3 regions of Scotland.
The areas in Scotland with the highest proportion of income from benefits have the highest proportion of people who are of retirement age. This would suggest that the majority of social benefits in these areas come from pension funds, both private and public.
Since 1997 the Scottish Borders is the area which has seen the largest increase in income from benefits, in both Scotland and the UK. The Scottish Borders has also seen one of the largest increases in the proportion of the population being 65 and over of the NUTS3 regions in Scotland.
Annex
| Population growth | Total GDHI | GDHI per person | |
|---|---|---|---|
| London | 23.6% | 136.8% | 91.5% |
| East of England | 15.4% | 95.3% | 69.2% |
| Northern Ireland | 10.8% | 93.3% | 74.5% |
| Scotland | 5.7% | 92.8% | 82.4% |
| South West | 13.3% | 90.0% | 67.6% |
| East Midlands | 13.5% | 89.9% | 67.3% |
| South East | 13.9% | 87.6% | 64.6% |
| Wales | 7.1% | 80.2% | 68.3% |
| West Midlands | 9.3% | 78.7% | 63.5% |
| Yorkshire and The Humber | 8.7% | 78.6% | 64.3% |
| North West | 5.6% | 77.8% | 68.4% |
| North East | 2.2% | 73.4% | 69.7% |
| Population share (2014) | Share of total primary income | |
|---|---|---|
| Aberdeen City & Aberdeenshire | 9.2% | 12.6% |
| Edinburgh, City of | 9.2% | 11.4% |
| Glasgow City | 11.2% | 10.0% |
| Clackmannanshire and Fife | 7.8% | 6.9% |
| Inverclyde, East Renfrewshire and Renfrewshire | 6.5% | 6.3% |
| South Lanarkshire | 5.9% | 5.7% |
| North Lanarkshire | 6.3% | 5.6% |
| Perth & Kinross and Stirling | 4.5% | 4.8% |
| Angus and Dundee City | 5.0% | 4.4% |
| East Dunbartonshire, West Dunbartonshire and Helensburgh & Lomond | 4.2% | 4.1% |
| East Lothian and Midlothian | 3.5% | 4.0% |
| Inverness & Nairn, Moray and Badenoch & Strathspey | 3.7% | 3.8% |
| East Ayrshire and North Ayrshire mainland | 4.7% | 3.7% |
| West Lothian | 3.3% | 3.1% |
| Falkirk | 2.9% | 2.6% |
| Dumfries & Galloway | 2.8% | 2.3% |
| Scottish Borders | 2.1% | 2.0% |
| South Ayrshire | 2.1% | 2.0% |
| Caithness & Sutherland and Ross & Cromarty | 1.8% | 1.6% |
| Lochaber, Skye & Lochalsh, Arran & Cumbrae and Argyll & Bute | 1.9% | 1.5% |
| Shetland Islands | 0.4% | 0.5% |
| Eilean Siar (Western Isles) | 0.5% | 0.4% |
| Orkney Islands | 0.4% | 0.4% |
Sources
Office for National Statistics. (2017, May 24). Regional gross disposable household income (GDHI): 1997 to 2015. Retrieved from <a href="https://www.ons.gov.uk/economy/regionalaccounts/grossdisposablehouseholdincome/bulletins/regionalgrossdisposablehouseholdincomegdhi/2015" target="_blank">https://www.ons.gov.uk/economy/regionalaccounts/grossdisposablehouseholdincome/bulletins/regionalgrossdisposablehouseholdincomegdhi/2015</a> [accessed May 2017]
Office for National Statistics. (2017, January). Households and NPISH expenditure: Implied deflator: SA. Retrieved from <a href="https://www.ons.gov.uk/economy/grossdomesticproductgdp/timeseries/ybfs/qna" target="_blank">https://www.ons.gov.uk/economy/grossdomesticproductgdp/timeseries/ybfs/qna</a> [accessed July 2017]
Scottish Government. (2016, November 8). Private Sector Rent Statistics, Scotland, 2010 to 2016. Retrieved from <a href="http://www.gov.scot/Publications/2016/11/3295" target="_blank">http://www.gov.scot/Publications/2016/11/3295</a> [accessed 26 July 2017]
Office for National Statistics. (2013). Where do we commute to? Commuting patterns in the United Kingdom, 2011 Census. Retrieved from <a href="http://webarchive.nationalarchives.gov.uk/20151013153922/http://www.neighbourhood.statistics.gov.uk/HTMLDocs/dvc193/index.html#sty=true&flow=flow1&period=0&fix=undefined&view=200,-40,630,635&tr=-193.72886117034767,-92.90627729286877&sc=1.5157165665103982" target="_blank">http://webarchive.nationalarchives.gov.uk/20151013153922/http://www.neighbourhood.statistics.gov.uk/HTMLDocs/dvc193/index.html#sty=true&flow=flow1&period=0&fix=undefined&view=200,-40,630,635&tr=-193.72886117034767,-92.90627729286877&sc=1.5157165665103982</a> [accessed 26 July 2017]