Scotland's Business Base - Facts and Figures
GDP and employment have long been recognised as the major indicators of economic success. Yet, a key driver of these indicators, the business base, is often overlooked. To leverage economic success, it is important to understand the trends and characteristics related to Scotland's business base. This paper brings together and explores a range of data on Scotland's business base. It sets out a variety of evidence to aide understanding on all aspects of Scottish business stock, such as: industry sectors, size, ownership, manufacturing, survival rates, internationalisation, current challenges, etc.
Executive Summary
This paper explores a range of information and data on Scotland's business base. It sets out a range of evidence to aide understanding on all facets of Scottish business stock. To leverage economic success, it is important to understand the trends and characteristics related to the business base, as businesses are the key drivers of GDP and employment.
Scotland's business count has shown an upward trend and is at its second highest stock figure in the series since 2000. Although the growth rate of the UK's business base has generally surpassed that of Scotland.
There were 350,410 private sector businesses (registered and unregistered, and excluding central and local government) operating in Scotland in 2016 - a fall from 2015 but the 2016 business count is still relatively high (with it being the second highest stock figure in the series back to 2000). This represented 6.4% of the UK's total private sector business base of 5.49 million enterprises. Scotland's business stock share lags behind relative to Scotland's UK population (16+) share of 8.4%.
Since 2000 the growth rate of the UK's business base has generally surpassed that of Scotland. Between 2001 and 2004, Scotland out performed the UK. However, this was followed by a period of under-performance relative to the UK from 2006 to 2011. The years 2012 and 2013 saw an uplift in Scotland's performance. The last three years (2014 to 2016) have seen a changeable Scottish business growth rate, in contrast to sustained growth at a UK level. In 2016, the gap between Scotland's business base growth rate relative to the UK was the largest it has been since the data series began. Scotland has a comparatively low business density rate relative to the UK average and other regions of the UK. The number of businesses (registered & unregistered) in Scotland per 10,000 resident adults was 728 in 2016.
The performance of business stock varied by sector, with Growth Sectors growing at a much more accelerated rate than other sectors. The sector structure of the economy has changed subtly.
Scotland's two largest industry sectors were ‘Professional, Scientific & Technical Activities’ (53,240 enterprises) and Construction (43,250 enterprises). Together, these sectors made up 28% of all private sector enterprises in Scotland's economy. Over the year to 2016, the number of enterprises in Scotland decreased by 3%. However, relative performance by broad industry sector was more mixed. For example, the 'Information and Communication' sector demonstrated the largest growth in enterprise numbers in the year to 2016, growing from 15,200 to 18,520 (22%). Whereas over the same period, both the 'Motor trade...' and 'Wholesale trade' sectors witnessed the largest decline in enterprise numbers, at 28% and 21% respectively (although worth noting these sectors have smaller bases relative to other sectors).
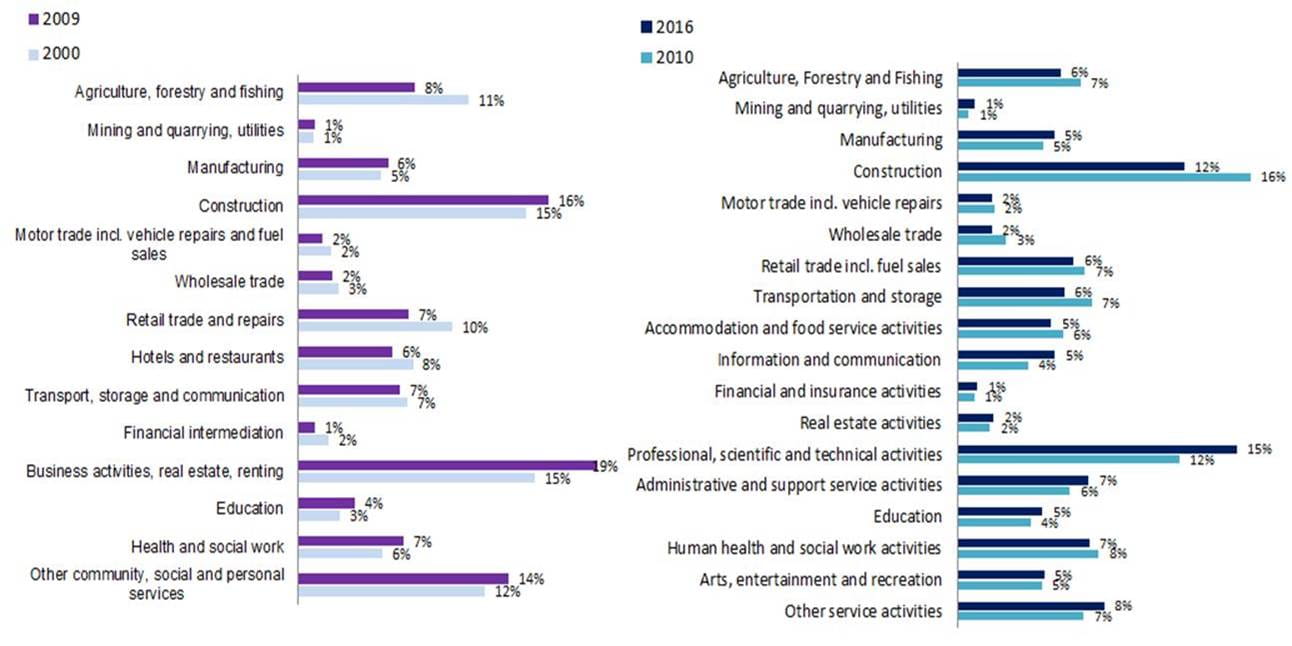
There have been subtle changes in the structure of the economy. Agriculture, forestry & fishing has steadily declined from 11% of businesses in 2000 to just 6% in 2016. Construction, while still one of the largest sector, has decreased slightly. Likewise both retail related businesses and accommodation & food serving related businesses have downward trends. The most recent 2010 to 2016 comparison shows the structure of the economy's business base is moving towards service orientated activities. This reflects trends in developed economies.
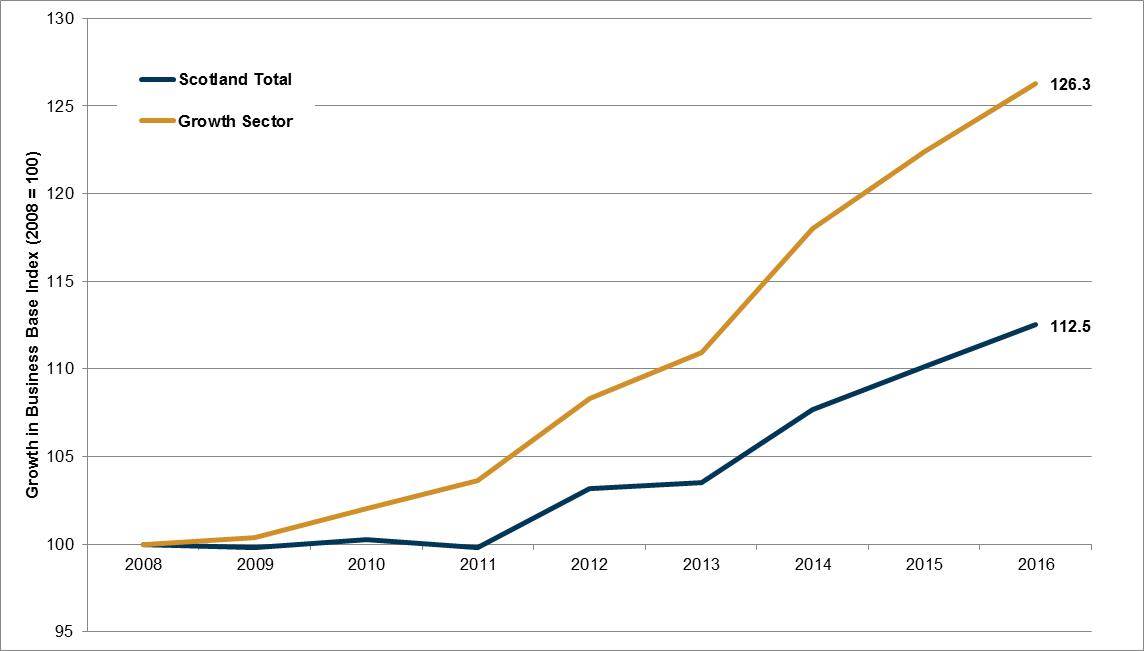
Growth Sectors represented 46% of all registered enterprises and 37% of employment in all registered enterprises across Scotland. In terms of volume of businesses, Financial and Business Services was the largest growth sector (28,305 enterprises) and Life Sciences the smallest (535 enterprises). The volume of businesses, in those sectors classed as Growth Sectors, have grown at a much more accelerated rate than the Scottish rate for all businesses (see Figure 8). Since 2008 the number of growth sector businesses in the economy grew by 26%, compared to 13% for all registered Scottish businesses.
The majority of Scottish enterprises have no employees. Yet Scotland has a different business stock make-up to the UK as a whole, with a higher rate of medium and large businesses.
The majority (69.4%) of Scotland's 350,410 private sector enterprises (registered and unregistered) were enterprises with no employees and accounted for 13% of employment. Small enterprises (1-49 employees) represented 29% of business stock and 29% total employment. Scotland's 3,920 medium-sized (50 to 249 employees) enterprises made-up 1.1% of business stock and 13% of total employment in Scotland. There were 2,365 large (250 or more employees) enterprises, which accounted for 0.6% of enterprises and 45% of employment.
There were differences in the business stock make-up of Scotland compared to the UK as a whole. Scotland had a lower rate of businesses which do not employ others but a higher rate of medium and large businesses compared to the UK as a whole. Large businesses account for a higher share of Scotland's private sector employment (45%), compared to the UK as a whole (40%).
Scotland had the fourth lowest enterprise birth rate and fifth highest enterprise death rate of the 12 UK regions.
Scotland had 21,725 business births in 2015, resulting in a birth rate of 12.6% (a slight increase on the previous year). The number of Scottish business deaths increased by 4% from 15,630 to 16,315 between 2014 and 2015, given a death rate of 9.4%. Encouragingly the gap has widened between business births and deaths since 2013, although at a diminishing rate (see Figure 11). In 2013, businesses were born at a rate which was 4.1 percentage points higher than the death rate, by 2015 this gap had fallen to 3.2 percentage points (comparatively an under-performance relative to the UK gap of 4.9 percentage points for 2015).
Across the UK regions, London had the highest business birth rate at 18.6% and Northern Ireland had the lowest birth rate, at 9.7%. Scotland had the fourth lowest birth rate of the 12 UK regions - at 12.6% - below the UK average of 14.3%. Scotland's business death rate of 9.4% -matched the UK average. The region with the highest business death rate was London at 10.5%, followed by the North West, at 9.9%. Northern Ireland had the lowest death rate, at 7.1%. Scotland had the fifth highest death rate of the 12 UK regions.
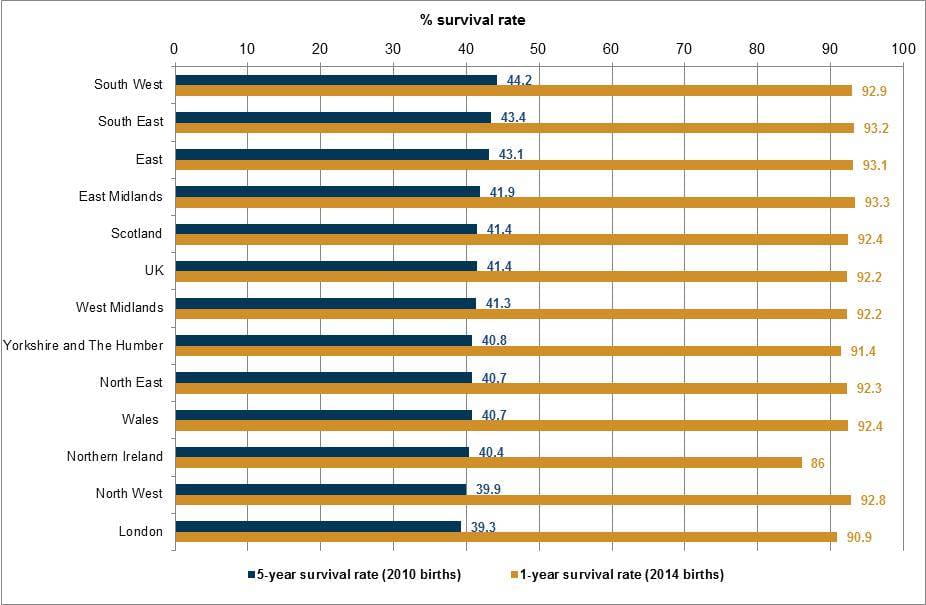
Generally, Scotland's business survival rates were slightly above the UK average across the 1-year to 5-year survival rates. The Scotland 5-year survival rate for businesses born in 2010 and still active in 2015 was 41.4% - this matched the UK average. Scotland was ranked fifth out of the UK's 12 regions for 5-year survival rates and seventh for the most recent 1-year survival rate (see Figure 13).
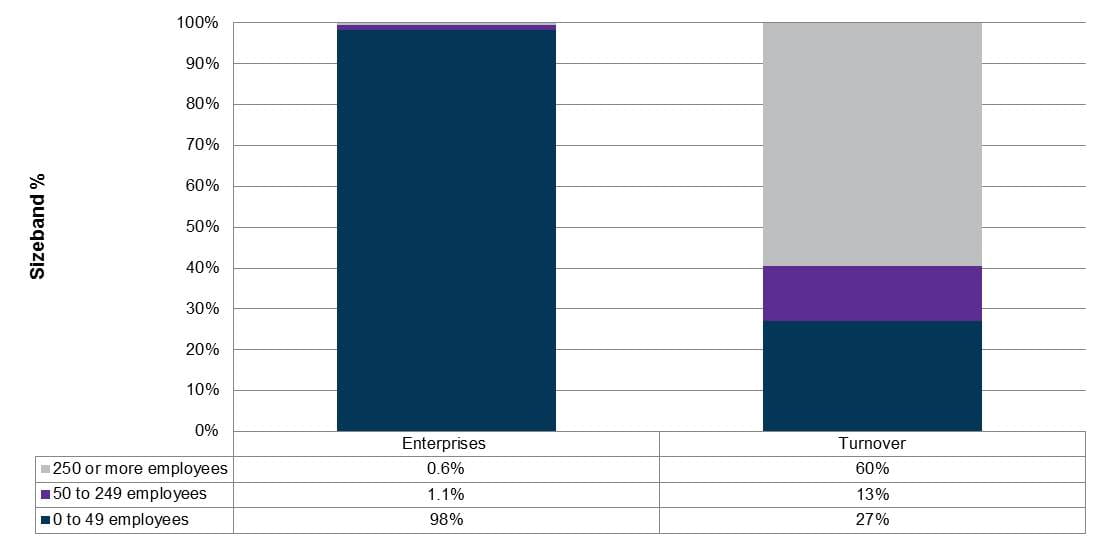
Large businesses made-up 0.6% of the business base and generated 60% of all turnover. Scotland's average GVA per enterprise was £731,400 (above the UK average).
Total private sector turnover generated by Scotland's 350,410 businesses was £276.1 billion (2016). The majority (98%) of turnover was from registered enterprises. The relationship between business size and turnover was inverse in nature. Small businesses represented 98% of the business base but just 27% of turnover, whereas large businesses made-up 0.6% of the business base generating 60% of all turnover.
Scotland's GVA was £127.5 billion in 2015, representing 7.6% of total UK GVA. In 2015, GVA per head of population was £23,700, an increase of 1.8% on the previous year. Scotland's average GVA per enterprise was £731,400 (above the UK average of £680,300). The 'mining and quarrying' and 'electricity, gas, steam and air-conditioning supply' sectors were the highest earning sectors, in terms of GVA per enterprise in Scotland (see Table 8).
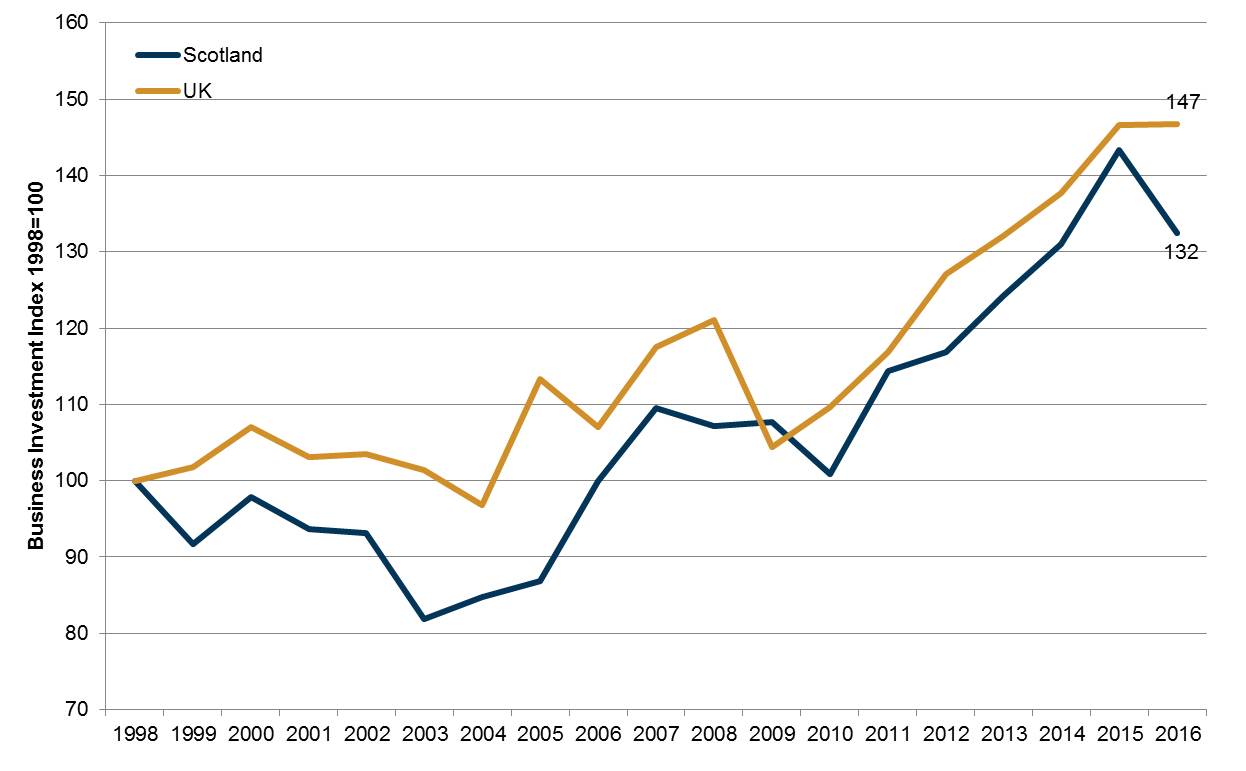
Scotland's business investment totalled £11.3 billion in 2016. Scotland's share of business investment represented 6% of total UK investment. Scotland's 2016 total represented a decline of 8% on the previous year.
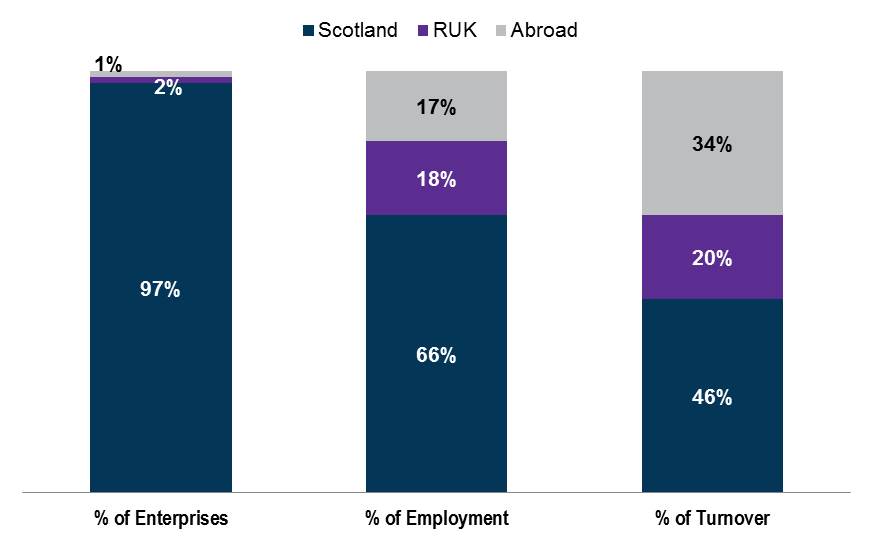
Indigenous enterprises made-up 97% of business stock, the remaining 3% of non-Scottish owned enterprises contributed 35% of employment and 54% of turnover.
The majority of Scotland's private sector enterprises were Scotland-owned (97%). These indigenous enterprises contributed 66% of employment and 46% of turnover. Total non-Scottish owned enterprises (RUK-owned and Abroad-owned) represented 3% of enterprises, and accounted for 35% of employment and 54% of turnover.
Most sectors were in line with national average for Scottish ownership. The main variations were financial and insurance activities (11% non-Scottish owned), manufacturing (6% non- Scottish owned), transport & storage (6% non-Scottish owned), and wholesale & retail trade (5% non-Scottish owned). However, when the share of employment by industry sector was examined by ownership, much more disparity was evident, particularly in primary industries and manufacturing.
Abroad-owned enterprises represented 2,305 of Scottish registered (1%) enterprises . Of these the largest proportions originated from the European Union (EU) and the USA:
1,000 were EU Abroad-owned (43%) enterprises operating in Scotland – employing 127,110 people and generating a turnover of £36 billion (13% of all turnover from registered businesses in Scotland or 39% of all turnover from abroad-owned registered businesses in Scotland)
550 were USA Abroad-owned (24%) enterprises operating in Scotland – employing 102,810 people and generating a turnover of £34 billion (12% of all turnover from registered businesses in Scotland or 37% of all turnover from abroad-owned registered businesses in Scotland).
It is estimated 7%-16% of Scottish businesses are involved in international trade activity. Scotland had the third fastest growth rate for exporting businesses in Great Britain.
There are information deficiencies around trade data. One source shows that there were 17,300 non-financial businesses trading internationally (exporting and/or importing) in 2015, representing approximately 10% of Scotland's business population in that period. Focusing specifically on exporting, these 11,500 businesses represented 7% of the business base. Related data from the Small Business Survey Scotland found that the proportion of SMEs that stated they exported goods or services outside of the UK in 2016 was 16%. Thus, it can be estimated that 7-16% of Scotland's business base were involved in international trade activity.
In the four years to 2015, the number of businesses importing increased by 28% and those exporting by 24%. Scotland had the third fastest growth rate for exporting businesses, after Wales (27%) and East Midlands (26%) (see Table 9). Scotland's exporting firms represent 5% of all exporting firms in Great Britain.
The majority (57%) of Scotland's export value (£45 billion) was generated by large enterprises. Medium sized enterprises accounted for 25% of all exports and this proportion has increased in recent years, growing by 27% between 2011 and 2015.
There has been a moderate decline in the number of manufacturing enterprises in Scotland, since 2000. Despite this manufacturing employment numbers have declined significantly.
Manufacturing represented 5% of Scotland's business base. These businesses contributed 9% of Scottish employment and 14% of the economy's turnover. Scotland's largest proportion (20%) of manufacturing enterprises were clustered around fabrication and metal product production. This was followed by repair and installation of machinery and equipment (12%) and wood related manufacturing (11%) rounded out the top three.
There has been a relatively moderate decline in the number of manufacturing enterprises in Scotland, since 2000. Despite this relatively moderate decline in enterprise numbers, the same cannot be said for manufacturing employment numbers. The ten year period to 2011 witnessed a signifiant decline in manufacturing employment, followed by a relatively flat period with minor growth. The most recent 2016 manufacturing employment data again saw a slight dip in numbers - it remains to be seen whether this will be a continued trend or a one off adjustment.
Manufacturing exports have grown at a slower rate relative to total exports and service exports. The value of manufacturing exports declined in the early 2000's but since 2007 have generally shown a moderate upward trend.
Edinburgh had the highest share of business stock and Na h-Eileanan Siar the lowest. Every constituency has seen business stock increase since 2010.
City of Edinburgh (10.4% of all registered Scottish businesses) was the local authority with the highest share of business stock. On the other end of the scale Na h-Eileanan Siar (0.7%) had the lowest number of enterprises.
The six year growth rate for local authority business stock was positive in all but three local authorities: Dumfries and Galloway saw business stock decrease by 1%; and there was zero percent growth in Argyll & Bute and the Orkney Islands were stock rates plateaued. Edinburgh (21% increase in enterprises), Aberdeen (20%), East Renfrewshire (18%), and North Lanarkshire (17%) had the highest stock growth rates over the six years.
The Orkney Islands have the highest business density ratio in Scotland. Many of the areas with high ranking business density rates were rural. West Dunbartonshire had the lowest business density rate. A characteristic of the lower ranking areas was that many contained commuter towns and villages, or were within city suburbs.
The top five constituencies for business stock in 2016 were: Edinburgh Central (4.1% of registered Scottish enterprises), Glasgow Kelvin (3.9%), Aberdeenshire West (2.7%), Aberdeen Central (2.5%), and Aberdeenshire East (2.4%). In contrast, the areas with the lowest volume of business stock were: Glasgow Provan (0.6%), Na h-Eileanan an Iar (0.7%), Glasgow Pollock (0.7%), Cunninghame South (0.7%), and Glasgow Maryhill and Springburn (0.7%).
Every constituency has seen business stock increase since 2010. Some more rural constituencies have had relatively moderate growth (e.g. Ettrick, Roxburgh and Berwickshire (4%), Galloway and West Dumfries (5%)), whilst urban areas, particularly cities, have seen significant growth (e.g. Aberdeen South and North Kincardine (31%), Glasgow Provan (43%)).
Challenges for the business base include subdued investment, constrained by falling real income, weaker consumer outlook, currency depreciation and uncertainty about future relationships with the EU.
Regulations and red tape were the most commonly reported obstacles to business success, with 45% of SMEs reporting this as the key issue. Other challenges highlighted were ‘competition in the market’ (42%) and taxation, VAT, PAYE, National Insurance, business rates (38%). Approximately one in five businesses stated that the UK exit from the EU was an obstacle and 18% saw the National Living Wage as a barrier to success. Just one in ten SMEs stated that they had no issues.
Evidence shows that profit margins for SMEs were decreasing. A driver of falling profit margins was the weakened rate of sterling, which has been depreciating since the June 2016 referendum vote to leave the European Union. This has lead to higher prices for imported goods and services.
Falling real income will impact the business base, especially as consumer demand derives around three quarters of Scotland's economic growth. The retail sector is perhaps most exposed to pressures on household budgets. And already retail businesses are reporting a fall in revenues and profits. Supply chain price rise pressures will also compound the issue.
With consumers under pressure and many large public sector funded infrastructure projects near completion, this means stronger growth will require higher levels of businesses investment. However, business investment has been subdued, constrained by the weaker consumer outlook and uncertainty about the UK’s future trading relationship with the EU.
Evidence suggests that the low unemployment rate may be impacting on businesses’ ability to recruit the talent they need. Recruitment difficulties are growing across almost all sectors of the economy. Businesses have increased their investment in staff training, possibly to improve the skills of existing staff or to bring new recruits up to speed, who may not have all the skills that the business needs".
Furthermore, it is important to recognise the regional split in business performance. Evidence from the Scottish Business Monitor shows that "businesses in all regions of Scotland – outside of the North East – reported growth in the total volume of business over the quarter. Conditions in the North East remained negative, but the situation has improved over the quarter".
Introduction
The two major indicators of economic success have often been viewed as GDP and employment. Yet, the key driver of these indicators, the business base of the economy in question, is often overlooked. Thus, to leverage economic success, it is important to understand the trends and characteristics related to a country's business base.
This paper brings together and explores a range of information and data on Scotland's business base. It sets out to understand, evidence, and communicate on all facets of Scottish business stock. This includes:
looking at trends over time in total business stock
understanding the contribution of different industry sectors to the business base
exploring businesses by size, employment and legal status
analysing the birth, death, and survival rates of Scottish business stock
looking at the characteristics of GVA, turnover, and investment amongst the business base
examining trends in Scotland's business ownership
evaluating data related to the role of businesses in internationalisation
enhancing understanding of manufacturing in the business base
considering current challenges for the business base
and understanding the business base by different geographical levels (local authority, parliamentary constituency, urban and rural).
Useful definitions
Data and information used in this paper's analysis focus on private sector enterprises rather than local units (unless otherwise stated).
An enterprise can be defined as the smallest combination of legal units (generally based on VAT and/or PAYE records) that is an organisational unit producing goods or services, which benefits from a certain degree of autonomy in decision-making, especially for the allocation of its current resources. An enterprise carries out one or more activities at one or more locations. An enterprise may be a sole legal unit.
A local unit (or business site) is an enterprise or part thereof (e.g. a workshop, factory, warehouse, office, mine or depot) situated in a geographically identified place.
Private sector is defined as including the following enterprise types: companies (including building societies), sole proprietors, partnerships, public corporations/nationalised bodies, and non-profit making bodies and mutual associations. Central and local government are excluded from the analysis. However, it is worth noting, if included central and local government would represent 0.1% of business organisations, and provide over a fifth (21%) of employment in Scotland.
Scottish Government1 state that "the figures for unregistered enterprises are estimated primarily using data from a sample survey (Labour Force Survey), which is subject to sampling error – this should be considered when making year on year comparisons between the number of unregistered enterprises".
Please note, while the data and information sources used in this briefing paper are considered to be true and correct at the date of publication, changes to circumstances after the time of publication may impact on the accuracy of the data, such as annual updates to data sources.
Total volume and trends over time
Total business base volume
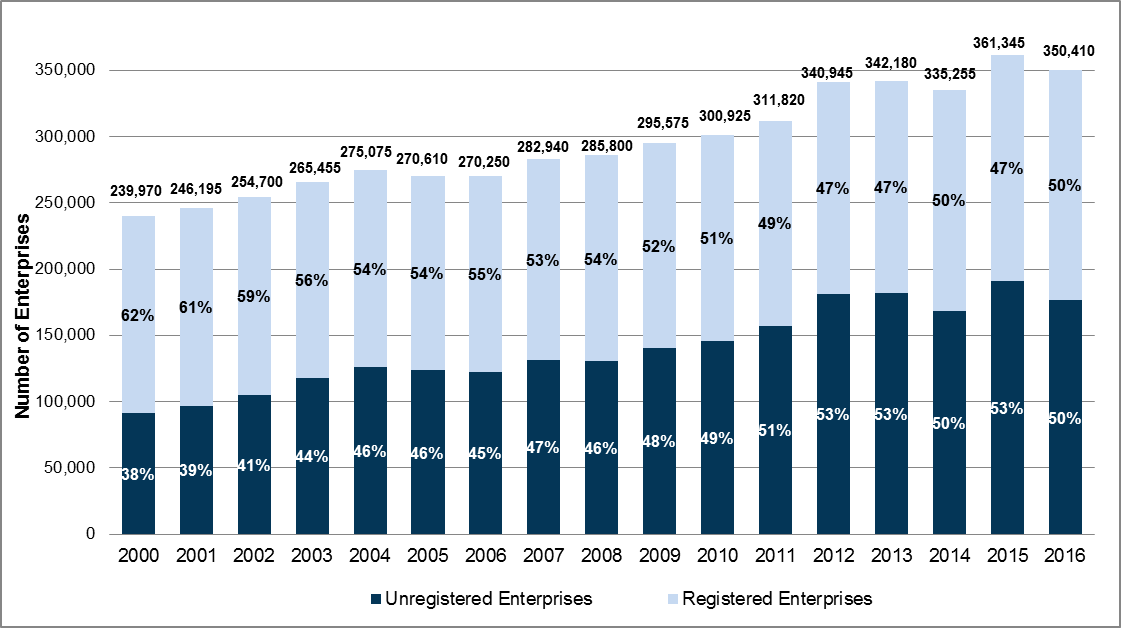
There were 350,410 private sector businesses (data excludes central and local government) operating in Scotland as at March 2016 - a fall from 2015 but the 2016 business count is still relatively high (with it being the second highest stock figure in the series back to 2000). 1
Unregistered businesses [unregistered enterprises are sole proprietorships and partnerships that are not large enough to be VAT registered (have an annual turnover below the VAT threshold, £82,000 as at March 2016) and are not PAYE registered (i.e. do not employ others)] accounted for approximately 176,400 enterprises (50% of the total) - the decrease in Scotland's business base over the latest year is driven by a fall in the number of unregistered businesses that fell by 14,590 (-7.6%).
The number of VAT/PAYE registered businesses has increased - up by 3,660 (+2.1%) from 170,335 in 2015 to 173,995 in 2016 – the highest figure since the time series began (in 2000).
Source: Scottish Government. (2016, November). Businesses in Scotland. Retrieved from http://www.gov.scot/Topics/Statistics/Browse/Business/Corporate/BISPDF [accessed 5 July 2017]
Business base trends over time
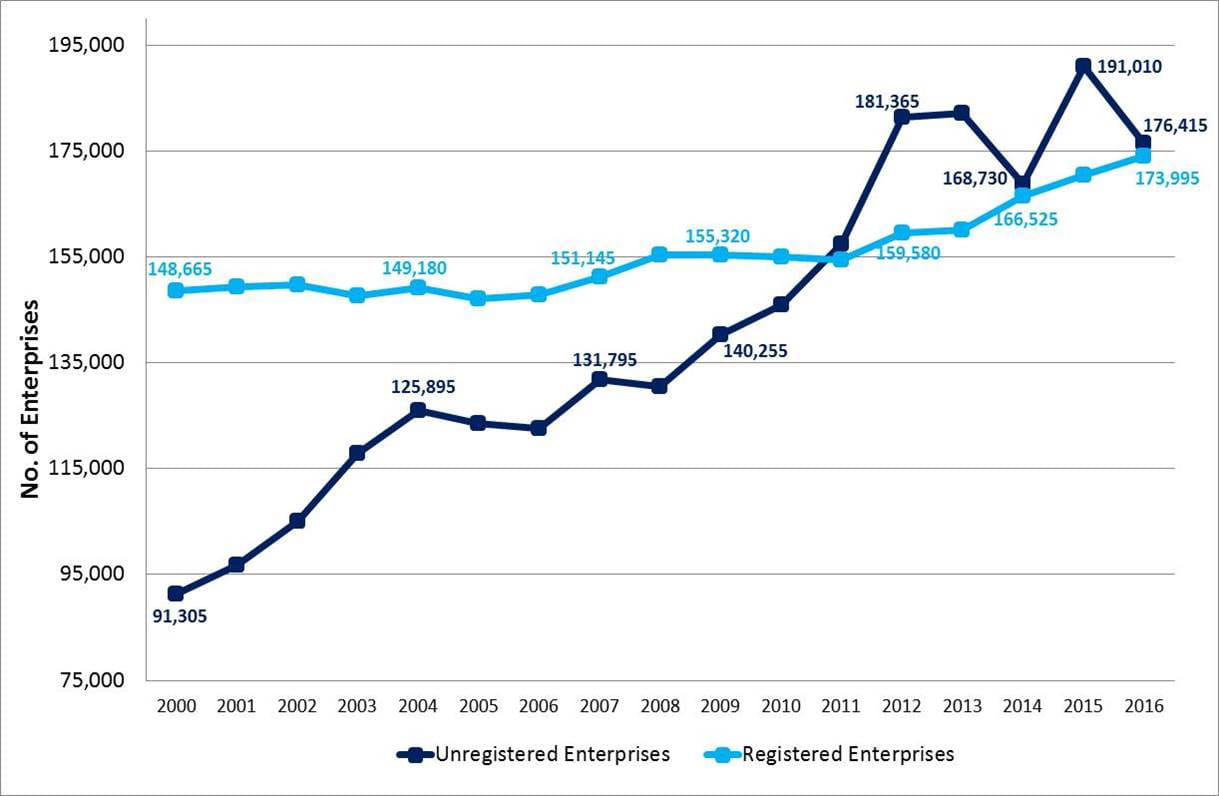
Unregistered and registered enterprises have shown differing growth trends overtime (see Figure 2).
Over 2000 to 2004, unregistered enterprises had a period of sustained growth. In the two years that followed (2005 & 2006) there was a moderate decline in numbers. Over the seven years, 2007 to 2013, there was a general trend of high growth with an additional 50,335 unregistered enterprises created in Scotland . The most recent three years of data for unregistered enterprises have demonstrated a mixed and sporadic performance: the year to 2014 saw a fall of 7%; in 2015 numbers peaked at 191,010 (approximately 100,000 unregistered enterprises more than 15 years earlier); and the year to 2016 witnessed a 8% decrease.
The number of registered enterprises remained relatively stable over the years 2000 to 2006 (averaging 148,000). This was followed by a period of moderate growth between 2007 and 2010. There was a minor dip in numbers in the year to 2011 (decrease of 700 enterprises). There has been consistent growth, over the most recent five year period (2012 to 2016), with an additional 14,400 registered enterprises in Scotland.
Source: Scottish Government. (2016, November). Businesses in Scotland. Retrieved from http://www.gov.scot/Topics/Statistics/Browse/Business/Corporate/BISPDF [accessed 5 July 2017]
Business base performance relative to the UK
In 2016, Scotland represented 6.4% of the UK's total private sector business base of 5.49 million enterprises (registered and unregistered).
This represented an under-performance relative to Scotland's UK population (16+) share of 8.4%.
The most recent data show that for the UK as a whole, the total number of businesses increased by 1.8% between the start of 2015 and start of 2016. This compares to a decrease of 3.0% for Scotland between March 2015 and March 2016.
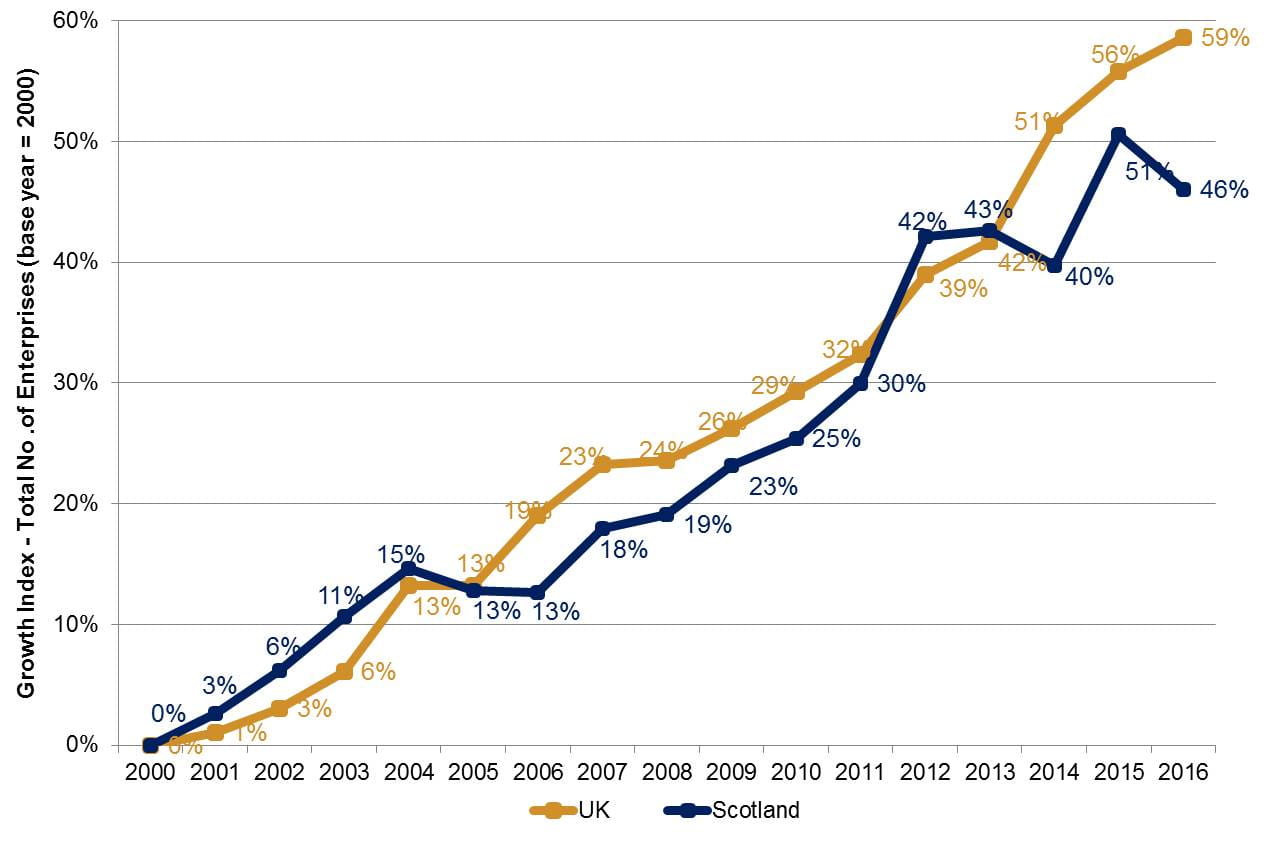
Since 2000 (see Figure 3) the growth rate of the UK's business base has generally surpassed that of Scotland. Between 2001 and 2004, Scotland out performed the UK. However, this was followed by a period of under-performance relative to the UK from 2006 to 2011. The years 2012 and 2013 saw an uplift in Scotland's performance. The last three years (2014 to 2016) have seen a changeable Scottish business growth rate, in contrast to sustained growth at a UK level. In 2016, the gap between Scotland's business base growth rate relative to the UK was the largest it has been since the data series began.
Source: Scottish Government. (2016, November). Businesses in Scotland. Retrieved from http://www.gov.scot/Topics/Statistics/Browse/Business/Corporate/BISPDF [accessed 5 July 2017] and Department for Business, Energy & Industrial Strategy. (2016, October). Business population estimates for the UK and regions 2016: detailed tables. Retrieved from https://www.gov.uk/government/statistics/business-population-estimates-2016 [accessed 28 June 2017]
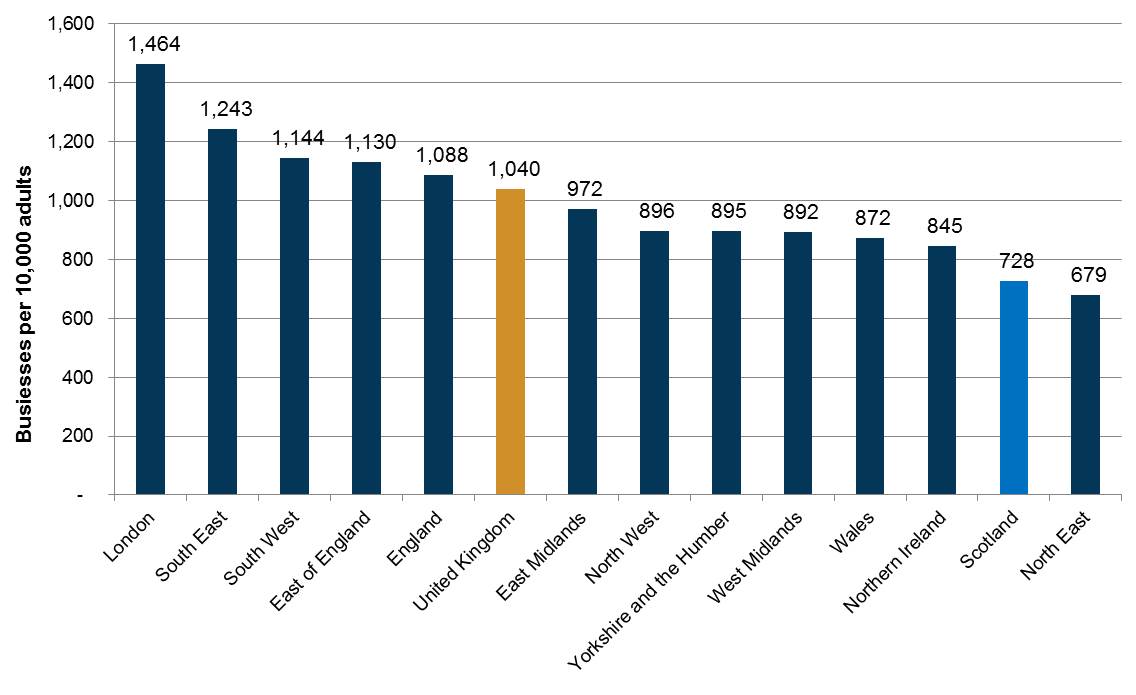
Scotland has a comparatively low business density rate relative to the UK average and other regions of the UK (see Figure 4). The number of businesses (registered & unregistered) in Scotland per 10,000 resident adults was 728 in 2016. This was significantly below the business density rates in London, South East, South West, and East of England. The North East was the only region with a business density rate lower than Scotland.
Source: Department for Business, Energy & Industrial Strategy. (2016, October). Business population estimates for the UK and regions 2016: detailed tables. Retrieved from https://www.gov.uk/government/statistics/business-population-estimates-2016 [accessed 28 June 2017]
Business base by sector
Sector overview
As at March 2016, the two largest industry sectors, in terms of enterprise numbers, were ‘Professional, Scientific & Technical Activities’ (53,240 enterprises) and Construction (43,250 enterprises). Together, these sectors made up 28% of all private sector enterprises in Scotland's economy1.
| Industry | Total | % of Total | % Change 2015 to 2016 |
|---|---|---|---|
| Agriculture, Forestry and Fishing | 19,585 | 6% | -9% |
| Mining and quarrying, utilities | 3,285 | 1% | -3% |
| Manufacturing | 18,355 | 5% | 5% |
| Construction | 43,250 | 12% | -10% |
| Motor trade incl. vehicle repairs | 6,455 | 2% | -28% |
| Wholesale trade | 6,490 | 2% | -21% |
| Retail trade incl. fuel sales | 22,105 | 6% | 8% |
| Transportation and storage | 20,250 | 6% | 4% |
| Accommodation and food service activities | 17,740 | 5% | -7% |
| Information and communication | 18,520 | 5% | 22% |
| Financial and insurance activities | 3,685 | 1% | 1% |
| Real estate activities | 6,840 | 2% | 4% |
| Professional, scientific and technical activities | 53,240 | 15% | 0% |
| Administrative and support service activities | 24,970 | 7% | -5% |
| Education | 16,130 | 5% | -13% |
| Human health and social work activities | 25,040 | 7% | -7% |
| Arts, entertainment and recreation | 16,515 | 5% | -5% |
| Other service activities | 27,960 | 8% | 4% |
| Total | 350,410 | 100% | -3% |
Source: Scottish Government. (2016, November). Businesses in Scotland. Retrieved from http://www.gov.scot/Topics/Statistics/Browse/Business/Corporate/BISPDF [accessed 5 July 2017] Note: Figures rounded to the nearest five. Totals may not equal the sum of the constituent parts due to rounding.
In total, over the year to 2016, the number of enterprises in Scotland decreased by 3%. However, relative performance by broad industry sector was more mixed.
The 'Information and Communication' sector demonstrated the largest growth in enterprise numbers in the year to 2016, growing from 15,200 to 18,520 (22%). Other notable sectors for growth were 'Retail trade...' at 8% and 'Manufacturing' at 5%.
In the year to 2016, both the 'Motor trade...' and 'Wholesale trade' sectors witnessed the largest decline in enterprise numbers, at 28% and 21% respectively (although worth noting these sectors have smaller bases relative to other sectors). 'Education', 'Construction', and 'Agriculture...' also had noteworthy decreases in enterprise stock, with falls of 13%, 10% and 9% respectively.
Sector changes over time
There was a change in data capture methodology in 2010 for sector data. This means it is not possible to create a directly comparable time series for 2000 to 2016 of the economy's business base structure by sector. Instead, the available data periods need to interrogated separately, as illustrated in Figure 5. These data periods are not directly comparable , but do provide a useful proxy of the direction of change. There have been subtle changes in the structure of the economy:
agriculture, forestry & fishing has steadily declined from 11% of businesses in 2000 to just 6% in 2016
the proportion of manufacturing firms in the economy has held constant
construction, while still one of the largest sector, has decreased slightly. Likewise both retail related businesses and accommodation & food serving related businesses have downward trends.
The most recent 2010 to 2016 comparison shows the structure of the economy's business base is moving towards service orientated activities. This reflects global trends in developed economies.
Source: Scottish Government. (2016, November). Businesses in Scotland. Retrieved from http://www.gov.scot/Topics/Statistics/Browse/Business/Corporate/BISPDF [accessed 5 July 2017]Note: 2000 to 2009 data collected in line with Standard Industrial Classification (SIC) codes 2003 and from 2010 onwards collected in accordance with SIC codes 2007.
Sector intensity
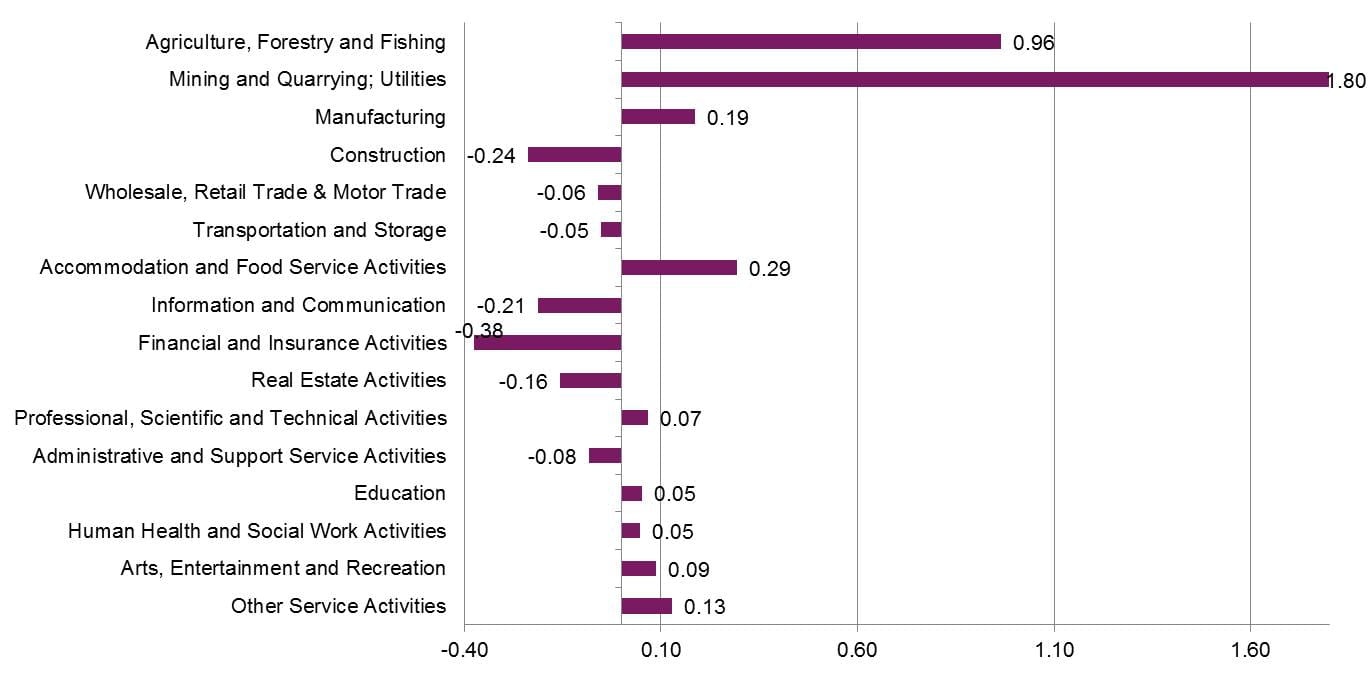
Figure 6 quantifies how concentrated a particular industry is in Scotland, as compared to the UK average as a whole. It reveals what makes the Scottish economy “unique” in comparison to the UK. A score greater than zero indicates specialisation in a sector (the higher the score the greater the level of specialisation) and a negative score shows a lower intensity of a sector in Scotland relative to the UK.
Scotland had a significantly high specialisation and intensity in 'mining, quarrying, utilities' reflecting the oil and gas industry in the North East. Scotland's economy also had a high specialisation in 'agriculture, forestry, & fishing' relative to the UK, which is to be expected given Scotland's landscape characteristics.
Other areas of intensity, though more minor in the extent of the specialisation, were 'accommodation & food serving activities', 'manufacturing', and 'other service activities'.
There were four sectors, in particular, that were relatively less intense in Scotland's business base compared to the UK economy. These were 'financial & insurance', 'construction', 'information & communication', and 'real estate activities'.
Source: Department for Business, Energy & Industrial Strategy. (2016, October). Business population estimates for the UK and regions 2016: detailed tables. Retrieved from https://www.gov.uk/government/statistics/business-population-estimates-2016 [accessed 28 June 2017]
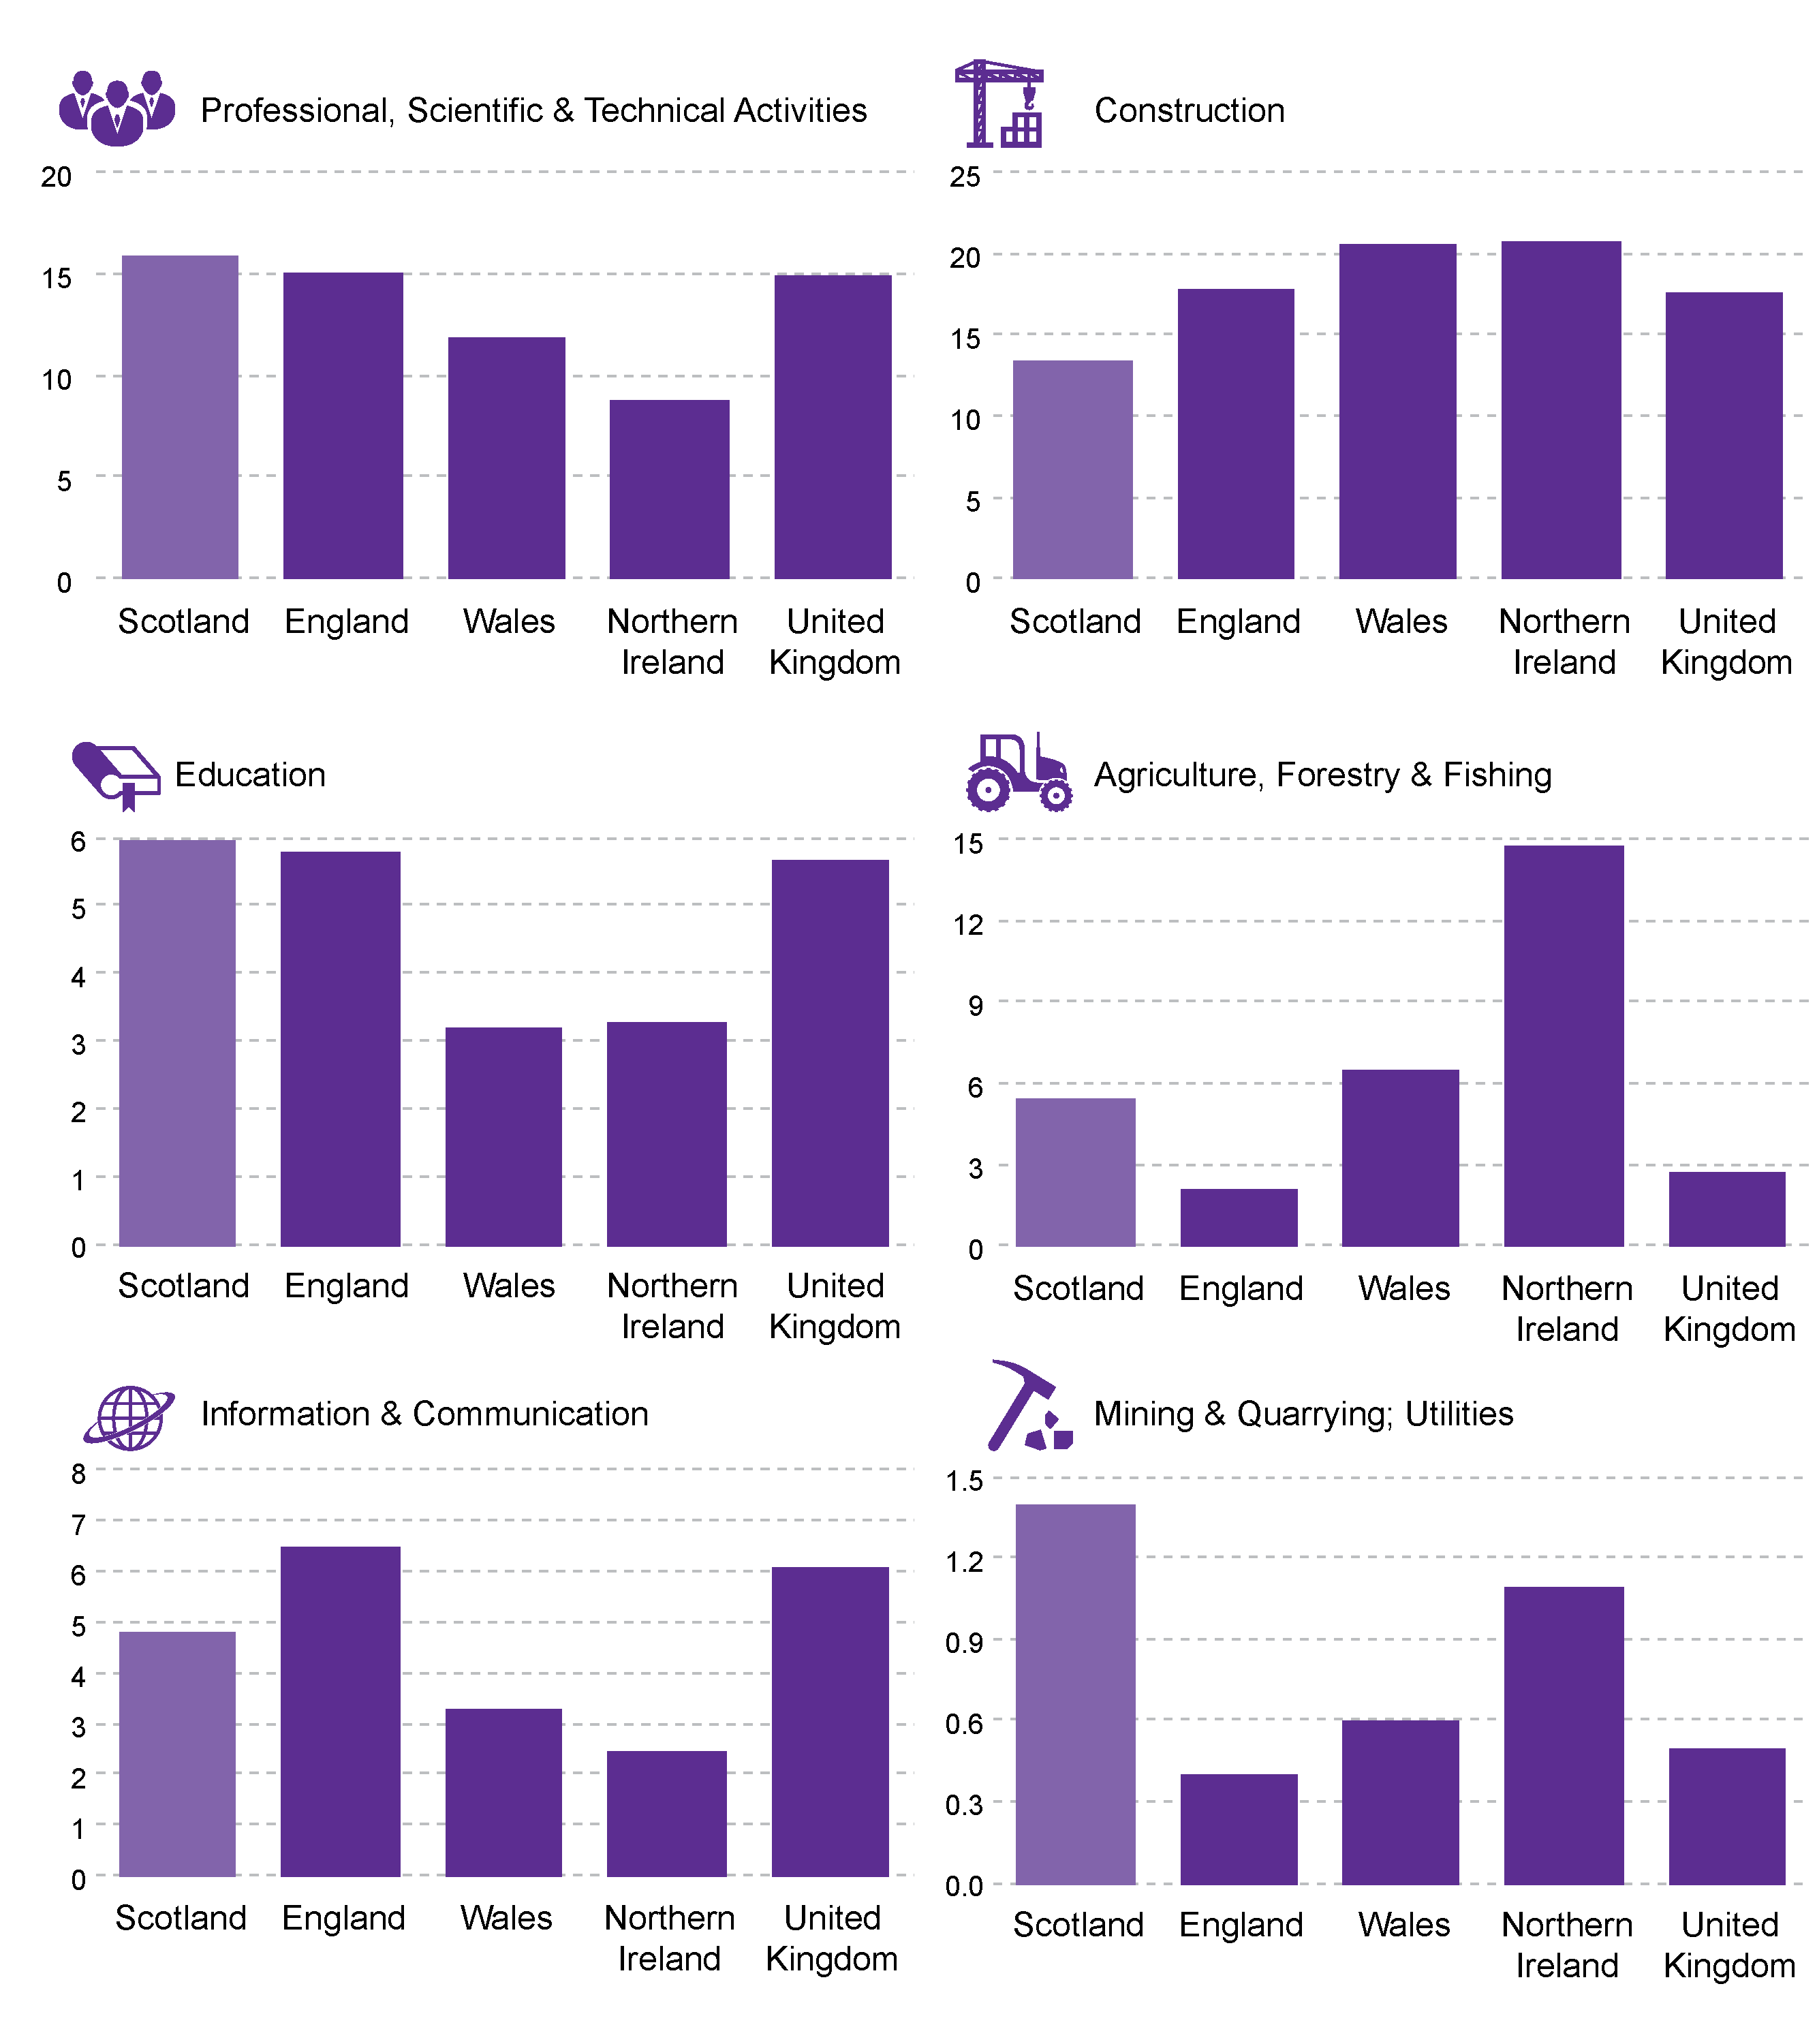
Figure 7 shows the business make-up of selected sectors of the nations of the UK (and the UK average). Again here the significantly high specialisation in 'mining, quarrying, utilities' is striking, reflecting the oil and gas industry in the North East. The high proportion of 'professional, scientific, and technical activities' in Scotland's business stock is clear. Also notable is that despite the high specialisation in 'agriculture, forestry, & fishing' relative to the UK average, the proportion of 'agriculture, forestry, & fishing' in Scotland is lower than Northern Ireland and Wales.
Source: Department for Business, Energy & Industrial Strategy. (2016, October). Business population estimates for the UK and regions 2016: detailed tables. Retrieved from https://www.gov.uk/government/statistics/business-population-estimates-2016 [accessed 28 June 2017]
Growth sectors
Scotland's Economic Strategy1, according to the Scottish Government, sets out a framework which establishes an economic environment that provides an opportunity for all companies - large or small, Scottish or international, new or old, or social enterprises - to be successful.
The Strategy recognises that certain sectors of the economy offer particular opportunities for growth - in all or part of that sector - due to existing comparative advantages or through the potential to capitalise on Scotland's unique natural assets. These are sectors where Scotland typically has distinctive capabilities and businesses with the potential to be internationally successful. The Strategy identifies six growth sectors:
Food & Drink (including agriculture & fisheries)
Creative Industries (including digital)
Sustainable Tourism
Energy (including renewables)
Financial & Business Services
Life Sciences.
Growth sector contribution to business base
In 2016, there were 79,665 growth sector businesses in Scotland (registered enterprises - Growth Sector Database1captures registered enterprises only). This represented 46% of all registered enterprises and 37% of all employment (in registered enterprises) in Scotland. In terms of volume of businesses, Financial and Business Services was the largest growth sector (28,305 enterprises) and Life Sciences the smallest (535 enterprises).
The proportion of growth sector businesses in the economy was relatively higher than the proportion of employment provided by growth sector businesses. This was due to the micro and small nature of many growth sector firms - 48% of growth sector firms had no employees and 50% were classed small (1-49 employees).
| No. of Enterprises (2016) | % of all Scottish Registered Enterprises (2016) | % Total Scottish Registered Employment (2015) | Enterprise % change: 2008 to 2016 | |
|---|---|---|---|---|
| Food and Drink | 17,320 | 10% | 6% | -2% |
| Financial and Business Services | 28,305 | 16% | 11% | 40% |
| Life Sciences | 535 | 0.3% | 1% | 22% |
| Energy (including Renewables) | 3,995 | 2% | 4% | 244% |
| Sustainable Tourism (Tourism related Industries) | 14,090 | 8% | 11% | 6% |
| Creative Industries (including Digital) | 15,420 | 9% | 4% | 50% |
| All | 79,665 | 46% | 37% | 26% |
Source: Scottish Government. (2017, July). Growth Sector Statistics Database. Retrieved from http://www.gov.scot/Topics/Statistics/Browse/Business/Publications/GrowthSectors/Database [accessed 10 July 2017] Totals may not equal the sum of the constituent parts due to rounding.
The volume of businesses, in those sectors classed as growth sectors, have grown at a much more accelerated rate than the Scottish rate for all businesses (see Figure 8). Since 2008 the number of growth sector businesses in the economy grew by 26%, compared to 13% for all registered Scottish businesses. Apart from Food and Drink, the other five sectors classed as growth sectors have all increased their business base size since 2008 - in particular this growth was driven by Finance (additional 8,070 businesses) and Creative Industries/Digital (5,145 additional businesses).
Source: Scottish Government. (2017, July). Growth Sector Statistics Database. Retrieved from http://www.gov.scot/Topics/Statistics/Browse/Business/Publications/GrowthSectors/Database [accessed 10 July 2017] Registered enterprises only - those registered for VAT and/or PAYE.
Business base by size, employment and legal status
Size and employment structure
The Scottish Government Businesses in Scotland publication showed that of the 350,410 private sector enterprises operating in Scotland in 2016:
enterprises with no employees – that is sole proprietors or partnerships comprising only the owner-managers or companies comprising only the employee director – accounted for 69.4% of all private sector enterprises in Scotland and 13% of employment
100,885 (29%) were small (1-49 employees) representing 29% of total employment
3,920 (1.1%) were medium-sized (50 to 249 employees) and represented 13% of total employment in Scotland
2,365 (0.6%) were large (250 or more employees) and accounted for 45% of employment.
| Employee Sizeband | No. of Enterprises | % of Total Enterprises | Enterprises change 2015-2016 | Total Scottish Employment | % of Total Employment | Employment change 2015-2016 |
|---|---|---|---|---|---|---|
| 0 | 243,245 | 69.4% | -4% | 270,510 | 13% | -5% |
| 1 - 4 | 64,985 | 18.5% | 1% | 178,570 | 8% | 0% |
| 5 - 9 | 19,520 | 5.6% | -5% | 136,150 | 6% | -5% |
| 10 - 19 | 11,275 | 3.2% | -1% | 155,710 | 7% | -1% |
| 20 - 49 | 5,105 | 1.5% | 1% | 146,280 | 7% | 1% |
| 50 - 99 | 2,235 | 0.6% | 2% | 119,580 | 6% | 3% |
| 100 - 199 | 1,320 | 0.4% | -1% | 109,370 | 5% | -1% |
| 200 - 249 | 365 | 0.1% | 7% | 39,340 | 2% | 3% |
| 250 - 499 | 805 | 0.2% | 3% | 116,210 | 5% | 0% |
| 500+ | 1,560 | 0.4% | 3% | 842,800 | 40% | 3% |
| Total | 350,410 | 100% | -3% | 2,114,510 | 100% | 0% |
Source: Scottish Government. (2016, November). Businesses in Scotland. Retrieved from http://www.gov.scot/Topics/Statistics/Browse/Business/Corporate/BISPDF [accessed 5 July 2017] Note: Figures rounded to the nearest five. Totals may not equal the sum of the constituent parts due to rounding.
The Scottish Government Businesses in Scotland publication noted that:
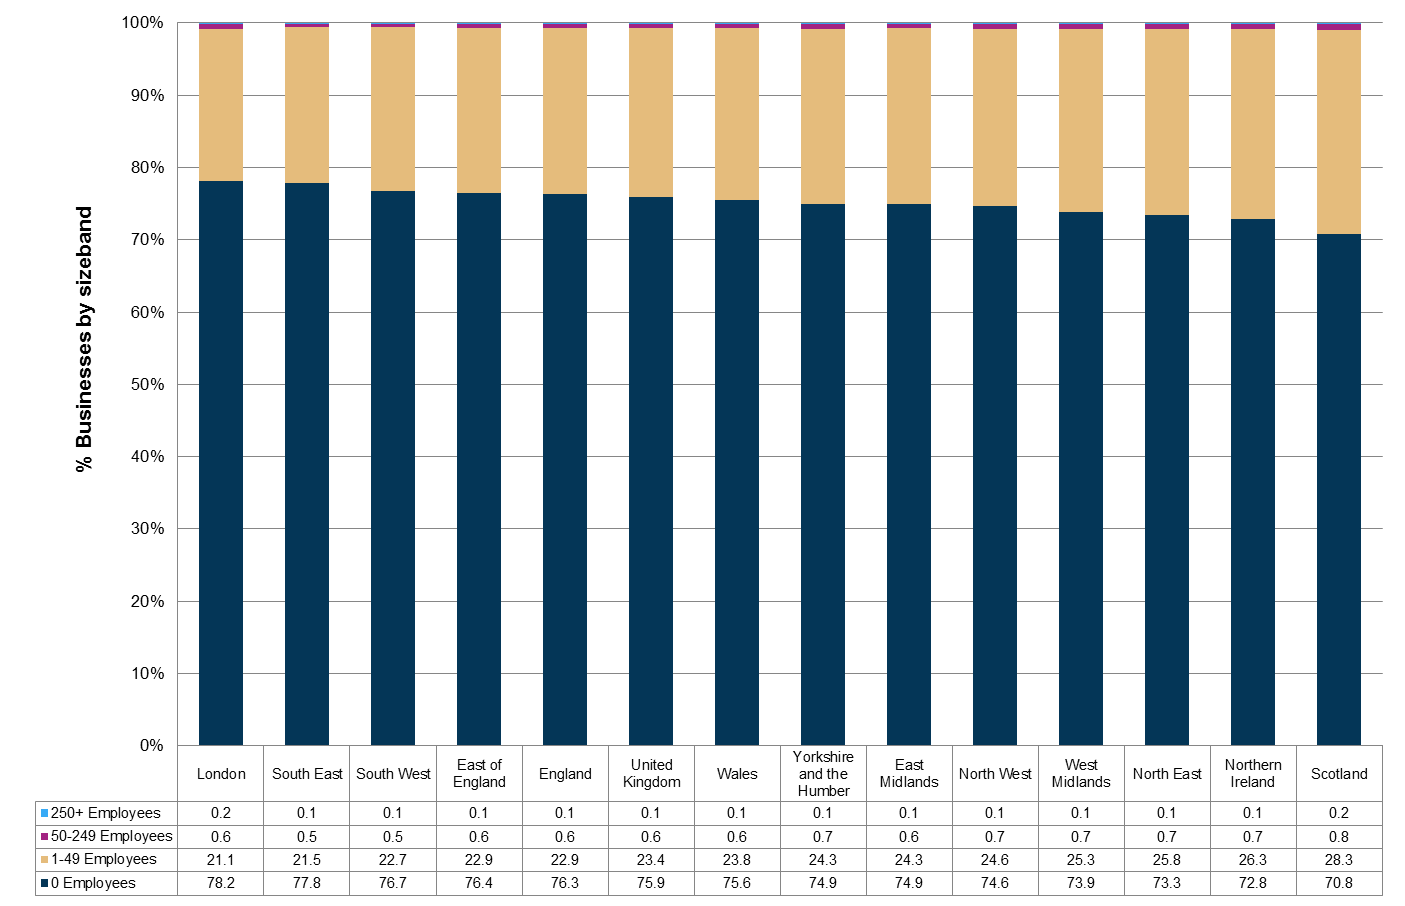
Scotland has a different business stock make-up compared to the UK as a whole..... ....Scotland has a lower rate of businesses that do not employ others but a higher rate of medium and large businesses compared to the UK as a whole. Large businesses account for a higher share of Scotland's private sector employment (45%), compared to the UK as a whole (40%).
Notable is the contrast, in the proportion of small businesses (1-49 employees) in Scotland relative to other UK regions (see Figure 9). This category made-up 29% of Scotland's business base - equivalent rates in other regions include London (21%), Wales (24%), North West (25%), North East (26%). This illustrates the unique nature of the make-up of Scottish business stock.
Source: Department for Business, Energy & Industrial Strategy. (2016, October). Business population estimates for the UK and regions 2016: detailed tables. Retrieved from https://www.gov.uk/government/statistics/business-population-estimates-2016 [accessed 28 June 2017]
Sectors by size
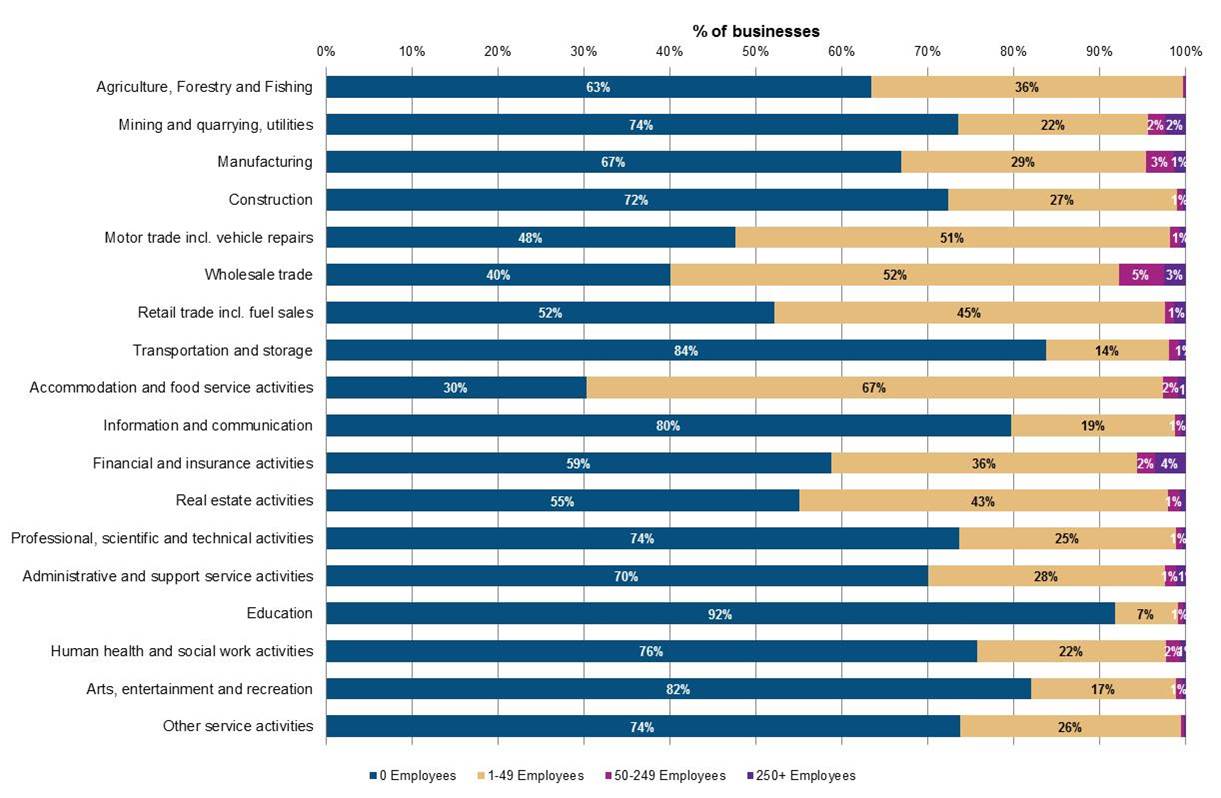
The sector make-up of Scotland's business stock varies significantly by size (see Figure 10).
The sectors with the largest proportionate of enterprises with no employees were 'education' (92%) and 'transportation & storage' (84%). On the other end of the spectrum 'accommodation & food serving activities' (30%) and 'wholesale trade' (40%) had the fewest number of businesses with no employees.
The highest proportion of large enterprises (250+ employees) were in the 'finance..'(4%), 'wholesale trade' (3%), and 'mining & quarrying..' (2%). There were very few large enterprises in 'agriculture, forestry ...' (0.1%, 15 enterprises), 'motor-trade' (0.7%, 45 enterprises), and 'real estate' (0.7%, 45 enterprises).
Source: Scottish Government. (2016, November). Businesses in Scotland. Retrieved from http://www.gov.scot/Topics/Statistics/Browse/Business/Corporate/BISPDF [accessed 5 July 2017]
Legal status
| Number of enterprises | % of enterprises | 2010 to 2016 % change enterprises | Total Scottish employment | % employment | 2010 to 2016 % change employment | |
|---|---|---|---|---|---|---|
| Companies (incl. Building Societies) | 108,150 | 30.8% | 40.5% | 1,490,510 | 70.5% | 13.1% |
| Sole proprietors | 36,975 | 10.5% | -15.9% | 106,470 | 5.0% | -15.0% |
| Partnerships | 21,180 | 6.0% | -19.5% | 123,210 | 5.8% | -21.1% |
| Public Corporation/ nationalised body | 35 | 0.0% | -46.2% | 20,660 | 1.0% | -70.7% |
| Non-profit making bodies and mutual associations | 7,660 | 2.2% | -0.8% | 178,390 | 8.4% | 5.4% |
| Unregistered enterprises | 176,420 | 50.3% | 20.9% | 195,280 | 9.2% | 21.4% |
| Total | 350,410 | 16.4% | 2,114,520 | 4.0% |
Source: Scottish Government. (2016, November). Businesses in Scotland. Retrieved from http://www.gov.scot/Topics/Statistics/Browse/Business/Corporate/BISPDF [accessed 5 July 2017] Totals may not equal the sum of the constituent parts due to rounding. Central & Local Government are excluded.
Not including unregistered enterprises, companies made-up the majority of registered enterprises (31%) in 2016. There has been sustained high growth in the number of companies over the last six years - growing by 41% (31,150 additional enterprises). Recent years have witnessed a declining number of partnerships and sole proprietors in the business base. Companies contributed the majority (71%) of Scotland's private sector employment base.
Birth, death and survival rates
Birth and death rates are calculated based on the concept of active businesses in a reference year. These are defined as businesses that had either turnover or employment at any time during the reference period.
New business registrations are referred to as business births and the birth rate is calculated using the number of births as a proportion of the active businesses.
Businesses that have ceased to trade (identified through de-registration of the administrative units, that is, VAT and Pay As You Earn (PAYE)) are referred to as business deaths and the death rate is calculated using the number of deaths as a proportion of the active businesses.
Business births and deaths
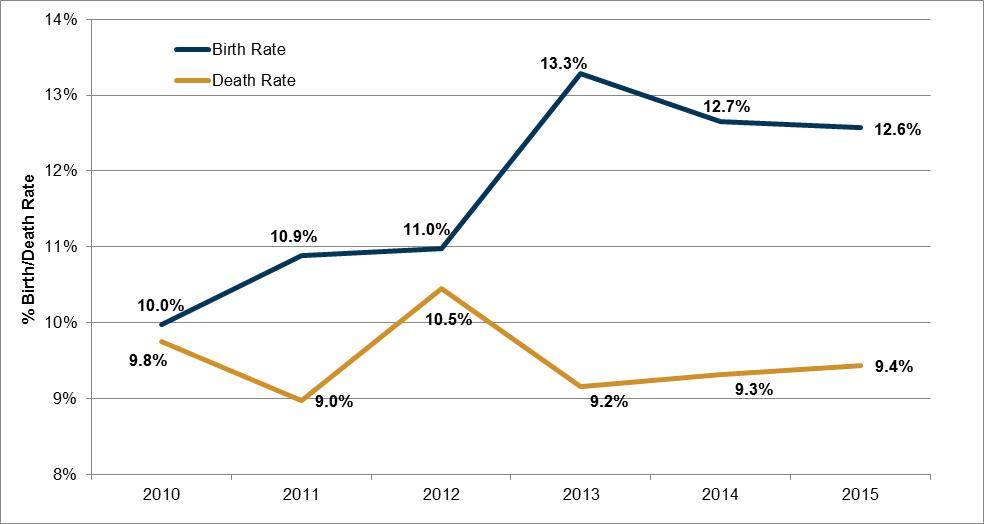
The number of Scottish business births increased by 2% between 2014 and 2015 to 21,725, resulting in a birth rate of 12.6%. The 21,725 business births in 2015 were the highest recorded since comparable records began. The number of Scottish business deaths increased by 4% from 15,630 to 16,315 between 2014 and 2015, a death rate of 9.4% compared with a rate of 9.3% in 2014.
| Active Count | Birth Count | Birth Rate | Death Count | Death Rate | |
|---|---|---|---|---|---|
| 2010 | 155,695 | 15,530 | 10.0% | 15,185 | 9.8% |
| 2011 | 155,655 | 16,940 | 10.9% | 13,970 | 9.0% |
| 2012 | 158,320 | 17,385 | 11.0% | 16,545 | 10.5% |
| 2013 | 162,230 | 21,540 | 13.3% | 14,850 | 9.2% |
| 2014 | 167,860 | 21,235 | 12.7% | 15,630 | 9.3% |
| 2015 | 172,890 | 21,725 | 12.6% | 16,315 | 9.4% |
Source: Office of National Statistics (ONS). (2016, November 23). Business Demography. Retrieved from https://www.ons.gov.uk/businessindustryandtrade/business/activitysizeandlocation/datasets/businessdemographyreferencetable [accessed 28 June 2017]
Promisingly the gap has widened between business births and deaths, since 2013, although at a diminishing rate (see Figure 11). In 2013, businesses were born at a rate which was 4.1 percentage points higher than the death rate, by 2015 this gap had fallen to 3.2 percentage points (comparatively an under-performance relative to the UK gap of 4.9 percentage points for 2015).
The narrow gap between birth and death rates over the 2010 to 2012 period, reflected the lag effect of the economic downturn of 2008 and 2009. The gap from 2013 onwards reflected a turnaround with strengthened economic indicators.
Source: Office of National Statistics (ONS). (2016, November 23). Business Demography. Retrieved from https://www.ons.gov.uk/businessindustryandtrade/business/activitysizeandlocation/datasets/businessdemographyreferencetable [accessed 28 June 2017]
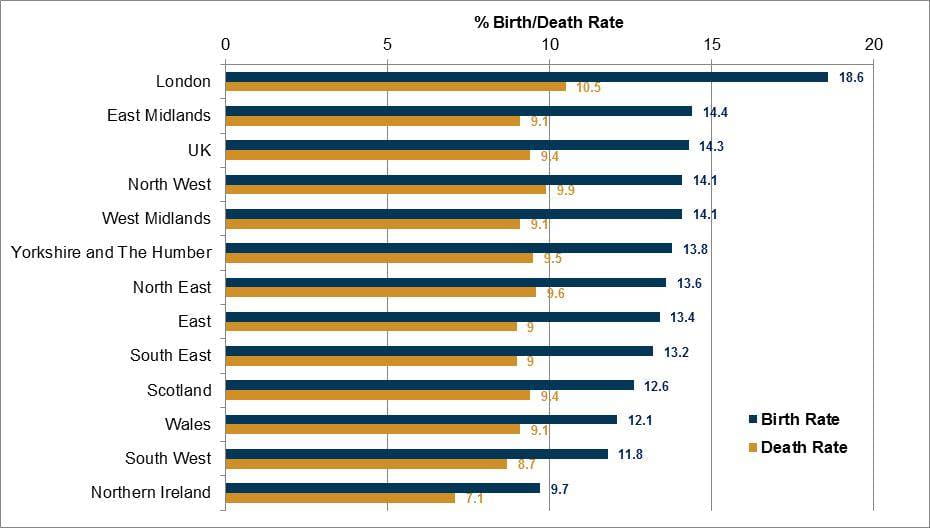
Across the UK regions (see Figure 12), London had the highest business birth rate at 18.6%, followed by the East Midlands (14.4%) and North West and West Midlands (14.1%). Northern Ireland had the lowest birth rate, at 9.7%. Scotland had the fourth lowest birth rate of the 12 UK regions - at 12.6% - below the UK average of 14.3%.
The region with the highest business death rate was London at 10.5%, followed by the North West, at 9.9%. Northern Ireland had the lowest death rate, at 7.1%. Scotland had a business death rate of 9.4% - this matched the UK average. Scotland had the fifth highest death rate of the 12 UK regions.
Source: Office of National Statistics (ONS). (2016, November 23). Business Demography. Retrieved from https://www.ons.gov.uk/businessindustryandtrade/business/activitysizeandlocation/datasets/businessdemographyreferencetable [accessed 28 June 2017]
Survival rates
The 1-year business survival rate in Scotland increased in 2011 and has been relatively stable over the years to 2014. Generally, Scotland's business survival rates were slightly above the UK average. The Scotland 5-year survival rate for businesses born in 2010 and still active in 2015 was 41.4% - this matched the UK average.
| Births 2010 | Births 2011 | Births 2012 | Births 2013 | Births 2014 | |
|---|---|---|---|---|---|
| 1-year survival | 86.7 | 93.1 | 91.2 | 93.5 | 92.2 |
| 2-year survival | 72.5 | 75.6 | 73.8 | 75.0 | : |
| 3-year survival | 57.1 | 60.5 | 59.4 | : | : |
| 4-year survival | 48.1 | 51.0 | : | : | : |
| 5-year survival | 41.4 | : | : | : |
Source: Office of National Statistics (ONS). (2016, November 23). Business Demography. Retrieved from https://www.ons.gov.uk/businessindustryandtrade/business/activitysizeandlocation/datasets/businessdemographyreferencetable [accessed 28 June 2017]
The highest 5-year survival rate, by region, was in the South West, at 44.2%, while the lowest was in London, at 39.3%. Scotland was ranked fifth out of the UK's 12 regions for 5-year survival rates and seventh for the most recent 1-year survival rate (see Figure 13).
Source: Office of National Statistics (ONS). (2016, November 23). Business Demography. Retrieved from https://www.ons.gov.uk/businessindustryandtrade/business/activitysizeandlocation/datasets/businessdemographyreferencetable [accessed 28 June 2017]
Turnover, GVA, and investment
Business turnover profile
Total private sector turnover generated by Scotland's 350,410 businesses (registered and unregistered) was £276.1 billion (2016). The majority (98%) of turnover was from registered enterprises.
The relationship between business size and turnover was inverse in nature (see Figure 14) - small businesses represented 98% of the business base but just 27% of turnover, whereas large businesses made-up 0.6% of the business base generating 60% of all turnover.
Source:Scottish Government. (2016, November). Businesses in Scotland. Retrieved from http://www.gov.scot/Topics/Statistics/Browse/Business/Corporate/BISPDF [accessed 5 July 2017] Totals may not equal the sum of the constituent parts due to rounding.
Average business turnover in Scotland was £658,100. Of the UK regions London had the highest business turnover ratio, followed by the South East and West Midlands (see Table 7). Scotland was ranked fourth highest of the regions.
| Region | Average turnover ratio per business |
|---|---|
| United Kingdom | £702,300 |
| North East | £492,100 |
| North West | £560,100 |
| Yorkshire and the Humber | £577,600 |
| East Midlands | £603,800 |
| West Midlands | £733,400 |
| East of England | £644,300 |
| London | £1,149,600 |
| South East | £738,300 |
| South West | £387,000 |
| England | £725,600 |
| Wales | £384,400 |
| Scotland | £658,100 |
| Northern Ireland | £478,700 |
Source: Department for Business, Energy & Industrial Strategy. (2016, October). Business population estimates for the UK and regions 2016: detailed tables. Retrieved from https://www.gov.uk/government/statistics/business-population-estimates-2016 [accessed 28 June 2017]
GVA and the business base
Gross Value Added (GVA) is a measure of the increase in the value of the economy due to the production of goods and services. It is measured at current basic prices, which include the effect of inflation, excluding taxes (less subsidies) on products (for example, Value Added Tax). GVA plus taxes (less subsidies) on products is equivalent to Gross Domestic Product (GDP).
Scotland's GVA, excluding any share of UK extra-regio activity, was £127.5 billion in 2015, representing 7.6% of total UK GVA1. In 2015, GVA per head of population was £23,700, an increase of 1.8% on the previous year. Scotland's average GVA per enterprise was £731,400 (above the UK average of £680,300). Table 8 shows that 'mining and quarrying' and 'electricity, gas, steam and air-conditioning supply' were the highest earning sectors in terms of GVA per enterprise in Scotland, reflecting importance of oil and gas sector.
| Scotland - Average GVA per enterprise | UK - Average GVA per enterprise | |
|---|---|---|
| Agriculture, forestry and fishing | £92,400 | £73,700 |
| Mining and quarrying | £7,261,800 | £14,122,500 |
| Manufacturing | £1,577,500 | £1,251,200 |
| Electricity, gas, steam and air-conditioning supply | £5,519,000 | £6,953,500 |
| Water supply; sewerage and waste management | £3,347,900 | £2,331,900 |
| Construction | £427,300 | £358,400 |
| Wholesale and retail trade; repair of motor vehicles | £567,600 | £495,100 |
| Transportation and storage | £1,043,300 | £933,700 |
| Accommodation and food service activities | £330,900 | £339,100 |
| Information and communication | £477,600 | £562,800 |
| Financial and insurance activities | £3,728,900 | £2,447,900 |
| Real estate activities | £2,353,500 | £2,453,600 |
| Professional, scientific and technical activities | £241,400 | £286,300 |
| Administrative and support service activities | £429,900 | £413,900 |
| Education | £4,153,600 | £2,425,200 |
| Human health and social work activities | £1,917,900 | £1,237,100 |
| Arts, entertainment and recreation | £498,100 | £378,000 |
| Other service activities | £293,800 | £339,300 |
| All industry average | £731,400 | £680,300 |
Source: Office of National Statistics (ONS). (2016, December 16). Regional gross value added (income approach), UK: 1997 to 2015. Retrieved from https://www.ons.gov.uk/economy/grossvalueaddedgva/bulletins/regionalgrossvalueaddedincomeapproach/december2016 [accessed 10 July 2017], Scottish Government. (2016, November). Businesses in Scotland. Retrieved from http://www.gov.scot/Topics/Statistics/Browse/Business/Corporate/BISPDF [accessed 5 July 2017], and Office of National Statistics (ONS) Nomis. (2016, October). UK Business Counts - Enterprises. Retrieved from https://www.nomisweb.co.uk/query/construct/summary.asp?mode=construct&version=0&dataset=142 [accessed 27 July 2017]
Investment
Business investment is net capital expenditurei by private and public corporations. These include investments in transport equipment, information and communication technology (ICT) equipment, other machinery and equipment, cultivated assets, intellectual property products (IPP, which includes investment in software, research and development, artistic originals and mineral exploration), and other buildings and structures. Business investment is a component of gross fixed capital formation (GFCFii).
Business investment does not include investment by central or local government, investment in dwellings, or the costs associated with the transfer of non-produced assets (such as land).
Scotland's business investment totalled £11.3 billion in 2016. Scotland's share of business investment represented 6% of total UK investment. Scotland's 2016 total represented a decline of 8% on the previous year. This decrease brought to a halt a sustained period of growth witnessed between 2010 to 2015 (see Figure 15). This is in contrast to the UK level, where business investment continues to grow (although very moderately over the year to 2016), expanding on the growth period started in 2009. Prior to 2010, investment at both a Scotland and UK level was relatively volatile.
Source: Office of National Statistics (OBS). (2017, June). Business investment in the UK: Jan to Mar 2017 revised results. Retrieved from https://www.ons.gov.uk/economy/grossdomesticproductgdp/bulletins/businessinvestment/jantomar2017revisedresults [accessed 24 July 2017] and Scottish Government. (2017, May 23). Quarterly National Accounts Scotland, 2016 Quarter 4. Retrieved from http://www.gov.scot/Topics/Statistics/Browse/Economy/QNA2016Q4 [accessed 25 July 2017] Note Scotland business investment data is classed as experimental as it is a new release.
Companies by ownership
Information on the ownership of enterprises operating in Scotland is only available for the 173,995 enterprises registered for VAT and/or PAYE. Within the Scottish Government's ‘Businesses in Scotland’ publication, enterprises can be either ‘Scotland based’, ‘Rest of the UK (RUK) based’ or 'Abroad-owned'. For example, 'Scotland based' businesses are enterprises that are UK-owned and that have their registered office in Scotland.
Ownership overview
The majority of Scotland's private sector enterprises were Scotland-owned (97%). These indigenous enterprises contributed 66% of employment and 46% of turnover. Total non-Scottish owned enterprises (RUK-owned and Abroad-owned) represented 3% of enterprises, and accounted for 35% of employment and 54% of turnover.
Source: Scottish Government. (2016, November). Businesses in Scotland. Retrieved from http://www.gov.scot/Topics/Statistics/Browse/Business/Corporate/BISPDF [accessed 5 July 2017]
Figure 17 examines ownership by size. The metrics (enterprises, employment, turnover) related to small enterprises (0-49 employees) were very much dominated by indigenous Scottish-owned firms. Whereas large enterprises (250+ employees) were more likely to be non-Scottish owned (RUK-owned and Abroad-owned) - these represented 81% of large enterprises, accounting for 62% of employment and 75% of turnover in large enterprises.
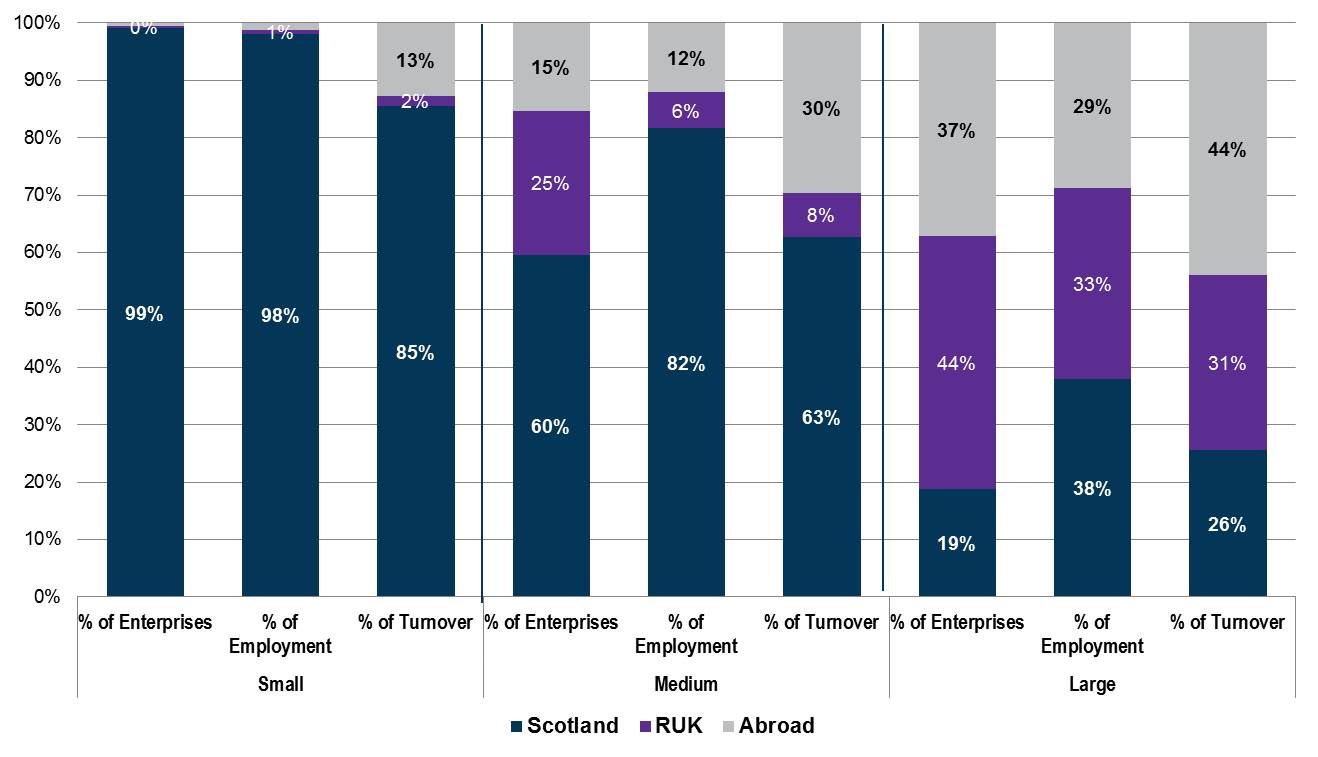
Source: Scottish Government. (2016, November). Businesses in Scotland. Retrieved from http://www.gov.scot/Topics/Statistics/Browse/Business/Corporate/BISPDF [accessed 5 July 2017]
Ownership by sector
The majority of industry sectors were in line with the overall Scottish average, where 97% of firms are Scottish owned (see Figure 18). The main areas of variation were financial and insurance activities (11% non-Scottish owned), manufacturing (6% non-Scottish owned), transport & storage (6% non-Scottish owned), and wholesale & retail trade (5% non-Scottish owned). However, when share of employment by industry sector is examined by ownership, much more disparity is evident (Figure 19).
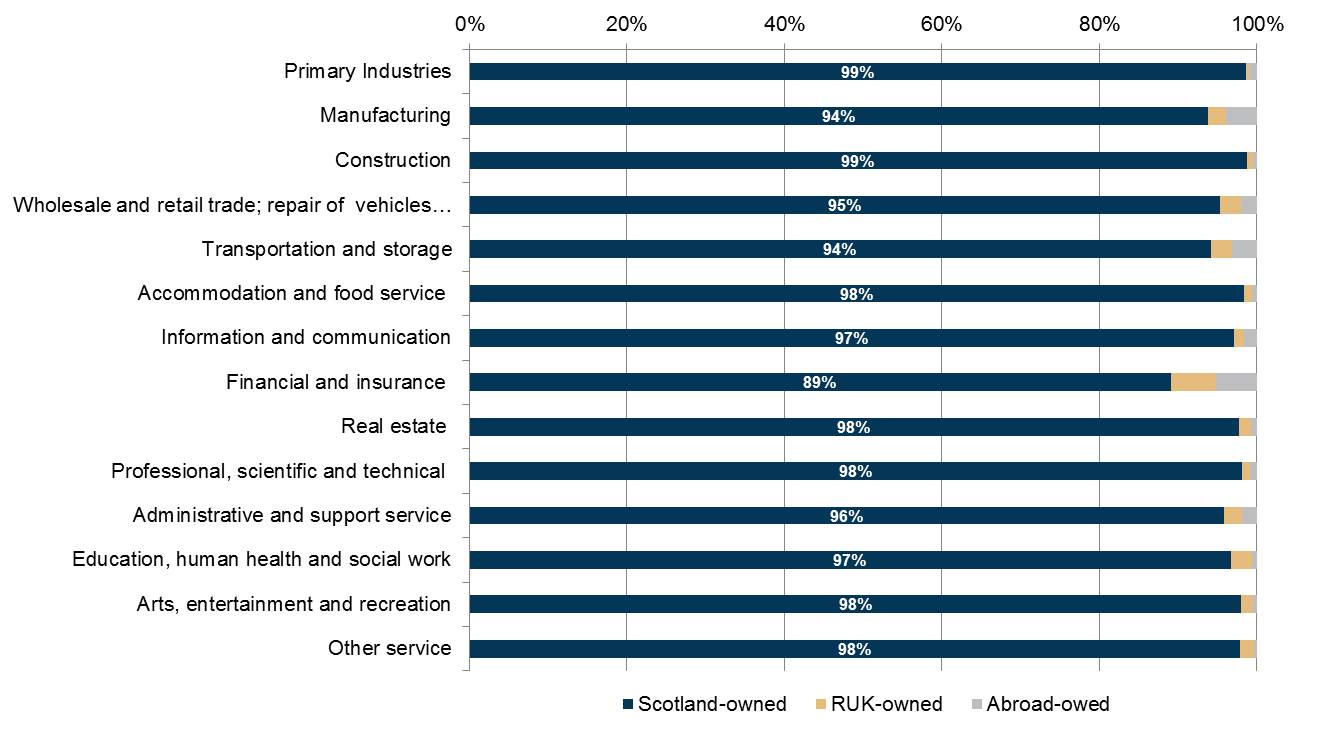
Source: Scottish Government. (2016, November). Businesses in Scotland. Retrieved from http://www.gov.scot/Topics/Statistics/Browse/Business/Corporate/BISPDF [accessed 5 July 2017]
The share of employment provided by Abroad-owned enterprises was significantly greater than the proportion of Abroad-owned enterprise (see Figure 19).
Only 1% of primary industry enterprises were Abroad-owned, yet these provided 28% of employment in the sector.
Four percent of manufacturing enterprises were Abroad-owned, providing 30% of employment in the sector.
Wholesale and retail (20%), transport and storage (23%), finance and insurance (24%) all had high shares of employment provided by Abroad-owned enterprises, relative to their total share of Abroad-owned firms.
The industry sectors other service activities (89%), real estate activities (87%), and construction (85%) all provided a high share of Scottish-owned employment.
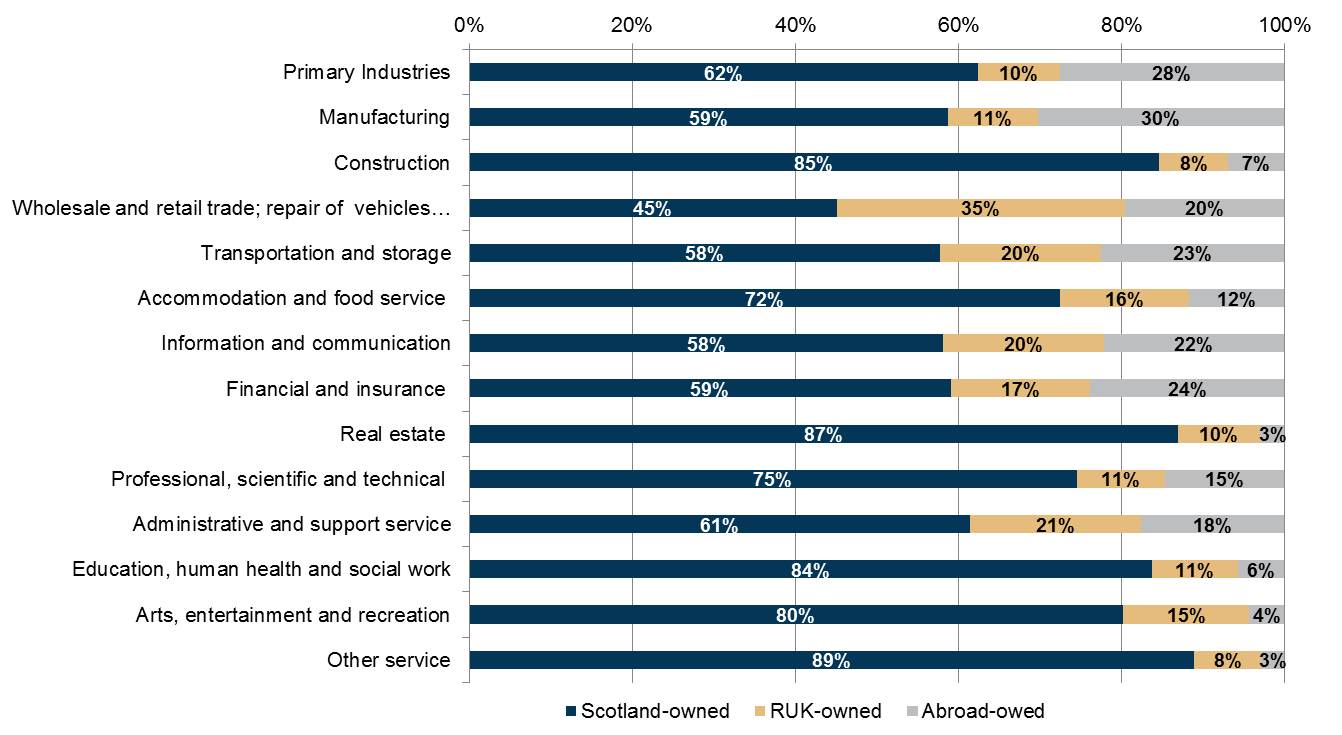
Source: Scottish Government. (2016, November). Businesses in Scotland. Retrieved from http://www.gov.scot/Topics/Statistics/Browse/Business/Corporate/BISPDF [accessed 5 July 2017]
Abroad-owned insights
Figure 16 showed that 1% of all registered enterprises in Scotland were Abroad-owned. This represented 2,305 of Scottish registered enterprises. Of these the largest proportions originated from the European Union (EU) and USA:
1,000 were EU Abroad-owned (43%) enterprises operating in Scotland – employing 127,110 people and generating a turnover of £36 billion (13% of all turnover from registered businesses in Scotland or 39% of all turnover from abroad-owned registered businesses in Scotland)
550 were USA Abroad-owned (24%) enterprises operating in Scotland – employing 102,810 people and generating a turnover of £34 billion (12% of all turnover from registered businesses in Scotland or 37% of all turnover from abroad-owned registered businesses in Scotland).
The remainder of Abroad-owned enterprises originated from a multitude of geographies, including Japan (85 enterprises), Australia (50), Canada (45), and Cayman Islands (40) to name but a few1.
Business base and internationalisation
There is no comprehensive dataset available that captures the internationalisation activity of the entire business base. This chapter highlights the data which are available, providing a good indicator of trends in internationalisation activity.
Trading internationally
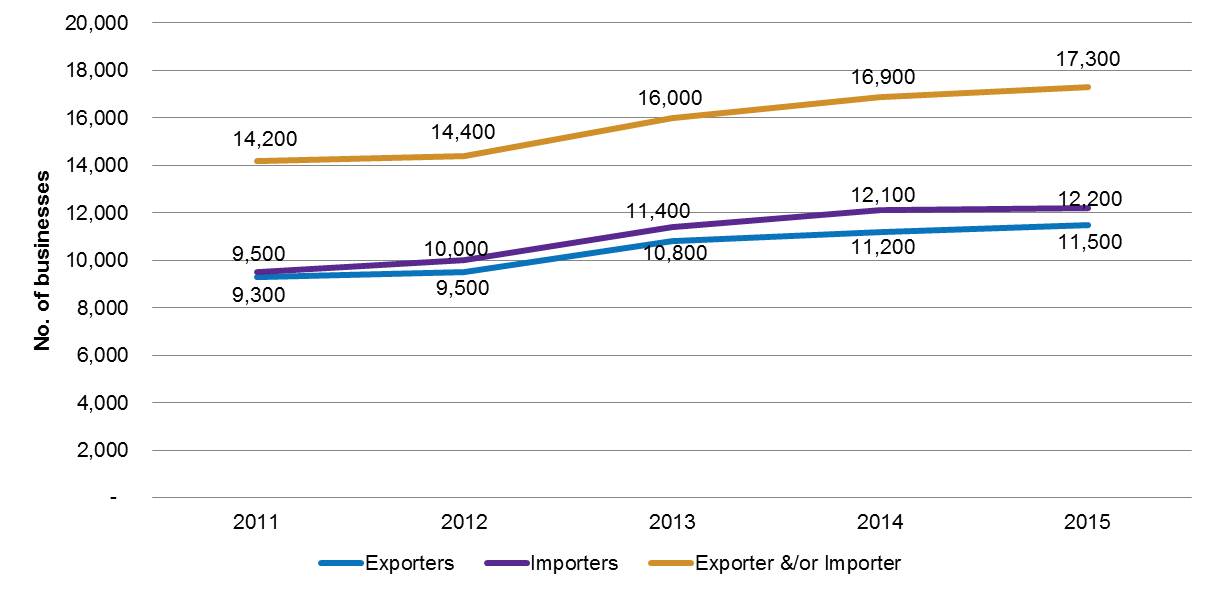
ONS Annual Business Survey1data showed an increase in the number of registered businesses in Scotland's non-financial business economy trading internationally, from 16,900 in 2014 to 17,300 in 2015 (2% increase).
In this instance, international trade is defined as the import and/or export of goods and/or services. These estimates cover the non-financial business economy in Scotland and exclude the following sectors: public administration and defence; public sector health and education; finance; animal and crop production; and household services. Thus, these counts under-estimate the number of businesses trading internationally due to sector coverage but are the best available indicators.
Source: Office of National Statistics (ONS). (2016, November). Annual Business Survey: Great Britain non-financial business economy exporters and importers, 2015 provisional results. Retrieved from https://www.ons.gov.uk/businessindustryandtrade/business/businessservices/articles/annualbusinesssurvey/greatbritainnonfinancialbusinesseconomyexportersandimporters2015provisionalresults [accessed 25 July 2017]
The 17,300 businesses trading internationally in 2015, represented approximately 10% of Scotland's registered business population in that period. Focusing on exporting, these 11,500 businesses represented 7% of the business base. Related data from the Small Business Survey Scotland3 found that the proportion of SMEs that stated they exported goods or services outside of the UK in 2016 was 16%. Thus, it can be estimated that 7%-16% of Scotland's business base are involved in export activity.
Furthermore, ONS Annual Business Survey data showed that in the four years to 2015, the number of businesses importing increased by 28% and those exporting by 24%. Scotland had the third fastest growth rate for exporting businesses, after Wales (27%) and East Midlands (26%) (see Table 9). Scotland's exporting firms represented 5% of all exporting firms in Great Britain. This was an under-performance relative to Scotland's working age population share of 9% (although it should be noted that the structure of Scotland's underlying business base is different). Both London and the South East significantly over-performed, in terms of the share of exporting firms, relative to population share.
| % change in no. exporting firms 2011 to 2015 | % of total GB exporters | % of total GB population (16+) - 2015 | |
|---|---|---|---|
| North East | 5% | 2% | 4% |
| North West | 15% | 8% | 11% |
| Yorkshire and The Humber | 10% | 6% | 9% |
| East Midlands | 26% | 7% | 7% |
| West Midlands | -4% | 7% | 9% |
| East of England | 7% | 11% | 10% |
| London | 18% | 23% | 13% |
| South East | 12% | 20% | 14% |
| South West | 18% | 9% | 9% |
| Wales | 27% | 2% | 5% |
| Scotland | 24% | 5% | 9% |
Source: Office of National Statistics (ONS). (2016, November). Annual Business Survey: Great Britain non-financial business economy exporters and importers, 2015 provisional results. Retrieved from https://www.ons.gov.uk/businessindustryandtrade/business/businessservices/articles/annualbusinesssurvey/greatbritainnonfinancialbusinesseconomyexportersandimporters2015provisionalresults [accessed 25 July 2017] Note data does not include Northern Ireland.
Exporting insights
Scottish Export Statistics1 show that total international and rest of the UK exports in 2015 (excluding oil and gas) were estimated at £78.6 billion, up £3.1 billion (4.1%) in the year. Exports to the rest of the UK accounted for 63% of this total, EU exports accounted for 16% and non-EU exports 21%.
Exports by sector
In the most recent Scottish Government data1, the largest export industry was the manufacture of food and beverages with exports worth £8.9 billion, 11% of all exports. The second largest industry was financial & insurance (£8.8 billion), followed by wholesale and retail trade (10.6% of all exports). Professional, scientific and technical activities (£8 billion, 10% of all exports), utilities (8% of all exports), and mining and quarrying (7% of all exports) complete the top 6 exporting industry sectors (Table 10). These sectors accounted for 58% of all exports.
| Value of International Exports (£, million) - (% of total international exports) 2015 | Value of Rest of UK and Exports (£, million) - (% of total Rest of UK exports) 2015 | % of All Exports (Total Rest of the UK and International) 2015 | |
|---|---|---|---|
| Manufacture of food & beverages | 4,835 (16.8%) | 4,075 (8.2%) | 11.3% |
| Financial & Insurance | 1,270 (4.4%) | 7,550 (15.1%) | 11.2% |
| Wholesale & retail trade | 1,640 (5.7%) | 6,660 (13.4%) | 10.6% |
| Professional, scientific and technical | 3,510 (12.2%) | 4,400 (8.8%) | 10.1% |
| Utilities | 295 (1.0%) | 5,785 (11.6%) | 7.7% |
| Mining & Quarrying | 2,135 (7.4%) | 3,140 (6.3%) | 6.7% |
Source: Scottish Government. (2017, January). Export Statistics Scotland. Retrieved from http://www.gov.scot/Topics/Statistics/Browse/Economy/Exports/ESSPublication [accessed 25 July 2017]
Please note these top 6 sectors are based on all exports (international and rest of UK) - the order of sectors will differ, if focusing on international only or rest of UK exports only. For example financial & insurance comprise 15% of rest of UK exports but only 4% of international exports.
Exports by company size
The majority (57%) of Scotland's export value (£45 billion) was generated by large enterprises. Medium sized enterprises accounted for 25% of all exports and this proportion has increased in recent years, growing by 27% between 2011 and 2015.
| Total Export value (£, millions) | % of total export value | 2011-2015 % change in value | |
|---|---|---|---|
| Small (<50 employees) | 14,175 | 18% | 10% |
| Medium (50-249 employees) | 19,295 | 25% | 27% |
| Large (250+ employees) | 45,100 | 57% | 5% |
Source: Scottish Government. (2017, January). Export Statistics Scotland. Retrieved from http://www.gov.scot/Topics/Statistics/Browse/Economy/Exports/ESSPublication [accessed 25 July 2017]
SPICe briefing SB 17-14 provides more information on Scotland's exports.
Manufacturing in the business base
Manufacturing has long been held as a sector that provides strength and stability to national economies, owing to its contribution to exports, productivity, and ability to create jobs (both skilled and semi-skilled). Manufacturing is no longer what it was in its mid twentieth century peak, nonetheless it is still of strategic importance for many economies.
Scotland has a proud manufacturing heritage as acknowledged in the recent strategy document 'A Manufacturing Future for Scotland', which recognises manufacturing is continually evolving, increasingly IT driven, and encompasses a wide variety of activities across a range of industrial and service sectors.
Manufacturing sub-sectors
As demonstrated previously in Table 1, in 2016 manufacturing represented 5% (18,355 enterprises registered and unregistered) of Scotland's business base. These businesses contributed 9% of Scottish employment and 14% of the economy's turnover.
Detail by manufacturing sub-sector, which is only available for registered enterprises, is shown in Table 12. Scotland's largest proportion (20%) of manufacturing enterprises were clustered around fabrication and metal product production. This was followed by repair and installation of machinery and equipment (12%) and wood related manufacturing (11%) rounded out the top three.
Food product manufacturing, despite been only the fourth largest manufacturing sector in terms of enterprise numbers, was the largest contributor to manufacturing employment. It provided 19% of all manufacturing employment and 15% of all manufacturing turnover.
Beverage manufacturing was the largest contributor (17%) to manufacturing turnover, even though it made-up only 2% of business stock in the wider manufacturing sector. And 7% of employment.
| % of total manufacturing enterprises | % of total manufacturing employment | % of total manufacturing turnover | |
|---|---|---|---|
| Manufacture of Fabricated and Metal Products | 20% | 12% | 7% |
| Repair and Installation of Machinery and Equipment | 12% | 8% | 10% |
| Manufacture of Wood and of Products of Wood and Cork | 11% | 4% | 3% |
| Manufacture of Food Products | 8% | 19% | 15% |
| Other Manufacturing | 7% | 3% | 1% |
| Printing and Reproduction of Recorded Media | 6% | 2% | 1% |
| Manufacture of Machinery and Equipment Not Elsewhere Classified | 6% | 8% | 8% |
| Manufacture of Computer, Electronic and Optical Products | 4% | 5% | 4% |
| Manufacture of Textiles | 3% | 3% | 1% |
| Manufacture of Other Non-Metallic Mineral Products | 3% | 3% | 2% |
| Manufacture of Rubber and Plastic Products | 3% | 5% | 4% |
| Manufacture of Furniture | 3% | 1% | 1% |
| Manufacture of Wearing Apparel | 2% | 2% | 1% |
| Manufacture of Beverages | 2% | 7% | 17% |
| Manufacture of Chemicals and Chemical Products | 2% | 3% | 8% |
| Manufacture of Other Transport Equipment | 2% | 6% | 7% |
| Manufacture of Electrical Equipment | 2% | 2% | 2% |
| Manufacture of Basic Metals | 1% | 1% | 2% |
| Manufacture of Motor Vehicles, Trailers and Semi-Trailers | 1% | 2% | 2% |
| Manufacture of Paper and Paper Products | 1% | 2% | 2% |
| Manufacture of Basic Pharmaceutical Products and Pharmaceutical Preparations | 0.3% | 2% | 2% |
| Manufacture of Leather and Related Products | 0.3% | 0.4% | Not available |
| Manufacture of Coke and Refined Petroleum | 0.1% | 0.6% | Not available |
| Total Manufacturing | 9,040 enterprises | 182,000 employment | £37,556 million |
Source: Scottish Government. (2016, November). Businesses in Scotland. Retrieved from http://www.gov.scot/Topics/Statistics/Browse/Business/Corporate/BISPDF [accessed 5 July 2017] Note: Data only refers to the registered enterprises. Unregistered are sole traders and partnerships who are not registered for PAYE or VAT. Totals may not equal the sum of the constituent parts due to rounding.
Manufacturing over time
Figure 21 shows that there has been a relatively moderate decline in the number of manufacturing enterprises in Scotland. The early 2000s saw a steep fall, which plateaued over the period 2003 to 2008. This was followed by another period of decline during the financial crisis of the late 2000s. However, from 2012 onwards the number of manufacturing enterprises has been on an upward trajectory. As of 2016 manufacturing enterprises numbers were almost back at 2000 levels.
Despite this relatively moderate decline in enterprise numbers, the same cannot be said for manufacturing employment numbers. The ten year period to 2011 witnessed a signifiant decline in manufacturing employment, followed by a relatively flat period with minor growth. The most recent 2016 data again saw a slight dip in numbers - it remains to be seen whether this will be a continued trend or a one off adjustment.
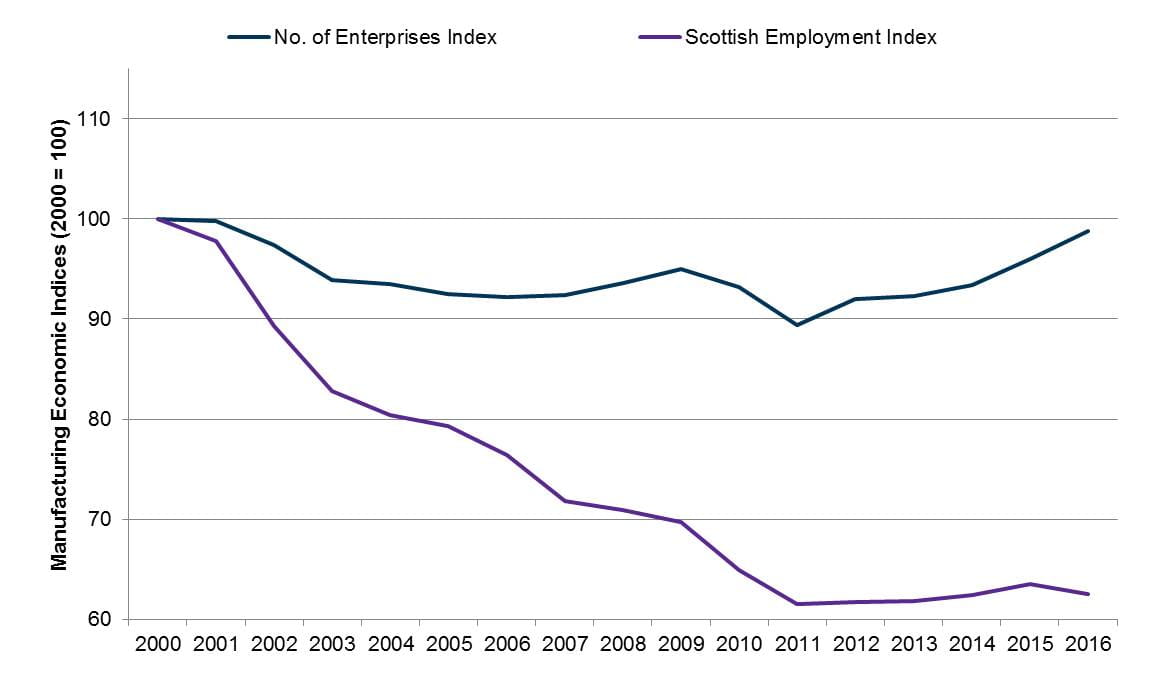
Source: Scottish Government. (2016, November). Businesses in Scotland. Retrieved from http://www.gov.scot/Topics/Statistics/Browse/Business/Corporate/BISPDF [accessed 5 July 2017] Note: Data only refers to the registered enterprises. Data prior to 2010 have been adjusted to reflect methodological changes and are therefore consistent.
Size of manufacturing enterprises
Manufacturing enterprises tend to be larger than the all setor Scottish average, particularly registered enterprises. Seven percent of registered manufacturing enterprises fall within the 50-249 employees sizeband, in contrast to a national average of two percent.
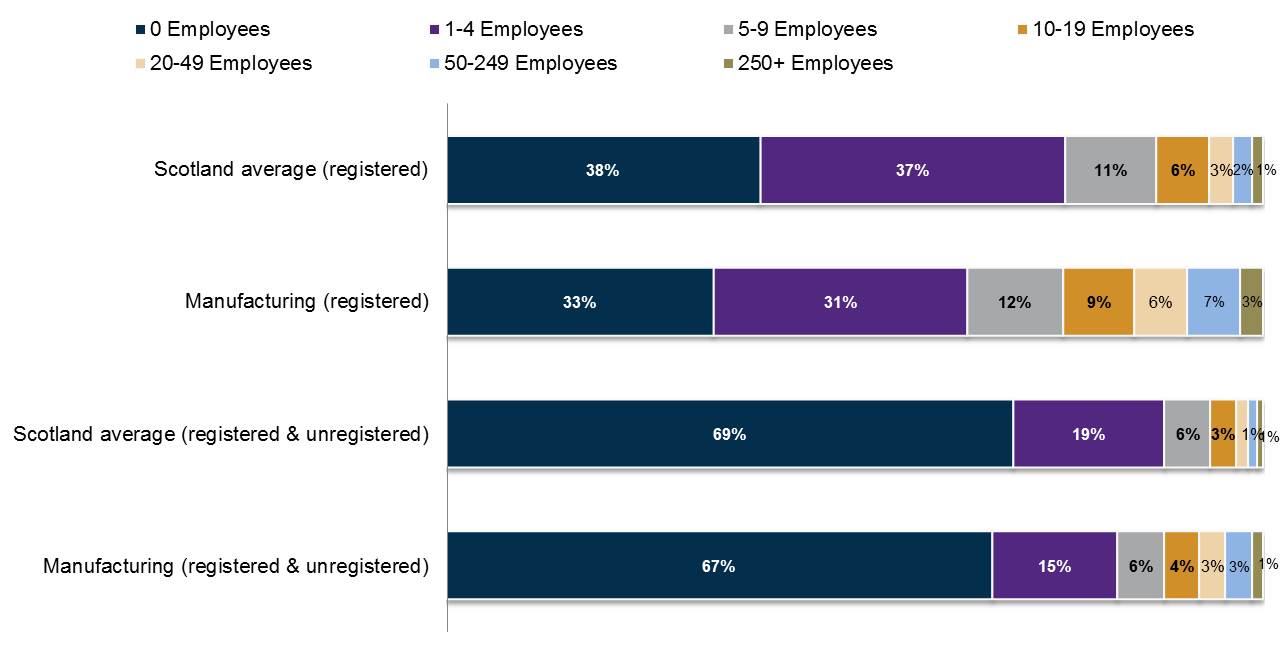
Source: Scottish Government. (2016, November). Businesses in Scotland. Retrieved from http://www.gov.scot/Topics/Statistics/Browse/Business/Corporate/BISPDF [accessed 5 July 2017]
Manufacturing exports
The combined value of international and rest of UK exports in 2015 (excluding oil and gas) was estimated at £78.6 billion. Of this total, £38.5 billion was attributable to service sector companies (49%) and £26.4 billion to the manufacturing sector (34%). The other £13.7 billion (17%) was from sectors classed as ‘other’. SPICe briefing SB 17-14 provides more information on Scotland's exports.
Just under a quarter (23%) of exports to the rest of the UK were from manufacturing sectors, whereas they made up over half (52%) of international exports.
“Food products, beverages and tobacco products” were the most valuable exports in 2015, worth £8.9 billion and accounting for 34% of total manufacturing exports.
Manufacturing accounted for 61% of exports to the EU with “Coke, refined petroleum and chemical products” the most valuable export to the EU.
Figure 23 shows that manufacturing exports have grown at a slower rate relative to total exports and service exports. The value of manufacturing exports declined in the early 2000's but since 2007 have generally shown a moderate upward trend.
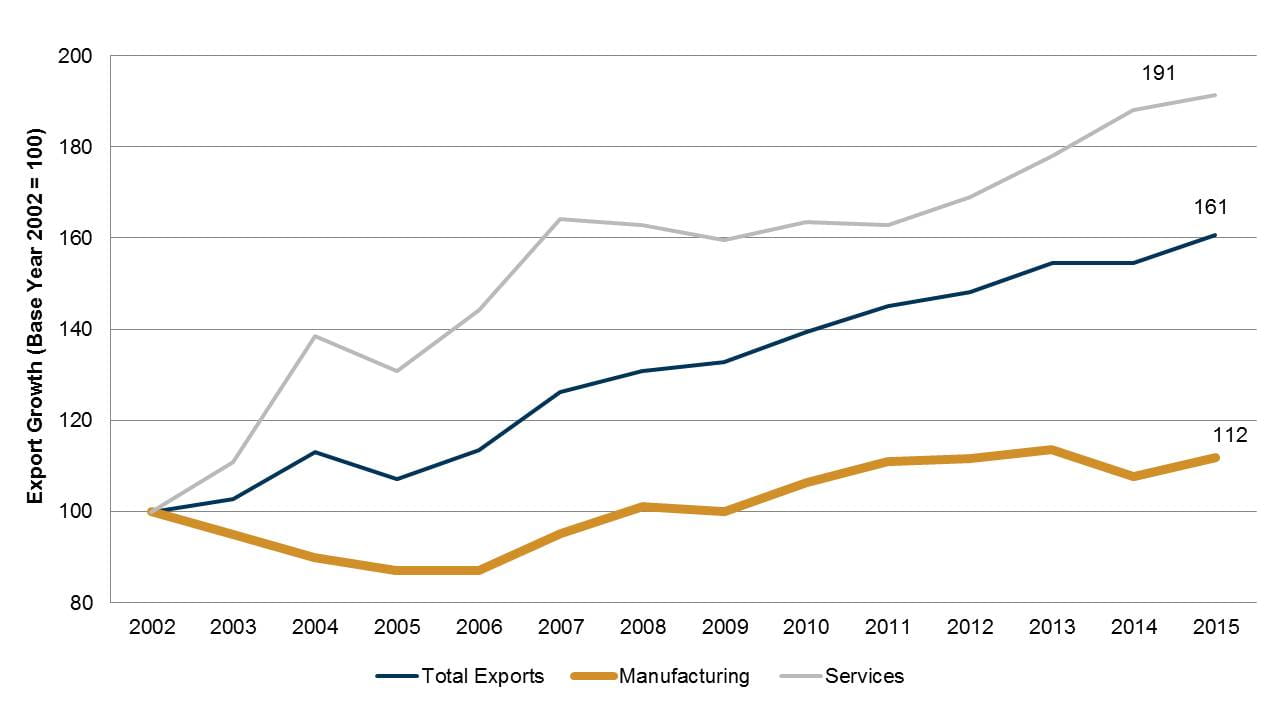
Source: Scottish Government. (2017, January). Export Statistics Scotland. Retrieved from http://www.gov.scot/Topics/Statistics/Browse/Economy/Exports/ESSPublication [accessed 25 July 2017]
Business base by local geography
This section provides an overview of Scotland's business base by local authority, parliamentary constituency, and urban-rural split. The data source used begins in 2010, thus this analysis has focussed on 1-year and 6-year growth rates.
Volume and trends by local authority
Table 13 provides a breakdown of the business base by local authority.
The top five local authority areas for business volumes in descending order were: City of Edinburgh (10.4% of all registered Scottish businesses), Glasgow City (10.2%), Aberdeenshire (7.8%), Highland (6.2%), and Aberdeen City (5.4%).
On the other end of the scale Na h-Eileanan Siar (0.7%) had the lowest number of enterprises, followed by Clackmannanshire (0.7%), Orkney Islands (0.8%), Shetland Islands (0.8%) and Inverclyde (1%).
However, when business volumes are viewed as a ratio of adult population in an area – illustrating business density in an area – the top five picture is quite different (again in descending order): Orkney Islands, Shetland Islands, Aberdeenshire, Highland, and Scottish Borders. For more detail see Business Density Section.
Between 2015 and 2016, the majority of local authority areas saw an increase in the number of registered enterprises. However, five of Scotland’s 32 local authority areas experienced a falling registered business count between 2015 and 2016 – Aberdeen City (down 155 businesses), Argyll and Bute (-10), Dumfries and Galloway (-65), Na h-Eileanan Siar (-10) and the Orkney Islands (-25). The City of Edinburgh local authority area experienced the greatest increase, with a rise of 835 enterprises between 2015 and 2016 – followed by Glasgow City local authority area with an increase of 740 enterprises.
The six year growth rate for local authority business stock was positive in all but three local authorities:
Dumfries and Galloway saw business stock decrease by 1%
there was zero percent growth in Argyll & Bute and Orkney Islands, where stock rates plateaued
Edinburgh (21%), Aberdeen (20%), East Renfrewshire (18%), and North Lanarkshire (17%) had the highest stock growth rates over the six years.
| No. Registered Enterprises | % of Scottish Total | One-Year Change (2015-2016) | Six-Year Change (2010-2016) | |
|---|---|---|---|---|
| Aberdeen City | 10,040 | 5% | -2% | 20% |
| Aberdeenshire | 14,485 | 8% | 0% | 13% |
| Angus | 4,155 | 2% | 1% | 9% |
| Argyll and Bute | 4,070 | 2% | 0% | 0% |
| City of Edinburgh | 19,285 | 10% | 5% | 21% |
| Clackmannanshire | 1,285 | 1% | 2% | 9% |
| Dumfries and Galloway | 6,705 | 4% | -1% | -1% |
| Dundee City | 3,760 | 2% | 1% | 10% |
| East Ayrshire | 3,405 | 2% | 1% | 9% |
| East Dunbartonshire | 3,160 | 2% | 4% | 16% |
| East Lothian | 3,260 | 2% | 4% | 15% |
| East Renfrewshire | 2,730 | 1% | 3% | 18% |
| Falkirk | 4,195 | 2% | 3% | 14% |
| Fife | 9,760 | 5% | 2% | 10% |
| Glasgow City | 18,910 | 10% | 4% | 15% |
| Highland | 11,485 | 6% | 1% | 7% |
| Inverclyde | 1,860 | 1% | 4% | 10% |
| Midlothian | 2,495 | 1% | 3% | 15% |
| Moray | 3,485 | 2% | 2% | 6% |
| Na h-Eileanan Siar | 1,230 | 1% | -1% | 8% |
| North Ayrshire | 3,480 | 2% | 1% | 8% |
| North Lanarkshire | 7,910 | 4% | 4% | 17% |
| Orkney Islands | 1,530 | 1% | -2% | 0% |
| Perth and Kinross | 6,485 | 3% | 0% | 4% |
| Renfrewshire | 5,015 | 3% | 3% | 9% |
| Scottish Borders | 5,330 | 3% | 0% | 3% |
| Shetland Islands | 1,530 | 1% | 3% | 13% |
| South Ayrshire | 3,885 | 2% | 3% | 5% |
| South Lanarkshire | 9,285 | 5% | 3% | 11% |
| Stirling | 4,275 | 2% | 2% | 8% |
| West Dunbartonshire | 2,040 | 1% | 5% | 14% |
| West Lothian | 5,065 | 3% | 4% | 14% |
| Scotland | 173,995 | 100% | 2% | 12% |
Source: Scottish Government. (2016, November). Businesses in Scotland. Retrieved from http://www.gov.scot/Topics/Statistics/Browse/Business/Corporate/BISPDF [accessed 5 July 2017] Note: Data only refers to the registered enterprises. Unregistered are sole traders and partnerships who are not registered for PAYE or VAT. Totals may not equal the sum of the constituent parts due to rounding.
Local authority business density
The average number of businesses (registered) in Scotland per 10,000 resident adults was 388 in 2016.
The Orkney Islands have the highest business density ratio in Scotland. Many of the areas with high ranking business density rates were rural.
West Dunbartonshire had the lowest business density rate. A characteristic of the lower ranking areas was that many contained commuter towns and villages, or were within city suburbs.
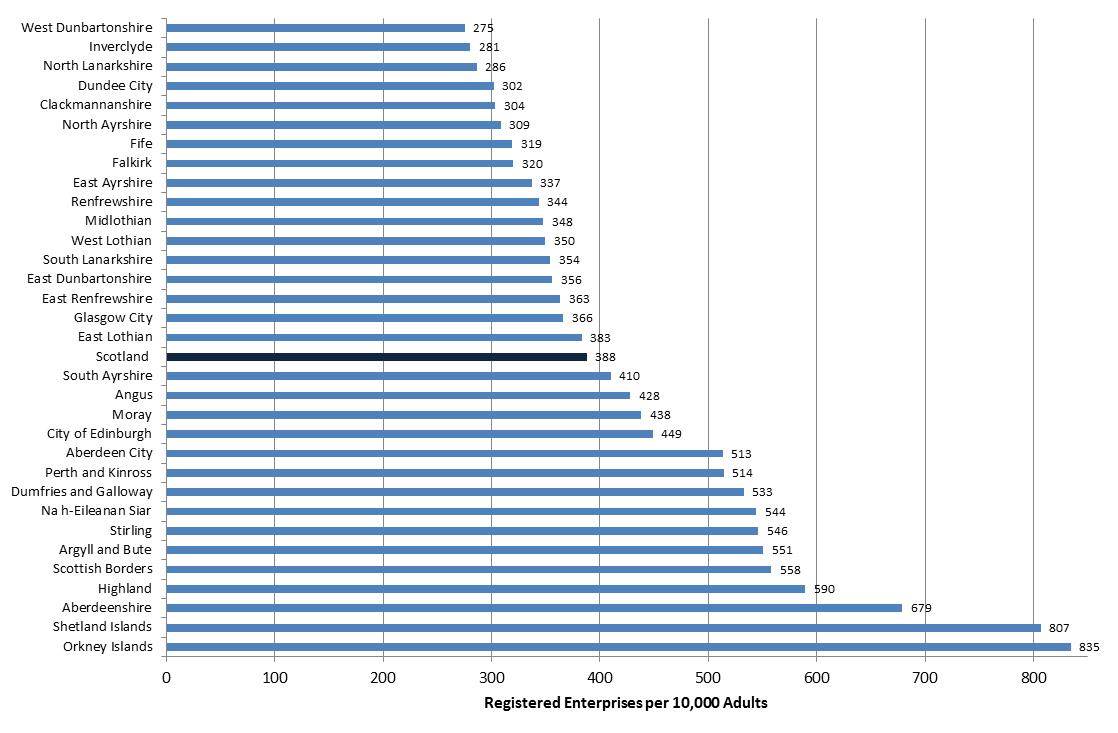
Source: Scottish Government. (2016, November). Businesses in Scotland. Retrieved from http://www.gov.scot/Topics/Statistics/Browse/Business/Corporate/BISPDF [accessed 5 July 2017] and National Records of Scotland. (2017, April 27). Mid-2016 population estimates Scotland. Retrieved from https://www.nrscotland.gov.uk/statistics-and-data/statistics/statistics-by-theme/population/population-estimates/mid-year-population-estimates/mid-2016 [accessed 27 June 2017]
Sector highlights by local authority
The share of Growth Sector and manufacturing enterprises varies by local authority, as demonstrated in Table 14.
Edinburgh, Glasgow, East Dunbartonshire, and East Renfrewshire had a relatively high proportion of creative industry enterprises.
There was a cluster of energy enterprises in Aberdeen City, Aberdeenshire, and Angus.
Aberdeen City, Edinburgh, East Renfrewshire, Aberdeenshire, and East Dunbartonshire all had a relatively high share of financial and business services. The high proportions in Aberdeen City and Aberdeenshire reflect support services to the oil and gas sector.
There was a high intensity of food and drink business stock in the Orkney Islands, Shetland Islands, Dumfries and Galloway, Scottish Borders, Aberdeenshire, and Argyll & Bute.
Mid Lothian had the highest proportion of life sciences enterprises but generally this sector had a very small presence across the business stock of local authorities.
Manufacturing activity was clustered around Clackmannanshire, North Lanarkshire, Renfrewshire, West Dunbartonshire, and Fife.
Argyll & Bute had the highest proportion of tourism enterprises. Dundee, Highland, North Ayrshire, and West Dunbartonshire also had a relatively high share of tourism businesses.
| Creative Industries* as % LA Enterprises | Energy* as % LA Enterprises | Financial & Business Services* as % LA Enterprises | Food & Drink* as % LA Enterprises | Life Sciences* as % LA Enterprises | Manufacturing as % LA Enterprises | Tourism* % LA Enterprises | |
|---|---|---|---|---|---|---|---|
| Aberdeen City | 9% | 8% | 28% | 1% | 0.3% | 5% | 5% |
| Aberdeenshire | 6% | 6% | 20% | 21% | 0.2% | 5% | 4% |
| Angus | 5% | 5% | 13% | 16% | 0.1% | 6% | 7% |
| Argyll and Bute | 4% | 2% | 9% | 20% | 0.1% | 5% | 13% |
| City of Edinburgh | 16% | 1% | 24% | 1% | 0.5% | 3% | 9% |
| Clackmannanshire | 7% | 1% | 15% | 4% | 0.4% | 7% | 9% |
| Dumfries and Galloway | 3% | 1% | 7% | 30% | 0.1% | 5% | 9% |
| Dundee City | 7% | 2% | 13% | 1% | 0.5% | 6% | 10% |
| East Ayrshire | 5% | 1% | 11% | 14% | 0.3% | 6% | 8% |
| East Dunbartonshire | 13% | 2% | 19% | 2% | 0.2% | 5% | 5% |
| East Lothian | 10% | 1% | 16% | 10% | 0.5% | 4% | 8% |
| East Renfrewshire | 12% | 1% | 21% | 3% | 0.0% | 4% | 5% |
| Falkirk | 9% | 2% | 16% | 3% | 0.1% | 6% | 7% |
| Fife | 8% | 2% | 15% | 7% | 0.4% | 7% | 9% |
| Glasgow City | 13% | 1% | 18% | 1% | 0.3% | 5% | 9% |
| Highland | 4% | 2% | 10% | 18% | 0.2% | 5% | 10% |
| Inverclyde | 8% | 2% | 17% | 2% | 0.3% | 5% | 8% |
| Midlothian | 9% | 1% | 15% | 5% | 1.2% | 6% | 7% |
| Moray | 4% | 3% | 10% | 18% | 0.1% | 5% | 8% |
| Na h-Eileanan Siar | 6% | 3% | 8% | 26% | 0.0% | 7% | 9% |
| North Ayrshire | 6% | 2% | 13% | 7% | 0.3% | 6% | 10% |
| North Lanarkshire | 7% | 1% | 13% | 2% | 0.4% | 7% | 8% |
| Orkney Islands | 2% | 3% | 5% | 45% | 0.7% | 3% | 6% |
| Perth and Kinross | 6% | 2% | 13% | 14% | 0.2% | 5% | 9% |
| Renfrewshire | 8% | 1% | 15% | 3% | 0.4% | 7% | 7% |
| Scottish Borders | 6% | 1% | 11% | 22% | 0.2% | 5% | 8% |
| Shetland Islands | 3% | 2% | 8% | 40% | 0.0% | 5% | 6% |
| South Ayrshire | 6% | 1% | 12% | 11% | 0.3% | 5% | 9% |
| South Lanarkshire | 8% | 1% | 14% | 7% | 0.2% | 7% | 7% |
| Stirling | 9% | 1% | 16% | 9% | 0.5% | 4% | 9% |
| West Dunbartonshire | 7% | 1% | 12% | 3% | 0.2% | 7% | 10% |
| West Lothian | 10% | 1% | 16% | 3% | 0.5% | 6% | 7% |
Source: Scottish Government. (2016, November). Businesses in Scotland. Retrieved from http://www.gov.scot/Topics/Statistics/Browse/Business/Corporate/BISPDF [accessed 5 July 2017] and Scottish Government. (2017, July). Growth Sector Statistics Database. Retrieved from http://www.gov.scot/Topics/Statistics/Browse/Business/Publications/GrowthSectors/Database [accessed 10 July 2017]* signifies Growth Sector definition.
Business base by constituency
Table 15 provides a breakdown of the business base by parliamentary constituency.
The top five constituencies for business stock in 2016 were: Edinburgh Central (4.1% of registered Scottish enterprises), Glasgow Kelvin (3.9%), Aberdeenshire West (2.7%), Aberdeen Central (2.5%), and Aberdeenshire East (2.4%). In contrast, the areas with the lowest volume of business stock were: Glasgow Provan (0.6%), Na h-Eileanan an Iar (0.7%), Glasgow Pollock (0.7%), Cunninghame South (0.7%), and Glasgow Maryhill and Springburn (0.7%).
In the year to 2016, there was mixed performance in terms of business stock growth across constituencies. A small number of areas witnessed a moderate decline in business stock (e.g. Angus North and Mearns 4% decline). However, the majority of areas experienced growth - notable increases were recorded in Edinburgh Pentlands (17%), Edinburgh Eastern (11%), and Hamilton, Larkhall and Stonehouse (10%).
Every constituency has seen business stock increase since 2010. Some more rural constituencies have had relatively moderate growth (e.g. Ettrick, Roxburgh and Berwickshire (4%), Galloway and West Dumfries (5%)), whilst urban areas, particularly cities, have seen significant growth (e.g. Aberdeen South and North Kincardine (31%), Glasgow Provan (43%)).
| Scottish Parliamentary Constituency | No. of Registered Enterprises | % of Scottish Total | One-Year Change (2015-2016) | Six-Year Change (2010-2016) |
|---|---|---|---|---|
| Aberdeen Central | 4,260 | 2.5% | -2% | 25% |
| Aberdeen Donside | 2,290 | 1.3% | -1% | 28% |
| Aberdeen South and North Kincardine | 3,295 | 1.9% | -2% | 31% |
| Aberdeenshire East | 4,205 | 2.4% | 0% | 17% |
| Aberdeenshire West | 4,720 | 2.7% | -2% | 15% |
| Airdrie and Shotts | 1,495 | 0.9% | 2% | 17% |
| Almond Valley | 2,005 | 1.2% | 6% | 30% |
| Angus North and Mearns | 3,145 | 1.8% | -4% | 15% |
| Angus South | 2,250 | 1.3% | 5% | 22% |
| Argyll and Bute | 3,105 | 1.8% | -1% | 5% |
| Ayr | 2,200 | 1.3% | 4% | 14% |
| Banffshire and Buchan Coast | 3,465 | 2.0% | 4% | 15% |
| Caithness, Sutherland and Ross | 3,885 | 2.3% | 1% | 16% |
| Carrick, Cumnock and Doon Valley | 2,240 | 1.3% | 2% | 14% |
| Clackmannanshire and Dunblane | 1,760 | 1.0% | -1% | 17% |
| Clydebank and Milngavie | 1,735 | 1.0% | 3% | 28% |
| Clydesdale | 2,655 | 1.5% | 4% | 12% |
| Coatbridge and Chryston | 1,430 | 0.8% | 1% | 24% |
| Cowdenbeath | 1,600 | 0.9% | 6% | 28% |
| Cumbernauld and Kilsyth | 1,490 | 0.9% | 9% | 30% |
| Cunninghame North | 1,950 | 1.1% | 2% | 18% |
| Cunninghame South | 1,235 | 0.7% | 0% | 14% |
| Dumbarton | 1,630 | 0.9% | 3% | 11% |
| Dumfriesshire | 3,250 | 1.9% | -2% | 5% |
| Dundee City East | 1,470 | 0.9% | 4% | 24% |
| Dundee City West | 1,755 | 1.0% | -2% | 16% |
| Dunfermline | 1,945 | 1.1% | 3% | 28% |
| East Kilbride | 1,830 | 1.1% | 4% | 27% |
| East Lothian | 2,505 | 1.5% | 4% | 22% |
| Eastwood | 2,115 | 1.2% | 5% | 29% |
| Edinburgh Central | 7,065 | 4.1% | 4% | 22% |
| Edinburgh Eastern | 1,550 | 0.9% | 11% | 40% |
| Edinburgh Northern and Leith | 3,200 | 1.9% | 7% | 37% |
| Edinburgh Pentlands | 1,645 | 1.0% | 17% | 48% |
| Edinburgh Southern | 2,415 | 1.4% | 1% | 27% |
| Edinburgh Western | 2,195 | 1.3% | -4% | 30% |
| Ettrick, Roxburgh and Berwickshire | 3,125 | 1.8% | -2% | 4% |
| Falkirk East | 1,700 | 1.0% | 0% | 21% |
| Falkirk West | 2,020 | 1.2% | 5% | 26% |
| Galloway and West Dumfries | 3,045 | 1.8% | 0% | 5% |
| Glasgow Anniesland | 1,280 | 0.7% | 9% | 35% |
| Glasgow Cathcart | 1,345 | 0.8% | 1% | 23% |
| Glasgow Kelvin | 6,715 | 3.9% | 3% | 16% |
| Glasgow Maryhill and Springburn | 1,265 | 0.7% | 6% | 30% |
| Glasgow Pollok | 1,190 | 0.7% | 5% | 29% |
| Glasgow Provan | 1,035 | 0.6% | 0% | 43% |
| Glasgow Shettleston | 1,955 | 1.1% | 7% | 23% |
| Glasgow Southside | 2,505 | 1.5% | 4% | 26% |
| Greenock and Inverclyde | 1,355 | 0.8% | 2% | 14% |
| Hamilton, Larkhall and Stonehouse | 1,890 | 1.1% | 10% | 30% |
| Inverness and Nairn | 3,055 | 1.8% | 2% | 14% |
| Kilmarnock and Irvine Valley | 2,180 | 1.3% | 2% | 17% |
| Kirkcaldy | 1,635 | 1.0% | -1% | 16% |
| Linlithgow | 2,450 | 1.4% | 4% | 18% |
| Mid Fife and Glenrothes | 1,595 | 0.9% | 1% | 14% |
| Midlothian North and Musselburgh | 2,145 | 1.2% | 2% | 21% |
| Midlothian South, Tweeddale and Lauderdale | 2,595 | 1.5% | 4% | 22% |
| Moray | 2,630 | 1.5% | 2% | 13% |
| Motherwell and Wishaw | 1,590 | 0.9% | 5% | 31% |
| Na h-Eileanan an Iar | 1,165 | 0.7% | -1% | 14% |
| North East Fife | 2,435 | 1.4% | 3% | 13% |
| Orkney Islands | 1,465 | 0.9% | -1% | 4% |
| Paisley | 1,810 | 1.1% | 0% | 10% |
| Perthshire North | 3,265 | 1.9% | 2% | 12% |
| Perthshire South and Kinrossshire | 2,770 | 1.6% | -1% | 9% |
| Renfrewshire North and West | 1,990 | 1.2% | 3% | 22% |
| Renfrewshire South | 1,460 | 0.8% | 9% | 25% |
| Rutherglen | 1,650 | 1.0% | 2% | 21% |
| Shetland Islands | 1,450 | 0.8% | 3% | 17% |
| Skye, Lochaber and Badenoch | 3,900 | 2.3% | 1% | 9% |
| Stirling | 3,270 | 1.9% | 4% | 15% |
| Strathkelvin and Bearsden | 2,120 | 1.2% | 9% | 30% |
| Uddingston and Bellshill | 1,855 | 1.1% | -2% | 21% |
Source: Office of National Statistics (ONS) Nomis. (2016, October). UK Business Counts - Enterprises. Retrieved from https://www.nomisweb.co.uk/query/construct/summary.asp?mode=construct&version=0&dataset=142 [accessed 27 July 2017]
Urban-rural dimension
Analysis using the Scottish Government's six fold Urban Rural Classification illustrated the regional distribution of Scottish business stock.
Large urban areas have the highest proportion of enterprises (37%), which is relatively in line with population share (35%).
Rural areas over preform in terms of the ratio of enterprises (30%) to population (17%). Though employment in rural areas was in line with population.
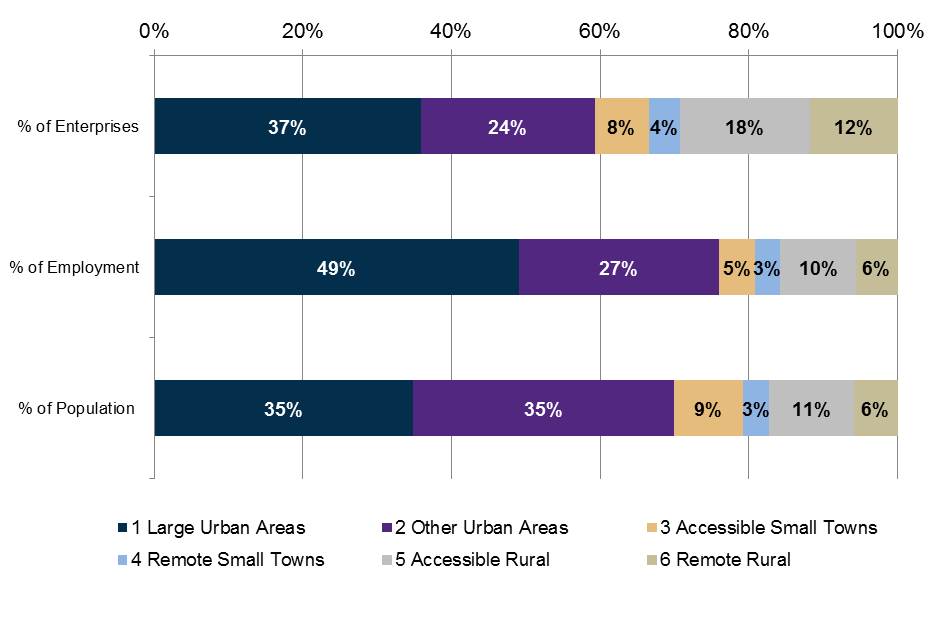
Source: Scottish Government. (2016, November). Businesses in Scotland. Retrieved from http://www.gov.scot/Topics/Statistics/Browse/Business/Corporate/BISPDF [accessed 5 July 2017] and National Records of Scotland. (2016, August 26). Population Estimates by Urban Rural Classification (2011 Data Zone based). Retrieved from https://www.nrscotland.gov.uk/statistics-and-data/statistics/statistics-by-theme/population/population-estimates/2011-based-special-area-population-estimates/population-estimates-by-urban-rural-classification [accessed 27 June 2017]
In terms of size and sector, the Businesses in Scotland publication stated the following:
SMEs account for a larger share of private sector employment in rural areas, compared to urban areas. As at March 2016, SMEs accounted for 79.3% of private sector employment in remote rural areas compared to 69.2% in accessible rural areas and 45.8% in the rest of Scotland.
In remote rural areas, the ‘Agriculture, Forestry & Fishing’ industrial sector had the largest share of private sector employment (18.0%), in accessible rural areas the Manufacturing sector was largest (16.1%) and in the rest of Scotland, the ‘Wholesale, Retail and Repair’ sector was largest (20.2%).
Key challenges for Scotland's business base
This chapter provides a summary of a range of recent research studies with Scotland's business base, specifically highlighting challenges that were identified.
Challenges - view from SMEs
SMEs make up 99% of Scotland's business base (registered and unregistered). Thus, it is important to understand their specific needs. Results from the Scottish Government's Small Business Survey highlight the main issues faced by SMEs. Figure 26 demonstrates that regulation/red tape was the most commonly reported major obstacles to business success, with 45% of SMEs reporting this as a key issue. This was followed by ‘competition in the market’ (42%) and taxation, VAT, PAYE, National Insurance, business rates (38%). Approximately one in five businesses stated that the UK exit from the EU was an obstacle and 18% saw the National Living Wage as a barrier to success. Just one in ten SMEs had no issues.
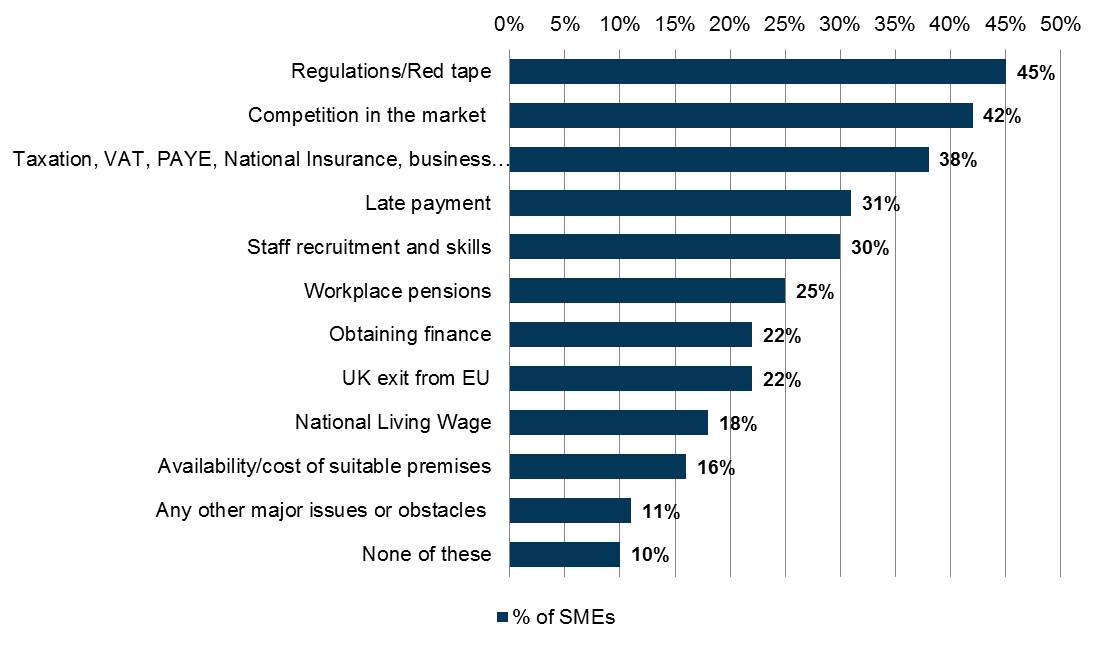
Source: Scottish Government. (2016, August). Small Business Survey Scotland 2015. Retrieved from http://www.gov.scot/Resource/0050/00504196.pdf [accessed 26 July 2017] Base: All SMEs (779)
Other points of note from the Small Business Survey :
The most common reason (21% of SMEs) for seeking advice was tax/National Insurance law and payments
Sixteen percent of SMEs had sought external finance in the last 12 months (compared to 13% for UK as a whole). The most common reason for applying for finance was for acquiring working capital/cash flow (65% of SMEs).
The Federation of Small Businesses Small Business Index2 found that increased fuel costs and the state of foreign economies had become a concern for small business owners. The Index also highlighted that profit margins for SMEs were decreasing (Q2 2017). A driver of falling profit margins was the weakened rate of sterling, which has been depreciating since the June 2016 referendum vote to leave the European Union. This has lead to higher prices for imported goods and services. Although it should also be noted that the Index highlighted that the weaker currency may boost Scottish exports by improving price competitiveness in overseas markets.
The Federation of Small Businesses Small Business Index showed that business confidence levels were subdued but despite this "smaller businesses continue to create jobs. While low unemployment is welcome, job creation without profit growth points to declining productivity in the Scottish workforce. This is likely to translate into weak pay growth for employees".
Wider economy challenges for businesses
Falling real incomes and rising recruitment problems were highlighted as threats to business success in the Scottish Chambers of Commerce’s Quarterly Economic Indicator1 .
Falling real income - "Consumer demand derives around three quarters of Scotland’s economic growth, so unless the recent falls in real earnings are reversed, there is a risk that the impact could spread to the wider economy. The retail sector is perhaps most exposed to pressures on household budgets. It is therefore worrying that almost half of retail respondents are reporting a fall in revenues and profits. Supply chain price rise pressures will compound that issue".
Recruitment issues - evidence suggests that the "low unemployment rate may be impacting on businesses’ ability to recruit the talent they need. Recruitment difficulties are growing across almost all sectors of the economy and we are seeing businesses increase their investment in staff training, possibly to improve the skills of existing staff or to bring new recruits up to speed, who may not have all the skills that the business needs".
The impact of the weak pound on Scottish businesses appears in a number of the research studies highlighted in this chapter. The Scottish Business Monitor2 noted that it is "having both positive and negative effects. Some sectors, particularly tourism are continuing to experience decent growth in turnover. A competitive pound makes Scotland an attractive place for overseas visitors and for Scottish/UK holidaymakers. But for many, the weak pound is putting pressure on in terms of rising costs, 56% of all businesses stated that costs rose over the last quarter".
In terms of the business base, it also important to recognise the regional split in business performance. Evidence from the Scottish Business Monitor shows that "businesses in all regions of Scotland – outside of the North East – reported growth in the total volume of business over the quarter. Conditions in the North East remained negative, but the situation has improved over the quarter".
The most recent Bank of Scotland PMI3 shows solid expansions in new business and employment. New orders received by Scottish private sector firms grew at the fastest rate since December 2014. Furthermore, the pace of expansion was above the series’ historical average. However, "input price inflation remained sharp, with the latest survey signalling a fractional acceleration in the rate of inflation. Furthermore, average cost burdens faced by Scottish private sector firms continue to increase at a faster pace than the series’ long-run average. Panellists pointed towards the exchange rate and wage inflation as key factors behind the rise".
The EY Scottish Item Club4 emphasised the need for business investment. It stated "the ending of the outsized contribution to GDP growth from construction as many of the big ticket public sector funded infrastructure projects near completion. With consumers also under pressure, means stronger growth will require higher levels of businesses investment". However, business investment has been subdued, constrained by the weaker consumer outlook and uncertainty about the UK’s future trading relationship with the EU.
Furthermore, Scottish businesses need to contend with changing global perceptions of Scotland. The EY Attractiveness Survey5 suggested that the "EU Referendum vote and its aftermath may be having an influence on global perceptions of Scotland and the UK’s long-term attractiveness and we could have reached a tipping point".
Sources
Scottish Government. (2016, November). Businesses in Scotland. Retrieved from <a href="http://www.gov.scot/Topics/Statistics/Browse/Business/Corporate/BISPDF" target="_blank">http://www.gov.scot/Topics/Statistics/Browse/Business/Corporate/BISPDF</a> [accessed 5 July 2017]
Department for Business, Energy & Industrial Strategy. (2016, October). Business population estimates for the UK and regions 2016: detailed tables. Retrieved from <a href="https://www.gov.uk/government/statistics/business-population-estimates-2016" target="_blank">https://www.gov.uk/government/statistics/business-population-estimates-2016</a> [accessed 28 June 2017]
Scottish Government. (2015, March 3). Scotland's Economic Strategy. Retrieved from <a href="http://www.gov.scot/Publications/2015/03/5984" target="_blank">http://www.gov.scot/Publications/2015/03/5984</a> [accessed 4 July 2017]
Scottish Government. (2017, July). Growth Sector Statistics Database. Retrieved from <a href="http://www.gov.scot/Topics/Statistics/Browse/Business/Publications/GrowthSectors/Database" target="_blank">http://www.gov.scot/Topics/Statistics/Browse/Business/Publications/GrowthSectors/Database</a> [accessed 10 July 2017]
Office of National Statistics (ONS). (2016, November 23). Business Demography. Retrieved from <a href="https://www.ons.gov.uk/businessindustryandtrade/business/activitysizeandlocation/datasets/businessdemographyreferencetable" target="_blank">https://www.ons.gov.uk/businessindustryandtrade/business/activitysizeandlocation/datasets/businessdemographyreferencetable</a> [accessed 28 June 2017]
Office of National Statistics (ONS). (2016, December 16). Regional gross value added (income approach), UK: 1997 to 2015. Retrieved from <a href="https://www.ons.gov.uk/economy/grossvalueaddedgva/bulletins/regionalgrossvalueaddedincomeapproach/december2016" target="_blank">https://www.ons.gov.uk/economy/grossvalueaddedgva/bulletins/regionalgrossvalueaddedincomeapproach/december2016</a> [accessed 10 July 2017]
Office of National Statistics (ONS) Nomis. (2016, October). UK Business Counts - Enterprises. Retrieved from <a href="https://www.nomisweb.co.uk/query/construct/summary.asp?mode=construct&version=0&dataset=142" target="_blank">https://www.nomisweb.co.uk/query/construct/summary.asp?mode=construct&version=0&dataset=142</a> [accessed 27 July 2017]
Office of National Statistics (OBS). (2017, June). Business investment in the UK: Jan to Mar 2017 revised results. Retrieved from <a href="https://www.ons.gov.uk/economy/grossdomesticproductgdp/bulletins/businessinvestment/jantomar2017revisedresults" target="_blank">https://www.ons.gov.uk/economy/grossdomesticproductgdp/bulletins/businessinvestment/jantomar2017revisedresults</a> [accessed 24 July 2017]
Scottish Government. (2017, May 23). Quarterly National Accounts Scotland, 2016 Quarter 4. Retrieved from <a href="http://www.gov.scot/Topics/Statistics/Browse/Economy/QNA2016Q4" target="_blank">http://www.gov.scot/Topics/Statistics/Browse/Economy/QNA2016Q4</a> [accessed 25 July 2017]
Office of National Statistics (ONS). (2016, November 9). Annual Business Survey importers and exporters regional breakdown. Retrieved from <a href="https://www.ons.gov.uk/businessindustryandtrade/business/businessservices/datasets/annualbusinesssurveyimportersandexportersregionalbreakdown" target="_blank">https://www.ons.gov.uk/businessindustryandtrade/business/businessservices/datasets/annualbusinesssurveyimportersandexportersregionalbreakdown</a> [accessed 25 July 2017]
Office of National Statistics (ONS). (2016, November). Annual Business Survey: Great Britain non-financial business economy exporters and importers, 2015 provisional results. Retrieved from <a href="https://www.ons.gov.uk/businessindustryandtrade/business/businessservices/articles/annualbusinesssurvey/greatbritainnonfinancialbusinesseconomyexportersandimporters2015provisionalresults" target="_blank">https://www.ons.gov.uk/businessindustryandtrade/business/businessservices/articles/annualbusinesssurvey/greatbritainnonfinancialbusinesseconomyexportersandimporters2015provisionalresults</a> [accessed 25 July 2017]
Scottish Government. (2016, August). Small Business Survey Scotland 2015. Retrieved from <a href="http://www.gov.scot/Resource/0050/00504196.pdf" target="_blank">http://www.gov.scot/Resource/0050/00504196.pdf</a> [accessed 26 July 2017]
Scottish Government. (2017, January). Export Statistics Scotland. Retrieved from <a href="http://www.gov.scot/Topics/Statistics/Browse/Economy/Exports/ESSPublication" target="_blank">http://www.gov.scot/Topics/Statistics/Browse/Economy/Exports/ESSPublication</a> [accessed 25 July 2017]
National Records of Scotland. (2017, April 27). Mid-2016 population estimates Scotland. Retrieved from <a href="https://www.nrscotland.gov.uk/statistics-and-data/statistics/statistics-by-theme/population/population-estimates/mid-year-population-estimates/mid-2016" target="_blank">https://www.nrscotland.gov.uk/statistics-and-data/statistics/statistics-by-theme/population/population-estimates/mid-year-population-estimates/mid-2016</a> [accessed 27 June 2017]
National Records of Scotland. (2016, August 26). Population Estimates by Urban Rural Classification (2011 Data Zone based). Retrieved from <a href="https://www.nrscotland.gov.uk/statistics-and-data/statistics/statistics-by-theme/population/population-estimates/2011-based-special-area-population-estimates/population-estimates-by-urban-rural-classification" target="_blank">https://www.nrscotland.gov.uk/statistics-and-data/statistics/statistics-by-theme/population/population-estimates/2011-based-special-area-population-estimates/population-estimates-by-urban-rural-classification</a> [accessed 27 June 2017]
Federation of Small Businesses Scotland. (2017, June). Small Businesss Index Q2 2017. Retrieved from <a href="https://www.fsb.org.uk/docs/default-source/fsb-org-uk/fsb-scotland-sbi-q2-2017.pdf?sfvrsn=0" target="_blank">https://www.fsb.org.uk/docs/default-source/fsb-org-uk/fsb-scotland-sbi-q2-2017.pdf?sfvrsn=0</a> [accessed 25 July 2017]
Scottish Chambers of Commerce. (2017, July 20). Quarterly Economic Indicator Q2 2017. Retrieved from <a href="http://www.scottishchambers.org.uk/press-policy/press-releases/2017/07/931" target="_blank">http://www.scottishchambers.org.uk/press-policy/press-releases/2017/07/931</a> [accessed 26 July 2017]
Fraser of Allander and Royal Bank of Scotland. (2017, July 3). Scottish Business Monitor Q2 2017. Retrieved from <a href="https://fraserofallander.org/2017/07/03/latest-royal-bank-of-scotland-scottish-business-monitor-results/" target="_blank">https://fraserofallander.org/2017/07/03/latest-royal-bank-of-scotland-scottish-business-monitor-results/</a> [accessed 26 July 2017]
Bank of Scotland. (2017, August 14). Bank of Scotland PMI (Purchasing Managers’ Index) Report August 2017. Retrieved from <a href="https://business.bankofscotland.co.uk/business-resource-centre/economic-and-market-insight/" target="_blank">https://business.bankofscotland.co.uk/business-resource-centre/economic-and-market-insight/</a> [accessed 31 August 2017]
EY. (2017, July). EY Scottish ITEM Club Summer Update 2017. Retrieved from <a href="http://www.ey.com/Publication/vwLUAssets/EY-Scottish-ITEM-Club-Summer-Update-2017/$FILE/EY-Scottish-ITEM-Club-Summer-Update-2017.pdf" target="_blank">http://www.ey.com/Publication/vwLUAssets/EY-Scottish-ITEM-Club-Summer-Update-2017/$FILE/EY-Scottish-ITEM-Club-Summer-Update-2017.pdf</a> [accessed 27 July 2017]
EY. (2017, May). EY’s Attractiveness Survey Scotland. Retrieved from <a href="http://www.ey.com/Publication/vwLUAssets/EY-attractiveness-survey-Scotland-2017/$FILE/EY-Scotland-Attractiveness-Survey-2017.pdf" target="_blank">http://www.ey.com/Publication/vwLUAssets/EY-attractiveness-survey-Scotland-2017/$FILE/EY-Scotland-Attractiveness-Survey-2017.pdf</a> [accessed 27 July 2017]