Local Government Finance: facts and figures 2024
This briefing provides a range of factual information and analysis on local government finance, including a profile of the local government budget over time, council tax and non domestic rates income, and expenditure trends from 2013-14 to 2024-25. Financial sustainability and capital investment are main focuses of the briefing. As such, there is extensive discussion of local government debt, borrowing and reserves.
Executive summary
Funding from the Scottish Government to local government, and spending by councils
The Scottish Government is providing local government with an overall funding package of £13.9 billion in 2024-25 (not including the money to help cover the council tax freeze).
Overall funding increased by £176 million in real terms over the year when comparing the 2024-25 Budget figure with the 2023-24 outturn figure.
The overall settlement is 1.9% higher in real terms when compared to financial year 2013-14, the earliest comparable year.
Revenue funding - which helps pay for day-to-day spending such as wages and operational costs - increased by £338 million in real terms between 2013-14 and 2024-25.
Employment costs constitute around 70% of local government revenue budgets.
Spending by councils on employment increased by 22% in real terms over the past 10 years – much of this being in the area of education.
The proportion of local government funding from the Scottish Government which is formally ring-fenced is lower now than it has been for 6 years.
COSLA argues that local government still sees high levels of "directed spend and protections" in areas such as education and social care.
Funding is distributed to local authorities on the basis of a needs based formula. This formula is agreed by COSLA and endorsed by COSLA leaders.
Not all local authorities have seen increases in their funding settlement since 2013-14.
Overall financial sustainability of local government
The Accounts Commission reported earlier this year that auditors have not identified any councils in Scotland as being financially unsustainable in the short term.
The financial sustainability indicators used by the Improvement Service's Local Government Benchmarking Framework (with indicators chosen by local government itself) suggest that local government is financially sustainable.
These national averages mask considerable variations at the local authority level.
A recent survey of council leaders and senior officials by the Local Government Information Unit found that confidence in the sustainability of council finances in Scotland is critically low
The biggest risk to financial sustainability across Scottish local government is the increasing demand in the area of adult social care, with the large amounts of money being spent on services struggling to keep up with demand.
Last year, the Accounts Commission warned: “there are signs that the [adult social care] sector is in crisis, with growing backlogs, declining satisfaction and no clear picture of demand or unmet need”.
Capital funding
Capital funding is used to pay for the buying, construction and improvement of physical property and other assets - things like schools, community centres, IT systems, paths and roads - whose benefits should last over a number of years, if not decades.
Local authorities receive capital grants from the Scottish Government, but they can also borrow for capital purposes.
Capital grant allocations from the Scottish Government this year are the lowest they have been since 2013-14.
Despite this, capital expenditure in 2024-25 is expected to be considerably higher than previous years. This will mainly be funded through borrowing.
Much of this increase in capital expenditure relates to the roll out of the Learning Estate Investment Programme
During the recent budget process, the then Minister for Local Government Empowerment and Planning explained that the cut to local government capital grants was as a result of a lower capital element in the Scottish Government's allocation from the UK Government.
COSLA told the Committee earlier this year that the “cut to our capital budget will have a significant effect on our work towards meeting our current and future net zero ambitions”.
Borrowing and debt
With reductions in capital grants from the Scottish Government, local authorities are borrowing more than ever. In 2024-25 it is expected councils will use over £3 billion from their Loans Funds to pay for capital projects.
This means that around 60% of capital spend this year will be funded through borrowing.
The amount of annual borrowing (£3.1 billion) has more than doubled (in real terms) since 2013-14 (when it stood at £1.5 billion, in 2024-25 prices).
Overall local government debt sat at at almost £22 billion in March 2023, with much of this being in the form of loans from the UK Government's Public Works Loans Board.
Although debt is at record levels – amounting to £4,000 per person – the costs of servicing debt, as a proportion of income, is lower than it has been for years.
One of the financial indicators in the Local Government Benchmarking Framework shows that local authorities across the country are paying less now on financing costs than they were in 2013-14.
Again, this national average masks considerable local variations. Some councils' financing costs as a percentage of net revenue stream sit at over 9%, whilst for others they are less than 1% .
Reserves
Reserves are the accumulated surpluses available to councils which have been generated over a number of years from various funding streams.
These have grown significantly recently, with Scottish Government data (collected from local authorities) showing that total usable reserves grew by 56% in real terms between March 2019 and March 2023.
Total usable reserves as at March 2023 stood at £4.5 billion, of which £2.9 billion are General Fund reserves.
According to the Accounts Commission, local authorities are increasingly using their reserves to plug budget gaps.
One of the financial sustainability indicators in the Local Government Benchmarking Framework shows that total useable reserves, as a % of council annual budgeted revenue, rose from 16% in 2013-14 to 24% in 2022-23.
Again, this national average masks some striking local variations, with the ratio ranging from 12% to 328%.
COSLA prefers to focus on unearmaked, or uncommitted, reserves, which stood at £480 million in March 2023.
The Accounts Commission believes a range of between 2% and 4% for unearmarked reserves as a proportion of total revenue income is healthy for local authorities. The national average, as published by the Local Government Benchmarking Framework is, on that basis, a healthy 3.2%.
However, some local authorities such as Angus and West Lothian have uncommitted General Fund reserves of less than 1% of net revenue income. Others, such as Orkney and Shetland, have uncommitted reserves of more than 12%.
The Accounts Commission states there is evidence that some local authorities are earmarking reserves for “contingency”. This may seem a little confusing, as theoretically, all usable reserves are potentially there for contingencies.
Impacts of spending decisions on communities and service users
There is evidence from the Scottish Household Survey that public satisfaction with services delivered by councils has reduced significantly over recent years.
Likewise, the Local Government Benchmarking Framework shows reductions in all four satisfaction indicators relating to adult social care, despite local authorities spending record amounts of money on these services.
According to the Accounts Commission, greater transparency is required in the reporting of financial outturn in council accounts, including savings performance.
Despite many local authorities seeking to involve the public in consultations relating to budget cuts, “councils need to better involve communities in service redesign to meet budget pressures” according to the Accounts Commission.
On the wider issue of public service reform, although there is a wealth of data available to councils, the Accounts Commission concluded in 2023 that "there is limited evidence in some councils of using performance data to drive improvements".
Comparison with other parts of the UK
Comparing local government finance across the UK is a tricky business due to the differences in how councils are funded and differences in the responsibilities of local authorities.
Nevertheless, statistics published by the UK Government show that spend by local government in Scotland is significantly higher per head than in England, but slightly lower than in Wales.
Over the past 10 years, there has been an 8% real terms reduction in expenditure by local government in England. In Scotland, spend by local government has increased by 2% over the period, and in Wales by 4%.
Northern Ireland is an outlier, as spending that would be the responsibility of local government in Scotland, England and Wales is mostly undertaken by Northern Ireland Assembly departments (education and social care for example).
Introduction
As the dust settles on the 2024-25 budget process, and the Local Government, Housing and Planning Committee starts its next round of pre-budget scrutiny, now is a good time to set out some trends in local government finance over recent years. This briefing does so at the national and local level, analysing changes in revenue and capital budgets across Scotland, as well as exploring spending trends and discussing a range of financial sustainability indicators.
Given the Parliament's role in scrutinising decisions made by the Scottish Government - and approving the annual local government finance order - we mainly focus on funding from the Scottish Government to local authorities. This comes in the form of general and specific grants, along with distributions of centrally-pooled Non-Domestic Rates income (NDRI). Local Government Finance Circulars provide the best source of information on these funding streams, and circulars are used throughout the first half of the briefing as one of the main sources of financial data.
Local authorities have other funding streams beyond government grants, including council tax - Scotland's only truly local tax (at the moment). The briefing discusses changes to council tax income over recent years, again at a national and local level, and shows how council tax as a proportion of total council income varies significantly across the country. Councils also get income from fees, rents and other charges; however, these are outside the scope of this briefing (except to the extent that such income is reflected in expenditure data).
Councils operate independently of central government and are accountable to their electorates for the services they provide. It is the responsibility of individual councils to decide how they spend their money and manage their accounts, although local government representatives consistently argue that there has been too much Scottish Government interference and influence in these decisions over recent years. There is a wealth of data available on service expenditure at a local authority level, and this briefing analyses some of this, presenting expenditure trends and highlighting some performance data.
Local government is a devolved area and the overall financial sustainability of local government - which accounts for a third of the Scottish Government's budget - is a matter of importance to the Scottish Parliament, not least its Local Government, Housing and Planning Committee. The Cabinet Secretary for Finance and Local Government has ultimate responsibility for the resilience of the local government finance system in Scotland1, and the Parliament has an important role in scrutinising Scottish Government spending and policy decisions.
Members of the Scottish Parliament often ask SPICe about the local government finance situation in other parts of the UK. This has especially been the case after announcements of Section 114 (financial distress) notices in some English local authorities. As such, this briefing includes a short section at the end looking at local government spending across the UK.
The overall local government settlement (revenue + capital)
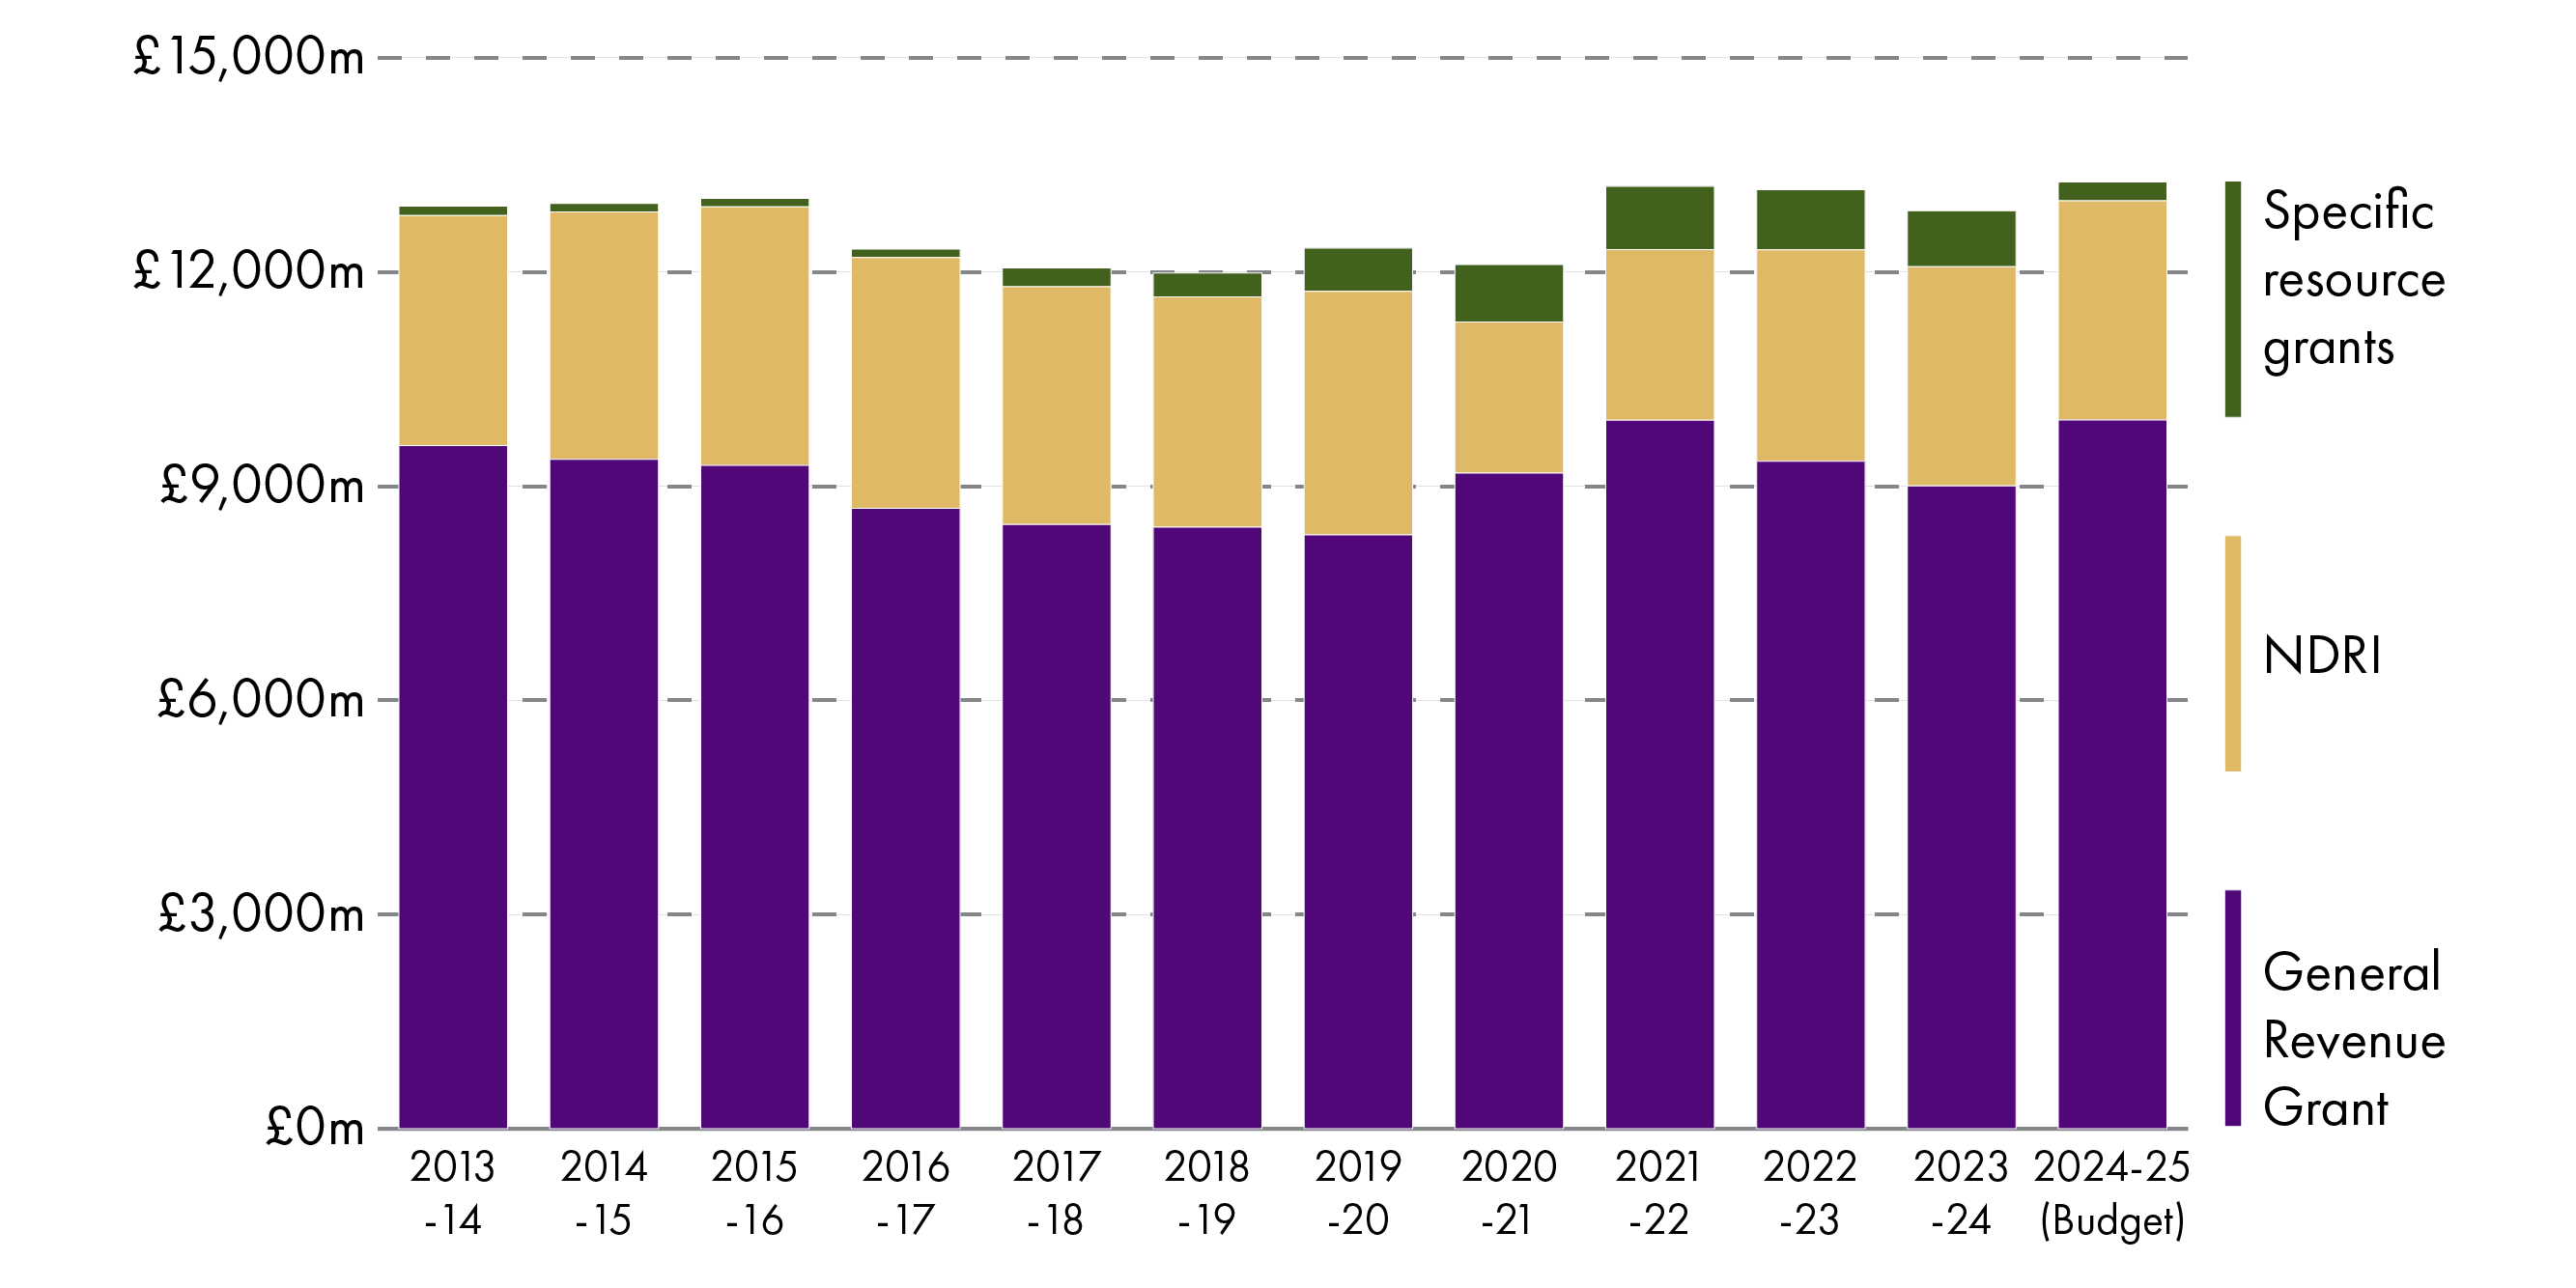
Local Government Finance Circular 02/2024 shows that the Scottish Government is providing an overall funding package of £13.9 billion to local government in 2024-251 (which does not include funding for the council tax freeze). This is the highest ever allocation in cash terms.
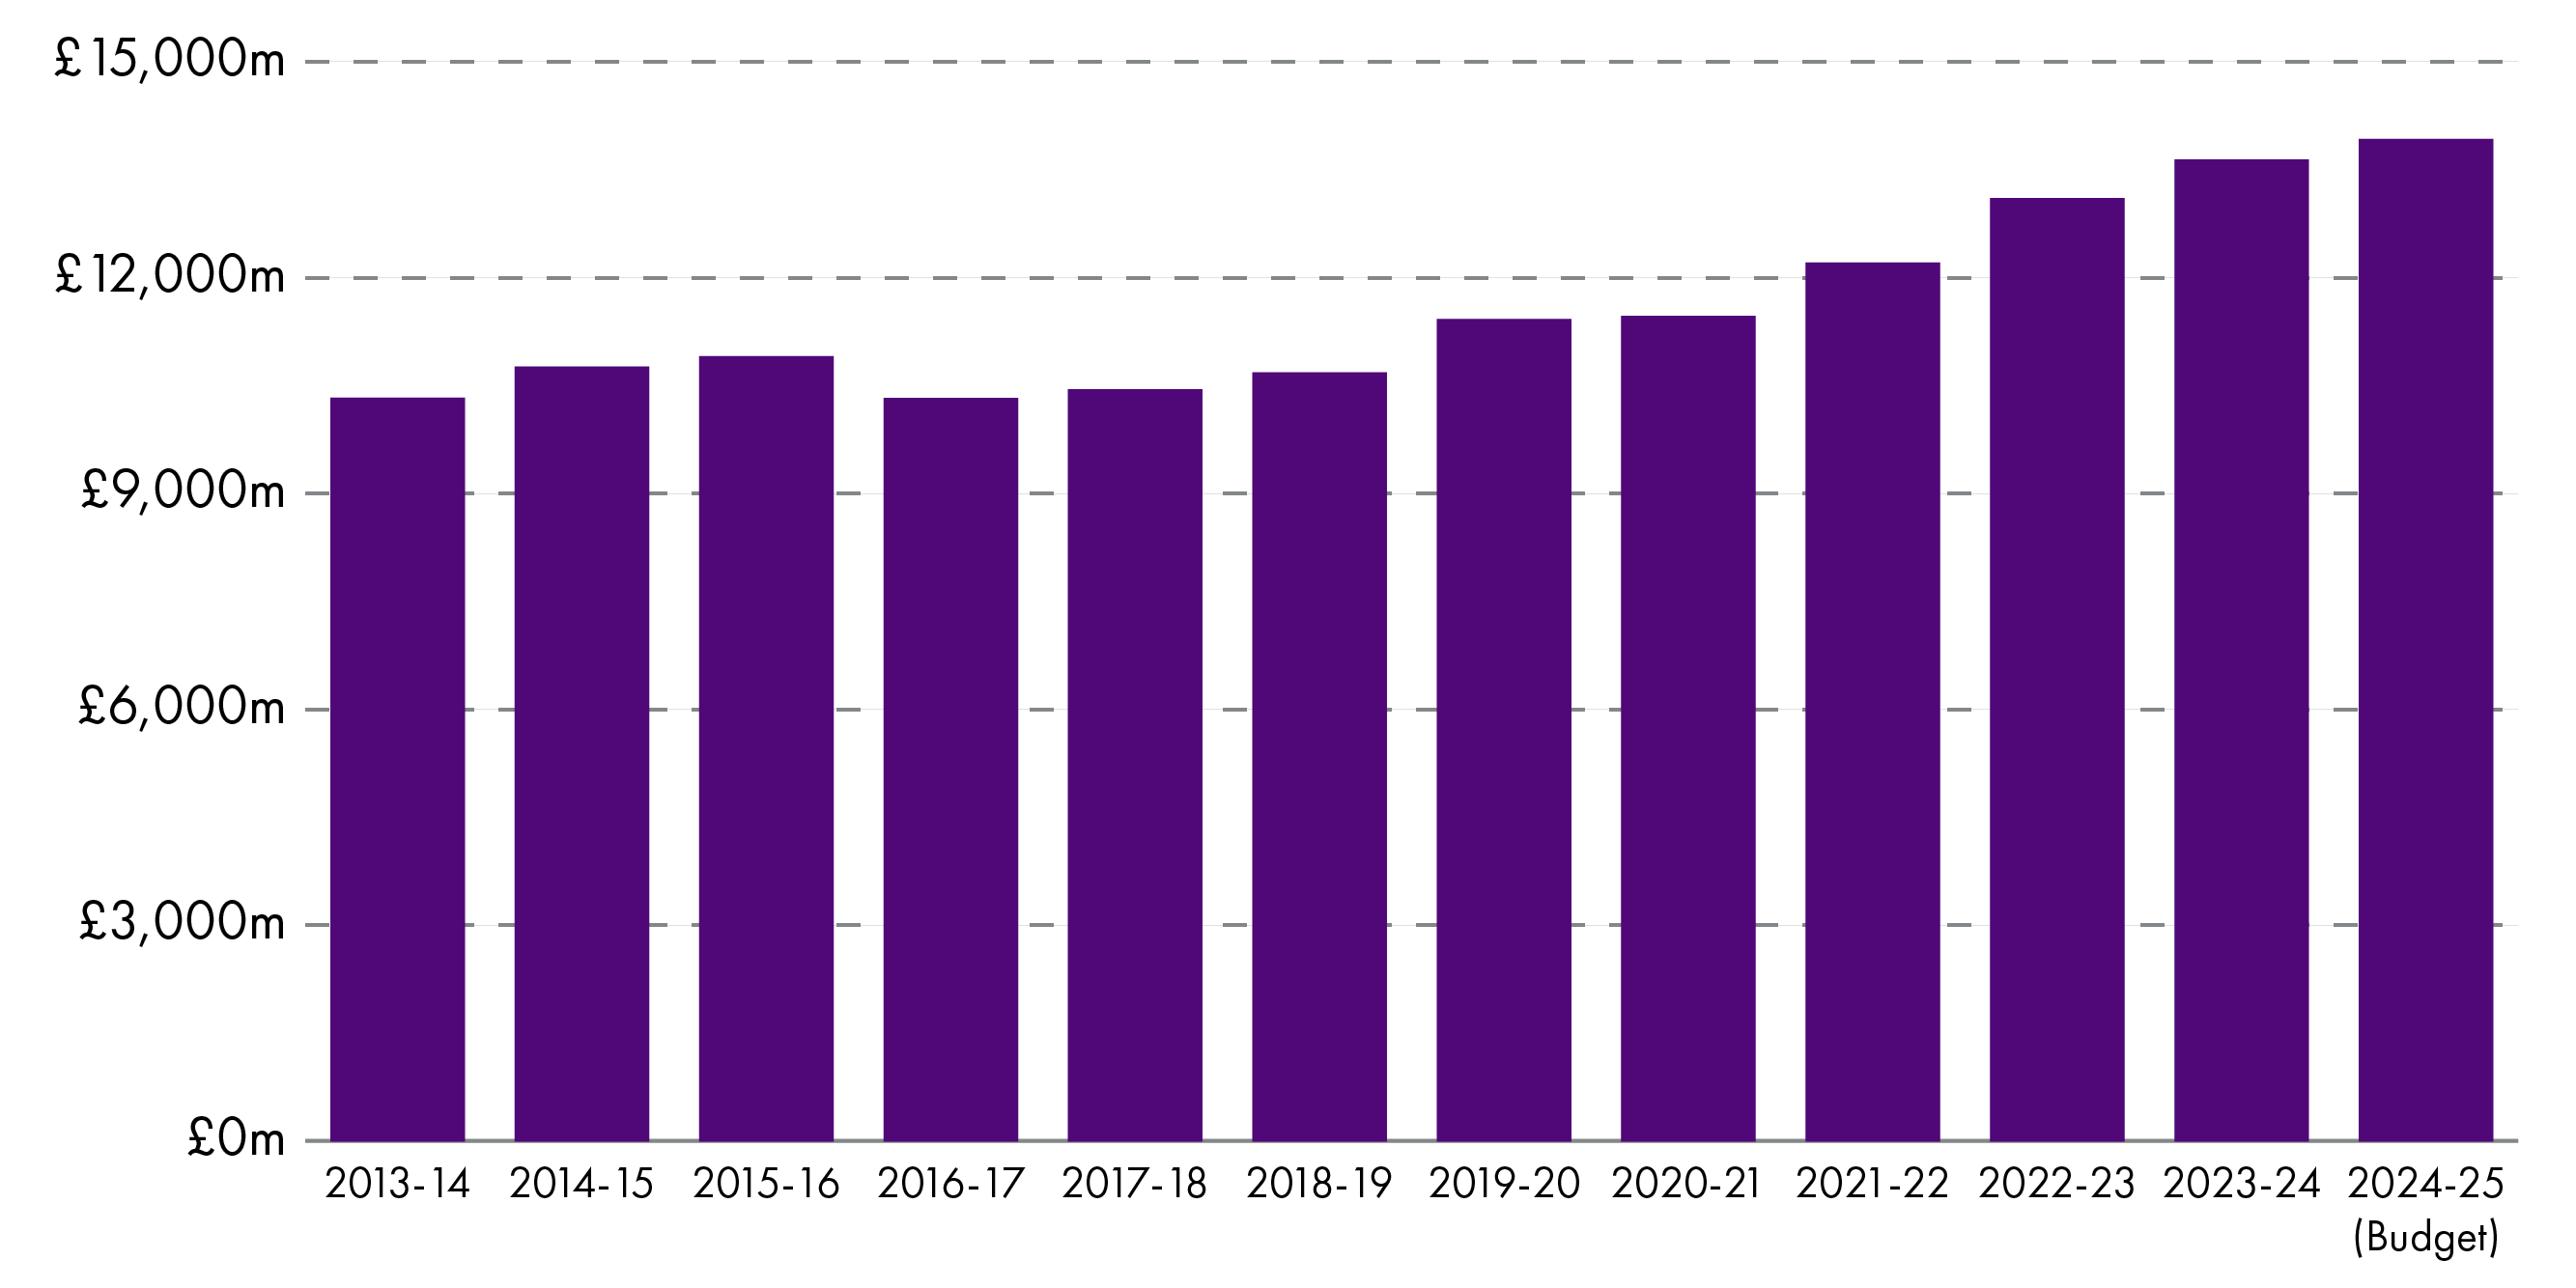
Taking into account the impact of inflation, Chart 2 (below) shows total funding in "real terms" for each year between 2013-14 and 2024-25. This shows that the total settlement increased by £263 million, or 1.9%, over the period. It also shows annual real term reductions for some years. For example, we can see that the settlement reduced by 7.4% in 2016-17 and by 4.8% in 2020-21:
The £13.9 billion funding for 2024-25 works out at £2,554 per person across Scotland. The comparable figure for 2013-14 was £2,567. Therefore, the local government settlement reduced by £13 per person over the 12 year period (a 0.5% real terms reduction). This is because the Scottish population grew at a faster rate than the slight increase in the local government settlement.
This briefing mostly uses 2013-14 as a baseline year for comparisons over time, as before that the local government settlement included funding for police and fire services. This was removed prior to the 2013-14 financial year, with Police Scotland and Fire and Rescue Services Scotland being established.
Changes in the revenue part of the settlement
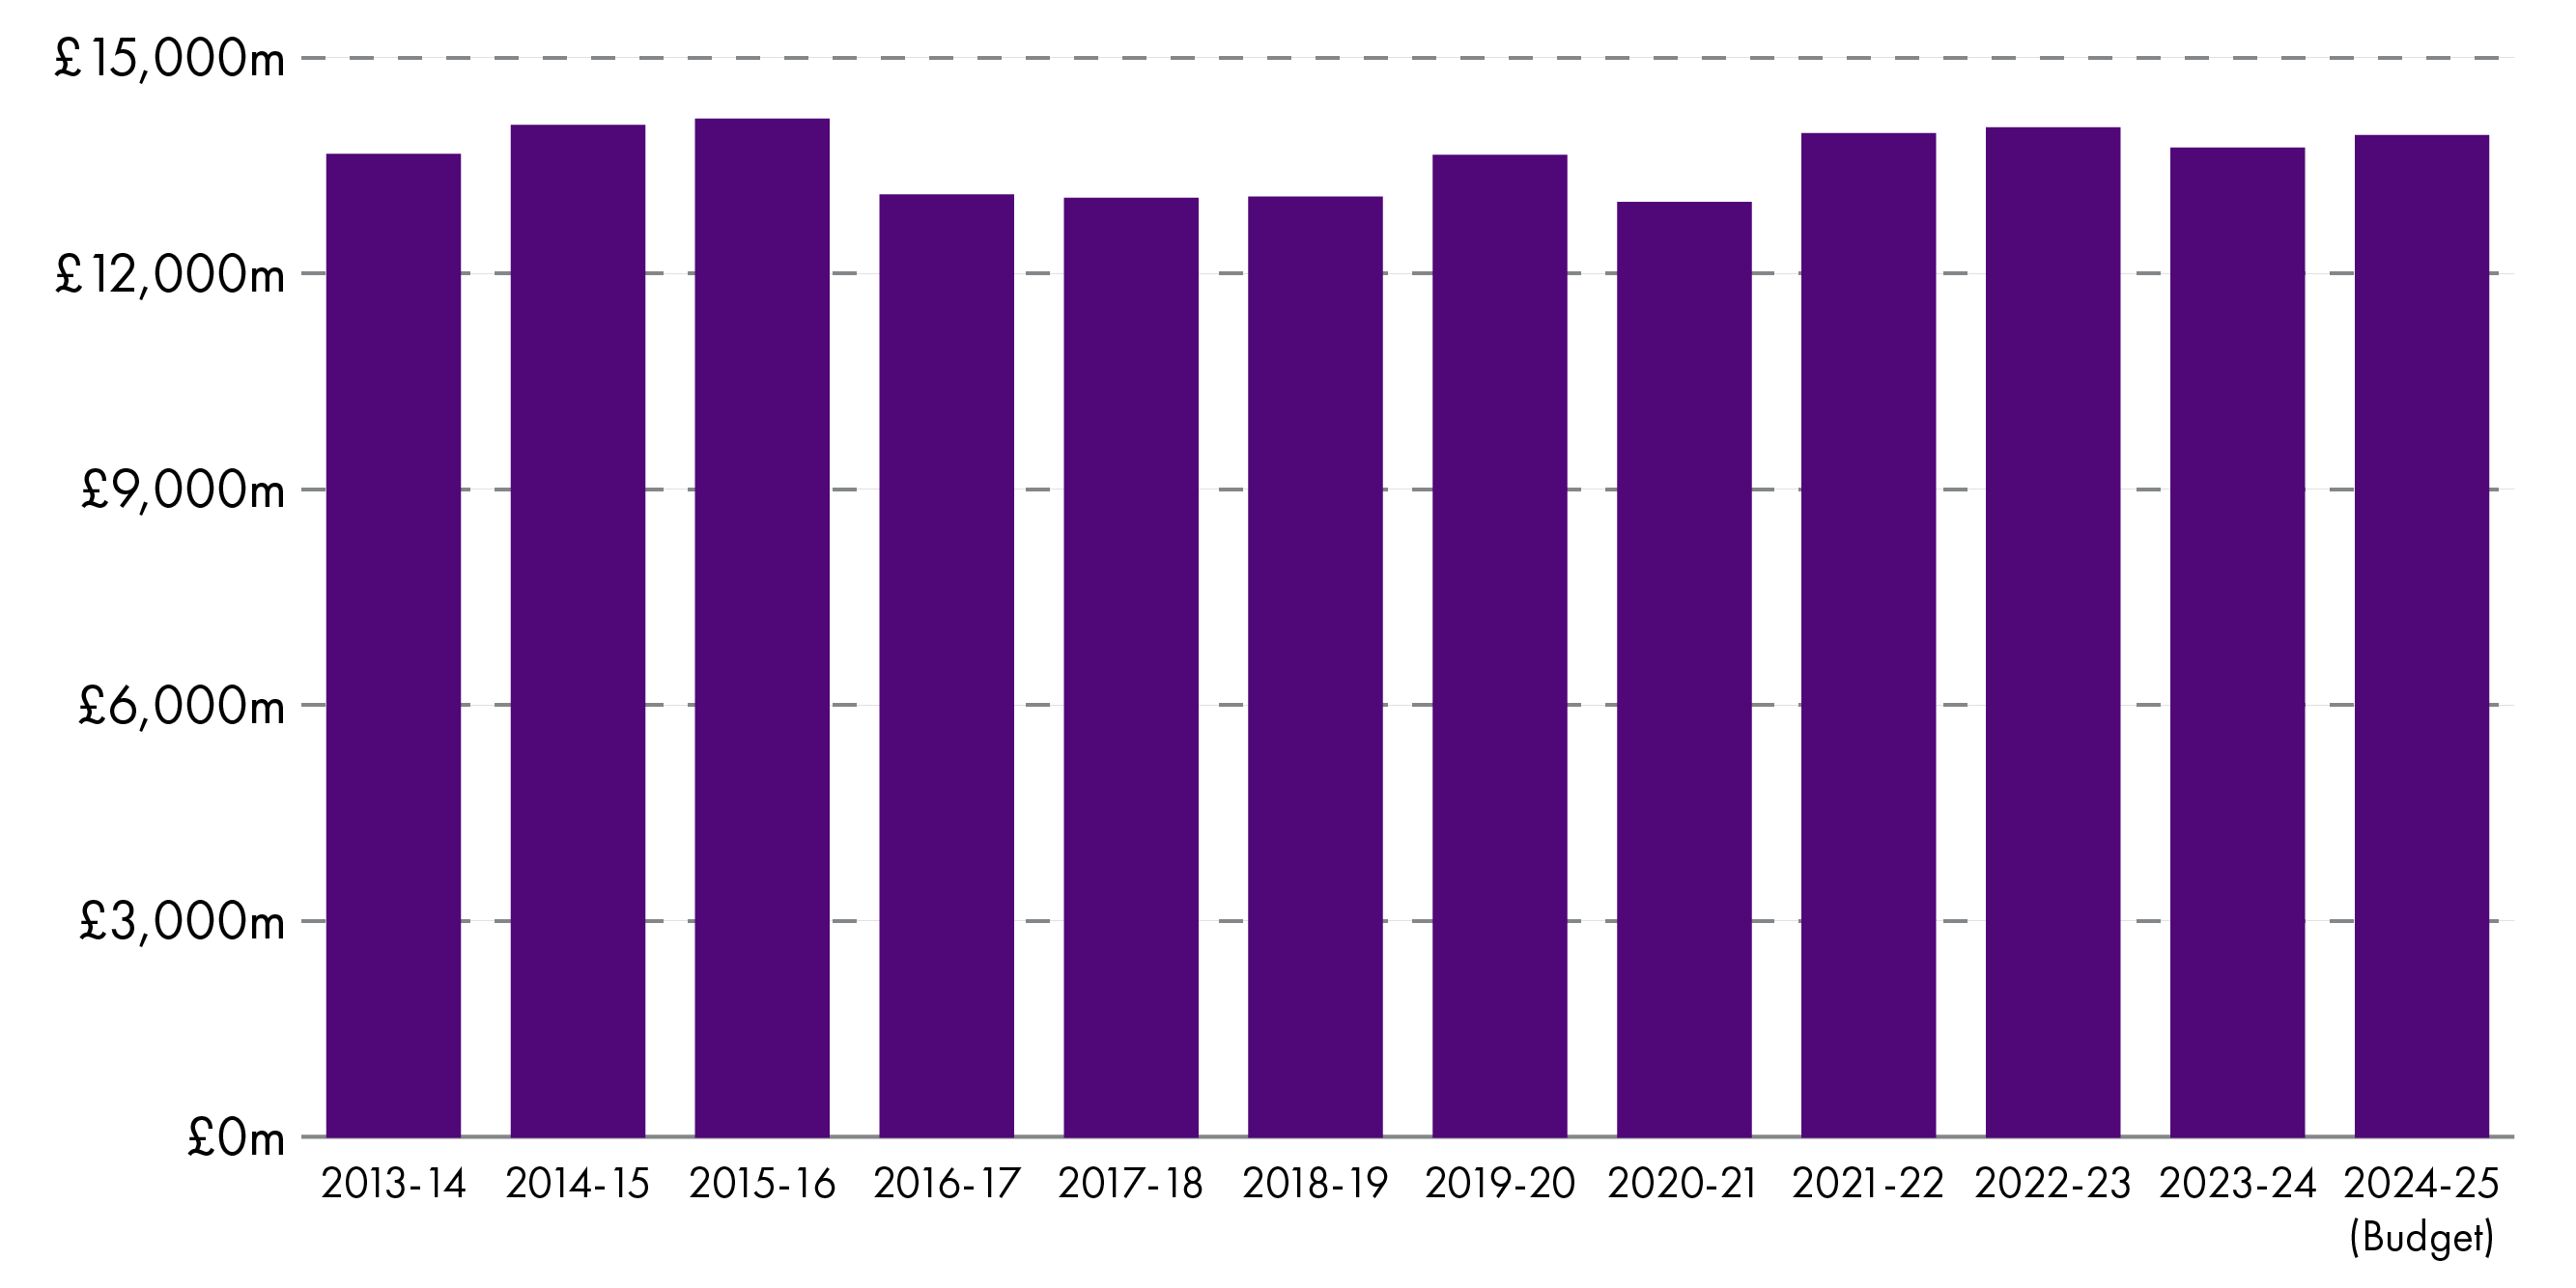
Looking at the revenue part of the local government settlement - the funding that helps pay for day-to-day spending such as wages and operational costs- Chart 4 shows a real terms increase of 2.6% between the 2013-141 and 2024-25 LG finance orders2, from £12.9 billion to £13.3 billion:
During an evidence session in January3, COSLA and CIPFA's Directors of Finance section stressed that local authorities do much more now than they did in 2013-14, particularly with regards to early years provision, free school meals and adult social care. They argue that the costs of delivering these new or enhanced services far exceed any additional money allocated by the Scottish Government over the period.
Chart 5 (below) demonstrates that Specific Resource Grants, also known as "ring-fenced" grants, grew markedly between 2016-17 and 2021-22. However, the budget for 2024-25 shows a reduction in this ring-fencing and a corresponding increase in the size of the general revenue element compared to 2023-24. This comes after a commitment to work towards a "default position" of no ring-fencing or directed funding which was included in the Verity House Agreement signed by the Scottish Government and COSLA in summer 20234.
In its recent report into budget gaps in 2024-255 (discussed in more detail in a later section), the Accounts Commission concludes that:
A move towards reducing ring-fenced funding is welcomed and in line with the commitments of the Verity House Agreement. However, funding remains constrained as the increase in the general revenue grant is largely directed towards the delivery of Scottish Government policies or to support previous pay awards, rather than an increase in available funding for councils to use at their discretion.
Revenue allocation as a % of the Scottish Government revenue budget
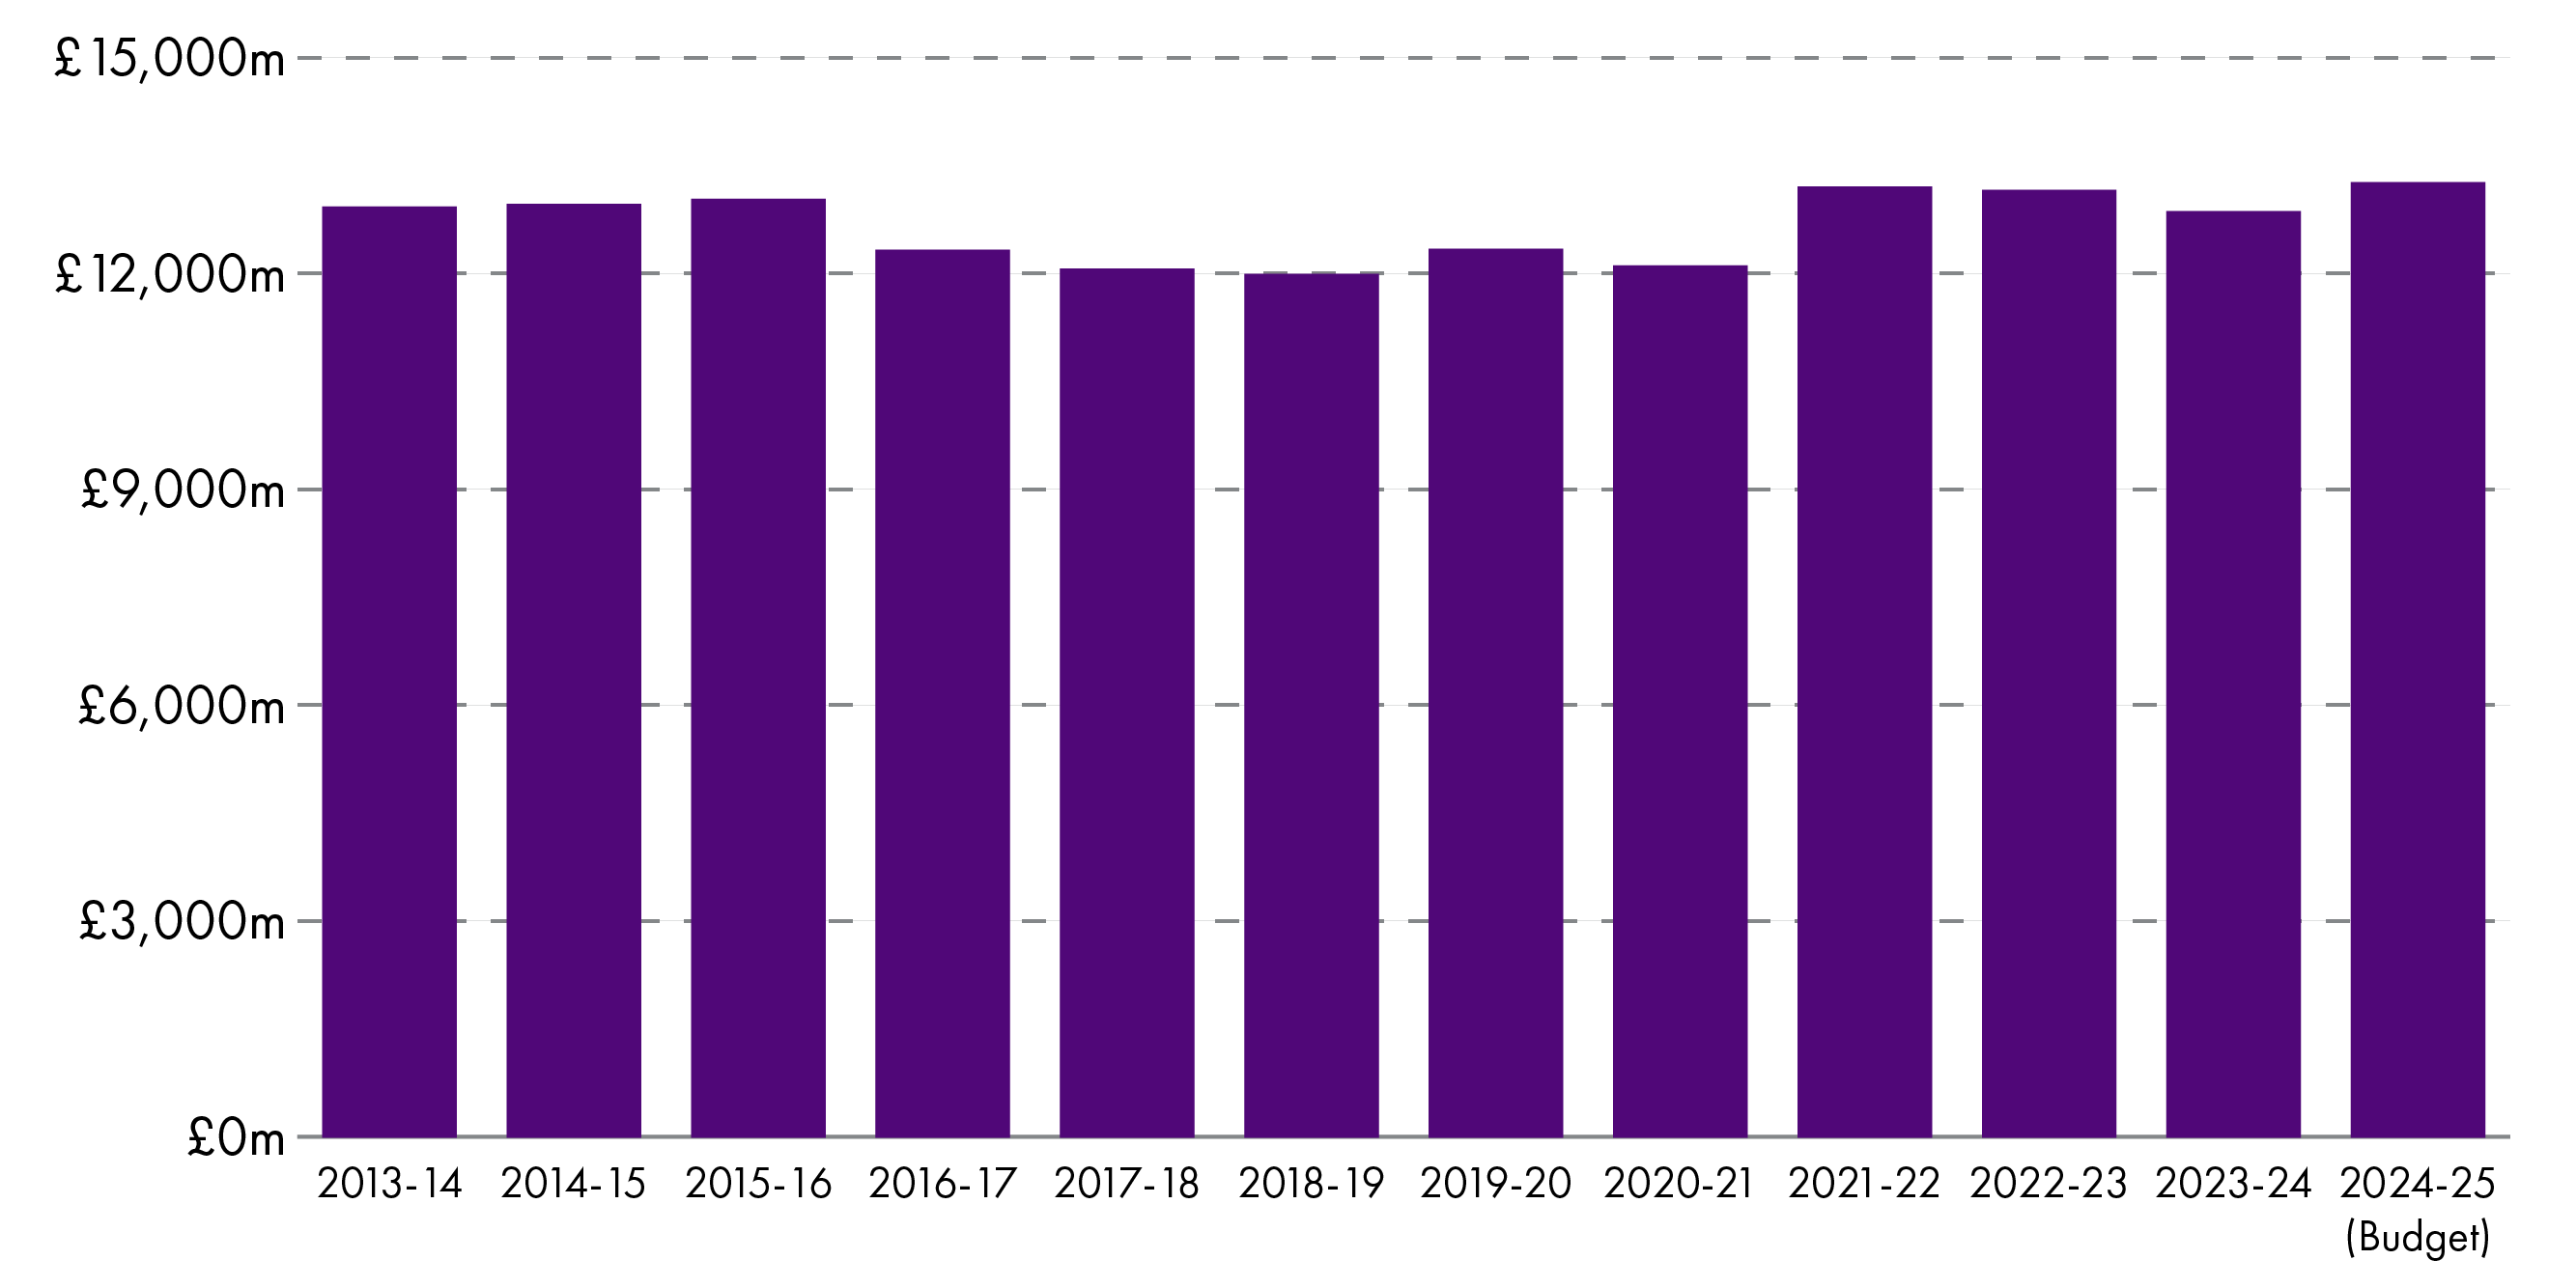
Chart 6 shows the local government revenue budget as a share of total Scottish Government revenue budget (plus non-domestic rates income) for each year since 2013-14 .
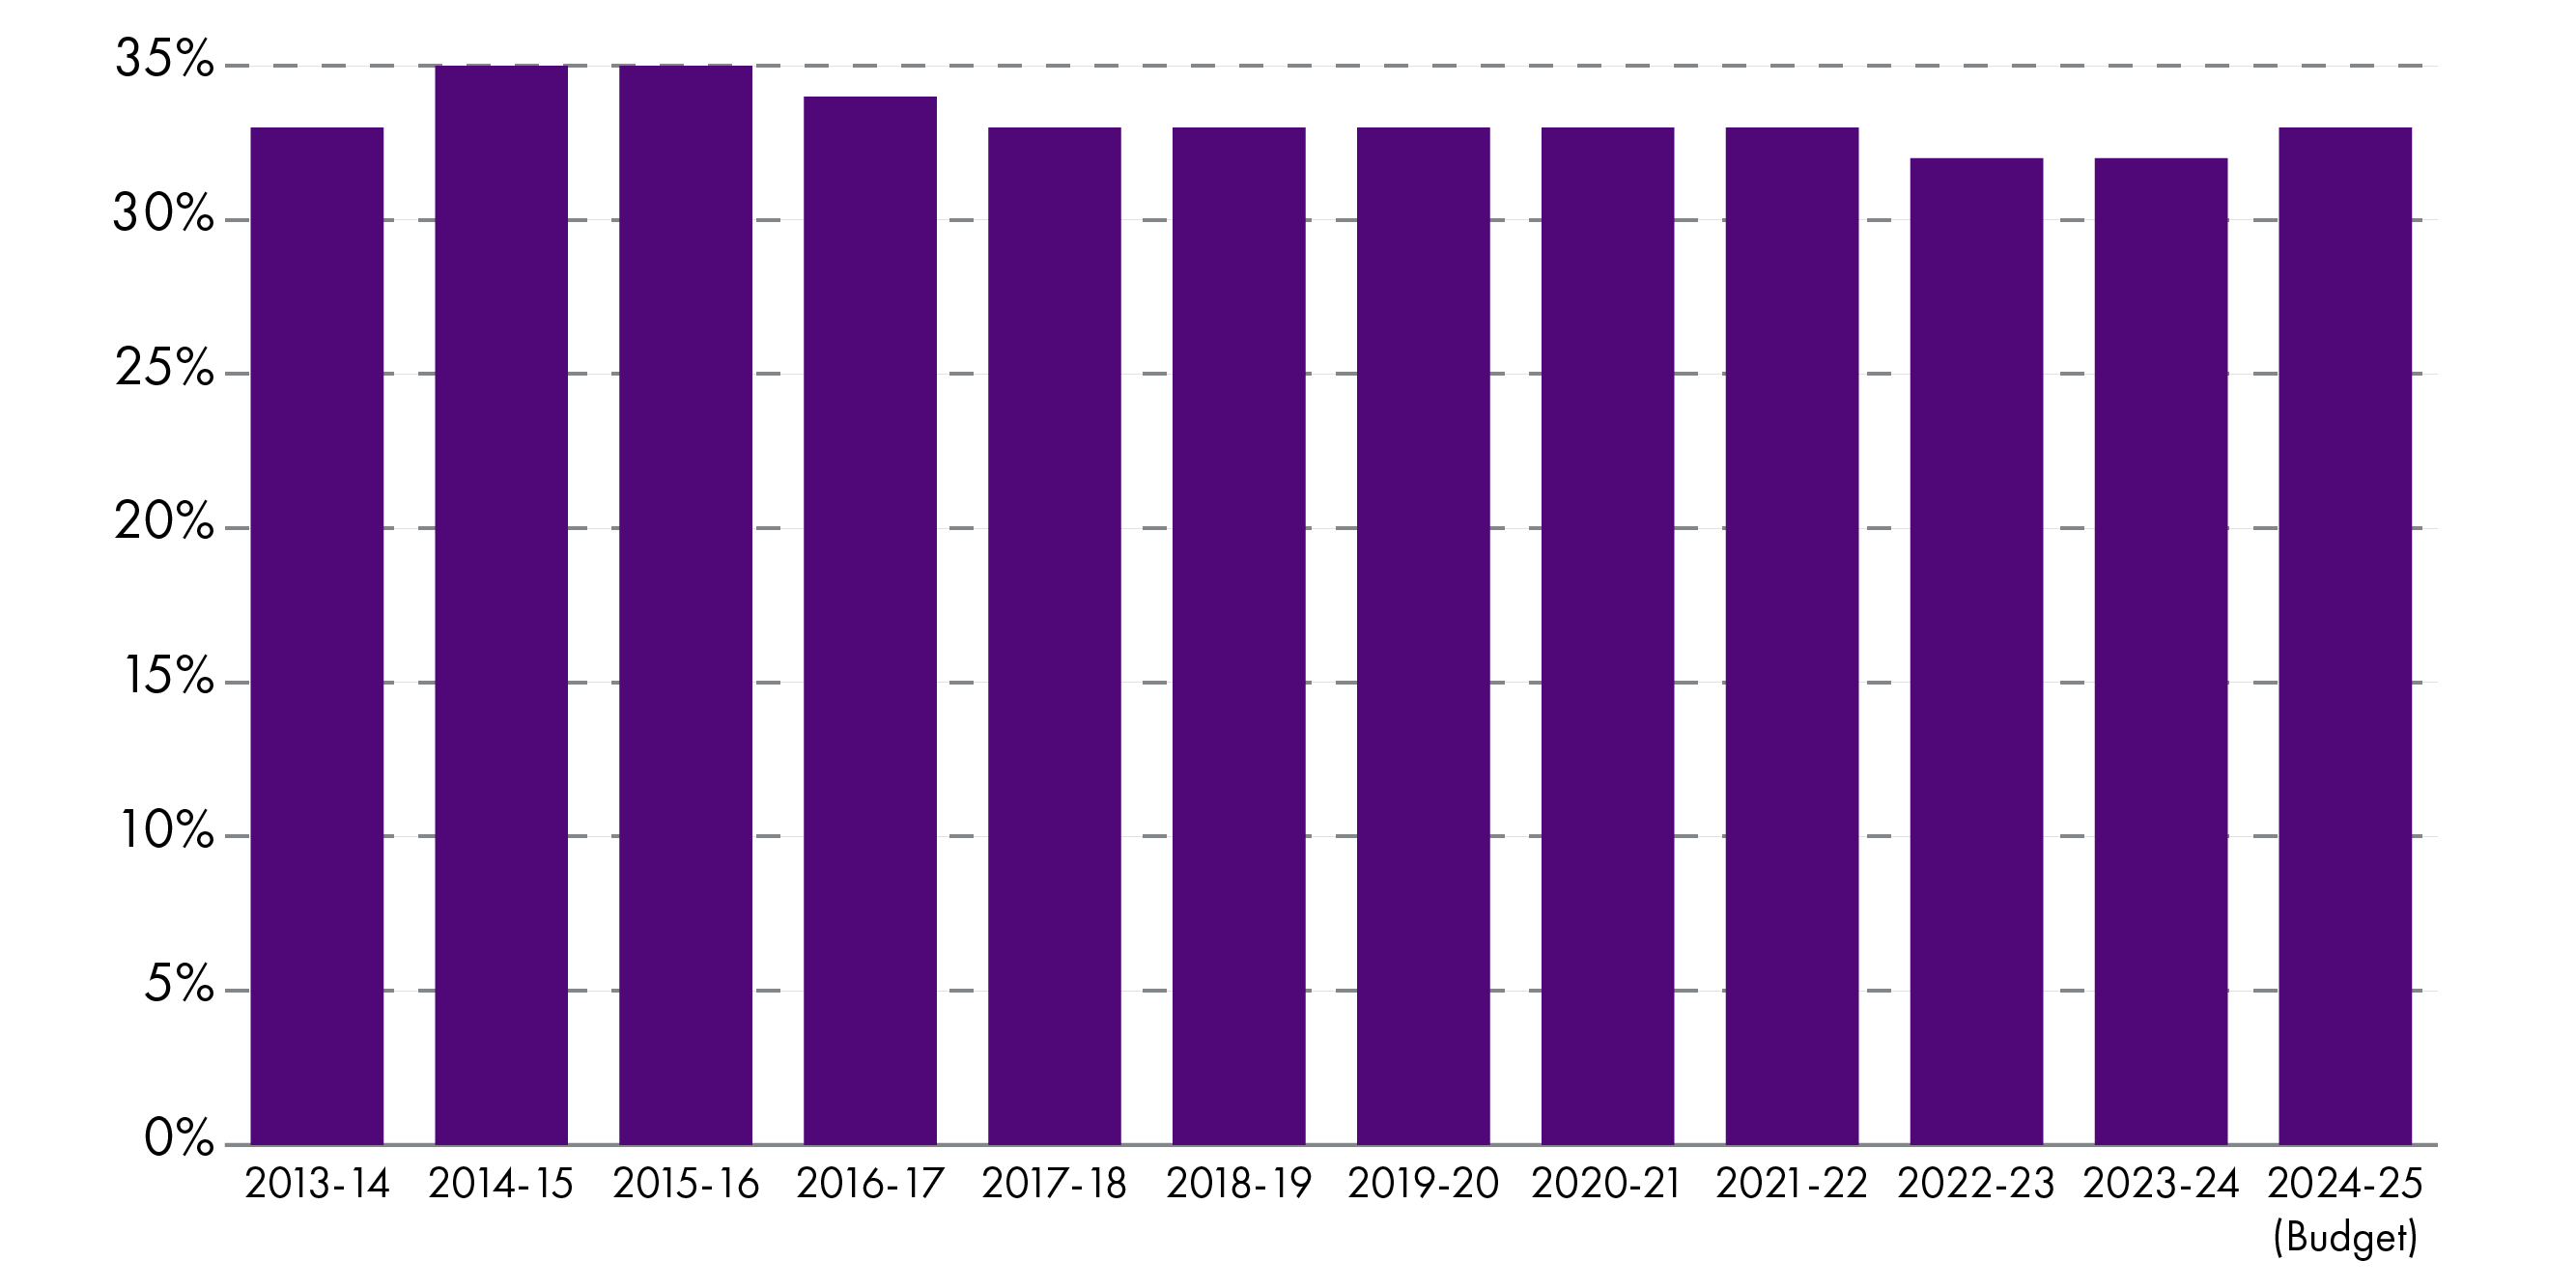
The Scottish Government revenue budget figure includes all fiscal revenue DEL, plus non-domestic rates income (NDRI). This shows that local government revenue as a proportion of the Scottish Government revenue budget remains at the 33% mark, much as it was 12 years ago.
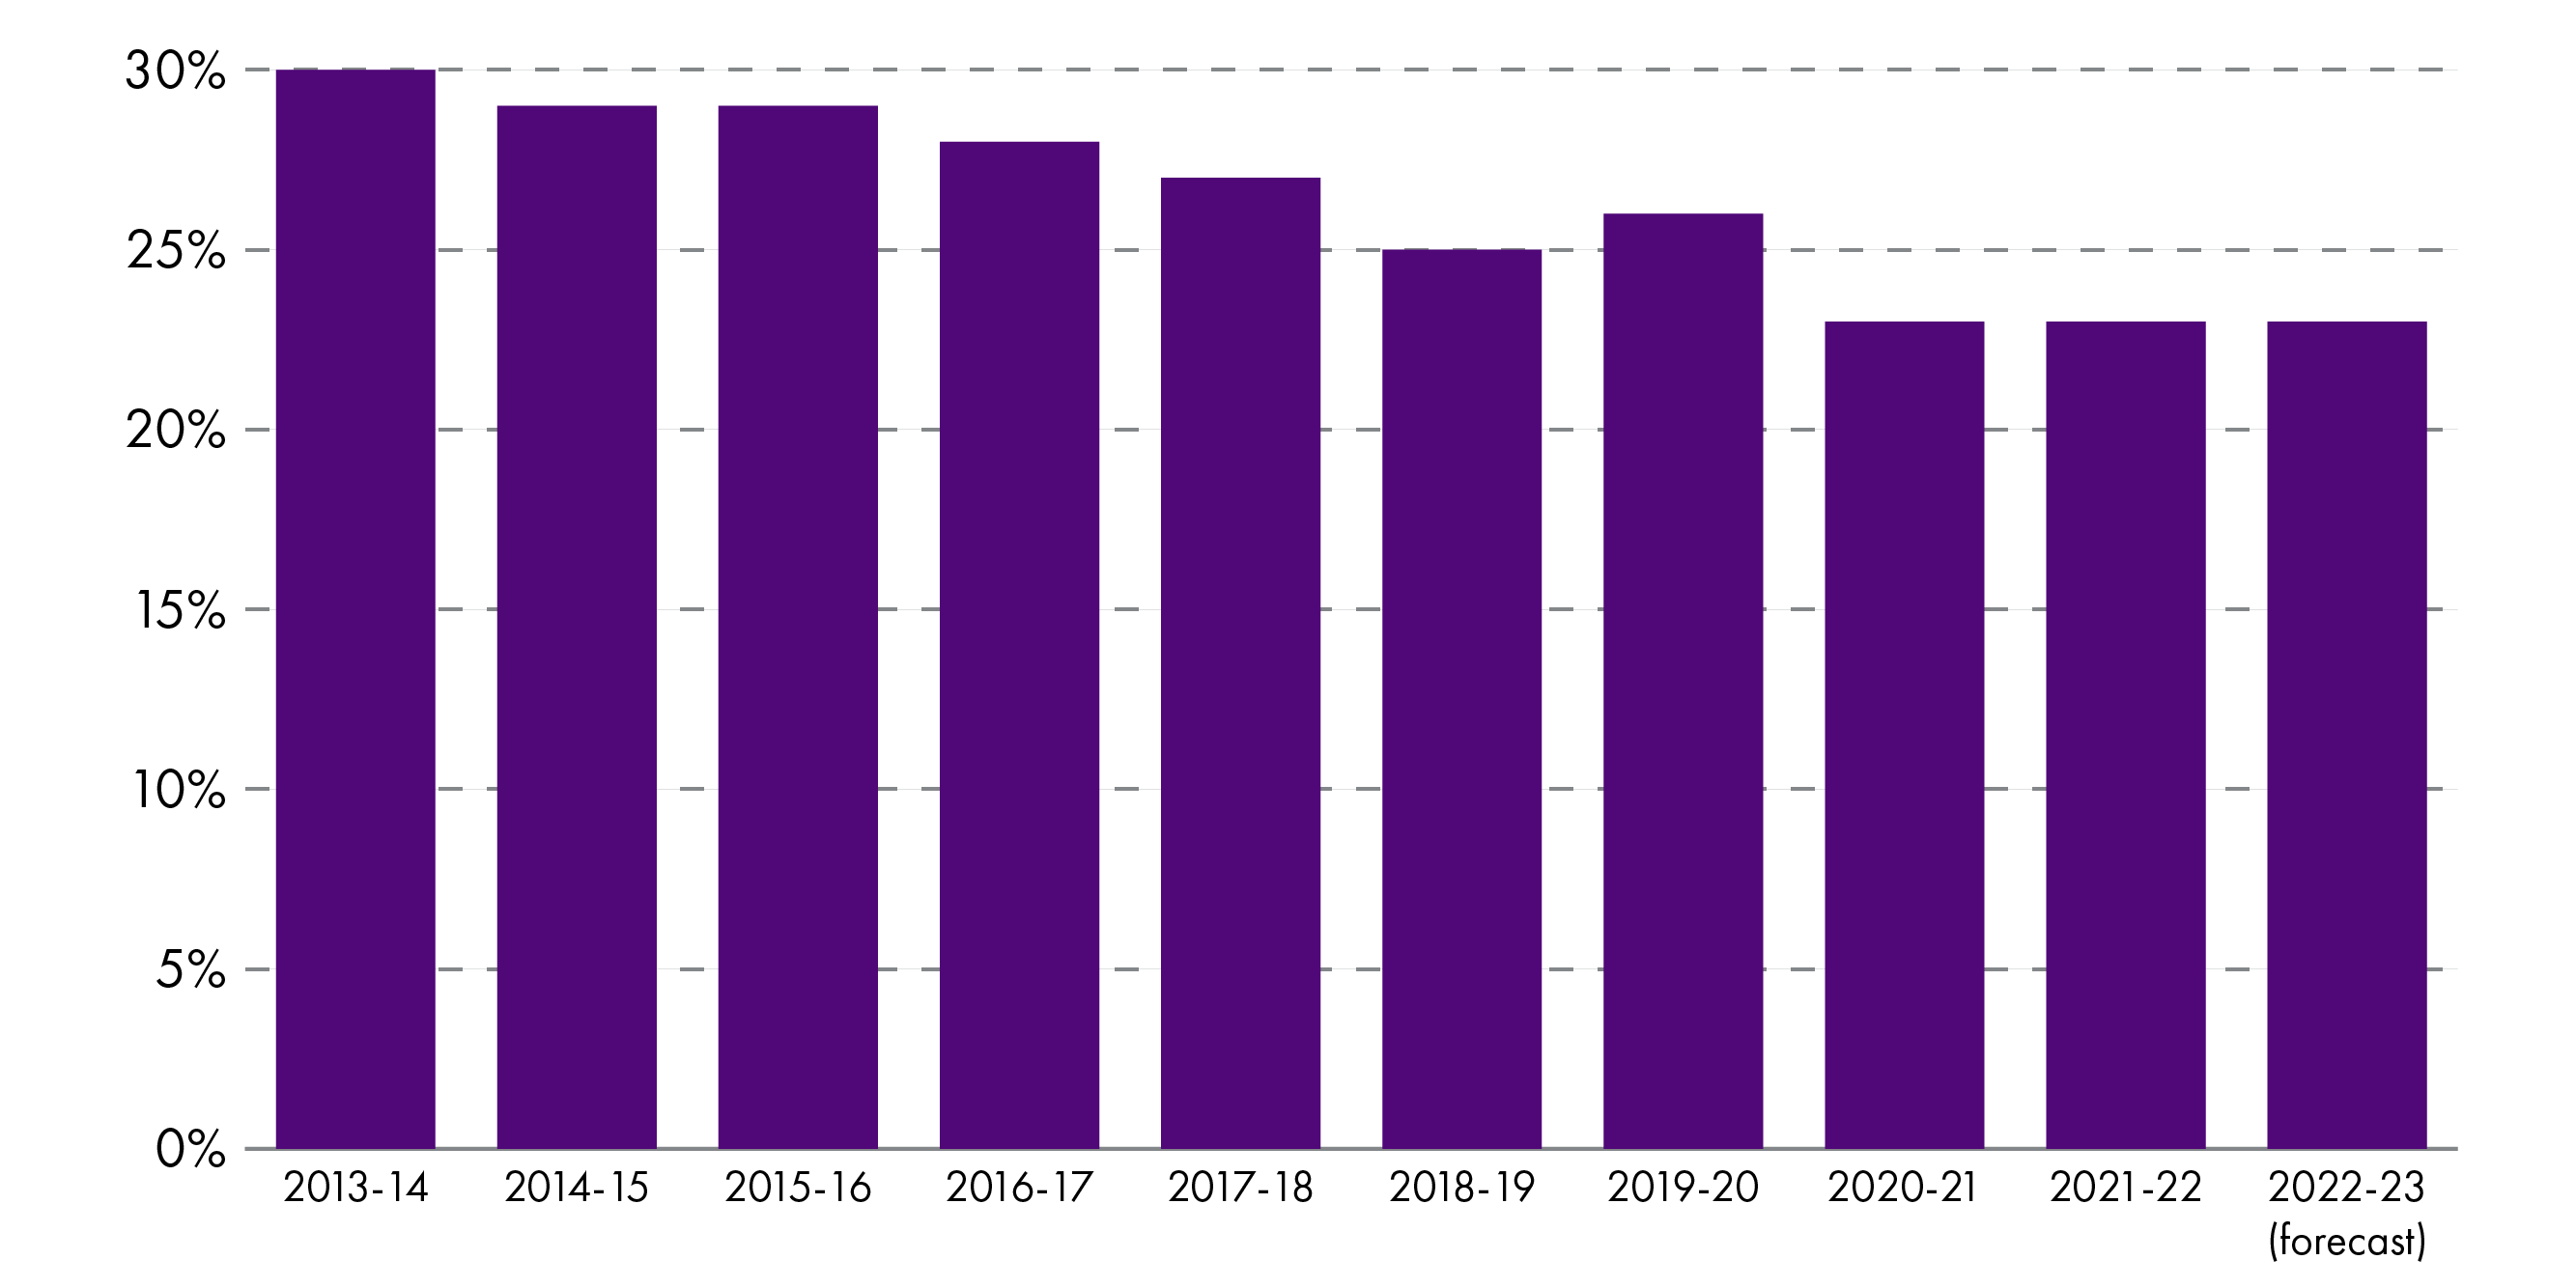
The Accounts Commission published its Local Government Financial Bulletin for 2022-23 earlier this year1. This includes an alternative interpretation of local government funding as a proportion of Scottish Government spend over the last 10 years. Unlike the chart above, the Accounts Commission includes the total local government allocation (including capital) and total Scottish Government spend (including things like public sector pensions and social security spend). The report states that in 2013-14, local government (capital and revenue) accounted for 30% of total Scottish Government spend and by 2022-23 it had fallen to 23%:
Accounts Commission dataAccounts Commission. (2024, January 16). Local government in Scotland: Financial bulletin 2022/23. Retrieved from https://audit.scot/publications/local-government-in-scotland-financial-bulletin-202223
Changes in overall capital allocation
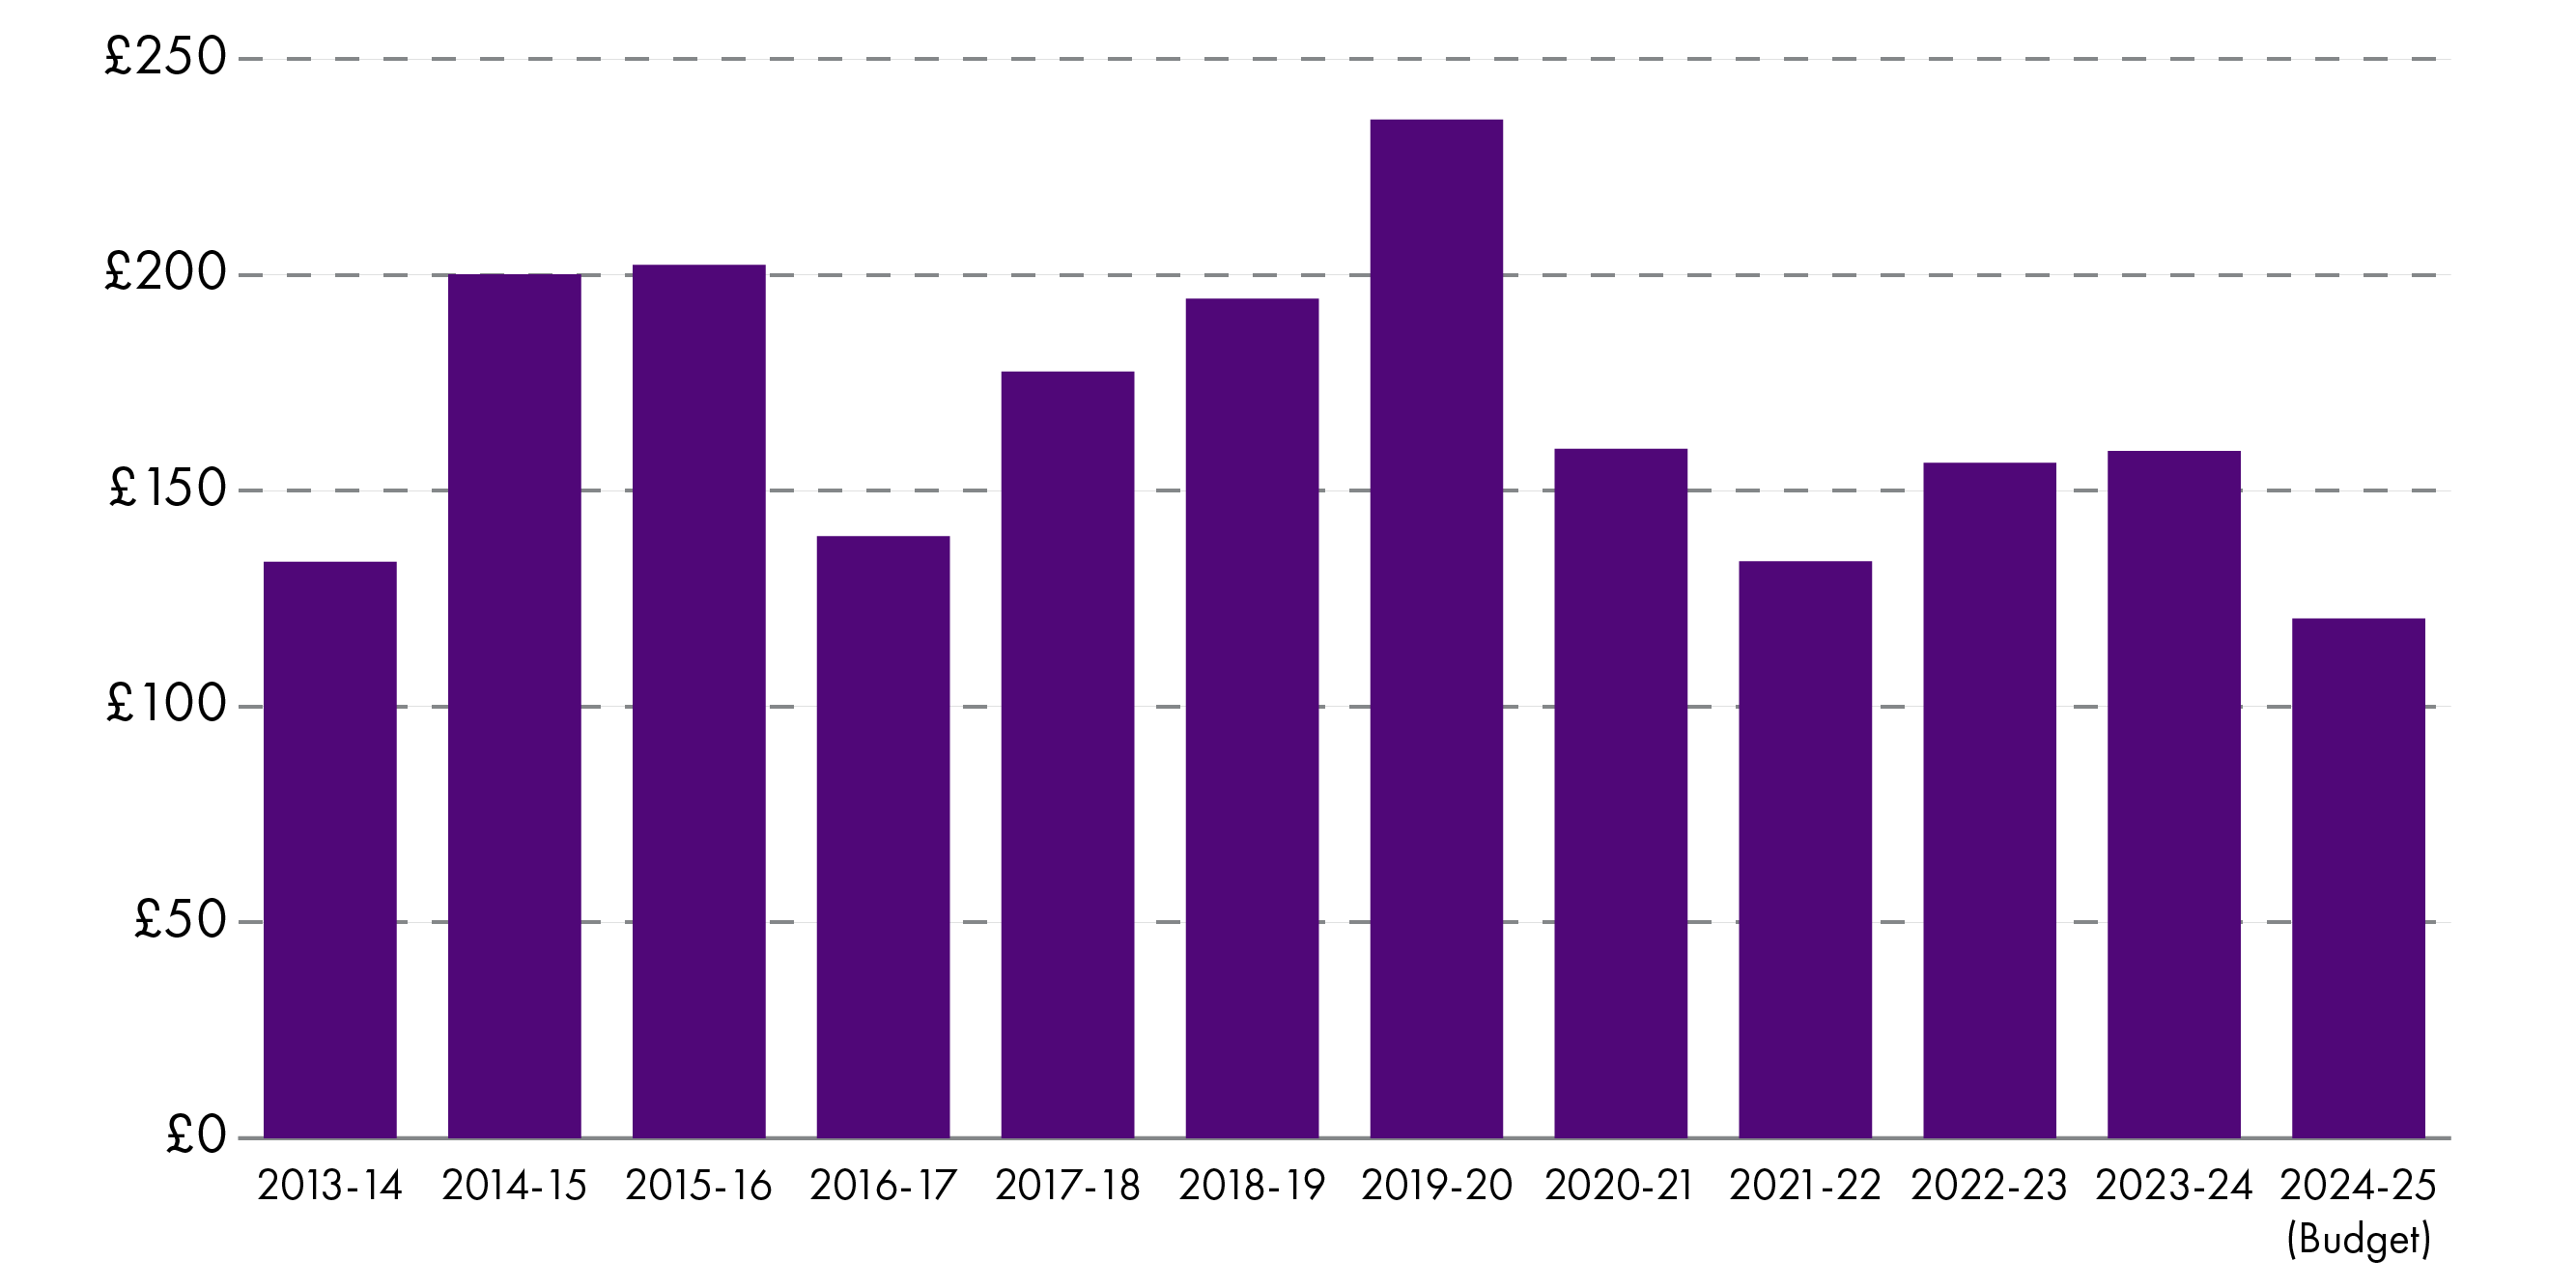
Capital funding is used to pay for the buying, construction or improvement of physical property and other assets - things like schools, community centres, IT systems, paths and roads - whose benefits should last over a number of years, if not decades. Local authorities receive capital grants from the Scottish Government but they can also borrow for capital purposes. Capital grants can vary significantly from year to year, as demonstrated in Chart 8 (below). Nevertheless, when presented in real-terms, there is a definite downward trend since 2020, with the capital allocation for 2024-25 being the lowest since 2013-14.
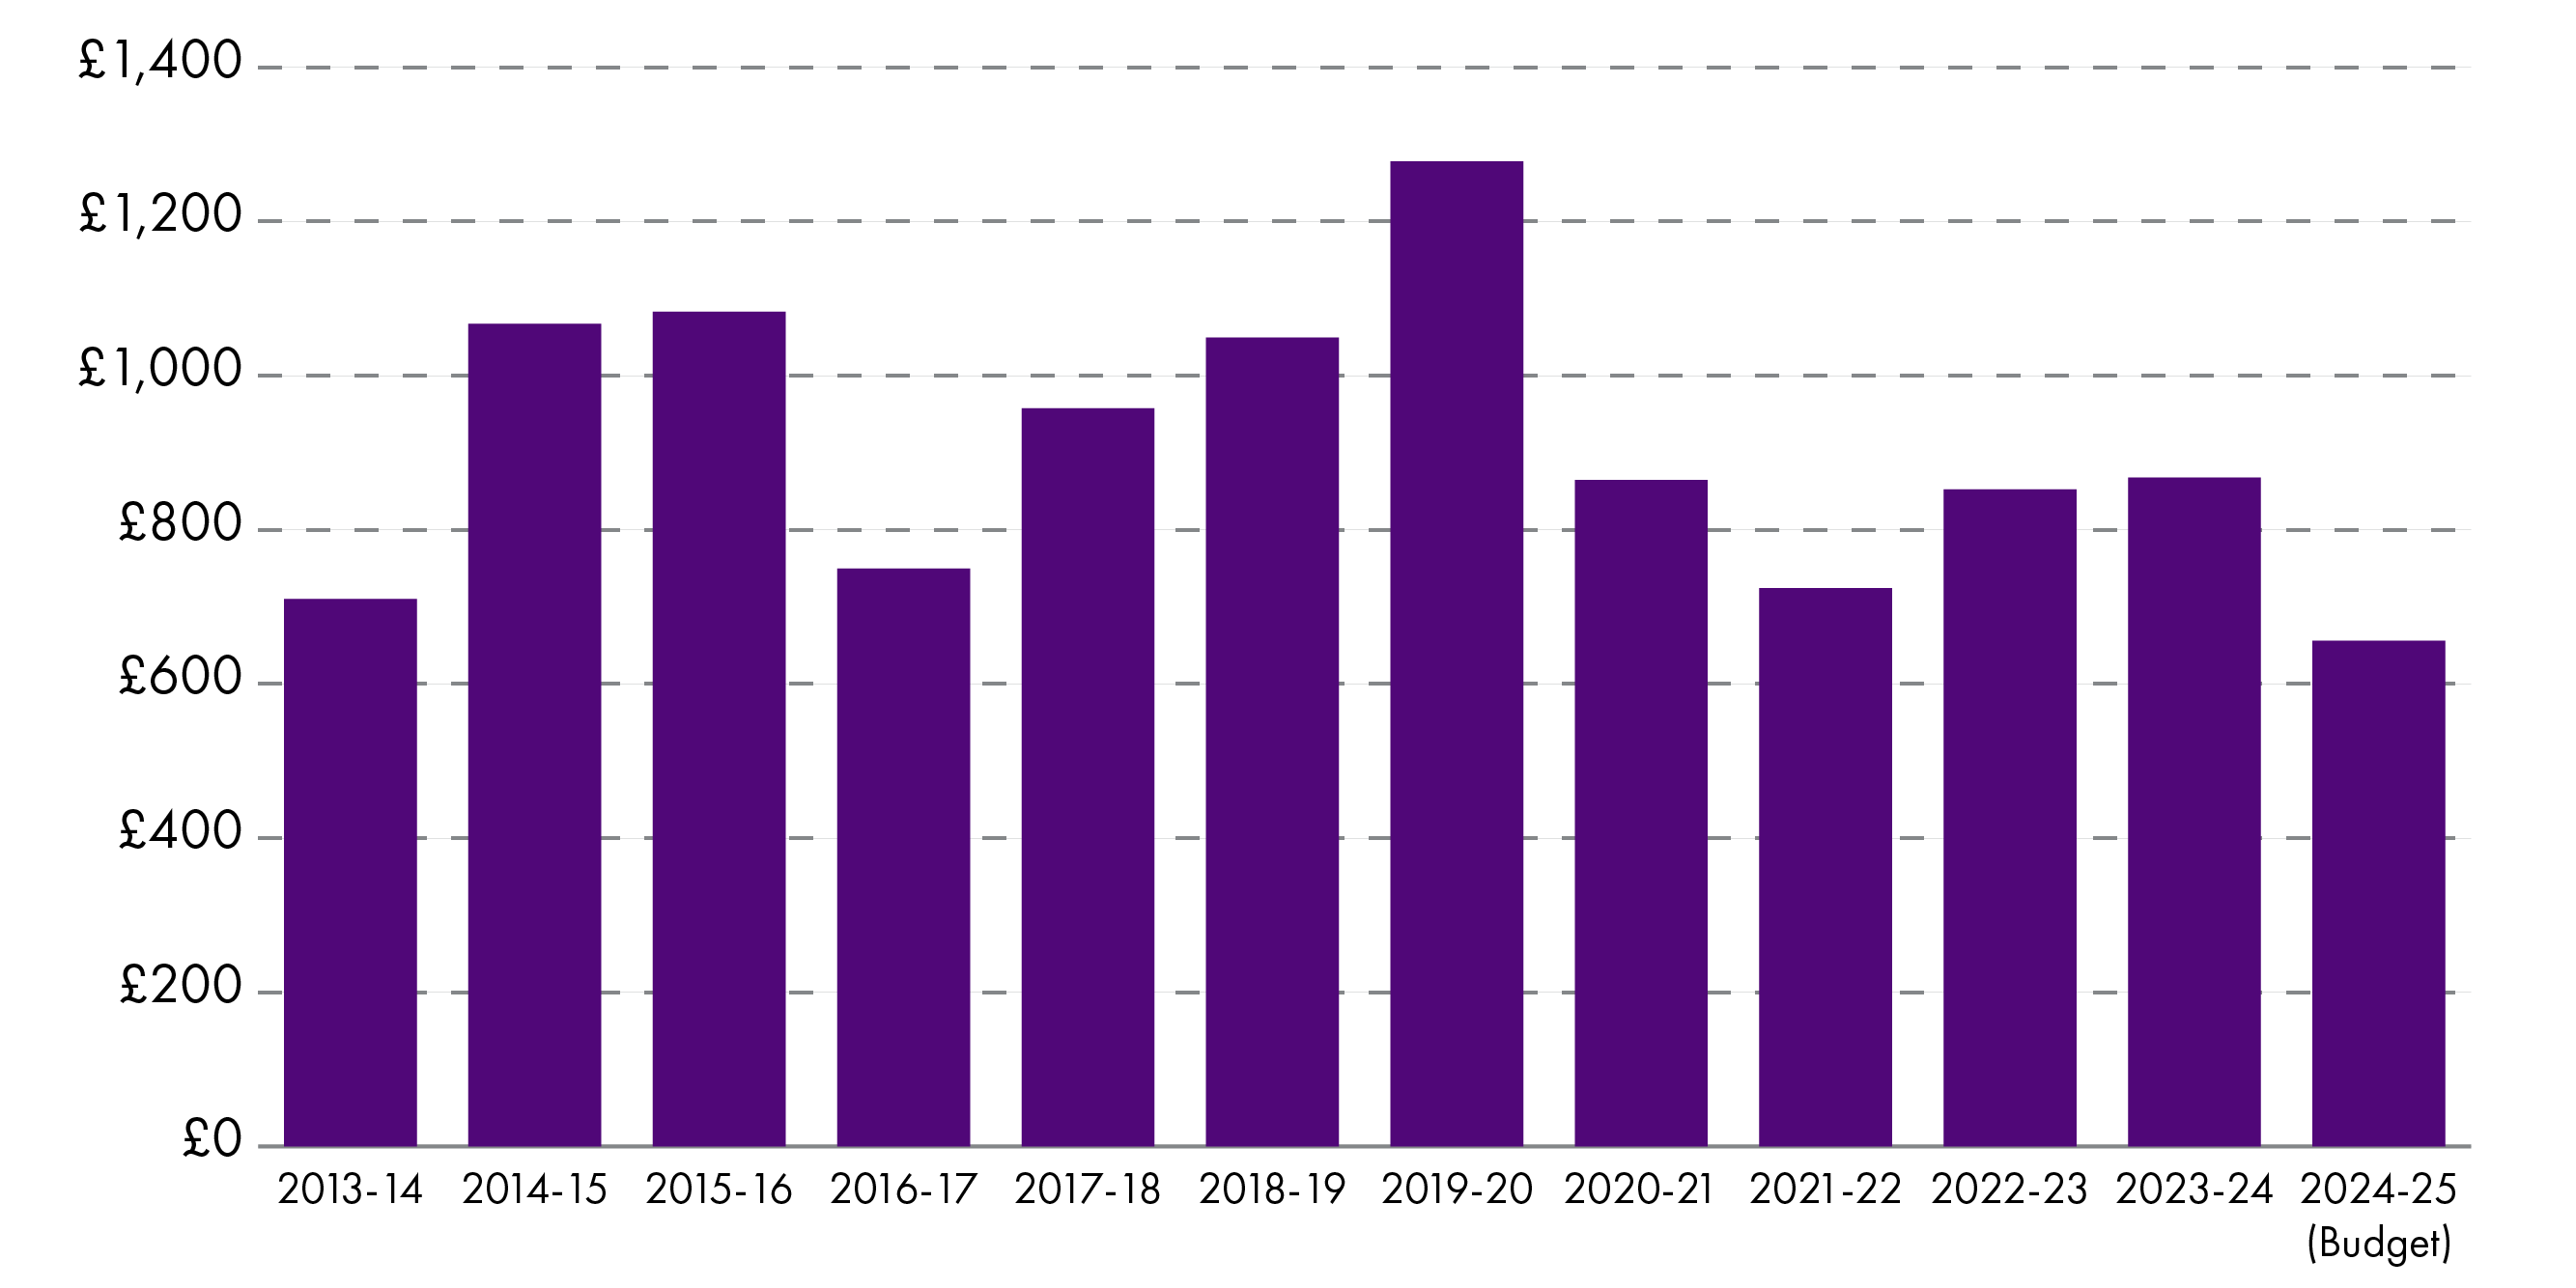
The 2022-23 and 2023-24 figures include £120.6 million which was switched to revenue and used to support pay deals. This was not repeated in the 2024-25 Budget, so the reduction in 2024-25 appears larger in the graph than the actual change to spending power.
Chart 9 (below) shows that capital settlements, when presented as per head amounts, reduced by 10% in real terms over the past 12 years. In 2013-14, the capital allocation worked out at £133 per head (when adjusted for inflation) and in 2024-25 it works out at £120. However, it has not been a steady decline over the period and in the intervening years it has often been at much higher levels than in 2013-14.
During the Local Government, Housing and Planning Committee's scrutiny of the Scottish Government's Budget in January 2024, COSLA's Resources Spokesperson told the Committee that "the cut to our capital budget will have a significant effect on our work towards meeting our current and future net zero ambitions”. Another consequence may be a need for councils to increase borrowing in order to pay for essential capital projects (see later section). This could impact future budgets as councils have to pay back loans from their general funds, meaning less money available for other purposes in the future.
How revenue funding is allocated to individual local authorities
The overall amount allocated to local government each year is decided by the Scottish Government through the wider budget process. For 2024-25, Ministers decided that councils should have a total of £15.2 billion revenue funding, a figure that includes General Revenue Grant, ring-fenced grants, forecasted non domestic rates revenue and assumed council tax income (see column 5, Annex B of the Finance Circular 02/20241). How this total is then distributed amongst Scotland's 32 local authorities is a complex process which has been developed over decades.
Central to the allocation process is the Settlement and Distribution Group (SDG), a joint group comprising Scottish Government and COSLA officials, as well as senior finance officers from individual local authorities. The SDG considers any new local government funding and distribution, whilst providing a forum for officials to discuss future funding issues.
The Green Book
The Scottish Government uses various data and weighted formulas to apportion a share of funding to each of Scotland's 32 councils2. These are contained within a 73 page document, known as the Green Book, which is reviewed regularly and agreed each year with COSLA3. The idea behind it is to assess, as far as possible, "how much each council needs to provide comparable and consistent service levels, operating at the same level of efficiency"4.
The formula considers around 140 local authority services- for example, early learning and childcare, adult support and protection, road maintenance, etc - each having different data sets and formulas applied to assess relative need. Many of these indicators are related to population or school pupil numbers, but other factors such as deprivation levels and rurality, road length and homelessness may be taken into account depending on the service being considered.
An important part of the settlement process is the main funding floor calculation, which ensures a local authority's funding allocation will not fall by more than a set amount from the previous year. More information is included in the Scottish Government's useful guide to the local government finance settlement.
The Scottish Parliament debates and approves individual local authority allocations each year, although no draft finance order has ever been rejected by the Parliament (see the Official Report of the most recent debate and vote).
Note that while the Green Book sets out how the allocations are determined by building up from calculations at the level of individual services, this does not determine how local authorities allocate their budgets. This is entirely a matter for individual local authorities and they do not need to reflect the Green Book allocations for individual services in their budget decisions.
Overall revenue settlement for individual councils
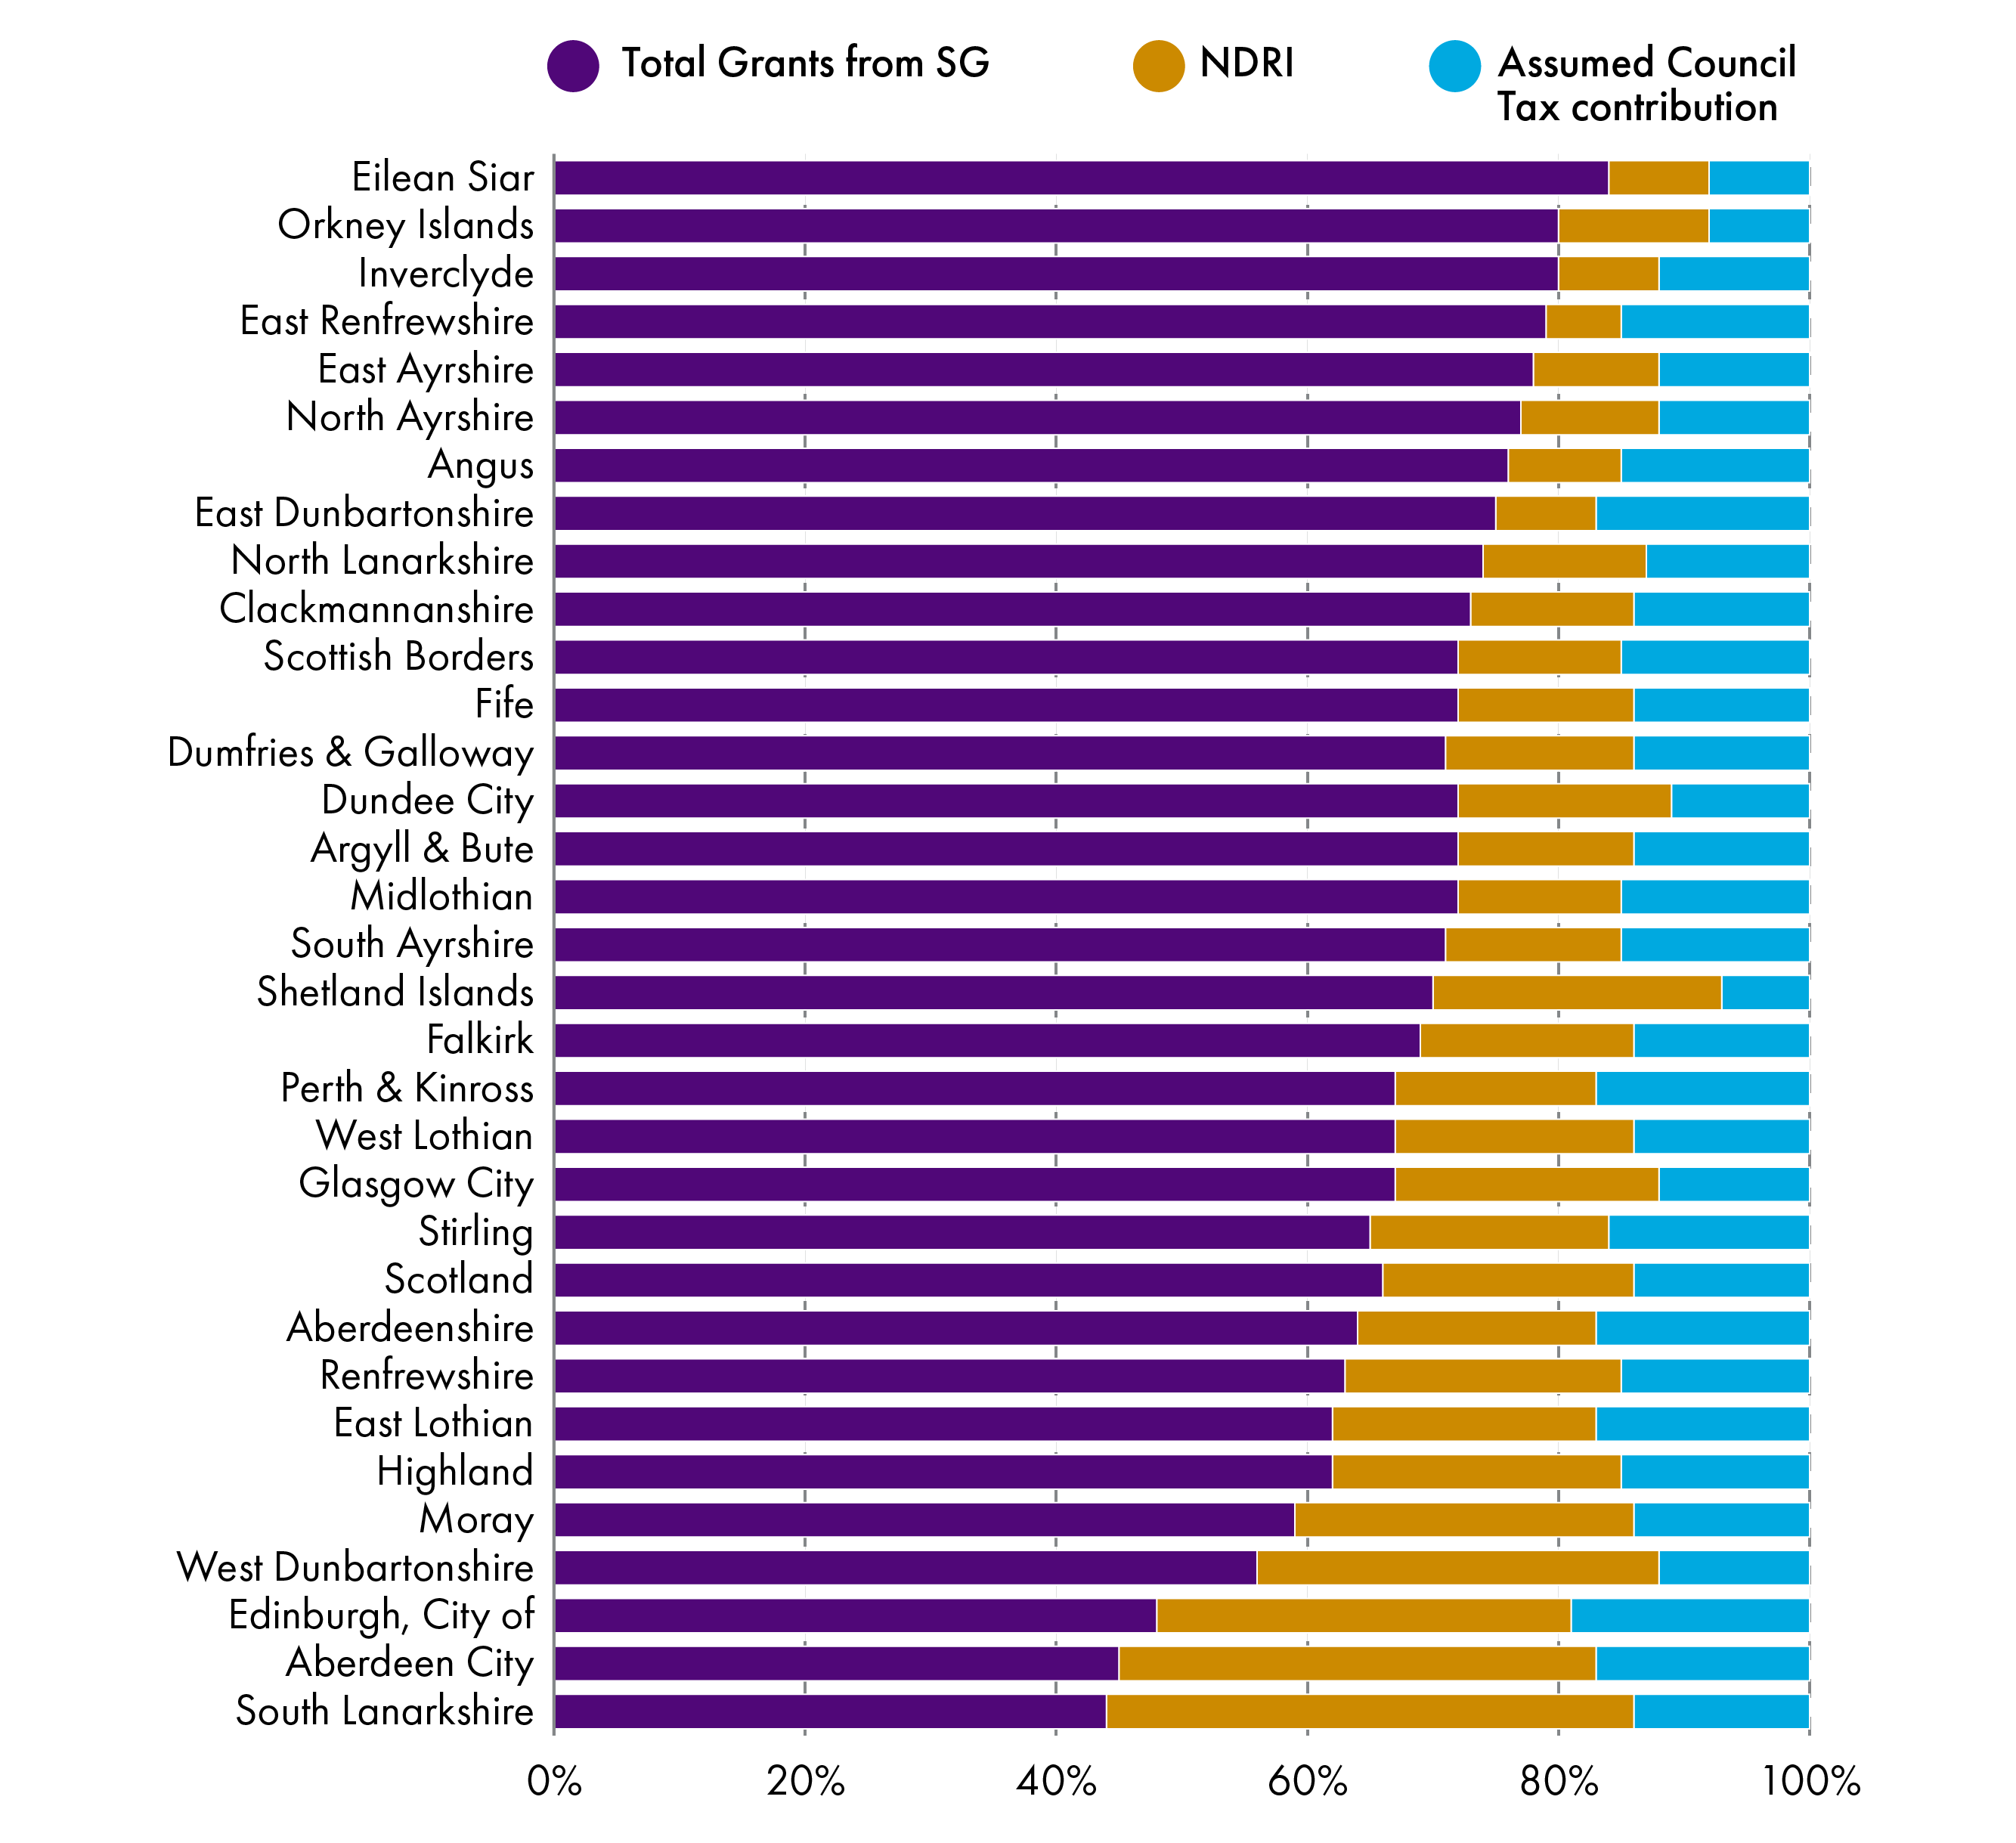
Once the total revenue funding for each local authority is calculated, the Scottish Government subtracts estimated council tax and non-domestic rates income from each of the 32 amounts. What remains is the value of revenue grant each council will receive, mainly in the form of General Revenue Grants.
Local authorities with higher levels of council tax and non domestic rates income will see a smaller proportion of their revenue coming in the form of revenue grant. Chart 10 demonstrates this for the current financial year, with Eilean Siar, Orkney and Inverclyde seeing the highest proportion of grant and South Lanarkshire, Aberdeen and Edinburgh seeing the lowest (however, with over 50% of their income coming from NDR and council tax income):
Local Government Finance Circular, 2/2024, Annex B
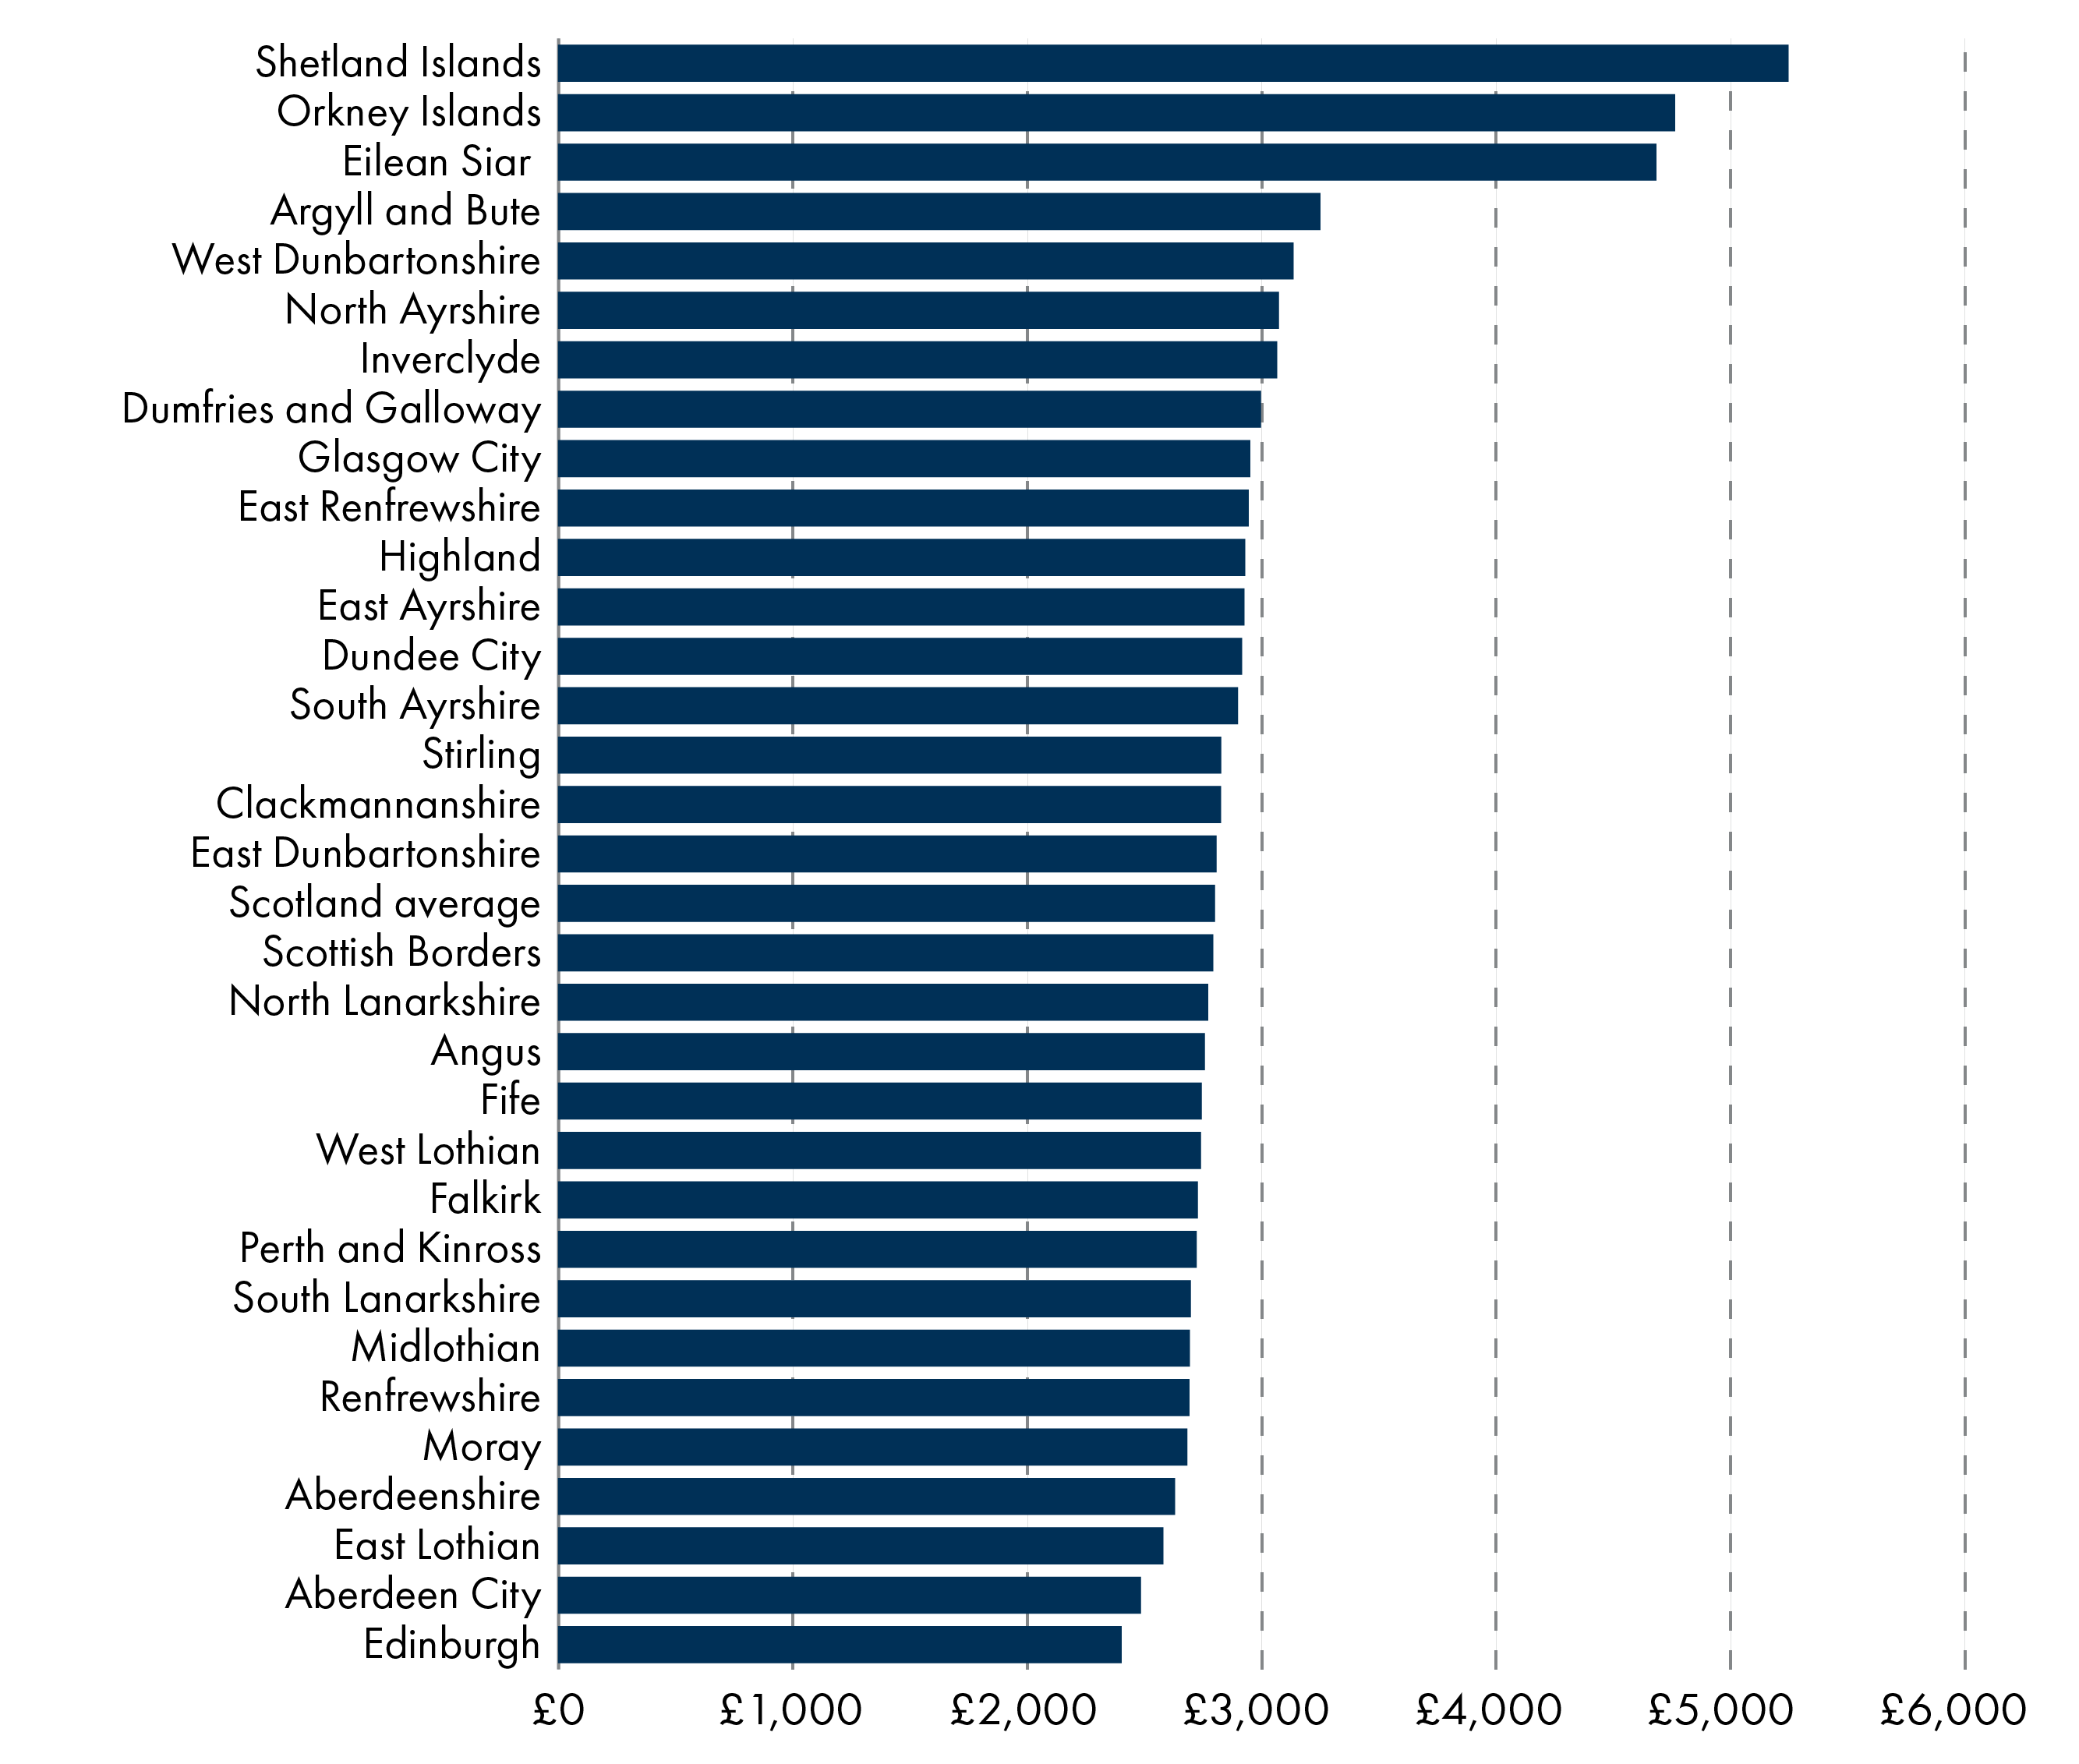
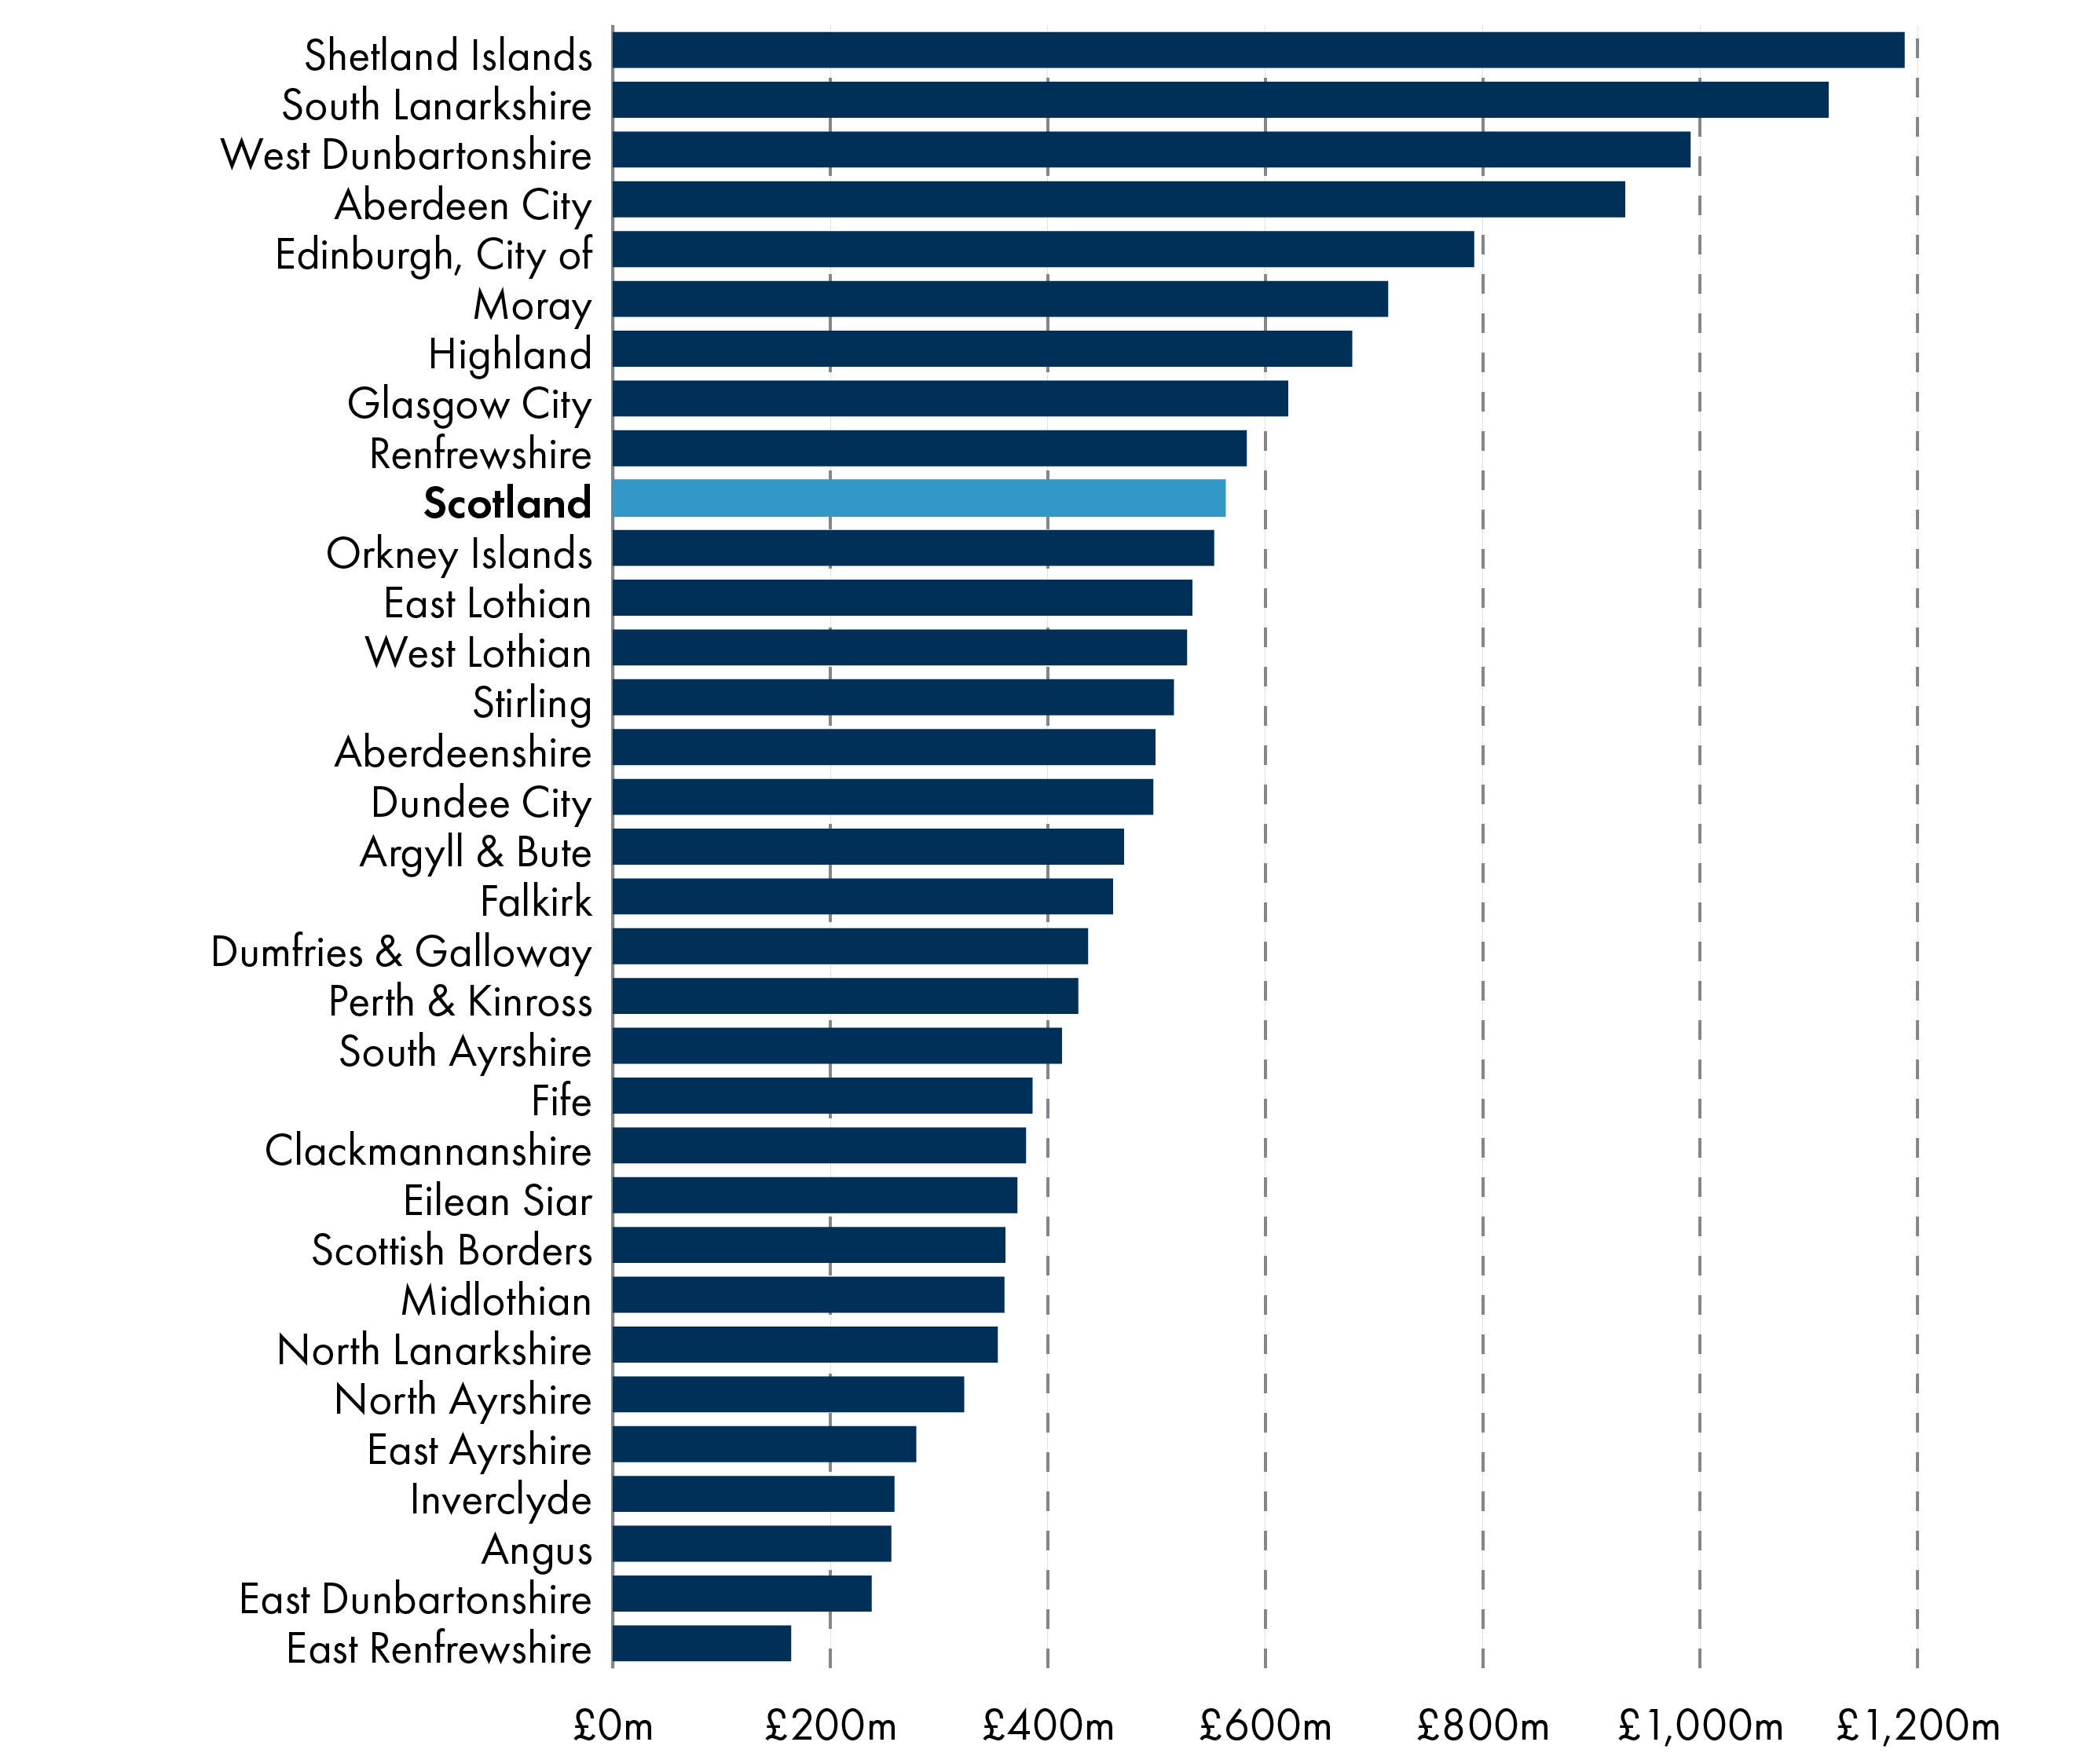
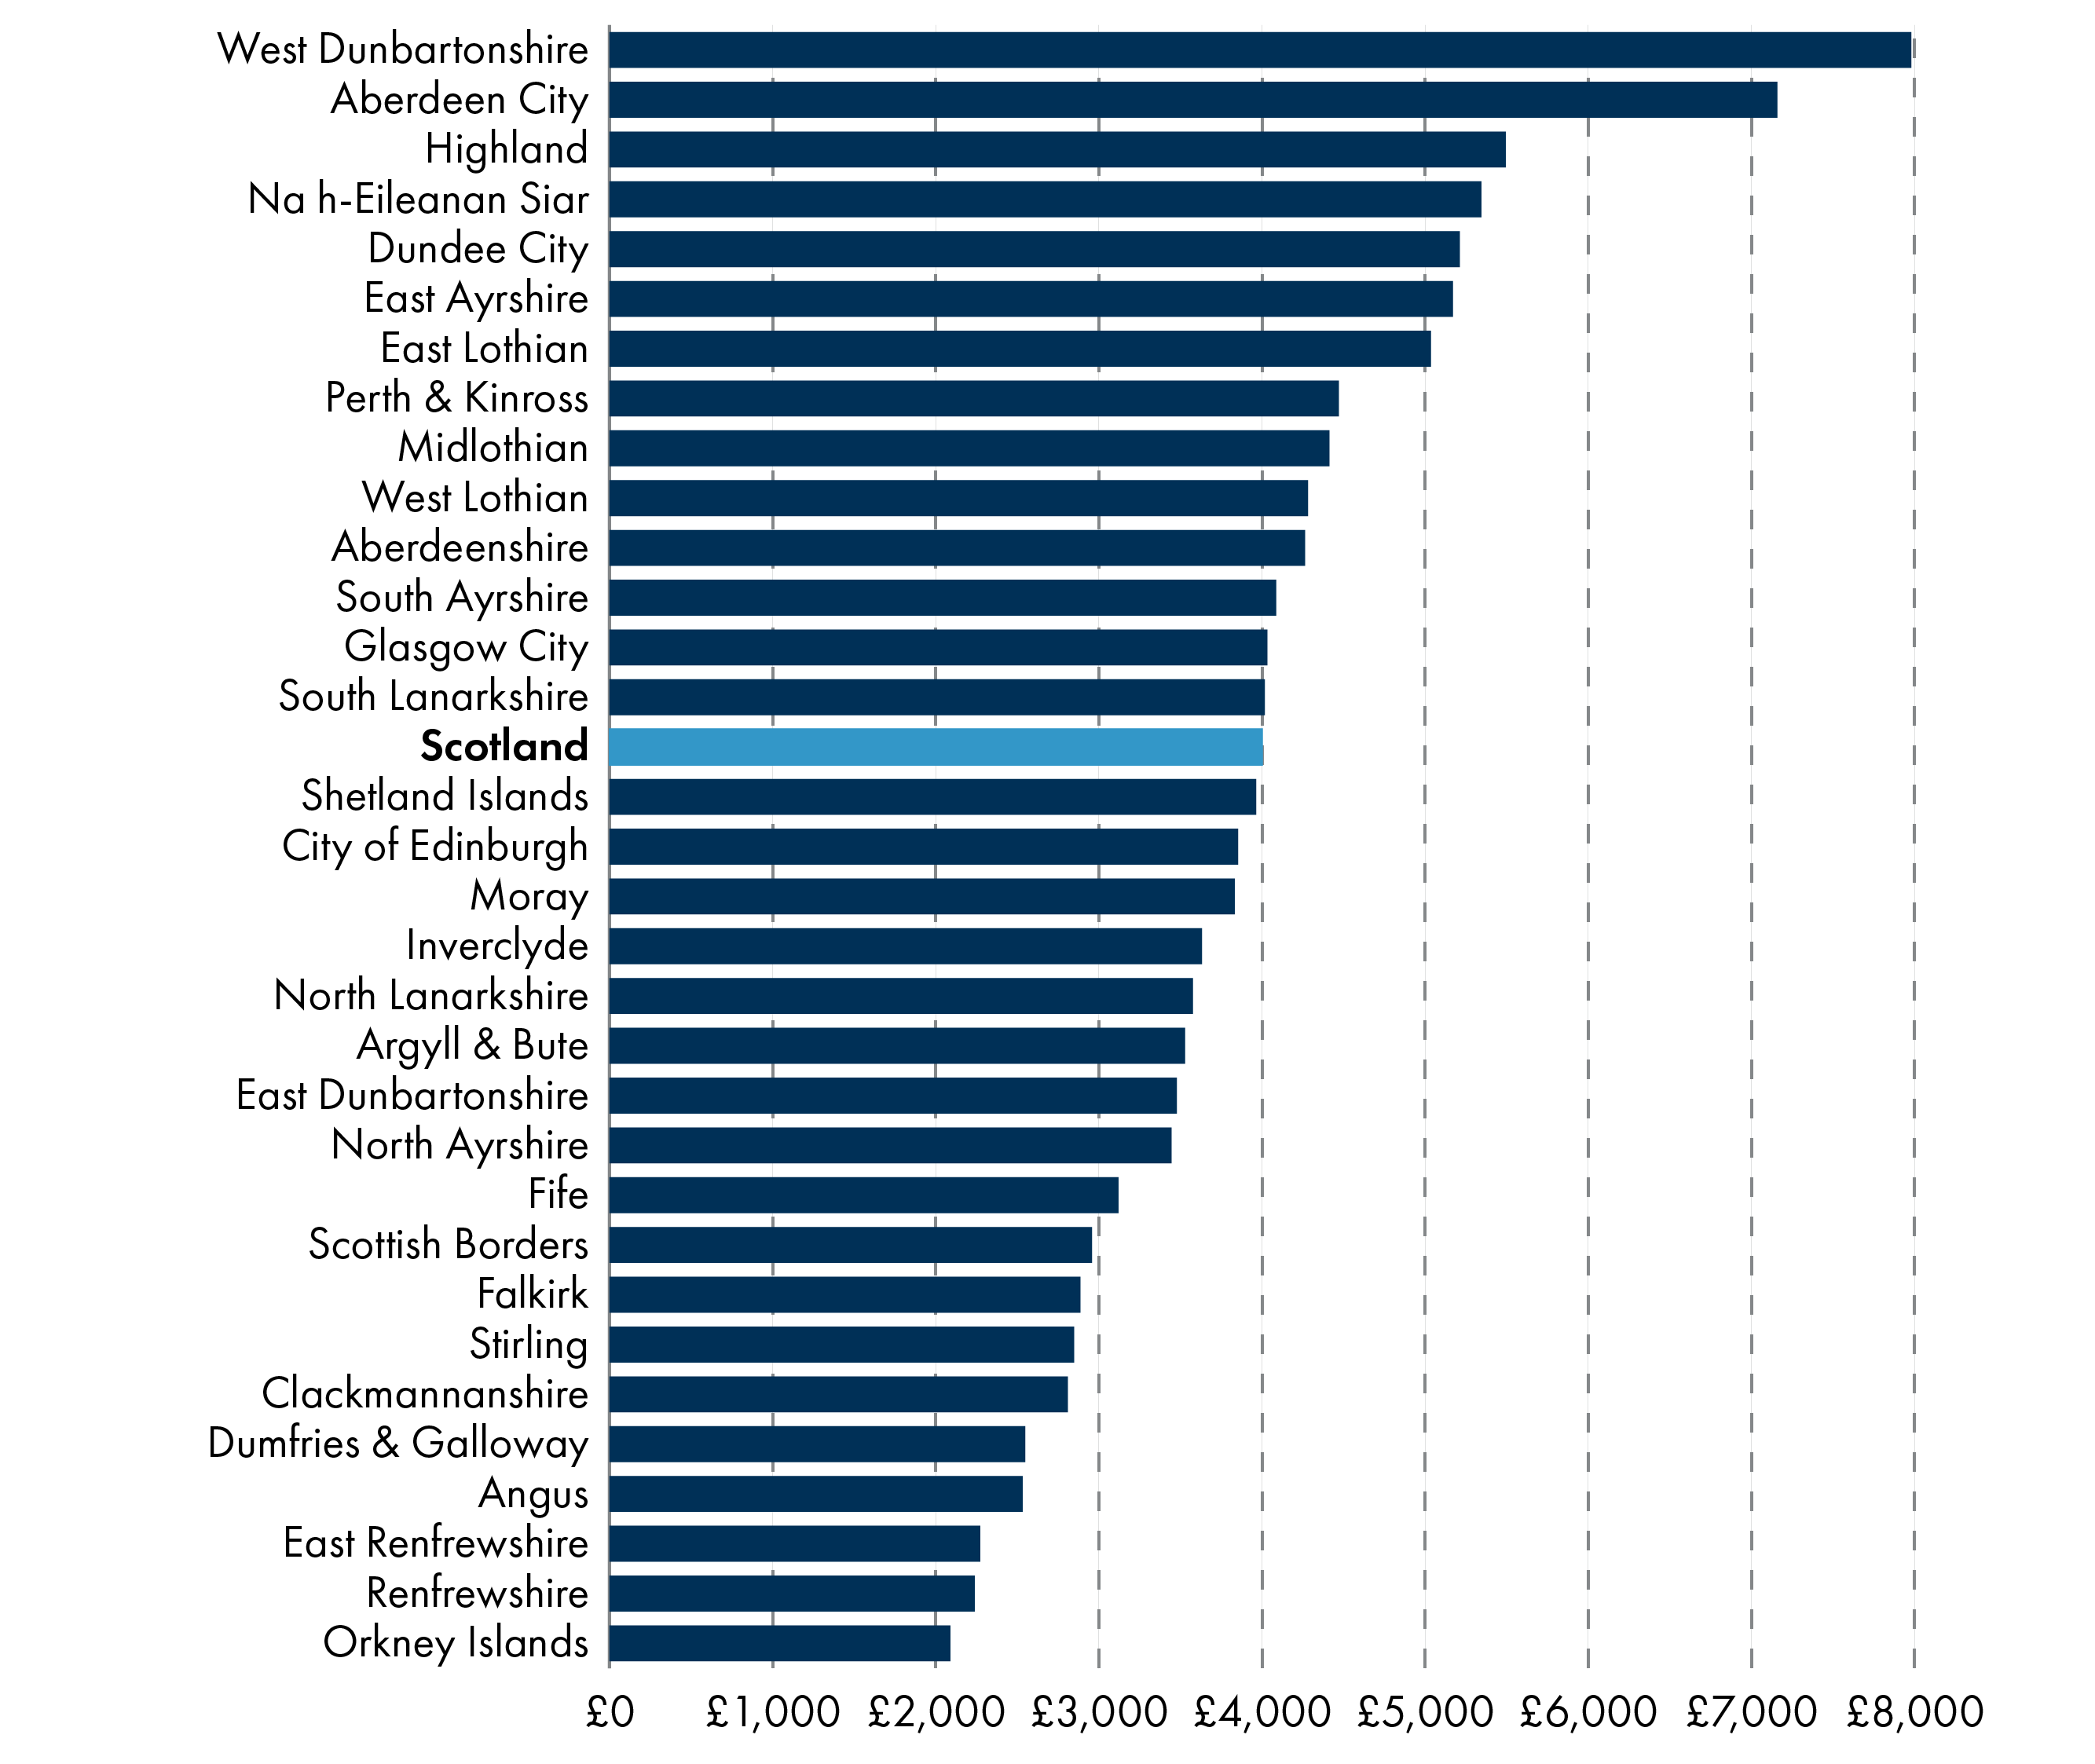
The combination of revenue grant funding, non domestic rates and council tax income is the same as Total Estimated Expenditure (TEE) as set out in the Local Government Finance Circulars, Annex B. Chart 11 (below) shows TEE per person for each local authority, with councils ranked from the highest per head to the lowest. With an all-Scotland average of £2,797 per head, Shetland and Orkney councils see the highest expenditure per head, whilst Edinburgh and Aberdeen see the smallest:
Local Government Finance Circular, 2/2024, Annex B and Mid-year population estimates from the National Records of Scotland
Some Members of the Scottish Parliament have stated that Edinburgh and Aberdeen are unfairly treated by the formula used to allocate local government funding. For example, during a recent Local Government, Housing and Planning Committee session, one of its Members asked COSLA:
I represent Edinburgh, which receives the lowest share per head of population but has some of the largest challenges in the country around homelessness and children in temporary accommodation. There are also the national events that take place in the capital and the costs that arise from those. What is COSLA’s thinking on that?
COSLA's position is that it seeks to increase funding for all local authorities: "the issue is the size of the cake that we are given, rather than the size of individual slices that local authorities receive". And the Scottish Government, when asked about the issue, told the Committee:
...the funding formula is a matter for COSLA. Over the years, adjustments have been made to the funding formula, but it is a thorny issue among local authorities. There is probably quite a lot of hesitance in COSLA and local government more widely about opening up that Pandora’s box, because there will be winners and losers from any adjustment to the formula. It is not something that we can do to local government; it has to be initiated by COSLA.
Allocations to individual councils over time
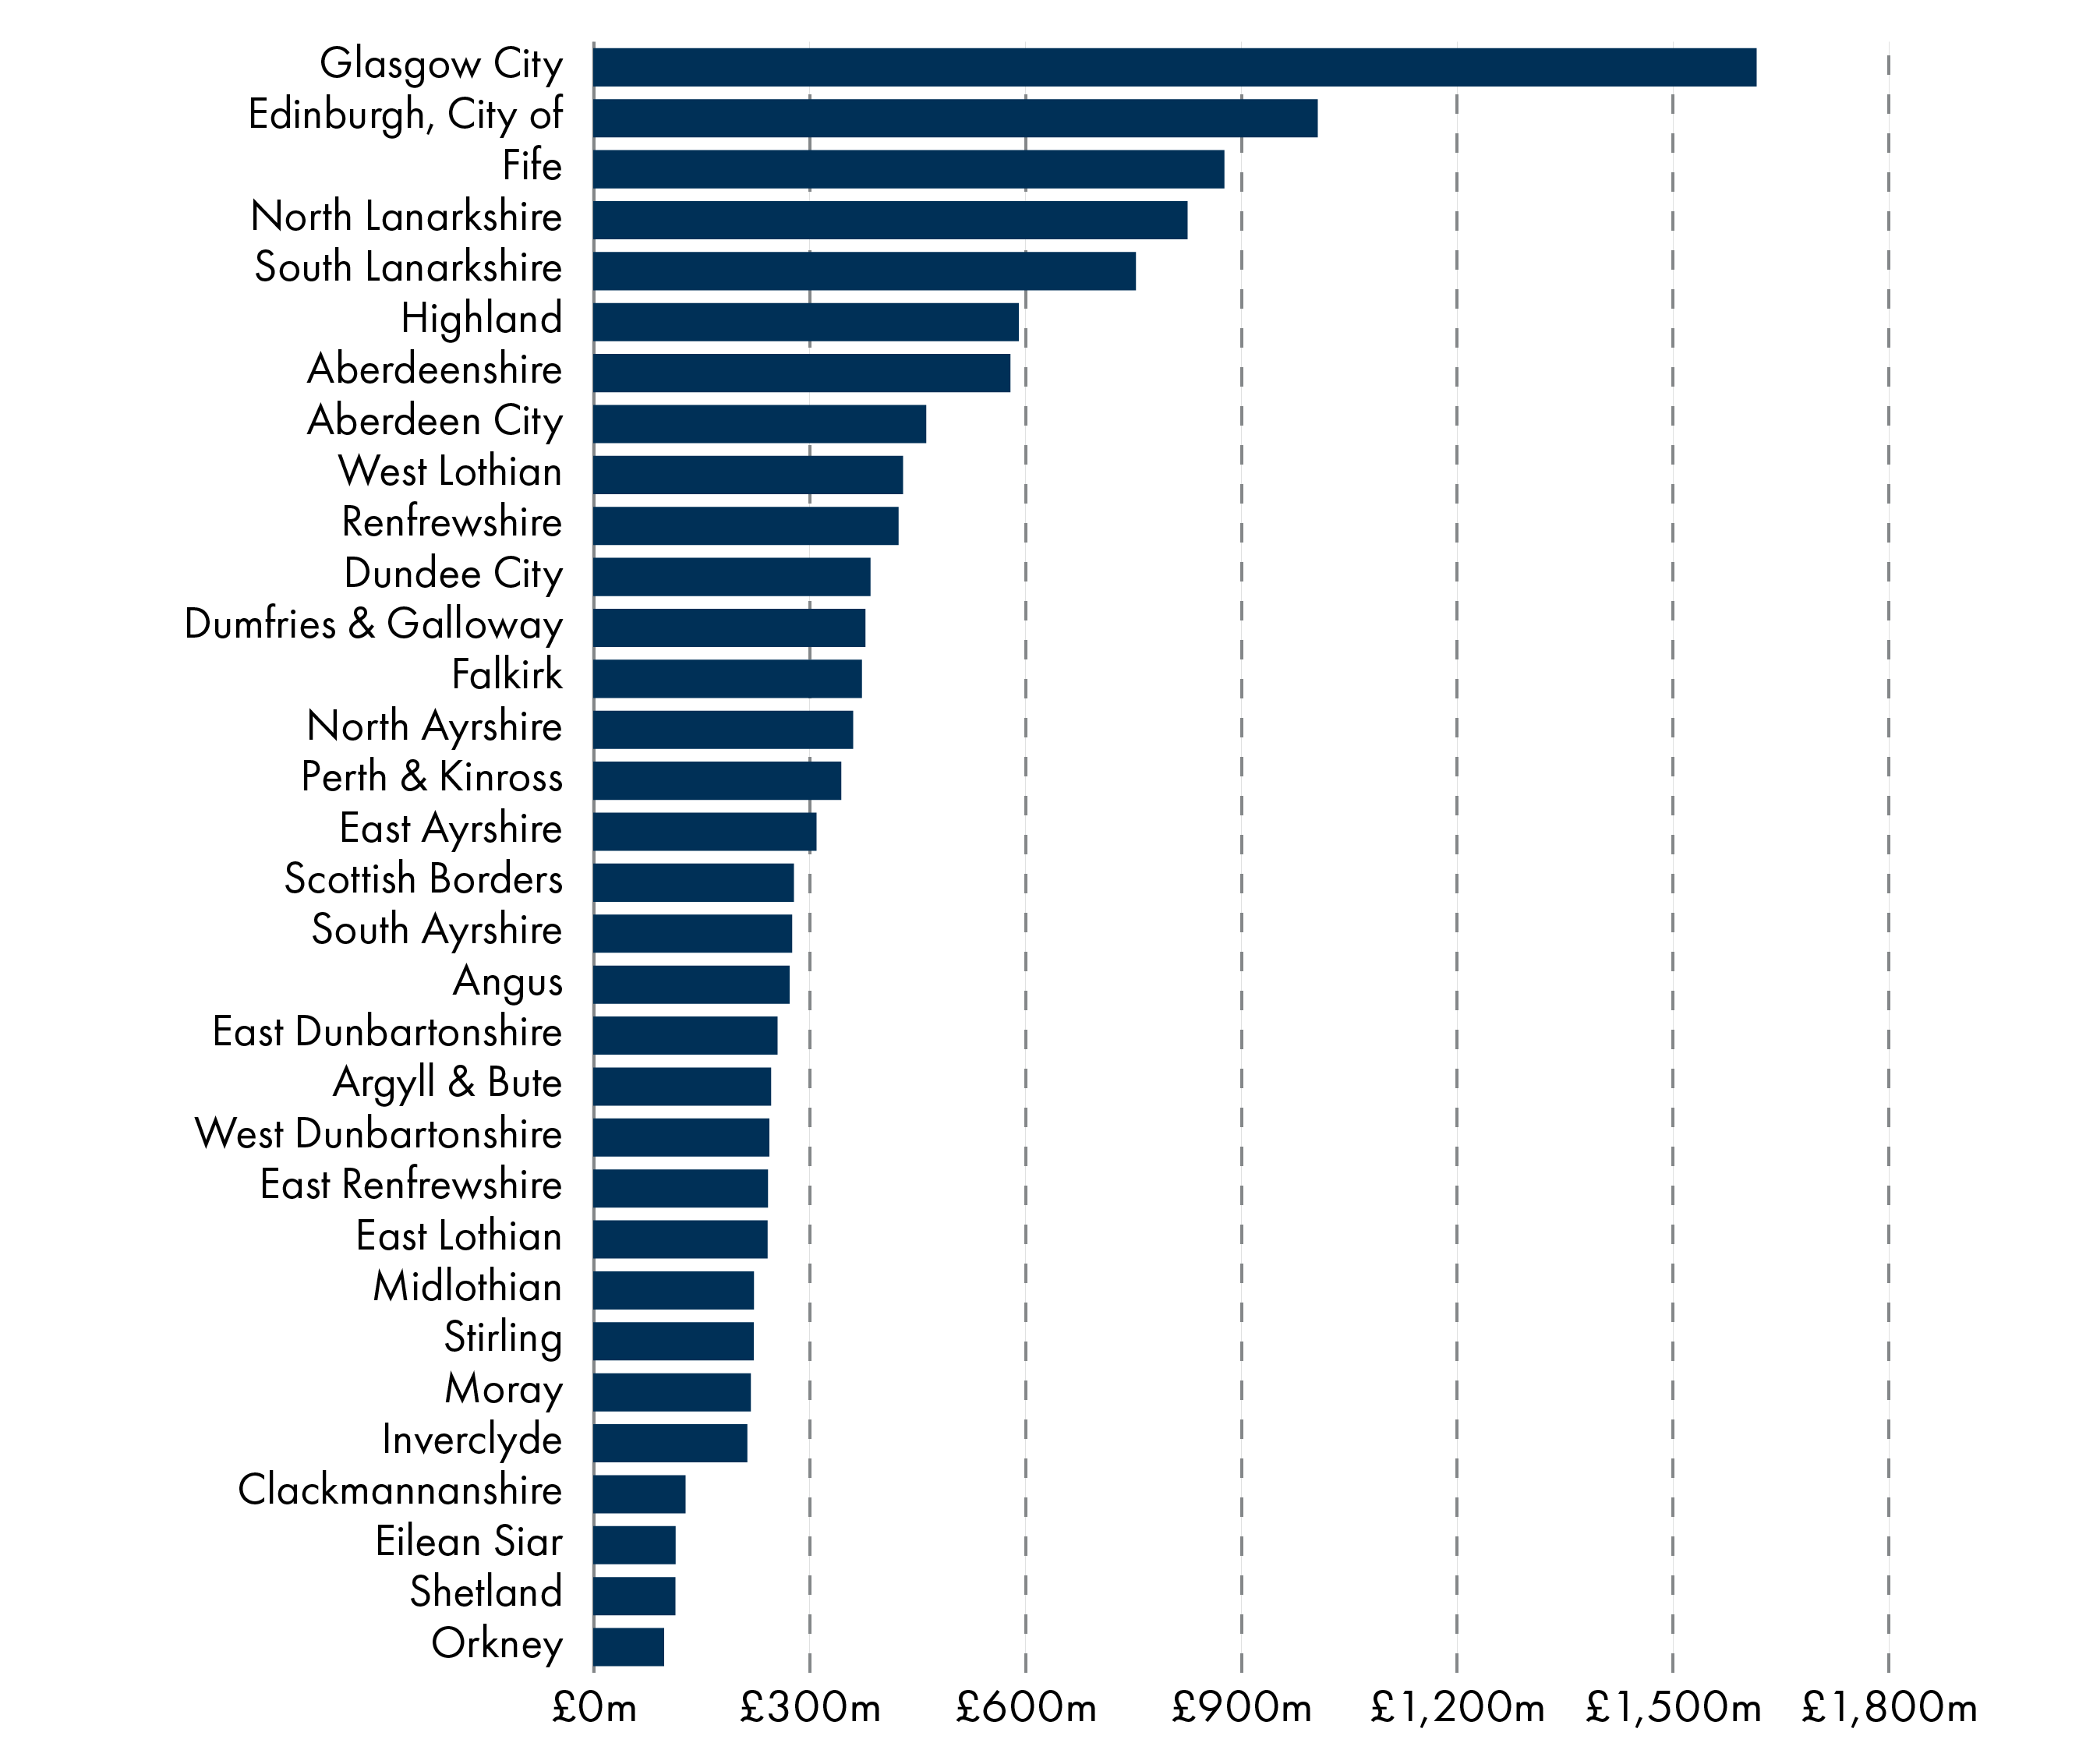
Revenue settlements to individual local authorities, as documented in the Scottish Government's finance circulars, include General Revenue Grants, non-domestic rates income and ring-fenced (specific) grants. Overall, this combined revenue allocation comes to just over £13 billion in 2024-25. Local authorities are informed about their likely allocations for the following financial year shortly after the publication of the Scottish Budget. However, the final allocations are not confirmed until after the Scottish Parliament debates and votes on the draft Local Government Finance Order in late February. The following allocations were approved by Parliament on 28th February 2024:
Local Government Finance Circular, 2/2024, Annex B
Chart 13 (below) shows the change in local authority revenue allocations between 2013-14 and 2024-25, presented in real terms, with sizeable increases seen in the Lothians and other eastern mainland areas. At the other end of the chart, we can see real term reductions in the revenue allocations of some west coast authorities such as Argyll and Bute, Inverclyde and West Dunbartonshire. Eilean Siar sees the largest reduction over the period and it is no co-incidence that this council area has also seen considerable depopulation over the period (a reduction in population of 4% between 2013 and 2022)1.
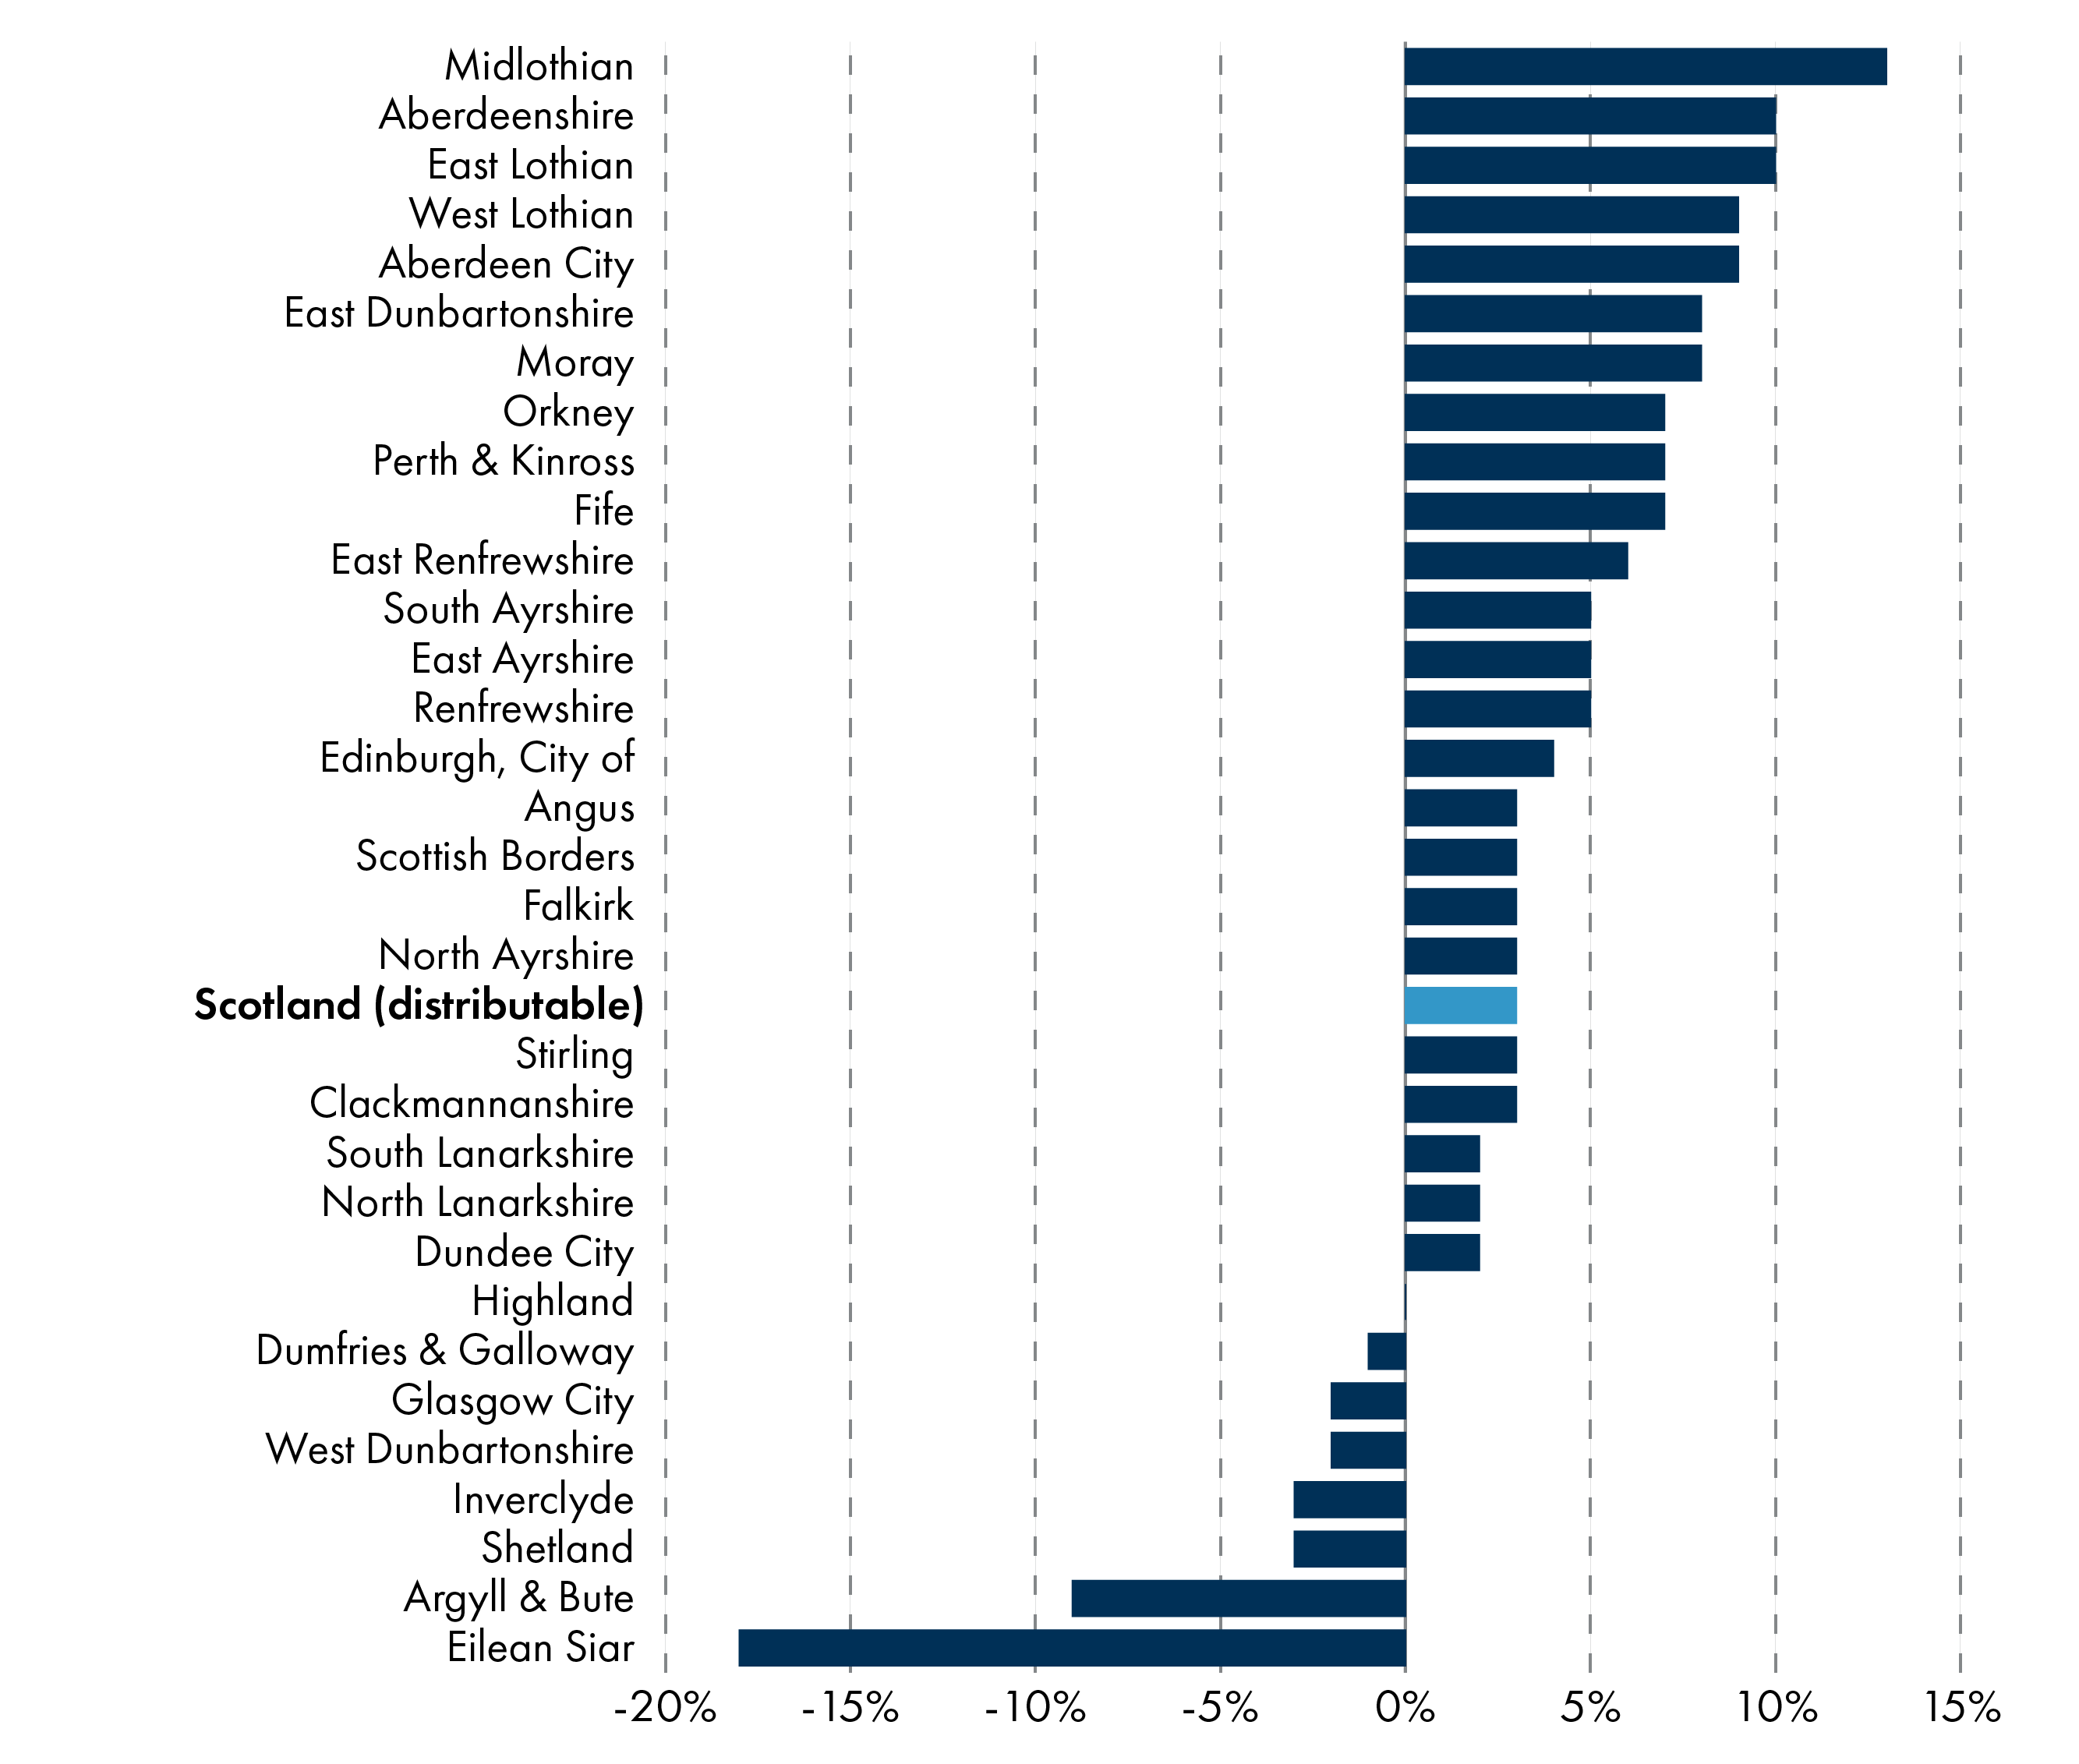
Local Government Finance Circulars, 2/2013 and 2/2024
Another way to present settlement figures is as per head calculations and compare these in real terms (i.e adjusting for inflation). Chart 14 does this, with 2013-14 per head values converted into 2024-25 prices and percentage changes shown. Local authorities are then ranked from largest per head % increase (Aberdeen City) to the largest per head % reduction (Eilean Siar):
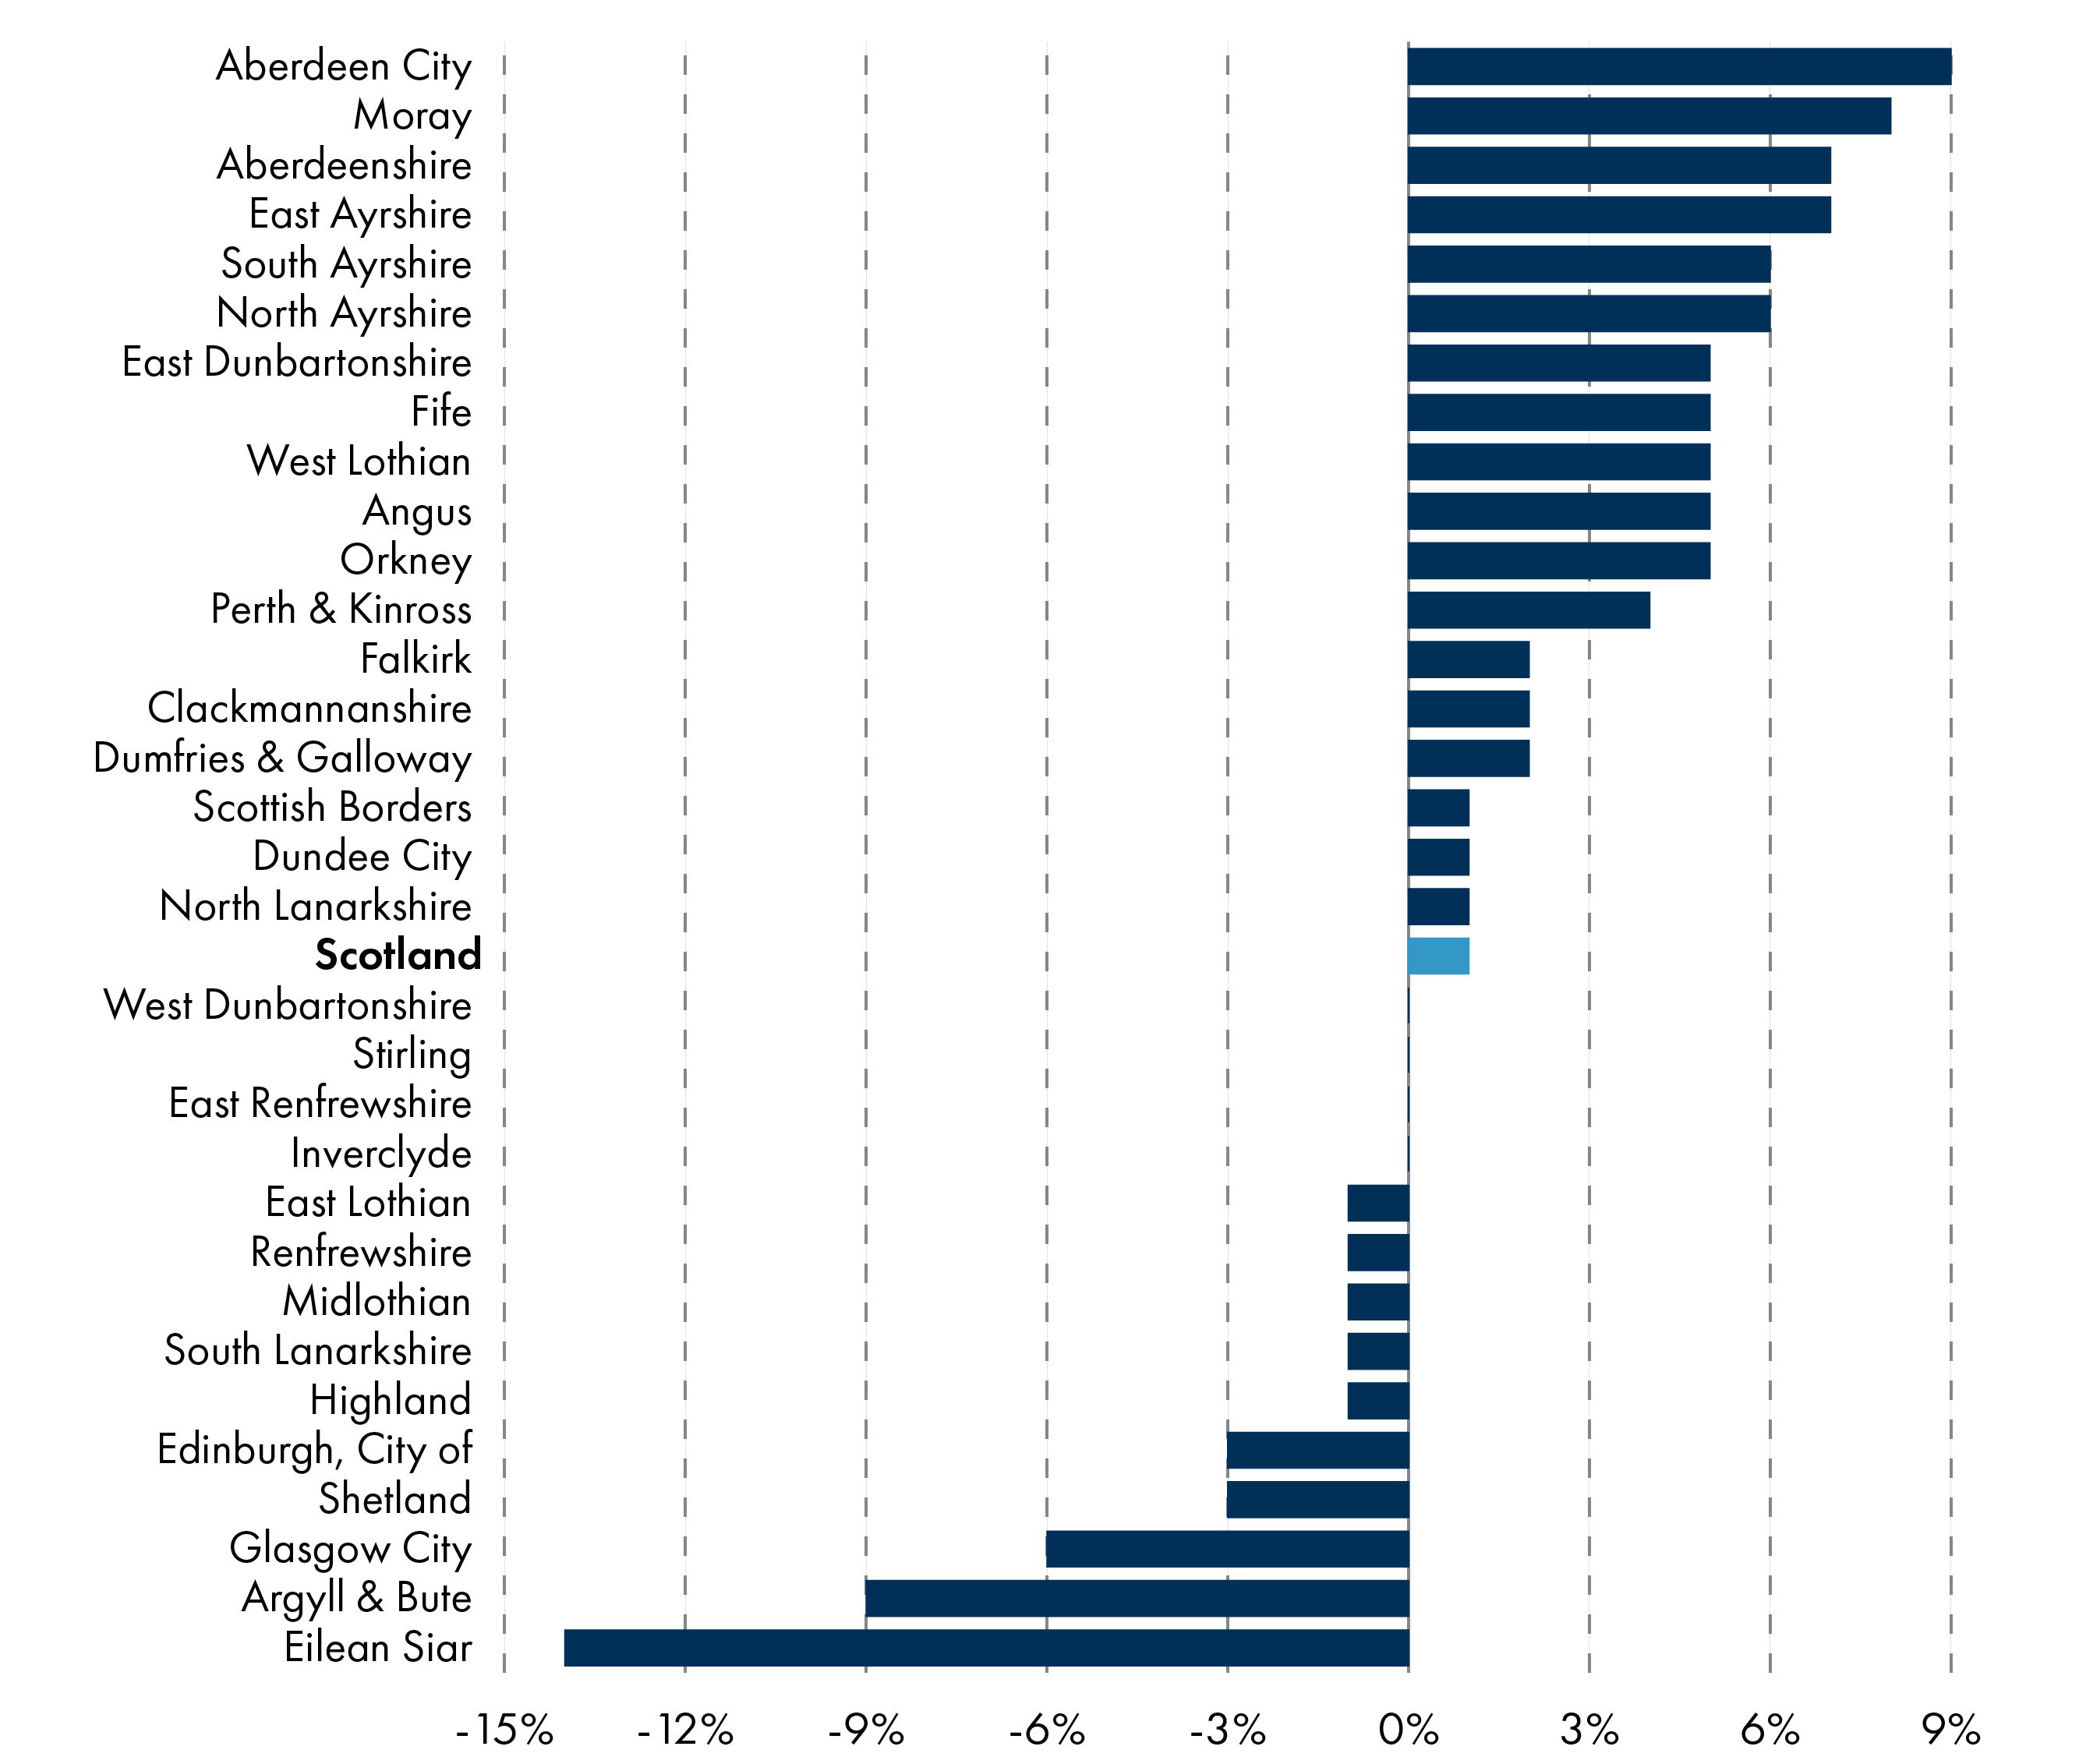
Local Government Finance Circulars, 2/2013 and 2/2024 and Mid-year population estimates from the National Records of Scotland
Budget gaps in 2024-25 and 2025-26
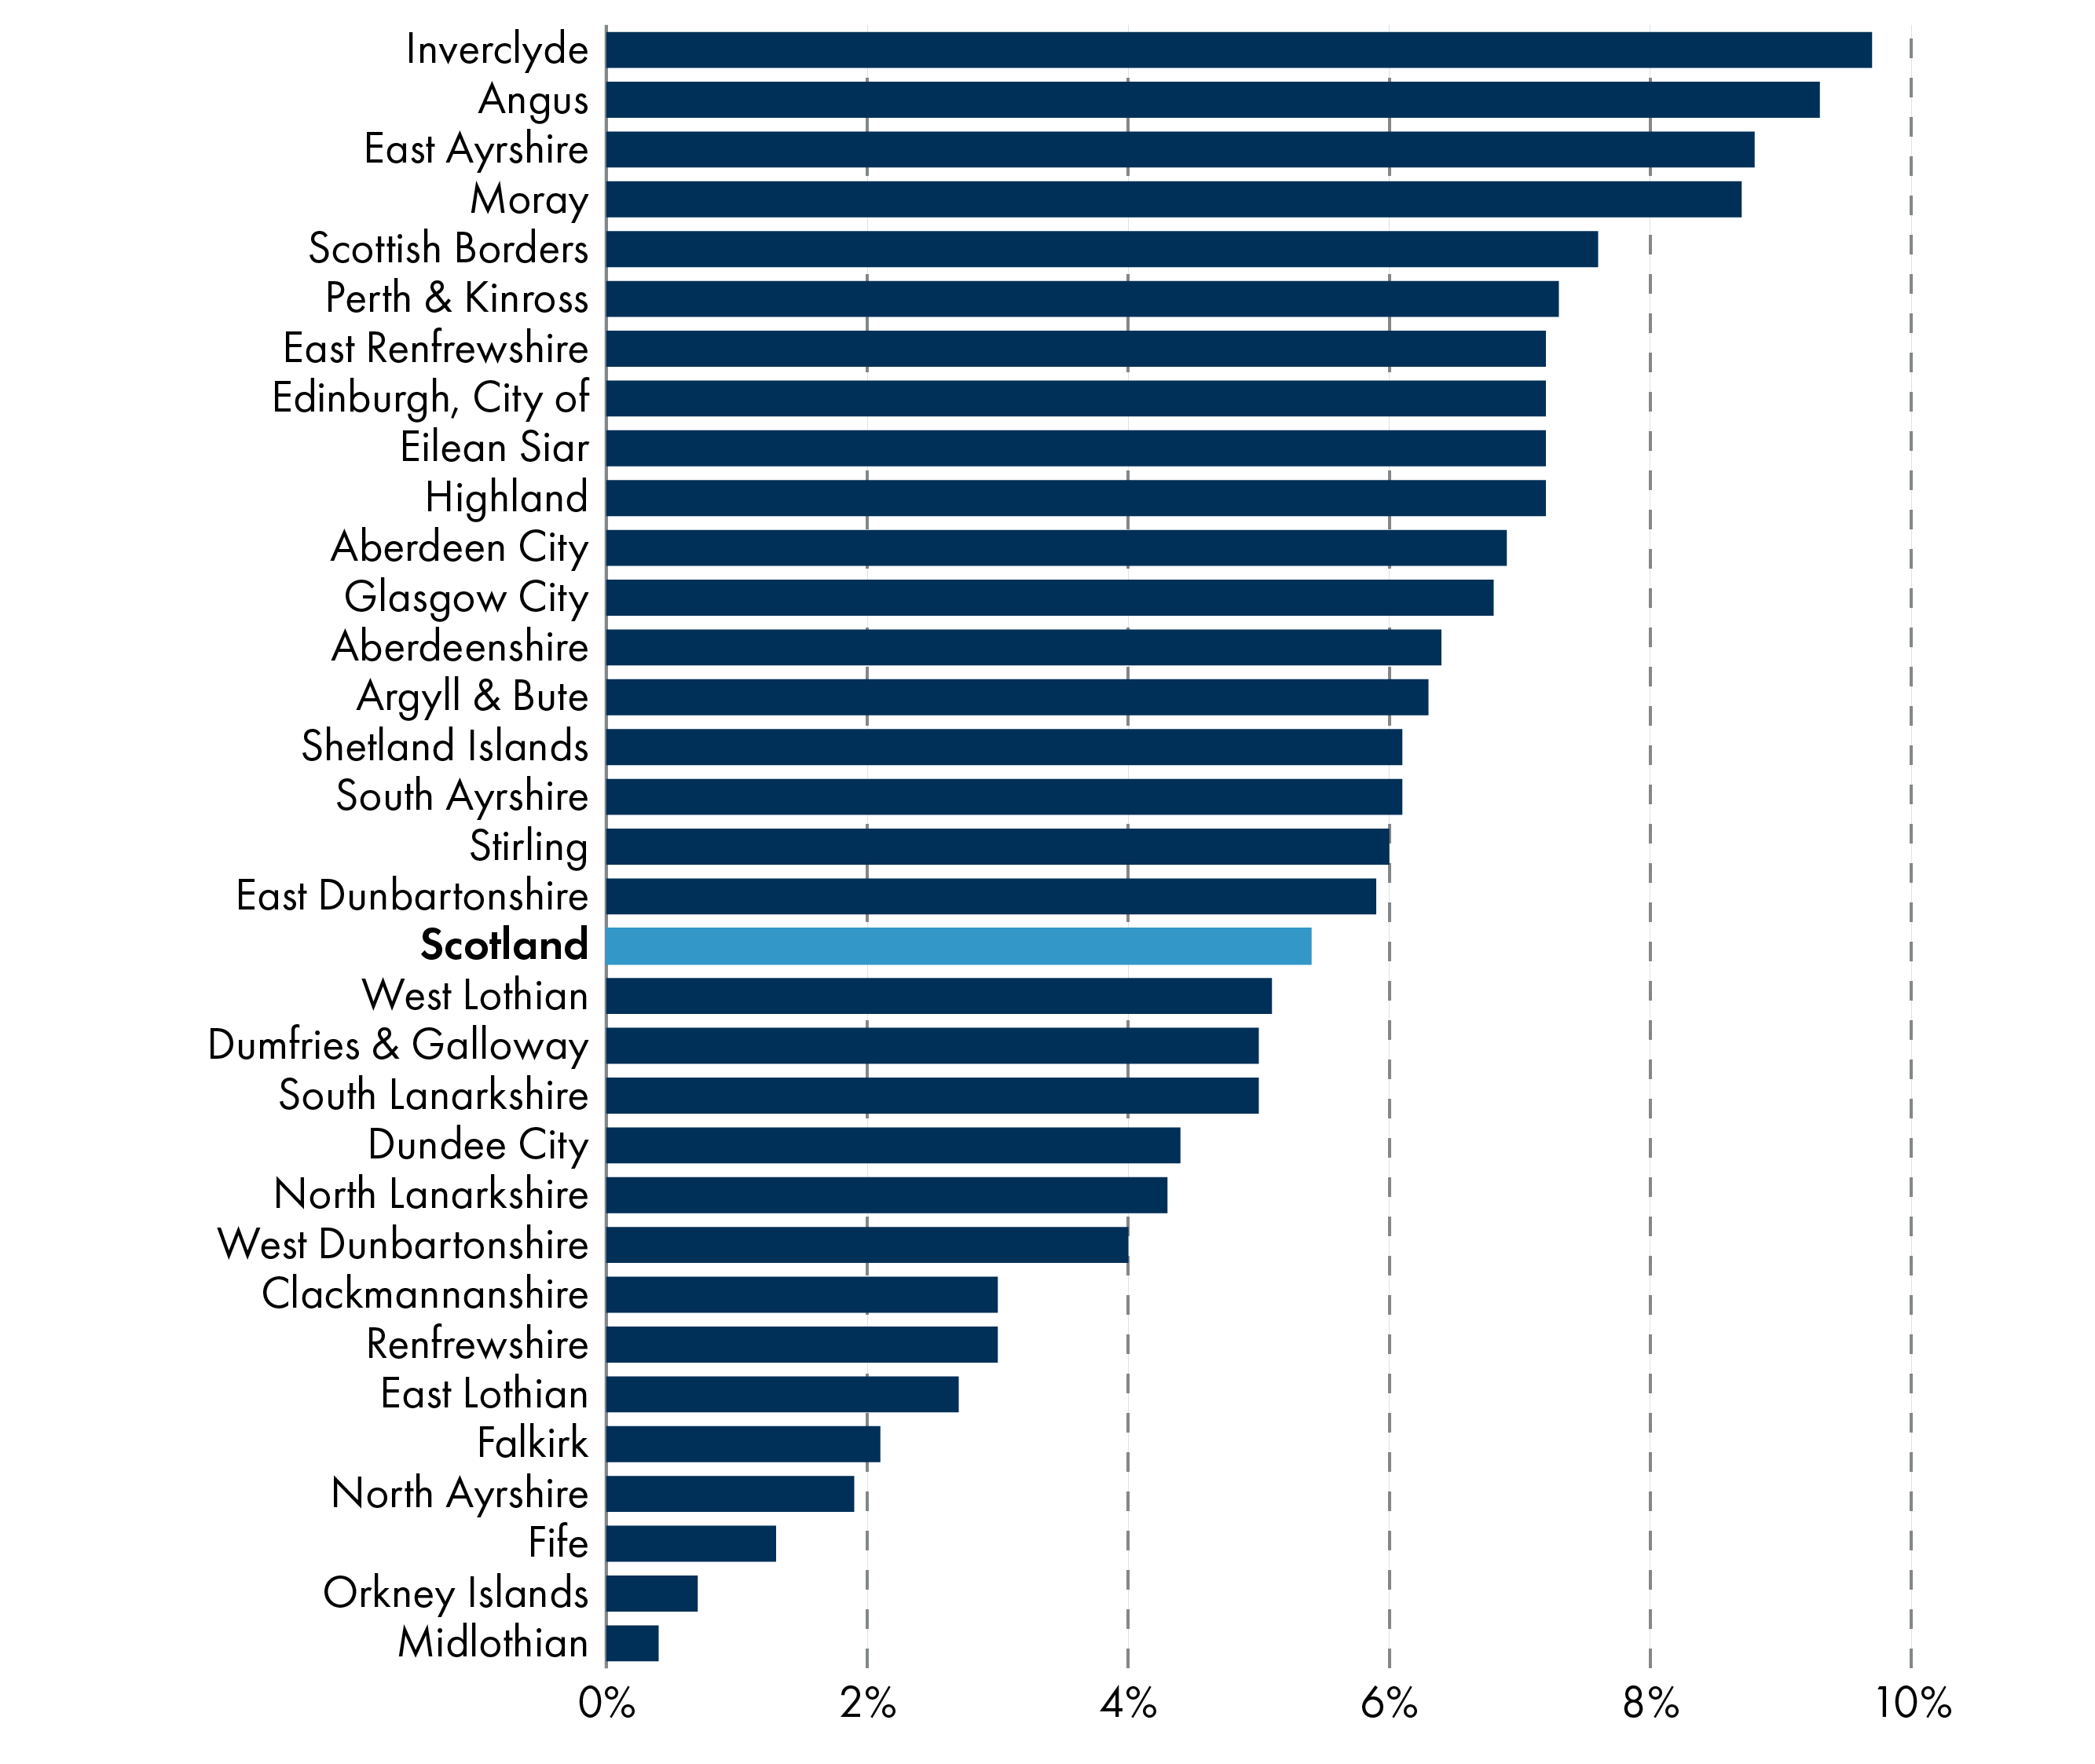
The Accounts Commission published a report in May 2024 summarising budget decisions made by Scotland's 32 councils, with information gathered by council auditors over the previous months1. One of its main findings was that councils face a gap of around £585 million between their anticipated expenditure and the income they expected to receive in 2024-25. At council meetings across the country, various options were discussed as to how these budget gaps should be addressed.
The range of budget gaps across the 32 councils is quite striking, from £3.1 million in Glasgow to £65.6 million in Highland, or 0.2% and 8.5% of their respective total revenue budgets1. The following chart shows all council budget gaps in 2024-25 with data provided by the Accounts Commission:
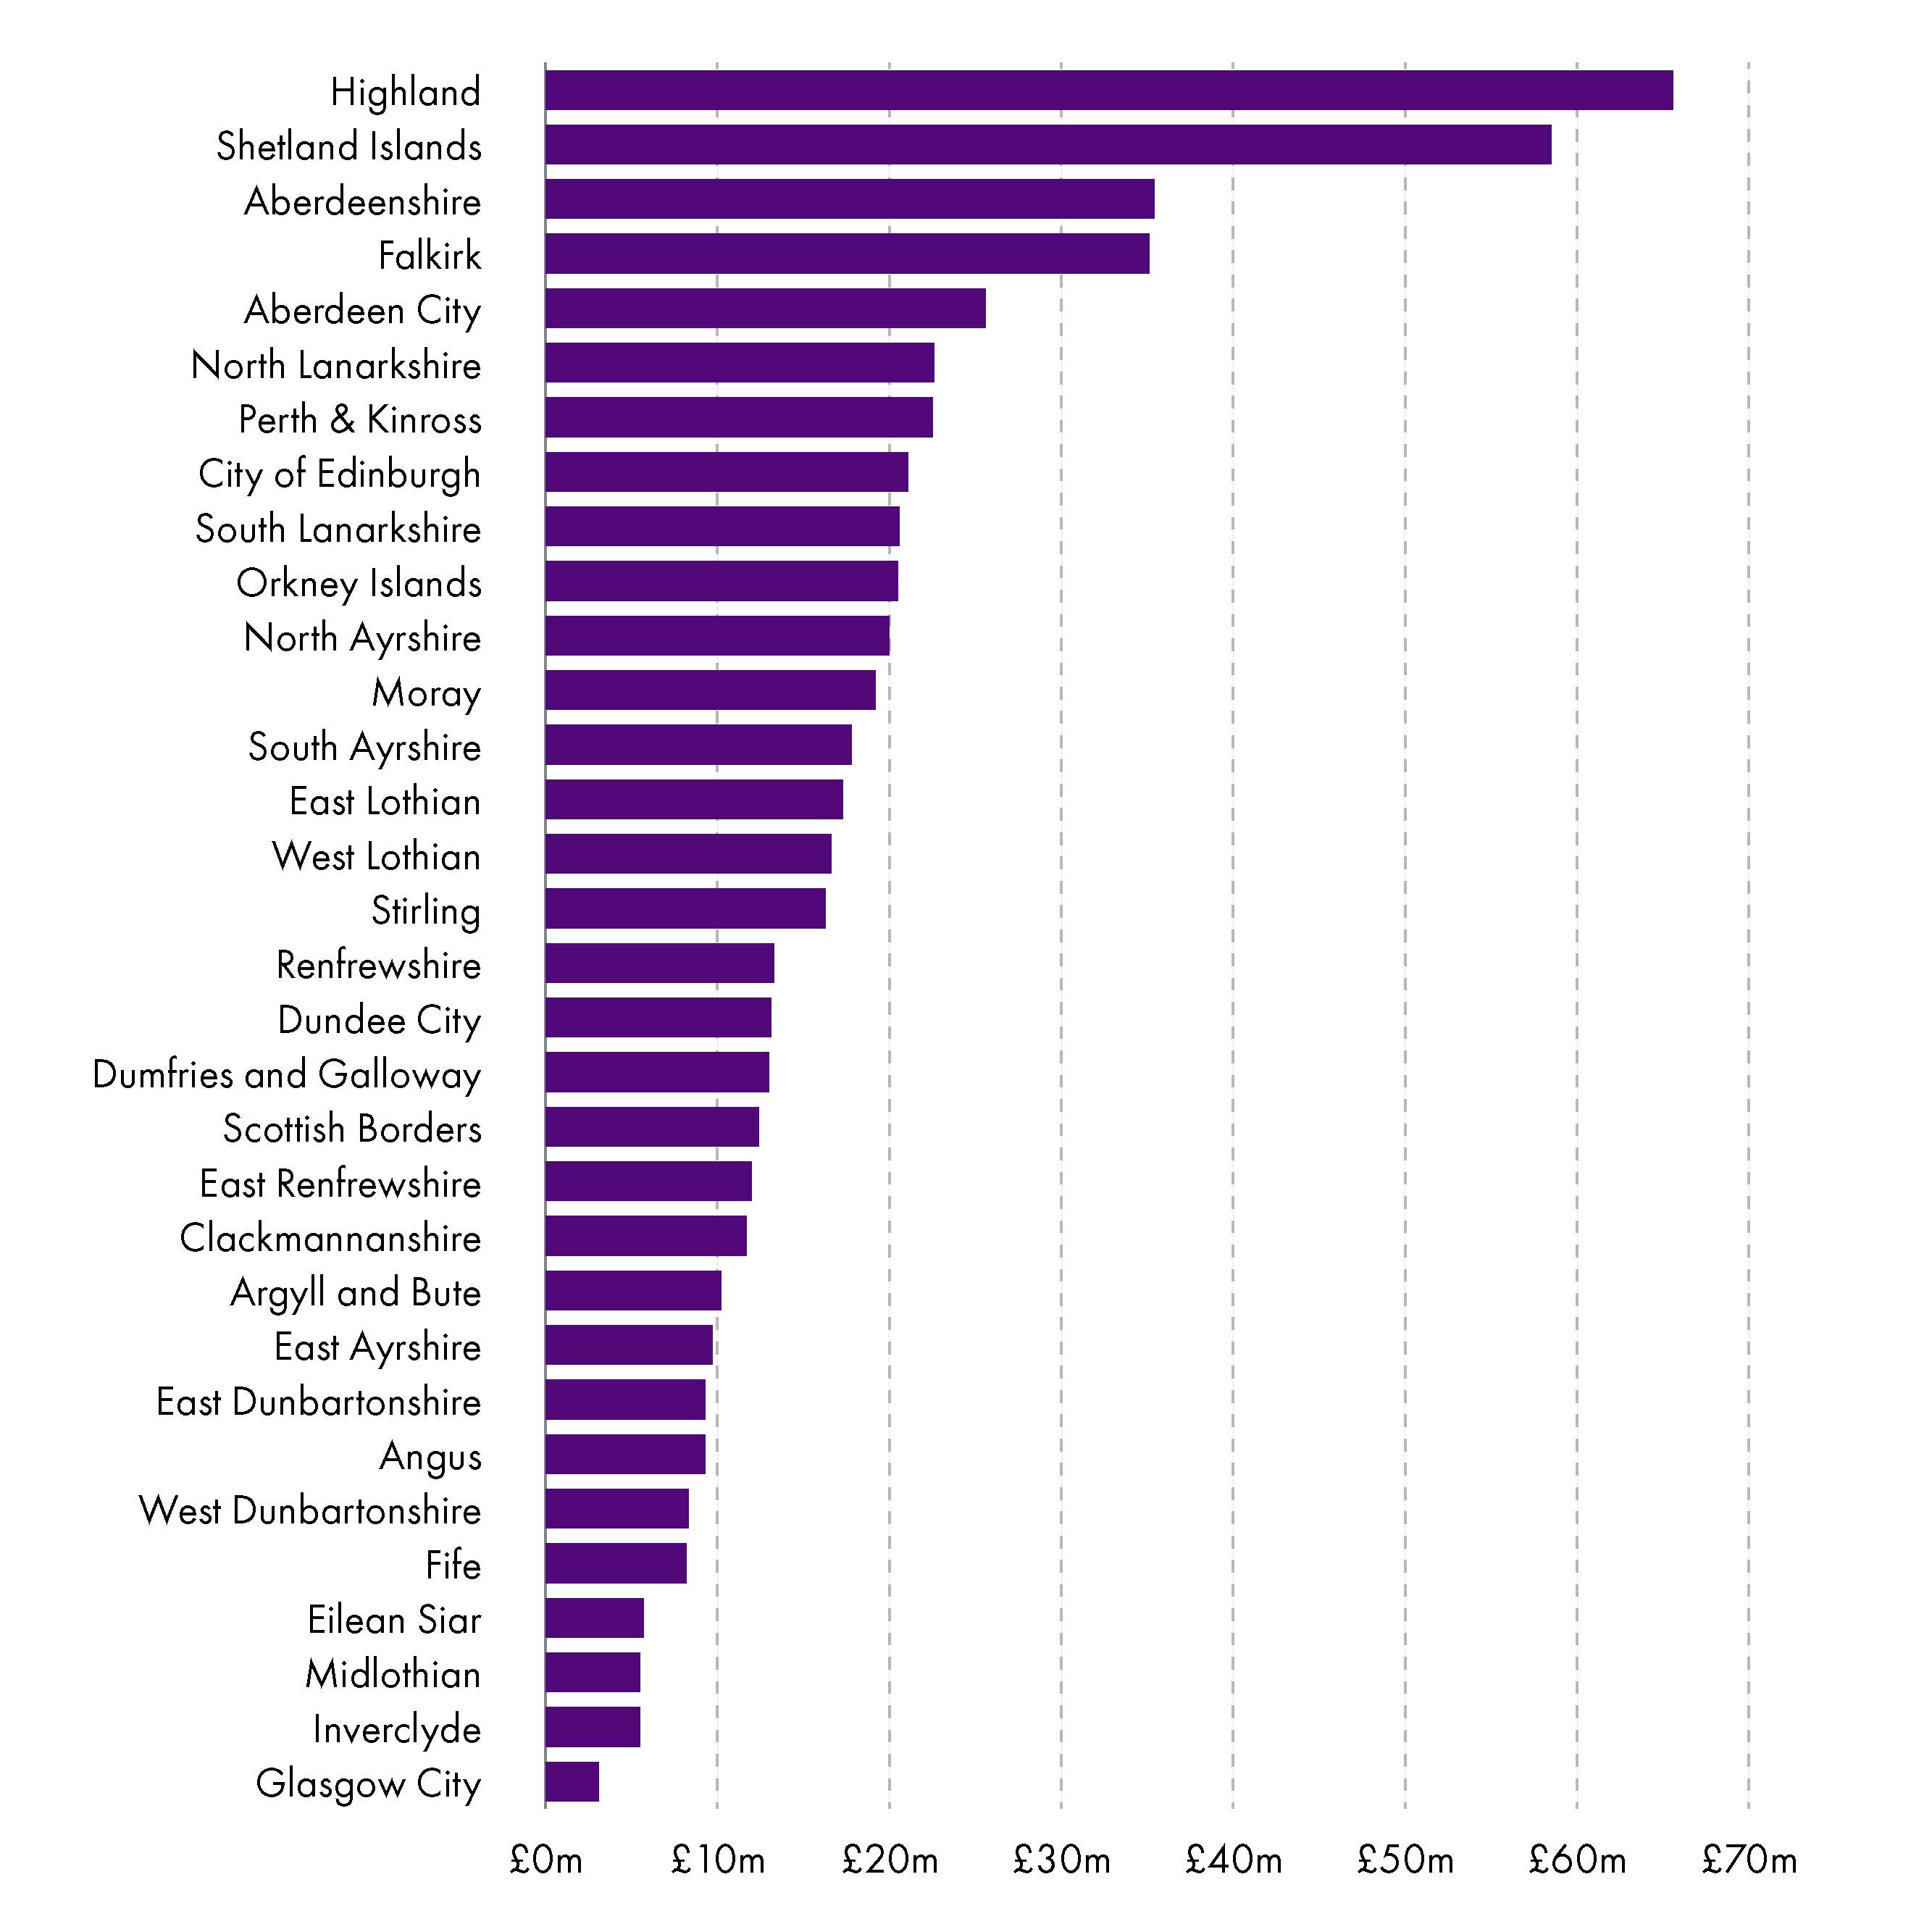
Accounts CommissionAccounts Commission. (2024). Local government budgets 2024/25. Retrieved from https://audit.scot/publications/local-government-budgets-202425
The Commission's report documents the various ways councils plan to close their budget gaps this year, mainly through the use of "recurring savings" and the spending of council reserves (more of which later). Recurring savings are savings that are expected to deliver a longer-term reduction in costs, not just a one-off saving, so might include efficiency savings, or reducing spending on a service through redesign or digitalisation.
According to the Commission, local authorities are also "budgeting for an increase in the income generated through fees and charges", with examples including new charges for garden waste, bulky waste uplift and for cruise ships using harbours. The new low emission zone charge in Dundee was also mentioned.
With councils facing a further budget gap of £393 million forecast in 2025-26, the Accounts Commission concludes "it's getting harder for councils to do more with less. They have to find and then deliver significant levels of savings to address budget gaps which represents five per cent of councils’ revenue budget"1. Councils have already started consulting their communities about shortfalls in 2025-26, with Aberdeen City Council, for example, launching a public consultation seeking views on income raising options and potential spending reductions in areas such as culture and sport, communities; citizen services, education, roads, waste and the environment. Participants are presented with a number of scenarios with questions such as: "What is the maximum percentage increase on Council Tax you would be willing to pay to help us lessen spending reductions?" and "Capital Projects are expensive, how would you prioritise the limited resources we have?".
Capital grant allocations to individual councils
As is explored in a following chapter, local authorities fund their capital projects a number of ways, including borrowing from the Public Works Loans Fund (PWLB), using other credit arrangements (e.g. PPP type arrangements), deploying capital reserves and, of course, spending capital grants. The latter are provided by the Scottish Government in the form of general and specific capital grants. It is almost always the case that these grants can only be used for capital purposes, although as noted earlier, there have been recent examples of capital budgets being shifted to fund pay deals, which represent part of the revenue budget.
Like revenue grants, the Scottish Government uses an agreed funding formula to allocate general capital grants. This is primarily based on population size and road-length. The Green Book includes details of how the total of £567 million of distributed general capital grant was distributed in 2024-251, and Chart 15 shows the resulting capital grants allocations by local authority in 2024-25:
Local Government Finance Circular, 2/2024, Annex I
Council tax income
Council tax was introduced across the UK in 1993 as a local property tax, and most households have to pay it. Currently, it is Scotland's only locally set tax, and even then there are some restrictions imposed by national government on what councils can and cannot do. For example, the ratios between Council Tax bands are defined by national legislation and have been since the tax was first introduced. Moreover, the Scottish Government may try to ensure a cap or freeze on council tax increases (as it did this financial year and has for much of the period covered by this briefing). Despite these limits and interventions, council tax is local in the sense that Band D rates are agreed each year by local councils, and the tax is then collected by local authorities, retained by them and spent on local authority services.
The Scottish Government's Provisional Outturn and Budget Estimates (POBE) publication shows that in 2024-25 the tax will likely bring in almost £3 billion for Scotland's councils, an estimated 19% of total local government general funding.1
| Component | 2024-25 (£m) | % of total general funding |
| General Revenue Grant (GRG) | 9,910 | 62% |
| NDR income | 3,068 | 19% |
| Council Tax | 2,964 | 19% |
| General revenue funding | 15,942 | 100% |
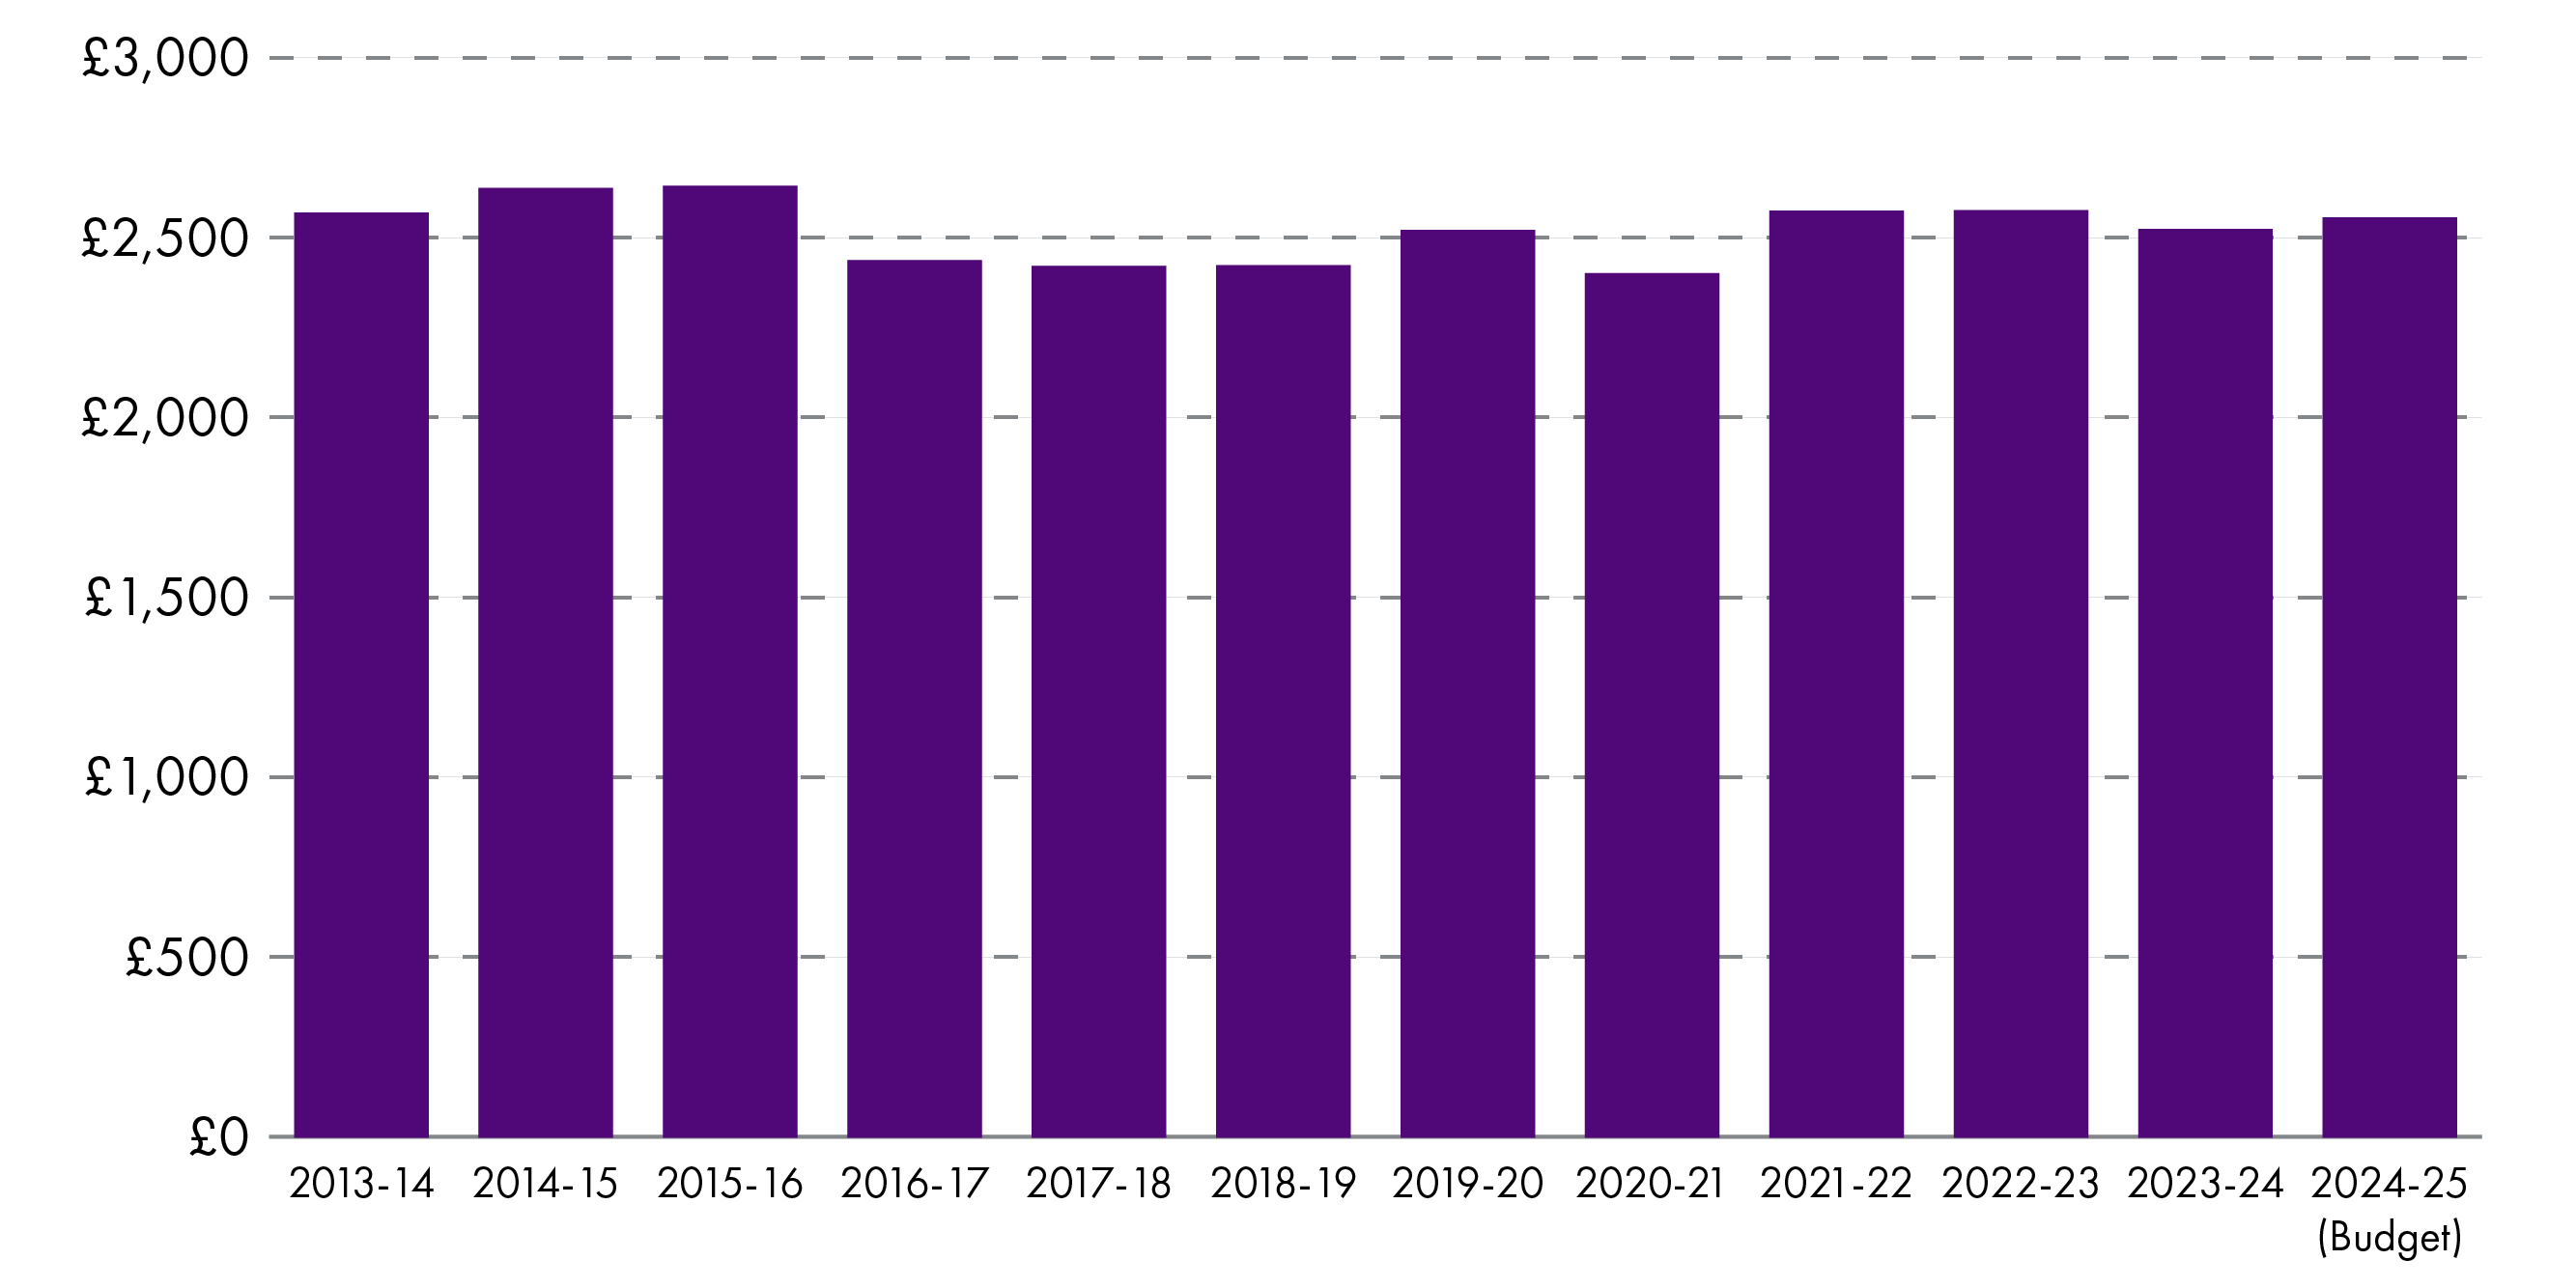
Despite council tax freezes being in place for much of the last 12 years, revenue from the tax has actually grown quite significantly in real terms, from £2.6 billion in 2013-14 to £3.0 billion in 2024-25. This will reflect new residential properties that are liable for council tax.
Table 2 (below) shows that while council tax income increased by 14%, General Revenue Grant income increased by 4% and there was a 5% decrease in NDR income over the period1.
| Component | 2013-14 | 2024-25 (budget) | £m change | % change |
| General Revenue Grant (GRG) | 9,556 | 9,910 | +354 | +4% |
| Non Domestic Rates income | 3,222 | 3,068 | -154 | -5% |
| Council Tax income | 2,606 | 2,964 | +358 | +14% |
| General revenue funding | 15,384 | 15,942 | +558 | +4% |
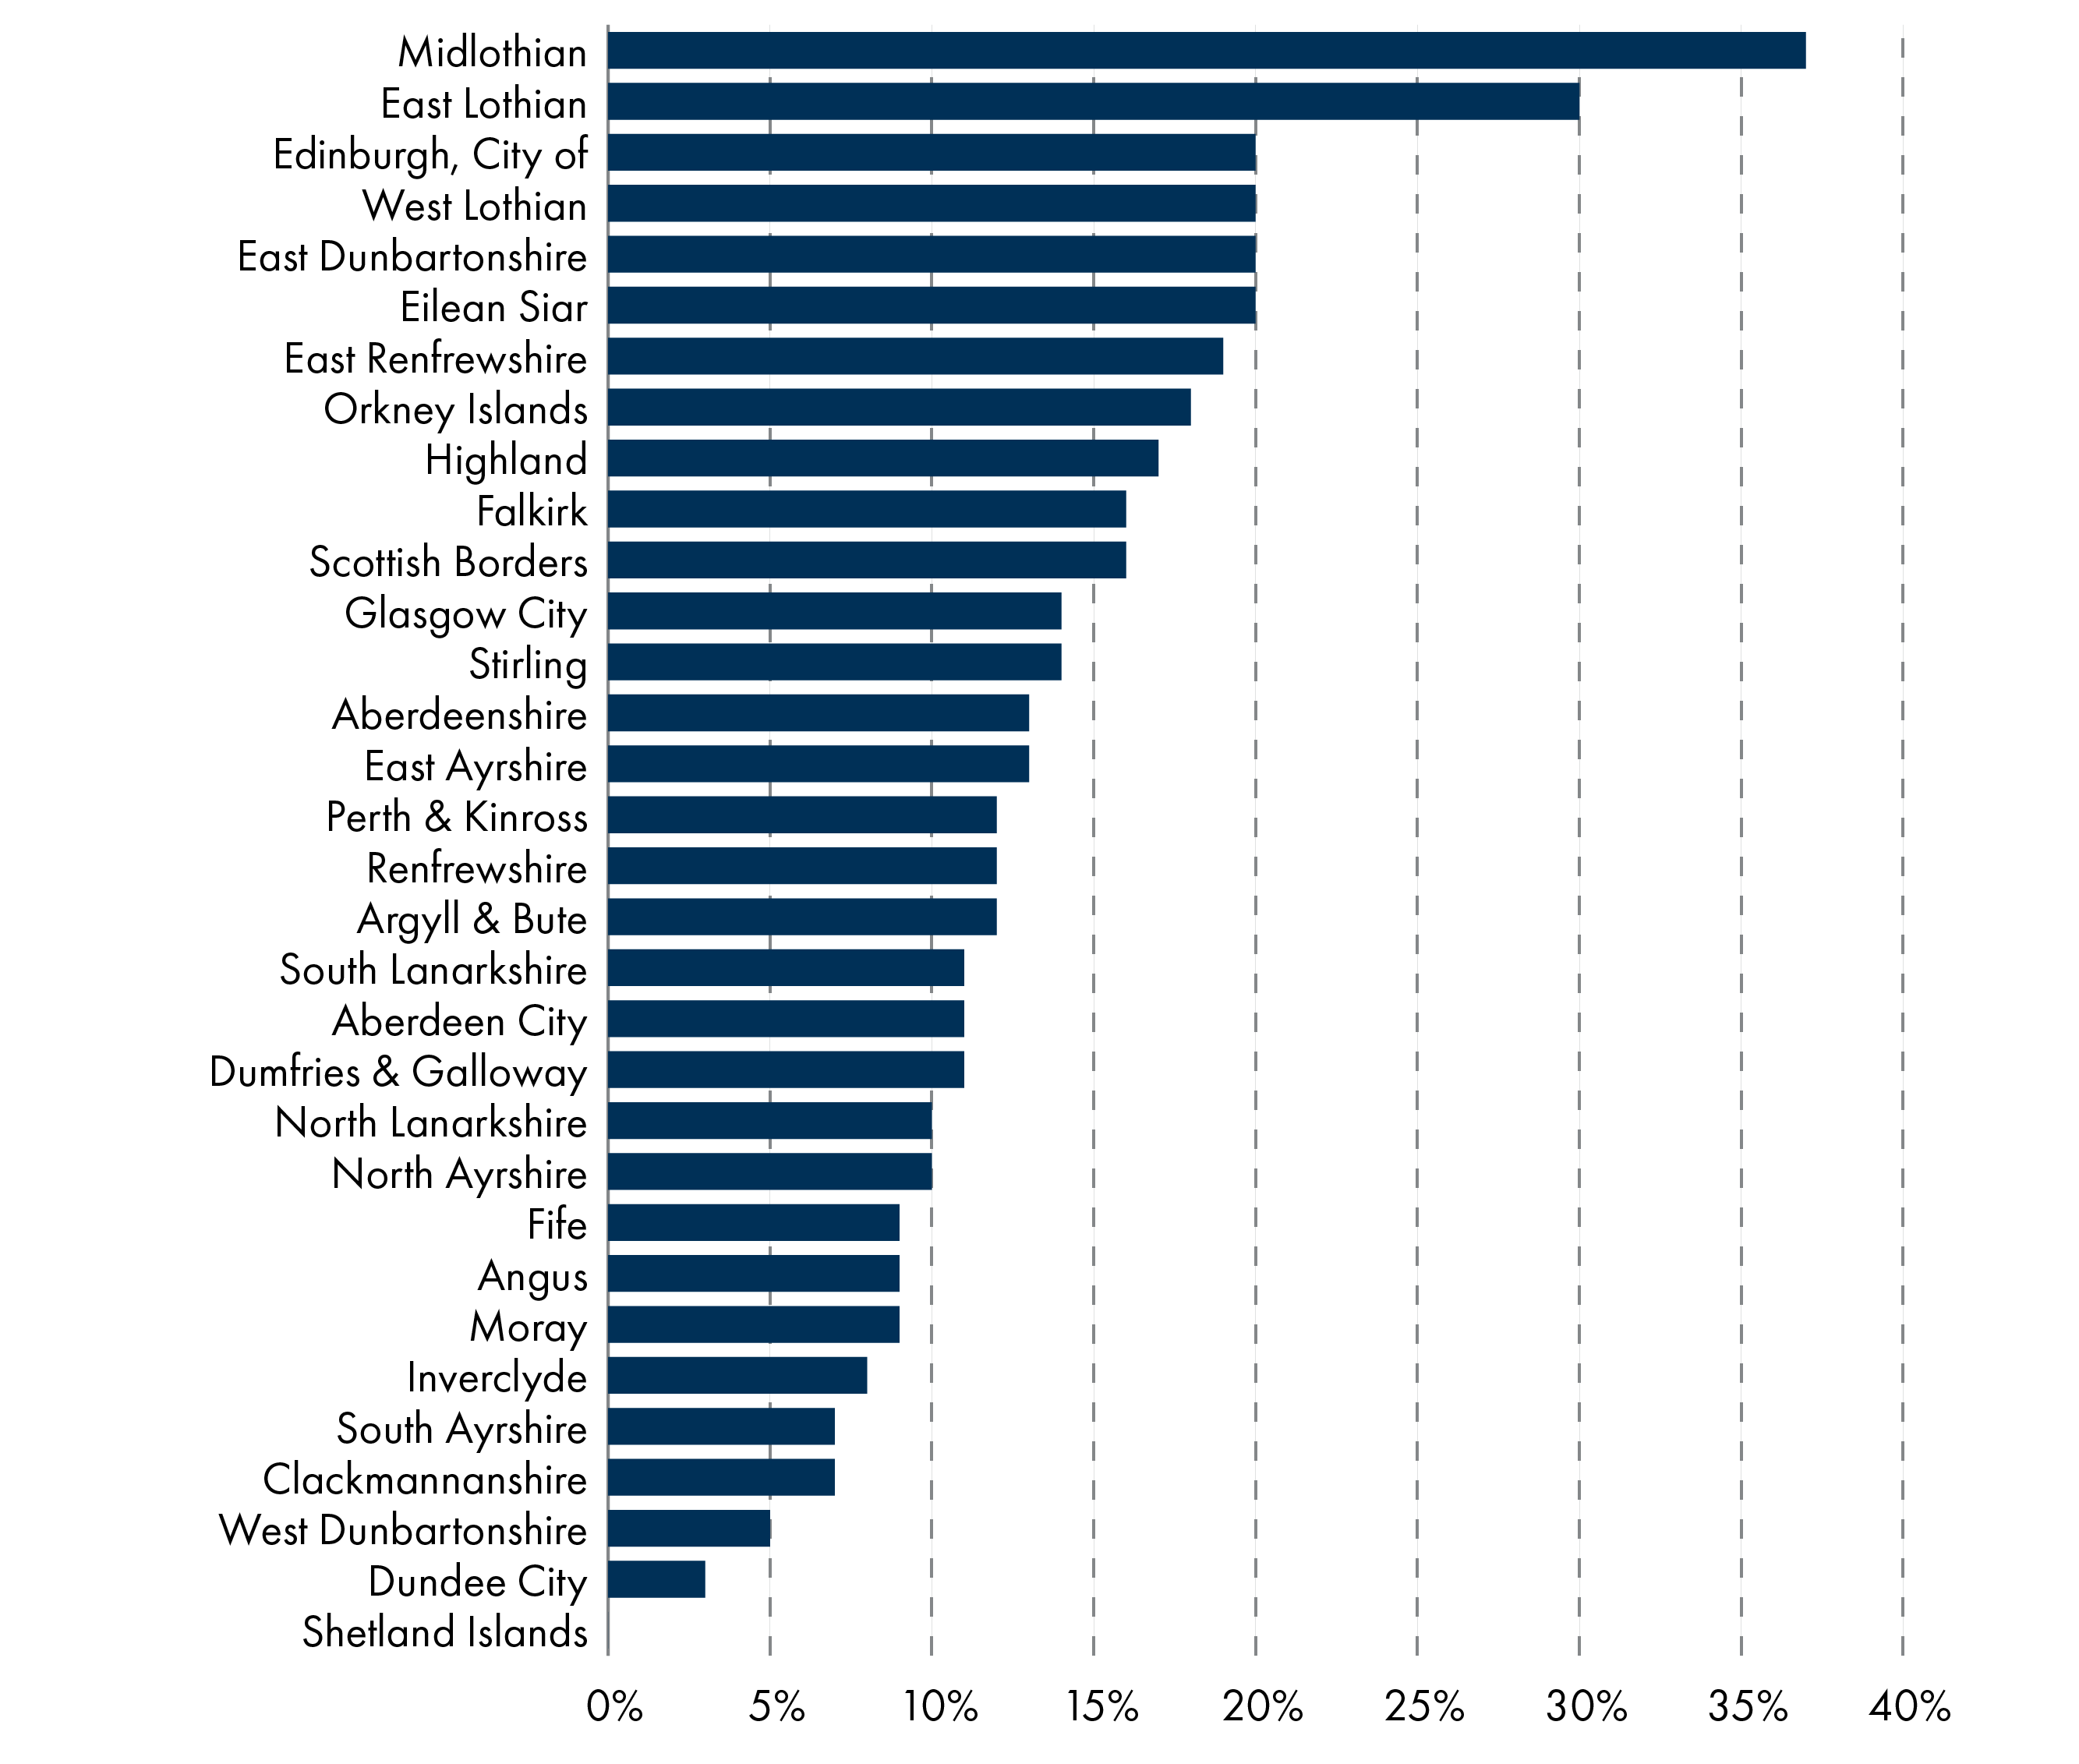
Income from council tax has increased (in real terms) for every local authority in Scotland except Shetland Islands Council. Chart 17 shows that there has been a big variation in the size of this increase across the country, with the Lothians and Edinburgh seeing the most significant increases in percentage terms. Scotland's two largest cities, plus Highland Council, have seen the largest increases in monetary terms, with Edinburgh City Council receiving £56 million more council tax revenue in 2024-25 than in 2013-14 (again, in real terms).
Scottish Government, Provisional Outturn and Budget Estimates (2024))Scottish Government. (2024, June 25). Local Government 2023-24 Provisional Outturn and 2024-25 Budget Estimates. Retrieved from https://www.gov.scot/publications/local-government-2023-24-provisional-outturn-and-2024-25-budget-estimates/documents/
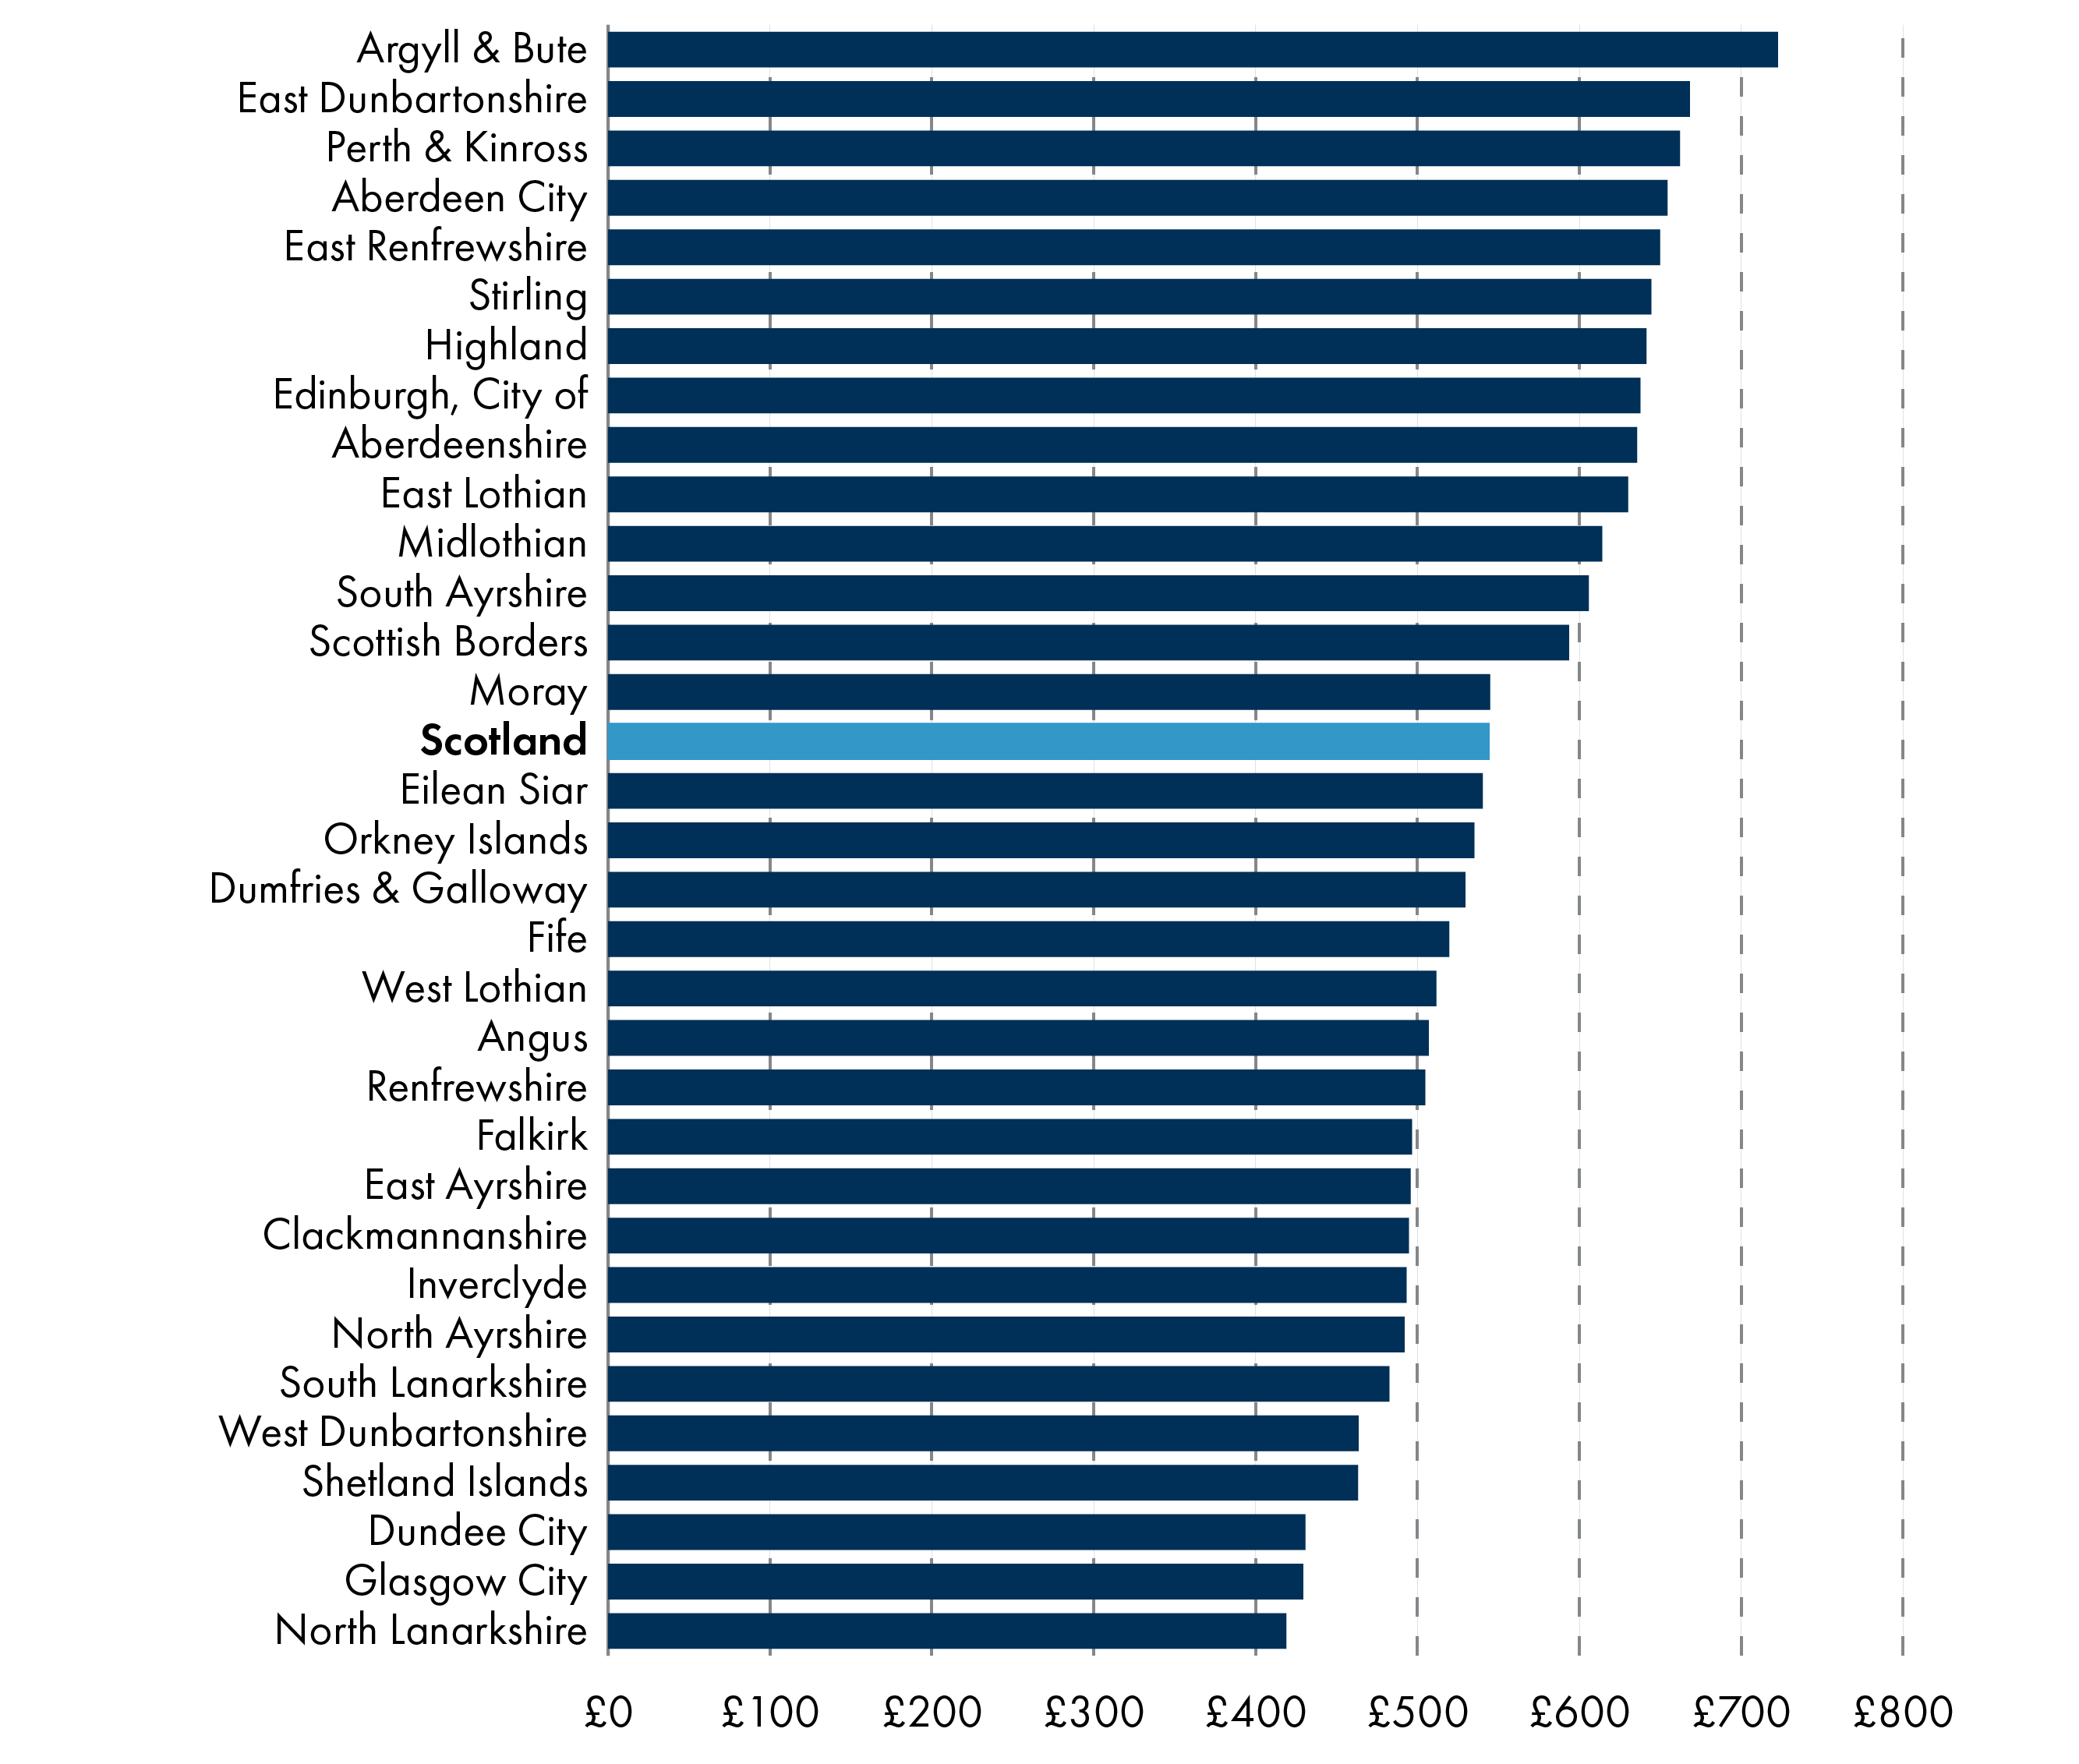
When council tax income in 2024-25 is presented as a per head calculation, we can see significant variation, with Argyll and Bute the local authority with the highest level of council tax income per head (£723) and North Lanarkshire with the lowest (£419).
Scottish Government, Provisional Outturn and Budget Estimates (2024) and mid-year population estimates
The announcement of a planned council tax freeze by former First Minister Humza Yousaf in October 2023 came as a big surprise to almost everyone, including COSLA. Regardless of the politics of the move, particularly in light of the recently signed Verity House Agreement, there was also considerable disagreement about what constituted a "fully-funded" freeze and the impact this year's freeze would have on future years. Shortly after the FM's announcement, the Deputy First Minister told Parliament:
Let me be clear that the Government will fully fund the council tax freeze. This year, in 2023-24, councils set their average council tax increases below the level of inflation. The OBR projection for inflation in the coming year based on the consumer prices index is 3 per cent. Of course, I could fund an inflation-proof 3 per cent council tax freeze, but I want to help support services, so I will go further than that. I will fund an above-inflation 5 per cent council tax freeze, delivering more than £140 million of additional investment for local services.
In its response to the Scottish Budget, COSLA argued that a fully-funded freeze would require the Scottish Government to provide funding of up to £300 million, £156 million more than the £144 million included in the Budget for this purpose. Furthermore, the Accounts Commission summarised the situation:
Most councils were proposing to increase their budgets by raising council tax rates for 2024/25 but in October 2023 the Scottish Government announced a council tax freeze. Although the Scottish Budget included £144 million to ‘fully fund’ a five per cent increase in council tax, and an additional £63 million was offered in February 2024, 11 councils said the funding provided would not ‘fully fund’ the freeze.
The Commission also highlighted some longer-term implications for councils because "future increases to council tax will start from a reduced position, with the freeze effectively suppressing the growth of the council tax base".
Non-domestic rates (NDR) income
Collected by councils, Non-Domestic Rates (NDR) income is pooled nationally and redistributed among Scottish local authorities as part of the overall local government settlement. The Scottish Government guarantees the combined General Resource Grant (GRG) and distributable NDR income figure to each local authority. If NDR income is lower than forecasted then GRG is increased accordingly, and vice versa.
Non Domestic Rates are often referred to as "business rates". However, it's not just businesses who pay them. Public buildings, such as schools and council offices may also be liable. There are various non-domestic rates reliefs available, and eligible ratepayers can apply for these through their local council.
Since 1989 councils have had no role in the setting of non-domestic rates. Instead, "rate poundage" is decided by the Scottish Government each year and approved by the Scottish Parliament as part of the Scottish budget process. It is therefore difficult to argue that NDR is a local tax.
The amount to be paid by property occupants is determined by both the national rate poundage and the rateable value of the property. The latter corresponds to the "notional rental value the property could achieve in the open market, if it were vacant and available to let, taking account of the type and nature of the property"1.
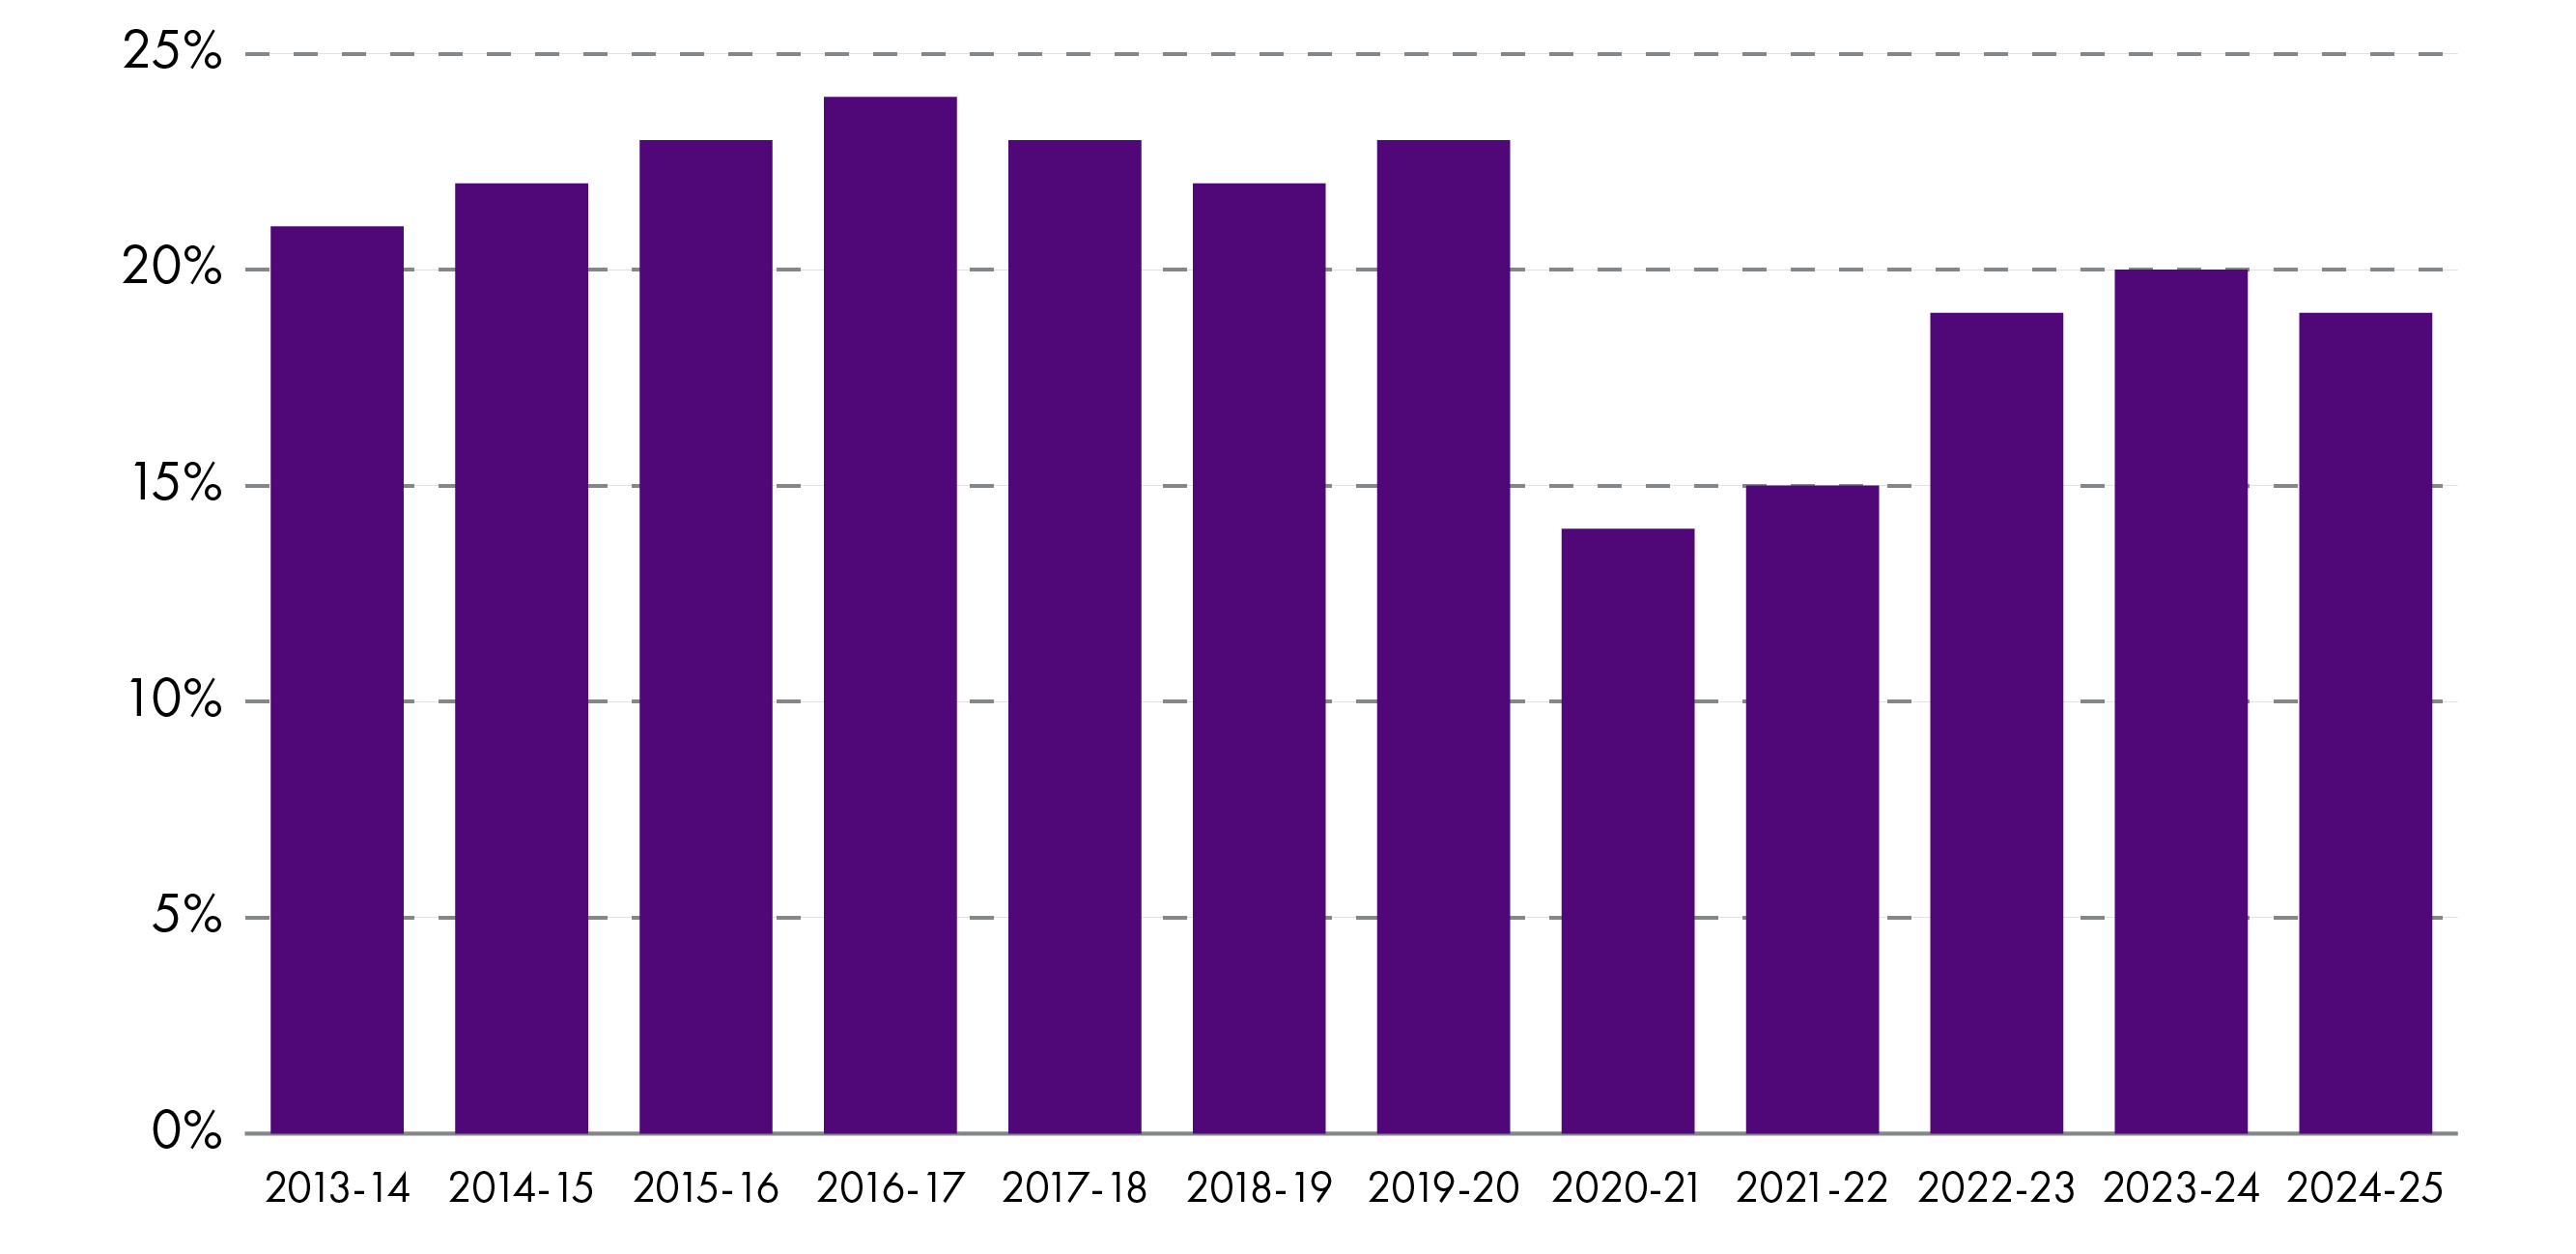
It is estimated that Scotland's local authorities will raise £3.1 billion in NDR income in 2024-252. This amounts to 19% of local government's total general revenue funding (GRG+NDR+CT income). Figure 19 shows how this has changed over the past twelve years, with NDR income as a proportion of total general funding smaller now (19%) than it was in 2013-14 (21%)3.
Scottish Government, Provisional Outturn and Budget Estimates
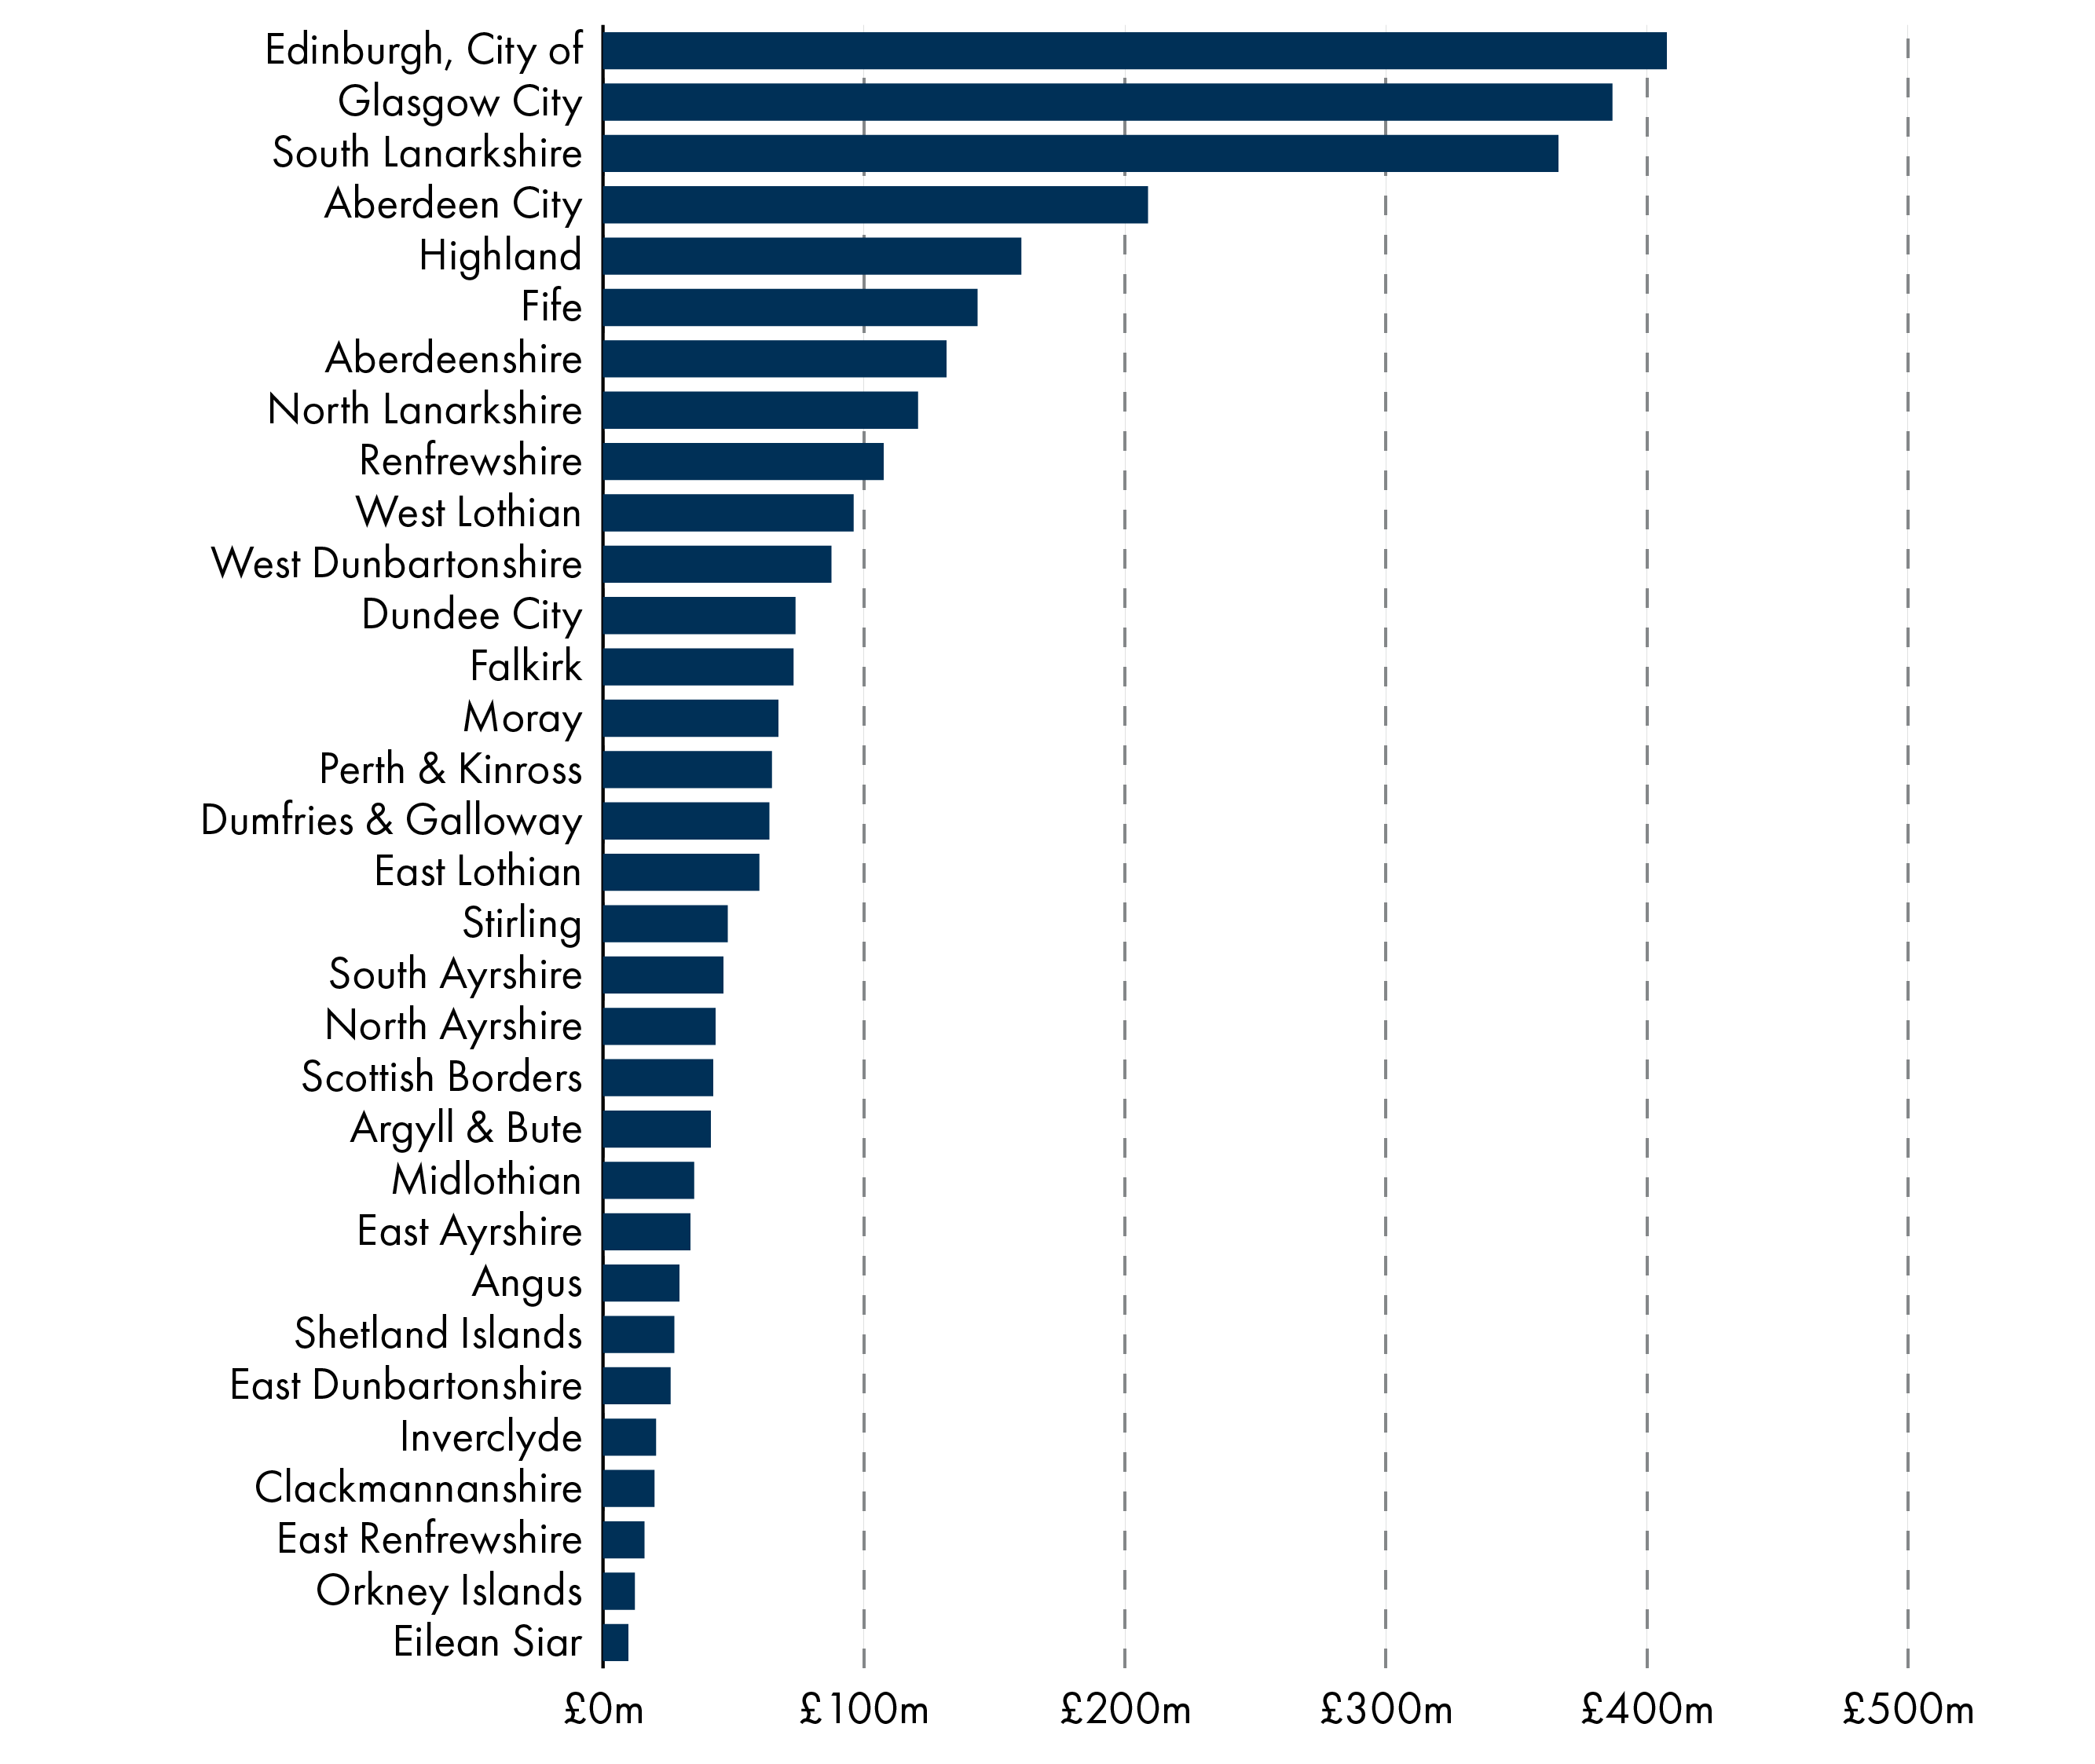
Like council tax revenues, NDR income varies across our 32 local authorities. Unsurprisingly, our two largest cities see the highest levels of NDR income in 2024-25 in monetary terms. Those local authorities seeing the smallest NDR revenues are Eilean Siar and Orkney Islands.
Scottish Government, Provisional Outturn and Budget Estimates
Presenting these figures as per head calculations reveals some interesting results. Figure 21 shows that the local authorities with the highest NDR income per head of population are Shetland Islands and South Lanarkshire. The two local authorities with the lowest levels are East Renfrewshire and East Dunbartonshire.
Scottish Government, Provisional Outturn and Budget Estimates and mid-year population estimates
One of the reasons South Lanarkshire's NDR income is so high is because the authority is the designated assessor for renewable electricity generation. This means that many of the large renewable generators have generation and transmission assets/properties valued by South Lanarkshire and their liability therefore sits with South Lanarkshire (even though the assets may not be in South Lanarkshire).
Local government expenditure - what do councils spend their money on
So far, this briefing has focussed on how local government is funded and how this varies across the country and over the past twelve years. We now look at what councils spend their money on and what outcomes are achieved. Around 20% of all public sector spending in Scotland is spent by local authorities, second only to the NHS1. This is because local authorities in Scotland are responsible for delivering a large range of services; however, we will see that the majority of spend is used to fund just two (extremely important) service areas.
When it comes to measuring performance and outcomes, the Improvement Service collates and publishes the Local Government Benchmarking Framework2 with indicators selected by the sector itself to determine whether performance is improving or not across a large range of services. The Accounts Commission also has an important role to play in assessing whether councils are achieving "best value" when it comes to spending public money. Therefore, more than 13 years after the publication of the "ambitious and visionary"3 Christie Commission report, politicians and their electorates have a wealth of information to assess whether local authorities are achieving Christie's aspirations of improving performance and reducing costs4.
Expenditure by service
The Scottish Government publishes extensive information on local authority expenditure12. These sources provide an insight into the spending priorities of local government, and it is clear that school education and social work/social care are at the top of that list. Of the total net revenue expenditure of £15 billion in 2024-25, around half (£7.4 billion) will be spent on education services and a further 31% will go to social work services (including social care). This means that around 80% of local government net revenue expenditure will go on funding these two service areas.
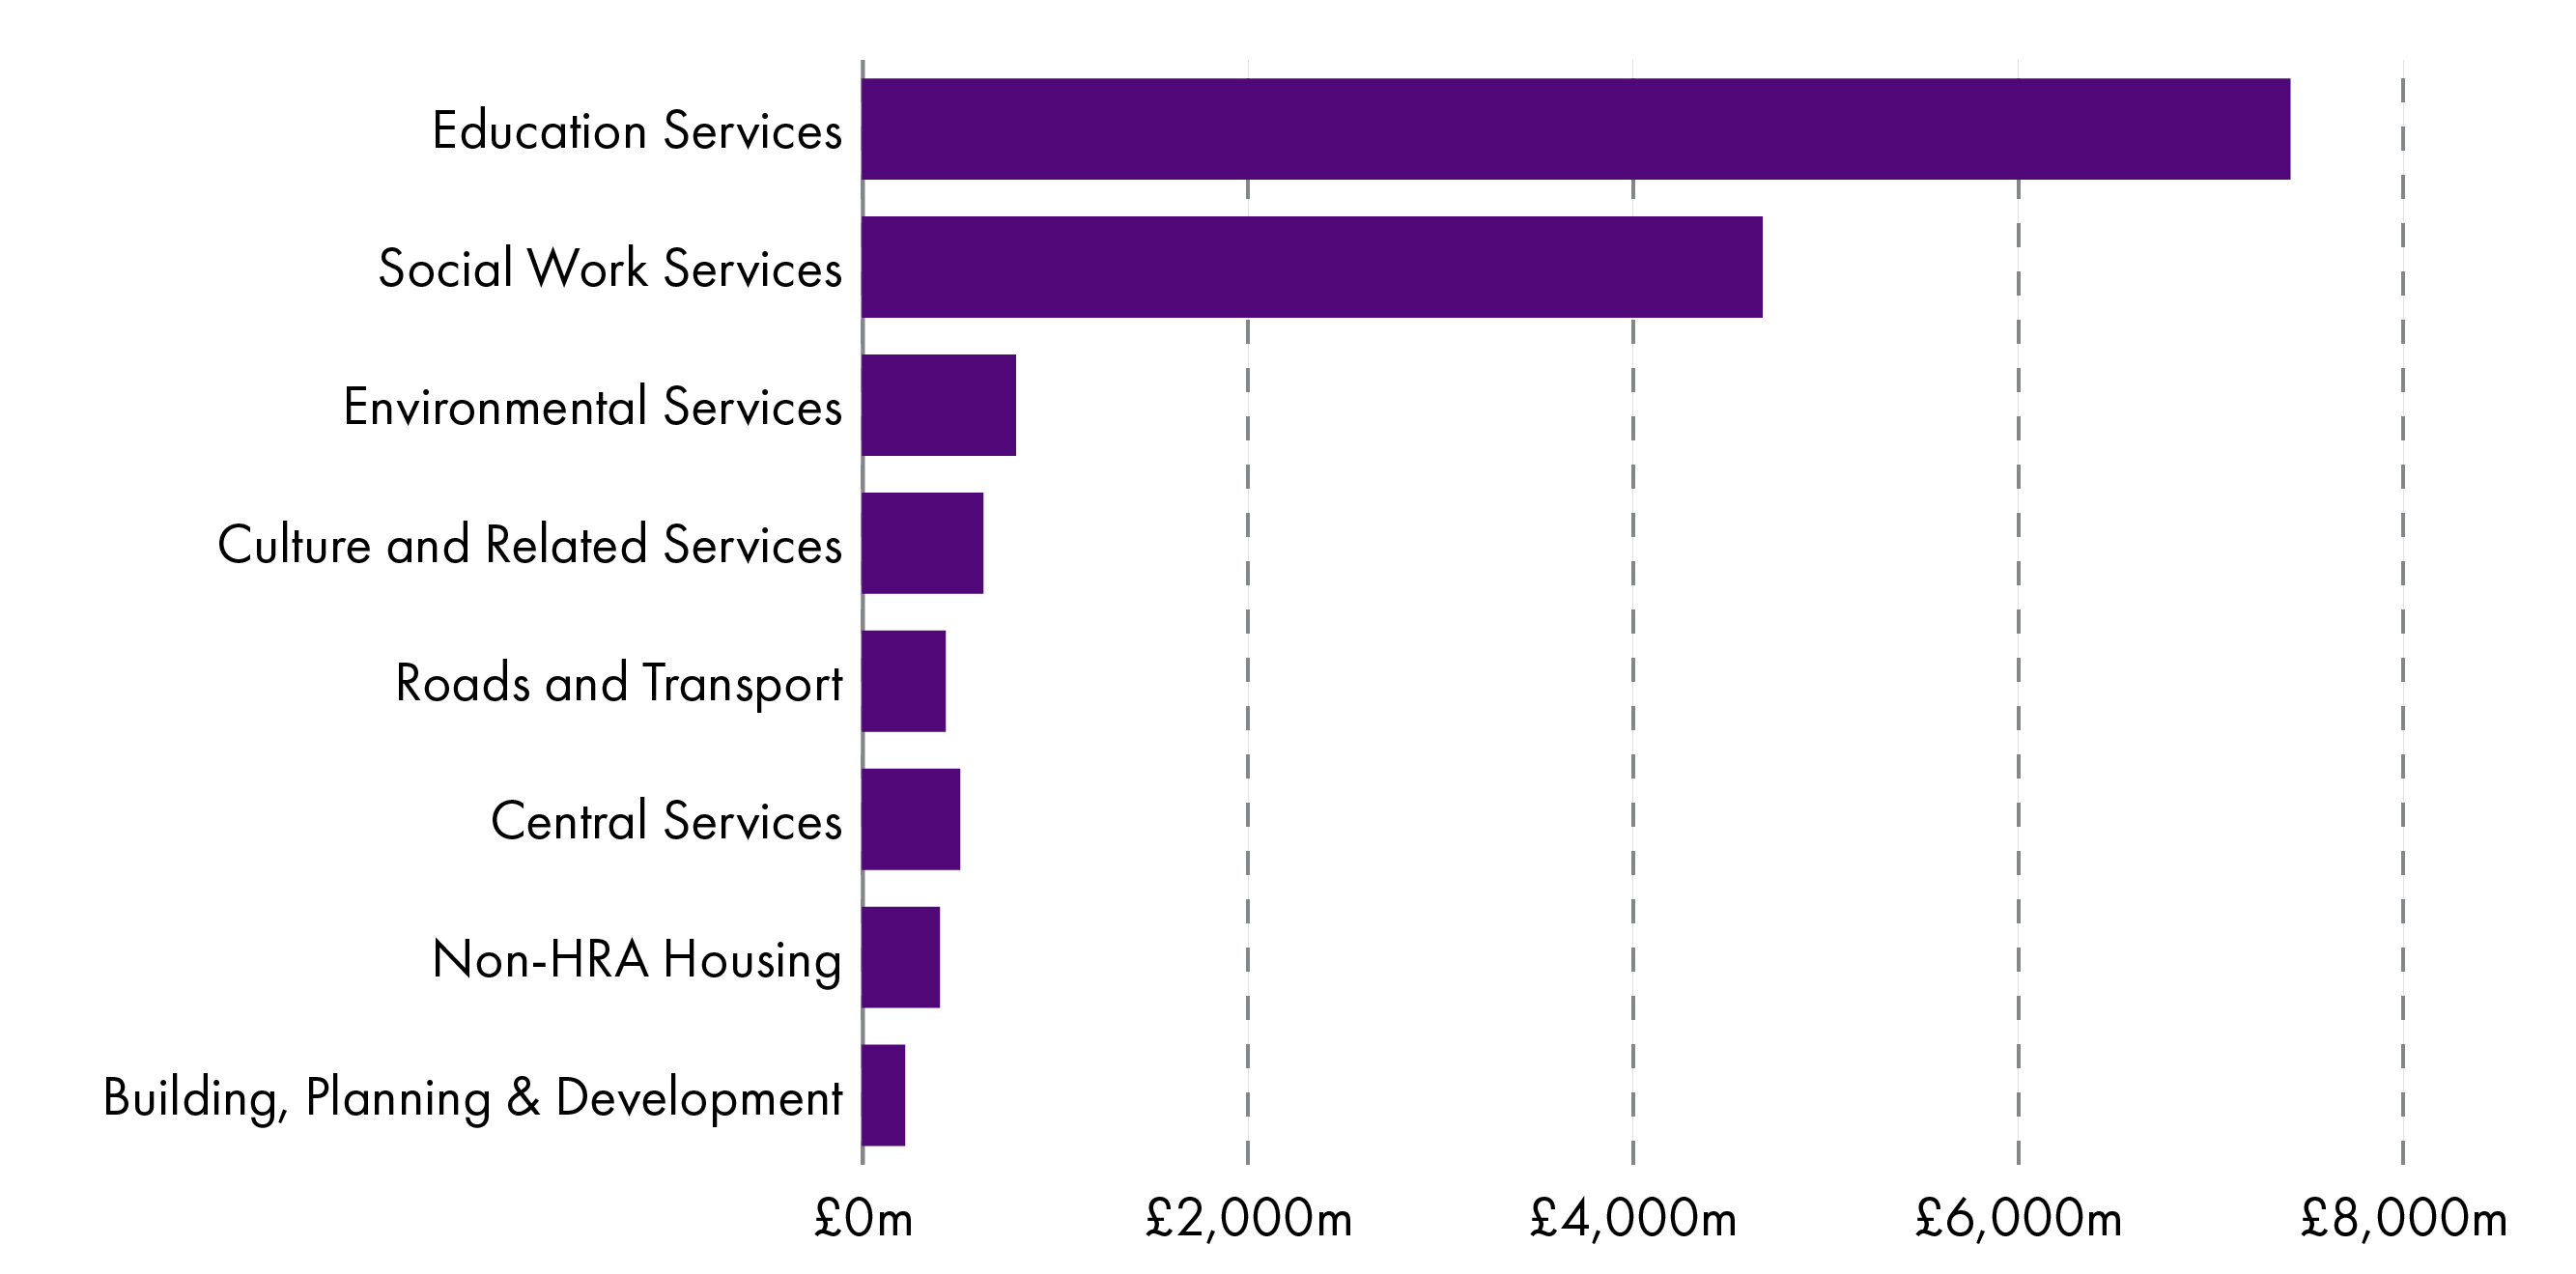
Scottish Government, Provisional Outturn and Budget Estimates
Overall, there have been significant real terms increases in the amount of money councils spend on education and social care over the 12 years between 2013-14 and 2024-25. Figure 23 (below) shows that it is only these two service areas which have seen such increases. Every other service area, from environmental services to planning, have seen significant real terms reductions over the period. The latter, for example, saw a 43% real terms reduction. Last year, the Accounts Commission concluded3:
Over the last decade, there is a clear divergent pattern of spend. Spending on children’s services (education and looked after children) and adult social care has been protected and increased because of national policy directives. This means that the remaining ‘unprotected’ services have borne a disproportionate level of spending reductions
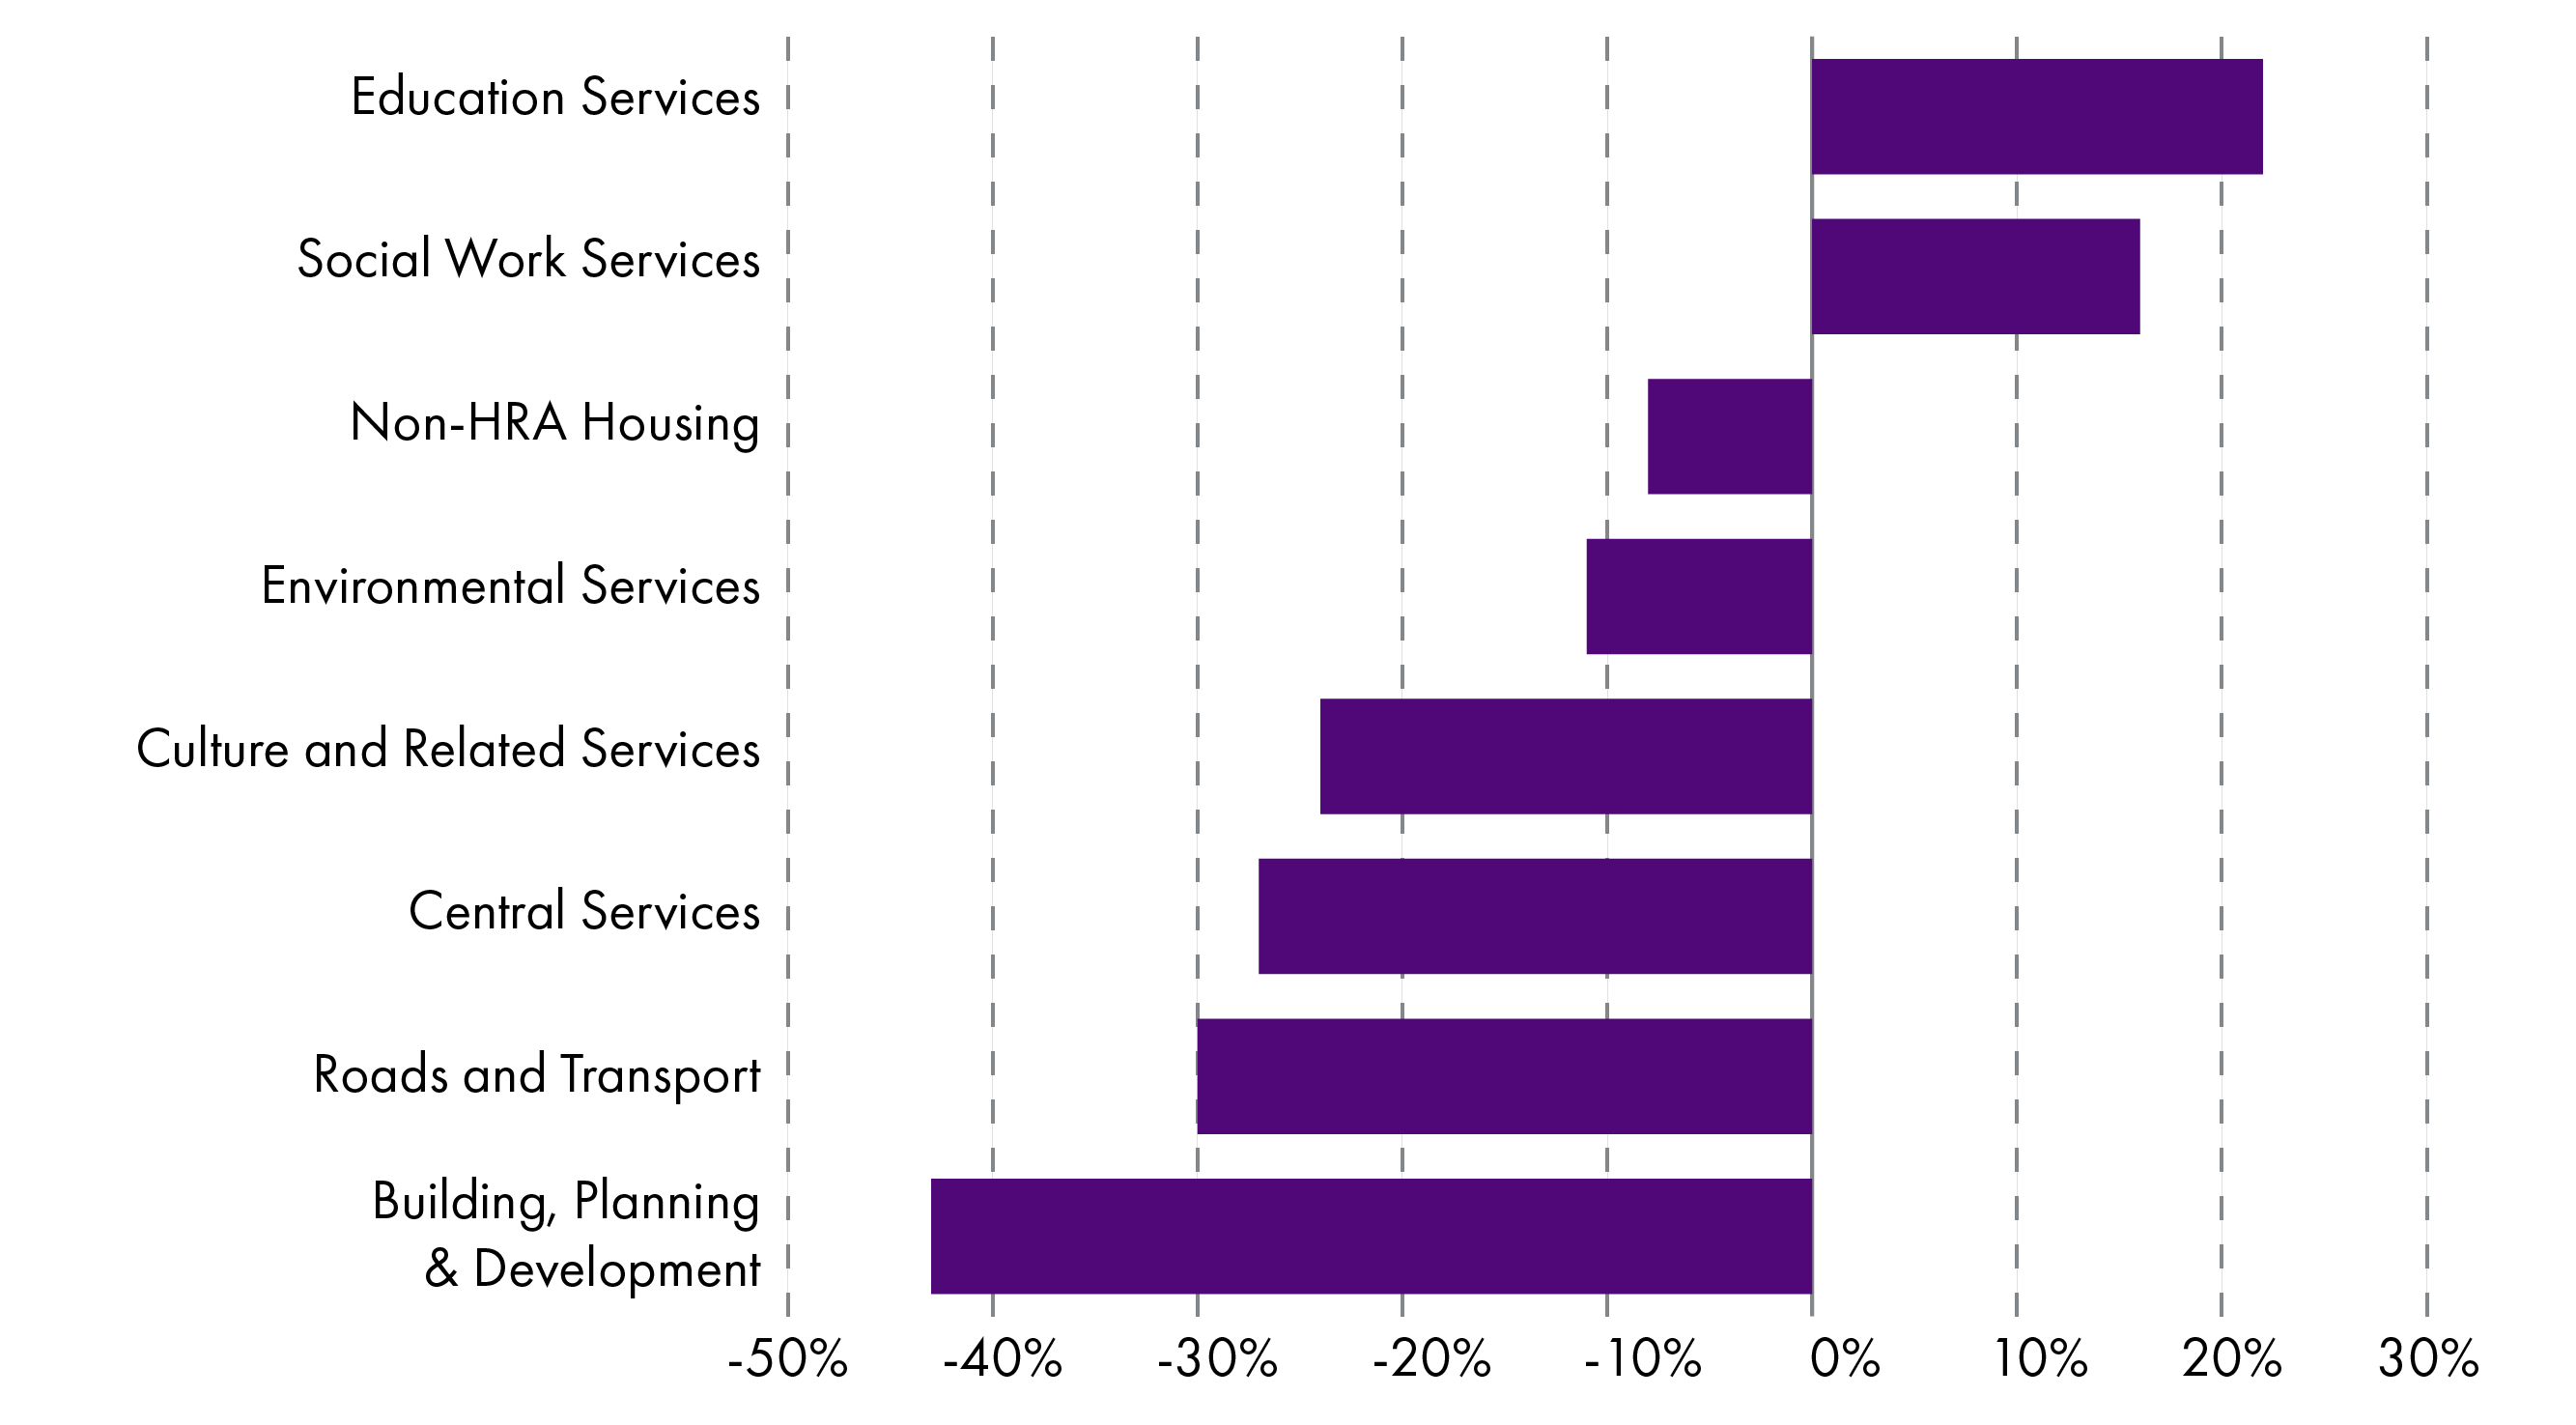
Scottish Government, Provisional Outturn and Budget Estimates 2013 and 2024
These overall figures for Scotland mask considerable variations at individual local authority level. Comparing Provisional Outturn and Budget Estimate figures for 2013-14 and 2024-25 we see that some local authorities actually increased spending in a particular service area where most other local authorities decided to reduce spending. Even in the "national priority" area of education, two local authorities saw real terms reductions in spending over the period. Likewise, Glasgow and Aberdeen both reduced spending on social work, albeit slightly, between 2013-14 and 2024-25.
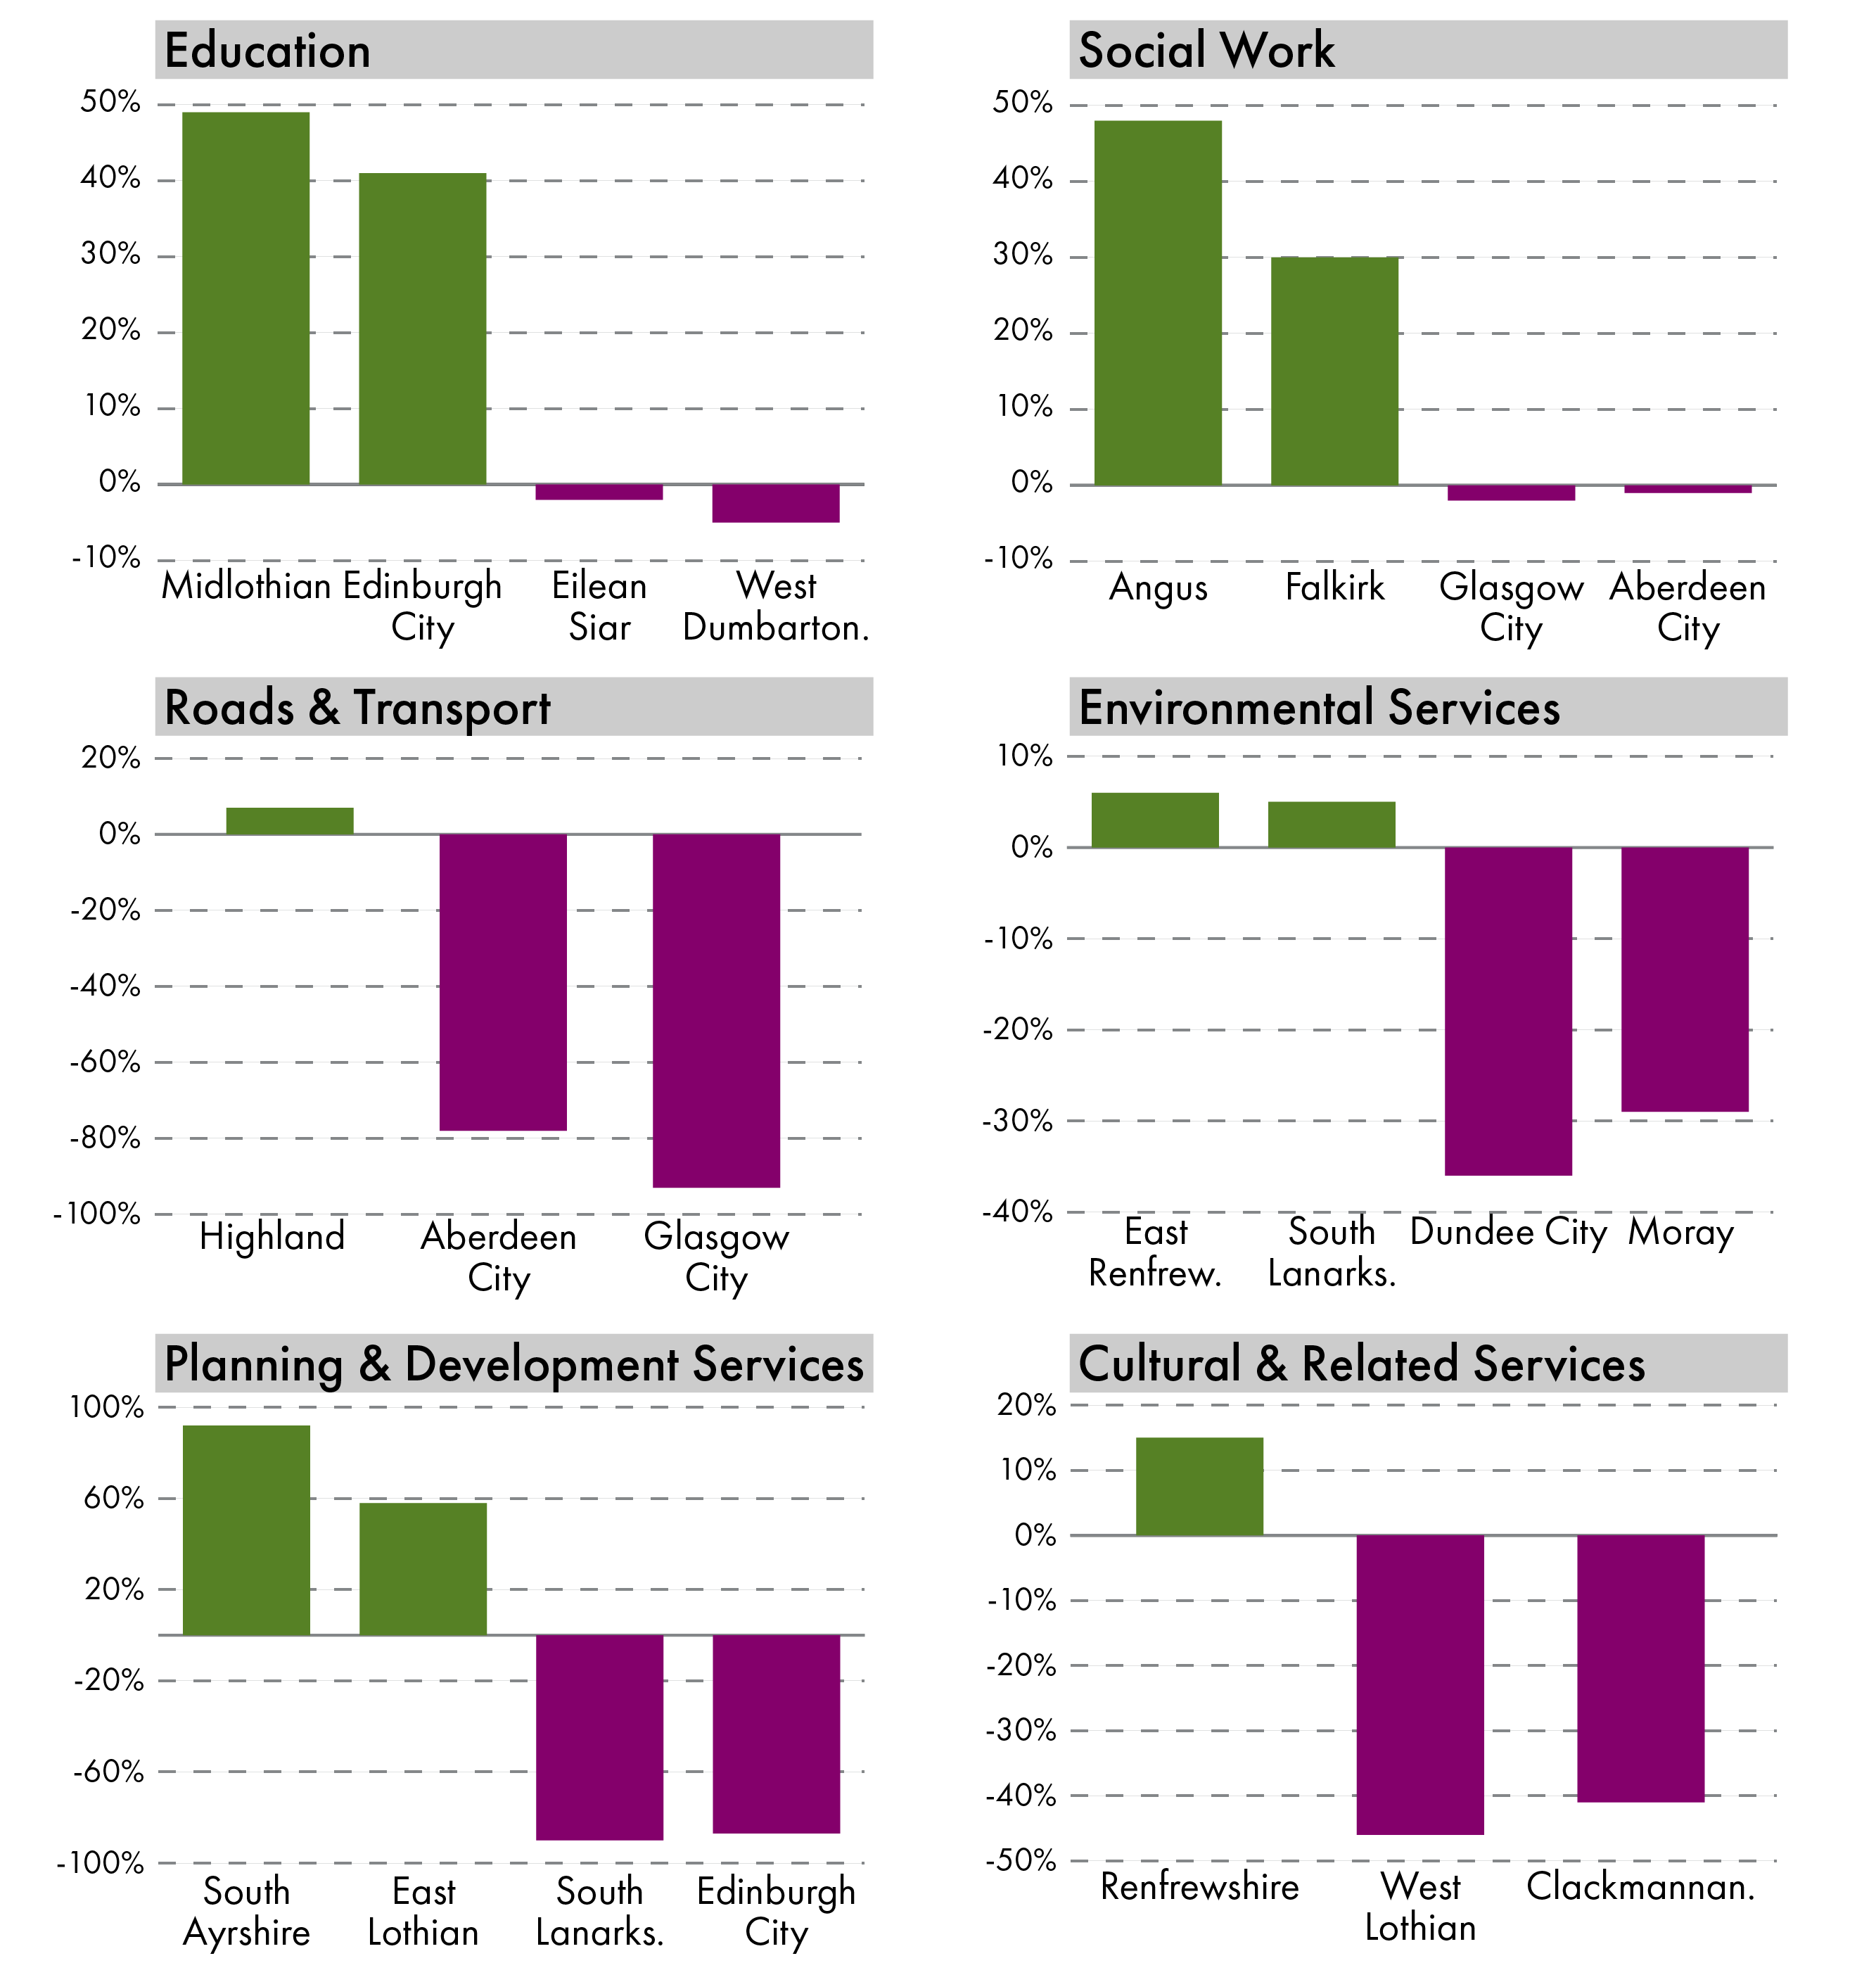
Scottish Government, Provisional Outturn and Budget Estimates 2013 and 2024
These are examples of exceptions, though, and the overall trends are indisputable. The vast majority of councils increased spending on education and social care over the past 10 years whilst reducing spending in most other areas. These examples are included here to show that individual local authorities appear to have some flexibility to diverge from national trends, despite the need to deliver against some national policy directives, and the picture is a bit more nuanced than Figure 23 would suggest.
Employment costs
Local government is by far the largest public sector employer in Scotland1, with recent figures showing that 262,000 people worked for local authorities in early 2024. That means 1 in 10 working people in Scotland are currently employed by a local authority. This shouldn't be a huge surprise considering the range of services provided by councils: education, adult social care, social work, environmental services, waste management and planning, to name but a few.
According to COSLA, between 60% and 70% of local authority budgets are used to pay for workforce costs2. And the Scottish Government's Local Government Finance Statistics for 2022-23 show that employee costs accounted for £9.3 billion that year. This paid for "salaries and wages, national insurance and superannuation contributions, cash allowances paid to employees, redundancy and severance payments and any other costs relating to employees"3. This area of spending has grown by 22% in real terms between 2013-14 and 2022-23:
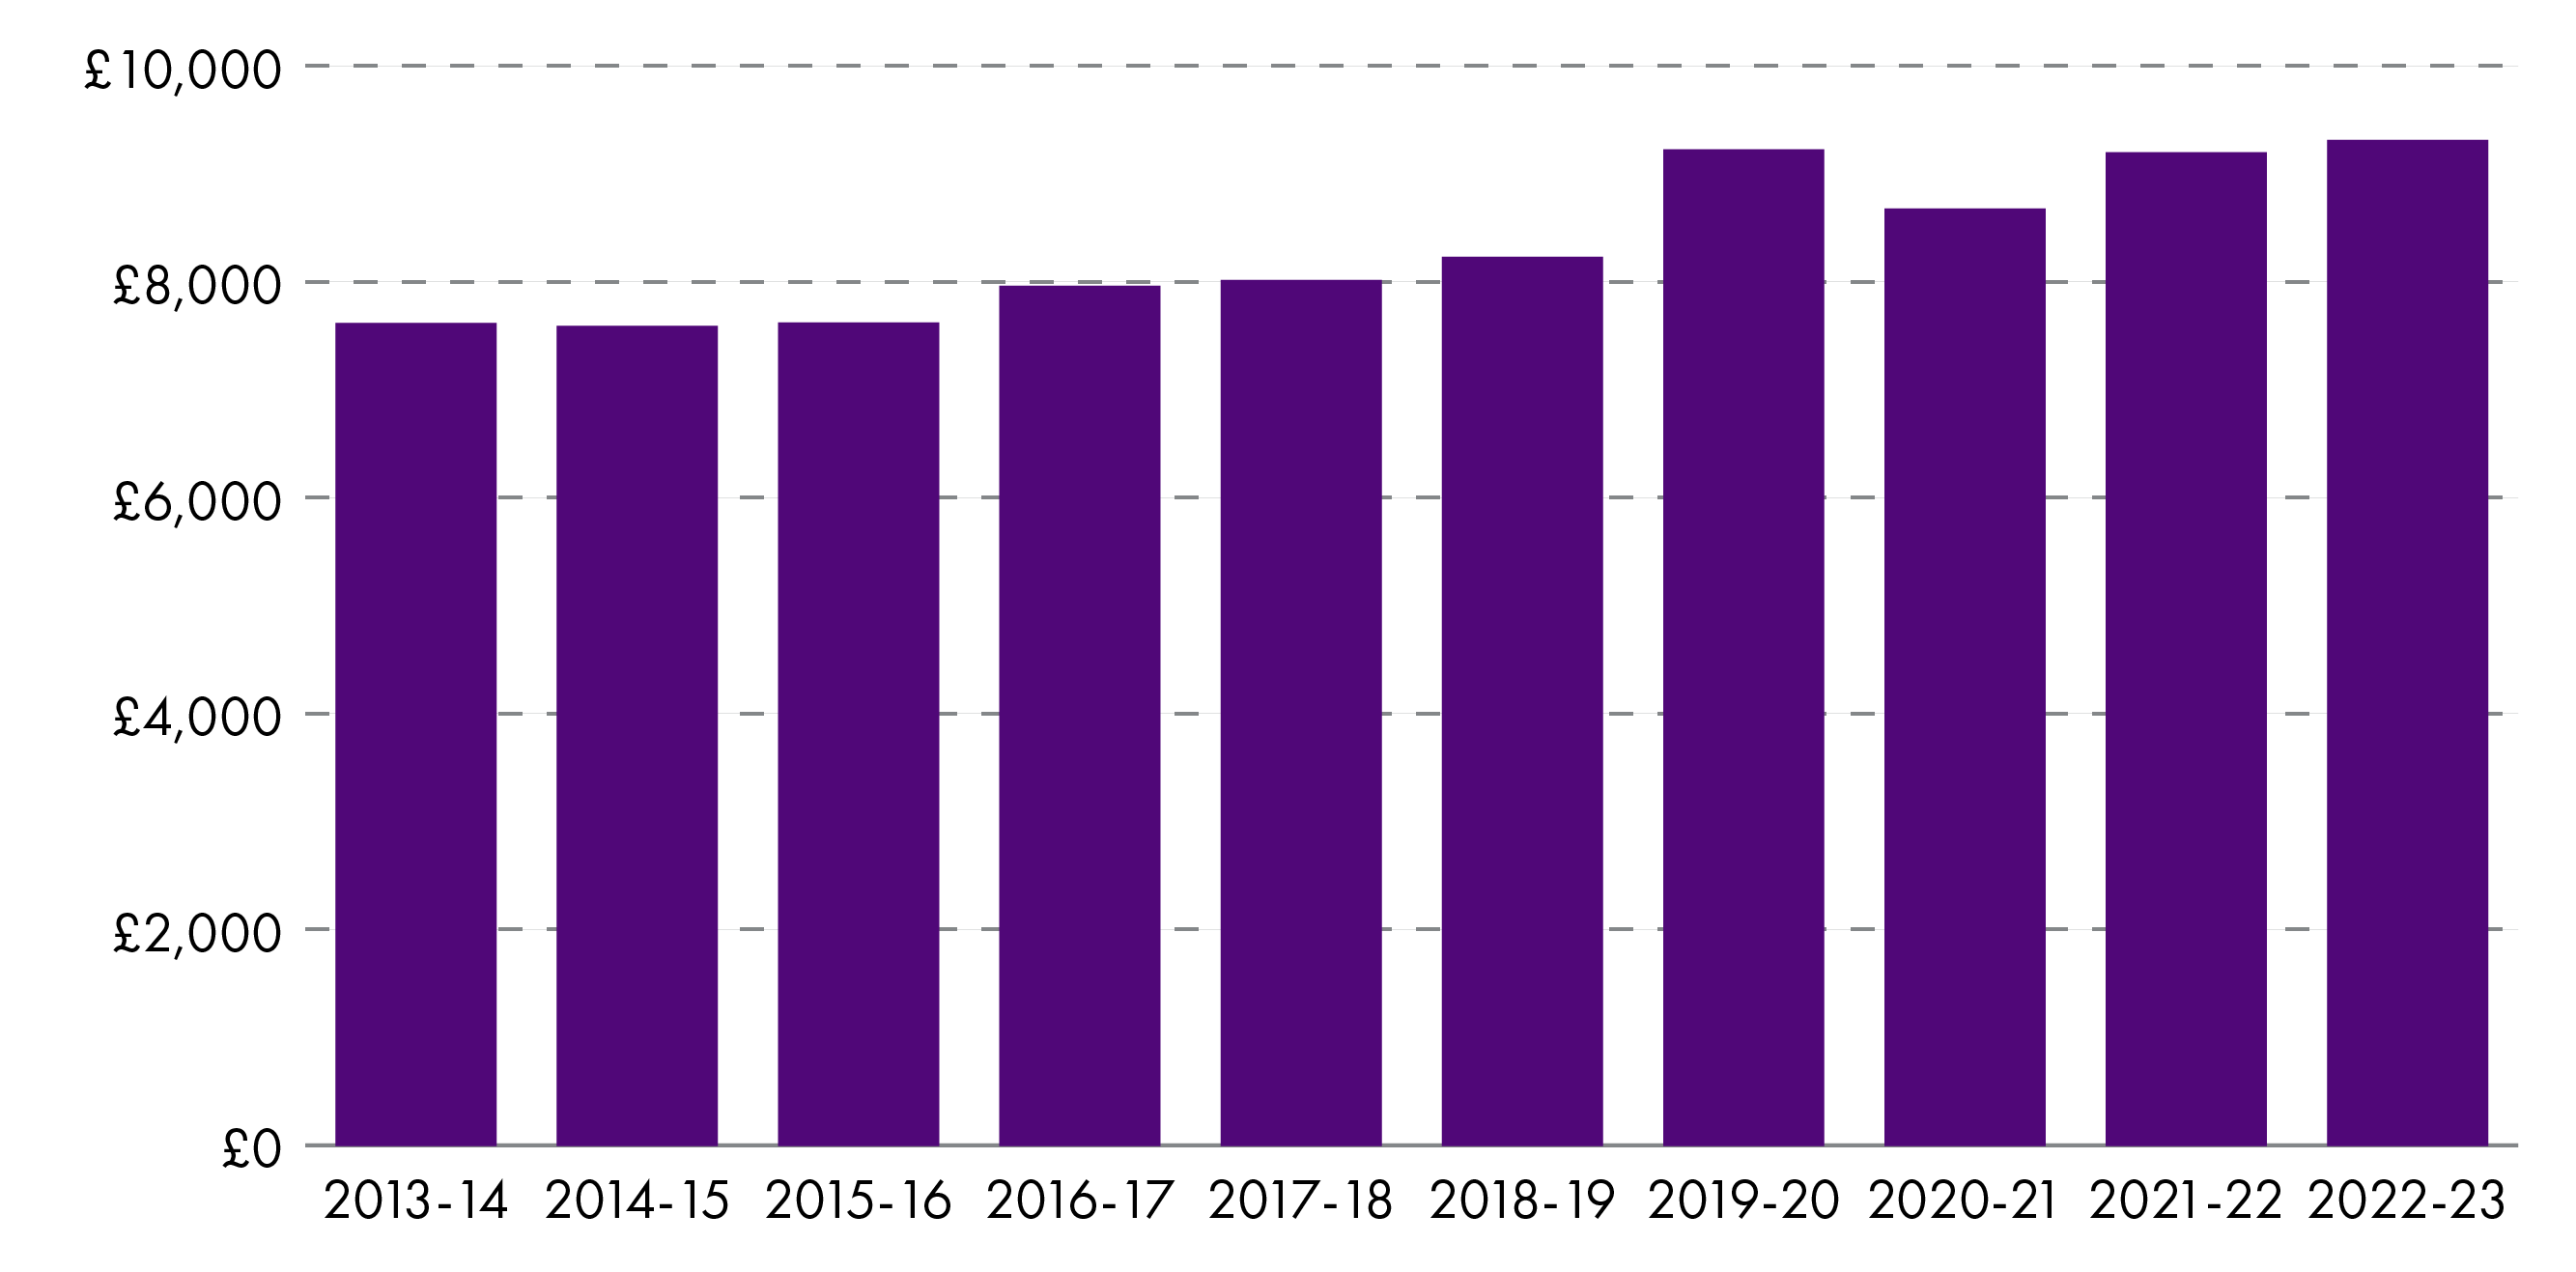
Scottish Government Local Government Finance StatisticsScottish Government. (2024, March). Local Government Finance Statistics 2022-23. Retrieved from https://www.gov.scot/publications/scottish-local-government-finance-statistics-2022-23/documents/
The Scottish Government publishes public sector employment statistics every quarter5 and these are available going back a number of years. Looking back to 2014, we can see that 248,000 people worked for local government, or 203,000 full-time equivalents. This had risen to 262,000 employees, or 216,000 full-time equivalents (FTE) in 2023. An FTE post is adjusted to reflect hours worked. For example, someone working 4 days a week would be counted as 0.8 FTE. Some of the increase in local government employment may be explained by the bringing back in-house of people formerly employed by arms length organisations (ALEOs), a point raised by Glasgow City Council's Director of Finance earlier this year. He also mentioned the increases in headcount arising from the expansion of childcare and free school meals.
As illustrated in Figure 25 (above), employee costs in 2013-14 were £7.6 billion (in 2022-23 prices), increasing to £9.3 billion in 2022-23. Therefore, cost per FTE in 2013-14 was £37,400 (in 2022-23 prices) and this had risen to £43,000 in 2022-23, a 16% real terms increase.
Total employee costs by service area show that the biggest percentage increase has been in education, a 30% real terms increase when comparing 2013-14 and 2022-23, as illustrated in Table 3 (below).
| Service | 2013-14 | 2022-23 | Change (%) |
| Education | 4,043 | 5,258 | +30% |
| Non-HRA Housing | 130 | 166 | +28% |
| Environmental Services | 363 | 436 | +20% |
| HRA | 166 | 196 | +19% |
| Social Work | 1,591 | 1,864 | +17% |
| Roads & Transport | 240 | 270 | +13% |
| Culture & Related Services | 273 | 287 | +5% |
| Other | 806 | 828 | +3% |
Despite the overall increase in local government employment and its associated costs, a recent report published by the Society of Local Authority Chief Executives and Senior Managers (SOLACE), the Improvement Service and the Society of Personnel and Development Scotland found that councils "are facing significant challenges in maintaining and developing workforce capacity across a number of key professional roles"6. Reasons include financial pressures, an ageing workforce, increased service demand, recruitment difficulties, differing population changes across the country, skills gaps and pay competition from other sectors are all contributing factors. Social care and social work are seeing particular problems. Councils are also struggling to recruit enough trading standards officers, planners and environmental health officers.
Capital expenditure
It is expected that total local government capital expenditure will amount to £5.2 billion in 2024-251. This is a large increase on the previous year, despite the considerable reduction seen in capital grants. Table 4 (below) shows that total capital expenditure is significantly higher this year than in any of the past six years (with previous years' sums put into real terms):
| 2019-20 | 2020-21 | 2021-22 | 2022-23 | 2023-24 | 2024-25 (budget) | |
| Capital expenditure | 4,535 | 2,952 | 3,819 | 4,053 | 3,947 | 5,174 |
Much of this increase in capital expenditure relates to the roll out of the Learning Estate Investment Programme. Table 5 (below) shows that the majority of capital expenditure in 2024-25 will be funded through borrowing.
Every Scottish local authority has a loans fund. These work like internal banks in the sense that the fund borrows externally (e.g. from the Public Works Loans Board) to bring in additional money for capital projects. Money is then “lent” to borrowing departments within the local authority, with the repayment of this borrowing (principal, interest, and expenses) being paid from the General Fund over a number of years.
| Budget estimate (£m) | % of total capital financing | |
| Borrowing from Loans Fund | 3,109 | 60% |
| Other Grants and Contributions | 1,036 | 20% |
| General Capital Grant (GCG) from Scottish Government | 445 | 9% |
| Capital Funded from Revenue Reserves | 291 | 6% |
| Assets acquired under Credit Arrangements | 154 | 3% |
| Capital Fund or Capital Receipts | 138 | 3% |
| Total Financing | 5,174 | 100% |
Chart 26 (below) shows that annual borrowing by councils has increased significantly over recent years. Anticipated borrowing in 2024-25, at 3.1 billion, is more than double what it was in 2013-14 (again, in real terms):
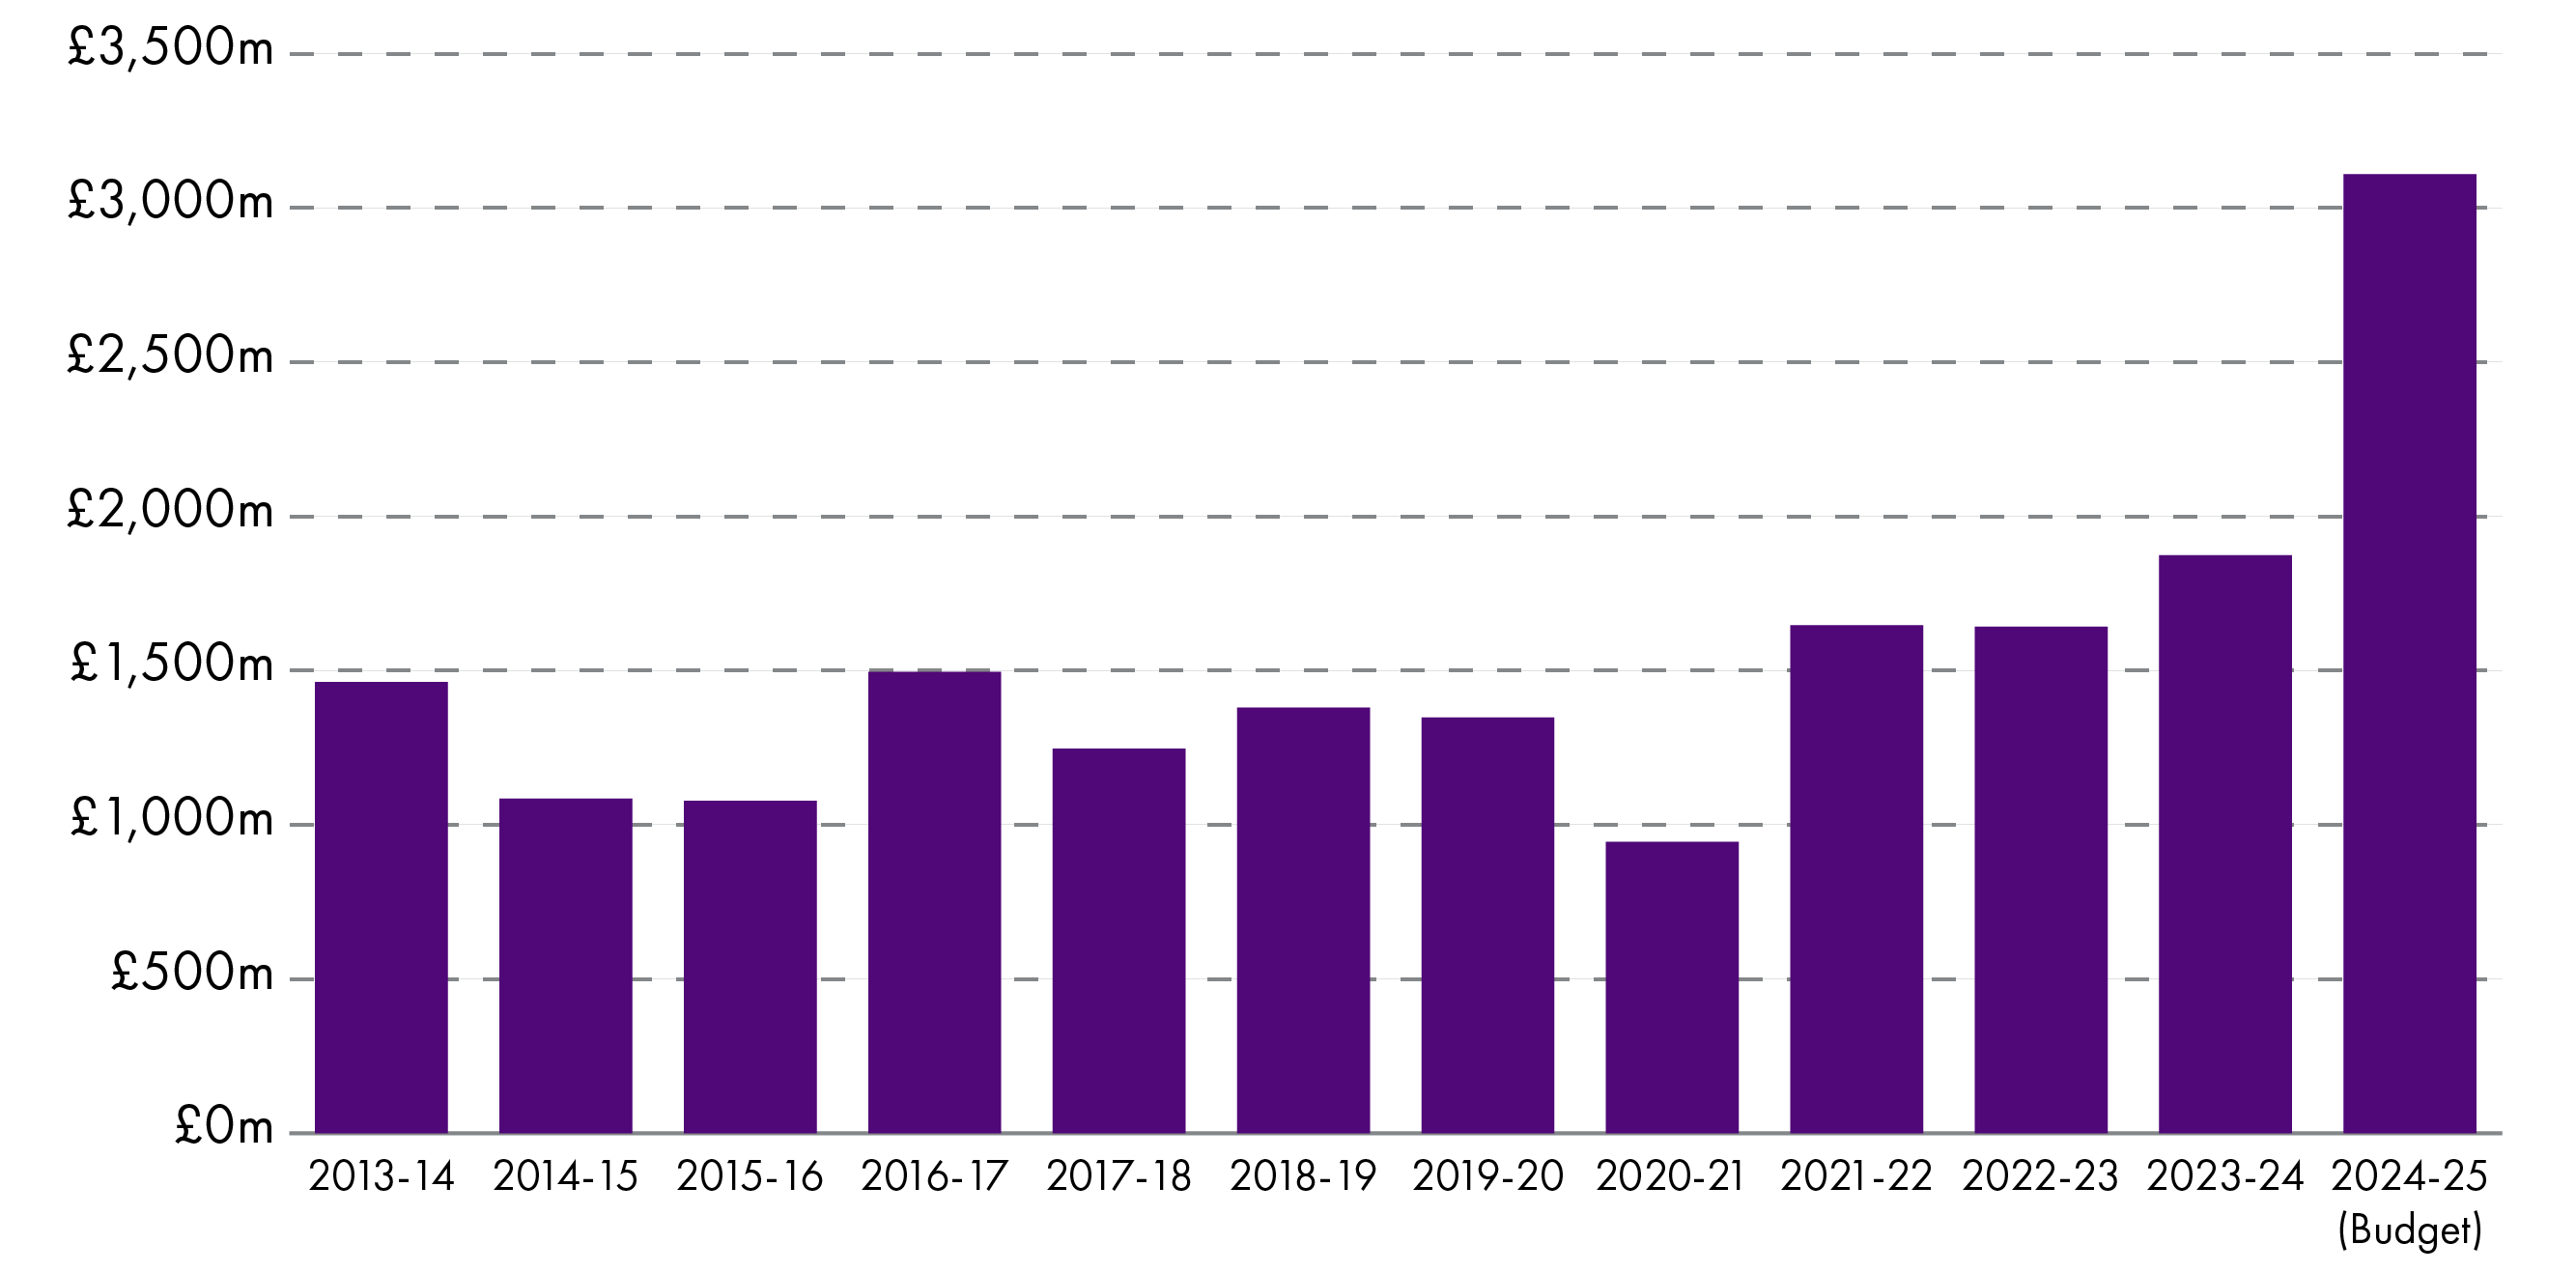
Scottish Government Local Government Finance Statistics: 2013-14 to 2022-23 and Provisional Outturn and Budget Estimates
A large amount of capital spend in 2024-25 will be in the area of education, with money being used for the building of new schools, or improvements and extensions to existing schools. The following table shows a massive real terms increase in capital expenditure when comparing outturns for 2013-14 and budget estimates for 2024-25, with much of this being in the areas of education, housing and building, planning and development.
| Service area | 2013-14 Outturn | 2024-25 Budget Estimate | Change (£m) | Change (%) |
| Education | 693 | 1,230 | +537 | +78% |
| Culture & Related Services | 197 | 287 | +90 | +45% |
| Social Work | 107 | 80 | -26 | -25% |
| Roads & Transport | 607 | 718 | +111 | +18% |
| Environmental Services | 249 | 280 | +30 | +12% |
| Building, Planning & Development | 125 | 519 | +394 | +315% |
| Non-HRA Housing | 207 | 267 | + 60 | +29% |
| Trading Services | 19 | 60 | +42 | +225% |
| Central and Other Services | 232 | 287 | +55 | +24% |
| HRA Housing | 819 | 1,445 | +627 | +77% |
| Total Capital Expenditure | 3,254 | 5,174 | +1,920 | +59% |
Councils can also sell land and property to raise money for capital purposes. Indeed, the Scottish Government tells us that "capital receipts may only be used to fund capital expenditure or for a purpose specified by statute, or statutory guidance"2. The general trend since 2013-14 has been reducing receipts from the sale of assets, with the Local Government Information Unit (LGIU) concluding that "income from such decisions is minimal with most viable disposals already having taken place"3. Local government assets were valued at around £55 billion in 2022-232, and Table 5 (above) shows that councils intend to sell off around £138 million of this in 2024-25.
Public Private Partnerships
Public-private partnership (PPP) models have been used across the UK since the 1990s to finance infrastructure investment, including the building/improvement of around 60 school projects in Scotland1. Under these schemes, a private sector consortium provides upfront financing for infrastructure projects and the public sector then pays for the project once completed through regular payments over a period of 25 to 30 years, which include maintenance and service charges. The project is delivered and assets managed for the duration of the contract by a private company known as a Special Purpose Vehicle (SPV).
The UK government's Private Finance Initiative (PFI) was the first major PPP initiative, and this was used extensively by Scottish local authorities during the 1990s and early 2000s. This model has been heavily criticised, though, because of the scale of profits made by the private sector partners and the costs to the public sector. The Scottish Government therefore developed an alternative PPP model, known as the Non-Profit Distributing (NPD) model, which they hoped would restrict the profits that could be made by the private sector2.
One Director of Finance recently told the Local Government, Housing and Planning Committee, many of the original PFI arrangements are now coming to the end of their contracts3:
At the time, PPP was the only game in town—it was our only way of funding. In the past, we looked at whether there were opportunities to refinance or reduce costs, but there were not. We are now getting towards the end, so we are planning for the future. We will have a school estate that still has a significant life left, and we will have finished paying off the contract
Audit Scotland has warned that public bodies need to begin preparing for the impact of these contracts expiring as local authorities (and other public bodies) will then become responsible for the maintenance of the buildings.4
Performance data and changes over time
A significant amount of data relating to local authority services is collected and published. We are able to compare performance in a number of areas across time and between different council areas. This is important when looking at local government finance because, since the Local Government in Scotland Act 2003, local authorities have been required to demonstrate "best value" and therefore:
make arrangements to secure continuous improvement in performance (while maintaining an appropriate balance between quality and cost); and, in making those arrangements and securing that balance, to have regard to economy, efficiency, effectiveness, the equal opportunities requirement and to contribute to the achievement of sustainable development.1
Over recent decades, the Accounts Commission and Audit Scotland have had a role in reviewing council performance and assessing whether best value is being achieved2. This is demonstrated in the importance of best value to the annual audit process, and the fact that between 2016 and 2022 Audit Scotland completed Best Value Audit Reports for all 32 local authorities3.
To support senior management teams across all local authorities, and help elected councillors to ask questions about the performance of council services, the Improvement Service created its Local Government Benchmarking Framework (LGBF). This was intended to be "a catalyst for improving services, targeting resources to areas of greatest impact and enhancing public accountability"4. The Improvement Service collects and presents a range of data which helps councils compare performance against a number of indicators that cover most areas of local government activity. According to the Improvement Service website, the Framework:
..reflects a commitment by SOLACE (Scotland) and COSLA to develop better measurement and comparable data in order to help councils improve services, target resources to areas of greatest impact and enhance public accountability.
In its most recent LGBF Annual Report, the Improvement Service concluded that performance has improved over the past decade: "...the long-term picture of council service performance remains positive, with 66% of performance indicators within the LGBF showing improvement since the base year"5. This is certainly true in relation to some of the education indicators. The LGBF Annual Report for 2022-23 specifically highlighted the following areas where we can see long-term improvement trends:
Attainment both at senior phase and at primary level.
Positive destinations and participation in education, training or employment for 16–19-year-olds.
School exclusion rates.
Placement stability for care experienced children.
Payment of the living wage.
Roll out of superfast broadband.
Housing energy efficiency.
Road network condition.
The gender pay gap.
Council tax collection.
Corporate asset condition.
However, despite record levels of spending on adult social care, the LGBF shows reductions in all four indicators relating to satisfaction with adult social care services. Using biennial data from the Health and Care Experience Survey, the most recent annual report included the following table:
| Indicators | 2013-14 | 2021-22 | Change since 2013/14 |
|---|---|---|---|
| % agree that their services and support had an impact in improving or maintaining their quality of life | 85.0% | 78.1% | -6.9 percentage points |
| % agree that they are supported to live as independently as possible | 82.8% | 78.8% | -4.0 percentage points |
| % agree that they had a say in how their help, care or support was provided | 83.1% | 70.6% | -12.5 percentage points |
| % of carers who feel supported to continue in their caring role | 43.0% | 29.7% | -13.3 percentage points |
The Accounts Commission has repeatedly highlighted pressures facing adult social care services, with its most recent Local Government Overview report concluding that "there are signs that the sector is in crisis, with growing backlogs, declining satisfaction and no clear picture of demand or unmet need"6.
Satisfaction levels with a whole range of local government services show a trend of decline when comparing Scottish Household Survey data over time7. For example, the survey results show that the percentage of adults satisfied with the quality of local public services (local health services, local schools and public transport) fell from 60% in 2013 to 40% in 2022. Likewise, the percentage of people agreeing with the statement "my local council is addressing the key issues affecting the quality of life in my local neighbourhood" fell from 36% in 2013 to 33% in 2022. Clearly, the COVID-19 pandemic will have had an impact on many of these indicators.
Despite this plethora of local data, and particularly the comprehensive Local Government Benchmarking Framework, the Accounts Commission concluded in 2023 that "there is limited evidence in some councils of using performance data to drive improvements"3.
Financial sustainability indicators
Last year, the Local Government Information Unit (LGIU) surveyed a range of council leaders, local authority chief executives and directors of finance across the country and found that “confidence in the sustainability of council finances in Scotland is critically low”1. However, around the same time, the Accounts Commission reported that “local appointed auditors did not identify any councils in Scotland as being financially unsustainable in the short term”2. The Scottish Parliament's Local Government, Housing and Planning Committee, hoping to get some clarity on this matter, has decided to explore the issue of local government financial sustainability as part of its 2025-26 pre-budget scrutiny.
The Local Government Benchmarking Framework (LGBF) includes five financial sustainability indicators, including the following four. These show averages for all Scottish local authorities in 2013-14 and 2022-23 (the most recent year available):
| Indicator | 2013-14 | 2022-23 |
| Total useable reserves as a % of council annual budgeted revenue | 16.0% | 24.5% |
| Ratio of Financing Costs to Net Revenue Stream - General Fund | 8.4% | 5.4% |
| Actual outturn as a percentage of budgeted expenditure | 99.1% | 98.6% |
| Uncommitted General Fund Balance as a % of annual budgeted net revenue | 3.7% | 3.2% |
Local Government Benchmarking Framework
The performance of the first three of these indicators would suggest that local government is actually more sustainable than it was 10 years ago, and the fourth reveals only a slight reduction in performance (and still comfortably within the 2% to 4% range as recommended by the Accounts Commission). As the above table only shows national averages, it is worth stating that there are considerable local variations across all of these indicators. It is also the case that an improving financial situation is not something most council leaders and senior local government officials would recognise. As already discussed, a recent Local Government Information Unit found that confidence in the sustainability of council finances in Scotland is critically low1, so it is perhaps the case that the financial sustainability indicators in the LGBF need to be reviewed.
More on reserves
Reserves are the accumulated surpluses generated by various local authority funding streams over a number of years. These have grown significantly recently. While a certain level of reserves is considered prudent to cover unforeseen eventualities, excessive reserves can be considered to demonstrate that resources are not being deployed effectively. The Scottish Government's Local Government Finance Statistics (SLGFS) provide data on local government reserves for Scotland as a whole and for individual local authorities1. And the following table shows that for Scotland overall, total usable reserves grew by 56% in real terms between March 2019 and March 2023:
| March of each year | 2019 | 2020 | 2021 | 2022 | 2023 | Change between 2019 and 2023 (£m) | Change between 2019 and 2023 (%) |
| Total usable reserves | 2,909 | 3,023 | 4,154 | 4,553 | 4,532 | +1,624 | +56% |
| of which: | |||||||
| General Fund Reserve | 1,306 | 1,467 | 2,504 | 2,978 | 2,870 | +1,564 | 120% |
| Other revenue reserves | 836 | 795 | 918 | 896 | 780 | - 56 | -7% |
| Capital Reserves | 767 | 761 | 731 | 679 | 882 | + 115 | +15% |
Table 9 (above) and Chart 27 (below) show that most of this increase in reserves has been in the General Fund. This is the principal revenue reserve for local authorities. The largest increase was between March 2019 and March 2021 with additional money being provided to local authorities as a response to the COVID-19 pandemic.
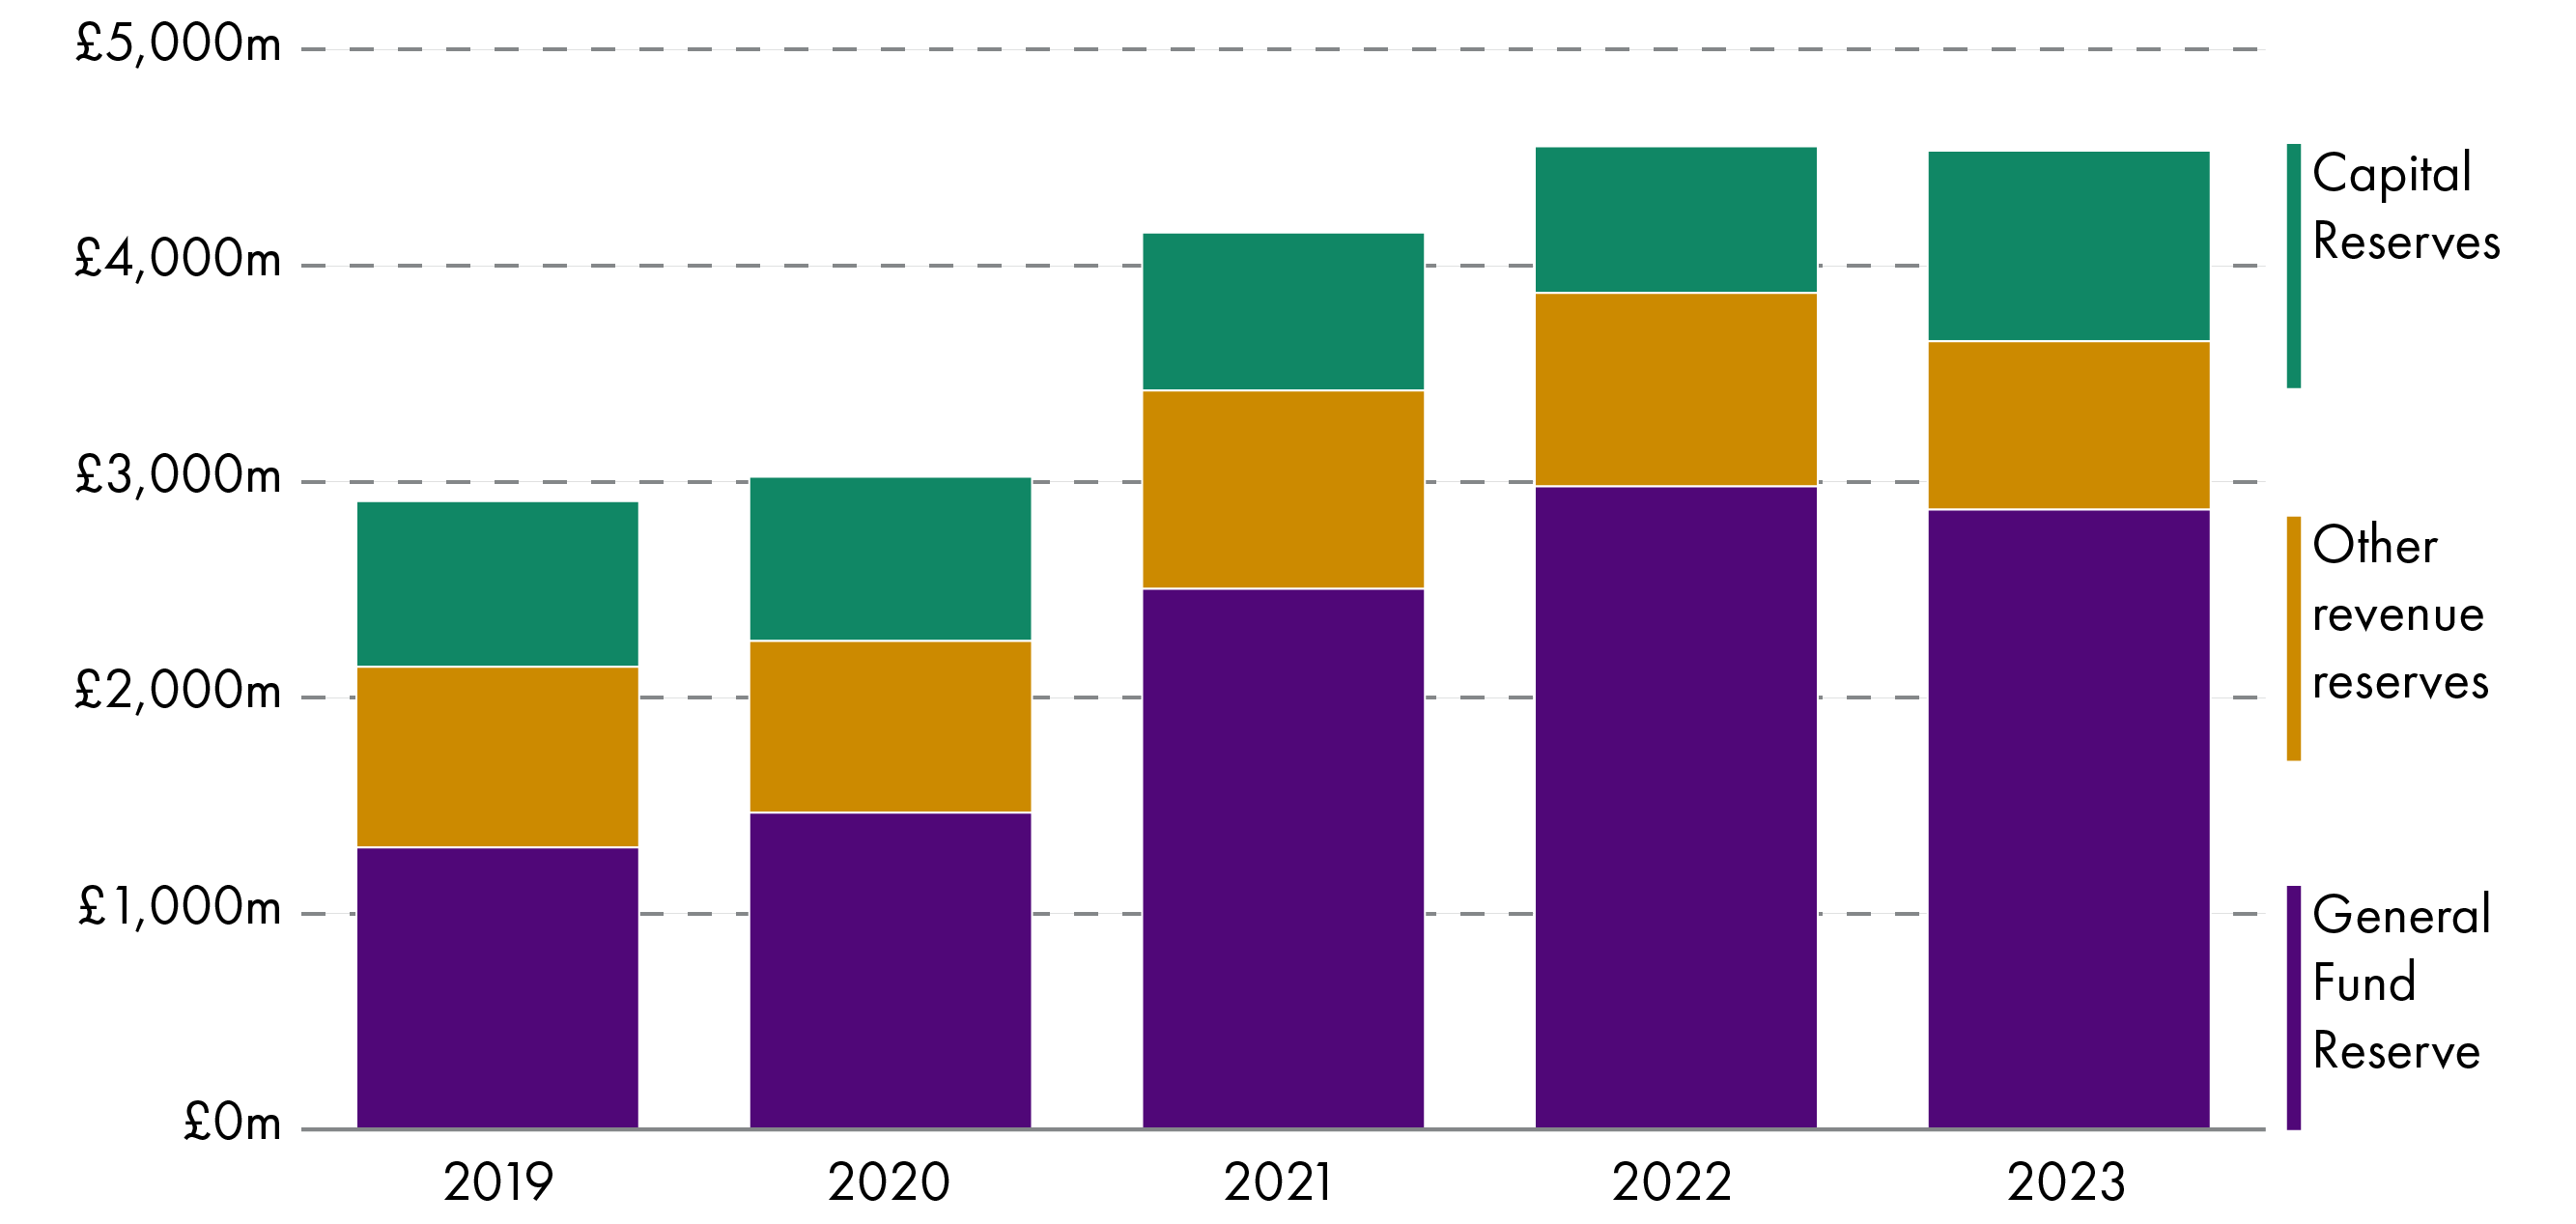
Scottish Government Local Government Finance statistics
Although this seems like a massive amount of money councils are sitting on, the vast majority of these usable reserves are considered “committed”, or “earmarked”, having been set aside by local authorities for specific purposes. Table 10 (below) shows that of the £2,870 million General Fund reserves in March 2023, local authorities had earmarked 83.3% or £2,390 million of the £2,870 million General Fund reserves. Unearmarked reserves - amounting to £480 million in March 2023 - are meant to help councils "mitigate financial risk"1, and we can see that this contingency funding has reduced significantly over the past three years:
| 2021 | 2022 | 2023 | |
| General Fund usable reserves (£m) | 2,504 | 2,978 | 2,870 |
| Of which: | |||
| Earmarked (£m) | 1,781 | 2,422 | 2,390 |
| Unearmarked (£m) | 723 | 556 | 480 |
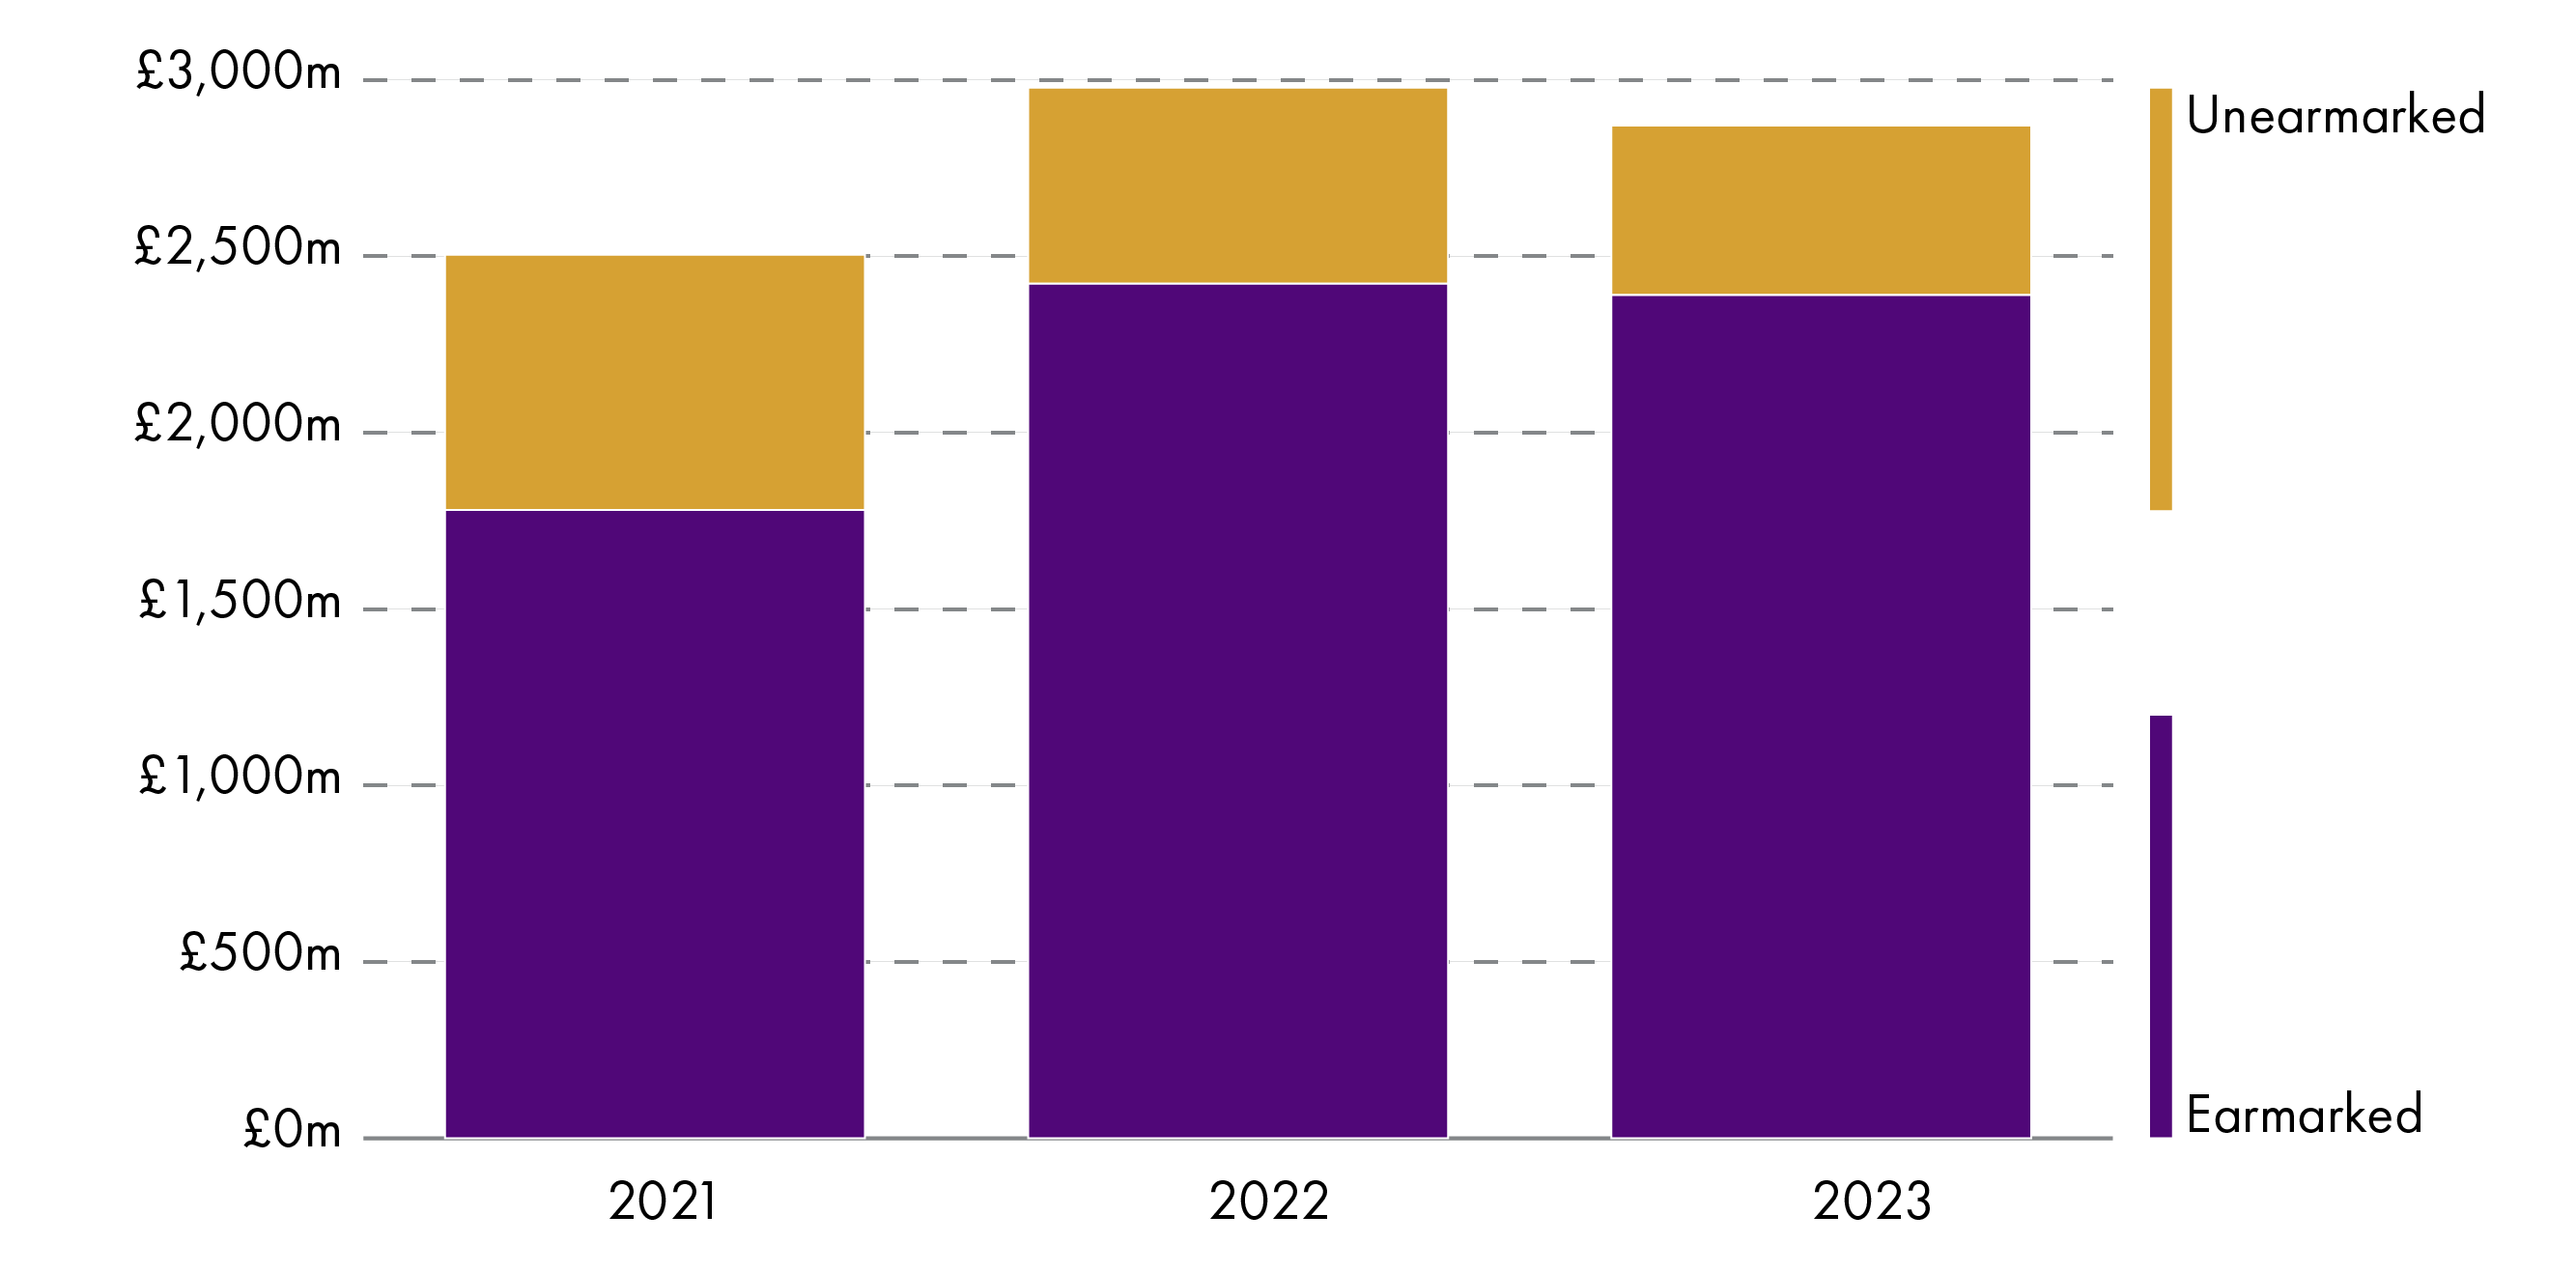
Scottish Government Local Government Finance statistics
As is demonstrated in Table 8 (previous section), the LGBF shows that unearmarked General Fund reserves were equal to 3.2% of annual budgeted net revenue in 2023. And the Accounts Commission tells us that "most councils plan to maintain uncommitted reserves at around 2 to 4 per cent of net budgeted expenditure as a contingency to respond to unforeseen events and associated cost pressures"3. So, it appears that unearmarked reserves are at a level considered to be acceptable. However, this national average masks some striking differences between local authorities. For example, the local authority with the highest level of unearmarked reserves as a proportion of net revenue expenditure is Shetland Islands (at 12.9%) and the local authority with the lowest level is West Lothian (0.4%).
West Lothian's uncommitted reserves are clearly below the 2% to 4% range, as recommended by the Accounts Commission, as are those of Aberdeenshire (1.4%), Angus (0.8%), Glasgow (1.4%) and South Lanarkshire (1.5%)4. Low levels of uncommitted or unearmarked reserves could imply "that a council will struggle financially if it experiences a financial shock or is unable to deliver a budget where income matches expenditure"3.
However, the Accounts Commission also found that many of these councils had stated in their 2022-23 annual accounts that they were earmarking some of their reserves "for contingency"3. Referring to this at a Local Government, Housing and Planning Committee meeting in April 20247, senior manager at Audit Scotland, Blyth Deans, stated:
...we are seeing a growing trend towards councils taking steps to earmark funds for contingency, which, in a way, adds to the uncommitted element that we have shown in exhibit 10 [of the Commission's Financial Bulletin 2022-23]. That money is earmarked for unexpected events or uneven cash flows, so that councils can use it to help them to smooth the path, so to speak.
More on council debt
Total local government debt stood at £21.8 billion in March 2023, a real terms increase of £2.4 billion since March 2014. The following table shows total local government debt for each year since 2013-14 (in 2022-2023 prices, £m):
| 2014 | 2015 | 2016 | 2017 | 2018 | 2019 | 2020 | 2021 | 2022 | 2023 | |
| Total Debt (£m) | 19,448 | 19,448 | 19,510 | 19,939 | 20,480 | 20,823 | 21,631 | 20,861 | 21,933 | 21,801 |
| Total debt per head of population (£) | 3,647 | 3,634 | 3,630 | 3,699 | 3,797 | 3,846 | 3,996 | 3,850 | 4,026 | 4,002 |
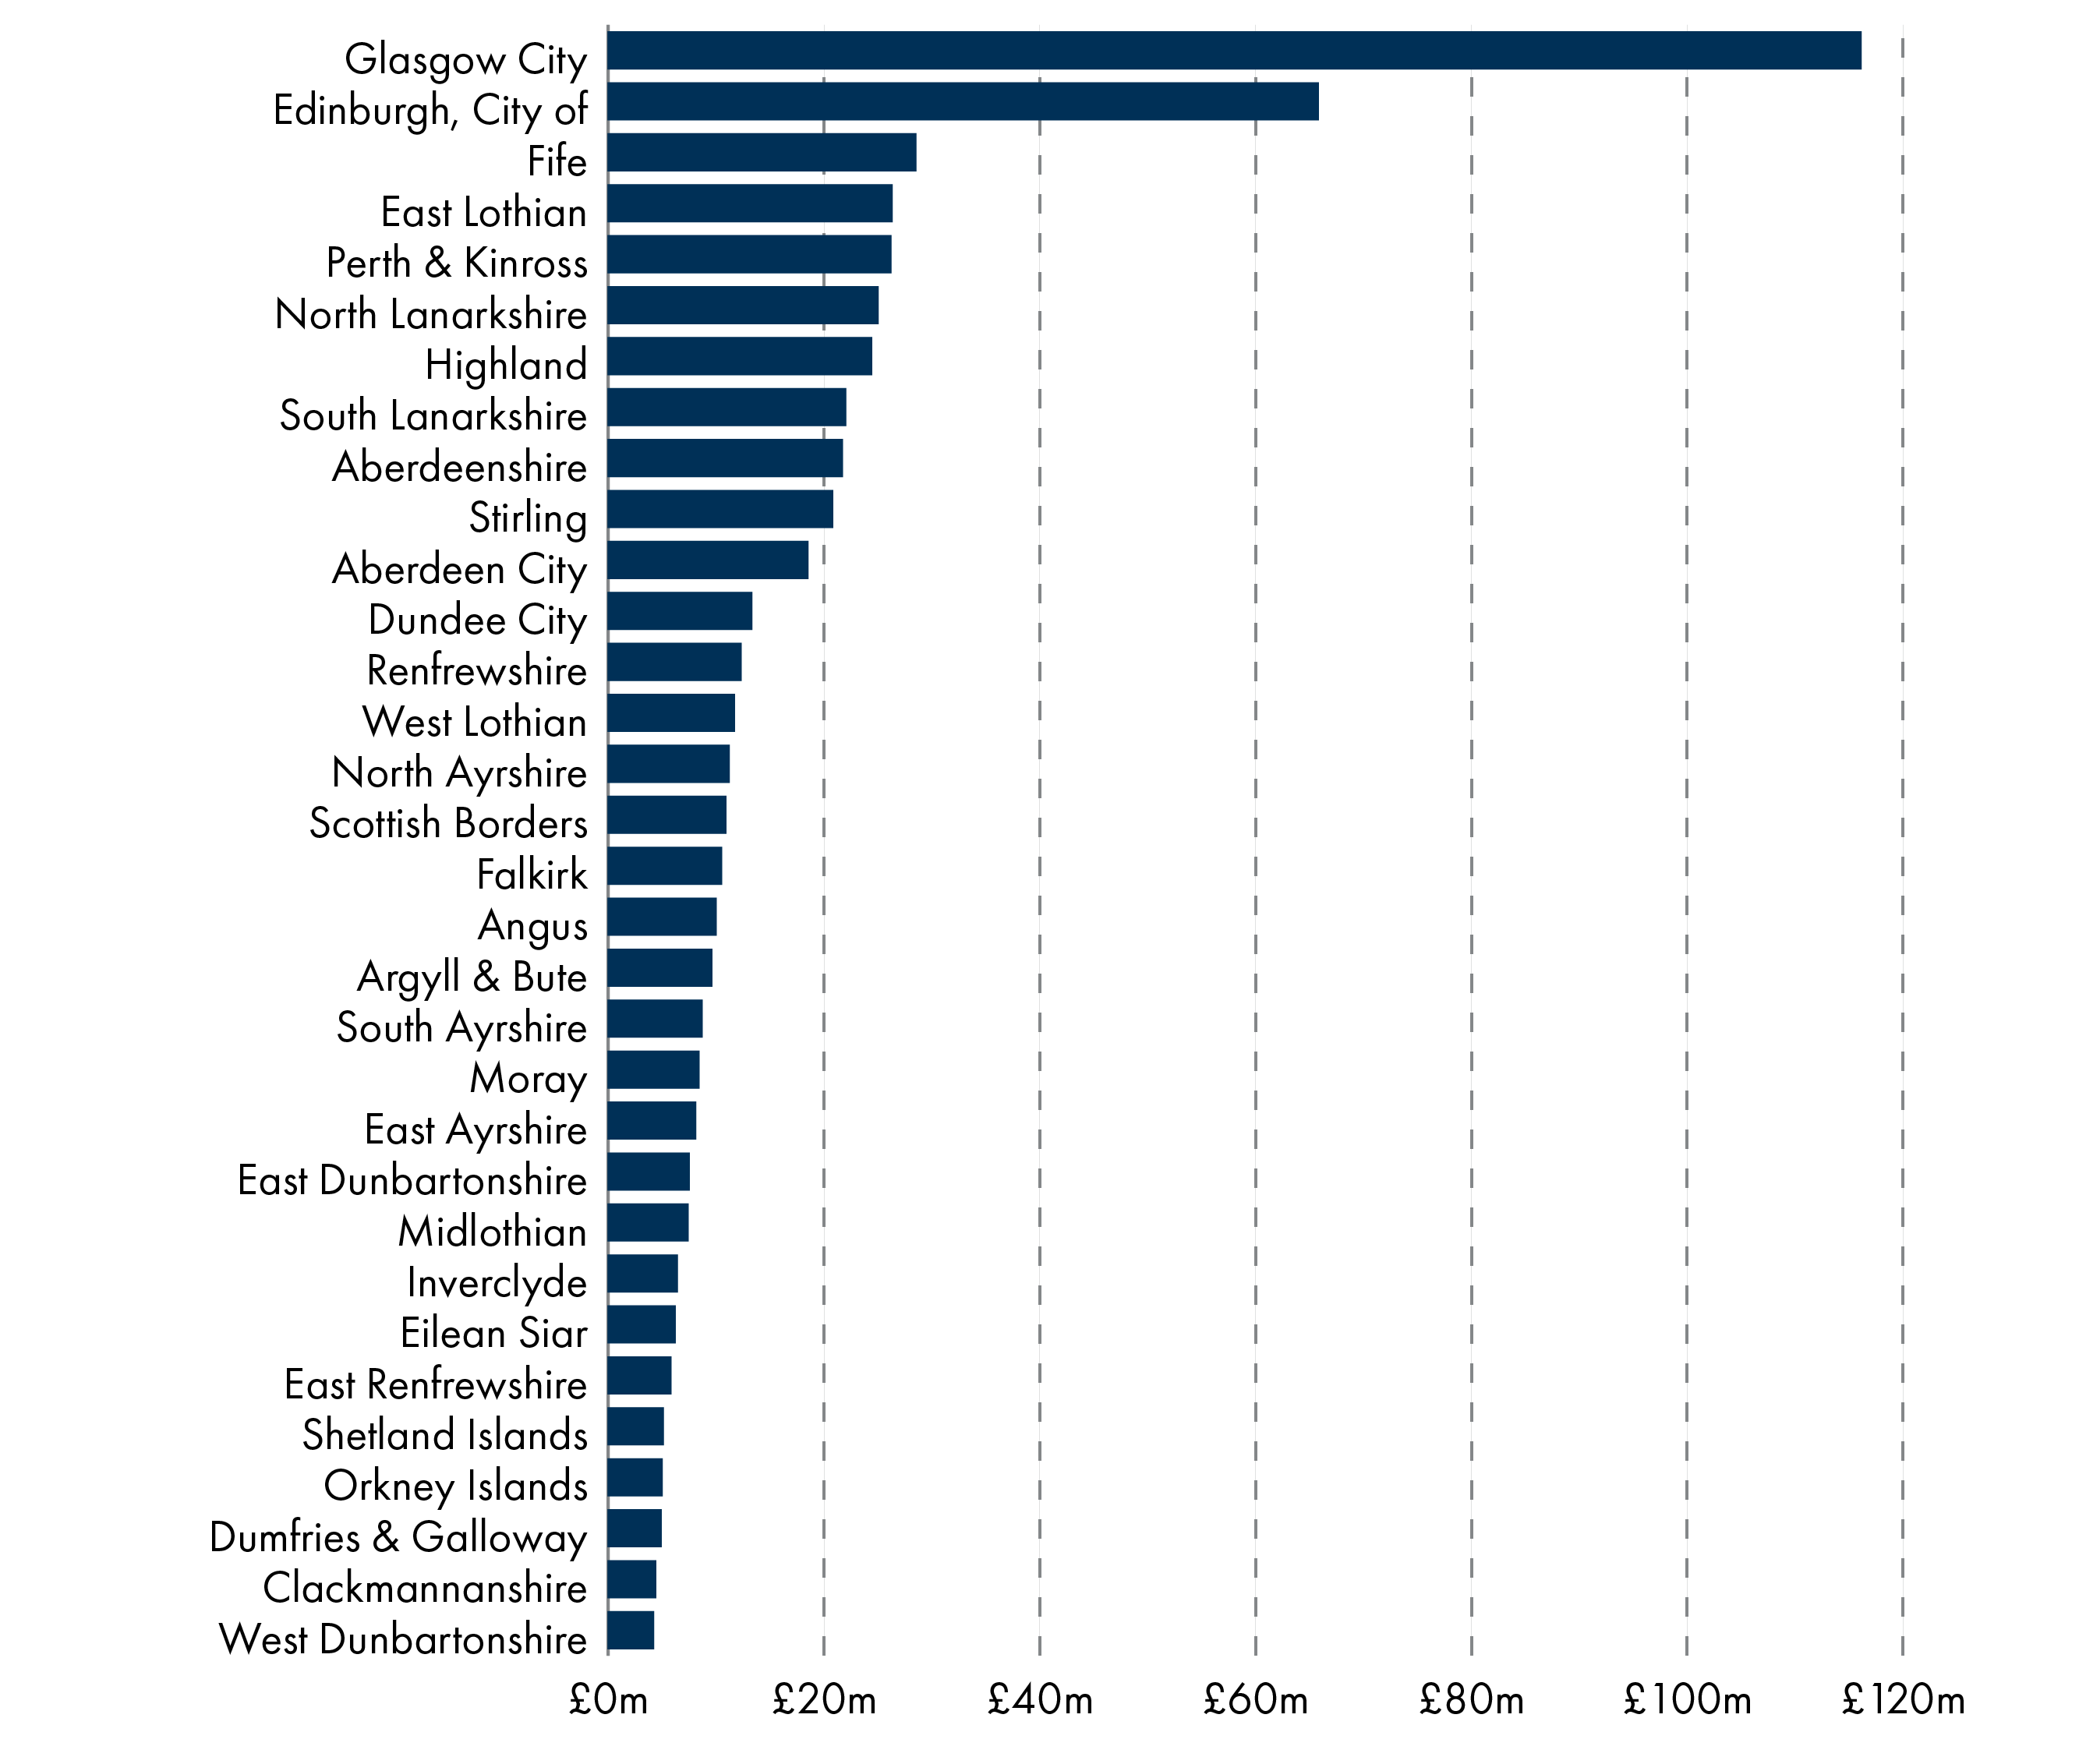
Local government debt per head now sits at over £4,000 per person, a 10% real terms increase since 2014. And again, national figures mask considerable variation across the country, with the following chart showing total debt per head of population by local authority in 2023-24. The range of values from the largest total debt per head (West Dunbartonshire) to the lowest (Orkney Islands) is striking:
Scottish Government Local Government Finance statistics and mid-year population estimates
The financial sustainability indicators used by the Improvement Service recognise that it is not so much the level of debt that is concerning, but the ability to pay off the interest on that debt. The Local Government Benchmarking Framework therefore includes an indicator presenting the annual revenue costs of borrowing (mainly interest payments) as a proportion of councils' General Fund "net revenue streams" (i.e. GRG+NDR income+council tax income). As discussed above, the figure for Scotland as a whole sits at a reasonable 5.4%. However, the following chart shows the ratios for each local authority in 2022-23, and again, there is quite a range from the lowest (Midlothian) to the highest (Inverclyde):
Improvement Service Local Government Benchmarking Framework
Local government finance across the UK
There are major differences in local government finance across the UK- in funding mechanisms and areas of expenditure - and these make comparison extremely difficult (see SPICe blog post on this issue from 2018). For example, general revenue grants from central government account for a much smaller proportion of council funding in England, with rapporteurs for the Congress of Local and Regional Authorities at the Council of Europe concluding that:
...in England, about one third of local resources consist of earmarked grants, that the core council grant is significantly smaller than the sum of the earmarked grants and that this general grant is partly earmarked as well. In Scotland and Wales, the general grants are more general than the English one, and a smaller part of local resources is formed with specific grants1.
Public expenditure on school education is also very different in Scotland and England. As highlighted in an earlier section of this briefing, around half of Scottish local government spend goes on education services, with councils allocating funding to their schools. Teachers are employed by local authorities, albeit their pay is negotiated nationally between unions and COSLA. In England, a significant number of schools now receive funding directly from central government, with 82% of secondary schools and 43% of primary schools being academies or "free schools"2. Teachers in these schools are employed by the academy trust, not a local authority.
The job of comparing local government expenditure across the four nations of the UK is made easier by the publication of the annual Public Expenditure Statistical Analyses (PESA)3. This UK Government document provides a comparison of spending by local government in each nation of the UK. The following table uses PESA data to show that between 2013-14 and 2022-23, overall local government spend in Scotland increased in real terms by 2%. During the same period, local government expenditure in England fell by 8%, whilst it increased in Wales (+4%) and in Northern Ireland (+21%).
| 2013-14 | 2022-23 | Change (£m) | Change (%) | |
| England | 156,958 | 144,011 | - 12,947 | -8% |
| Scotland | 17,072 | 17,371 | +299 | +2% |
| Wales | 10,373 | 10,762 | +389 | +4% |
| Northern Ireland | 781 | 943 | +162 | +21% |
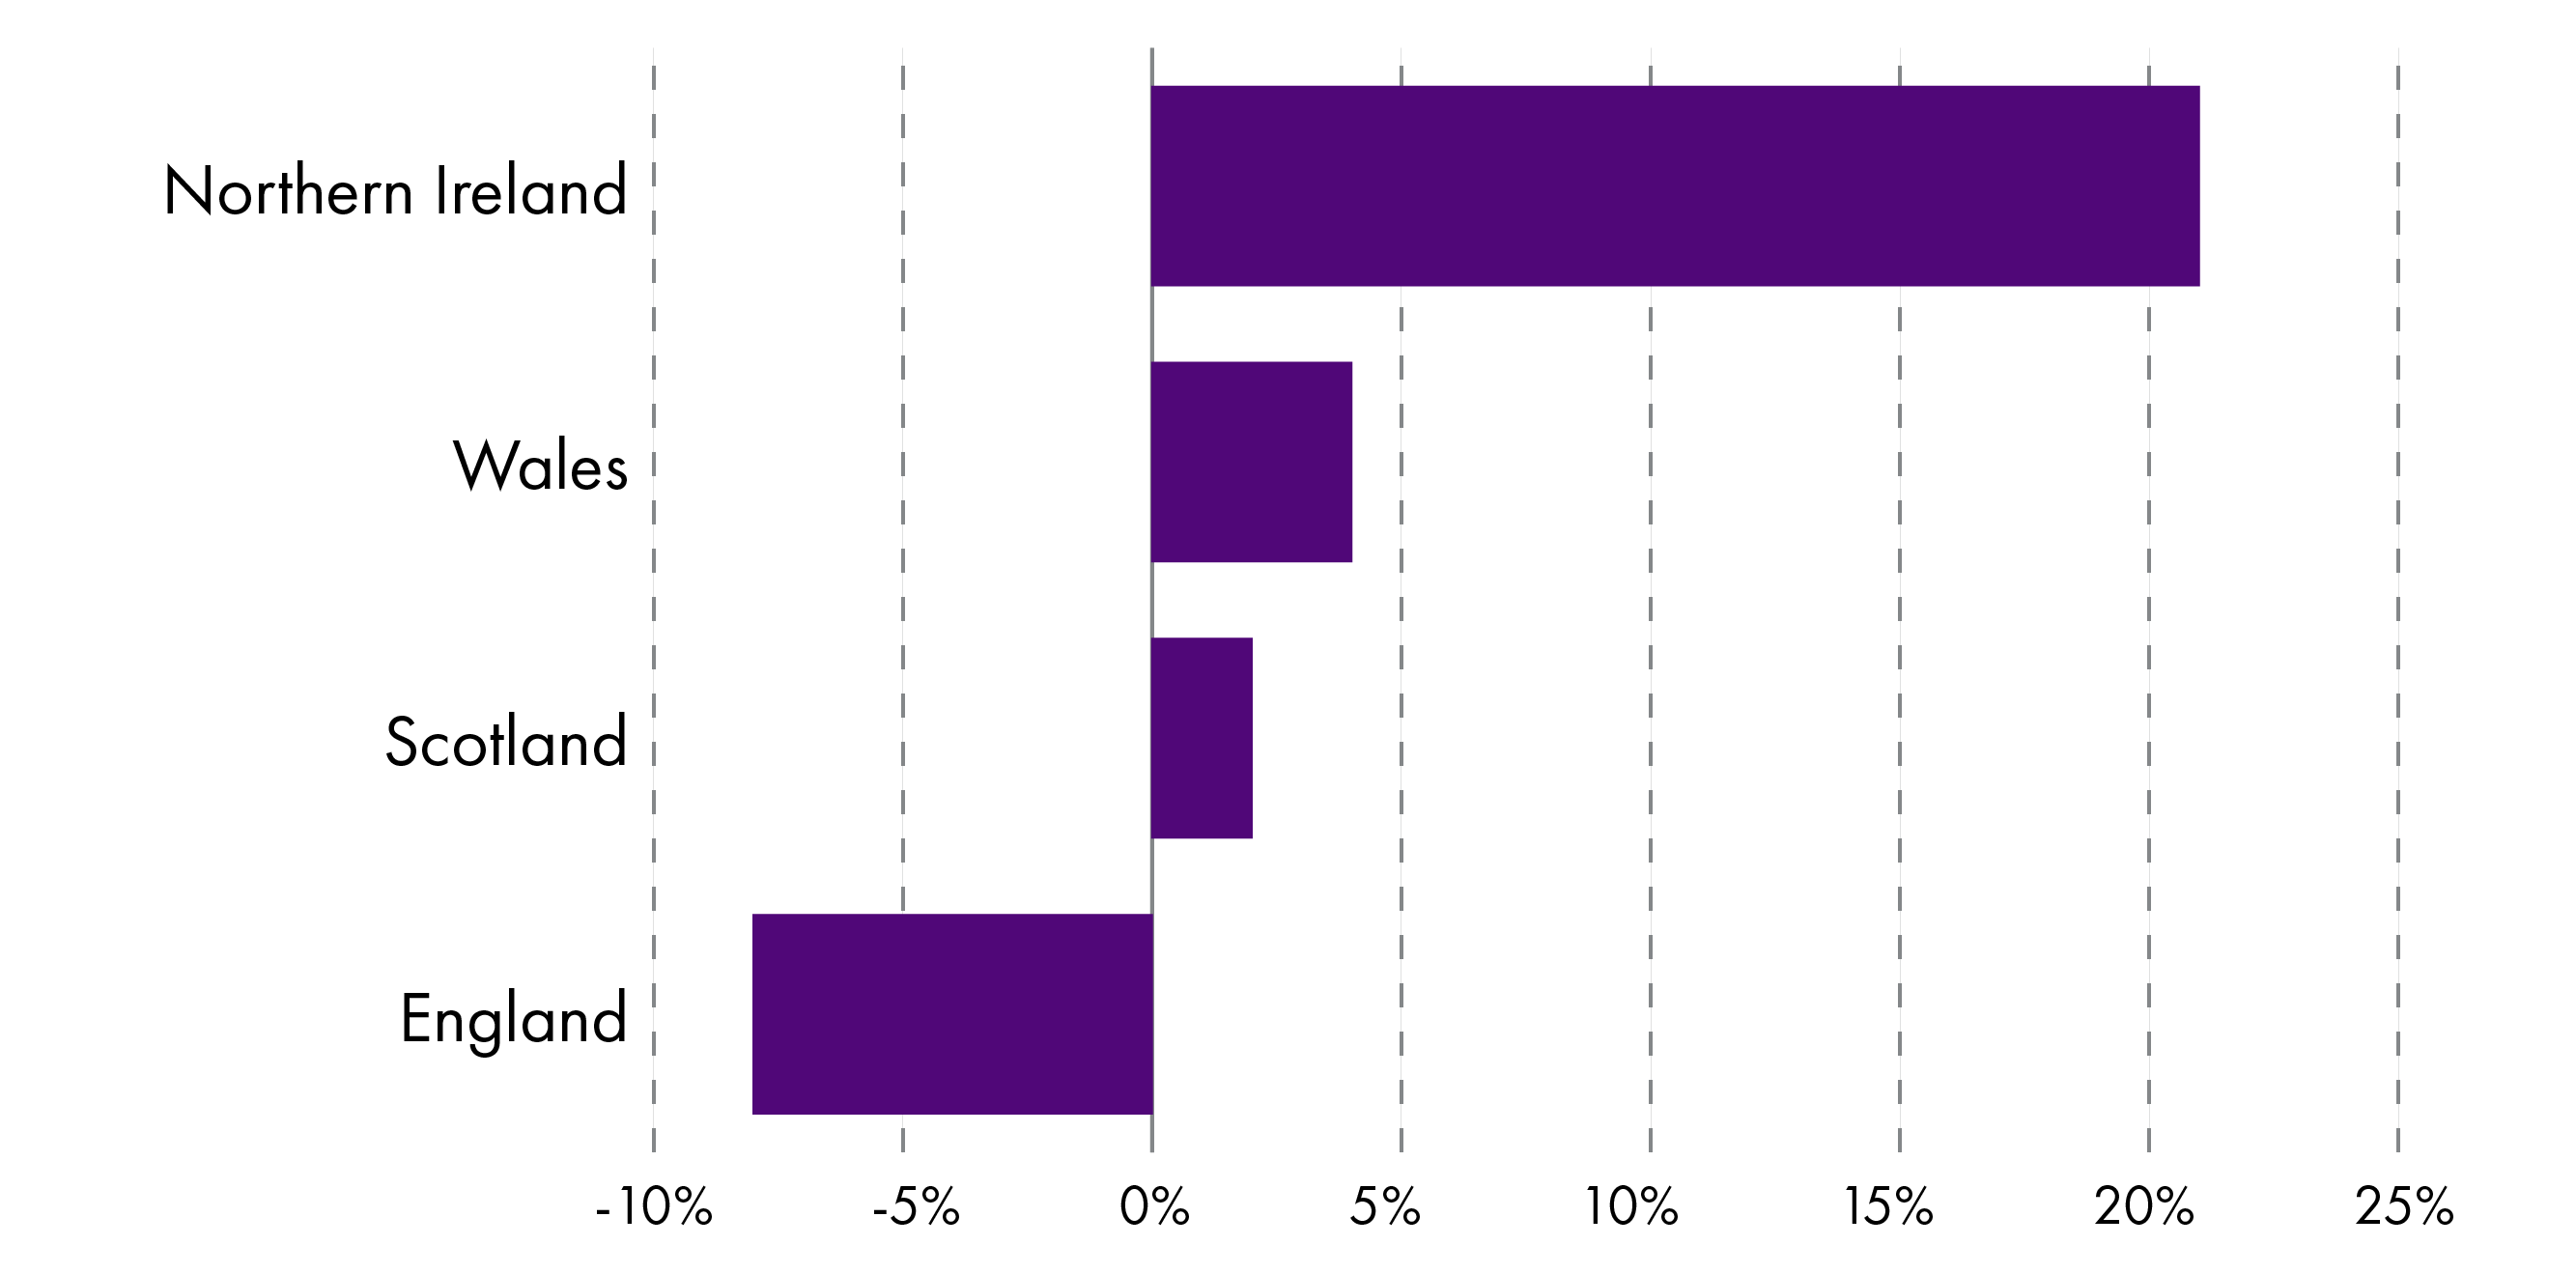
Public Expenditure Statistical Analyses: Country and regional analysis 2023
This table and chart are based on data supplied by the Department for Levelling Up, Housing and Communities (DLUHC) and the Department for Work and Pensions (DWP), as well as the devolved administrations. And it is worth stressing that the reduction in spend by English local government over this period happened at the same time as a corresponding increase in central government spend on school education. So "academisation" of schools may well explain much of the reduction.
Northern Ireland is an outlier in a number of ways, with PESA reminding us that much spending undertaken by local government in England, Scotland and Wales is mostly undertaken by Northern Ireland departments (education and social care for example).
Sources
Local Government Information Unit. (2024). Constrained autonomy and uncertain viability in Scotland. Retrieved from <a href="https://lgiu.org/publication/constrained-autonomy-and-uncertain-viability-in-scotland/" target="_blank">https://lgiu.org/publication/constrained-autonomy-and-uncertain-viability-in-scotland/</a>
Scottish Government. (2024, February 29). Local government finance circular No. 2/2024: settlement for 2024-2025. Retrieved from <a href="https://www.gov.scot/publications/local-government-finance-circular-no-2-2024-settlement-and-redeterminations-for-non-domestic-rates-2023-to-2025/" target="_blank">https://www.gov.scot/publications/local-government-finance-circular-no-2-2024-settlement-and-redeterminations-for-non-domestic-rates-2023-to-2025/</a>
Scottish Government. (2013). Local Government Finance Circular 1/2013. Retrieved from <a href="https://www.gov.scot/binaries/content/documents/govscot/publications/advice-and-guidance/2013/02/local-government-finance-circular-12013-settlement-2013-2014-changes-2012-2013/documents/local-government-finance-circular-1-2013-pdf/local-government-finance-circular-1-2013-pdf/govscot%3Adocument/Local%2Bgovernment%2Bfinance%2Bcircular%2B1-2013.pdf" target="_blank">https://www.gov.scot/binaries/content/documents/govscot/publications/advice-and-guidance/2013/02/local-government-finance-circular-12013-settlement-2013-2014-changes-2012-2013/documents/local-government-finance-circular-1-2013-pdf/local-government-finance-circular-1-2013-pdf/govscot%3Adocument/Local%2Bgovernment%2Bfinance%2Bcircular%2B1-2013.pdf</a>
Scottish Parliament Official Report. (2024, January). Official Report for the Local Government, Housing and Planning Committee's first meeting of 2024. Retrieved from <a href="https://www.parliament.scot/api/sitecore/CustomMedia/OfficialReport?meetingId=15640" target="_blank">https://www.parliament.scot/api/sitecore/CustomMedia/OfficialReport?meetingId=15640</a>
COSLA and the Scottish Government. (2023, June). Verity House Agreement. Retrieved from <a href="https://www.gov.scot/binaries/content/documents/govscot/publications/agreement/2023/06/new-deal-local-government-partnership-agreement/documents/new-deal-local-government-verity-house-agreement/new-deal-local-government-verity-house-agreement/govscot%3Adocument/new-deal-local-government-verity-house-agreement.pdf" target="_blank">https://www.gov.scot/binaries/content/documents/govscot/publications/agreement/2023/06/new-deal-local-government-partnership-agreement/documents/new-deal-local-government-verity-house-agreement/new-deal-local-government-verity-house-agreement/govscot%3Adocument/new-deal-local-government-verity-house-agreement.pdf</a>
Accounts Commission. (2024). Local government budgets 2024/25. Retrieved from <a href="https://audit.scot/publications/local-government-budgets-202425" target="_blank">https://audit.scot/publications/local-government-budgets-202425</a>
Accounts Commission. (2024, January 16). Local government in Scotland: Financial bulletin 2022/23. Retrieved from <a href="https://audit.scot/publications/local-government-in-scotland-financial-bulletin-202223" target="_blank">https://audit.scot/publications/local-government-in-scotland-financial-bulletin-202223</a>
Scottish Government. (2024, February). Scottish Local Government Finance - Green Book: 2024-2025. Retrieved from <a href="https://www.gov.scot/publications/scottish-local-government-finance-green-book-2024-25/documents/" target="_blank">https://www.gov.scot/publications/scottish-local-government-finance-green-book-2024-25/documents/</a>
Scottish Government. (2024, July). Scottish Public Finance Manual. Retrieved from <a href="https://www.gov.scot/publications/scottish-public-finance-manual/local-government-finance/local-government-finance/" target="_blank">https://www.gov.scot/publications/scottish-public-finance-manual/local-government-finance/local-government-finance/</a>
McConnell, A. (2004). Scottish Local Government. (n.p.): Edinburgh University Press.
National Records of Scotland. (2024, July 9). Population Estimates Time Series Data. Retrieved from <a href="https://www.nrscotland.gov.uk/statistics-and-data/statistics/statistics-by-theme/population/population-estimates/mid-year-population-estimates/population-estimates-time-series-data" target="_blank">https://www.nrscotland.gov.uk/statistics-and-data/statistics/statistics-by-theme/population/population-estimates/mid-year-population-estimates/population-estimates-time-series-data</a>
Scottish Government. (2024, June 25). Local Government 2023-24 Provisional Outturn and 2024-25 Budget Estimates. Retrieved from <a href="https://www.gov.scot/publications/local-government-2023-24-provisional-outturn-and-2024-25-budget-estimates/documents/" target="_blank">https://www.gov.scot/publications/local-government-2023-24-provisional-outturn-and-2024-25-budget-estimates/documents/</a>
Scottish Government. (2023). Non-domestic rates revaluation 2023 in Scotland. Retrieved from <a href="https://www.gov.scot/binaries/content/documents/govscot/publications/statistics/2023/05/revaluation-2023-official-statistics/documents/non-domestic-rates-revaluation-2023-in-scotland/non-domestic-rates-revaluation-2023-in-scotland/govscot%3Adocument/Revaluation%2B2023%2B-%2Bstatistics%2Breport%2B-%2Bweb.pdf" target="_blank">https://www.gov.scot/binaries/content/documents/govscot/publications/statistics/2023/05/revaluation-2023-official-statistics/documents/non-domestic-rates-revaluation-2023-in-scotland/non-domestic-rates-revaluation-2023-in-scotland/govscot%3Adocument/Revaluation%2B2023%2B-%2Bstatistics%2Breport%2B-%2Bweb.pdf</a>
Scottish Government. (2015, February 24). Local Government Finance Statistics, 2013-14. Retrieved from <a href="https://www.gov.scot/publications/scottish-local-government-financial-statistics-2013-14/" target="_blank">https://www.gov.scot/publications/scottish-local-government-financial-statistics-2013-14/</a>
Scottish Government. (2023, August 16). Government Expenditure and Revenue Scotland, 2022-23. Retrieved from <a href="https://www.gov.scot/publications/government-expenditure-revenue-scotland-2022-23/documents/" target="_blank">https://www.gov.scot/publications/government-expenditure-revenue-scotland-2022-23/documents/</a>
Improvement Service. (2024). Local Government Benchmark Framework Annual Report 2022-23. Retrieved from <a href="https://www.improvementservice.org.uk/benchmarking/reports" target="_blank">https://www.improvementservice.org.uk/benchmarking/reports</a>
Audit Scotland. (2021, September 7). Christie’s clarion call can’t wait another decade - blog post by the Auditor General. Retrieved from <a href="https://audit.scot/publications/blog-christie-10-years-on" target="_blank">https://audit.scot/publications/blog-christie-10-years-on</a>
Scottish Government. (2011, June 29). Report on the future delivery of public services by the commission chaired by Dr Campbell Christie. Retrieved from <a href="https://www.gov.scot/publications/commission-future-delivery-public-services/documents/" target="_blank">https://www.gov.scot/publications/commission-future-delivery-public-services/documents/</a>
Scottish Government. (2024, March). Local Government Finance Statistics 2022-23. Retrieved from <a href="https://www.gov.scot/publications/scottish-local-government-finance-statistics-2022-23/documents/" target="_blank">https://www.gov.scot/publications/scottish-local-government-finance-statistics-2022-23/documents/</a>
Accounts Commission. (2023). Local government in Scotland Overview 2023. Retrieved from <a href="https://audit.scot/uploads/docs/report/2023/nr_230517_local_government_overview.pdf" target="_blank">https://audit.scot/uploads/docs/report/2023/nr_230517_local_government_overview.pdf</a>
Scottish Government. (2024, June). Public Sector Employment in Scotland Statistics for 1st Quarter 2024. Retrieved from <a href="https://www.gov.scot/publications/public-sector-employment-in-scotland-statistics-for-1st-quarter-2024/" target="_blank">https://www.gov.scot/publications/public-sector-employment-in-scotland-statistics-for-1st-quarter-2024/</a>
COSLA. (2022). Submission to Finance Committee's inquiry into Scotland's public finances in 2023-24: the impact of the cost of living and public service reform. Retrieved from <a href="https://yourviews.parliament.scot/finance/scotland-public-finances-23-24/consultation/view_respondent?uuId=489985552" target="_blank">https://yourviews.parliament.scot/finance/scotland-public-finances-23-24/consultation/view_respondent?uuId=489985552</a>
Scottish Government. (2024, June 11). Public Sector Employment Statistics. Retrieved from <a href="https://www.gov.scot/collections/public-sector-employment-statistics/" target="_blank">https://www.gov.scot/collections/public-sector-employment-statistics/</a>
Improvement Service, SOLACE and SPDS. (2024, September). Scotland's Local Government Workforce Report 2024. Retrieved from <a href="https://www.improvementservice.org.uk/__data/assets/pdf_file/0027/53559/Local-Government-Workforce-Report-2024-v4.pdf" target="_blank">https://www.improvementservice.org.uk/__data/assets/pdf_file/0027/53559/Local-Government-Workforce-Report-2024-v4.pdf</a>
Hudson, N. (2018, January). Private financing of Scotland’s infrastructure, SPICe blog. Retrieved from <a href="https://spice-spotlight.scot/2018/01/30/private-financing-of-scotlands-infrastructure/" target="_blank">https://spice-spotlight.scot/2018/01/30/private-financing-of-scotlands-infrastructure/</a>
Scottish Parliament Information Centre. (2023, March). Briefing for the Citizen Participation and Public Petitions Committee on petition PE2004: Abolish the use of Public Private Partnerships in Scotland. Retrieved from <a href="https://www.parliament.scot/get-involved/petitions/view-petitions/pe2004-abolish-the-use-of-public-private-partnerships-in-scotland" target="_blank">https://www.parliament.scot/get-involved/petitions/view-petitions/pe2004-abolish-the-use-of-public-private-partnerships-in-scotland</a>
Audit Scotland. (2023, September). Investing in Scotland's infrastructure. Retrieved from <a href="https://audit.scot/uploads/docs/report/2023/briefing_230928_scotlands_infrastructure.pdf" target="_blank">https://audit.scot/uploads/docs/report/2023/briefing_230928_scotlands_infrastructure.pdf</a>
Scottish Government. (2020). Best Value: revised statutory guidance 2020. Retrieved from <a href="https://www.gov.scot/publications/best-value-revised-statutory-guidance-2020/" target="_blank">https://www.gov.scot/publications/best-value-revised-statutory-guidance-2020/</a>
Accounts Commission. (2023, September). Best Value in Scotland: Twenty years of auditing Best Value and next steps for Best Value reporting in Scottish councils. Retrieved from <a href="https://audit.scot/uploads/docs/report/2023/nr_230926_best_value_in_scotland.pdf" target="_blank">https://audit.scot/uploads/docs/report/2023/nr_230926_best_value_in_scotland.pdf</a>
Improvement Service. (2024). Local Government Benchmarking Framework. Retrieved from <a href="https://www.improvementservice.org.uk/benchmarking/home" target="_blank">https://www.improvementservice.org.uk/benchmarking/home</a>
Scottish Government. (2023). Scottish Household Survey 2022: Key Findings. Retrieved from <a href="https://www.gov.scot/publications/scottish-household-survey-2022-key-findings/documents/" target="_blank">https://www.gov.scot/publications/scottish-household-survey-2022-key-findings/documents/</a>
Local Government Information Unit. (2023, December 13). The State of Local Government FInance in Scotland. Retrieved from <a href="https://lgiu.org/publication/the-state-of-local-government-finance-in-scotland/" target="_blank">https://lgiu.org/publication/the-state-of-local-government-finance-in-scotland/</a>
Scottish Parliament Official Report. (2024, April 23). Official Report of the Local Government, Housing and Planning Committee's session looking at Accounts Commission's “Local government in Scotland: Financial bulletin 2022/23”. Retrieved from <a href="https://www.parliament.scot/chamber-and-committees/official-report/search-what-was-said-in-parliament/LGHP-23-04-2024?meeting=15815&iob=135004" target="_blank">https://www.parliament.scot/chamber-and-committees/official-report/search-what-was-said-in-parliament/LGHP-23-04-2024?meeting=15815&iob=135004</a>
Congress of Local and Regional Authorities of the Council of Europe. (2022, March 22). Monitoring of the application of the European Charter of Local Self-Government in the United Kingdom. Retrieved from <a href="https://rm.coe.int/cg-2022-42-18-en-monitoring-of-the-application-of-the-european-charter/1680a5b483" target="_blank">https://rm.coe.int/cg-2022-42-18-en-monitoring-of-the-application-of-the-european-charter/1680a5b483</a>
UK Government. (2024). Academic year 2023/24 Schools, pupils and their characteristics - explore education statistics. Retrieved from <a href="https://explore-education-statistics.service.gov.uk/find-statistics/school-pupils-and-their-characteristics" target="_blank">https://explore-education-statistics.service.gov.uk/find-statistics/school-pupils-and-their-characteristics</a>
UK Government. (2023, December). Public Expenditure Statistical Analyses: Country and regional analysis 2023. Retrieved from <a href="https://www.gov.uk/government/statistics/country-and-regional-analysis-2023" target="_blank">https://www.gov.uk/government/statistics/country-and-regional-analysis-2023</a>