Economic inactivity and ill health in Scotland
This briefing explores the relationship between poor health and economic inactivity in Scotland. It documents a larger proportion of economic inactivity in Scotland than in the rest of the UK. This reflects both a higher proportion of the population with long-term conditions and a higher correlation between long-term health conditions and disabilities and inactivity, as well as trends by characteristics like age, gender, and level of educational attainment. It concludes by relating NHS wait times to trends in inactivity, showing that reduced access to public healthcare may be linked to greater inactivity due to poor health.
Summary
The economic inactivity rate represents the proportion of the population that is not in work and is not ready to start work in the near future. While some types of inactivity are not causes for concern, like being in further education, others like poor health may reflect barriers to participation in paid work.
Rates of inactivity in Scotland and the rest of the UK both trended downwards from 2001 to about 2015, when Scotland's began to rise and the rest of the UK's continued to fall. When the UK's overall rate of inactivity rose during the pandemic, research focused on the potential roles of Long Covid and early retirement prompted by disillusionment with work. However, Scotland's inactivity rate actually fell during the pandemic, starting to rise again in 2023.
Scotland's recent trend in inactivity has therefore been very different from the UK, likely reflecting different underlying drivers. One potential reason for this divergence is differences in population health and health inequalities. This report therefore explores labour market survey data and NHS wait times data to understand the relationship between health and inactivity in Scotland.
This report starts by comparing Scotland to the rest of the UK on a number of measures, including rates of inactivity attributed to poor health, prevalence of limiting long-term illnesses (LLTIs), and correlations between LLTIs and inactivity. It then explores variation in health and inactivity within Scotland by area, age, gender, and level of education. Finally, the report summarises the relationship between healthcare access (proxied by A&E wait times) and inactivity, distinguishing between the overall trend from 2012-2022 and the pre-pandemic period. The briefing concludes with a discussion of key policy considerations.
Key findings include:
Poor health explains a larger proportion of economic inactivity in Scotland than in the rest of the UK, reflecting both a higher proportion of the population with long-term conditions or disabilities and a higher correlation between long-term conditions or disabilities and inactivity.
A higher proportion of economic inactivity is attributed to permanent ill health or disability by men over 24 than by women in Scotland. However, this reason has trended downward for men over 24 since 2001, but increased for women of all ages in the last five years.
NHS wait times for A&E services are leading indicators of healthcare access. Rates of A&E attendances not meeting the four-hour statutory target have increased sharply since the start of the pandemic in many health boards, indicating reduced healthcare access in these areas.
Reduced healthcare access in the preceding year is correlated with a higher probability of individuals reporting long-term health conditions or disabilities and economic inactivity due to poor health or disability even when controlling for factors like age, gender, education, and number of children in the household.
The briefing describes several key considerations for research and policy. These include:
UK-wide research on inactivity may be of limited relevance in Scotland; Scotland-specific data and research are needed to fully understand the relationship.
To fully understand the impact of policy decisions, labour market policy should consider health drivers, and health policy should consider employment outcomes.
The relevant policy levers to reduce rates of inactivity and inactivity due to poor health or disability may also differ depending on the targeted group (e.g., different age groups).
The report concludes by laying out some key questions for further research on this topic. These questions include:
How do health policy changes affect inactivity or other employment outcomes?
What types of health policy changes have the largest impact on inactivity or other employment outcomes?
What types of employability services would best support people not working due to poor health into work?
What impact might an increase in rates of poor health have on demand for other services (e.g., social care) and on the Scottish Government's fiscal position?
Introduction
What is economic inactivity?
The economic inactivity rate measures how much of the population is not in work and is not ready to start work in the near future.
The inactivity rate is typically calculated within the working-age population (aged 16-64) and is used by economists as an indicator of the state of the labour market.
Inactivity is distinct from unemployment. Unemployed people are those who are not in work, but who have actively sought work within the last four weeks and are ready to start working in the next two weeks. Unemployment also includes people who have found a job and will start in the next two weeks.
Unemployment measures the proportion of the working-age population that is looking and ready for work, whereas inactivity measures the proportion that are not immediate candidates to move back into work.
Some inactivity is expected. For instance, students over the age of 16 are considered inactive, but it is generally agreed that education is a "good" reason not to be in the labour market. Other reasons include early retirement and providing care for family members.
Some types of inactivity may indicate barriers to the labour market that prevent people from engaging in paid work, like long-term sickness or disability.
Long-term sickness was the most frequently reported reason for inactivity by both men and women of working age in Scotland for the year to June 2023.
Reasons for economic inactivity in Scotland for working age people (aged 16-64) by gender. The category for discouraged workers is omitted due to the small sample size (<10 respondents). The categories for "long-term sick" and "temporary sick" include both illness and disability.
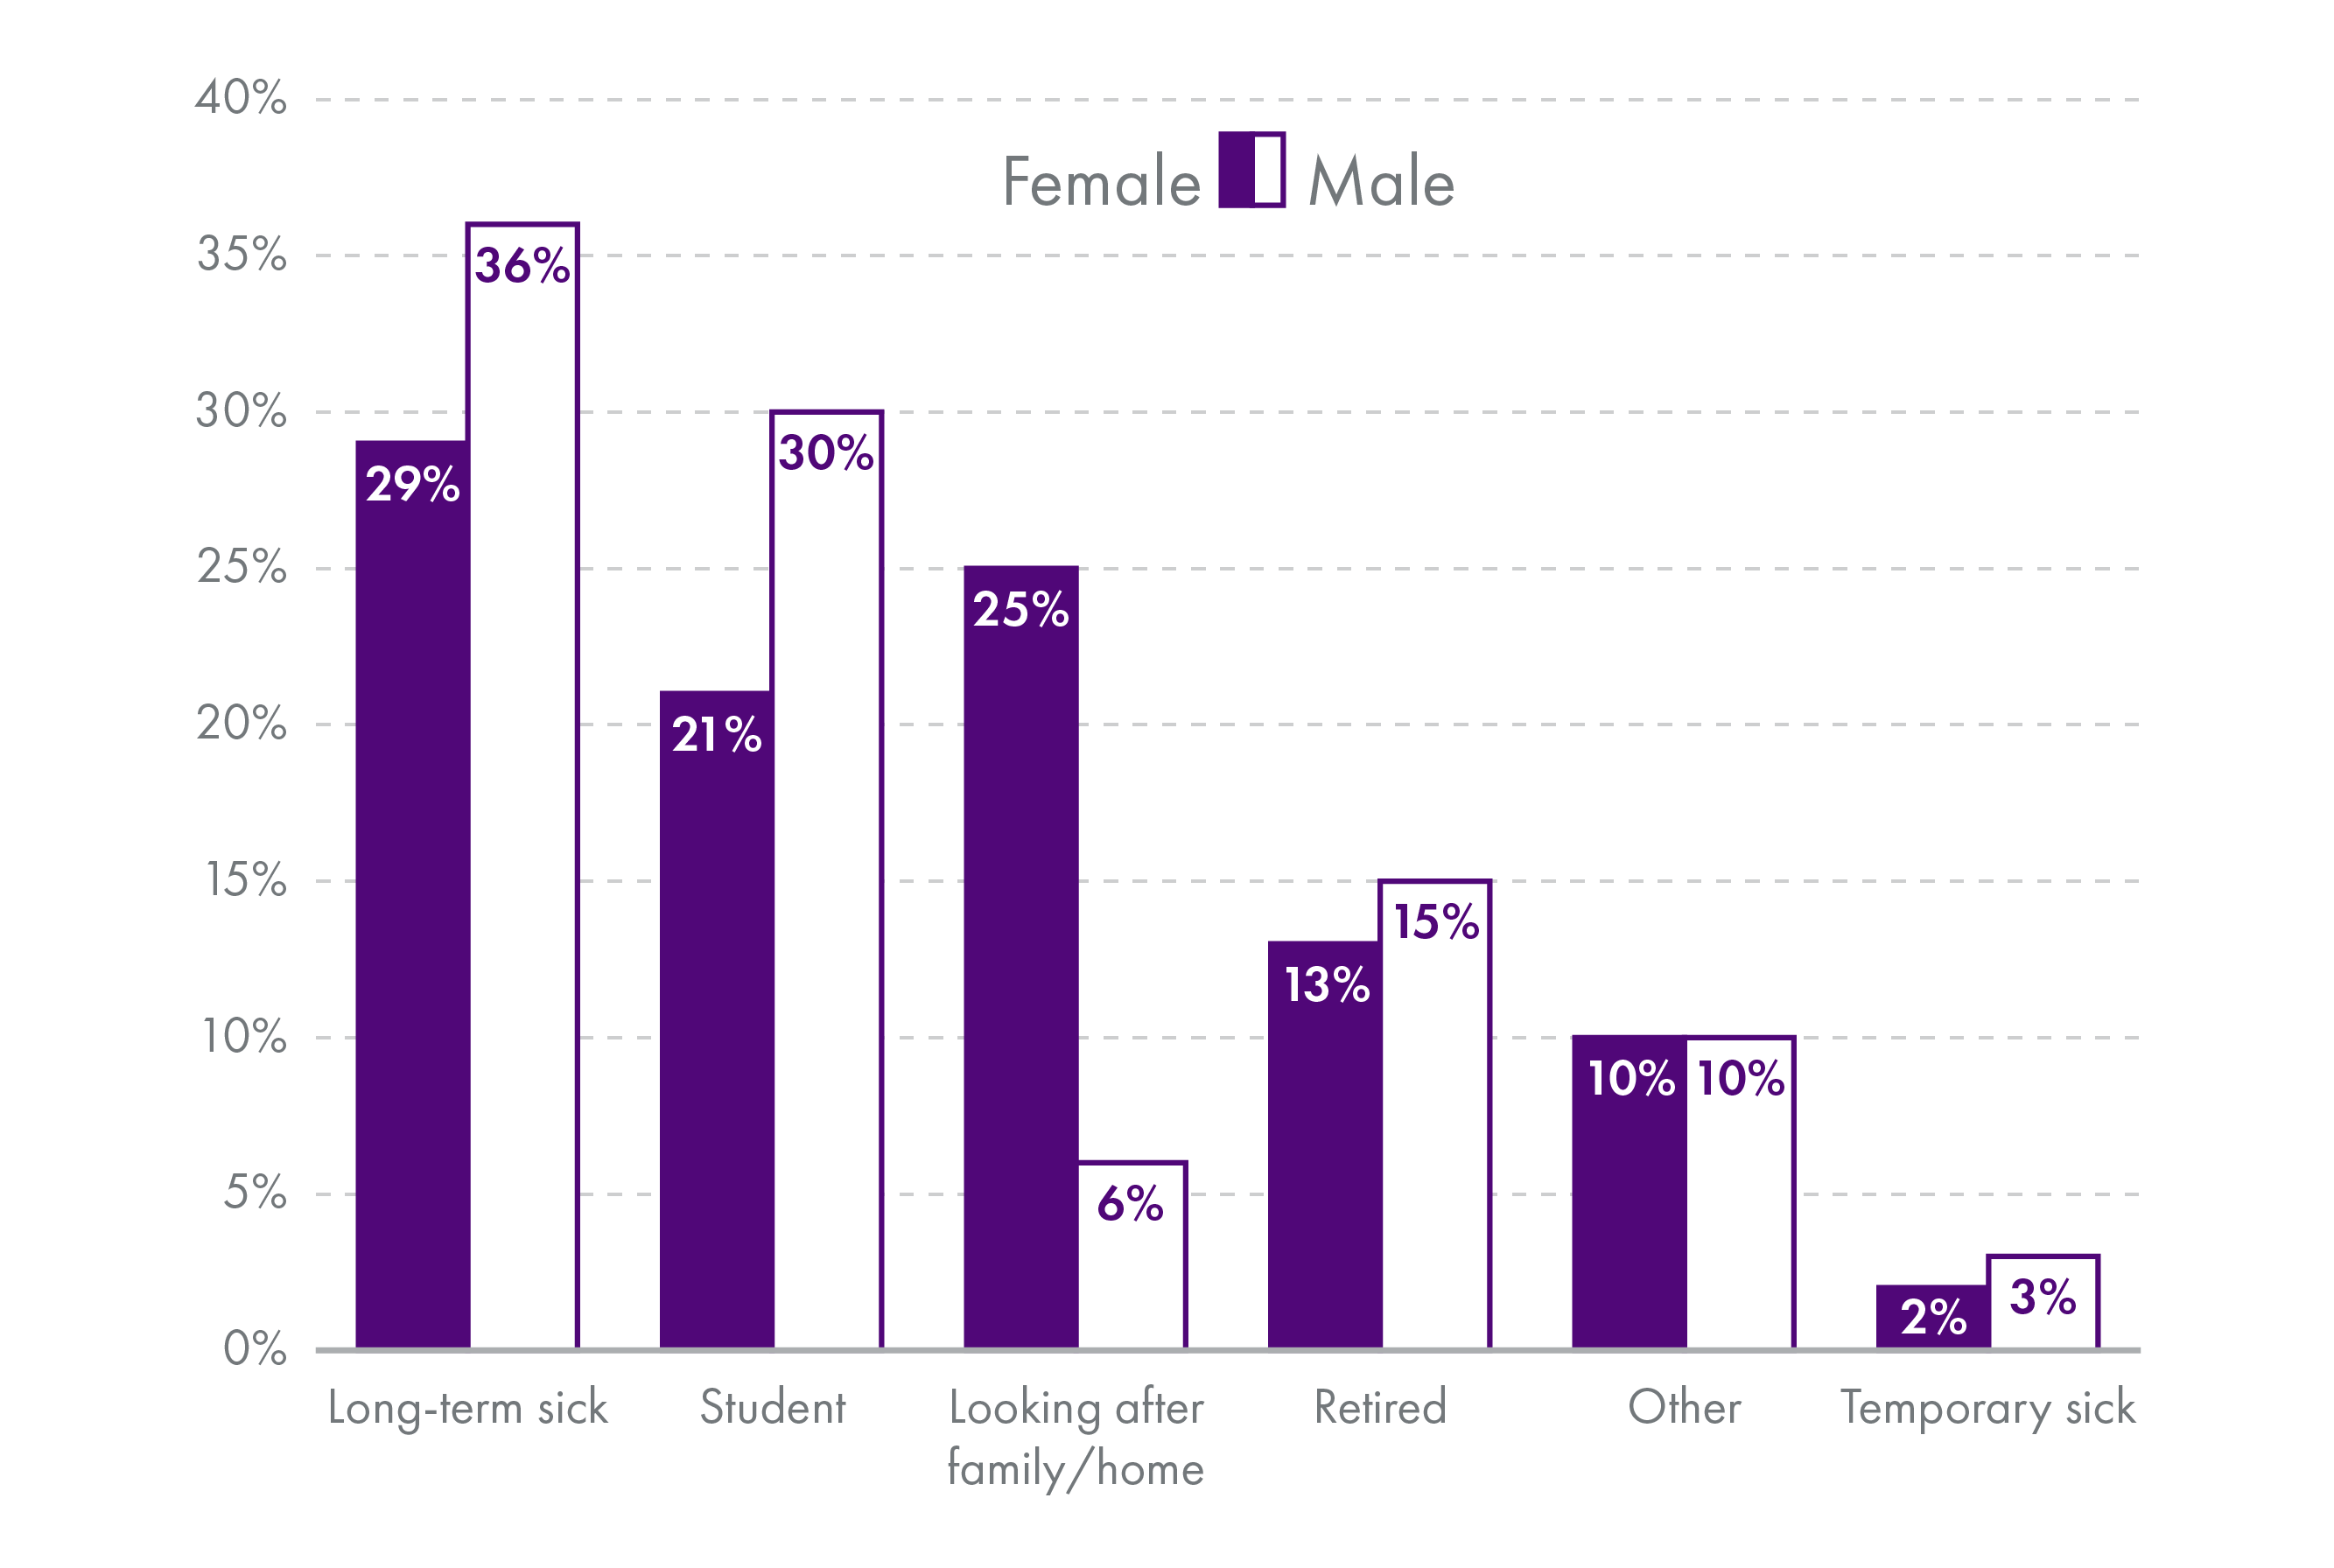
Annual Population Survey, year to June 2023. Accessed through Nomis.
Those not in work may suffer ill effects from being on low incomes1, such as poorer outcomes for children, poorer health, higher stress, and greater time poverty. Inactive people may also require more from the government in the form of benefits and other support. At the same time, they do not form part of the income tax base.
Additionally, inactivity may do longer-term damage to young people's employment trajectories than unemployment2, making reductions in inactivity an important means of preventing disengagement from the labour market.
Higher rates of inactivity due to ill health or disability may contribute to the growing gap between rates of disability benefit applications in Scotland compared to the rest of the UK 3. At the same time, inactivity reduces the working-age tax base 4. These effects create a dual challenge for Scotland's fiscal sustainability.
UK and Scottish inactivity
Concerns about the effects of the pandemic on the UK labour market have focused on rising economic inactivity. However, Scotland's pattern of inactivity differs from the rest of the UK. At the end of 2015, economic inactivity in Scotland increased, diverging from the decreasing trend across the rest of the UK (rUK).
Rates of economic inactivity for working-age adults (16-64) in Scotland and the rest of the UK (rUK) from 2001 Q1 to 2023 Q4. Quarterly rates are smoothed using a rolling average across four quarters and thus differ from official statistics.
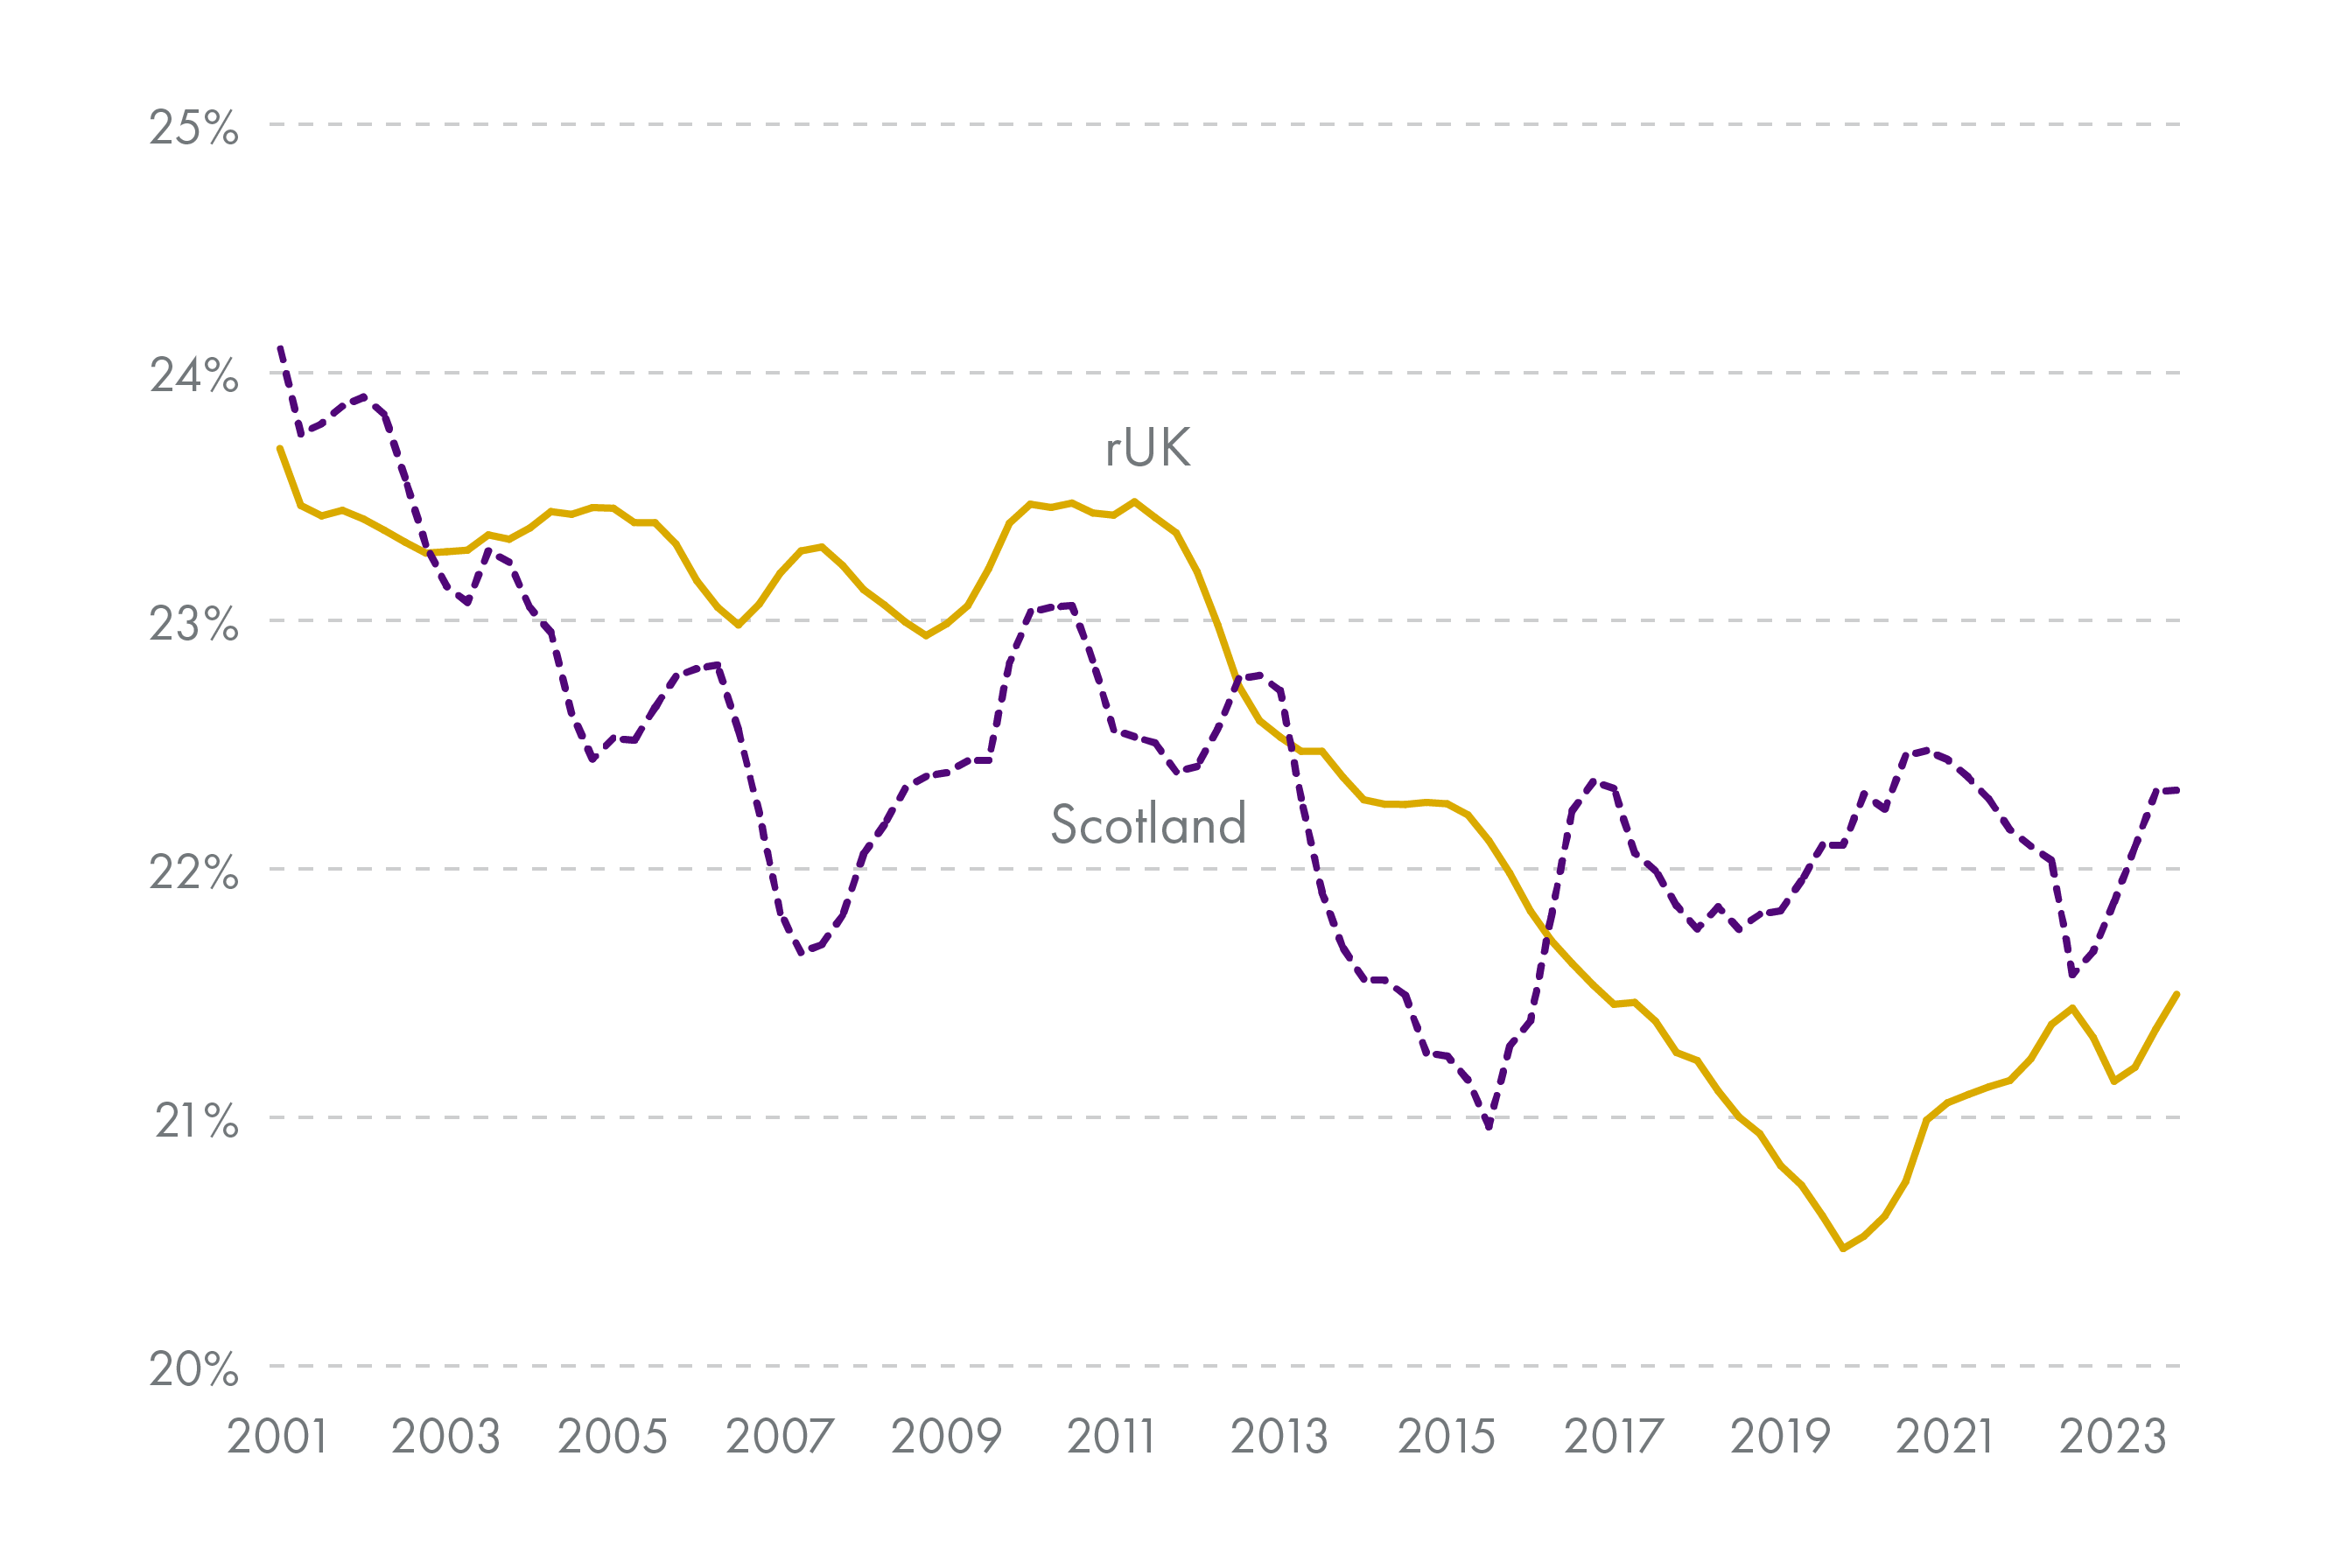
Quarterly Labour Force Survey, 2001-2023. Accessed through the UK Data Service.
Furthermore, rates of inactivity due to ill health or disability have been persistently higher in Scotland than in rUK over the last twenty years.
Percent of inactivity attributed to permanent ill health or disability, working-age adults, Scotland and the rest of the UK (rUK), 2001 Q1 - 2023 Q4. Rates are smoothed using a rolling average across four quarters.
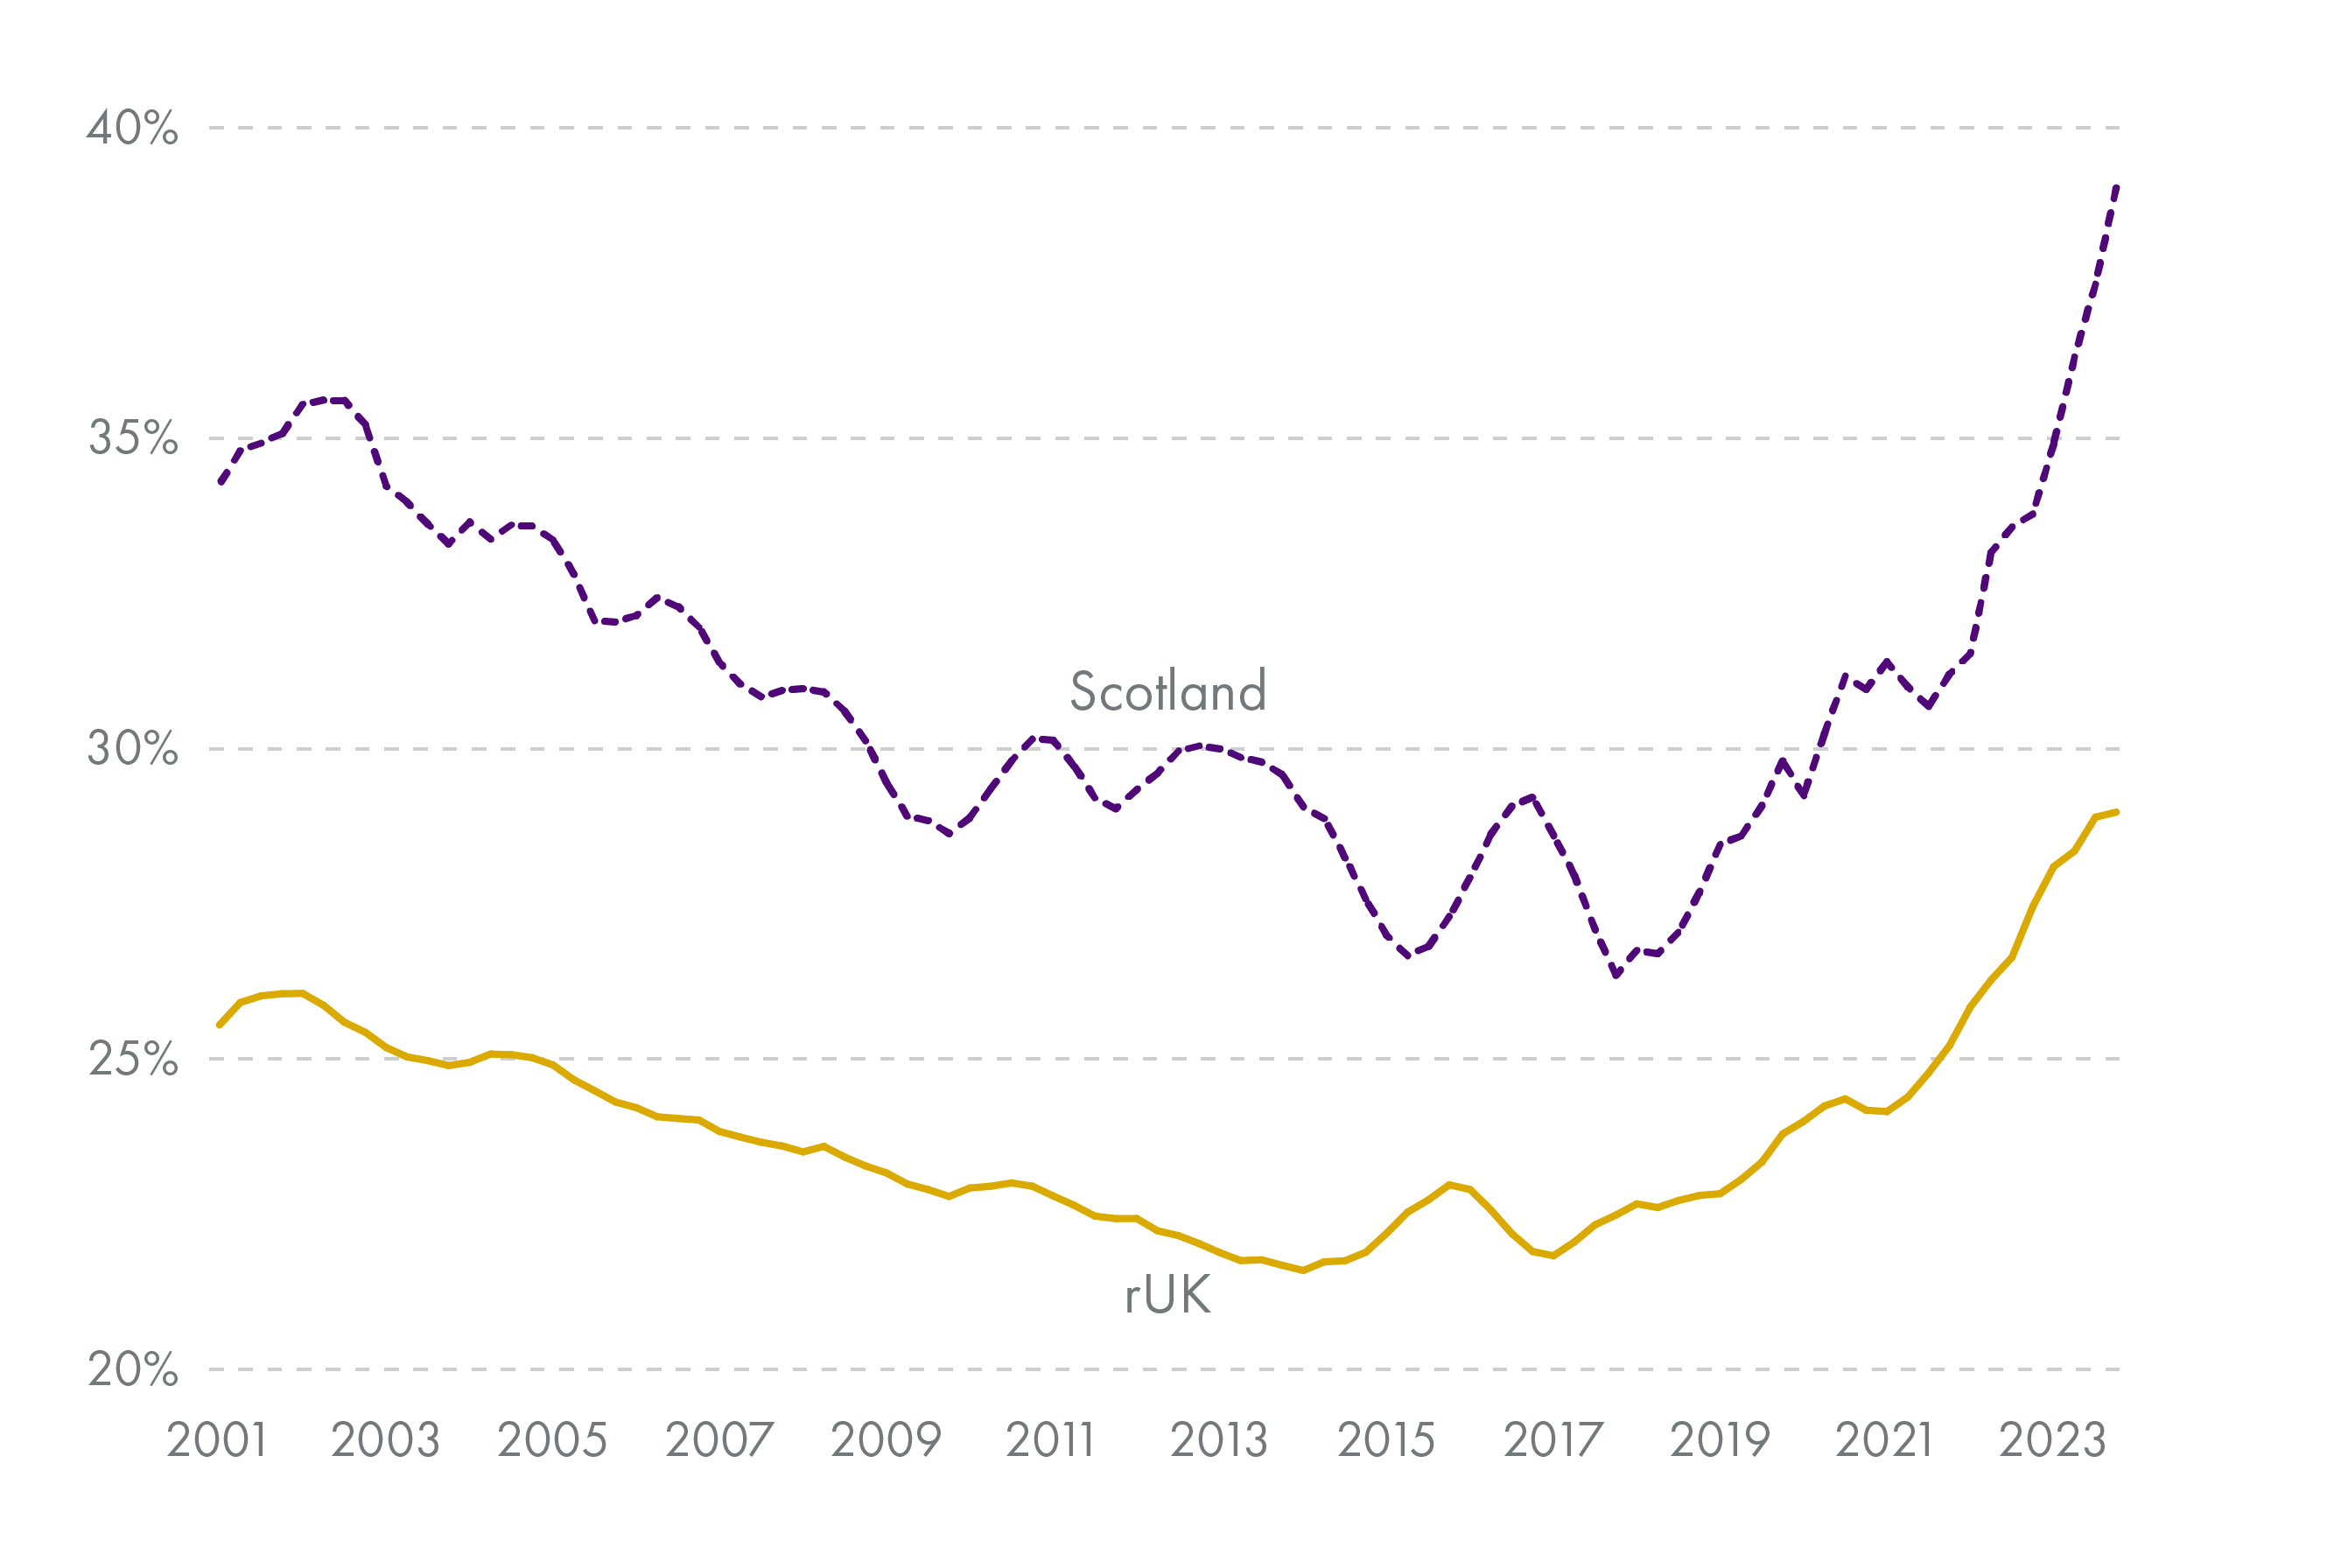
Quarterly Labour Force Survey, 2001-2023. Accessed through the UK Data Service.
Previous research1 has shown that:
Both men and women in Scotland are more likely to report ill health or disability as the cause of their inactivity than in rUK.
The gap in rates of ill health as the main cause of inactivity between Scotland and rUK has increased over the last 5+ years for both men and women.
Research has been conducted on UK inactivity rates and the impact of health and the Covid-19 pandemic. However, the story emerging from this research differs widely in Scotland compared to the rest of the UK.
UK research suggests that temporarily higher inactivity post-pandemic is explained by higher rates of retirement, not ill health or disability2. However, differing trends in Scottish inactivity and persistently higher rates of inactivity due to ill health or disability suggest that Scottish inactivity may be linked to worse health inequalities in Scotland. Furthermore, trends in inactivity in Scotland are likely to be longer-term issues rather than an acute problem caused by the Covid-19 pandemic.
This briefing presents evidence on:
health-related drivers of inactivity in Scotland compared to rUK
the contribution of ill health or disability and health inequality to rates of inactivity in Scotland
the relationship between healthcare access, population health and disability, and inactivity rates in Scotland
The briefing concludes with implications for health and labour market policy.
This work contains statistical data from ONS which is Crown Copyright. The use of the ONS statistical data in this work does not imply the endorsement of the ONS in relation to the interpretation or analysis of the statistical data. This work uses research datasets which may not exactly reproduce National Statistics aggregates. Part of this analysis was carried out in the Secure Research Service, which is part of the Office for National Statistics.
Evidence on health and inactivity
General evidence
There is a variety of evidence on the relationship between health and employment status. Some offer only associative evidence, which cannot conclude that ill health causes inactivity. Other studies use methods that show causality between the two.
A substantial body of work documents a significant association between poor health and inactivity in the UK 123. The same holds for other countries 45678.
Disability is also correlated with a higher probability of inactivity, both in the UK and in other countries 9.
Other studies show that individual poor health causes a higher probability of becoming inactive 1011. There is also evidence that the effect is larger for men 1113.
This relationship holds true (and may be greater) for older workers 141516. A larger effect of an adverse health event on inactivity for older workers may be driven by preferences for labour market exit combined with lower productivity due to ill health.
These incentives may also interact with more opportunities to take up disability benefits upon exit from the labour market 1718. For instance, one UK study found that capping welfare payments in 2016 shifted individuals from unemployment to inactivity, both due to adverse mental health impacts and because disability benefits were not subject to the cap 19.
In Scotland, ill health is associated with higher inactivity and unemployment, as well as with low educational attainment and living in a disadvantaged area 20.
Although ill health is more prevalent among the inactive population than in the rest of the population, unemployed and inactive people are not systematically unhealthier (measured by mortality) than the employed in Scotland when other factors are controlled for 21. That is, when compared to people with the same social class, marital status, ethnicity, and level of deprivation, people who were unemployed or inactive in the 1991 UK Census had no higher mortality than working people by 2001. Thus, both poor health and inactivity may have another common cause.
Much of the existing research focuses on either the UK as a whole or England (and sometimes Wales) specifically. Very few studies focus exclusively on Scotland, or indeed include regional analysis within the UK.
Inactivity following the Covid-19 pandemic
Several studies suggest that rising ill health before and during the pandemic has driven rising inactivity rates 12. One estimate finds that at least 0.6% of the UK working-age population is now at risk of a limiting long-term illness (LLTI) from Long Covid 2.
However, several pieces of research show that increases in ill health due to the pandemic are unlikely to have caused documented changes in inactivity rates.
Using UK data, Boileau and Cribb 4 and Cribb 5 find that most people newly reporting inactivity due to ill health or disability had previously reported inactivity for other reasons. They also find that early retirement better explains rising inactivity among those 50-64. Similarly, Phoenix 6 finds that financial security and changed attitudes to work post-pandemic are more likely to drive trends in inactivity and early retirement than the rise in ill health.
Furthermore, Long Covid is unlikely to be the cause of rising inactivity due to ill health in Scotland, while mental health issues are increasingly important for explaining this trend 7.
Trends in health and inactivity
General trends
Health is generally worse among the working-age population in Scotland compared to the rest of the UK. For example, 39.2% of working-age people in Scotland had a long-term illness in 2023, compared to 35.8% of the same population in rUK(based on author calculations from the ONS' Annual Population Survey 2023).
Having a long-term physical or mental health condition or illness is correlated with inactivity in both Scotland and rUK, but the relationship is stronger in Scotland.
Correlations between long-term illness or disability, limiting long-term illness (LLTIs), and economic inactivity, Scotland and the rest of the UK (rUK), from 2004-2023. Correlations are calculated at the individual level for respondents aged 16-64.
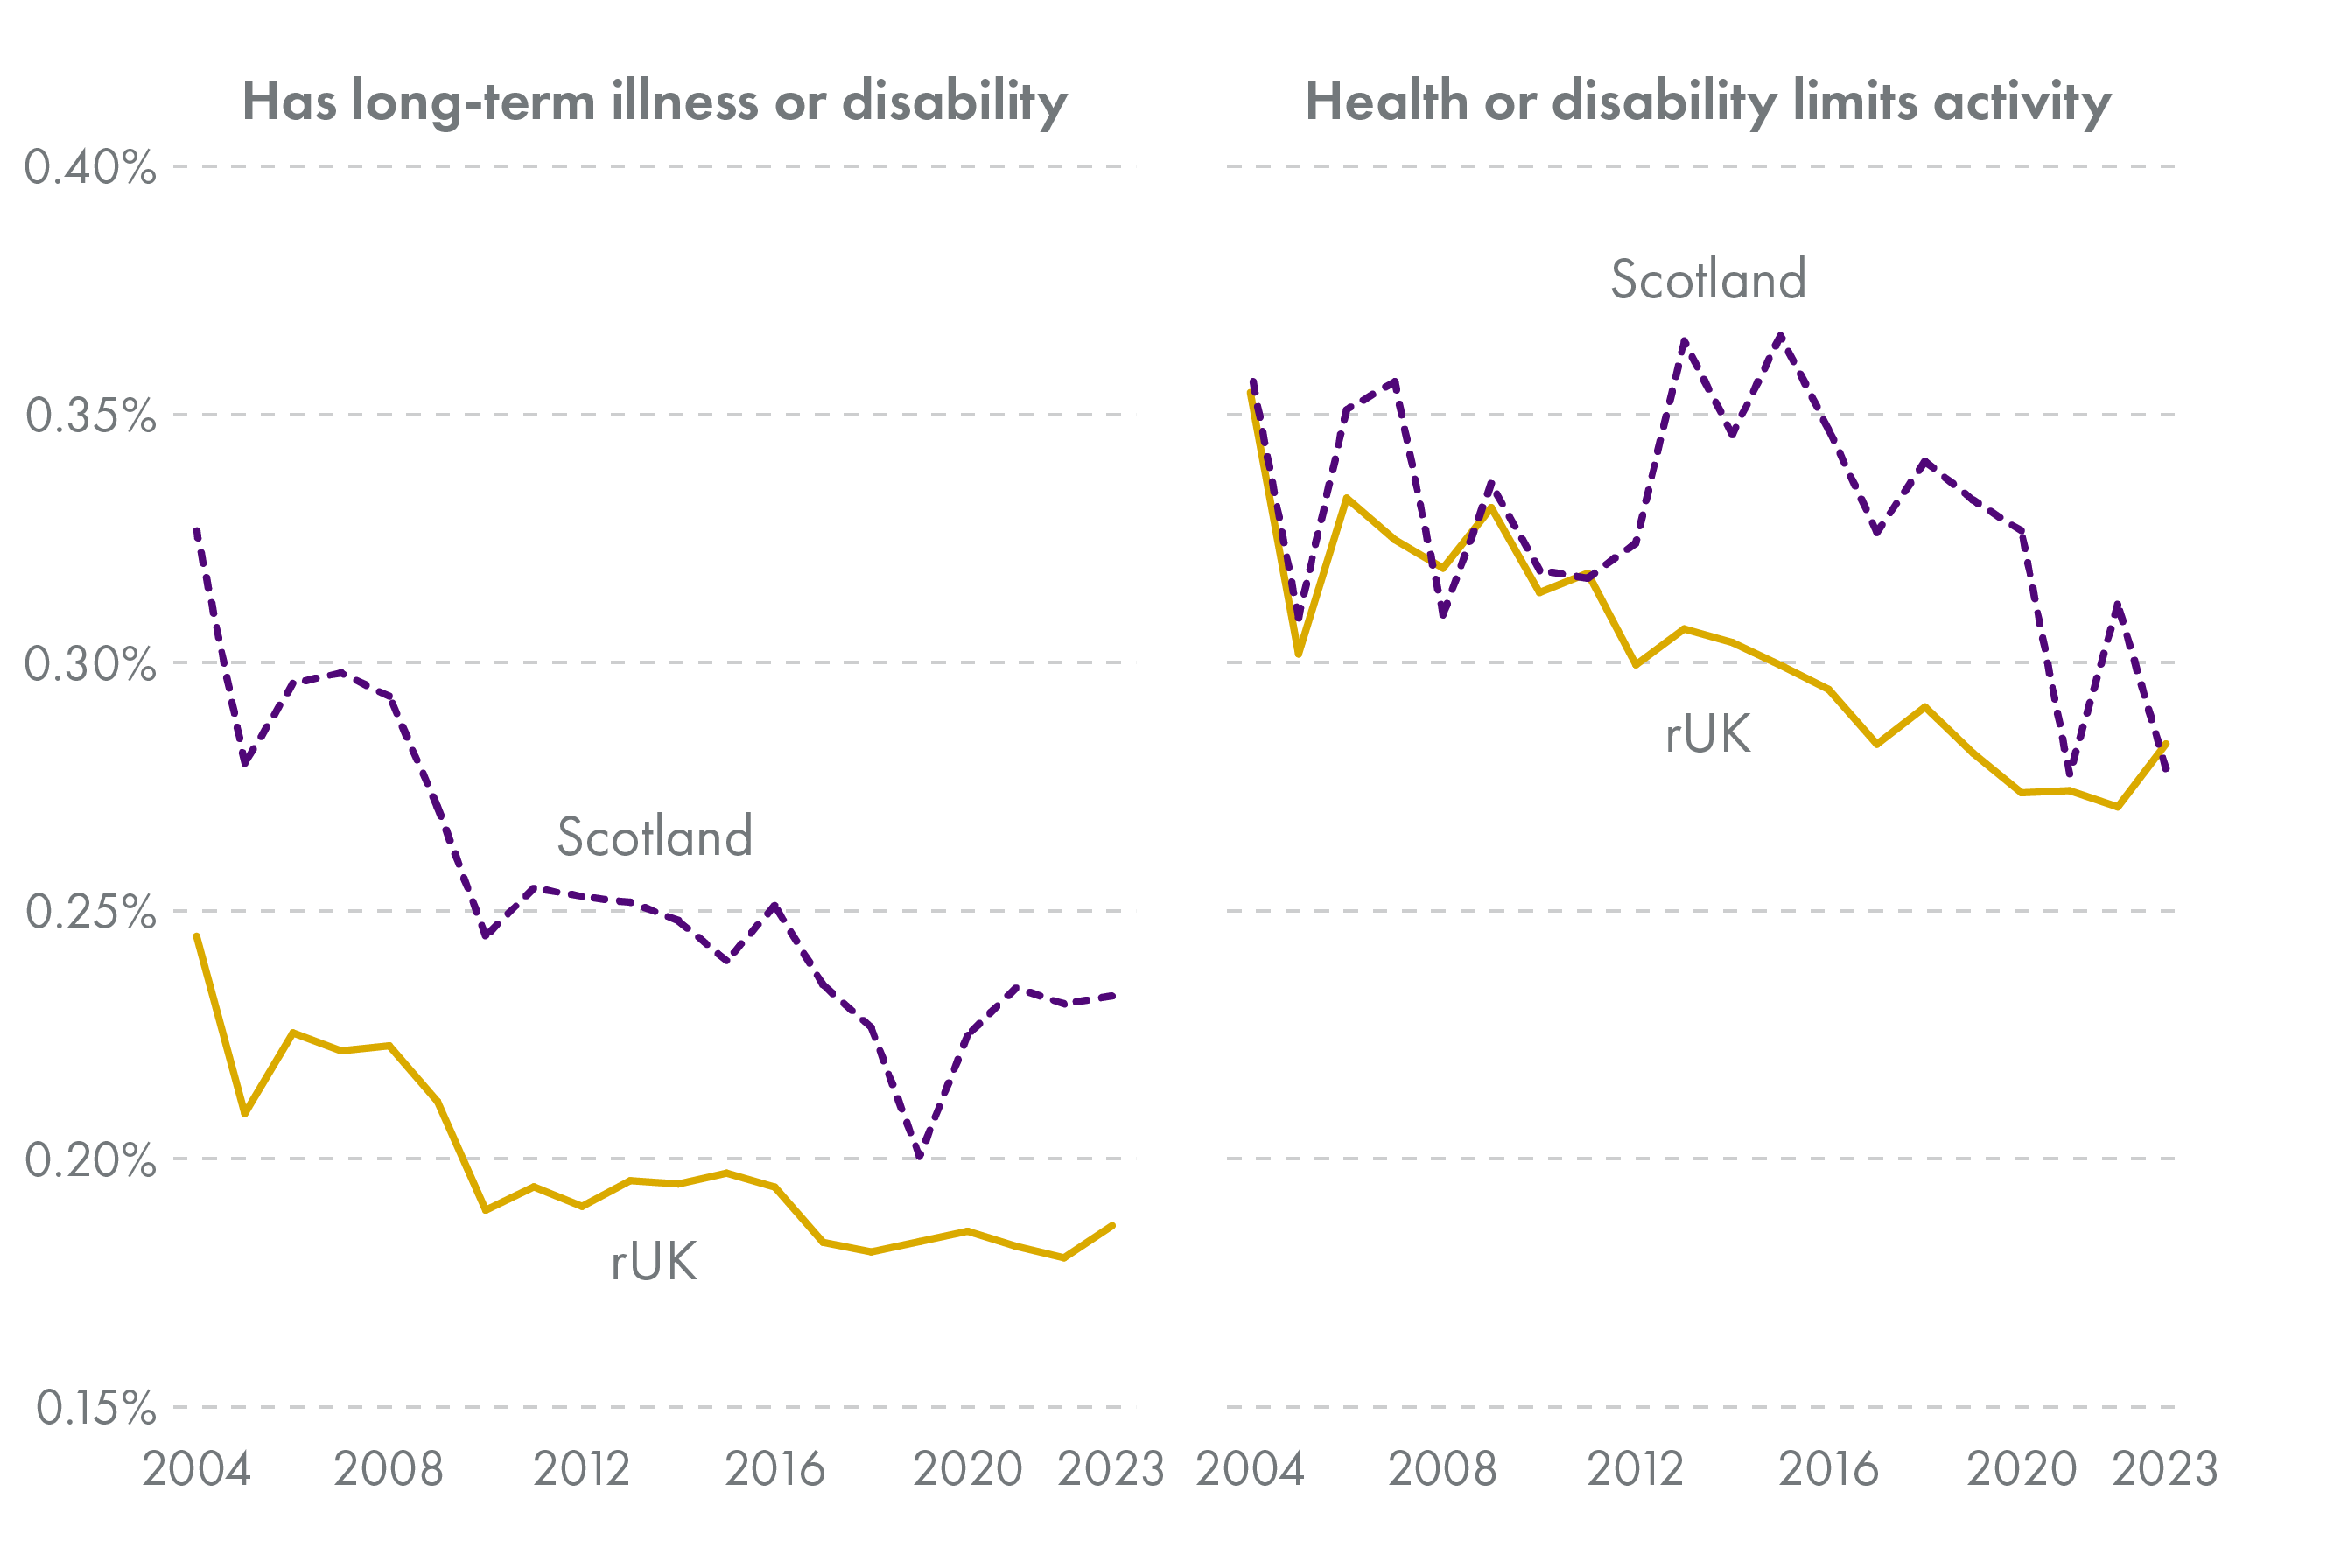
Annual Population Survey, 2004-2023. Accessed through the UK Data Service.
In the UK Labour Force Survey (LFS) and the associated Annual Population Survey (APS), respondents are asked whether or not they have a physical or mental health condition lasting (or expected to last) over a year. If so, they are asked whether it limits their activities "not at all", "a little", or "a lot". Respondents are considered disabled according to the Equality Act definition if their activities are limited in any way. This definition of disability is essentially the same as that used to define limiting long-term illnesses (LLTIs) in the Scottish Health Survey. For consistency, this briefing refers to LLTIs throughout, but it is important to note that in these data LLTIs are synonymous with the Equality Act definition of disability.
The correlation between having a limiting long-term illness (LLTI) and being inactive has fallen over time, but remains consistently higher in Scotland than in rUK.
Thus the health component of differences in inactivity trends between Scotland and rUK likely come from both:
A higher proportion of the population with LLTIs, and
Those with LLTIs being more likely to be inactive.
In addition to differences from rUK, poor health is concentrated in specific areas of Scotland.
Rates of long-term limiting illness among adults 16+ across Scottish local authorities in 2018/22. Estimates are averaged over a multi-year reporting period to ensure a large enough sample for accuracy. The sample does not capture those living in institutions, and thus these statistics may underestimate the prevalence of LLTIs.
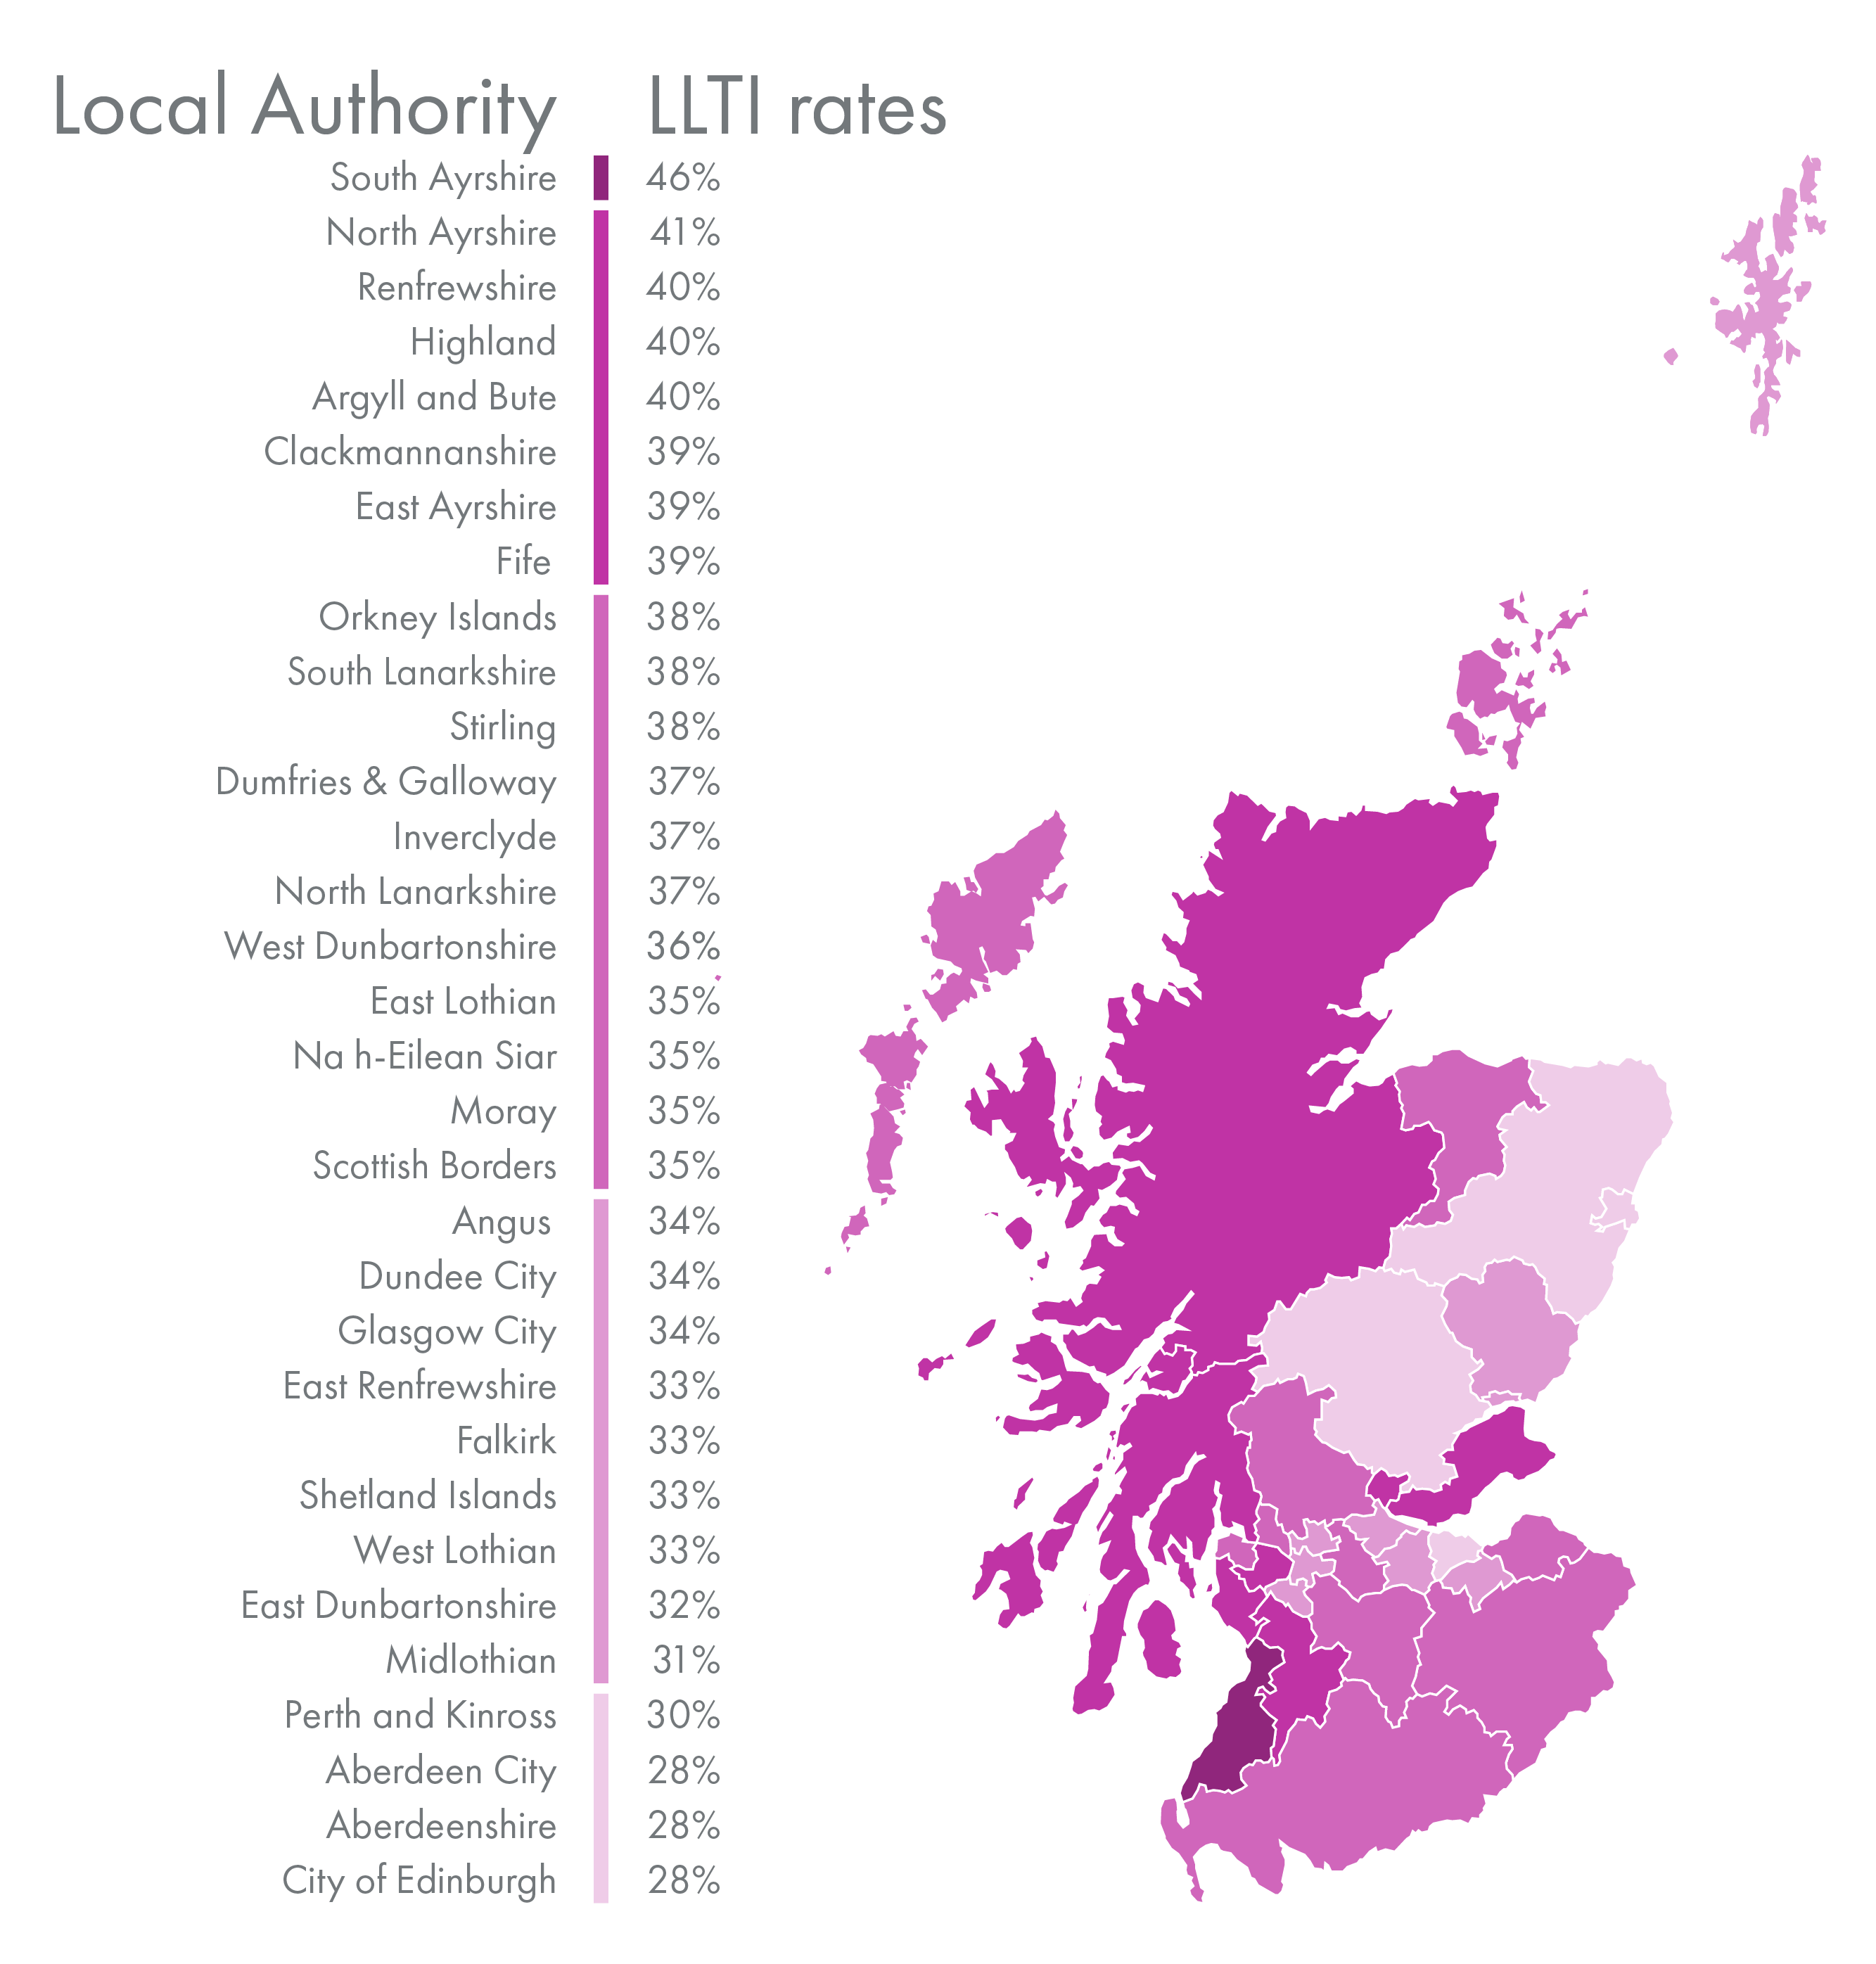
Scottish Health Survey, 2018/22. Accessed through Scottish Government.
In health data from 2018-2022 (excluding responses from 2020, as they are not directly comparable with previous years), South Ayrshire had the highest rates of LLTIs among adults (46%), while Aberdeen City, Aberdeenshire, and City of Edinburgh had the lowest (28%).
The geographic distribution of LLTIs has changed over the last ten years. East Ayrshire saw the largest overall decrease in the rates of long-term illness between 2012/15 and 2018/22 (4 percentage points), while Moray, Stirling, and South Lanarkshire saw the largest increases (12, 12, and 11 percentage points, respectively).
Those with LLTIs tend to have lower employment rates than those without. This is known as an employment gap. There is significant variation in employment gaps by LLTI across health boards.
Employment gaps between those with long-term limiting illness and those without across Scottish health boards, 2021. Gaps are calculated for adults aged 16-64. Health boards for which the sample size is not sufficient to calculate employment rates for each group are shown in grey.
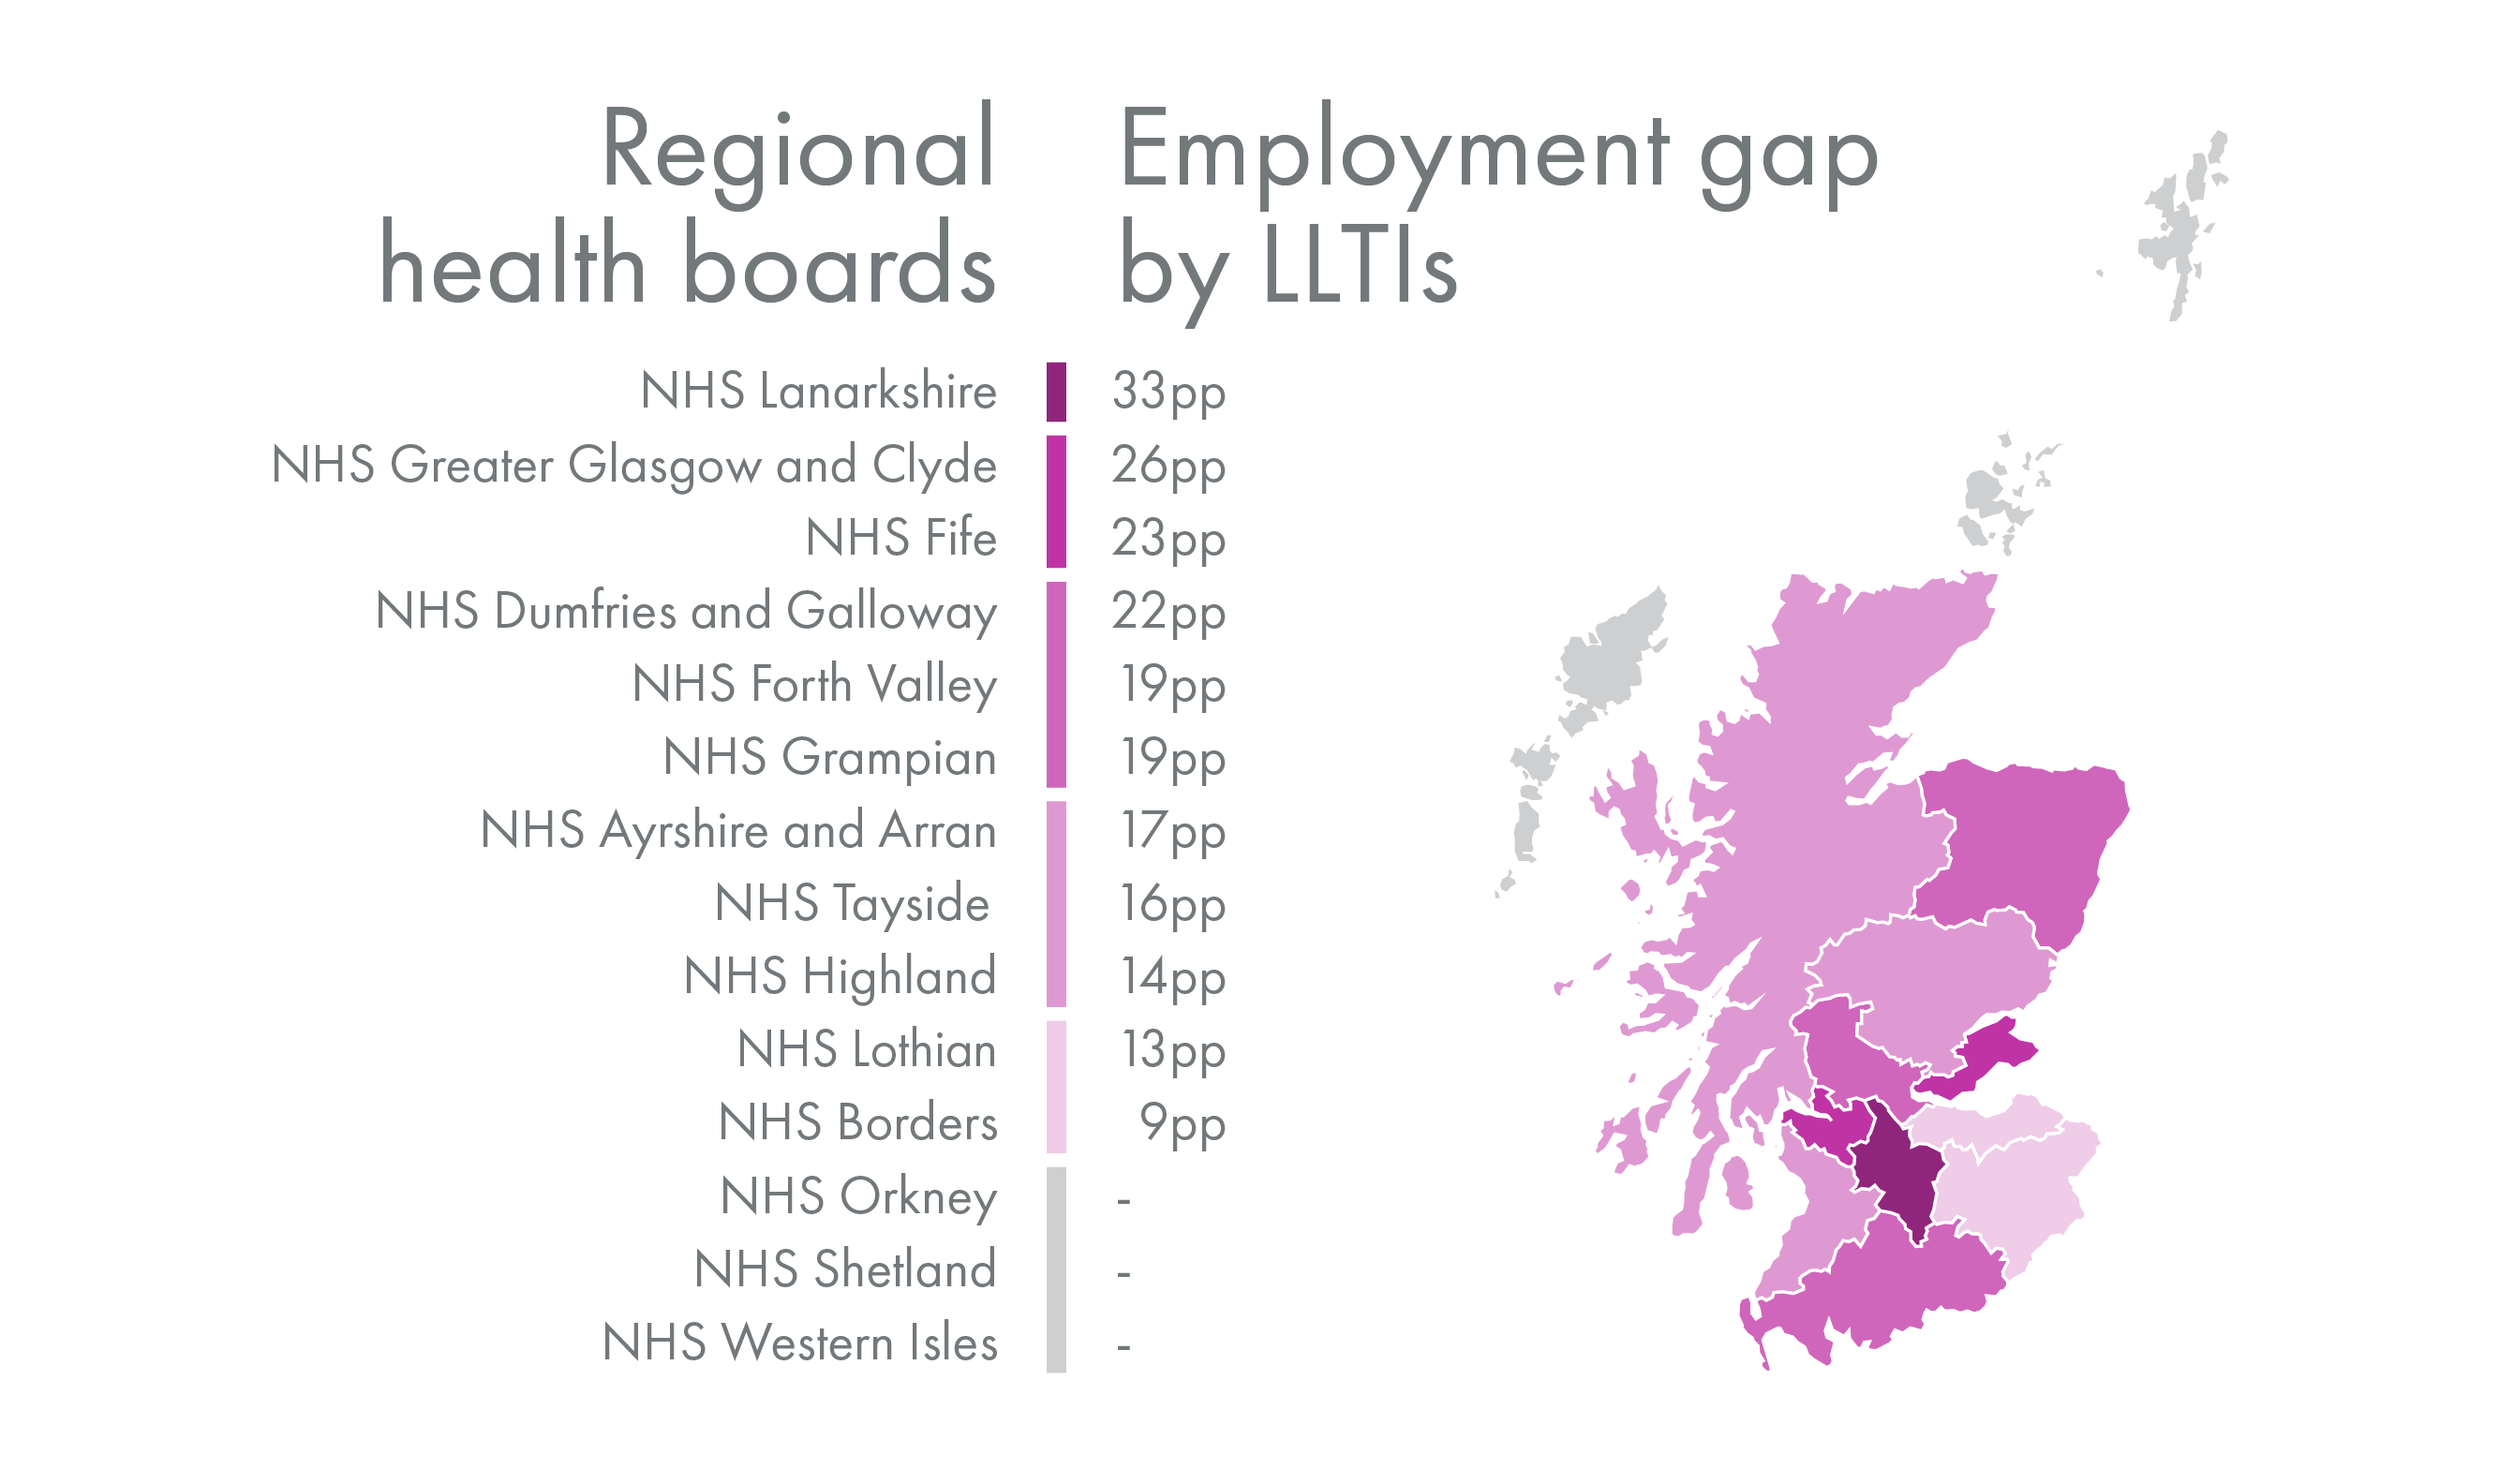
Scottish Health Survey 2021. Accessed through the UK Data Service.
Lanarkshire had the largest gap in employment by LLTI status in 2018/22 at 33 percentage points (pp), followed by Greater Glasgow and Clyde (26pp) and Fife (23pp). Of those for whom employment rates by LLTI status can be calculated, Borders had the lowest gap (9pp). Note that sample sizes for Shetland, Orkney, and Western Isles were too small to calculate reliable employment rates by LLTI status.
These statistics suggest areas in which targeted interventions may reduce barriers to the labour market for some working-age people with LLTIs. However, some of the variation may also arise from differences in types of LLTIs common in different regions.
Data limitations
The Annual Population Survey (APS) allows for examination of trends at a lower geographic level than the Labour Force Survey (LFS) due to its larger sample size. However, variables asking about specific health problems are not included in the APS. This makes it difficult to say more about which health conditions are prevalent in specific areas of Scotland and how this has changed over time.
The Scottish Health Survey offers more detailed cross-sectional data on health status, health problems, and other information, but is also limited by sample size. Regional or otherwise disaggregated analysis is therefore difficult with these data.
Factors relating to health and inactivity
Age, gender, and education
In addition to geographic trends, the relationship between poor health or disability and inactivity also differs by individual characteristics like gender and age (see chart 7). Examination of trends among different groups highlights that the inactive population is not a homogeneous group and suggests where targeted interventions might be most effective.
The percent of economic inactivity attributed to permanent ill health or disability by age group and gender among working-age adults in Scotland from 2001 Q1 to 2023 Q4. Rates are smoothed using a rolling average across four quarters.
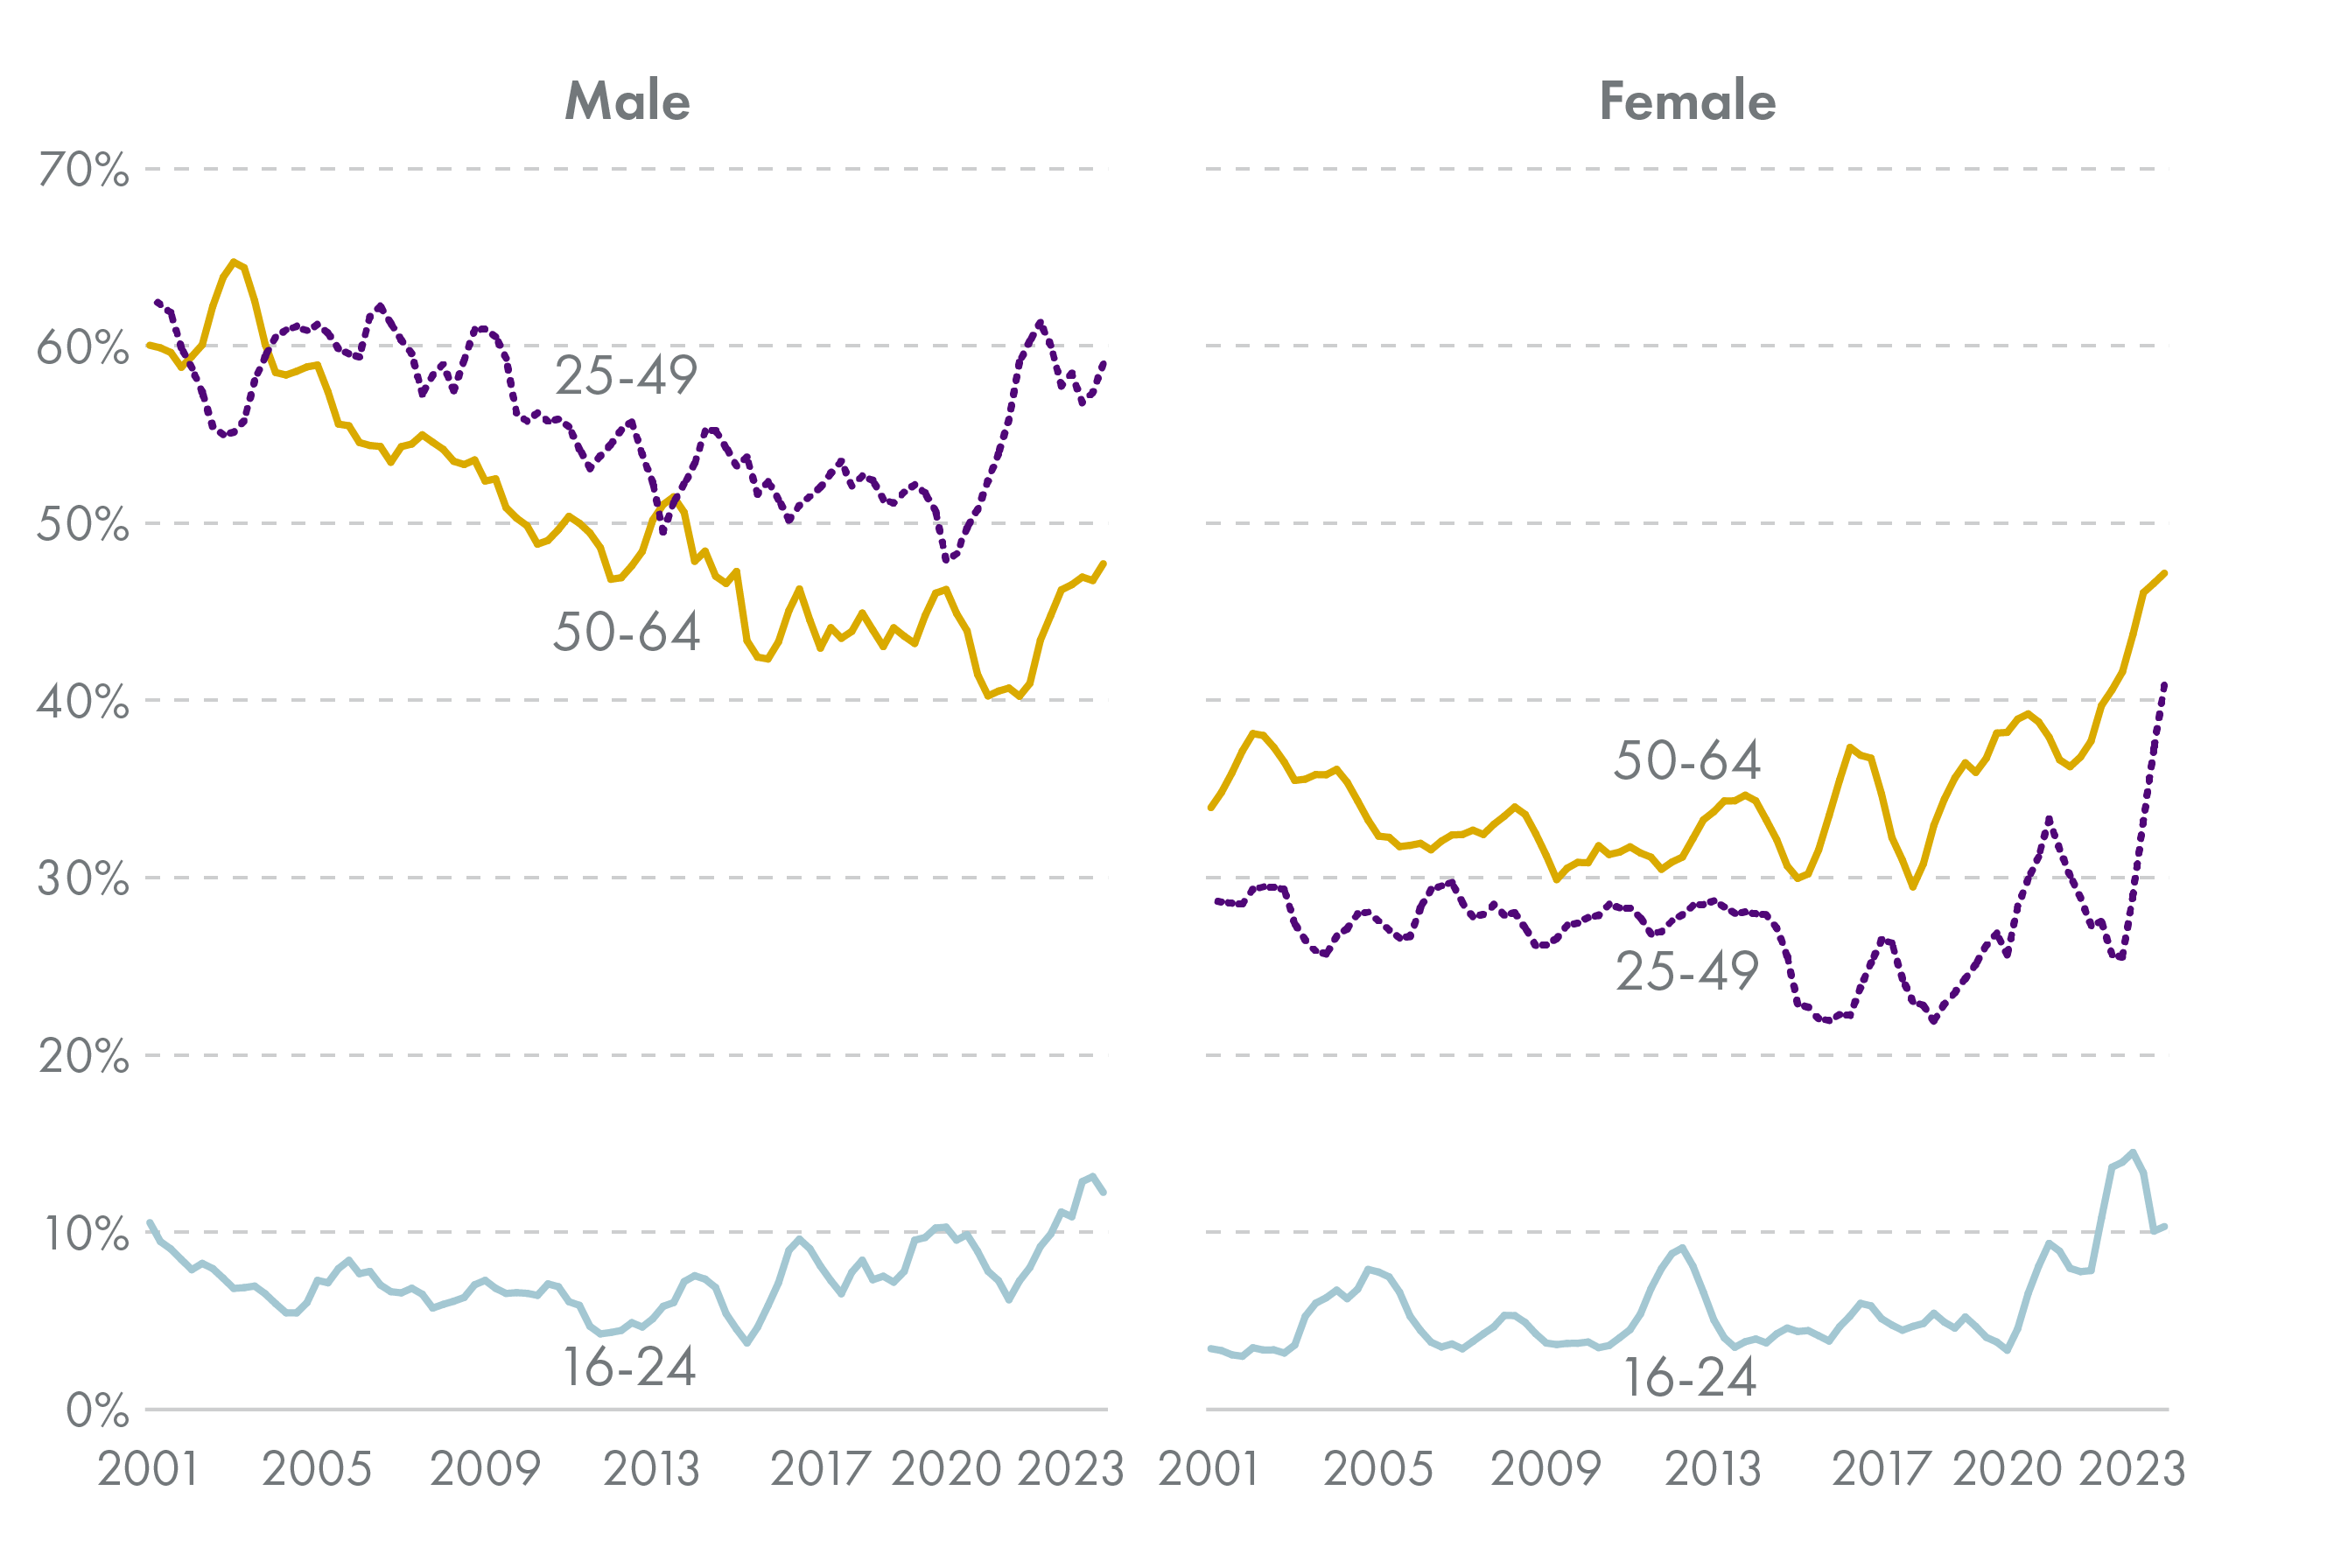
Quarterly Labour Force Survey, 2001-2023. Accessed through the UK Data Service.
Permanent illness or disability are typically cited as the reason for less than 10% of inactivity among young people (aged 15-24) although this figure has risen over the last few years.
Available statistics on changes in inactivity, health problems, and disability benefit claims shows the greatest increases for younger (16-24) and older (50-64) working-age people 1. Rates of mental health problems have risen for young people, and those with mental health problems are less likely to be employed 2.
In contrast, nearly 60% of inactivity among men 25-49 was attributed to permanent illness or disability at the end of 2023. This figure hovered around 60% in the early 2000s, then fell in the 2010s; it subsequently rose during the Covid-19 pandemic.
The percentage of inactivity due to ill health or disability for men 50-64 has remained lower than that for men 25-49, although it has trended similarly.
Inactivity due to ill health or disability has typically been lower for women than for men (explaining 20-40% of inactivity), and highest for women 50-64 compared to younger women.
While the proportion of inactivity attributed to ill health or disability spiked for women aged 25-49 during the pandemic and then fell back to pre-pandemic levels, the proportion for women aged 50-64 has risen since 2018 and is now very similar to the rate for men in the same age group (47-48%).
Although less of young people's inactivity is due to illness or disability than for those over 25, illness and disability have increasingly been cited as reasons for young people's NEET status (not in employment, education, or training).
Inactivity accounted for 54% of NEET young people in the UK in 2021, up from 41% in 2011; the increase was driven by a rise in sickness and disability 3. Rates of inactivity due to ill health compared to other reasons among young people are lower in cities than elsewhere in the UK, which may be attributable to sorting of people with more education and higher income to cities 4.
While education is not necessarily the primary driver of differences in the relationship between poor health or disability and inactivity, it may be seen as a proxy for other related factors like type of work and approximate level of income.
The percent of those inactive due to permanent poor health or disability with different levels of educational qualifications, Scotland, 2001 Q1 to 2023 Q4.
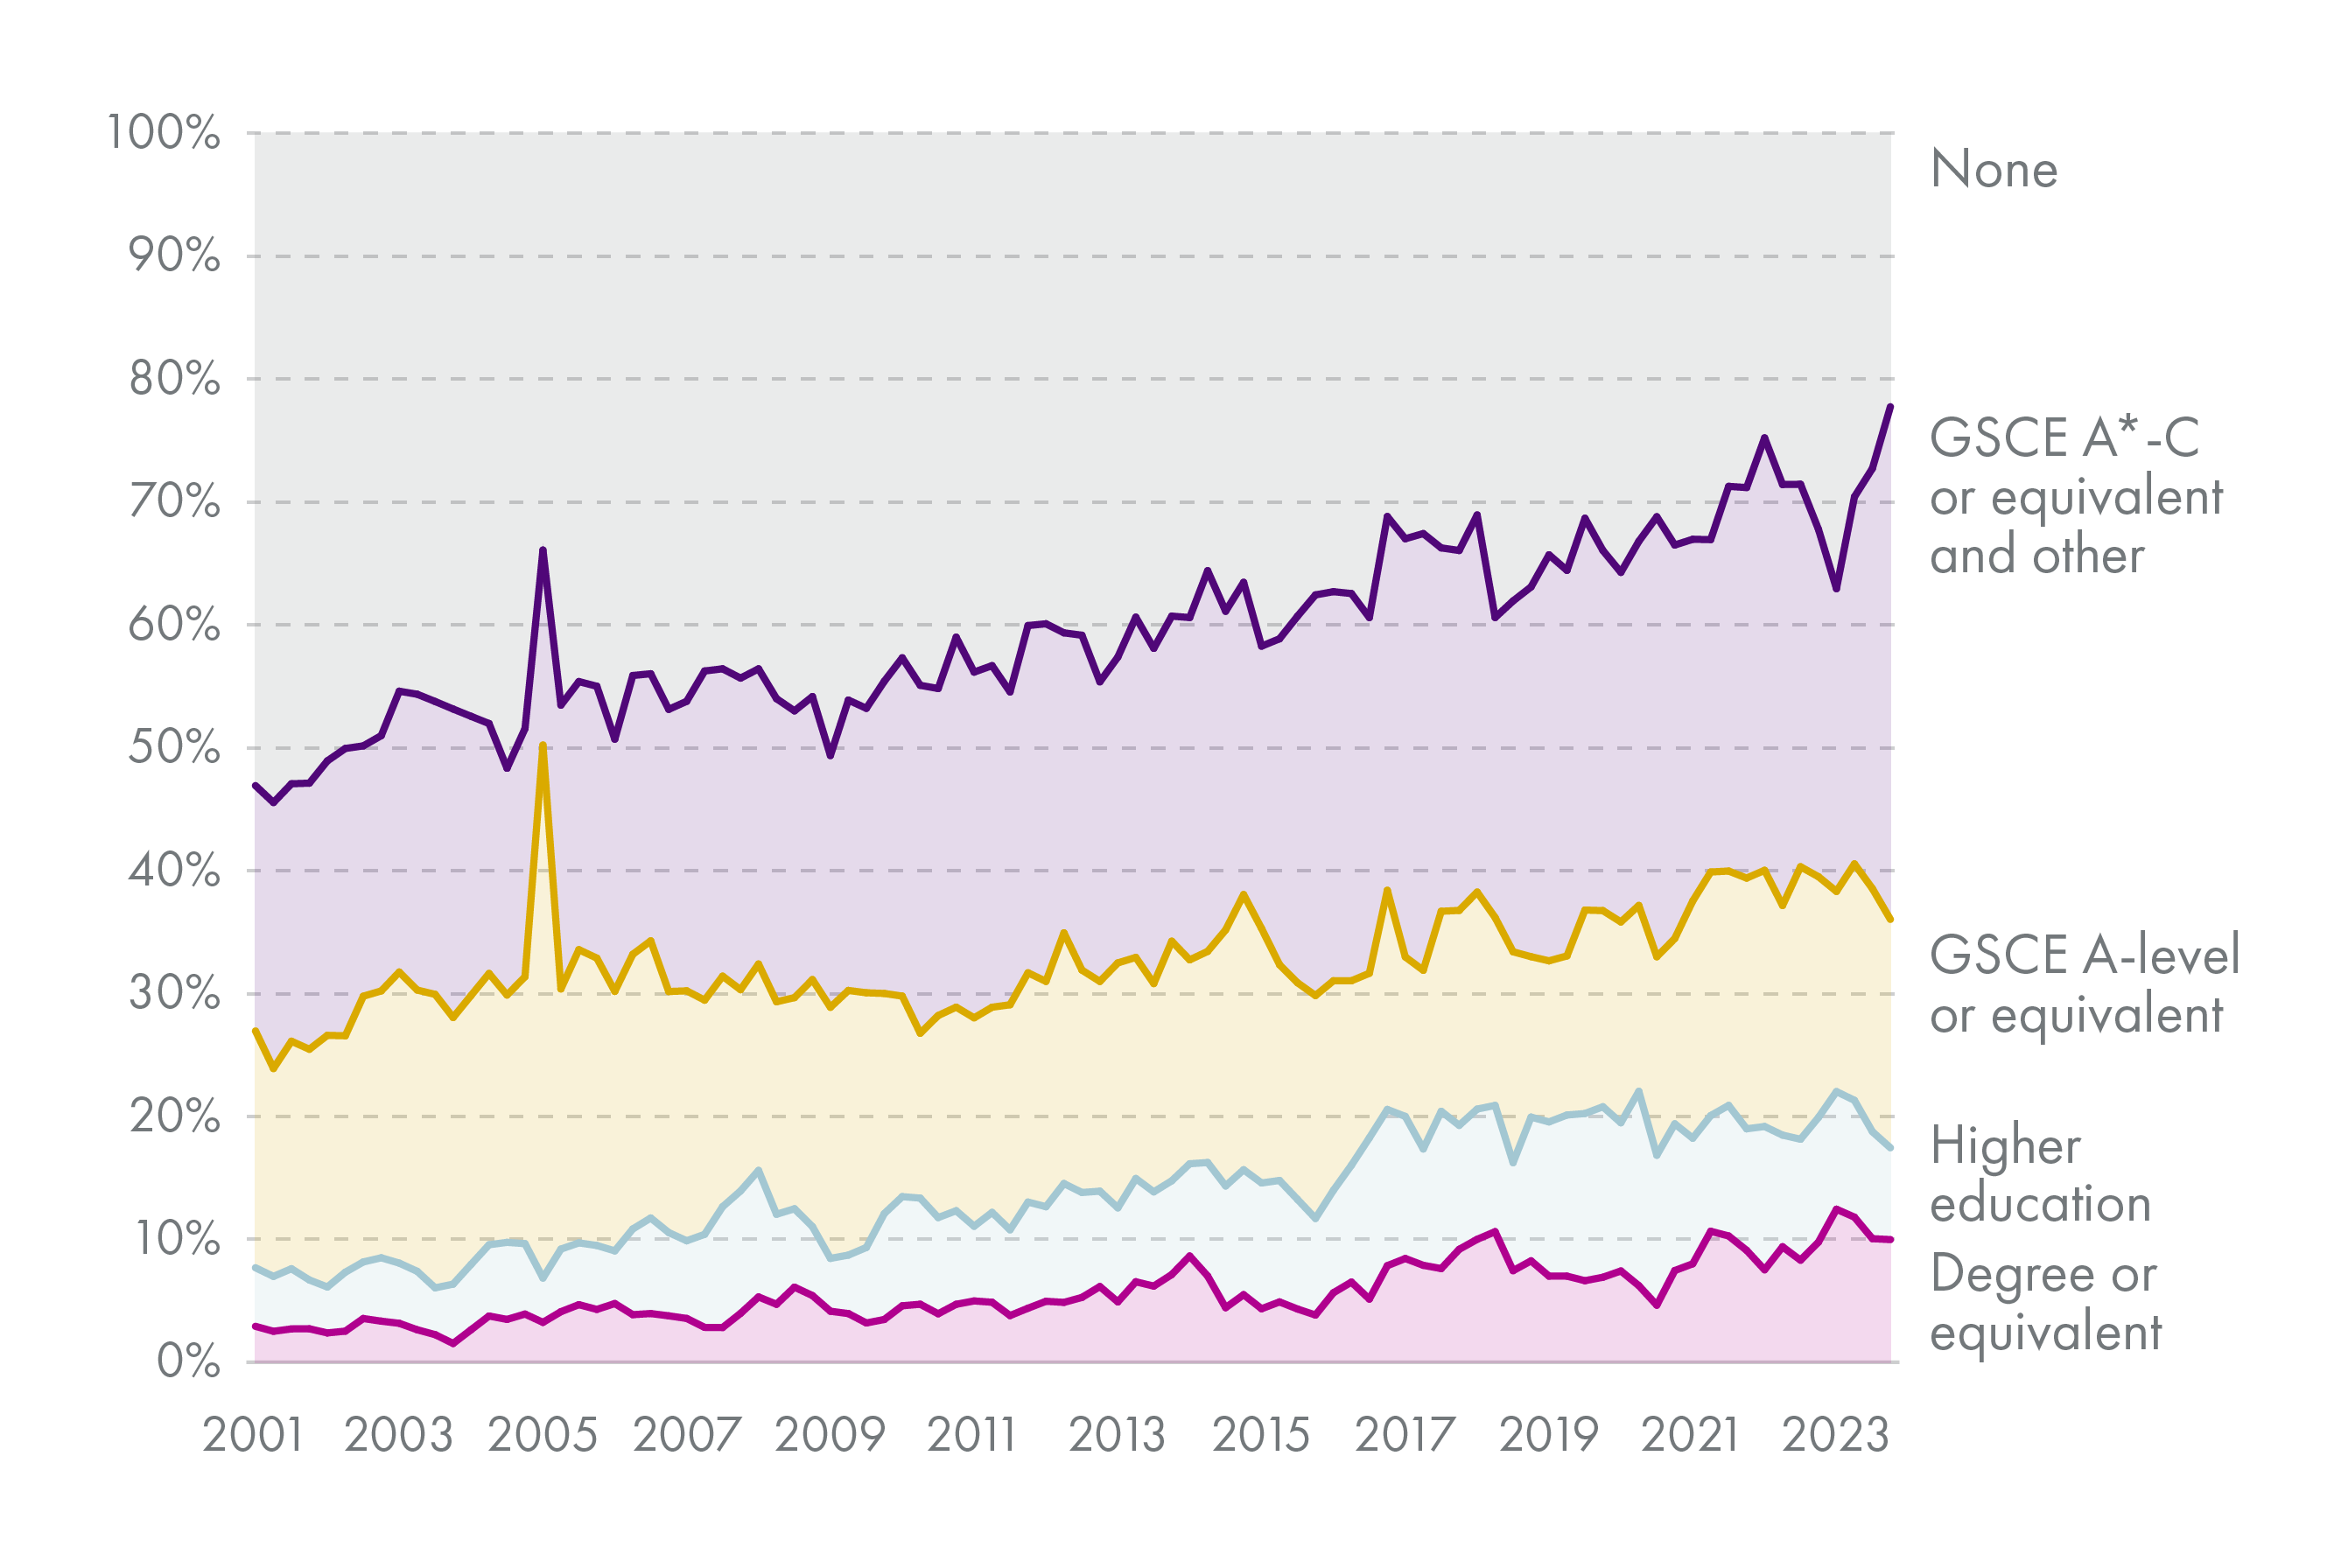
Quarterly Labour Force Survey, 2001-2023. Accessed through the UK Data Service.
Chart 8 shows how the educational attainment of those who attribute their inactivity to permanent poor health or disability has changed over time.
Those with degree-level or higher education qualifications make up a small but growing proportion of those inactive due to permanent poor health or disability. Conversely, those without qualifications made up over 50% of those inactive for this reason at the start of 2001, but only around 25% by the end of 2023.
These proportions diverge from population shares by educational attainment. For instance, people with GCSE-level or below make up one-third of all people aged 18-24, but four in five of those inactive due to ill health in that age range 2.
These changes may reflect differences in the underlying health conditions causing inactivity due to poor health.
NHS wait times
There are several potential health-related drivers of inactivity trends. These include: access to healthcare, quality of healthcare, health inequalities, and type of work.
Prior to 2010, there were marked reductions in health inequality across the UK, but thisprogress slowed during the 2010s; an update to the Marmot review attributes this phenomenon to changes in public policy and spending 1.
Although one measure cannot capture the quality of healthcare provided in a local area, A&E wait times do correlate with and may be predictors of healthcare performance. They also proxy for access to, and in some ways quality of, healthcare in a given health board.
There is a statutory target that all patients attending A&E should be seen within four hours. The percentage meeting these targets has varied widely by health board in recent years. For example, in January 2024, 6% of A&E attendances waited over 4 hours in NHS Orkney, compared to 58% in NHS Forth Valley.
Percent of A&E attendances not meeting statutory targets by health board, January 2024. Wait times are calculated for emergency departments, which represent about 80% of total A&E activity. Site-level wait times have been aggregated to the health board level.
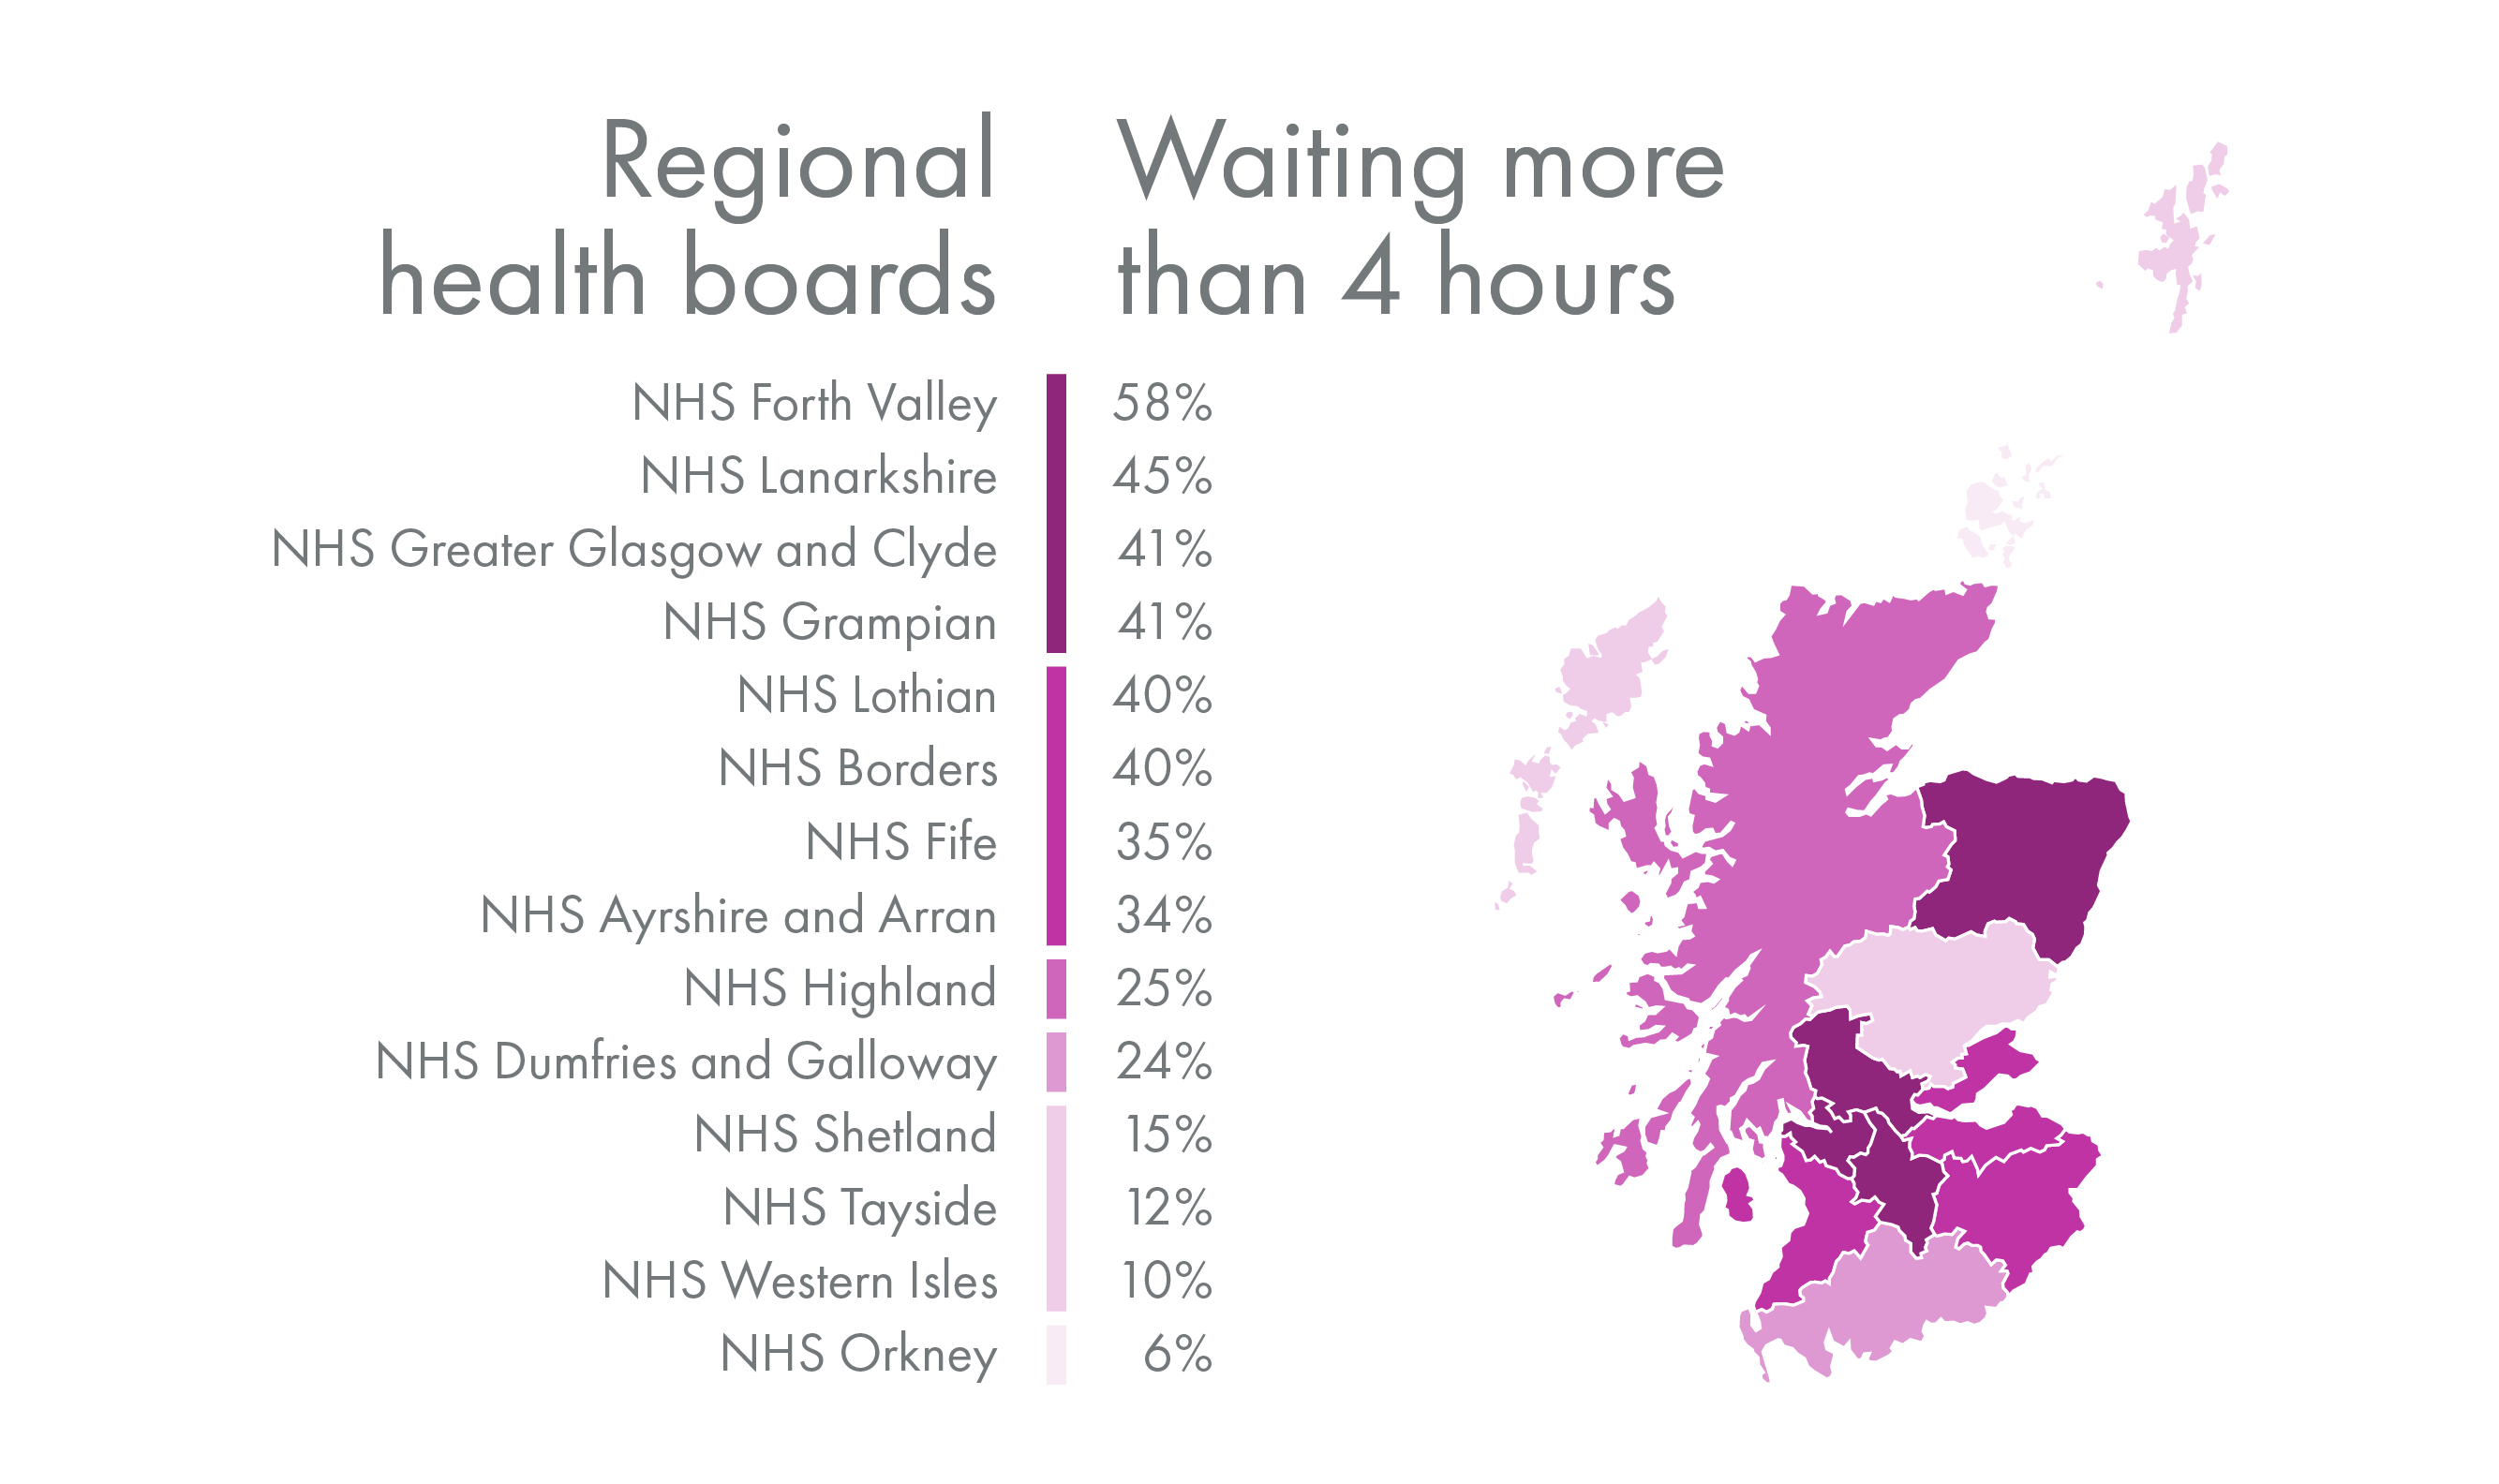
A&E wait times statistics. Accessed through Public Health Scotland.
Wait times have also changed significantly since the pandemic (see chart 10). In February 2020, just before the Covid-19 pandemic, the highest proportions of attendances waiting longer than four hours were around 20%. By February 2024, 59% of attendances in NHS Forth Valley and 45% of attendances in NHS Lanarkshire waited longer than four hours.
Trends in percent of A&E attendances not meeting the 4-hour statutory targets by health board from July 2007 to March 2024. Wait times are calculated for emergency departments, which represent about 80% of total A&E activity. Site-level wait times have been aggregated to the health board level.
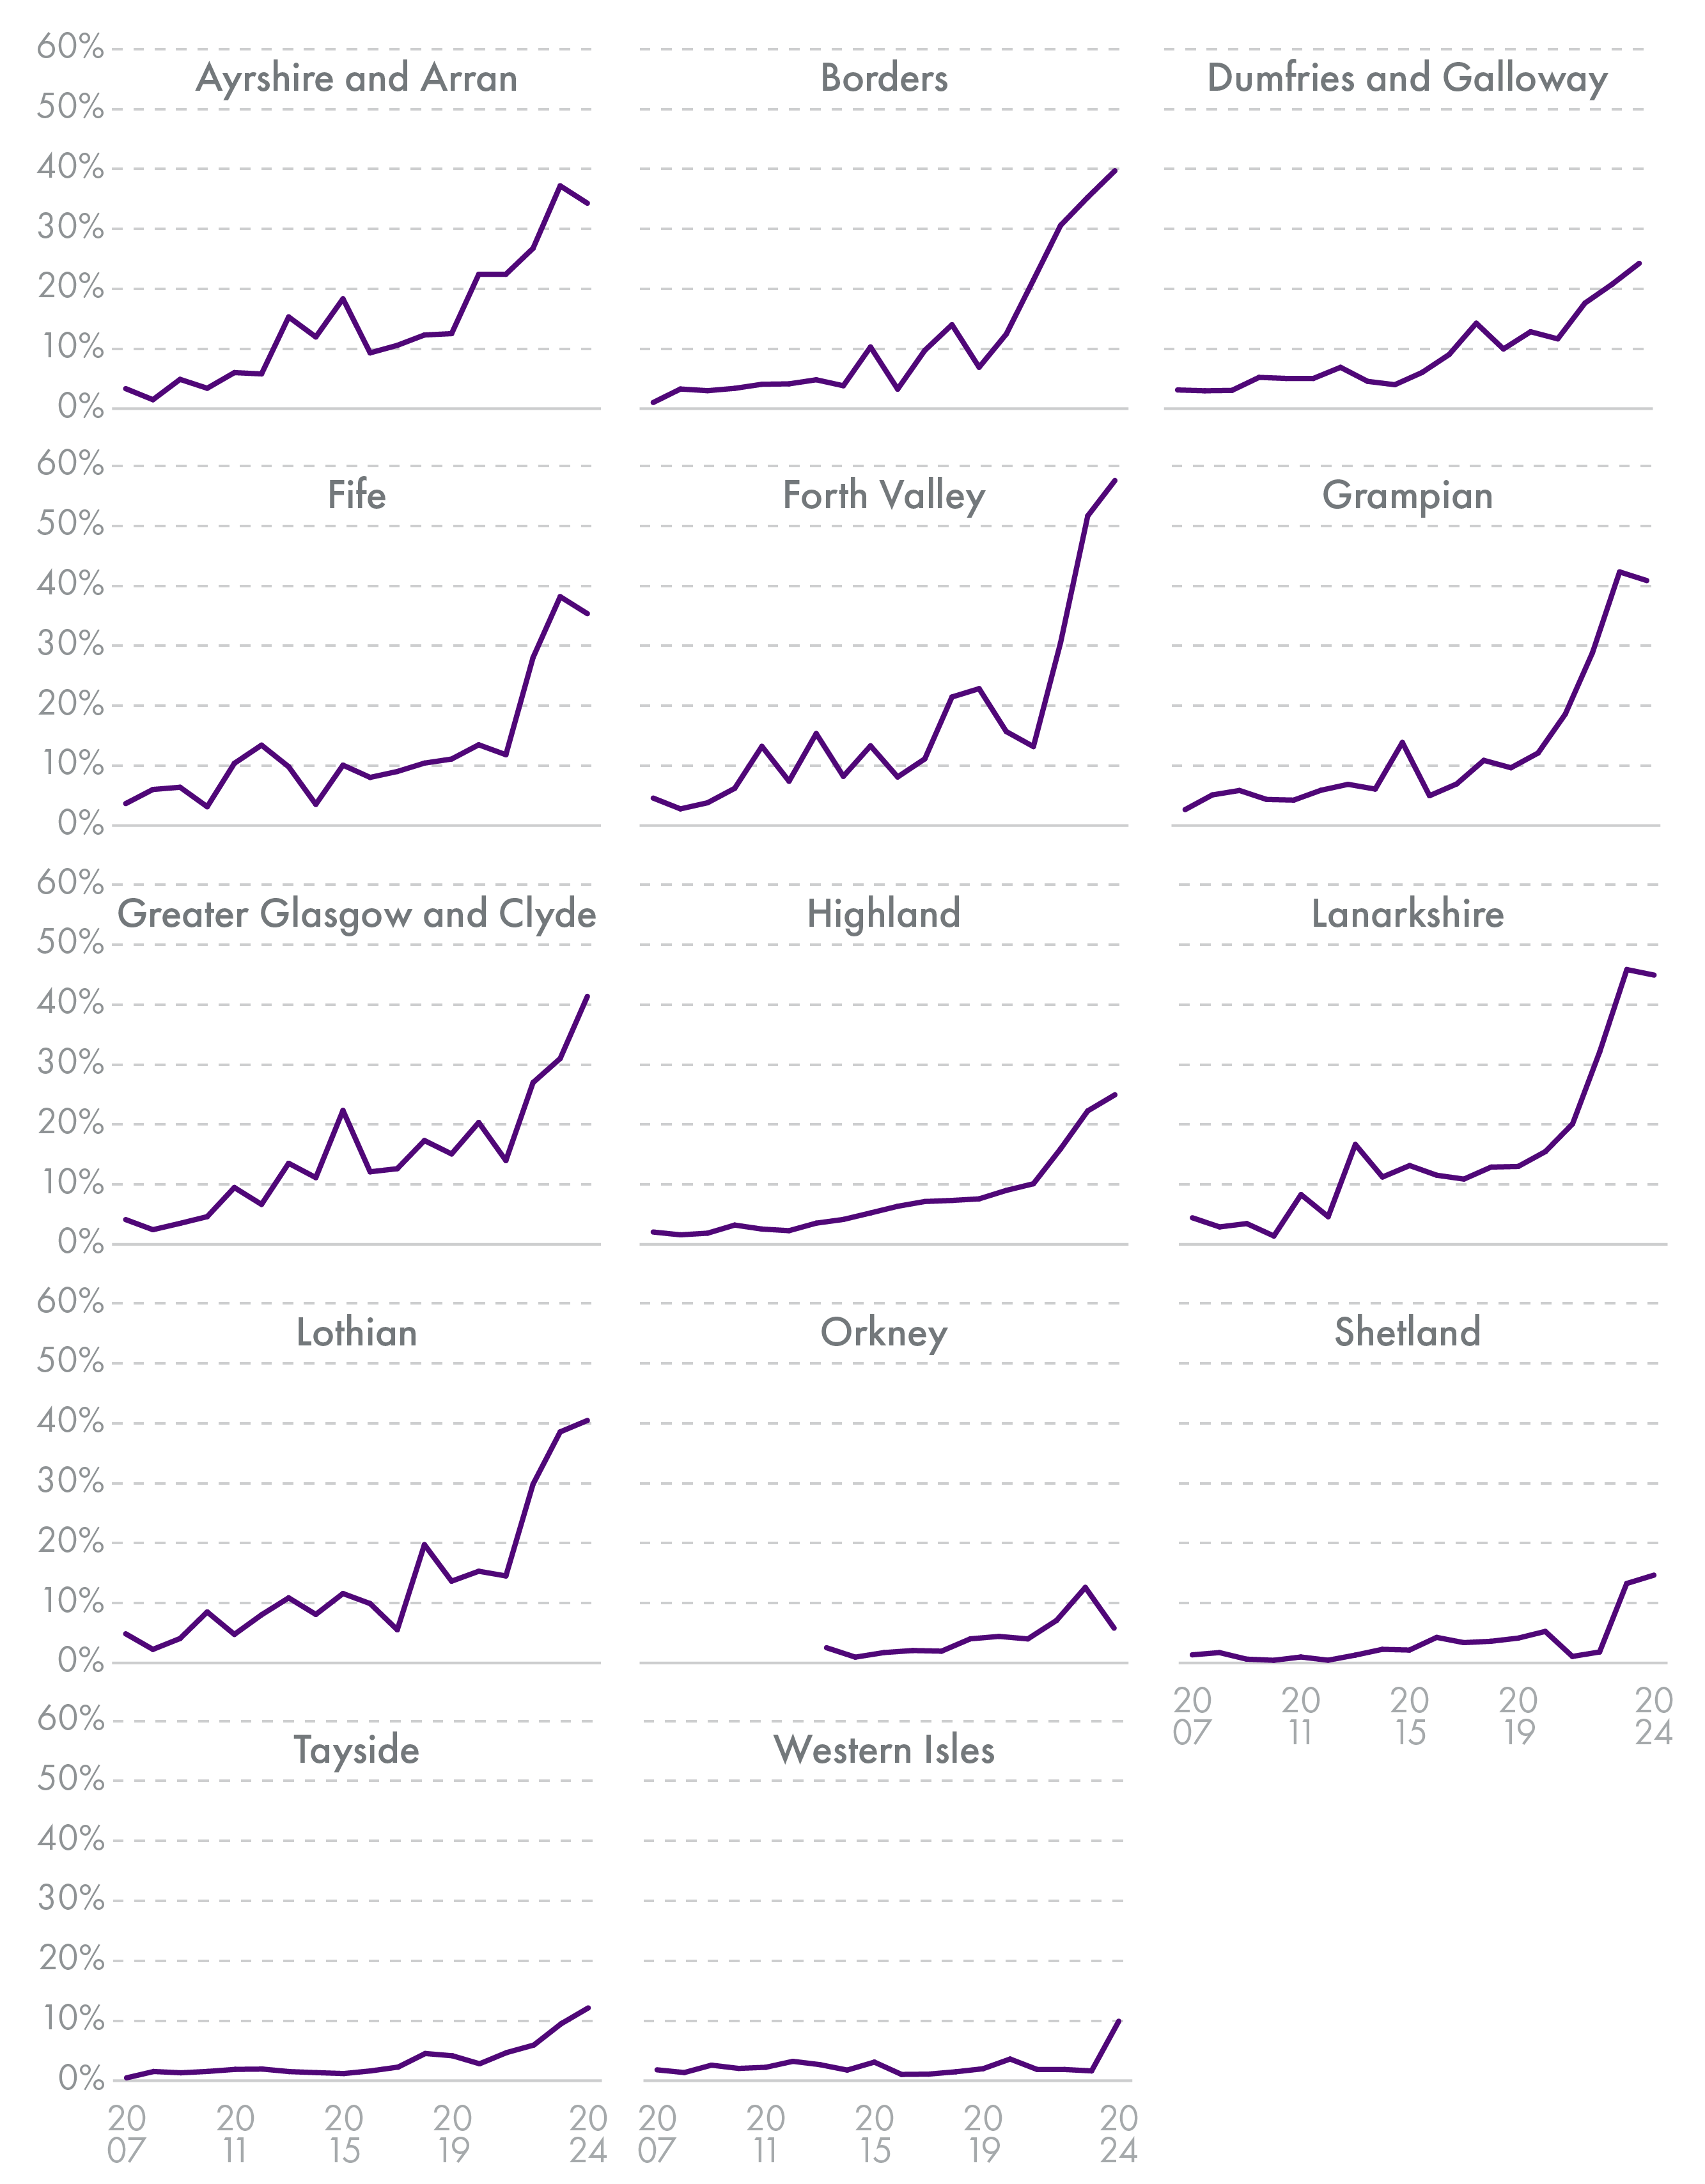
A&E wait times statistics. Accessed through Public Health Scotland.
NHS Forth Valley experienced an increase in the percentage of attendances missing the statutory target by nearly 50 percentage points (pp) from February 2020 to March 2024. The same changes for NHS Lanarkshire and NHS Grampian were both around 30pp. The median health boards, NHS Highland and NHS Greater Glasgow and Clyde, had increases of about 16pp. These changes highlight the lingering effects of the pandemic on health board capacity to meet demand.
Analysis of Annual Population Survey data and Public Health Scotland data on wait times from 2012-2022 shows the relationship between A&E wait times and individual health and employment status, even when controlling for other factors. The correlations discussed below are provided in the Annex.
Analysis of these data finds that both long-term illness or disability and inactivity are positively correlated with a greater proportion of people waiting more than 4 hours in A&E. These correlations are smaller when only pre-pandemic years are considered, indicating that the relationship may have strengthened since 2020.
A&E wait times are also positively related to rates of people inactive due to poor health or disability. This is true of (1) the entire population, (2) just among those who are economically inactive, and (3) just among those with long-term health conditions or disabilities.
The relationship is strongest among those who are inactive; this can be interpreted as meaning that among those who are inactive, those living in areas where healthcare has recently been less accessible or of lower quality are more likely to attribute their inactivity to poor health or disability. Similarly, among those who have long-term health conditions or disabilities, those living in areas with less accessible or poorer-quality healthcare are more likely to be inactive.
When health board fixed effects and individual characteristics like age, sex, level of education, and number of children in the household are accounted for, these correlations become smaller and in some cases statistically insignificant.
Notably, A&E wait times are still positively related to the probability of having a long-term health condition and the probability of being inactive due to poor health or disability.
The correlation between long-term health conditions and A&E wait times is 0.005. This figure can be interpreted as meaning that if the proportion of A&E attendees waiting more than 4 hours increases by 1 percentage point (1pp), the probability of having a long-term health condition or disability rises by about 0.5pp. The same change in A&E wait times is associated with a 0.08pp increase in the probability of inactivity due to poor health or disability.
When health board and individual factors are accounted for, A&E wait times are no longer related to the overall probability of inactivity or to the probability of reporting inactivity due to ill health or disability among those with long-term health conditions or disabilities.
However, A&E wait times are still positively related to the probability that someone who is economically inactive attributes their inactivity to poor health or disability. This probability rises by about 0.2pp for every 1pp increase in the proportion of A&E attendees waiting over four hours.
For example, an increase in the average proportion of A&E attendees waiting over four hours from 10% to 20% (a 10pp rise) in a given health board is associated with a 5pp rise in the rate of long-term health conditions, a 0.8pp increase in the rate of inactivity due to poor health or disability, and a 2pp rise in the proportion of economically inactive people attributing their inactivity to poor health or disability.
Key findings and implications
Rates of economic inactivity have trended differently in Scotland compared to the rest of the UK since about 2015, likely reflecting differences in underlying drivers of inactivity trends. One of the likely causes of differences is health-related factors.
Poor health and disability explains a larger proportion of economic inactivity in Scotland than in the rest of the UK. This reflects both a higher proportion of the population with long-term conditions or disabilities and a higher correlation between long-term conditions or disability and inactivity.
The relationship between long-term conditions or disability and inactivity also varies within Scotland by geography as well as personal characteristics like age, gender, and educational attainment. A higher proportion of economic inactivity is attributed to permanent ill health or disability by men over 24 than by women in Scotland. However, this reason has trended downward for men over 24 since 2001, but increased for women of all ages in the last five years. Those with higher levels of educational attainment make up an increasing proportion of those attributing inactivity to permanent poor health or disability, potentially indicating a change in the underlying conditions explaining some of the rise in inactivity.
The briefing also finds a significant, positive relationship between reduced healthcare access in the past year (proxied by A&E wait times) and current reporting of long-term conditions or disabilities and economic inactivity due to poor health or disability. The relationship persists even when comparing to others of similar age, gender, education, and number of children in the household.
This relationship holds true particularly among the inactive population. That is, those who are inactive are more likely to attribute their inactivity to poor health or disability when they have faced reduced access to public healthcare in the year prior.
These findings imply several key policy considerations.
Trends in economic inactivity in Scotland likely have different drivers than the rest of the UK; use of UK-wide research on inactivity may be of limited relevance in Scotland. Scotland-specific data and research are needed to fully understand the relationship.
Public healthcare access and inactivity rates are related; to fully understand the impact of policy decisions, labour market policy should consider health drivers, and health policy should consider employment outcomes.
Since relationships between poor health and inactivity vary based on characteristics like age, gender, and level of education, the relevant policy levers to reduce rates of inactivity and inactivity due to poor health or disability may also differ depending on the targeted group.
A number of questions remain for future research. This report has dealt with the general relationship between health or disability and inactivity; future research should consider questions such as:
How do health policy changes affect inactivity or other employment outcomes?
What types of health policy changes have the largest impact on inactivity or other employment outcomes?
What types of employability services would best support people not working due to poor health or disability into sustained work?
What impact might an increase in rates of poor health or disability have on demand for other services (e.g., employability or social care) and on the Scottish Government's fiscal position?
Annex
Correlations between A&E wait times, poor health, and inactivity in Scotland from 2012-2022. A&E wait times are measured as the percent of A&E attendees waiting more than 4 hours, averaged over the year preceding the respondent's interview. Long-lasting illness is not observed in 2012, so correlation coefficients in that column represent estimates from 2013-2022. * 0.10 > p >= 0.05 ** 0.05 > p >= 0.01 *** 0.01 > p
| Dependent variable | Respondent has long-lasting illness | Inactivity | Inactivity attributed to poor health or disability | ||
|---|---|---|---|---|---|
| ALL YEARS (2012-2022) | (1) | (2) | (3) | (4) | (5) |
| Correlation with A&E wait times over year preceding interview | 0.0453*** | 0.0022*** | 0.0191*** | 0.0314*** | 0.0092*** |
| N | 226,870 | 316,596 | 316,596 | 140,205 | 86,779 |
| PRE-PANDEMIC (2012-2019) | (6) | (7) | (8) | (9) | (10) |
| Correlation with A&E wait times over year preceding interview | 0.0235*** | 0.0020*** | 0.0199*** | 0.0329*** | 0.0255*** |
| N | 177,888 | 255,467 | 255,467 | 109,587 | 65,969 |
| Sample definition | All | All | All | Inactive population | People with long-term health conditions |
Annual Population Survey and A&E wait times statistics, 2012-2022. Accessed through the UK Data Service and Public Health Scotland.Office for National Statistics. (2024). Annual Population Survey 2014-2022. 8th release. UK Data Service. SN:200002. Retrieved from http://doi.org/10.5255/UKDA-Series-200002
Table 1 shows correlations between A&E wait times, poor health, and inactivity. The top section of the table uses data from 2012-2022, while the bottom section makes the same calculations using only data from before the Covid-19 pandemic (2012-2019).
Conditional correlations between A&E wait times, poor health, and inactivity in Scotland from 2012-2022. Point estimates are OLS coefficients from regression of the dependent variable on the percent of A&E attendees waiting more than 4 hours, averaged over the year preceding the respondent’s interview, plus individual characteristics. These characteristics include age, age squared, sex, level of qualifications held, and the number of children in the household aged 0-4 and aged 5-15. Health board fixed effects are also included. Long-lasting illness is not observed in 2012. * 0.10 > p >= 0.05 ** 0.05 > p >= 0.01 *** 0.01 > p
| Dependent variable | Respondent has long-lasting illness | Inactivity | Inactivity attributed to poor health or disability | ||
|---|---|---|---|---|---|
| ALL YEARS (2012-2022) | (1) | (2) | (3) | (4) | (5) |
| Coefficient: A&E wait times over year preceding interview | 0.0048927*** | 0.00042 | 0.0007949** | 0.00176** | -0.000149 |
| Standard error | 0.0007502 | 0.0007219 | 0.0003078 | 0.0006112 | 0.000953 |
| N | 187,708 | 237,291 | 237,291 | 70,648 | 64,345 |
| PRE-PANDEMIC (2012-2019) | (6) | (7) | (8) | (9) | (10) |
| Coefficient: A&E wait times over year preceding interview | 0.004187*** | -0.0008831 | 0.0000847 | 0.0011024* | -0.0013024 |
| Standard error | 0.0008227 | -0.0008831 | 0.0003436 | 0.0005313 | 0.0013364 |
| N | 159,227 | 206,489 | 206,489 | 54,347 | 46,099 |
| Sample definition | All | All | All | Inactive population | People with long-term health conditions |
Annual Population Survey and A&E wait times statistics, 2012-2022. Accessed through the UK Data Service and Public Health Scotland.Office for National Statistics. (2024). Annual Population Survey 2014-2022. 8th release. UK Data Service. SN:200002. Retrieved from http://doi.org/10.5255/UKDA-Series-200002
Table 2 computes similar calculations to Table 1, but controls for individual characteristics like age, sex, level of educational qualifications attained, and the numbers of children in the household aged 0-4 and aged 5-15. The coefficients represent relationships between the dependent variables and A&E wait times if these other factors are held constant.
As in Table 1, the top section of Table2 shows results for 2012-2022, and the bottom section shows results from only pre-pandemic years (2012-2019).
Sources
Hill, K., Davis, A., Hirsch, D., & Marshall, L. (2016). Falling short: the experiences of families below the Minimum Income Standard. Retrieved from <a href="https://www.jrf.org.uk/cost-of-living/falling-short-the-experiences-of-families-below-the-minimum-income-standard" target="_blank">https://www.jrf.org.uk/cost-of-living/falling-short-the-experiences-of-families-below-the-minimum-income-standard</a> [accessed March 2024]
Dorsett, R., & Lucchino, P. (2018). Young People's Labour Market Transitions: The Role of Early Experiences. Labour Economics, 54, 29-46. doi: https://doi.org/10.1016/j.labeco.2018.06.002
Scottish Fiscal Commission. (2023). Scotland's Economic and Fiscal Forecasts. Edinburgh: Scottish Fiscal Commission.
Millar, R., Burns, H., & Morton, A. (2015). Ageing, Health Status, and Economic Activity in Scotland: A Twenty Year View. Retrieved from <a href="https://strathprints.strath.ac.uk/65143/" target="_blank">https://strathprints.strath.ac.uk/65143/</a> [accessed 30 May 2023]
Randolph, H., & Crummey, C. (2023). Economic inactivity and ill-health in Scotland. Retrieved from <a href="https://fraserofallander.org/economic-inactivity-and-ill-health-in-scotland/" target="_blank">https://fraserofallander.org/economic-inactivity-and-ill-health-in-scotland/</a> [accessed February 2024]
Boileau, B., & Cribb, J. (2022, October 26). Is worsening health leading to more older workers quitting work, driving up rates of economic inactivity?. Retrieved from <a href="https://ifs.org.uk/articles/worsening-health-leading-more-older-workers-quitting-work-driving-rates-economic" target="_blank">https://ifs.org.uk/articles/worsening-health-leading-more-older-workers-quitting-work-driving-rates-economic</a> [accessed 15 February 2023]
Ki, M., Kelly, Y., Sacker, A., & Nazroo, J. (2013). Poor health, employment transitions and gender: evidence from the British Household Panel Survey. International Journal of Public Health, 58(4), 537-546.
Popham, F., Gray, L., & Bambra, C. (2012). Employment status and the prevalence of poor self-rated health: Findings from UK individual-level repeated cross-sectional data from 1978 to 2004. BMJ Open, 2(6).
Webber, D.J., Veliziotis, M., & Johnson, S. (2015, June). Does poor health affect employment transitions?. Retrieved from <a href="https://uwe-repository.worktribe.com/preview/833958/JRF%20FINAL%20PUBLISHED.pdf" target="_blank">https://uwe-repository.worktribe.com/preview/833958/JRF%20FINAL%20PUBLISHED.pdf</a> [accessed 6 June 2023]
van de Mheen, H., Stronks, K., Schrijvers, C.T.M., & Mackenbach, J.P. (1999). The influence of adult ill health on occupational class mobility and mobility out of and into employment in The Netherlands. Social Science & Medicine, 49(4), 509-518.
Ulman, P., Walega, A., & Walega, G. (2017). Is Health Status a Determinant of The Economic Activity? Some Evidence From Poland. Acta Universitatis Lodziensis Folia Oeconomica, 2(328), 39-54.
Bennett, R., & Waterhouse, P. (2018). Work and family transitions and the self-rated health of young women in South Africa. Social Science & Medicine, 203, 9-18.
Gurgel do Amaral, G., Ots, P., Brouwer, S., & van Zon, S.K.R. (2022). Multimorbidity and exit from paid employment: The effect of specific combinations of chronic health conditions. European Journal of Public Health, 32(3), 392-397.
Schuring, M., Robroek, S.J.W., Lingsma, H.F., & Burdorf, A. (2015). Educational differences in trajectories of self-rated health before, during, and after entering or leaving paid employment in the European workforce. Scandinavian Journal of Work, Environment & Health, 41(5), 441-450.
Leinonen, T., Viikari-Juntura, E., Räisänen, H., Sundvall, S., Kauhanen, A., & Solovieva, S. (2021). Does Work Disability Contribute to Trajectories of Work Participation before and after Vocational Labour Market Training for Job Seekers?. International Journal of Environmental Research and Public Health, 18(3), 1-17.
Brown, S., Roberts, J., & Taylor, K. (2010). Reservation wages, labour market participation and health. Journal of the Royal Statistical Society: Series A (Statistics in Society), 173(3), 501-529.
García-Gómez, P., Jones, A.M., & Rice, N. (2010). Health effects on labour market exits and entries. Labour Economics, 17(1), 62-76.
Minelli, L., Pigini, C., Chiavarini, M., & Bartolucci, F. (2014). Employment status and perceived health condition: Longitudinal data from Italy. BMC Public Health, 14(1).
Chen, W.H. (2019). Health and transitions into nonemployment and early retirement among older workers in Canada. Economics & Human Biology, 35, 193-206.
Harris, M.N., Zhao, X., & Zucchelli, E. (2021). Ageing Workforces, Ill-health and Multi-state Labour Market Transitions. Oxford Bulletin of Economics and Statistics, 83(1), 199-227. doi: 10.1111/obes.12379
Schofield, S.J., Woods, A., Szram, J., Newman Taylor, A.J., & Cullinan, P. (2019). Chronic obstructive pulmonary disease and breathlessness in older workers predit economic inactivity in a prospective cohort study. American Journal of Respiratory and Critical Care Medicine, 200(10), 1228-1233. doi: 10.1164/rccm.201902-0297OC
Britton, J., & French, E. (2020). Health and Employment amongst Older Workers. Fiscal Studies, 41(1), 221-250. doi: 10.1111/1475-5890.12213
Hengel, K.O., Robroek, S.J.W., Eekhout, I., van der Beek, A.J., & Burdorf, A. (2019). Educational inequalities in the impact of chronic diseases on exit from paid employment among older workers: a 7-year prospective study in the Netherlands. Occupational and Environmental Medicine, 76(10), 718-725. doi: 10.1136/oemed-2019-105788
Reeves, A., Fransham, M., Stewart, K., Reader, M., & Patrick, R. (2024). Capping welfare payments for workless families increases employment and economic inactivity: Evidence from the UK's benefit cap. International Journal of Social Welfare, 1-14. doi: 10.1111/ijsw.12651
Brown, J., Demou, E., Tristram, M.A., Gilmour, H., Sanati, K.A., & MacDonald, E.B. (2012). Employment status and health: understanding the health of the economically inactive population in Scotland. BMC Public Health, 12(1), 327. doi: 10.1186/1471-2458-12-327
Clemens, T., Boyle, P., & Popham, F. (2009). Unemployment, mortality and the problem of health-related selection: evidence from the Scottish and England & Wales (ONS) longitudinal studies. Health Statistics Quarterly, (43), 7-13.
Tinson, A., Major, A., & Finch, D. (2022, October 10). Is poor health driving a rise in economic inactivity?. Retrieved from <a href="https://www.health.org.uk/news-and-comment/charts-and-infographics/is-poor-health-driving-a-rise-in-economic-inactivity" target="_blank">https://www.health.org.uk/news-and-comment/charts-and-infographics/is-poor-health-driving-a-rise-in-economic-inactivity</a> [accessed 30 May 2023]
Reuschke, D., & Houston, D. (2022). The impact of Long COVID on the UK workforce. Applied Economics Letters, 1-5. doi: 10.1080/13504851.2022.2098239
Cribb, J. (2023). Falling employment and worsening health in the UK: connected or distinct trends?. BMJ, 380, 647. doi: 10.1136/bmj.p647
Phoenix. (2022, November). What is driving the great retirement?. Retrieved from <a href="https://www.voced.edu.au/content/ngv:96654" target="_blank">https://www.voced.edu.au/content/ngv:96654</a> [accessed 30 May 2023]
Randolph, H., & Crummey, C. (2023, March 14). Economic inactivity and ill-health in Scotland. Retrieved from <a href="https://fraserofallander.org/economic-inactivity-and-ill-health-in-scotland/" target="_blank">https://fraserofallander.org/economic-inactivity-and-ill-health-in-scotland/</a> [accessed 14 March 2023]
Murphy, L. (2024). A U-shaped legacy: Taking stock of trends in economic inactivity in 2024. Retrieved from <a href="https://www.resolutionfoundation.org/publications/a-u-shaped-legacy/" target="_blank">https://www.resolutionfoundation.org/publications/a-u-shaped-legacy/</a> [accessed 30 March 2024]
Charlie, M.C., & Louise, M. (2024). We've only just begun: Action to improve young people's mental health, education and employment. Retrieved from <a href="https://www.resolutionfoundation.org/publications/weve-only-just-begun/" target="_blank">https://www.resolutionfoundation.org/publications/weve-only-just-begun/</a> [accessed 30 March 2024]
Windett, S. (2022, July 19). The Power of Potential: Supporting the Future of 'NEET' Young People in the Labour Market. Retrieved from <a href="https://learningandwork.org.uk/resources/research-and-reports/power-of-potential/" target="_blank">https://learningandwork.org.uk/resources/research-and-reports/power-of-potential/</a> [accessed 30 May 2022]
Murphy, L. (2023, June 5). Left behind: Exploring the prevalence of youth worklessness due to ill health in different parts of the UK. Retrieved from <a href="https://www.resolutionfoundation.org/publications/left-behind/" target="_blank">https://www.resolutionfoundation.org/publications/left-behind/</a> [accessed 5 June 2023]
Marmot, M. (2020). Health equity in England: the Marmot review 10 years on. BMJ, 368, 693. doi: 10.1136/bmj.m693
Office for National Statistics. (2024). Annual Population Survey 2014-2022. 8th release. UK Data Service. SN:200002. Retrieved from <a href="http://doi.org/10.5255/UKDA-Series-200002" target="_blank">http://doi.org/10.5255/UKDA-Series-200002</a>