Local government finance: Budget 2024-25 and provisional allocations to local authorities
This briefing focuses on both the overall local government settlement for 2024-25, as set out in the Scottish Government's Budget document, and the provisional allocations to local authorities, as set out in the most recent Local Government Finance Circular. The positions of the Scottish Government and COSLA are explained in some detail. The briefing also discusses the Scottish Government's council tax freeze proposals and COSLA's response.
Summary
The main purpose of this briefing is to inform Members of the Scottish Parliament about this year’s Budget allocation to local government and highlight changes to individual council allocations over the year. The main sources of information used are the 2024-5 Scottish Budget document1 and the Local Government Finance Circular 8/2023 published in late December2. It may be that during the Budget Bill process, changes are made to the local government budget. If this happens, SPICe will publish a revised briefing or a blog article as soon as practicable.
The key points in this briefing include:
There is annual disagreement between the Scottish Government and local government representatives about the presentation of Budget figures.
The Scottish Government's Budget document shows that the local government revenue settlement increases by 5% in real terms when comparing the 2024-25 Budget to the 2023-24 Budget.
Local authority directors of finance believe that this is not an accurate representation of changes to local authorities' spending power.
COSLA argues that the cost of previously agreed national commitments means that the local government revenue settlement is £62.7 million less than they expected, even before inflation is factored in.
All local authorities see a real terms increase in their revenue funding when comparing the provisional 2024-25 figures with provisional 2023-24 allocations.
The formula used to allocate revenue funding to individual local authorities uses a whole range of indicators from population and deprivation to road length and remoteness.
The island local authorities receive a far higher per head allocation than mainland local authorities.
Edinburgh and Aberdeen receive the lowest per-head allocations of all local authorities.
There is a significant reduction in capital funding between 2023-24 and 2024-25.
There is continued debate over the principle of the Scottish Government announcing a council tax freeze (without consulting local government), and the estimated cost of "fully funding" such a freeze.
Introduction
The Scottish Government Budget includes details of both revenue and capital allocations for local government. Revenue spend goes on day-to-day services and is used for wages, contracts, supplies, etc. Capital, on the other hand, refers to spend on physical items which benefit service users over a number of years (and the maintenance of these assets). This includes things like school buildings, new roads and paths, flood defences, vehicles, and so on. With the local government sector employing more than 260,000 people, the largest element of local authority expenditure is on workers' pay, including pay for teachers and social care workers.
The majority of local government's net revenue funding comes from the Scottish Government in the form of combined General Revenue Grant, guaranteed Non-Domestic Rates income and specific resource grants. Details of the other sources of local authority income - including council tax - are included in the Scottish Government's Local Government Finance Statistics publications.
The Scottish Government's 2024-25 Budget was published on 19 December 2023 and includes details of the local government settlement from the Scottish Government1. As agreed with the Convention of Scottish Local Authorities (COSLA) on behalf of all 32 local authorities, the Government issued Finance Circular 8/2023 which includes details of individual council allocations2. This briefing draws heavily on both these documents, as well as their equivalents from previous years.
Each year the Scottish Government and local authorities engage in discussions on the appropriate levels of funding for local government. Negotiations on the annual local government finance settlement are conducted between the Scottish Government and COSLA, on behalf of all 32 local authorities, ahead of the announcement of the Scottish Budget.
This year's Budget was published five months after the Verity House Agreement(VHA) was signed between the Scottish Government and COSLA. Whilst the signing of the Agreement marks the beginning of a process, we nevertheless have some high-level principles in place now– agreed by both parties - which we can measure spending decisions against. These include an assumption against ring-fencing, a commitment to sustainable public services and an agreement on the underlying principle of “no surprises” when it comes to budget discussions.
Sources of local authority funding
Local authorities in Scotland are responsible for delivering a wide range of vitally important services, including pre-school care, primary and secondary education, adult social care, social work, local roads and transport, economic development, housing and planning, environmental protection, waste management, and cultural/leisure services.
The Scottish Government’s position is that “councils operate independently of central government and are accountable to their electorates for the services they provide”. However, they are not financially independent. Table 1 shows that the largest single element of local government's income in 2021-22 came from the Scottish Government, in the form of General Revenue Grant (GRG):
| 2021-22 (£bn) | % total revenue income | |
| General Revenue Grant | 9.0 | 38% |
| Non-Domestic Rates | 2.1 | 9% |
| Other grants (e.g ring-fenced from SG) | 2.9 | 12% |
| Council Tax | 2.6 | 11% |
| Customer and client receiptsi | 2.7 | 11% |
| Other grants, reimbursements and contributions | 4.2 | 18% |
| Total revenue income | 23.5 | 100% |
Source: Scottish Local Government Finance Statistics 2021-22. Calculations based on the method used by the 2016 Commission on Local Tax Reform (see p.13).
The Scottish Government provides a block grant to local government consisting of the General Revenue Grant, Non-Domestic Rates income and a number of Specific Revenue Grants. Details of these allocations, plus their capital equivalents, are set out in the annual Scottish Government Budget document and associated Local Government Finance Circulars. These are what we will focus on in the remainder of the briefing.
The 2024-25 Budget and the local government revenue settlement
The local government element of the Scottish budget is always one of the most fraught, and complicated, parts of the annual budget process. It is the second largest spending area in the Scottish Budget document, after health. But local government is not a delivery agent of the Scottish Government, albeit that's where much of its budget comes from. Rather, councils have their own democratic mandates and local priorities which they are accountable to their electorates for delivering.
This section summarises some of the changes to the local government settlement as detailed in the 2023-24 and 2024-25 Scottish Budget documents12. In presenting the local government figures this way, the Scottish Government points to the 2018 Written Agreement between the Finance and Constitution Committee and the Scottish Government3. Covering the administrative arrangements for the annual budget process and other related budgetary matters, the Agreement states that aggregates should be comparable year on year in budget documentation.
COSLA and some local authority Directors of Finance highlighted another interpretation of figures in their evidence to the Local Government, Housing and Planning Committee in January45. They prefer to compare the 2024-25 Budget figures with the likely out-turns for 2023-24, which would give (in their opinion) a more accurate view of the financial situation faced by local authorities. This briefing attempts to present and discuss both interpretations.
Comparing 2024-25 to the 2023-24 settlement
Tables 2 and 3 compare figures from the 2023-24 and the 2024-25 Budget documents. These show a cash increase of 6.8%, or 5% real-terms, in the total local government revenue settlement when comparing the 2024-25 Budget to the 2023-24 Budget.
| Local Government (Revenue) | 2023-24 Budget document | 2024-25 Budget document | Cash change (£m) | Cash change % |
| General Revenue Grant | 7,133.9 | 8,403.9 | +1,270.0 | +17.8% |
| Non-Domestic Rates | 3,047.0 | 3,068.0 | +21.0 | +0.7% |
| Specific (ring-fenced) Resource Grants | 752.1 | 238.8 | -513.3 | -68.2% |
| Revenue within other portfolios | 1,471.8 | 1,534.4 | +62.6 | +4.3% |
| Total revenue in Finance Circular | 12,404.8 | 13,245.1 | +840.3 | +6.8% |
| Local Government (Revenue) | 2023-24 Budget document (£m) | 2024-25 Budget document (£m) | Real change (£m) | Real change % |
| General Revenue Grant | 7,133.9 | 8,265.3 | +1,131.4 | +15.9% |
| Non-Domestic Rates | 3,047.0 | 3,017.4 | -29.6 | -1.0% |
| Specific (ring-fenced) Resource Grants | 752.1 | 234.9 | -517.2 | -68.8% |
| Revenue within other portfolios | 1,471.8 | 1,509.1 | +37.3 | +2.5% |
| Total revenue in Finance Circular | 12,404.8 | 13,026.6 | +621.8 | +5.0% |
When giving evidence to the Local Government, Housing and Planning Committee, the Scottish Government stated:
The agreement between the Scottish Government and the Finance and Public Administration Committee is absolutely clear that we have to compare like with like—comparing pre-budget with pre-budget and outturn with outturn. It is a matter of comparing apples with apples.1
However, Martin Booth, Glasgow City Council Director of Finance, told the Local Government, Housing and Planning Committee in January that "the headline figure of real-terms increases of 5 per cent is not really accurate". According to the Directors of Finance, these figures:
compare our budget at this time last year with the budget at this time this year. They take no account of in-year commitments, where funding has been provided, principally around pay for teachers and non-teaching staff.2
For the Directors of Finance, comparing Budget to Budget does not accurately reflect changes to local government's current and future spending power.
Out-turn figures for 2023-24 are obviously not available yet, as the financial year hasn't ended. However, the Local Government Finance Circular3 published a few days after the Budget provides a snap shot of the most recent 2023-24 settlement, and, as observed by the Directors of Finance, there have been a number of additions made since the 2023-24 Budget was first published. The below tables therefore compare the 2024-25 provisional figures with the most recent 2023-24 figures set out in the Finance Circular, in both cash and real terms:
| 2023-24 (£m) | 2024-25 (£m) | Change (£m) | Change (%) | |
| General Resource Grant | 8,998.2 | 9,914.1 | +915.9 | +10% |
| Non Domestic Rate Income | 3,047.0 | 3,068.0 | +21.0 | +1% |
| Specific Revenue Grants | 775.9 | 263.0 | -512.9 | -66% |
| Total Revenue | 12,821.0 | 13,245.1 | +424.1 | +3% |
Scottish Government's Local Government Finance Circular 8/2023
| 2023-24 (£m) | 2024-25 (£m) | Change (£m) | Change (%) | |
| General Resource Grant | 8,998.2 | 9,750.6 | +752.4 | +8% |
| Non Domestic Rate Income | 3,047.0 | 3,017.4 | -29.6 | -1% |
| Specific Revenue Grants | 775.9 | 258.6 | -517.2 | -67% |
| Total Revenue | 12,821.0 | 13,026.6 | +205.6 | +2% |
Scottish Government's Local Government Finance Circular 8/2023
Table 5 still shows a real-terms increase; however, it is much smaller than that seen in the Budget document and in Table 3 of this briefing (above).
COSLA provides further analysis in their Budget Reality document which shows what they view as a cash terms cut of £62.7 million in local government's revenue spending power over the year4:
...we have received £62.7 million less in revenue than we expected before inflation is taken into account. That is set out in the first table in the budget reality document that we published on 21 December and which also sets out what we were expecting for pay and for baselining. The fact that funding has been baselined this year adds another complication. We have set out what we expected to receive just as flat cash before anything has been taken into account, and the revenue total is £62.7 million short.1
Comparing 2024-25 to the 2013-14 settlement
Members of the Local Government Housing and Planning Committee recently expressed an interest in looking at the local government settlement over the past ten years1. The following shows the total revenue allocation for local government as detailed in the Budget documents for 2013-14 and 2024-25:
| 2013-14 | 2024-25 | Change £m | Change % | |
| General resource grant | 6,858.2 | 8,403.9 | +1,545.7 | +23% |
| NDRI | 2,435.0 | 3,068.0 | +633.0 | +26% |
| Specific resource grants | 98.9 | 238.8 | +139.9 | +141% |
| Total revenue within other Portfolios | - | 1,534.4 | +1,534.4 | - |
| Total revenue in Budget | 9,396.4 | 13,245.1 | +3,848.7 | +41% |
Scottish Government Draft Budget 2013-14 and Budget 2024-25
| 2013-14 | 2024-25 | Change £m | Change % | |
| General resource grant | 8,987.0 | 8,265.3 | -721.7 | -8% |
| NDRI | 3,190.8 | 3,017.4 | -173.4 | -5% |
| Specific resource grants | 129.6 | 234.9 | +105.3 | +81% |
| Total revenue within other Portfolios | - | 1,509.1 | +1,509.1 | |
| Total revenue in Budget | 12,313.1 | 13,026.6 | 713.6 | +6% |
Scottish Government Draft Budget 2013-14 and Budget 2024-25
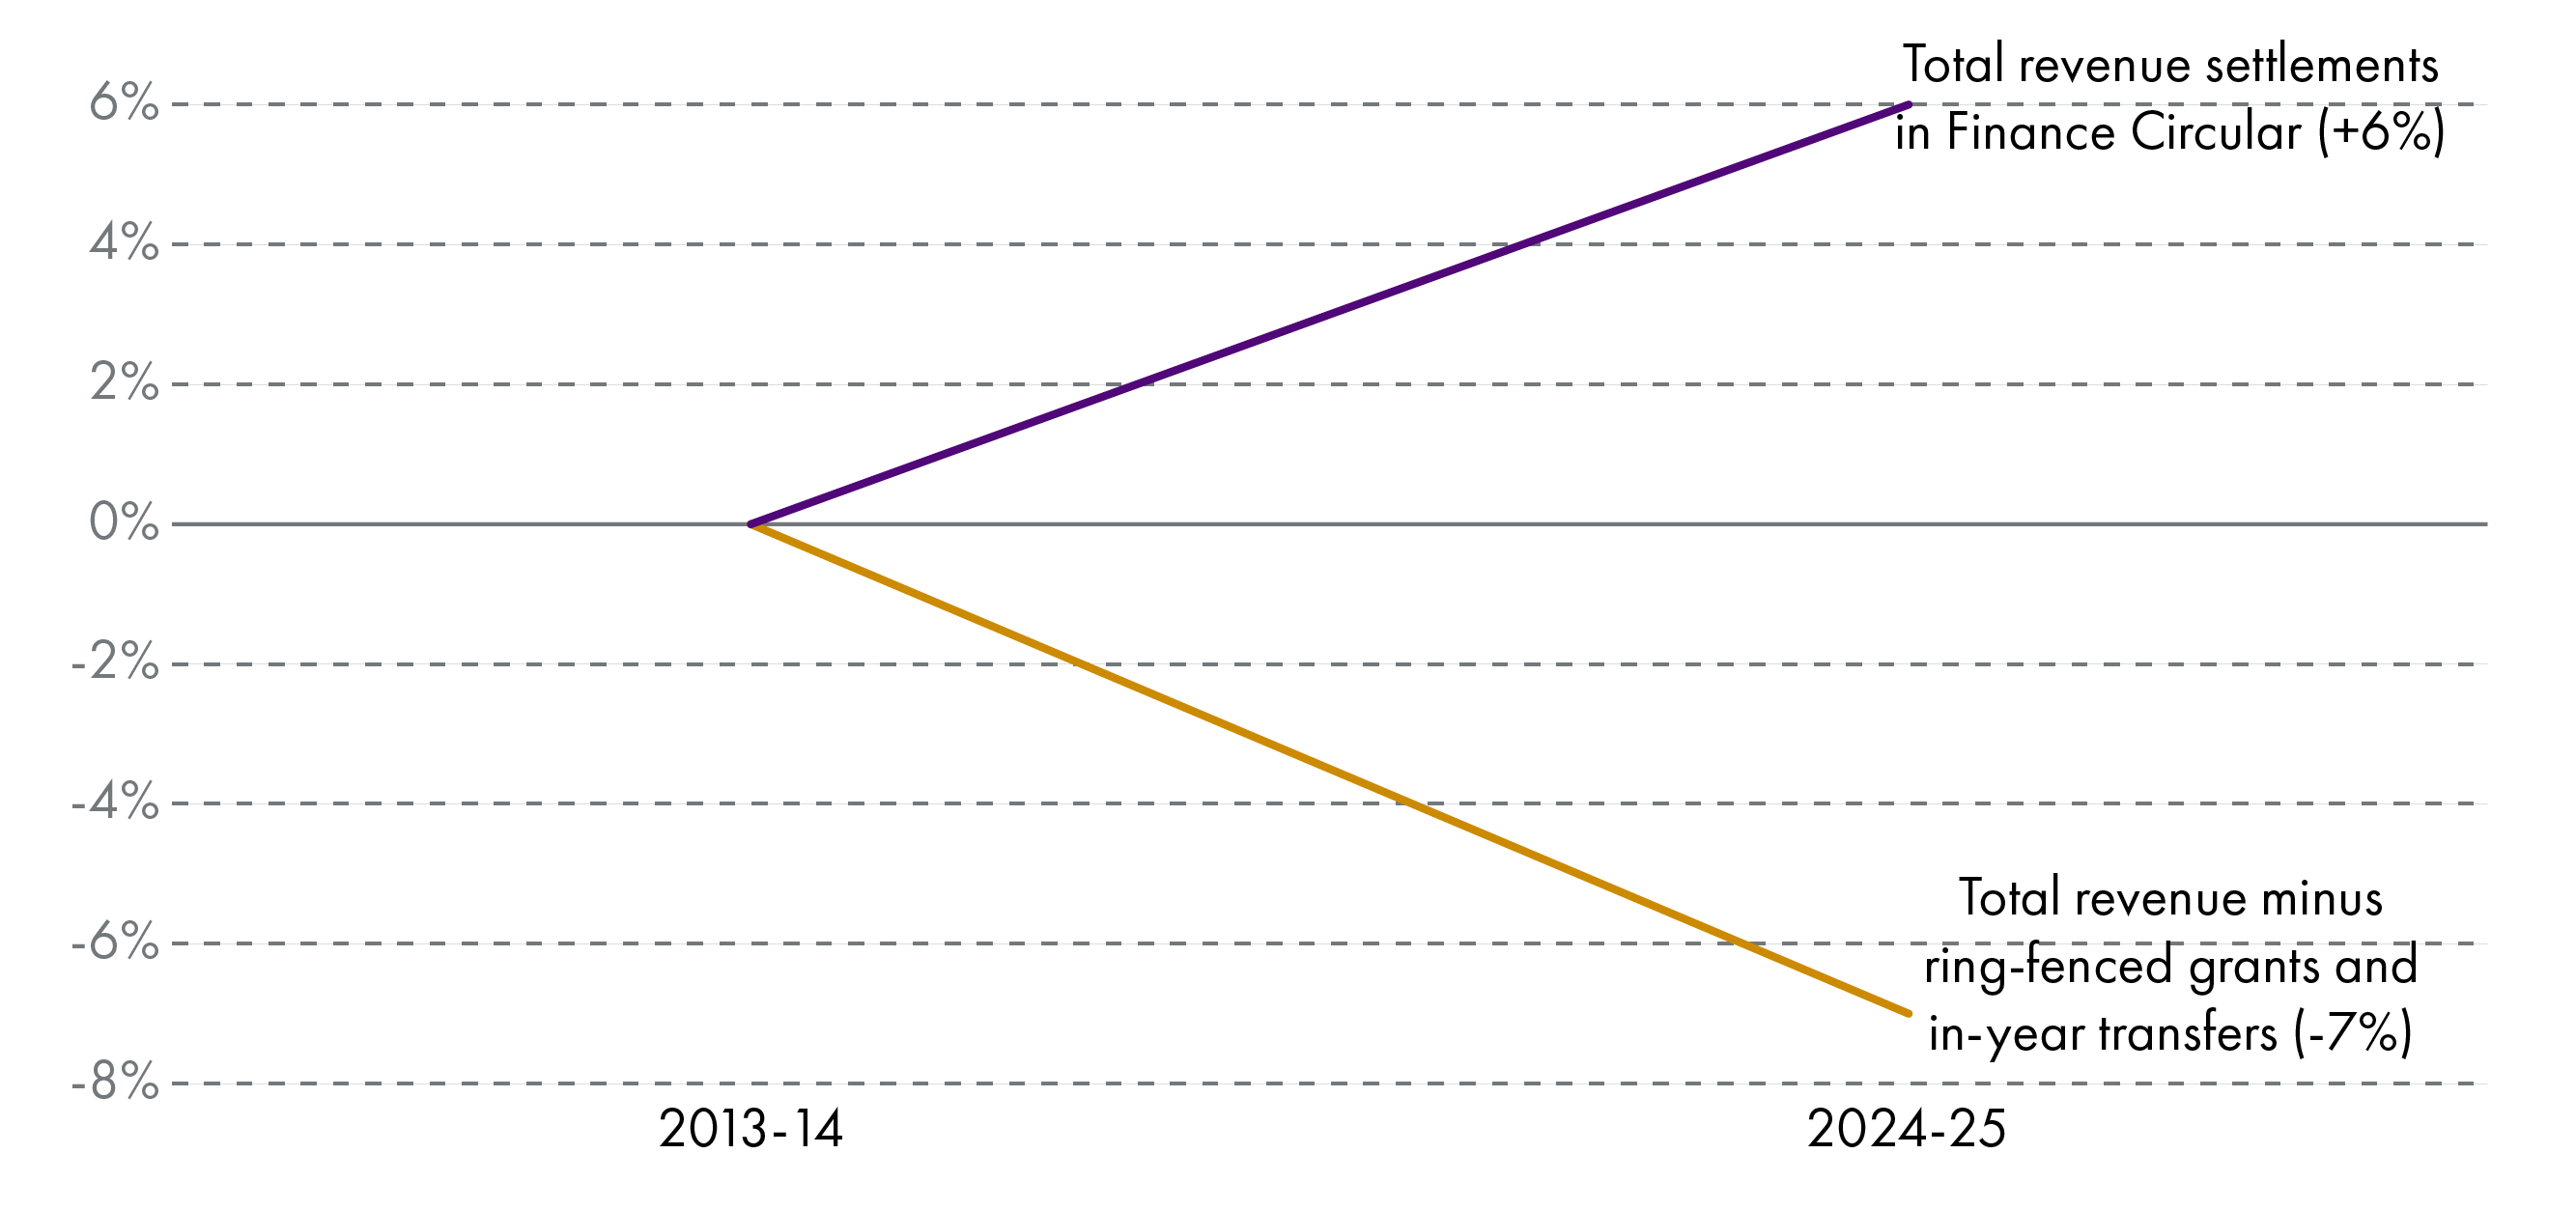
Comparing the Draft Budget 2013-14 and Budget 2024-25 we can see a real terms increase of £714 million, or +6%, in the total revenue allocation to local government. This increase is consistent with the trend seen in Exhibit 4 of the Accounts Commission's recent Local Government Financial Bulletin.
This interpretation is challenged by COSLA and by the Directors of Finance who gave evidence to the Parliament's Local Government, Housing and Planning Committee in January2. The Directors of Finance explained that local authorities do much more now than they did ten years ago, particularly with regards to early years provision, free school meals and adult social care. They argue that the costs of delivering these new or enhanced services far exceed any additional money allocated by the Scottish Government over the period.
As acknowledged by the Director of Finance for Glasgow City Council, stripping out the funding and costs of new policy requirements and comparing like-for-like over time is a very difficult exercise. Nevertheless, the following tables remove ring-fenced grants and in-year transfers from the revenue part of the local government settlement, and compare the figures in the 2024-25 Budget document with those in the 2013-14 Draft Budget (in cash and real terms):
| 2013-14 | 2024-25 | Change £m | Change % | |
| General Revenue Grant (GRG) | 6,858.2 | 8,403.9 | +1,545.7 | +23% |
| NDRI | 2,435.0 | 3,068.0 | +633.0 | +26% |
| Total | 9,293.2 | 11,472.0 | +2,179.7 | +23% |
Scottish Government Draft Budget 2013-14 and Budget 2024-25
| 2013-14 | 2024-25 | Change £m | Change % | |
| General Revenue Grant (GRG) | 8,987.0 | 8,265.3 | -721.7 | -8% |
| NDRI | 3,190.8 | 3017.4 | -173.4 | -5% |
| Total | 12,177.8 | 11,282.6 | -895.1 | -7% |
Scottish Government Draft Budget 2013-14 and Budget 2024-25
Table 9 shows that between 2013-14 and 2024-25, the combined General Resource Grant plus Non-Domestic Rates income reduced by £895 million, or -7%, in real terms.
The Scottish Government disagrees with the presentation of figures in this way as they argue that the "Total revenue within other Portfolios", seen in Tables 6 and 7, is transferred to local authorities' General Revenue Grants which they can then allocate to local needs and priorities.
It is worth repeating that the Scottish Government feel that in-year transfers (IYTs) - which currently sit at £1,534 million in 2024-25 - should be included in calculations as they are paid as part of the General Revenue Grants to local authorities.
Local government revenue budget as a percentage of Scottish Government revenue budget
It is possible to show the local government revenue allocation as a percentage of total Scottish Government revenue budget, and how this compares over time. Table 10 shows that the local government revenue settlement amounts to 33.1% of the total Scottish Government revenue budget (plus NDR income) in 2024-25. This is slightly higher than it was in 2013-14:
| 2013-14 | ... | 2023-24 | 2024-25 | |
| Local Government revenue Budget(£m) | 9,396 | ... | 12,403 | 13,245 |
| SG Total revenue DEL+NDRI (£m) | 28,499 | ... | 39,070 | 40,028 |
| LG as % of SG | 33.0% | ... | 31.7% | 33.1% |
Scottish Government Draft Budget 2013-14 and Budget 2024-25. The SG figure for 2013-14 consists of the Revenue DEL figure from Table 1 in the Draft Budget document plus NDRI. The SG figure for 2024-25 consists of Core Block Grant revenue from UK Government in table B.02, plus NDRI.
Proportion of resource allocation that is ring-fenced or directed
The Budget document tells us that reducing ring-fencing is part of the post-Verity House Agreement relationship between the Scottish Government and local government:
[the Budget] displays our commitment to that partnership by reducing levels of ringfenced and directed expenditure by baselining almost £1 billion of funding across Health, Education, Justice, Net Zero and Social Justice, giving authority and autonomy to local partners to achieve the outcomes we share in a way that best meets the needs of local communities.
The £1 billion figure quoted above comprises previously ring-fenced Early Learning and Childcare Expansion grant (£521.9 million) plus a number of funds previously transferred from other portfolios in-year (combined £429 million). These, according to the Budget document, have been "baselined" into the General Revenue Grant in 2024-25. Local authorities are still required to deliver policies for which funding was previously ring-fenced. Therefore, COSLA and Directors of Finance argue that this baselined money is still "directed" to a great extent, and flexibility over how it is spent locally remains limited.12.
Although the combined ring-fenced grants plus in-year transfers for 2024-25 remains very high (at £1.7 billion), as a proportion of the total revenue settlement it is smaller than in the previous two years. Figure 2 shows that the 2024-25 Budget goes some way to reversing the trend of rising ring-fencing/transfers seen in recent years:
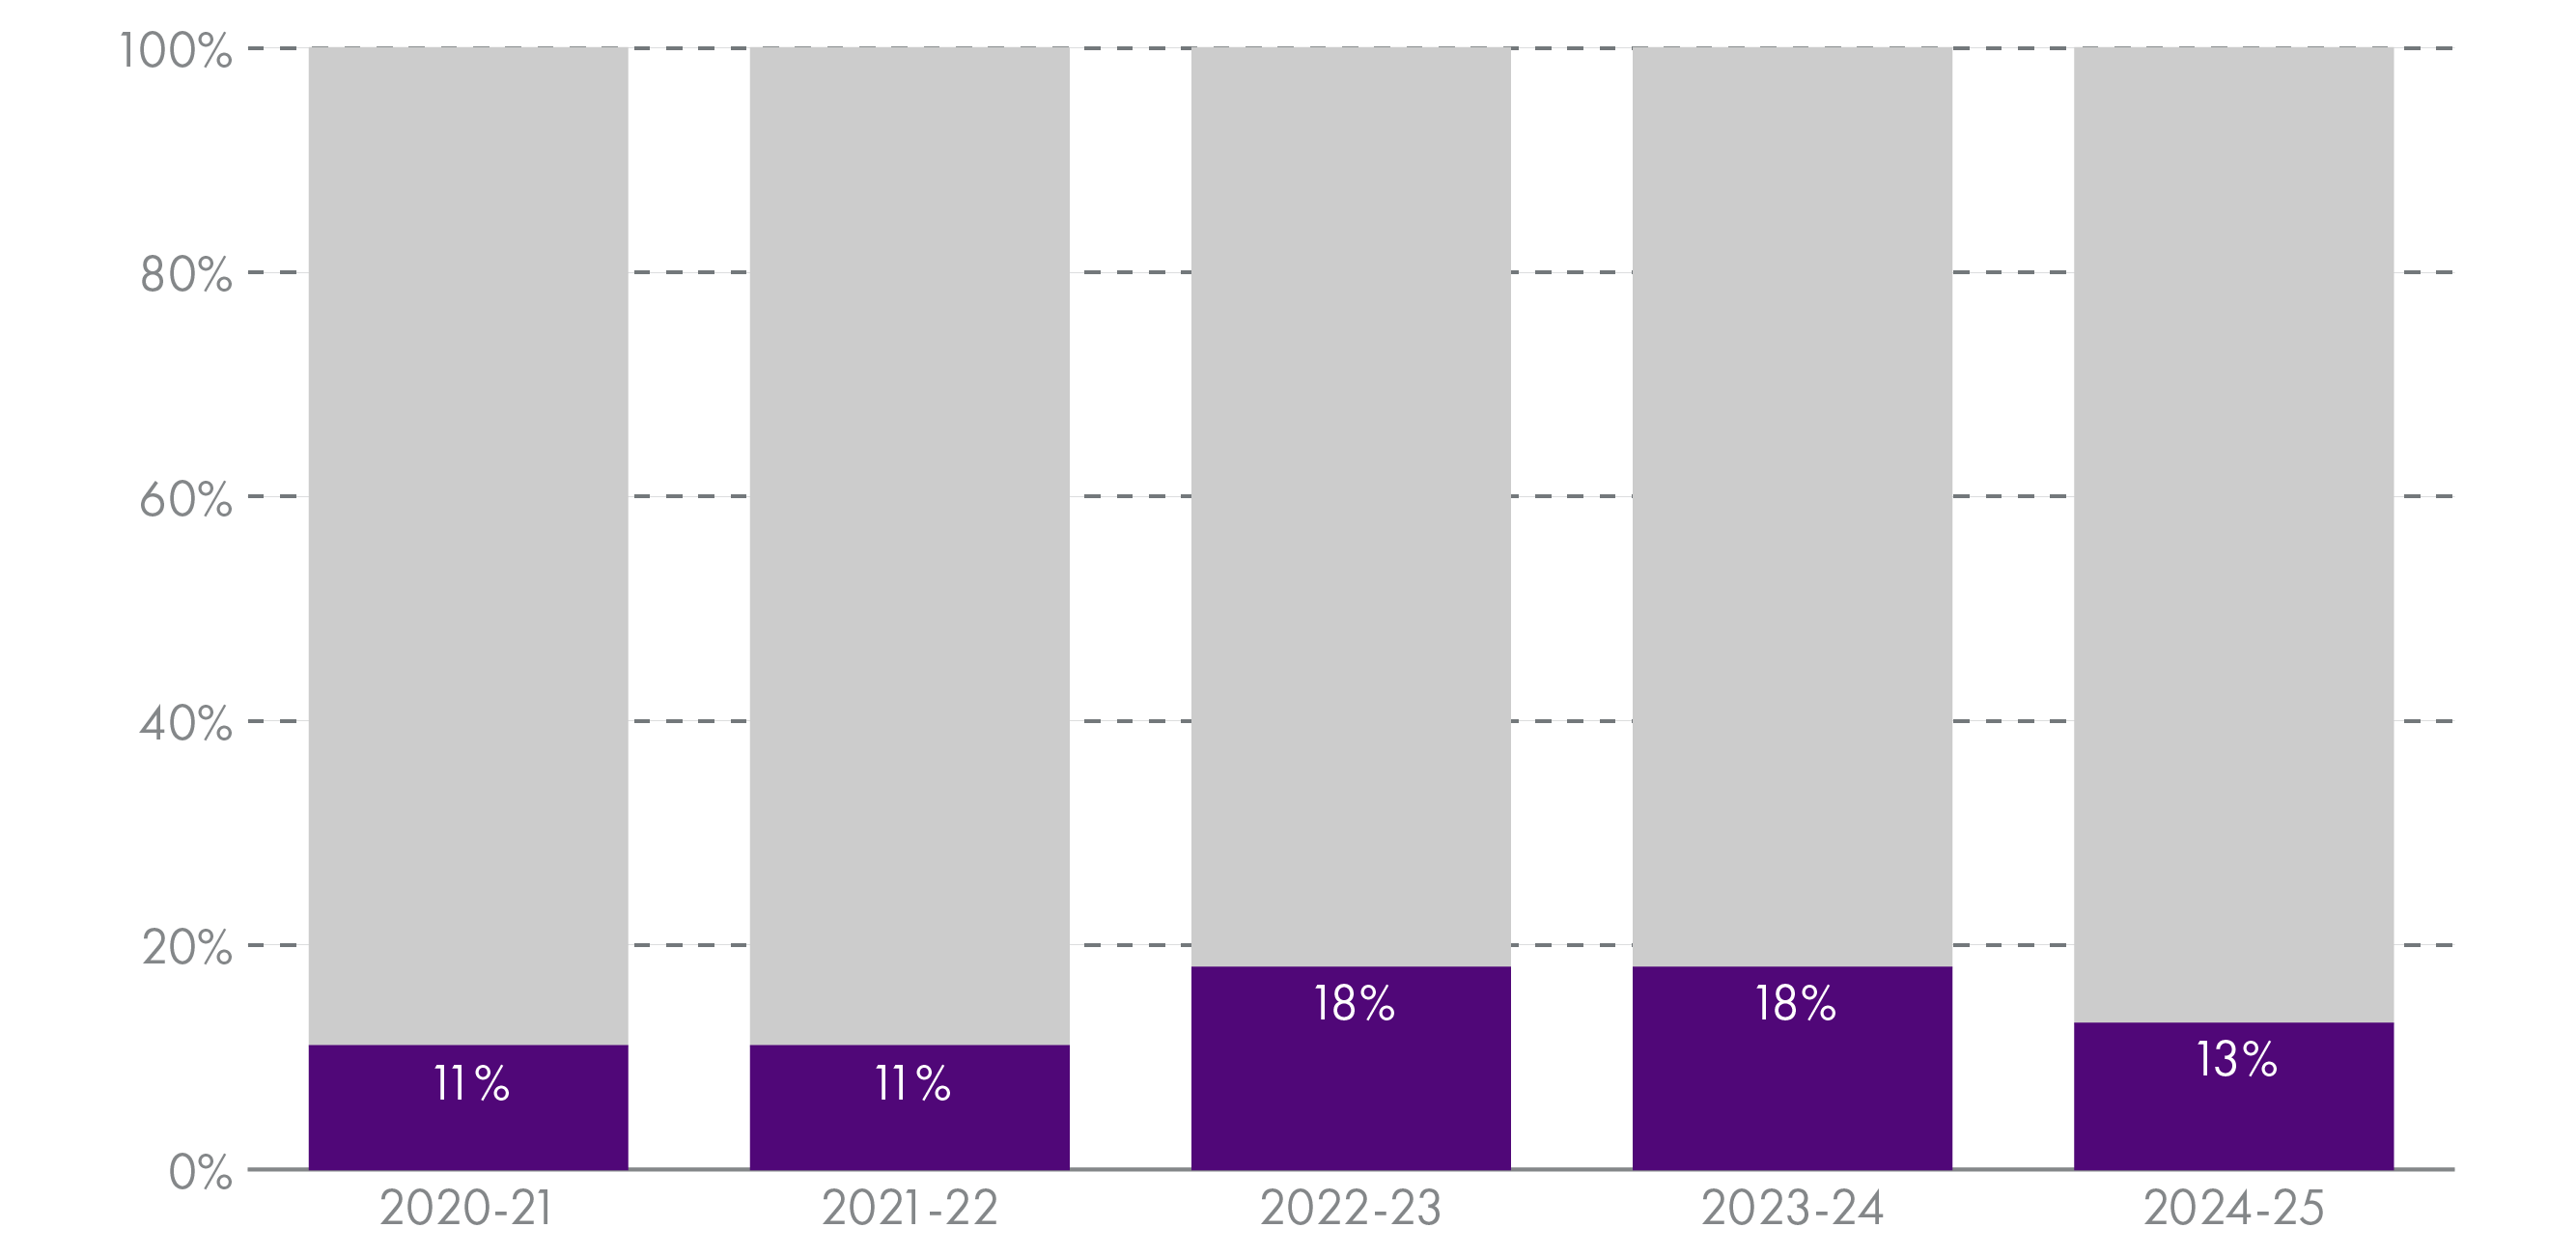
SPICe analysis of Scottish Government Budget documents
Local government capital settlement
The local government allocation in the Scottish Budget also includes capital funding, which councils spend on new or existing physical assets, e.g. new buildings, repairs, roads, etc as well as the purchase of vehicles and machinery. Like revenue allocations, capital grants from the Scottish Government take the form of general and specific (ring-fenced) grants. Unlike the revenue budgets discussed above, the 2024-25 capital settlement sees significant reductions in both cash and real terms:
| 2023-24 Budget document | 2024-25 Budget document | Cash change (£m) | Cash change % | |
| General Capital Grant | 607.6 | 476.9 | -130.7 | -21.5% |
| Specific (ring-fenced) capital grants | 139.0 | 121.1 | -17.9 | -12.9% |
| Capital Funding within other Portfolios | 80.0 | 40.0 | -40.0 | -50.0% |
| Total capital in Finance Circular | 826.6 | 638.0 | -188.6 | -22.8% |
| 2023-24 Budget document | 2024-25 Budget document | Real change (£m) | Real change % | |
| General Capital Grant | 607.6 | 469.0 | -138.6 | -22.8% |
| Specific (ring-fenced) capital grants | 139.0 | 119.10 | -19.9 | -14.3% |
| Capital Funding within other Portfolios | 80.0 | 39.3 | -40.7 | -50.8% |
| Total capital in Finance Circular | 826.6 | 627.5 | -199.1 | -24.1% |
Much of the reduction in the capital allocation is accounted for by £120.6 million being switched from capital to revenue budgets in 2024-25 (to help fund pay deals). This £120.6 million was in the capital budget line in 2022-23 and 2023-24 (even though it was subsequently used by councils to support revenue budgets by reversing previous plans locally which were to use revenue for capital purposes), but is included upfront in the revenue budget this year. Speaking to the Local Government, Housing and Planning Committee in January1, COSLA's Chief Officer for Local Government Finance, Mirren Kelly, explains:
...[the £120.6 million] was put into the local government settlement as capital to support the 2022-23 pay deal. That was done by agreement with local government, whereby we identified areas where we could effectively release revenue by having the capital funding....At that point, however, we said that we could sustain that for only two years and that it must come in as revenue funding from this year [2024-25] onwards.
The treatment is therefore different this year, and it has been included in the General Revenue Grant rather than the capital budget. However, even accounting for this, capital budgets reduce significantly over the year. COSLA estimates that the budget shows a cash reduction of £54.9 million to local government's capital grant funding between 2023-24 and 2024-252.
Individual local authority settlements
The Scottish Government uses a needs-based formula, agreed with COSLA, to allocate the overall local government settlement. This aims to take into account variations in the demands for services and the costs of providing them to a similar standard. Applying this formula to the overall revenue settlement allows the Scottish Government to allocate revenue funding to Scotland's 32 local authorities. For more information on how the Scottish Government allocates funding please see the Scottish Government's Funding of Local Government in Scotland, 2023-2024 document1.
Change in allocations between 2023-24 and 2024-25
Finance Circular 8/2023 includes provisional revenue and capital allocations for local authorities. Consultation on these figures is taking place between the Scottish Government and COSLA in advance of the Local Government Finance (Scotland) Order 2024 being presented to the Scottish Parliament in late February. Final allocations will likely be published in a circular in early March.
Charts 13 and 14 show provisional revenue allocations for each local authority as they appear in Finance Circulars 11/2022 and 8/2023, showing cash and real terms changes over the year:
| Local Authority - Finance circular, Annex B | 2023-24 (from 11/2022) | 2024-25 (from 8/23) | Cash change (£m) | Cash change % |
| Aberdeen City | 432.1 | 454.2 | 22.0 | 5.1% |
| Aberdeenshire | 534.8 | 572.9 | 38.1 | 7.1% |
| Angus | 253.0 | 267.1 | 14.1 | 5.6% |
| Argyll & Bute | 230.9 | 242.0 | 11.1 | 4.8% |
| Clackmannanshire | 117.7 | 124.6 | 6.9 | 5.8% |
| Dumfries & Galloway | 351.5 | 370.4 | 18.9 | 5.4% |
| Dundee City | 357.1 | 377.2 | 20.1 | 5.6% |
| East Ayrshire | 288.4 | 303.1 | 14.7 | 5.1% |
| East Dunbartonshire | 230.7 | 252.0 | 21.3 | 9.2% |
| East Lothian | 219.0 | 237.3 | 18.2 | 8.3% |
| East Renfrewshire | 220.6 | 239.7 | 19.1 | 8.7% |
| Edinburgh, City of | 940.2 | 988.6 | 48.5 | 5.2% |
| Eilean Siar | 108.3 | 111.4 | 3.1 | 2.9% |
| Falkirk | 349.0 | 366.5 | 17.5 | 5.0% |
| Fife | 813.4 | 862.0 | 48.6 | 6.0% |
| Glasgow City | 1,518.7 | 1,591.0 | 72.3 | 4.8% |
| Highland | 555.4 | 582.1 | 26.7 | 4.8% |
| Inverclyde | 199.2 | 208.6 | 9.4 | 4.7% |
| Midlothian | 203.2 | 218.9 | 15.7 | 7.7% |
| Moray | 202.9 | 214.2 | 11.3 | 5.6% |
| North Ayrshire | 335.0 | 353.1 | 18.1 | 5.4% |
| North Lanarkshire | 768.7 | 813.4 | 44.7 | 5.8% |
| Orkney | 89.1 | 95.6 | 6.5 | 7.3% |
| Perth & Kinross | 317.3 | 337.7 | 20.5 | 6.5% |
| Renfrewshire | 389.8 | 416.5 | 26.7 | 6.8% |
| Scottish Borders | 257.8 | 272.5 | 14.8 | 5.7% |
| Shetland | 102.8 | 111.9 | 9.1 | 8.9% |
| South Ayrshire | 253.5 | 269.7 | 16.2 | 6.4% |
| South Lanarkshire | 696.8 | 742.7 | 45.9 | 6.6% |
| Stirling | 208.2 | 218.8 | 10.6 | 5.1% |
| West Dunbartonshire | 227.0 | 238.6 | 11.6 | 5.1% |
| West Lothian | 399.4 | 424.1 | 24.7 | 6.2% |
| Local Authority - Finance circular, Annex B | 2023-24 (from 11/2022) | 2024-25 (from 8/23) | Real change (£m) | Real change % |
| Aberdeen City | 432.1 | 446.7 | 14.5 | 3.4% |
| Aberdeenshire | 534.8 | 563.4 | 28.6 | 5.4% |
| Angus | 253.0 | 262.7 | 9.7 | 3.8% |
| Argyll & Bute | 230.9 | 238.0 | 7.1 | 3.1% |
| Clackmannanshire | 117.7 | 122.5 | 4.8 | 4.1% |
| Dumfries & Galloway | 351.5 | 364.2 | 12.8 | 3.6% |
| Dundee City | 357.1 | 371.0 | 13.9 | 3.9% |
| East Ayrshire | 288.4 | 298.1 | 9.7 | 3.4% |
| East Dunbartonshire | 230.7 | 247.8 | 17.1 | 7.4% |
| East Lothian | 219.0 | 233.3 | 14.3 | 6.5% |
| East Renfrewshire | 220.6 | 235.7 | 15.2 | 6.9% |
| Edinburgh, City of | 940.2 | 972.3 | 32.2 | 3.4% |
| Eilean Siar | 108.3 | 109.6 | 1.3 | 1.2% |
| Falkirk | 349.0 | 360.5 | 11.5 | 3.3% |
| Fife | 813.4 | 847.8 | 34.4 | 4.2% |
| Glasgow City | 1,518.7 | 1,564.7 | 46.0 | 3.0% |
| Highland | 555.4 | 572.5 | 17.1 | 3.1% |
| Inverclyde | 199.2 | 205.2 | 6.0 | 3.0% |
| Midlothian | 203.2 | 215.3 | 12.1 | 6.0% |
| Moray | 202.9 | 210.7 | 7.8 | 3.8% |
| North Ayrshire | 335.0 | 347.3 | 12.2 | 3.6% |
| North Lanarkshire | 768.7 | 800.0 | 31.3 | 4.1% |
| Orkney | 89.1 | 94.0 | 5.0 | 5.6% |
| Perth & Kinross | 317.3 | 332.2 | 14.9 | 4.7% |
| Renfrewshire | 389.8 | 409.6 | 19.8 | 5.1% |
| Scottish Borders | 257.8 | 268.0 | 10.3 | 4.0% |
| Shetland | 102.8 | 110.0 | 7.3 | 7.1% |
| South Ayrshire | 253.5 | 265.2 | 11.7 | 4.6% |
| South Lanarkshire | 696.8 | 730.4 | 33.6 | 4.8% |
| Stirling | 208.2 | 215.2 | 7.0 | 3.4% |
| West Dunbartonshire | 227.0 | 234.6 | 7.6 | 3.4% |
| West Lothian | 399.4 | 417.1 | 17.7 | 4.4% |
Every local authority sees a cash and real terms increase over the year when comparing provisional allocations. However, just as we can compare Budget 2024-25 figures with out-turn 2023-24 figures for the total Scottish allocation, we can do the same for the individual local authority allocations. Tables 15 and 16 compare figures as they appear in Finance Circular 8/2023, in both cash and real terms (see Annex A)1. It is worth stating that the 2024-25 Finance Circular includes £365 million of currently undistributed revenue. This will be distributed to councils throughout the year and will positively impact the figures for 2024-25:
| Local Authority - Finance circular, Annex B, and Annex C | 2023-24 out-turn (from 8/2023) | 2024-25 provisional (from 8/23) | Cash change (£m) | Cash change % |
| Aberdeen City | 454.0 | 454.2 | 0.2 | 0.0% |
| Aberdeenshire | 557.2 | 572.9 | 15.7 | 2.8% |
| Angus | 264.5 | 267.1 | 2.6 | 1.0% |
| Argyll & Bute | 239.7 | 242.0 | 2.3 | 1.0% |
| Clackmannanshire | 123.6 | 124.6 | 0.9 | 0.8% |
| Dumfries & Galloway | 367.4 | 370.4 | 3.0 | 0.8% |
| Dundee City | 376.4 | 377.2 | 0.8 | 0.2% |
| East Ayrshire | 302.8 | 303.1 | 0.4 | 0.1% |
| East Dunbartonshire | 244.4 | 252.0 | 7.6 | 3.1% |
| East Lothian | 229.3 | 237.3 | 8.0 | 3.5% |
| East Renfrewshire | 232.5 | 239.7 | 7.2 | 3.1% |
| Edinburgh, City of | 985.1 | 988.6 | 3.5 | 0.4% |
| Eilean Siar | 111.6 | 111.4 | -0.2 | -0.2% |
| Falkirk | 367.3 | 366.5 | -0.8 | -0.2% |
| Fife | 852.2 | 862.0 | 9.8 | 1.1% |
| Glasgow City | 1,590.6 | 1,591.0 | 0.3 | 0.0% |
| Highland | 578.9 | 582.1 | 3.2 | 0.6% |
| Inverclyde | 208.4 | 208.6 | 0.2 | 0.1% |
| Midlothian | 213.0 | 218.9 | 5.9 | 2.8% |
| Moray | 213.2 | 214.2 | 1.0 | 0.5% |
| North Ayrshire | 351.1 | 353.1 | 2.0 | 0.6% |
| North Lanarkshire | 808.3 | 813.4 | 5.1 | 0.6% |
| Orkney | 92.0 | 95.6 | 3.6 | 4.0% |
| Perth & Kinross | 330.8 | 337.7 | 6.9 | 2.1% |
| Renfrewshire | 409.5 | 416.5 | 6.9 | 1.7% |
| Scottish Borders | 269.6 | 272.5 | 3.0 | 1.1% |
| Shetland | 105.8 | 111.9 | 6.1 | 5.8% |
| South Ayrshire | 266.4 | 269.7 | 3.3 | 1.2% |
| South Lanarkshire | 730.5 | 742.7 | 12.1 | 1.7% |
| Stirling | 218.2 | 218.8 | 0.6 | 0.3% |
| West Dunbartonshire | 238.3 | 238.6 | 0.2 | 0.1% |
| West Lothian | 421.1 | 424.1 | 3.1 | 0.7% |
Scottish Government Finance Circular 8/2023
| Local Authority - Finance circular, Annex B and Annex C | 2023-24 out-turn (from 8/2023) | 2024-25 provisional (from 8/23) | Real change (£m) | Real change % |
| Aberdeen City | 454.0 | 446.7 | -7.3 | -1.6% |
| Aberdeenshire | 557.2 | 563.4 | 6.2 | 1.1% |
| Angus | 264.5 | 262.7 | -1.8 | -0.7% |
| Argyll & Bute | 239.7 | 238.0 | -1.7 | -0.7% |
| Clackmannanshire | 123.6 | 122.5 | -1.1 | -0.9% |
| Dumfries & Galloway | 367.4 | 364.2 | -3.1 | -0.9% |
| Dundee City | 376.4 | 371.0 | -5.4 | -1.4% |
| East Ayrshire | 302.8 | 298.1 | -4.6 | -1.5% |
| East Dunbartonshire | 244.4 | 247.8 | 3.4 | 1.4% |
| East Lothian | 229.3 | 233.3 | 4.0 | 1.8% |
| East Renfrewshire | 232.5 | 235.7 | 3.3 | 1.4% |
| Edinburgh, City of | 985.1 | 972.3 | -12.8 | -1.3% |
| Eilean Siar | 111.6 | 109.6 | -2.0 | -1.8% |
| Falkirk | 367.3 | 360.5 | -6.9 | -1.9% |
| Fife | 852.2 | 847.8 | -4.4 | -0.5% |
| Glasgow City | 1,590.6 | 1,564.7 | -25.9 | -1.6% |
| Highland | 578.9 | 572.5 | -6.4 | -1.1% |
| Inverclyde | 208.4 | 205.2 | -3.2 | -1.6% |
| Midlothian | 213.0 | 215.3 | 2.3 | 1.1% |
| Moray | 213.2 | 210.7 | -2.6 | -1.2% |
| North Ayrshire | 351.1 | 347.3 | -3.8 | -1.1% |
| North Lanarkshire | 808.3 | 800.0 | -8.3 | -1.0% |
| Orkney | 92.0 | 94.0 | 2.1 | 2.2% |
| Perth & Kinross | 330.8 | 332.2 | 1.4 | 0.4% |
| Renfrewshire | 409.5 | 409.6 | 0.0 | 0.0% |
| Scottish Borders | 269.6 | 268.0 | -1.5 | -0.6% |
| Shetland | 105.8 | 110.0 | 4.3 | 4.0% |
| South Ayrshire | 266.4 | 265.2 | -1.2 | -0.4% |
| South Lanarkshire | 730.5 | 730.4 | -0.1 | 0.0% |
| Stirling | 218.6 | 215.2 | -3.0 | -1.4% |
| West Dunbartonshire | 238.3 | 234.6 | -3.7 | -1.6% |
| West Lothian | 421.1 | 417.1 | -3.9 | -0.9% |
Scottish Government Finance Circular 8/2023
When comparing provisional 2024-25 figures with out-turn 2023-24 allocations, we can see small real terms decreases for most councils. However, as stated above, the figures for 2024-25 do not yet include £365 million worth of undistributed funds, which will be distributed to councils throughout the year.
Local government revenue per head by local authority
For illustrative purposes Table 17 and Figure 3 show 2024-25 revenue allocations as a per head of population calculation by local authority area. This uses allocations from Finance Circular 8/20231 and mid-year population estimates for 2021 from the National Records of Scotland2. It is worth noting that the formula used to allocate funding takes into account a whole range of indicators from population and deprivation to road length and remoteness.
| Local Authority - Finance circular | 2024-25 (£) | Population | Revenue allocation per head |
| Aberdeen City | 454,180,000 | 227,430 | 1,997 |
| Aberdeenshire | 572,859,000 | 262,690 | 2,181 |
| Angus | 267,106,000 | 116,120 | 2,300 |
| Argyll & Bute | 242,001,000 | 86,220 | 2,807 |
| Clackmannanshire | 124,556,000 | 51,540 | 2,417 |
| Dumfries & Galloway | 370,358,000 | 148,790 | 2,489 |
| Dundee City | 377,208,000 | 147,720 | 2,554 |
| East Ayrshire | 303,127,000 | 122,020 | 2,484 |
| East Dunbartonshire | 251,987,000 | 108,900 | 2,314 |
| East Lothian | 237,263,000 | 109,580 | 2,165 |
| East Renfrewshire | 239,690,000 | 96,580 | 2,482 |
| Edinburgh, City of | 988,629,000 | 526,470 | 1,878 |
| Eilean Siar | 111,411,000 | 26,640 | 4,182 |
| Falkirk | 366,538,000 | 160,700 | 2,281 |
| Fife | 861,984,000 | 374,730 | 2,300 |
| Glasgow City | 1,590,981,000 | 635,130 | 2,505 |
| Highland | 582,135,000 | 238,060 | 2,445 |
| Inverclyde | 208,601,000 | 76,700 | 2,720 |
| Midlothian | 218,905,000 | 94,680 | 2,312 |
| Moray | 214,201,000 | 96,410 | 2,222 |
| North Ayrshire | 353,087,000 | 134,220 | 2,631 |
| North Lanarkshire | 813,424,000 | 341,400 | 2,383 |
| Orkney | 95,596,000 | 22,540 | 4,241 |
| Perth & Kinross | 337,738,000 | 153,810 | 2,196 |
| Renfrewshire | 416,455,000 | 179,940 | 2,314 |
| Scottish Borders | 272,537,000 | 116,020 | 2,349 |
| Shetland | 111,883,000 | 22,940 | 4,877 |
| South Ayrshire | 269,665,000 | 112,450 | 2,398 |
| South Lanarkshire | 742,664,000 | 322,630 | 2,302 |
| Stirling | 218,780,000 | 93,470 | 2,341 |
| West Dunbartonshire | 238,568,000 | 87,790 | 2,717 |
| West Lothian | 424,136,000 | 185,580 | 2,285 |
| Scotland distributable revenue average | 12,878,253,000 | 5,479,900 | 2,350 |
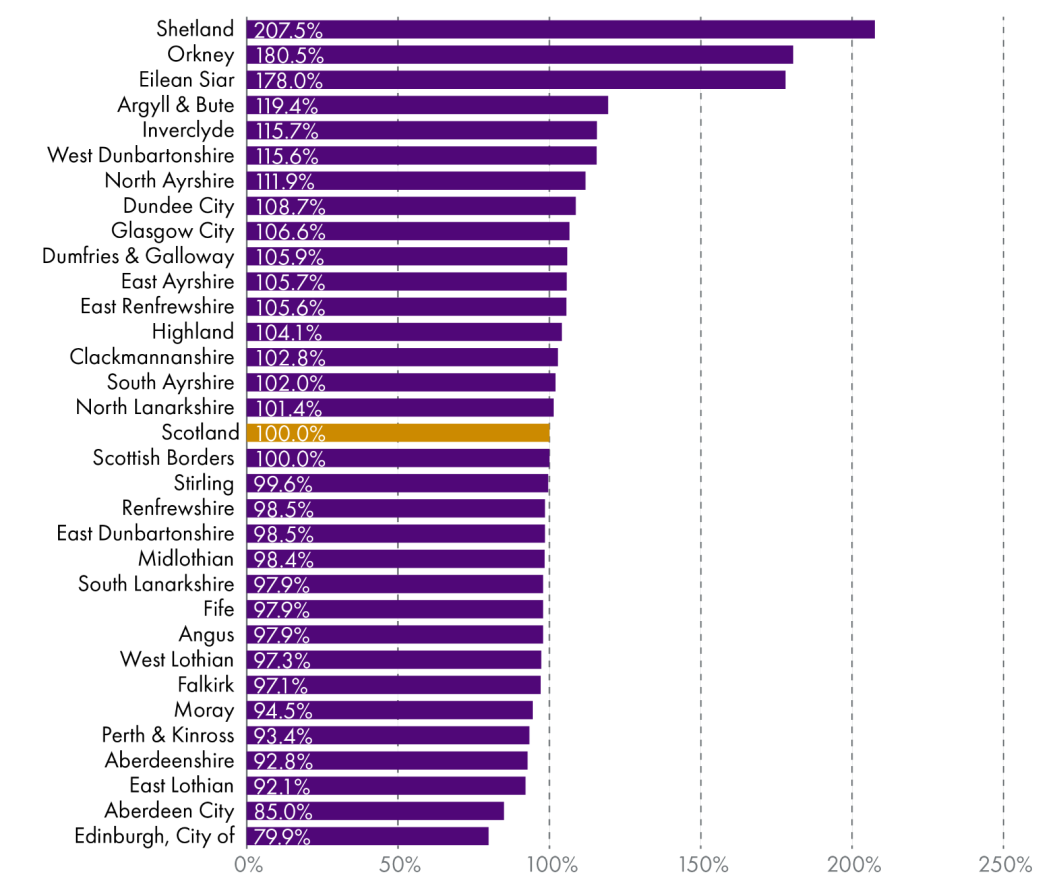
Figure 3 shows revenue allocation per head as a percentage of the Scottish average, with Scotland being 100%. Island local authorities clearly have the highest allocations per head, whilst Edinburgh and Aberdeen have the lowest. These two cities two have higher levels of anticipated council tax income than the national average; council tax receipts in these cities are expected to represent 19% and 17% of total estimated expenditure in 2024-25, as compared to 14% nationally, and less than 10% in Orkney, Eilean Siar and Shetland.
Local Government Finance Circular 8/2023Scottish Government. (2023, December 22). Local Government Finance Circular 8/2023. Retrieved from https://www.gov.scot/publications/local-government-finance-circular-8-2023-settlement-for-2024-to-2025/ and National Records of Scotland mid-year population estimatesNational Records of Scotland. (2022). Mid-year population estimates 2021. Retrieved from https://www.nrscotland.gov.uk/statistics-and-data/statistics/statistics-by-theme/population/population-estimates/mid-year-population-estimates/mid-2021
Council tax freeze
Four months after the signing of the Verity House Agreement, the First Minister announced at the SNP party conference the Government's intention to freeze council tax in 2024-25, without having first consulted COSLA. Council leaders expressed their “extreme disappointment” with the announcement, stating that “the First Minister chose to undermine the spirit and the letter of the Verity House Agreement (VHA), so soon after it being signed”. Despite this, the Scottish Government argued that it remains “wholly committed” to the VHA, with the Minister for Community Wealth and Public Finance telling the Local Government, Housing and Planning Committee in November:
We are very much committed to partnership working right across all aspects of the new deal with local government and specifically with regard to the council tax freeze. We are committed to ensuring that we can implement it in a way that meets the requirements set by the First Minister that it be fully funded and that it deliver a freeze that will be of benefit to people across Scotland.1
Council tax is Scotland’s only truly local tax, in the sense that Band D rates are set by councils each year, local authorities collect the money, and the money raised is used to fund local services. It is therefore up to councils themselves to decide whether to implement a freeze or not.
In addition to the principle of central government announcing a freeze on a local tax before having first consulted local government, there is the practical question of how much a “fully funded” freeze would cost the Scottish Government should local authorities decide to implement a freeze. In her statement to the Parliament, the Deputy First Minister stated:
Let me be clear that the Government will fully fund the council tax freeze. This year, in 2023-24, councils set their average council tax increases below the level of inflation. The OBR projection for inflation in the coming year based on the consumer prices index is 3 per cent. Of course, I could fund an inflation-proof 3 per cent council tax freeze, but I want to help support services, so I will go further than that. I will fund an above-inflation 5 per cent council tax freeze, delivering more than £140 million of additional investment for local services.
In its response to the Scottish Budget, COSLA’s President Councillor Shona Morrison said:
COSLA’s initial analysis of the Budget is that the Council Tax freeze is not fully funded. Leaders from across Scotland agreed today that decisions on Council Tax can only be made by each full Council, and it is for each individual Council to determine their own level of Council Tax. With any sort of shortfall in core funding, the £144m revenue offered for the freeze is immediately worth less.2
As stated above, COSLA identify a £62.7 million cut to local government's core revenue allocation in the 2024-25 Budget. They say that subtracting this from the £144 million leaves only enough to fund a 2.8% increase in council tax3. In a further press release issued after a full meeting of Council Leaders in late January, COSLA stated:
Leaders were clear today that as well as the £144m, councils should still have the discretion to set their own council tax level. COSLA’s analysis of the £144 million is that it does not fully fund a council tax freeze due to cuts to our core budget.... Leaders also highlighted that in relation to the pay claims now being received from our trade union colleagues, there is no additional money for pay in the Budget as it stands and that this will endanger local jobs and services. Leaders agreed to lobbying both UK and Scottish Government in relation to funding for pay.4
Sources
Scottish Government. (2023, December 19). Scottish Budget 2024-25. Retrieved from <a href="https://www.gov.scot/publications/scottish-budget-2024-25/" target="_blank">https://www.gov.scot/publications/scottish-budget-2024-25/</a>
Scottish Government. (2023, December 22). Local Government Finance Circular 8/2023. Retrieved from <a href="https://www.gov.scot/publications/local-government-finance-circular-8-2023-settlement-for-2024-to-2025/" target="_blank">https://www.gov.scot/publications/local-government-finance-circular-8-2023-settlement-for-2024-to-2025/</a>
Scottish Government. (2022). Scottish Budget 2023-24. Retrieved from <a href="https://www.gov.scot/collections/scottish-budget-2023-to-2024-documents/" target="_blank">https://www.gov.scot/collections/scottish-budget-2023-to-2024-documents/</a>
Scottish Parliament. (2018). Written Agreement between the Finance and Constitution Committee and the Scottish Government. Retrieved from <a href="https://archive2021.parliament.scot/S5_Finance/General%20Documents/2018.02.22.Letter_to_SPPA.pdf" target="_blank">https://archive2021.parliament.scot/S5_Finance/General%20Documents/2018.02.22.Letter_to_SPPA.pdf</a>
Scottish Parliament. (2024, January 16). Official Report, Local Government, Housing and Planning Committee, Tuesday, January 9, 2024. Retrieved from <a href="https://www.parliament.scot/chamber-and-committees/official-report/search-what-was-said-in-parliament/LGHP-09-01-2024?meeting=15640&iob=133473" target="_blank">https://www.parliament.scot/chamber-and-committees/official-report/search-what-was-said-in-parliament/LGHP-09-01-2024?meeting=15640&iob=133473</a>
Scottish Parliament. (2023). Official Report for Local Government, Housing and Planning Committee Tuesday, January 16, 2024 session. Retrieved from <a href="https://www.parliament.scot/chamber-and-committees/official-report/search-what-was-said-in-parliament/LGHP-16-01-2024?meeting=15653&iob=133572" target="_blank">https://www.parliament.scot/chamber-and-committees/official-report/search-what-was-said-in-parliament/LGHP-16-01-2024?meeting=15653&iob=133572</a>
COSLA. (2023, December 21). COSLA Response to Scottish Government Budget Announcement. Retrieved from <a href="https://www.cosla.gov.uk/news/2023/cosla-response-to-scottish-budget-announcement" target="_blank">https://www.cosla.gov.uk/news/2023/cosla-response-to-scottish-budget-announcement</a>
Scottish Government. (2023, March 2). Funding of Local Government in Scotland, 2023-2024. Retrieved from <a href="https://www.gov.scot/publications/funding-local-government-scotland-2023-24/" target="_blank">https://www.gov.scot/publications/funding-local-government-scotland-2023-24/</a>
National Records of Scotland. (2022). Mid-year population estimates 2021. Retrieved from <a href="https://www.nrscotland.gov.uk/statistics-and-data/statistics/statistics-by-theme/population/population-estimates/mid-year-population-estimates/mid-2021" target="_blank">https://www.nrscotland.gov.uk/statistics-and-data/statistics/statistics-by-theme/population/population-estimates/mid-year-population-estimates/mid-2021</a>
COSLA. (2024). Personal email correspondence between COSLA and SPICe. (n.p.): (n.p.).
COSLA. (2024, January 26). Council tax principle must remain. Retrieved from <a href="https://www.cosla.gov.uk/news/2024/council-tax-principle-must-remain" target="_blank">https://www.cosla.gov.uk/news/2024/council-tax-principle-must-remain</a>