Local government finance: Budget 2025-26 and provisional allocations to local authorities
This briefing focuses on both the overall local government settlement for 2025-26, as set out in the Scottish Government's Budget document, and the provisional allocations to local authorities, as set out in the most recent Local Government Finance Circular. It looks at how provisional allocations have changed over the year and how individual council allocations have changed since 2013-14.
Introduction
The main purpose of this briefing is to inform Members of the Scottish Parliament about the Budget allocation to local government and show changes to individual council allocations over time. The main sources of information are the 2025-26 Scottish Budget document1 published on 4th December 2024 and Local Government Finance Circular 10/2024 2published on 12th December 2024.
Perhaps the most striking aspect of this year's Budget has been the relatively positive response from COSLA and the degree to which there is general agreement between local government and Scottish Government on what the figures show. This has not always been the case. There appears to be a refreshing change of tone, perhaps demonstrating an improvement in the relationship between these two important spheres of government since the signing of the Verity House Agreement in summer 2023.
When compared with the 2024-25 Budget, this year's Budget includes a cash and real terms increase in both the resource and capital parts of of the local government settlement. Every council sees at least a 3% real terms increase in revenue allocation compared to the same time last year. Likewise, the overall capital allocation sees a 19% real terms increase compared to 2024-25. COSLA highlights that much of the increase relates to funding commitments announced in 2024-25 (or earlier) with costs being carried forward into 2025-26. Nevertheless, both the Scottish Government and COSLA state that there is a real-terms uplift.
Funding increases such as these make the road to a better relationship somewhat smoother. However, a potential pothole in this road could come next month when local authorities start discussing council tax increases for 2025-26. The Cabinet Secretary for Finance and Local Government has made it clear that “with record funding, there is no reason for big increases in council tax next year”. But that's now a decision for councils themselves to make. We know from the Local Government Information Unit that around a fifth of local authorities had been considering raising council tax by at least 10% next year. Increases of this scale would be very unpopular, and the Scottish Government could find itself being blamed just as much as the councils themselves.
This year, the presentation of the figures in the main Budget document was different with 2024-25 figures set out to show changes made at the 2024-25 Autumn Budget Revision. For the local government budget, this can present a misleading picture, due to the number of in-year transfers that take place in this portfolio area. For this reason, all the figures in this briefing are presented comparing 2025-26 Budget with the 2024-25 Budget (before revisions), as is the usual practice for the SPICe local government budget briefing.
Sources of local authority funding
Local authorities in Scotland are responsible for delivering a wide range of vitally important services, including pre-school care, primary and secondary education, adult social care, social work, local roads and transport, economic development, housing and planning, environmental protection, waste management, and cultural/leisure services.
The Scottish Government’s position is that “councils operate independently of central government and are accountable to their electorates for the services they provide”. However, they are not financially independent. Table 1 shows that the largest single element of local government's income in 2022-23 came from the Scottish Government, in the form of General Revenue Grant (GRG):
| Source | 2022-23 (£bn) | % of total revenue income |
| General Revenue Grant | 8.7 | 35% |
| Non-Domestic Rates | 2.8 | 11% |
| Other grants (including ring-fenced from SG) | 2.9 | 12% |
| Council tax | 2.8 | 11% |
| Customer and client receipts | 2.9 | 12% |
| Other grants, reimbursements and contributions | 4.7 | 19% |
| Total revenue income | 24.8 | 100% |
Source: Scottish Local Government Finance Statistics 2022-23. Calculations based on the method used by the 2016 Commission on Local Tax Reform (see p.13).
The Scottish Government provides a block grant to local government consisting of the General Revenue Grant, Non-Domestic Rates income and a number of Specific Revenue Grants. Details of these allocations, plus their capital equivalents, are set out in the annual Scottish Government Budget document and associated Local Government Finance Circulars. These are what we will focus on in the remainder of the briefing.
Local government revenue settlement
Unusually, COSLA has been relatively positive about the Scottish Budget this year, with the organisation welcoming "the Scottish Government’s efforts to provide Local Government with a real terms funding increase for the coming year". It still highlights the "continued financial challenge" faced by local authorities and notes that "it will take more than a single year’s settlement to restore the financial position of local authorities". Nevertheless, there is a noticeable difference in tone coming from COSLA compared to previous years.
Comparing 2025-26 to the 2024-25 settlement
Comparing Budget document 2024-25 and Budget document 2025-26 we see both cash and real terms increases in the overall revenue allocation (see Tables 2 and 3).
| Local Government (Revenue) | 2024-25 Budget document | 2025-26 Budget document | Cash change (£m) | Cash change % |
| General Revenue Grant | 8,404 | 9,458 | +1,054 | +12.5% |
| Non-Domestic Rates | 3,068 | 3,114 | +46 | +1.5% |
| Specific (ring-fenced) Resource Grants | 239 | 247 | +9 | +3.6% |
| Revenue within other portfolios | 1,534 | 1,438 | -96 | -6.3% |
| Total revenue in Finance Circular | 13,245 | 14,258 | +1,013 | +7.6% |
Table 3 shows that the total revenue settlement increases by 5.1% in real terms. However, this does not take into account the £144 million provided to local authorities in 2024-25 for the council tax freeze. When this is factored in, we see a cash terms increase of £869 million over the year, or a 4% increase in real terms.
| Local Government (Revenue) | 2024-25 Budget document | 2025-26 Budget document | Real change (£m) | Real change % |
| General Revenue Grant | 8,404 | 9,238 | +834 | +9.9% |
| Non-Domestic Rates | 3,068 | 3,041 | -27 | -0.9% |
| Specific (ring-fenced) Resource Grants | 239 | 242 | +3 | +1.2% |
| Revenue transferred from other portfolios | 1,534 | 1,405 | -130 | -8.4% |
| Total revenue in Finance Circular | 13,245 | 13,926 | +681 | +5.1% |
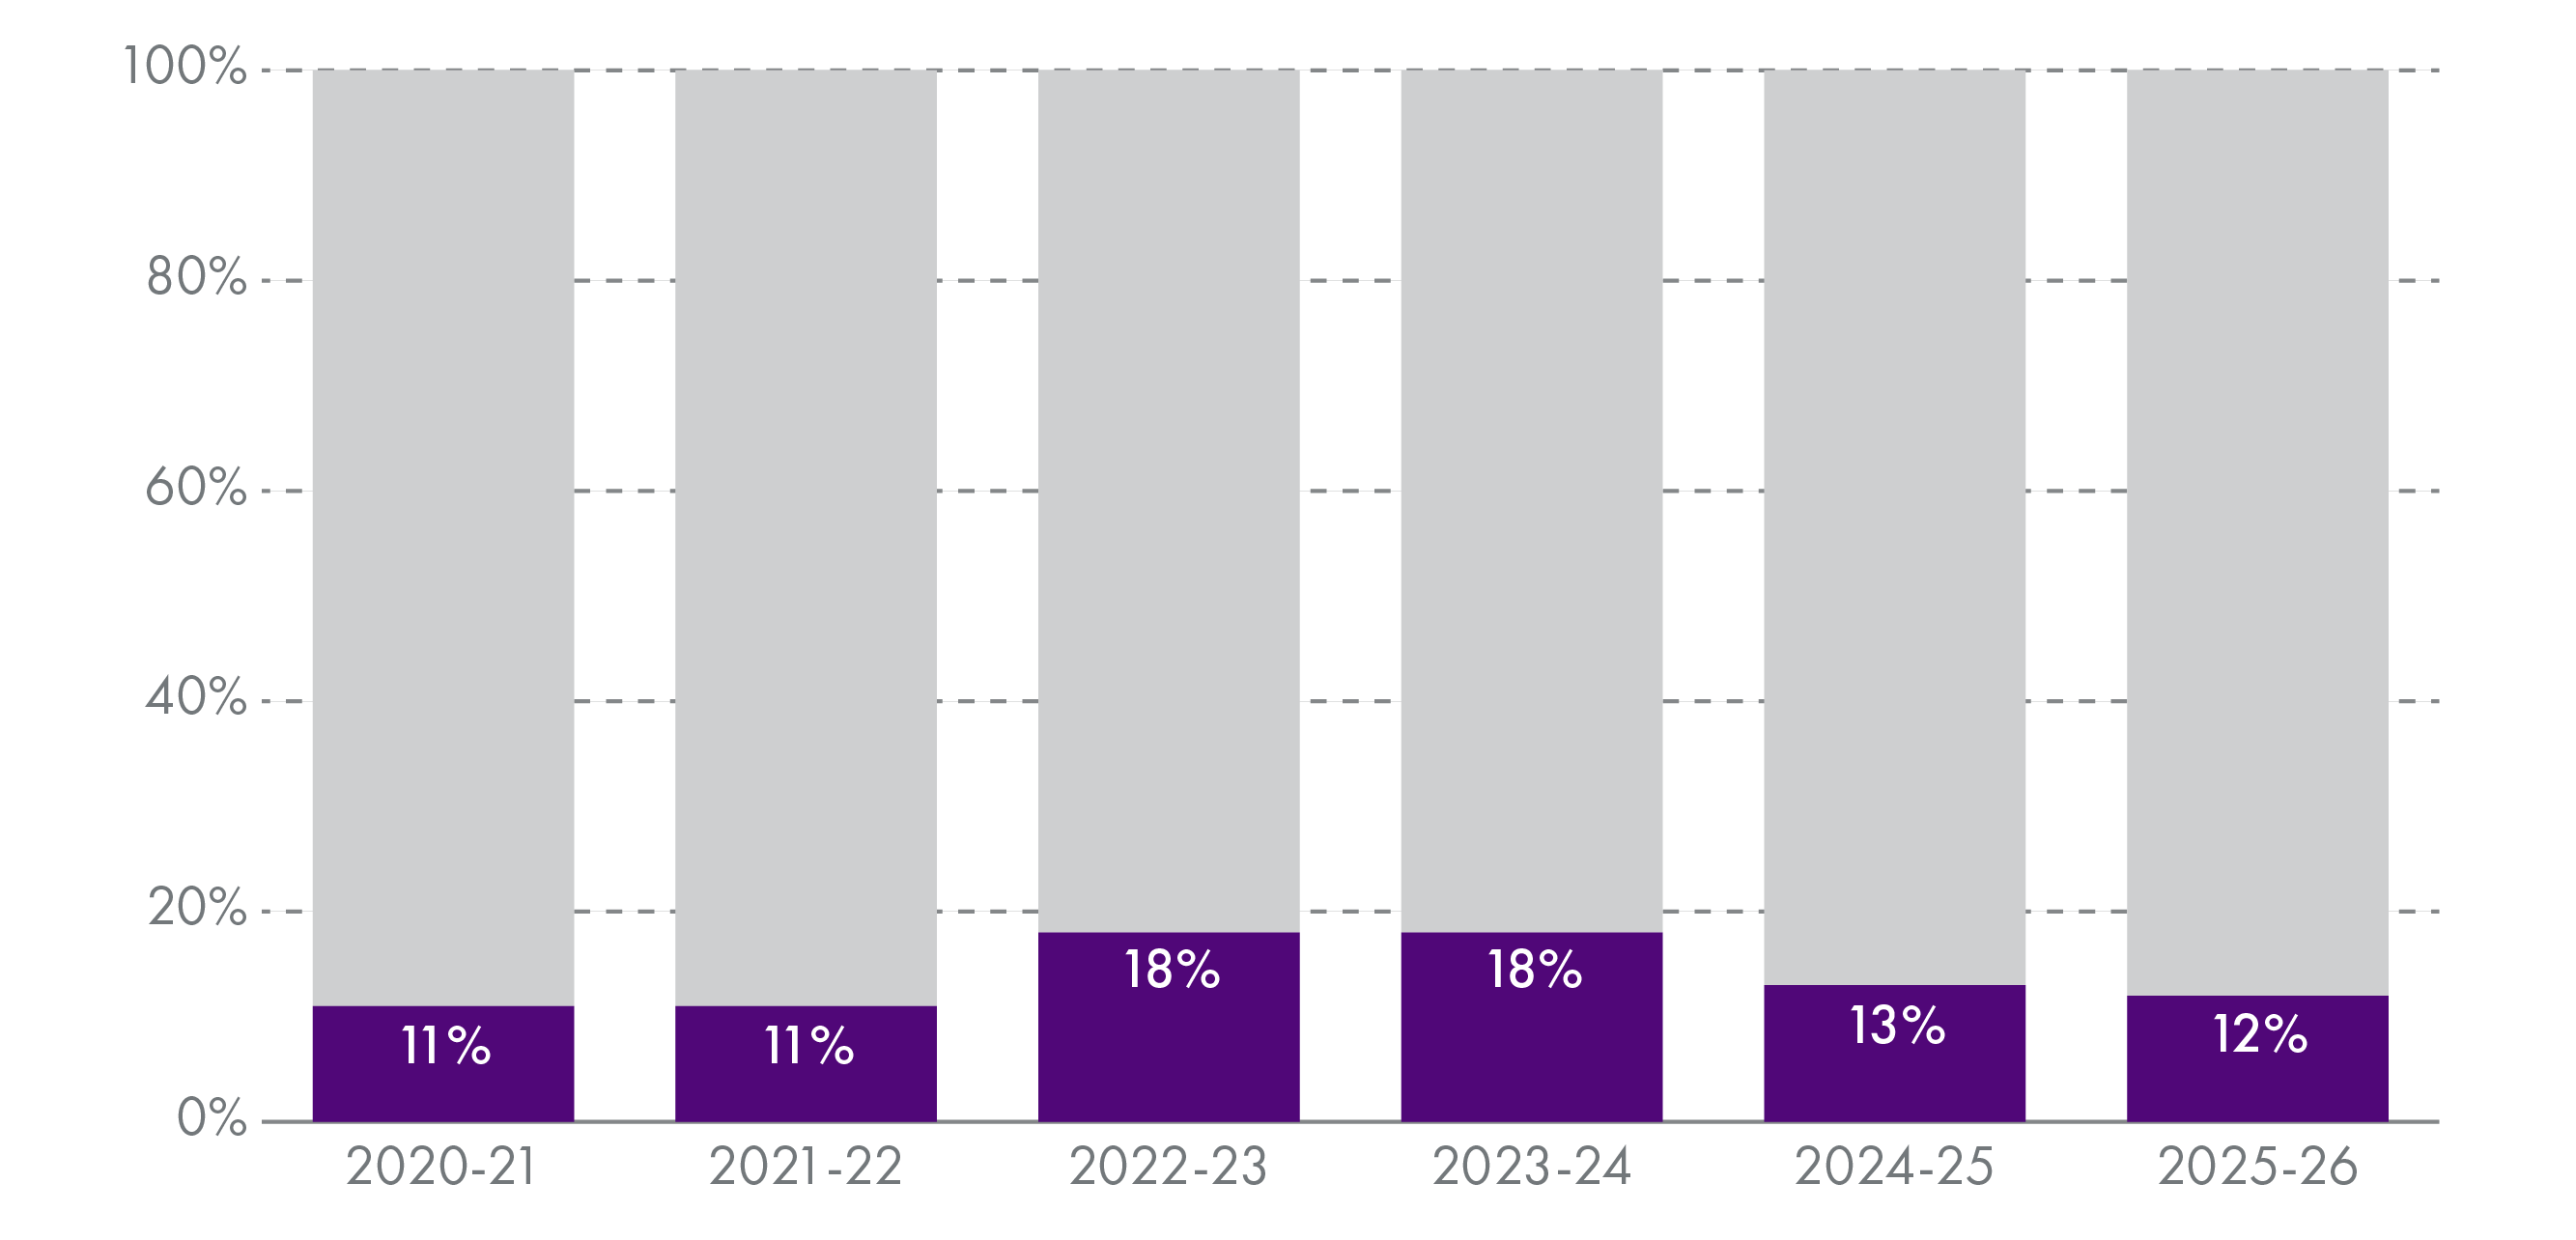
The amount of funding that is formally ring-fenced or transferred from other portfolios (a total of £1.7 billion in 2025-26) has reduced in both cash and real terms over the year. As a proportion of total revenue funding in the Finance Circular, it has reduced from 13% in 2024-25 to just under 12% in 2025-26. This demonstrates progress towards the "default position" of no ring-fencing or direction of funding as set out in the Verity House Agreement signed last summer.
COSLA state that much of the increase in General Revenue Grant relates to funding commitments announced in 2024-25 (or earlier) with costs being carried forward into 2025-261. The following table shows how these commitments are being met in the 2025-26 allocation:
| Revenue Change | Cost (£m) |
| Discretionary Housing Payment increase | 6.5 |
| Early Learning and Care Pay | 25.7 |
| Free Nursing Care | 10.0 |
| Real Living Wage | 125.0 |
| Additional Support for Learning | 28.0 |
| School workforce | 41.0 |
| Teachers Pay | 43.0 |
| Teachers Pension | 86.2 |
| Local Government Pay | 77.5 |
| 24-25 GRG Baselined | 62.7 |
| Mental Health Baselined | 15.0 |
| Minor in-year transfers Reductions | -0.8 |
| Child Social Care staff | 33.0 |
| Council tax freeze | 3.3 |
| Inter Islands (Ferries) Specific Grant | 8.6 |
| Free school meals increase | 15.0 |
| General Revenue Grant Uplift | 289.3 |
| Total Revenue increase | 869.0 |
After accounting for these costs, the remainder of the increase represents a General Revenue Grant uplift of £289.3 million. This, according to the Scottish Government, is “to deliver real terms protection” to councils, with COSLA noting that “the Budget reality is that there is £289.3m of additional uncommitted local government core revenue funding”1.
In its press release published after the all-leader meeting on 6th December, the COSLA leadership welcomed the real terms uplift whilst warning of the impact of increased employer National Insurance Contributions for councils. Finance Spokesperson, Cllr Katie Hagmann, also mentioned the issue of local government pay, which in theory is a matter for local authorities and their unions but for the past few summers have required Scottish Government intervening in some high profile disputes:
I look forward to constructive discussions with the Scottish Government over the coming months, to emphasise that the final Budget must address these risks and ensure that Local Government is fairly and adequately funded. This is essential if we are to relieve the pressures on our crucial services, such as social care, and ensure our workforce can receive the pay rise that they deserve next year.
Comparing Budgets over the past 13 years
The local government revenue settlement, as presented in the Scottish Government Budget has seen an increase of almost 10% in real terms since Draft Budget 2013-14. We should remember that over this period there have been some years when local government have seen significant real term annual reductions. However, for the past two years there have been real terms increases of 4% and 5%:
| Source | 2013-14 | 2025-26 | Change since 2013-14 | % change |
| General resource grant (GRG) | 9,256 | 9,238 | -18 | -0.2% |
| NDRI | 3,286 | 3,041 | - 245 | -7.4% |
| Specific resource grants | 133 | 242 | +108 | +81.0% |
| Transferred in-year from other Portfolios | - | 1,405 | +1,405 | - |
| Total revenue in provisional Finance Circulars | 12,681 | 13,926 | +1,245 | +9.8% |
Table 5shows that much of the increase in total revenue over the past 13 years has been in funding transferred in-year from other portfolios, mainly from health and education budgets. This is provided to support specific policies but does not have terms and conditions attached so is not formally ring-fenced. Instead, it is transferred to the local government settlement in-year and is included as part of the weekly General Revenue Grant payments made to councils. The Scottish Government argue that local authorities have autonomy to allocate this and other general funding on the basis of local needs and priorities (personal email correspondence).
During an evidence session in January 20241, both COSLA and CIPFA's Directors of Finance section stressed that local authorities do considerably more now than they did in 2013-14, particularly in the areas of early years provision, free school meals and adult social care. Stripping out the funding and costs of new policy requirements and comparing like-for-like over time is a very difficult exercise. COSLA also argues that the true costs of delivering new and enhanced services exceed the additional money allocated by the Scottish Government over the period. And if we look at only the GRG and NDR element of the Budget, we see a real terms reduction of 2% in the thirteen years since the 2013-14 Budget.
Local government revenue budget as a percentage of Scottish Government revenue budget
One way of assessing the importance of local government to the Scottish Government is by looking at the local government revenue allocation as a proportion of the Scottish Government's budget and comparing this over time.
We have already seen that total revenue going to local government, including General Revenue Grant, Non Domestic Rates income and ring-fenced grants, will amount to £14.3 billion in 2025-26. This is equivalent to 32.2% of the Scottish Government's total resource settlement (plus NDR).
| 2016-17 | 2017-18 | 2018-19 | 2019-20 | 2020-21 | 2021-22 | 2022-23 | 2023-24 | 2024-25 | 2025-26 | |
| LG revenue allocation from SG (£m) | 9,693 | 9,496 | 9,631 | 9,987 | 10,573 | 11,003 | 11,859 | 12,403 | 13,245 | 14,258 |
| SG Total revenue DEL+NDRI (£m) | 28,867 | 29,109 | 29,496 | 30,486 | 32,501 | 33,554 | 37,088 | 39,070 | 40,028 | 44,255 |
| LG as % of SG | 33.6% | 32.6% | 32.7% | 32.8% | 32.5% | 32.8% | 32.0% | 31.7% | 33.1% | 32.2% |
Local government capital settlement
There is a significant increase in the capital allocation when comparing budget to budget, with a real terms increase of £121 million, or 19%, between 2024-25 and 2025-26. This comes after a big reduction in the capital allocation between 2023-24 and 2024-25.
| Local Government (Capital) | 2024-25 Budget document | 2025-26 Budget document | Cash change (£m) | Cash change % |
| General Capital Grant | 477 | 556 | 79 | 16.6% |
| Specific (ring-fenced) capital grants | 121 | 196 | 75 | 61.9% |
| Capital Funding within other Portfolios | 40 | 25 | -15 | -37.5% |
| Total capital in Finance Circular | 638 | 777 | +139 | +21.8% |
| Local Government (Capital) | 2024-25 Budget document | 2025-26 Budget document | Real change (£m) | Real change % |
| General Capital Grant | 477 | 543 | +66 | +13.9% |
| Specific (ring-fenced) capital grants | 121 | 192 | +70 | +58.2% |
| Capital Funding within other Portfolios | 40 | 24 | -16 | -39.0% |
| Total capital in Finance Circular | 638 | 759 | +121 | +19.0% |
As with the revenue budget increase, COSLA has provided additional information showing that much of the £139 million cash increase has already been committed, with the “uncommitted” part of this increase amounting to £48.1 million.
| Capital Change | Costs (£m) |
| Local government pay* | 31 |
| Climate | 40 |
| SPT Specific Grant | 12 |
| VDLF Specific Grant | 3 |
| Free school meals capital (24-25) | -40 |
| Inter Islands (Ferries) | 20 |
| 25-26 Playparks | 25 |
| GCG Uplift | 48 |
| Total Capital increase | 139 |
*This is included because the Scottish Government allowed local authorities to switch some capital to resource to help support the 2024-25 pay deal. In a letter to council leaders at the time, the Scottish Government recognised that this “would need to be replaced as additional capital funding in 2025-26”.
In its pre-budget letter to the Scottish Government, the Local Government, Housing and Planning Committee noted “the continuing pressures on capital budget allocations” and the need for local authorities to invest in infrastructure “to facilitate the effective delivery of services in the most efficient way possible”. In her response, the Cabinet Secretary highlighted the real terms increase in capital in the Budget whilst also stressing “the importance of considering more innovative measures to fund capital projects”. We do not have details of these measures, but it is worth remembering that local government debt already sits at around £22 billion (see Local Government Finance: facts and figures 2024).
Individual local authority settlements
The Finance Circular announcing provisional allocations for individual local authorities was published on 12th December 2024. The delay was because officials had to wait for the publication of pupil-teacher ratio data, an important part of the allocation calculations.
This data is used as part of a needs-based formula, agreed with COSLA, which the Scottish Government uses to allocate the overall local government settlement. This aims to take into account variations in the demands for services and the costs of providing them to a similar standard. Applying this formula to the overall revenue settlement allows the Scottish Government to allocate revenue funding to Scotland's 32 local authorities.
For more information on how the Scottish Government allocates funding please see the Scottish Government's Funding of Local Government in Scotland, 2024-25 document. This explains how the formula considers around 140 local authority services- for example, early learning and childcare, adult support and protection, road maintenance, etc - each having different data sets and formulas applied to assess relative need. Many of these indicators are related to population or school pupil numbers, but other factors such as deprivation levels and rurality, road length and homelessness may be taken into account depending on the service being considered.
In order to provide a stable distribution of revenue funding to councils, the financial settlement includes a grant ‘floor’ to ensure that all councils receive at least a minimum increase in revenue support for each year when there is an overall increase in revenue funding or a maximum decrease in those years where overall revenue funding decreases. Where an individual councils' total revenue support allocation from the distribution formula is below the ‘floor’ in any one year, its allocation is increased up to the ‘floor’ by redistributing grant from other councils based on their share of total revenue support.
For 2025-26 , nine councils are beneficiaries of funding from the floor with twenty-three councils contributing to the floor. Details of who benefits and who contributes to the floor are included in Column 4, Annex B in Finance Circular 10/2024.
Change in revenue allocations between 2024-25 and 2025-26
Finance Circular 10/2024 includes provisional revenue and capital allocations for local authorities. Consultation on these figures is taking place between the Scottish Government and COSLA in advance of the Local Government Finance (Scotland) Order 2025 being presented to the Scottish Parliament in late February. Final allocations will likely be published in a circular in late February.
Tables 10 and 11 show provisional revenue allocations for each local authority as they appear in Finance Circulars 8/2023 and 10/2024 (comparing "like-for-like") and show cash and real terms changes over the year:
| Local authority | 2024-25 Provisional | 2025-26 Provisional | Change (£m) | Change (%) |
| Aberdeen City | 454 | 495 | 41 | +9% |
| Aberdeenshire | 573 | 615 | 42 | +7% |
| Angus | 267 | 288 | 21 | +8% |
| Argyll & Bute | 242 | 260 | 18 | +7% |
| Clackmannanshire | 125 | 135 | 10 | +8% |
| Dumfries & Galloway | 370 | 397 | 27 | +7% |
| Dundee City | 377 | 399 | 22 | +6% |
| East Ayrshire | 303 | 322 | 19 | +6% |
| East Dunbartonshire | 252 | 275 | 23 | +9% |
| East Lothian | 237 | 258 | 21 | +9% |
| East Renfrewshire | 240 | 261 | 22 | +9% |
| Edinburgh, City of | 989 | 1,059 | 70 | +7% |
| Eilean Siar | 111 | 118 | 7 | +6% |
| Falkirk* | 367 | 381 | 14 | +4% |
| Fife | 862 | 928 | 66 | +8% |
| Glasgow City | 1,591 | 1,679 | 88 | +6% |
| Highland | 582 | 621 | 39 | +7% |
| Inverclyde | 209 | 222 | 14 | +7% |
| Midlothian | 219 | 239 | 20 | +9% |
| Moray | 214 | 230 | 15 | +7% |
| North Ayrshire | 353 | 375 | 22 | +6% |
| North Lanarkshire | 813 | 870 | 56 | +7% |
| Orkney Islands | 96 | 106 | 10 | +11% |
| Perth & Kinross | 338 | 364 | 27 | +8% |
| Renfrewshire | 416 | 452 | 36 | +9% |
| Scottish Borders | 273 | 292 | 20 | +7% |
| Shetland Islands | 112 | 119 | 7 | +6% |
| South Ayrshire | 270 | 292 | 22 | +8% |
| South Lanarkshire | 743 | 806 | 63 | +9% |
| Stirling | 219 | 234 | 16 | +7% |
| West Dunbartonshire | 239 | 253 | 14 | +6% |
| West Lothian | 424 | 459 | 35 | +8% |
| Scotland | 12,878 | 13,804 | 925 | +7% |
Every local authority sees a cash and real terms increase over the year when comparing 2024-25 and 2025-26 provisional allocations:
| Local authority | 2024-25 Provisional | 2025-26 Provisional | Change (£m) | Change (%) |
| Aberdeen City | 454 | 483 | 29 | +6% |
| Aberdeenshire | 573 | 601 | 28 | +5% |
| Angus | 267 | 281 | 14 | +5% |
| Argyll & Bute | 242 | 253 | 11 | +5% |
| Clackmannanshire | 125 | 131 | 7 | +6% |
| Dumfries & Galloway | 370 | 388 | 18 | +5% |
| Dundee City | 377 | 390 | 12 | +3% |
| East Ayrshire | 303 | 315 | 12 | +4% |
| East Dunbartonshire | 252 | 268 | 16 | +7% |
| East Lothian | 237 | 252 | 15 | +6% |
| East Renfrewshire | 240 | 255 | 16 | +7% |
| Edinburgh, City of | 989 | 1,034 | 46 | +5% |
| Eilean Siar | 111 | 115 | 4 | +3% |
| Falkirk* | 367 | 372 | 6 | +2% |
| Fife | 862 | 906 | 44 | +5% |
| Glasgow City | 1,591 | 1,640 | 49 | +3% |
| Highland | 582 | 606 | 24 | +4% |
| Inverclyde | 209 | 217 | 9 | +4% |
| Midlothian | 219 | 233 | 14 | +6% |
| Moray | 214 | 224 | 10 | +5% |
| North Ayrshire | 353 | 367 | 13 | +4% |
| North Lanarkshire | 813 | 849 | 36 | +4% |
| Orkney Islands | 96 | 104 | 8 | +8% |
| Perth & Kinross | 338 | 356 | 18 | +5% |
| Renfrewshire | 416 | 442 | 25 | +6% |
| Scottish Borders | 273 | 285 | 13 | +5% |
| Shetland Islands | 112 | 116 | 4 | +4% |
| South Ayrshire | 270 | 285 | 15 | +6% |
| South Lanarkshire | 743 | 787 | 44 | +6% |
| Stirling | 219 | 229 | 10 | +5% |
| West Dunbartonshire | 239 | 247 | 8 | +4% |
| West Lothian | 424 | 448 | 24 | +6% |
| Scotland | 12,878 | 13,482 | 604 | +5% |
*The allocation for Falkirk may be revised with discussions between the local authority and Scottish Government ongoing.
Again, it is worth reiterating the point made by COSLA about the real terms increase across the board, i.e they believe much of the increase relates to funding commitments announced in 2024-25 (or earlier) with costs being carried forward into 2025-26.
Change in allocations over the past 13 years
Because of the "main floor" safeguards (discussed above) local authorities are protected from dramatic changes in their allocations from year to year. However, the floor can only do so much, and over a longer period of time factors such as changes in population and school pupil numbers can lead to considerable changes. This can be seen in the following chart which shows real terms changes in provisional revenue allocations over the past 13 years for every local authority. We can see a noticeable West-East shift, with five of the six local authorities seeing real terms reductions over the period being in the West of the country.
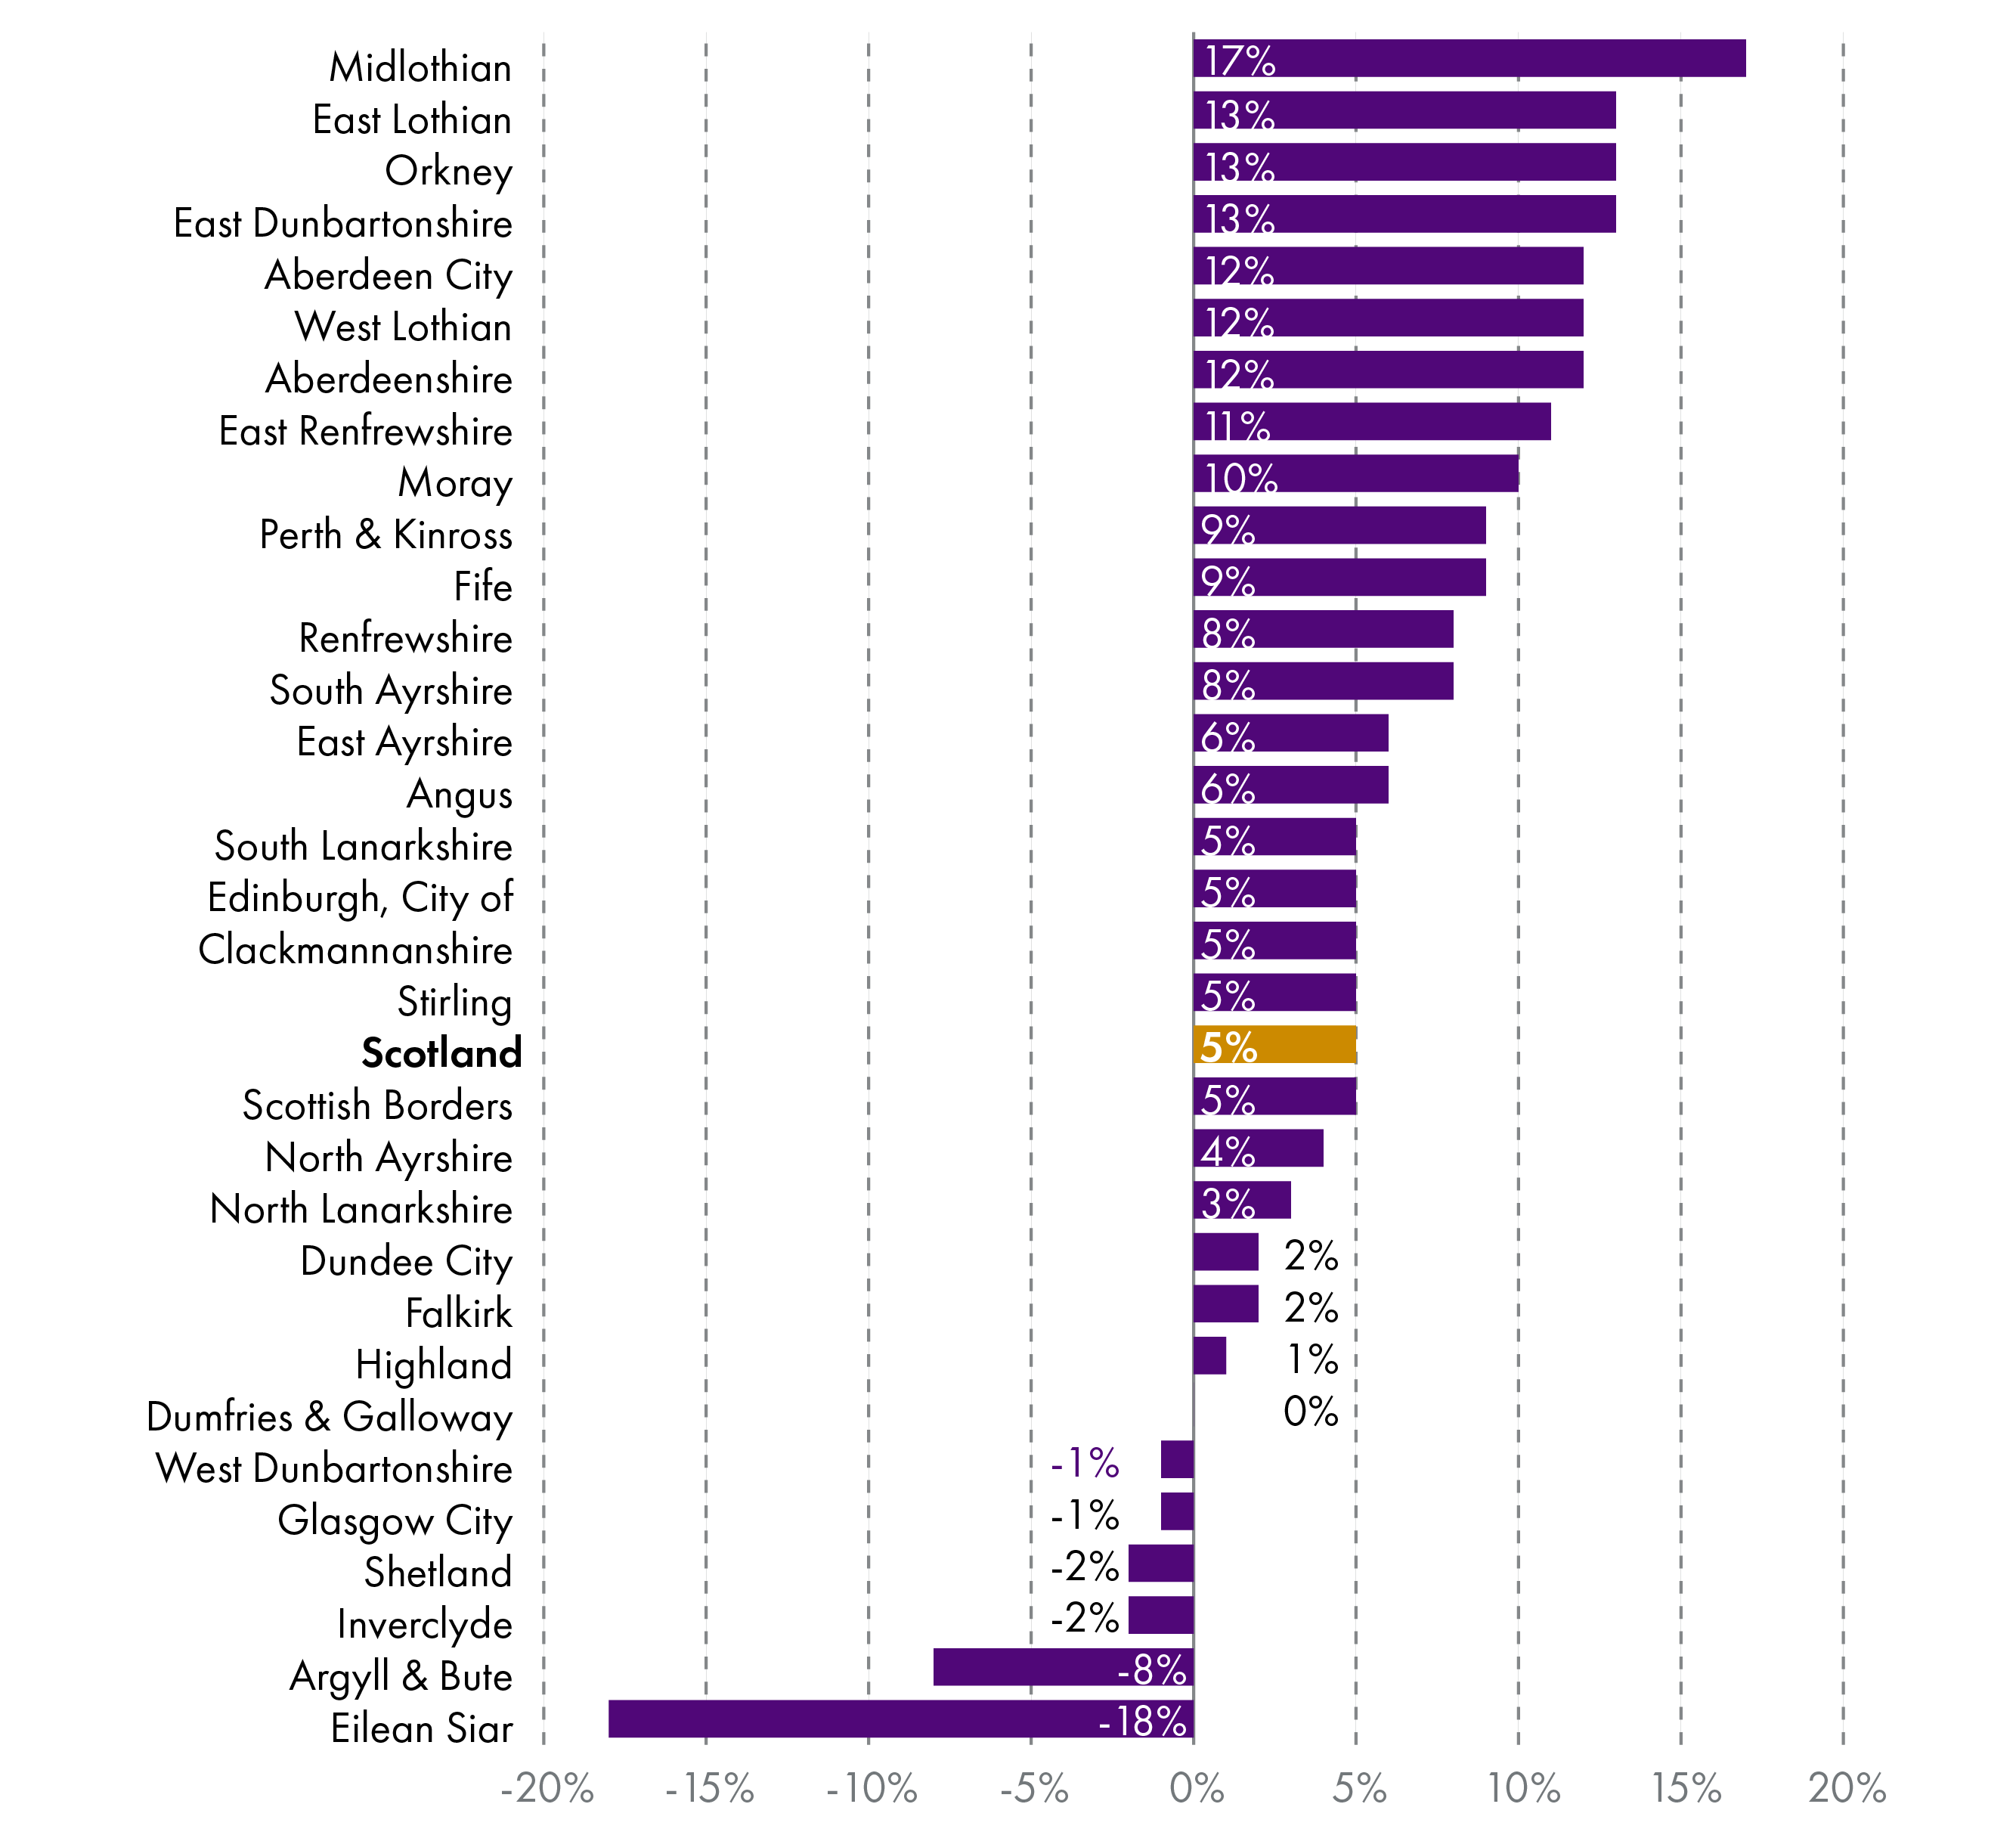
The Scottish average increase of +5% is different from the figure in Table 5 (+9.8%) because the 2025-26 figure used in the earlier table includes £440 million that has not yet been distributed to individual councils. This money will be distributed over the next year.
| Local Authority (ranked by highest to lowest % change) | 2013-14 revenue totals (from 01/2013) | 2025-26 revenue totals (from 10/2024) | £ change | % change |
| Midlothian | 199 | 233 | 34 | 17% |
| East Lothian | 223 | 252 | 30 | 13% |
| Orkney | 92 | 104 | 12 | 13% |
| East Dunbartonshire | 239 | 268 | 30 | 13% |
| Aberdeen City | 431 | 483 | 53 | 12% |
| West Lothian | 399 | 448 | 49 | 12% |
| Aberdeenshire | 536 | 601 | 65 | 12% |
| East Renfrewshire | 231 | 255 | 24 | 11% |
| Moray | 204 | 224 | 20 | 10% |
| Perth & Kinross | 326 | 356 | 30 | 9% |
| Fife | 833 | 906 | 73 | 9% |
| Renfrewshire | 410 | 442 | 32 | 8% |
| South Ayrshire | 265 | 285 | 20 | 8% |
| East Ayrshire | 298 | 315 | 17 | 6% |
| Angus | 266 | 281 | 15 | 6% |
| South Lanarkshire | 746 | 787 | 41 | 5% |
| Edinburgh, City of | 982 | 1,034 | 52 | 5% |
| Clackmannanshire | 125 | 131 | 7 | 5% |
| Stirling | 218 | 229 | 11 | 5% |
| Scotland | 12,869 | 13,482 | 613 | 5% |
| Scottish Borders | 273 | 285 | 13 | 5% |
| North Ayrshire | 353 | 367 | 14 | 4% |
| North Lanarkshire | 822 | 849 | 28 | 3% |
| Dundee City | 382 | 390 | 7 | 2% |
| Falkirk | 365 | 372 | 7 | 2% |
| Highland | 601 | 606 | 6 | 1% |
| Dumfries & Galloway | 387 | 388 | 1 | 0% |
| West Dunbartonshire | 250 | 247 | -3 | -1% |
| Glasgow City | 1,660 | 1,640 | -20 | -1% |
| Shetland | 118 | 116 | -2 | -2% |
| Inverclyde | 222 | 217 | -4 | -2% |
| Argyll & Bute | 275 | 253 | -22 | -8% |
| Eilean Siar | 140 | 115 | -25 | -18% |
Local government revenue per head by local authority
For illustrative purposes Table 12 revenue allocations as per head calculations. This uses allocations from Finance Circular 10/2024 and mid-year population estimates for 2023 from the National Records of Scotland1. It is worth repeating that the formula used to allocate funding takes into account a whole range of indicators from population and deprivation to road length and remoteness.
A PREVIOUS VERSION OF THIS BRIEFING INCLUDED AN INCORRECT TABLE - this has been updated (27 February 2025)
| Local authority | 2025-26 Provisional (£m) | Population (2023) | Per head (£) |
| Shetland Islands | 118.916 | 23,000 | 5,170 |
| Orkney Islands | 105.994 | 22,000 | 4,818 |
| Eilean Siar | 118.038 | 26,030 | 4,535 |
| Argyll & Bute | 259.534 | 87,810 | 2,956 |
| West Dunbartonshire | 252.848 | 88,750 | 2,849 |
| Inverclyde | 222.499 | 78,330 | 2,841 |
| North Ayrshire | 375.310 | 133,570 | 2,810 |
| Dumfries & Galloway | 397.163 | 145,670 | 2,726 |
| East Ayrshire | 322.291 | 120,750 | 2,669 |
| Glasgow City | 1,679.119 | 631,970 | 2,657 |
| Dundee City | 398.904 | 150,390 | 2,652 |
| East Renfrewshire | 261.368 | 98,600 | 2,651 |
| Highland | 620.952 | 236,330 | 2,627 |
| South Ayrshire | 291.514 | 111,830 | 2,607 |
| Clackmannanshire | 134.544 | 51,940 | 2,590 |
| North Lanarkshire | 869.724 | 341,890 | 2,544 |
| East Dunbartonshire | 274.850 | 109,230 | 2,516 |
| Scotland | 13,803.577 | 5,490,100 | 2,514 |
| Angus | 287.836 | 114,820 | 2,507 |
| Scottish Borders | 292.207 | 116,630 | 2,505 |
| Stirling | 234.354 | 93,550 | 2,505 |
| West Lothian | 459.069 | 183,810 | 2,498 |
| Fife | 927.538 | 373,210 | 2,485 |
| South Lanarkshire | 805.832 | 330,280 | 2,440 |
| Midlothian | 238.601 | 98,260 | 2,428 |
| Moray | 229.599 | 94,670 | 2,425 |
| Renfrewshire | 452.225 | 186,540 | 2,424 |
| Falkirk | 380.999 | 158,620 | 2,402 |
| Perth & Kinross | 364.242 | 152,560 | 2,388 |
| Aberdeenshire | 615.313 | 264,320 | 2,328 |
| East Lothian | 258.246 | 113,740 | 2,270 |
| Aberdeen City | 494.904 | 227,750 | 2,173 |
| Edinburgh, City of | 1,059.044 | 523,250 | 2,024 |
Local Government performance and public service reform
No one disputes the importance of the services delivered by local authorities as well as the need to strengthen local democracy. However, it is also a fact that public satisfaction with local government and the services provided is not especially high at the moment. Results of the Scottish Household Survey show that the percentage of people saying they trust local government dropped from 59% in 2022 to 53% in 2023, and only 42% of people surveyed in 2022 agreed with the statement "my local council provides high quality services" 12. It is also worth noting that the number of complaints about local government services escalated to the Scottish Public Services Ombudsman increased dramatically during the last reporting year.
The Improvement Service's Local Government Benchmarking Framework 2022-23 Annual Report shows that performance across a range of indicators has reduced in recent years, particularly in the area of social care. It also discusses how "for the first time, the rate of decline has overtaken the rate of improvement". The report concludes:
If the current trend continues, the improvements and progress that has been achieved thus far, could potentially be lost and council service performance may start to decline over the longer-term.
The need for public service reform has not escaped the attention of the Scottish Parliament's Local Government, Housing and Planning Committee, with its pre-budget letter to the Scottish Government noting an "urgent need for transformational change". As such the Committee hoped to see:
...specific measures in the Budget that support sector-led transformation in local government. These could include funding for collaborative pilots, for example in areas of digital, human resources and procurement, or in supporting changes in the way services are delivered in specific areas.
Although the Budget did not mention any specific measures, and the Scottish Government did not fully address this recommendation in its response to the Committee, the Cabinet Secretary did set out a number of ways her Government has already supported public service reform. Her letter also discussed possible future developments, for example relating to single island authorities:
Proposals for a move towards single authority models in three authority areas reflect the potential of place-based approaches to enable systems reform. Alternative local governance arrangements would enhance local leaders’ ability to shape service provision in light of local circumstances and deploy budgets in ways which support a vital shift towards prevention. Closer integration across key service areas within these geographies also presents opportunities to secure back-office efficiencies and redirect resource to front-line services.
So, in response to the question "how can local government address the various challenges they face?", one answer could be "more money from the Scottish Government", but it is not the only answer. This is recognised by the sector itself, for example in work being done jointly by the Improvement Service and the Society of Local Authority Chief Executives (SOLACE). Their Local Government Transformation Programme, launched in October 2022, aims to develop proposals both for future operating models for councils and options for future delivery of council services. Outputs from the programme will hopefully appear over coming months. COSLA and the Scottish Government may also point to the Local Governance Review which has been in existence for more than 7 years but has not yet led to any meaningful changes.
Sources
Scottish Government 2025-26. (2024, December 4). Scottish Budget . Retrieved from <a href="https://www.gov.scot/publications/scottish-budget-2025-2026/" target="_blank">https://www.gov.scot/publications/scottish-budget-2025-2026/</a>
Scottish Government. (2024, December 12). Local Government Finance Circular 10/2024. Retrieved from <a href="https://www.gov.scot/publications/local-government-finance-circular-10-2024-settlement-for-2025-to-2026/" target="_blank">https://www.gov.scot/publications/local-government-finance-circular-10-2024-settlement-for-2025-to-2026/</a>
COSLA. (2024, December 4). Budget Reality 2025-26. Retrieved from <a href="https://www.cosla.gov.uk/__data/assets/pdf_file/0029/55838/24-12-04-Budget-Reality-25-26-Final.pdf" target="_blank">https://www.cosla.gov.uk/__data/assets/pdf_file/0029/55838/24-12-04-Budget-Reality-25-26-Final.pdf</a>
Scottish Parliament. (2024). Official Report of the Local Government, Housing and Planning Committee's Budget Scrutiny 2024-25 session. Retrieved from <a href="https://www.parliament.scot/chamber-and-committees/official-report/search-what-was-said-in-parliament/LGHP-09-01-2024?meeting=15640&amp;iob=133473%22%20target=%22_blank%22%3Ehttps://www.parliament.scot/chamber-and-committees/official-report/search-what-was-said-in-parliament/LGHP-09-01-2024?meeting=15640&amp;iob=133473%3C/a%3E" target="_blank">https://www.parliament.scot/chamber-and-committees/official-report/search-what-was-said-in-parliament/LGHP-09-01-2024?meeting=15640&amp;iob=133473%22%20target=%22_blank%22%3Ehttps://www.parliament.scot/chamber-and-committees/official-report/search-what-was-said-in-parliament/LGHP-09-01-2024?meeting=15640&amp;iob=133473%3C/a%3E</a>
National Records of Scotland. (2024, October 8). Mid-2023 population estimates. Retrieved from <a href="https://www.nrscotland.gov.uk/publications/mid-2023-population-estimates/#" target="_blank">https://www.nrscotland.gov.uk/publications/mid-2023-population-estimates/#</a>
Scottish Government. (2024, December). Scottish Household Survey 2023: trust in public institutions. Retrieved from <a href="https://www.gov.scot/publications/scottish-household-survey-2023-trust-public-institutions/documents/" target="_blank">https://www.gov.scot/publications/scottish-household-survey-2023-trust-public-institutions/documents/</a>
Scottish Government. (2023, December). Scottish Household Survey 2022: Key Findings. Retrieved from <a href="https://www.gov.scot/publications/scottish-household-survey-2022-key-findings/documents/" target="_blank">https://www.gov.scot/publications/scottish-household-survey-2022-key-findings/documents/</a>