Earnings in Scotland 2022
This briefing looks at the latest data for Scotland from the Annual Survey of Hours and Earnings.
Executive summary
The Annual Survey of Hours and Earnings (ASHE) data was published on 26 October 20221.
In 2020 and 2021 ASHE was impacted by the pandemic. The latest data was gathered at a time of high inflation. Therefore, in this briefing we have looked at the latest data, for April 2022, and how it has changed over the last five years. This is discussed in more depth in the briefing.
Fig 1: Gross annual pay, gross weekly pay and hourly pay excluding overtime for all employees by nation and region of the UK - 2022
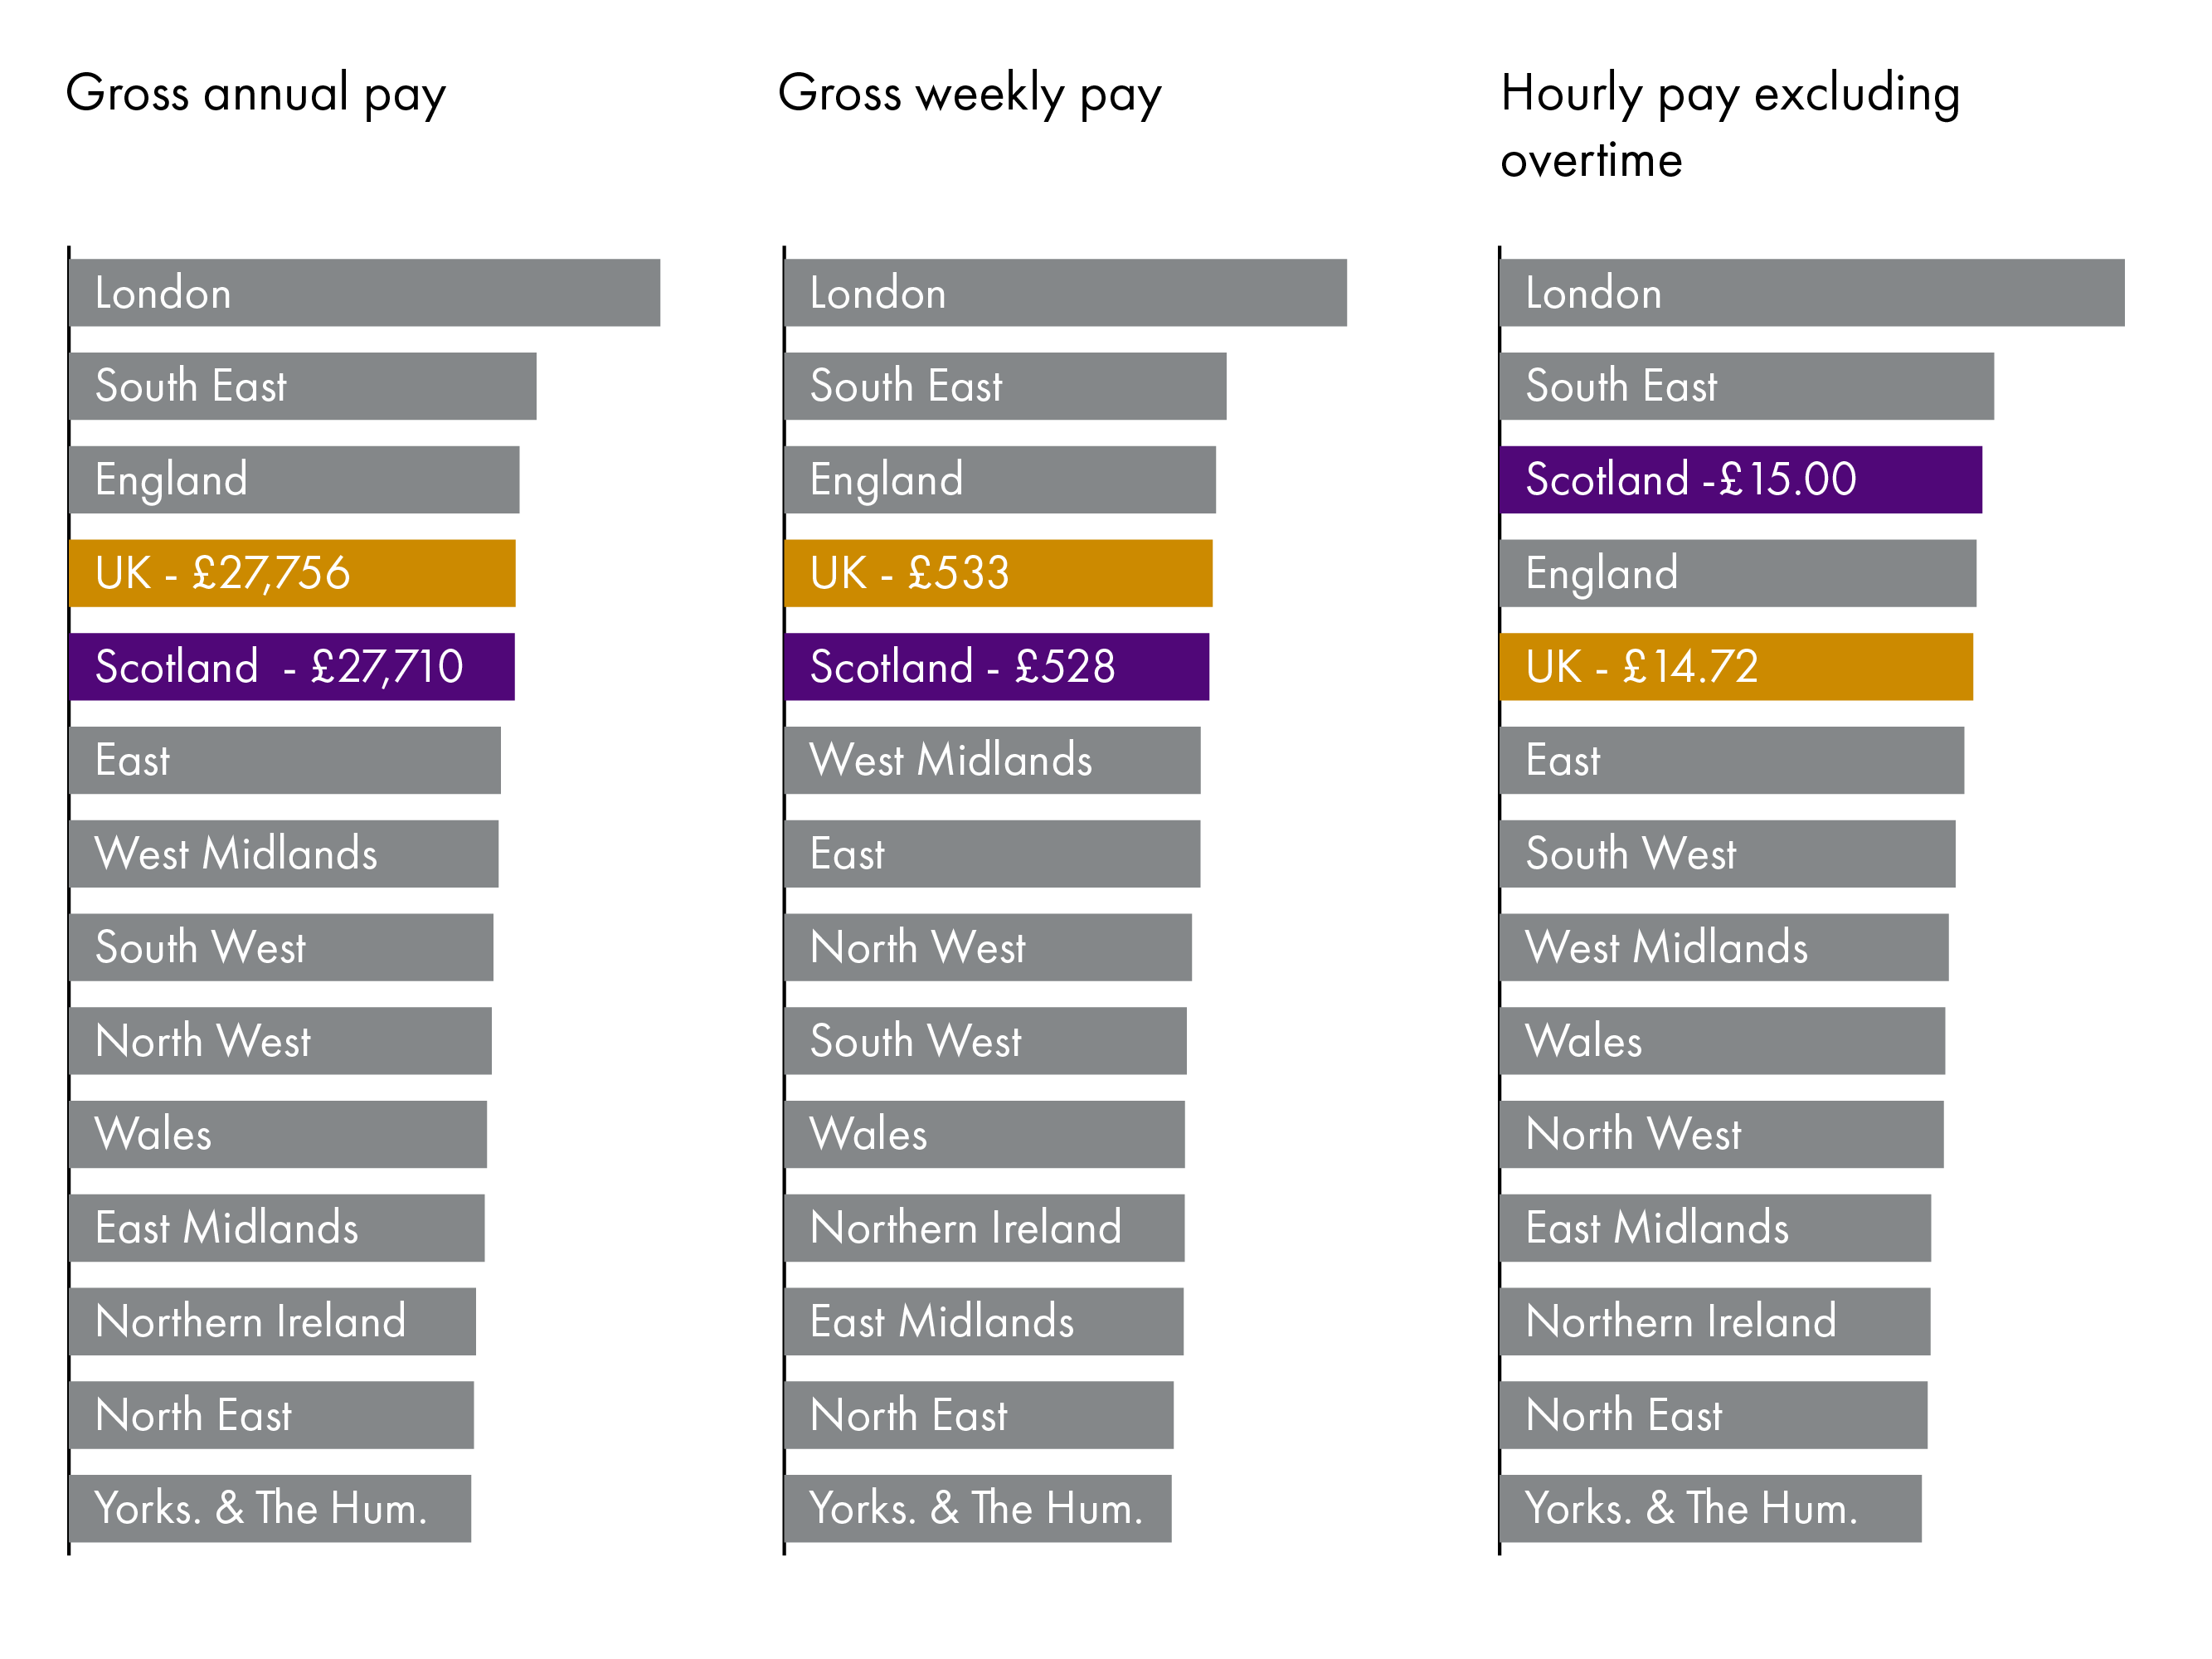
When looking at pay for all employees:
At £27,710, Scotland has the fourth highest median gross annual salary of the nations and regions of the UK, which is higher than the UK figure.
At £528, Scotland has the fourth highest median gross weekly pay of the nations and regions of the UK, which is the same as the UK figure.
At £14.72, Scotland has the third highest median hourly pay excluding overtime of the nations and regions of the UK, which is higher than the UK figure.
Fig 2: Gross annual pay, gross weekly pay and hourly pay excluding overtime for full-time employees by nation and region of the UK - 2022
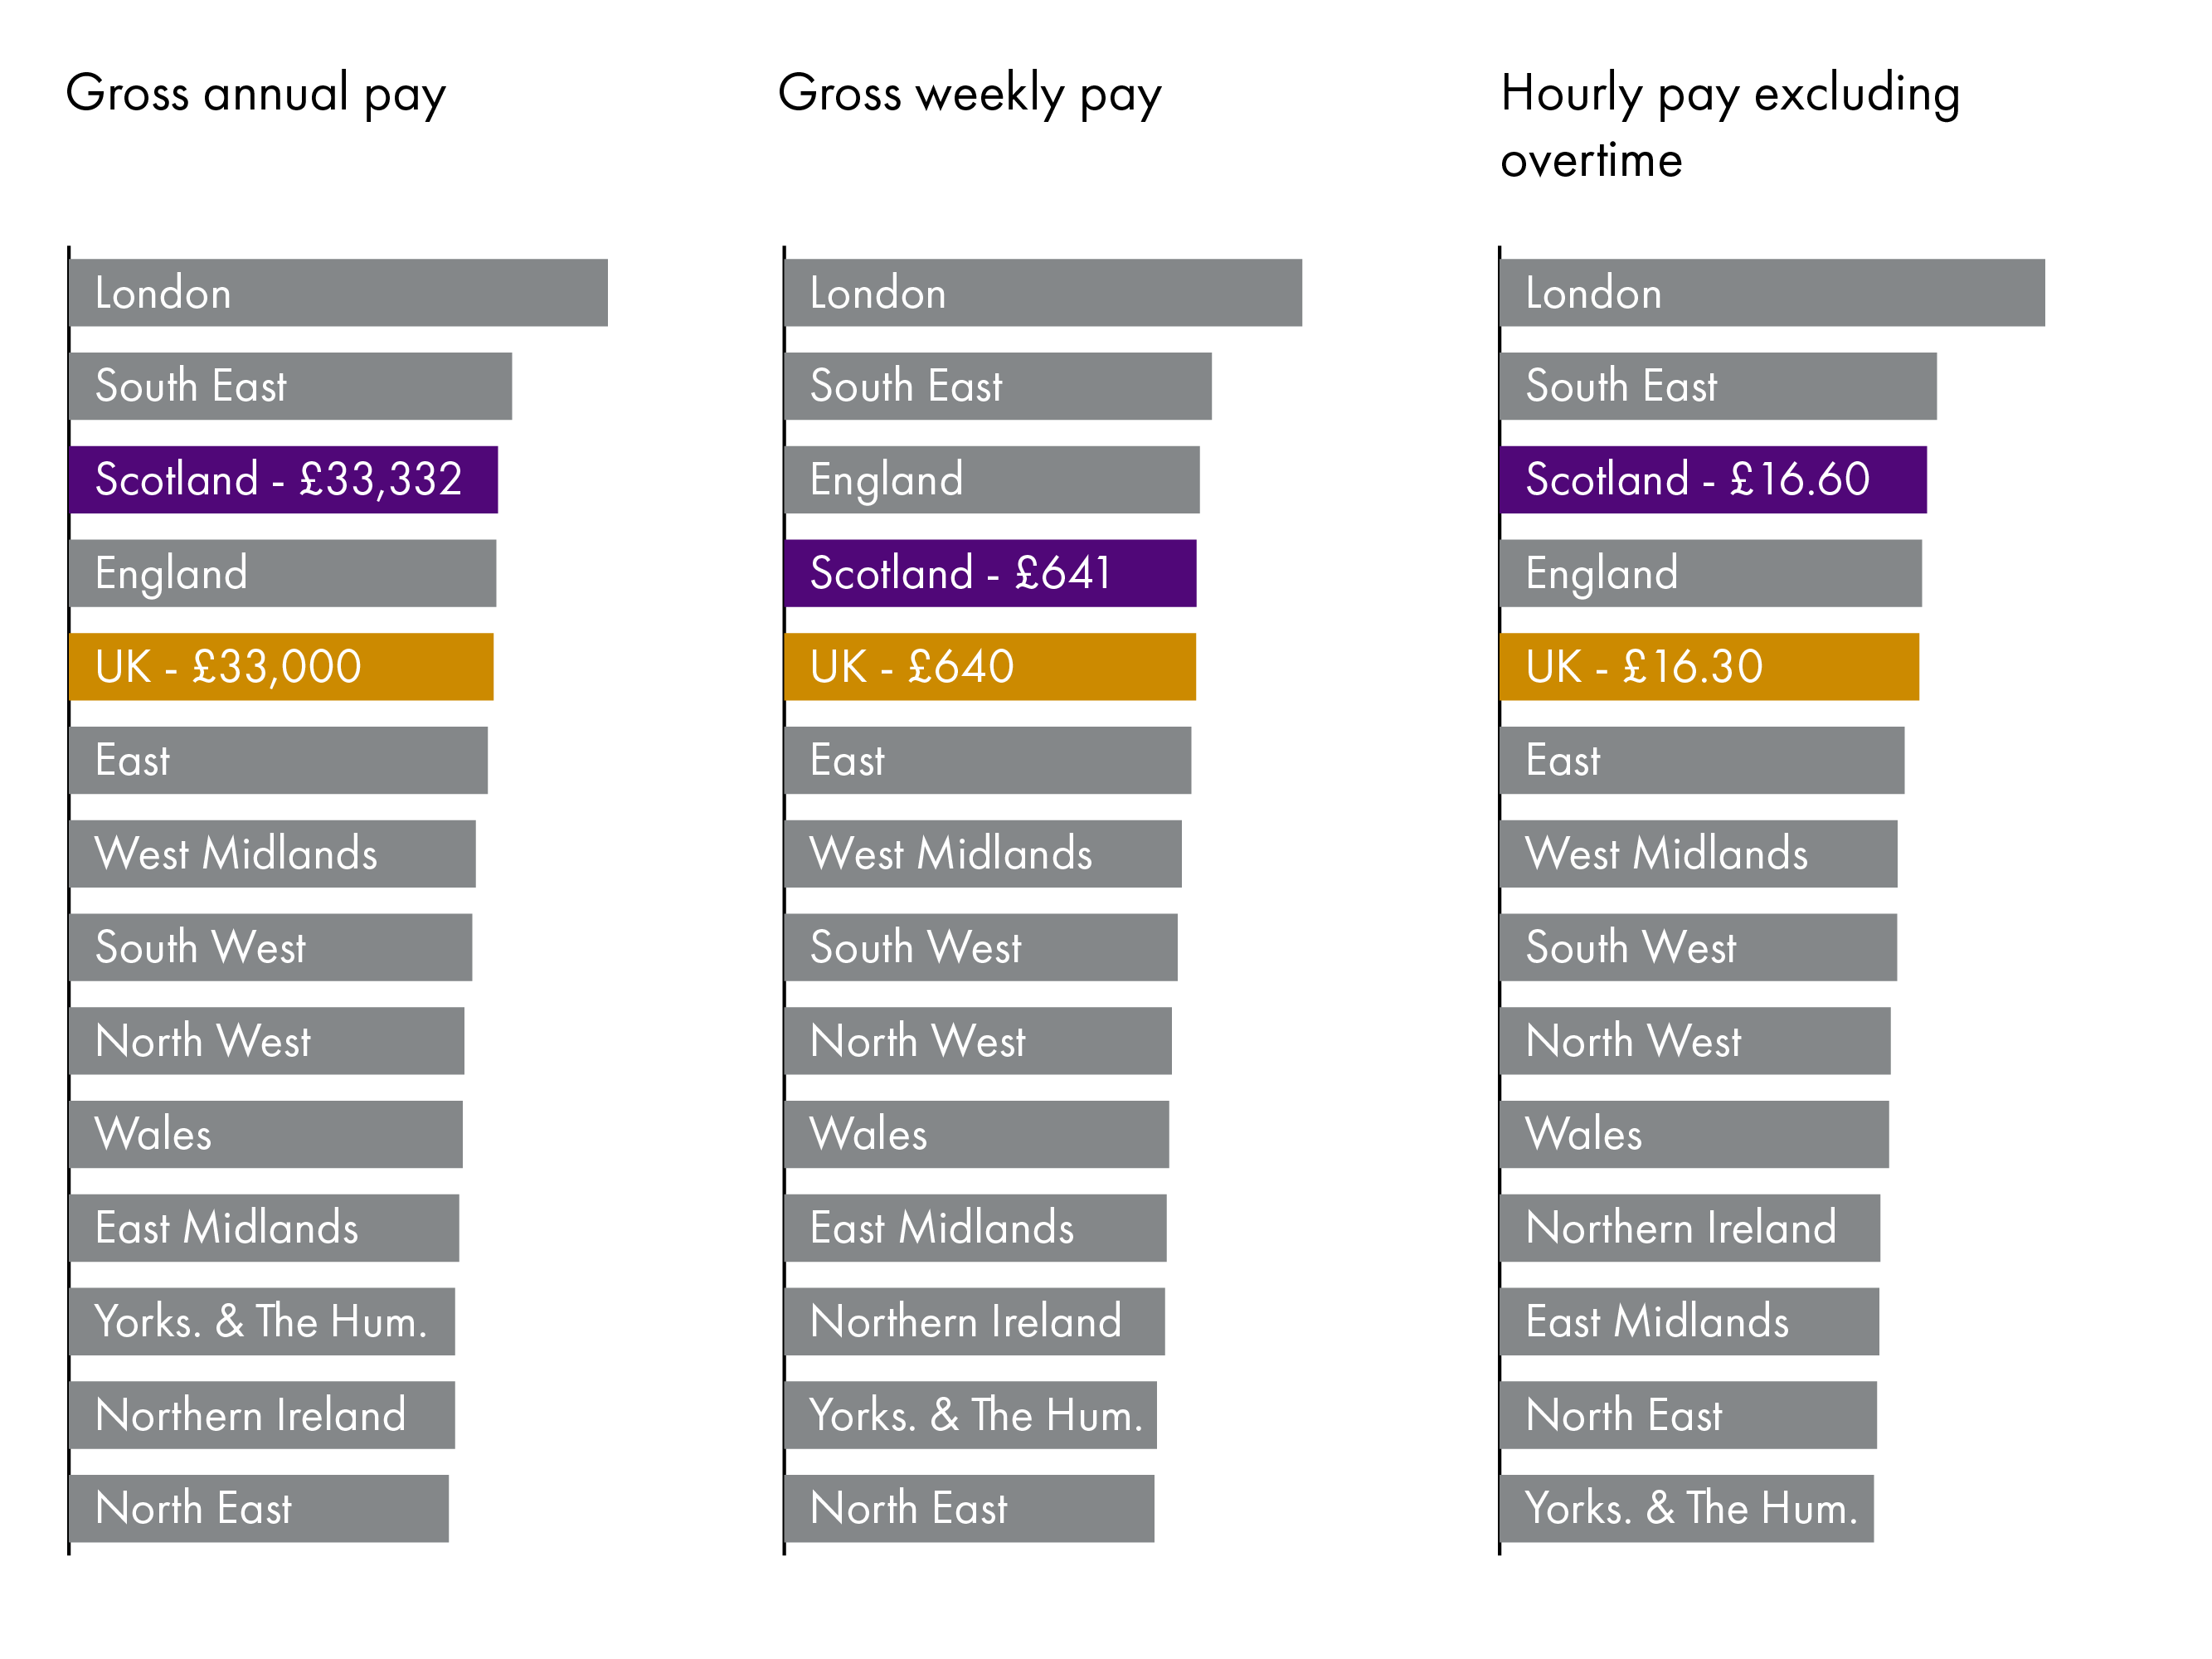
When looking at pay for full-time employees:
At £33,332, Scotland has the third highest median gross annual salary of the nations and regions of the UK, which is higher than the UK figure.
At £641, Scotland has the fourth highest median gross weekly pay of the nations and regions of the UK, which is the same as the UK figure.
At £16.60, Scotland has the third highest median hourly pay excluding overtime of the nations and regions of the UK, which is higher than the UK figure.
Fig 3: Gross annual pay, gross weekly pay and hourly pay excluding overtime for part-time employees by nation and region of the UK - 2022
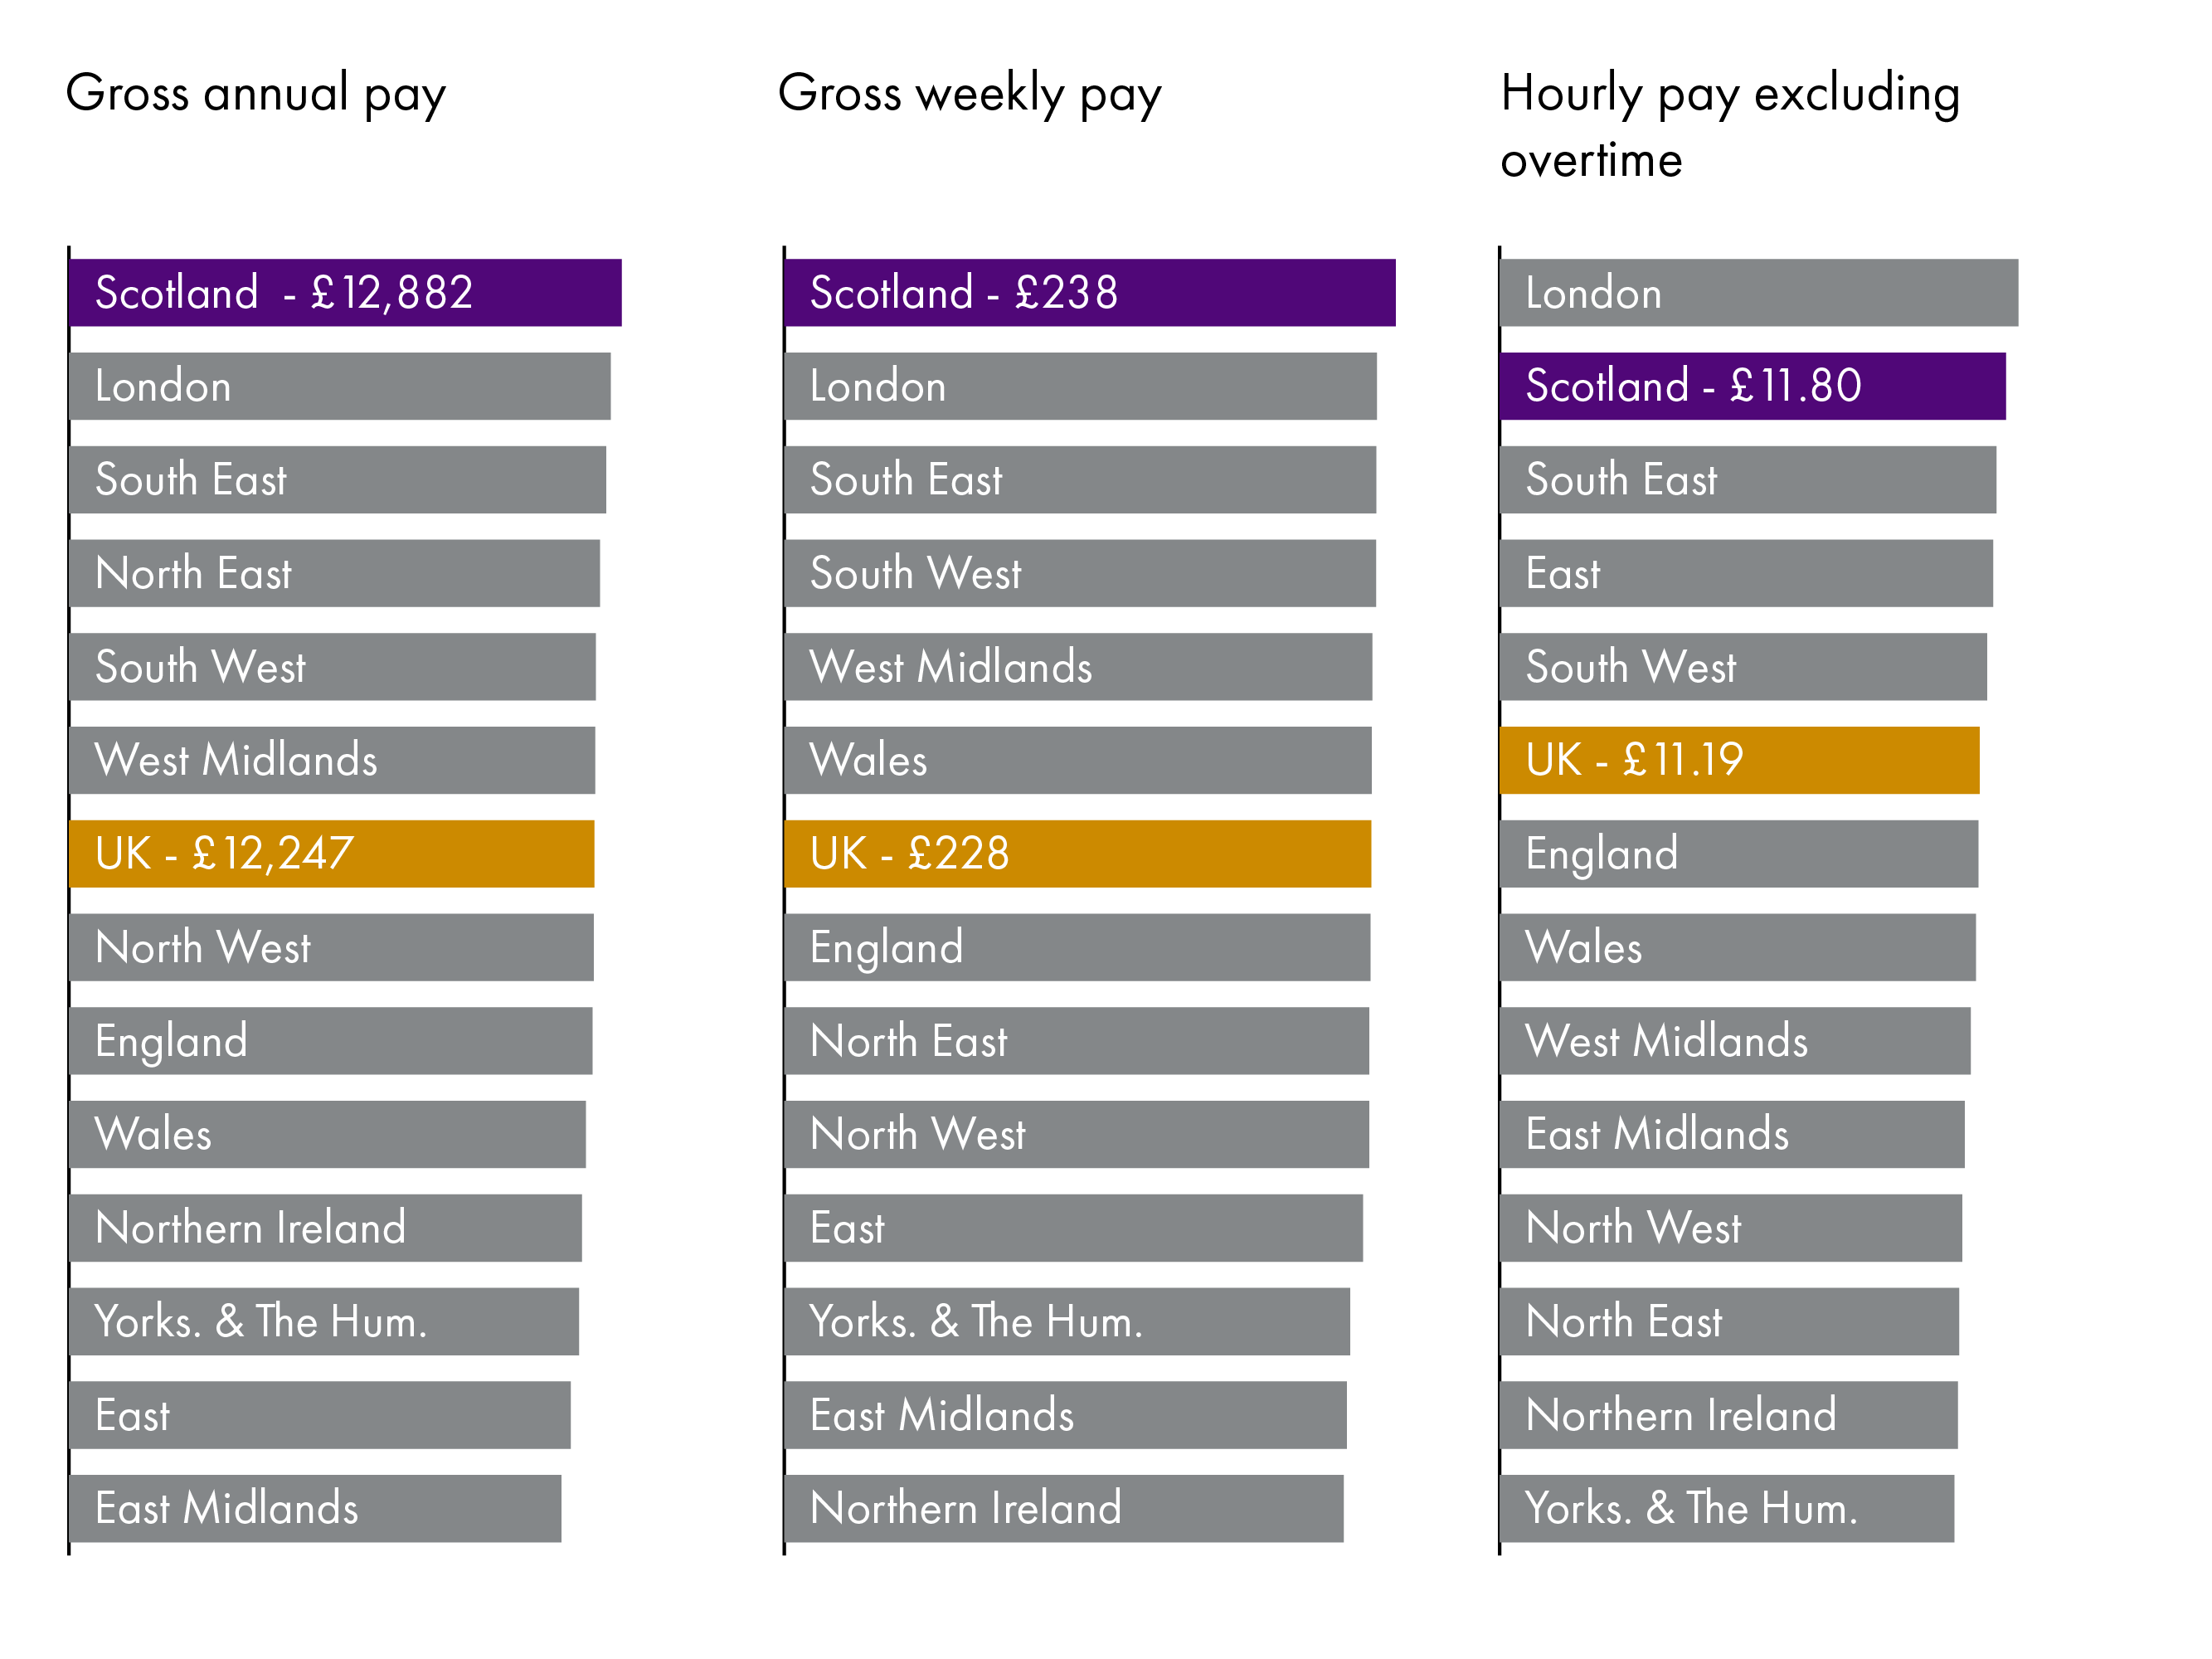
When looking at pay for part-time employees, the pattern across annual, weekly and hourly pay is different:
At £12,882, Scotland has the highest median gross annual salary of the nations and regions of the UK, which is higher than the UK figure.
At £238, Scotland has the highest median gross weekly pay of the nations and regions of the UK, which is higher than the UK figure.
At £11.80, Scotland has the third highest median hourly pay excluding overtime of the nations and regions of the UK, which is higher than the UK figure.
Fig 4: Highest and lowest paid industry and occupation for hourly pay excluding overtime for all employees in Scotland - 2022
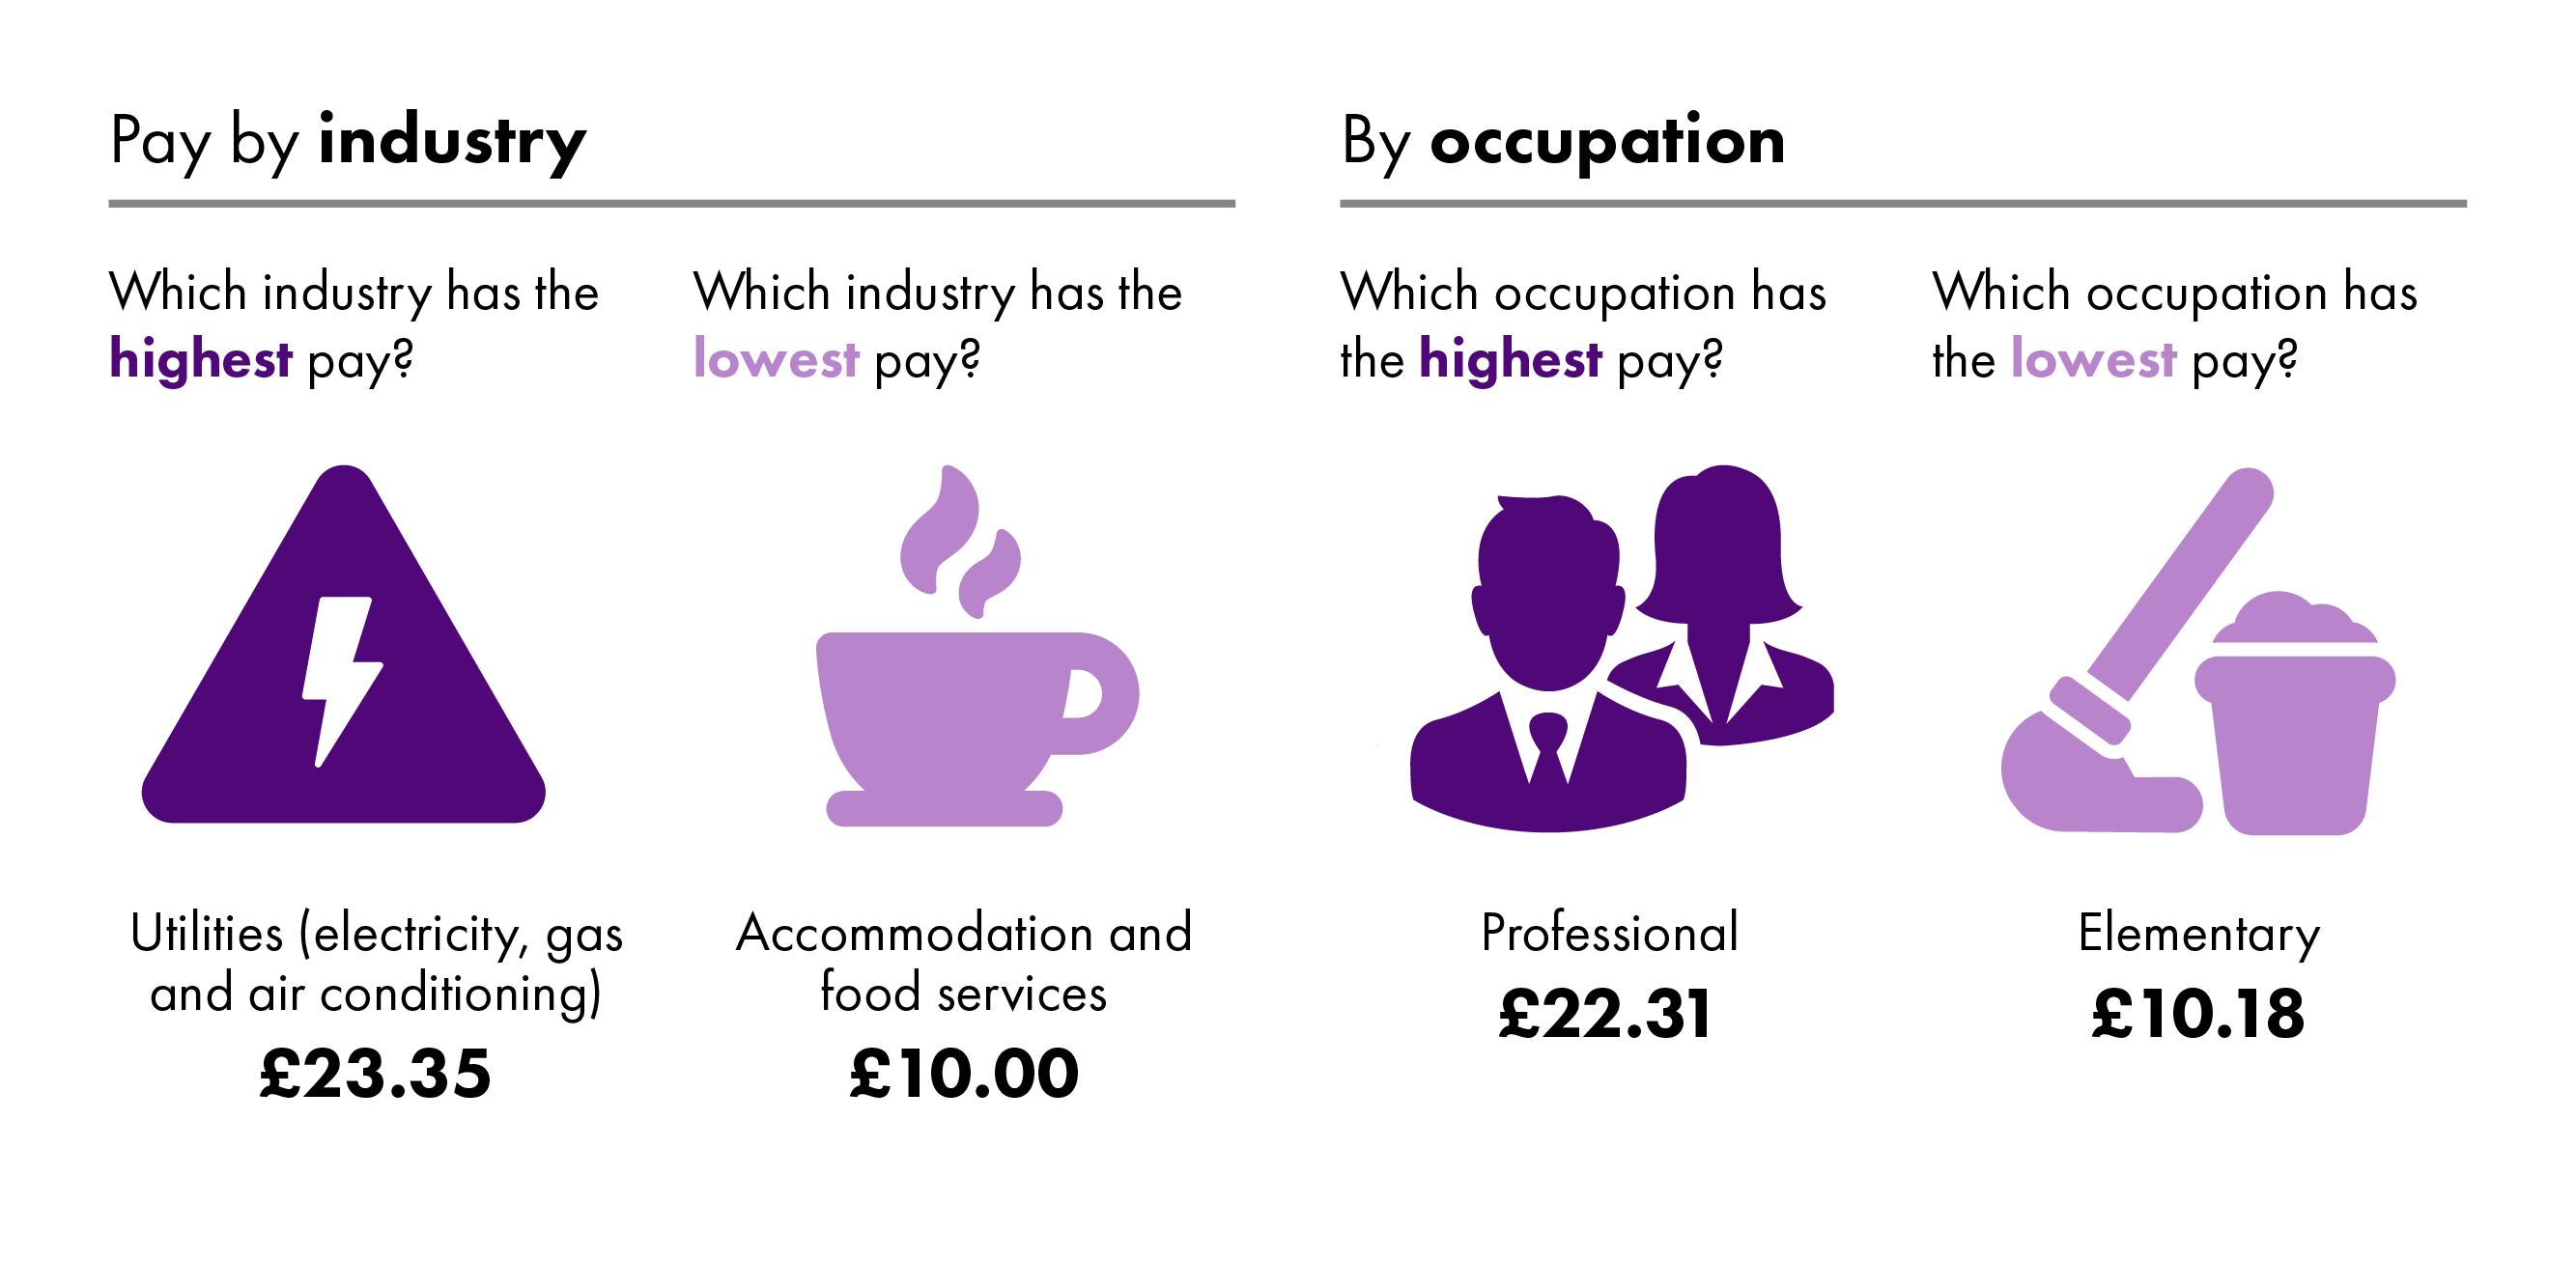
When looking at median hourly pay excluding overtime by industry:
Electricity, gas and air conditioning is the highest paid industry in Scotland, at £23.35.
Accommodation and food services is the lowest paid, at £10.00.
When looking at median hourly pay excluding overtime by occupation:
Professional occupations are the highest paid at, £22.31.
Elementary are the lowest paid, at £10.18.
Fig 5: Top ten local authorities by hourly pay excluding overtime for were people live and where people work- 2022
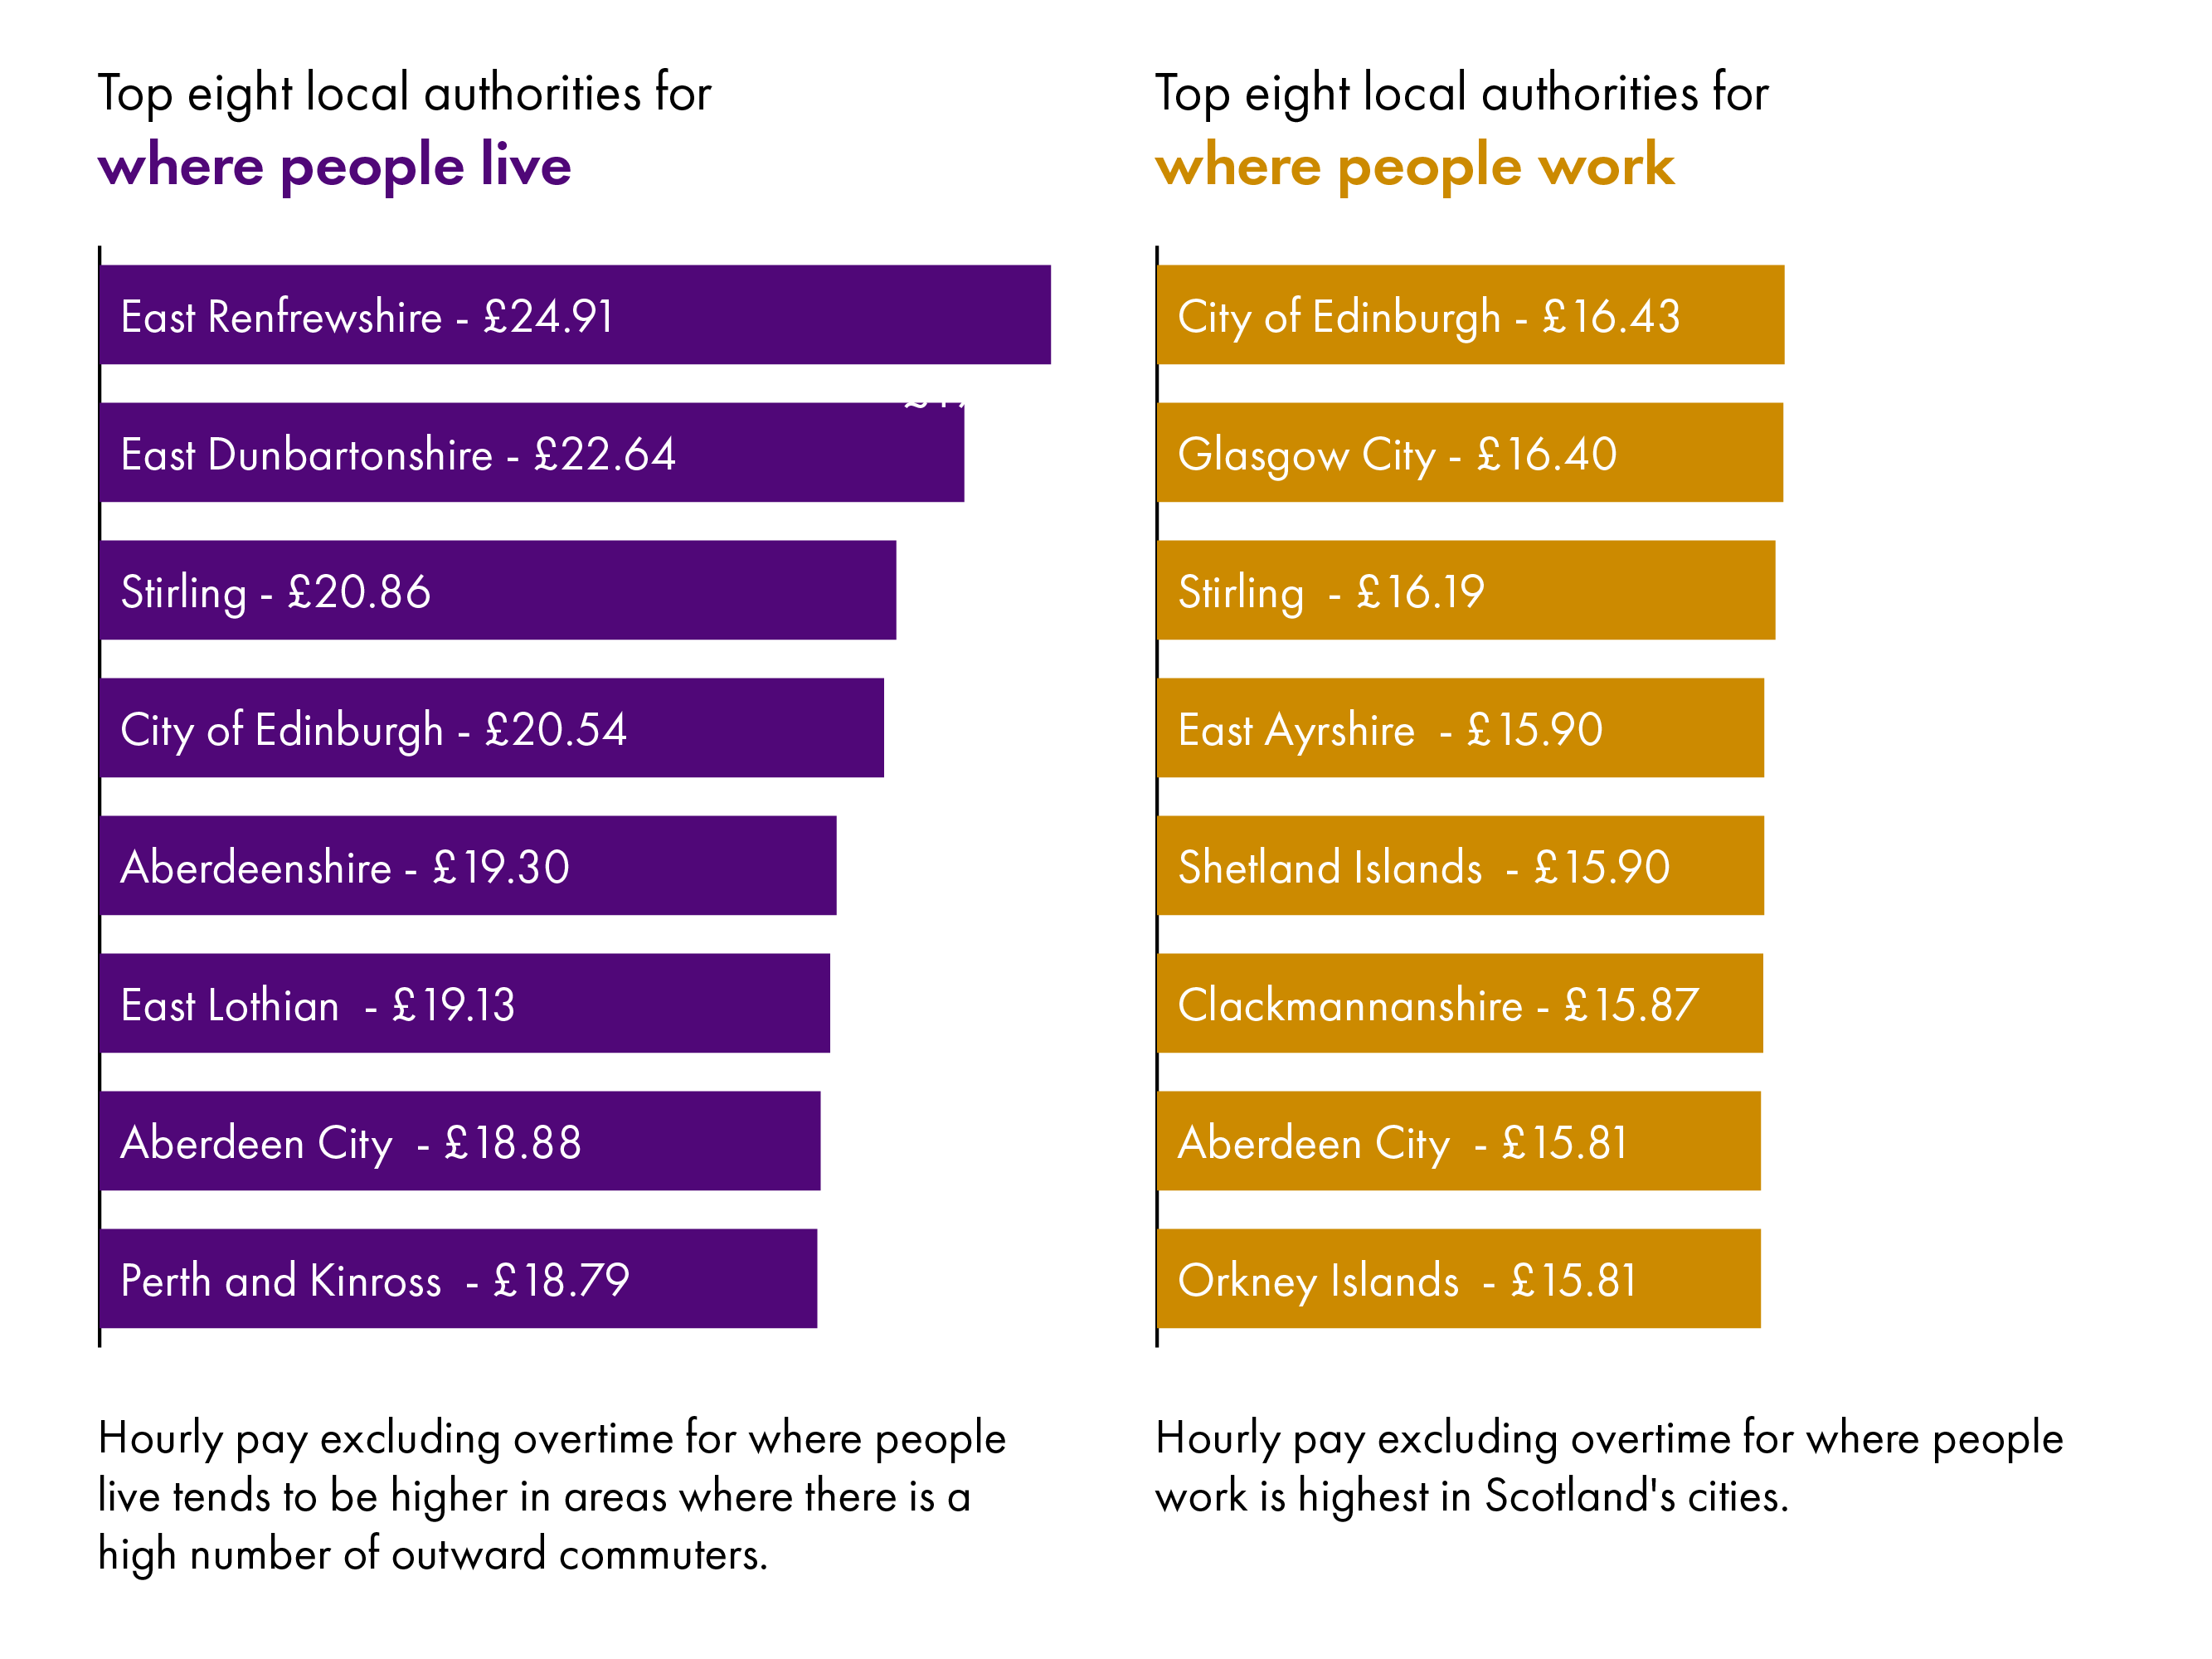
When looking at pay by local authority across Scotland:
Hourly pay excluding overtime for where people live tends to be higher in areas where there is a high number of outward commuters.
Hourly pay excluding overtime for where people work is highest in Scotland's two largest cities.
About the data
The data in this briefing are ASHE 2022 provisional results, published by the Office for National Statistics (ONS). The survey provides a range of earnings statistics for employees across the UK. ASHE provides data for hourly, weekly and annual income for all employees, and part-time and full-time employees. It does not cover the self-employed. ASHE uses Pay As You Earn (PAYE) data to identify representative sub groups of employers and employees who they then survey to get information on employee hours and earnings.
Key points about the data:
Where figures are adjusted for inflation, the Consumer Prices Index including owner occupiers’ housing costs (CPIH) figure has been used (7.8% in the year to April 2022). CPIH is the most comprehensive measure of UK consumer price inflation, as it includes owner occupiers’ housing costs (OOH) and Council Tax.
Because of the potential for sampling errors for smaller groups, including local areas and small industries, there is a wider margin of error with some of the smaller data sets than for Scotland as a whole.
Unless otherwise stated, the median estimate has been used rather than the mean, as it provides a better indication of ‘typical’ pay. Median values split the top 50 per cent from the bottom 50 per cent, meaning it is less likely to be skewed by the relatively small number of very high earners.
"Full-time" is defined as employees working 30 paid hours per week or more (or 25 or more for the teaching professions).
Methodological changes in 2004, 2006, 2011 and 2021 resulted in discontinuities in the ASHE time series, therefore care should be taken when making comparisons with earlier years.
Unless otherwise stated this briefing looks at the workplace analysis of the ASHE.
Inflation
One of the biggest issues at the time of the survey was high inflation. The figures used when quoting growth in inflation are from the Consumer Prices Index including owner occupiers’ housing costs (CPIH). CPIH is the inflation measure used to adjust earnings data into real terms figures. At the time of the ASHE survey, CPIH had increased by 7.8 percent compared to April 2021, which was at the time the highest annual increase since 1982. This has since been surpassed. The major contributor to the increase was housing and household services, which was as a result of the increase in the energy costs.
Although inflation had a huge impact on pay at the time of the survey we have focused on longer term changes because of uncertainty in the 2020 and 2021 data, due to the pandemic. This is in line with recommendation from the ONS on how to analyse the data.
Impact of the pandemic on the data
Interpreting the data from ASHE has been complicated because of the pandemic. There are three main areas to consider when looking at the data:
The impact of the Coronavirus Job Retention Scheme (CJRS).
Job insecurity for low-paid jobs.
A decreased response rate for the survey.
Coronavirus Job Retention Scheme (CJRS)
At the time of the survey in 2020 approximately 8.8 million employees were furloughed under the Coronavirus Job Retention Scheme (CJRS), compared to around 3.7 million at the time of the 2021 survey. This means that many employees saw their income fall by 20%, as the CJRS only supported 80% of an employee’s wages. The ONS estimates that around half of employers topped up wages to 100% in both years, but this still leaves a significant number of employees affected by reduced earnings.
Job insecurity for low-paid jobs
As well as the impact of furlough, lower-paid people were at greater risk of losing their jobs during the pandemic. Fewer lower-paid people in the workforce will increase the average earnings for those who remained in work.
Decreased response rate for the survey
Both the 2020 and 2021 surveys saw a lower response rates than usual. As such, ASHE estimates for 2020 and 2021 are subject to more uncertainty than normal.
The combination of furlough and fewer low paid employees mean that the overall composition of employee income changed significantly between 2019 and 2020. With this change in composition and the lower response rates in 2020 and 2021, the ONS have recommended that users should focus on longer term tends rather than comparing 2020 to 2021, as we have done in this briefing.
Jobs in Scotland: March 2018 to March 2022
The composition of the labour market is important in understanding changes in the ASHE data. For example, the headline figure may show that there has been an increase in median pay. However, this could be for multiple reasons, for example:
There could have been an increase in the number of jobs that are paid above the median, which means that the median will increase.
Conversely, there could have been a fall in the number of jobs that are paid less than the median, which will also drive up the median.
The Workforce Jobs data from the ONS allows the breakdown of total workforce jobs by the total number of employee jobs. This is useful as the ASHE data is based on PAYE data. The Workforce Jobs data is released quarterly. We will be looking at the data for March as it is the closest to the time that the ONS survey businesses, which is April every year.
Let's start by looking at the total number of employees:
Between 2018 and 2022, the number of employees in Scotland increased by 81,000.
When we look at the working pattern breakdown, there were 78,000 more full-time employees and 3,000 more part-time.
As full-time roles tend to be higher paid than part-time, we might expect that there would be a increase in the median. However, it is not as straightforward as this.
It is helpful to look at the breakdown by industry to give an idea of the underlying trends between 2018 and 2022:
There has been an increase of 78,000 jobs for the industries with pay above the Scottish median. However, the three highest paid industries have all seen a decrease in the number of jobs.
There has been an increase of 4,500 jobs for the industries paid below the Scottish median. Two of the three lowest paid industries accounted for this increase.
It should be noted that the industries are ranked based on hourly pay excluding overtime for all employees, we have used this measure to control for different working patterns across industries.
Fig 6: Change in the number of jobs by industry between 2018 and 2022, sorted from highest to lowest hourly pay excluding overtime, for average between 2018 to 2022
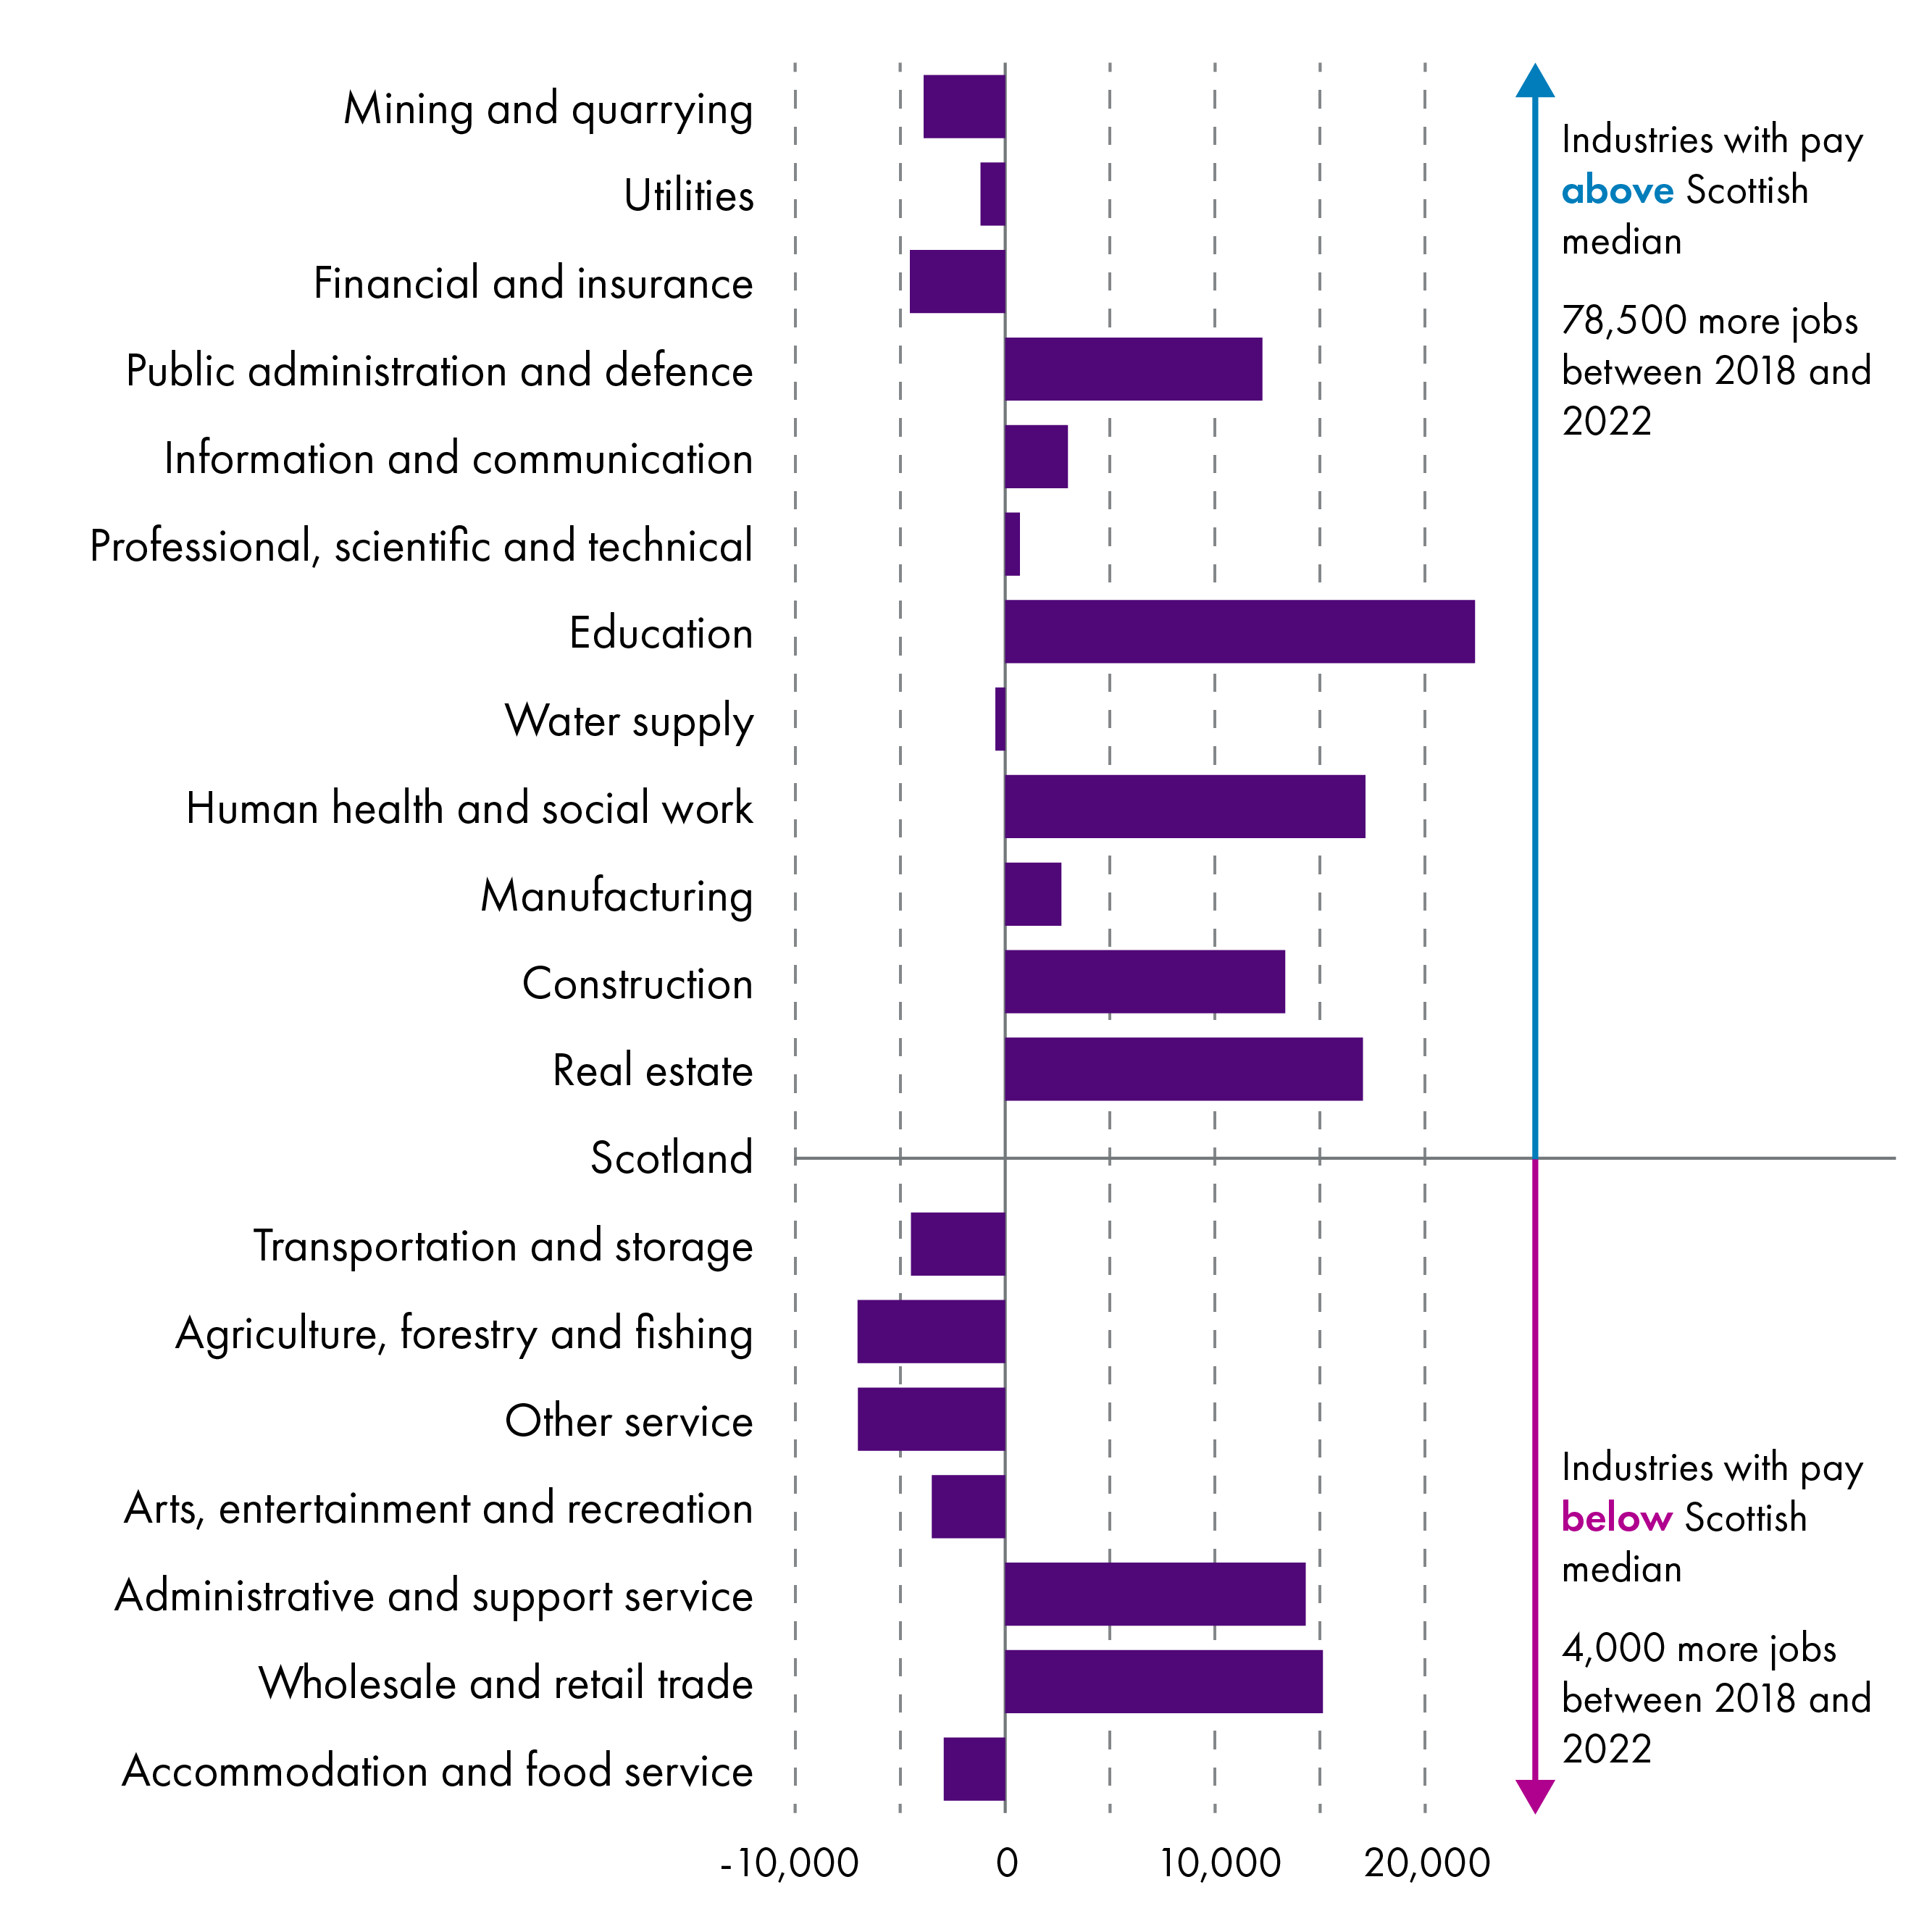
This analysis provides insight on how sectoral changes in the labour market in Scotland, between 2018 and 2022, impacted the ASHE data. However, we cannot make any explicit inferences about this analysis as we don't know the pay for the jobs that have been added or removed from the jobs market.
Typical salaries in Scotland
This section looks at annual salaries for all employees in Scotland, broken down by those in full-time and part-time employment, and how these numbers compare to the other regions and nations of the UK.
The ASHE analysis for annual earnings relates to employees who have been in the same job for more than one year. The ONS has therefore stated the individual annual pay estimates are largely unaffected by the Coronavirus (COVID-19) pandemic.
But, as noted elsewhere, due to the pandemic, the ASHE data for 2020 and 2021 is subject to more uncertainly. We have therefore provided percentage change from 2020 and 2019 as the ONS has recommended focusing on longer term trends. We will be focusing on the change between 2019 and 2021. More information can be found in the About the data section.
What is the typical salary for all employees in Scotland?
This section looks at typical salaries for all employees in Scotland and across the UK.
Fig 7: Median gross annual pay for all employees by nations and regions of the UK - 2022
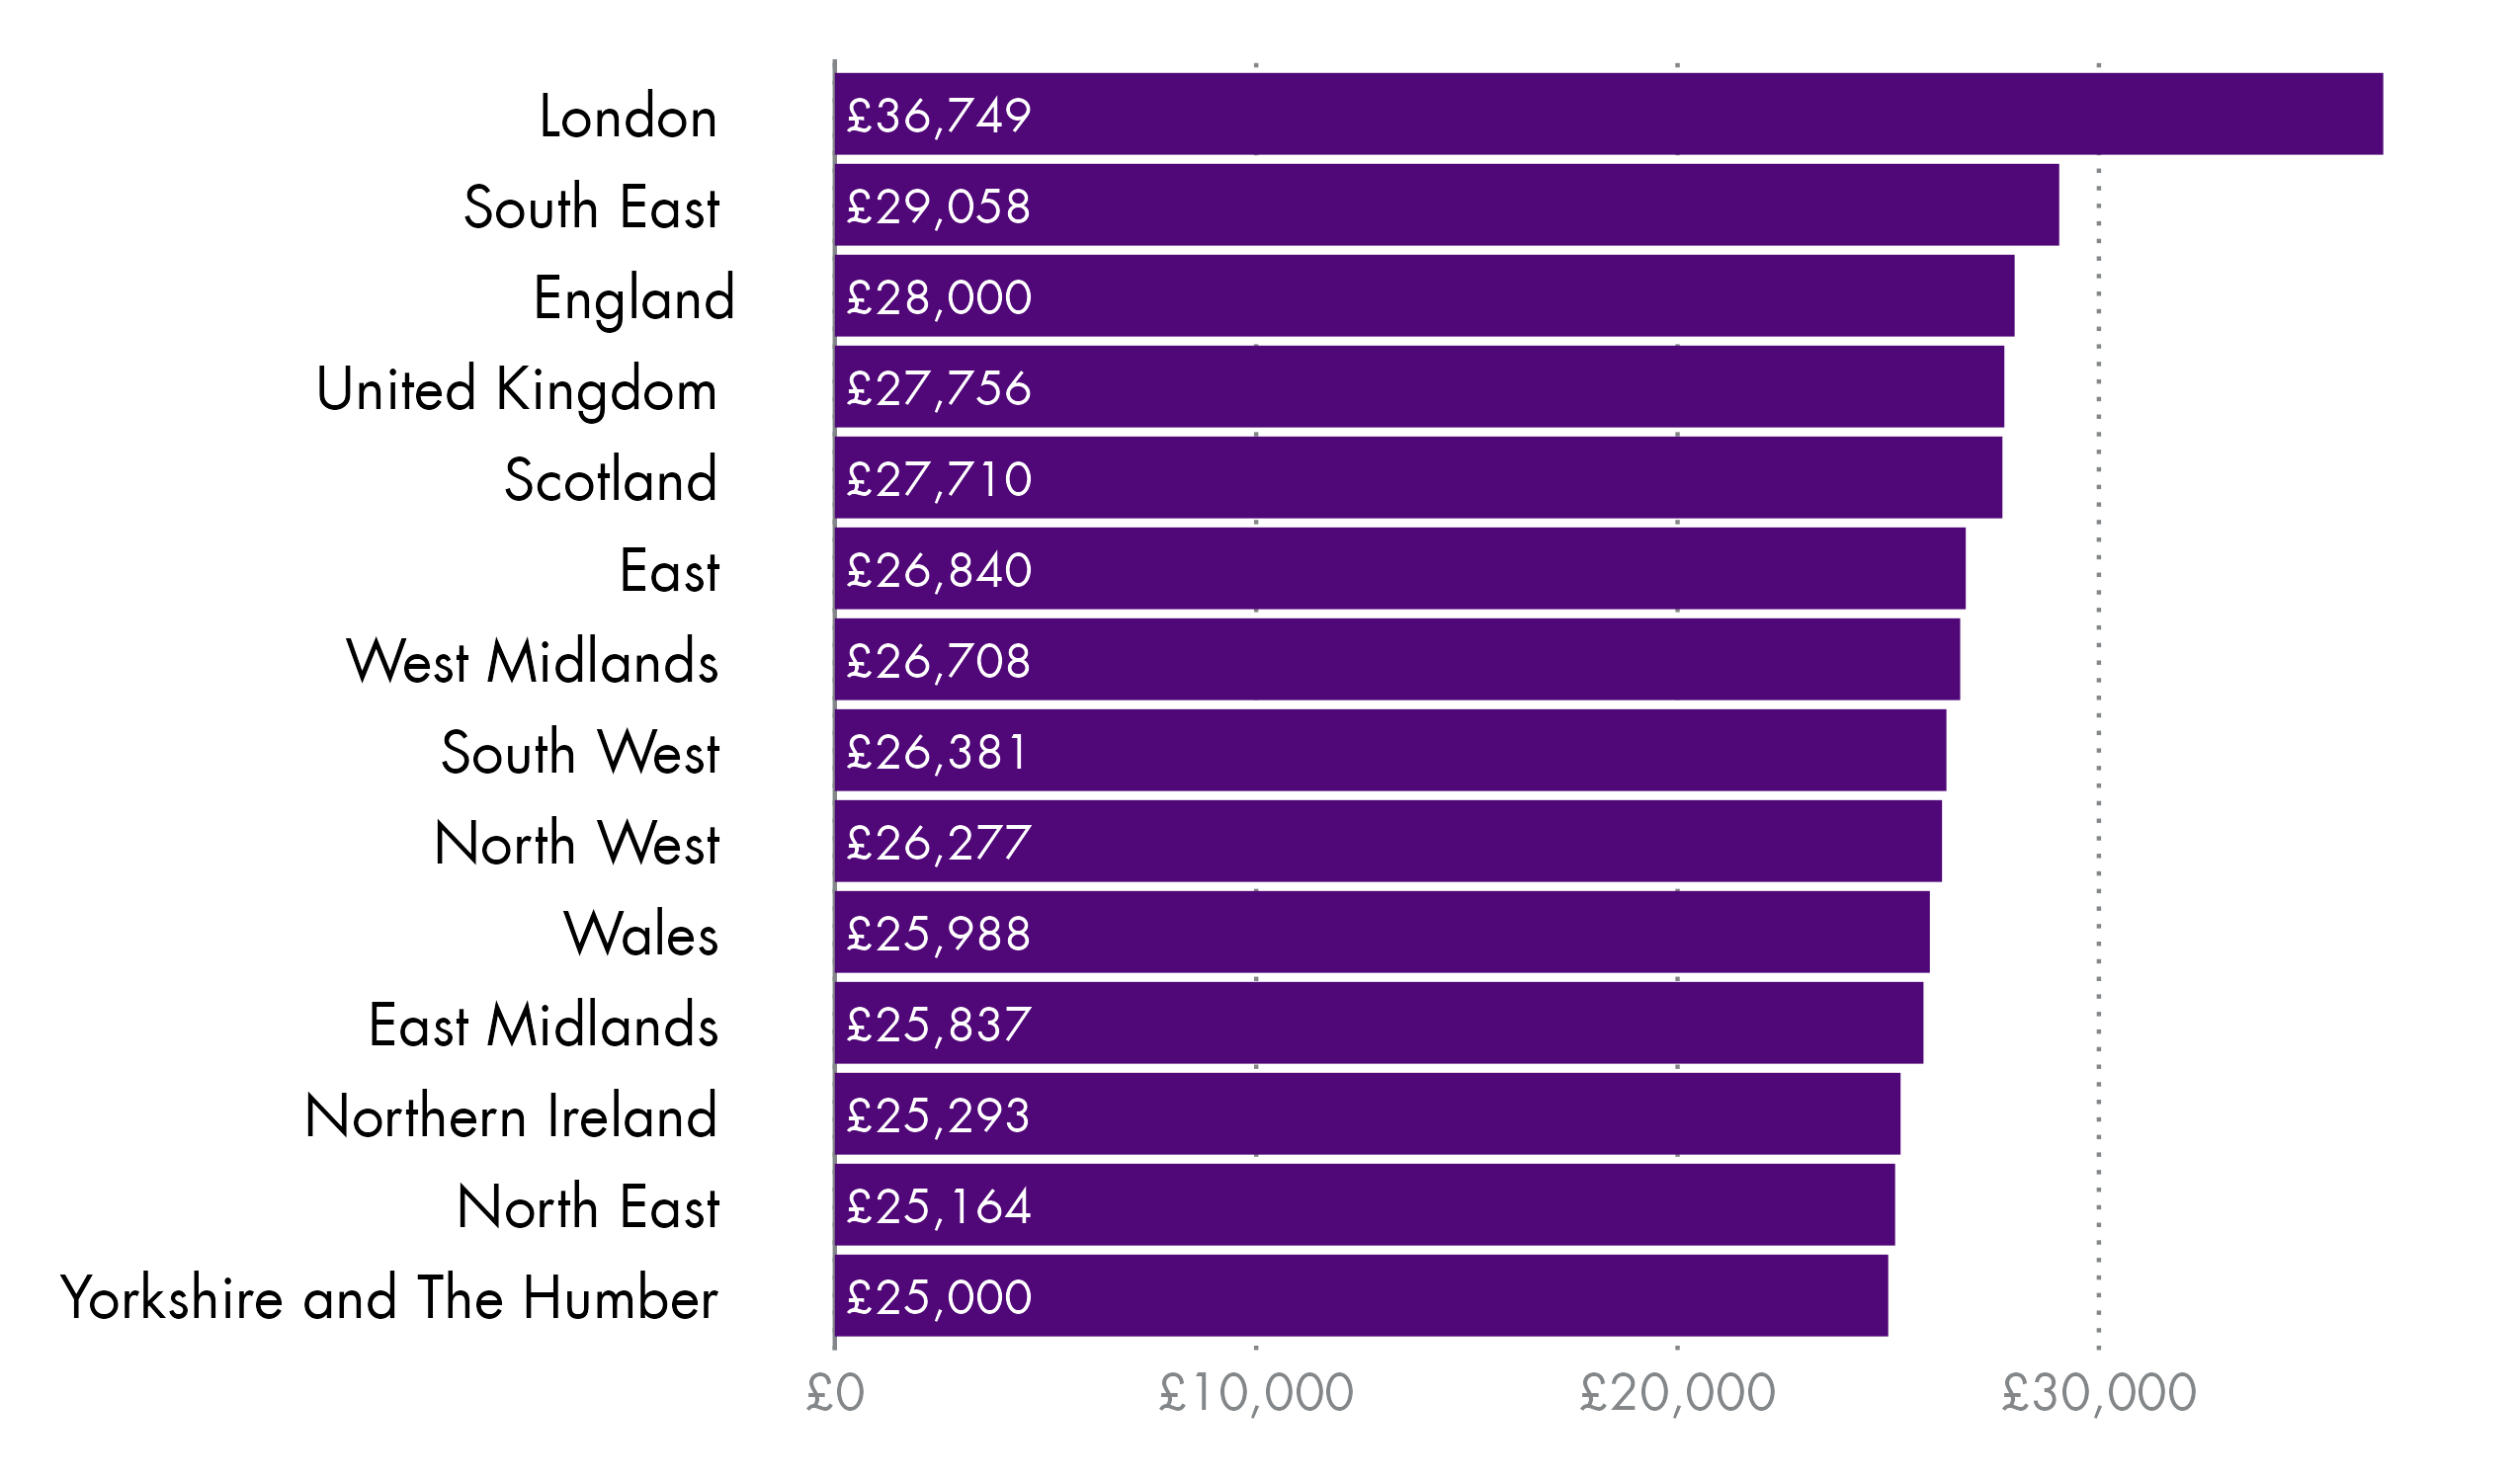
In April 2022, the typical salary for all employees in Scotland was £27,710, which is just below the UK wide figure of £27,756. London has the highest typical salary at £36,749 while Yorkshire and the Humber has the lowest at £25,000.
Figure 8: Real terms median gross annual pay for all employees by region and nation of the UK between 2018 and 2022
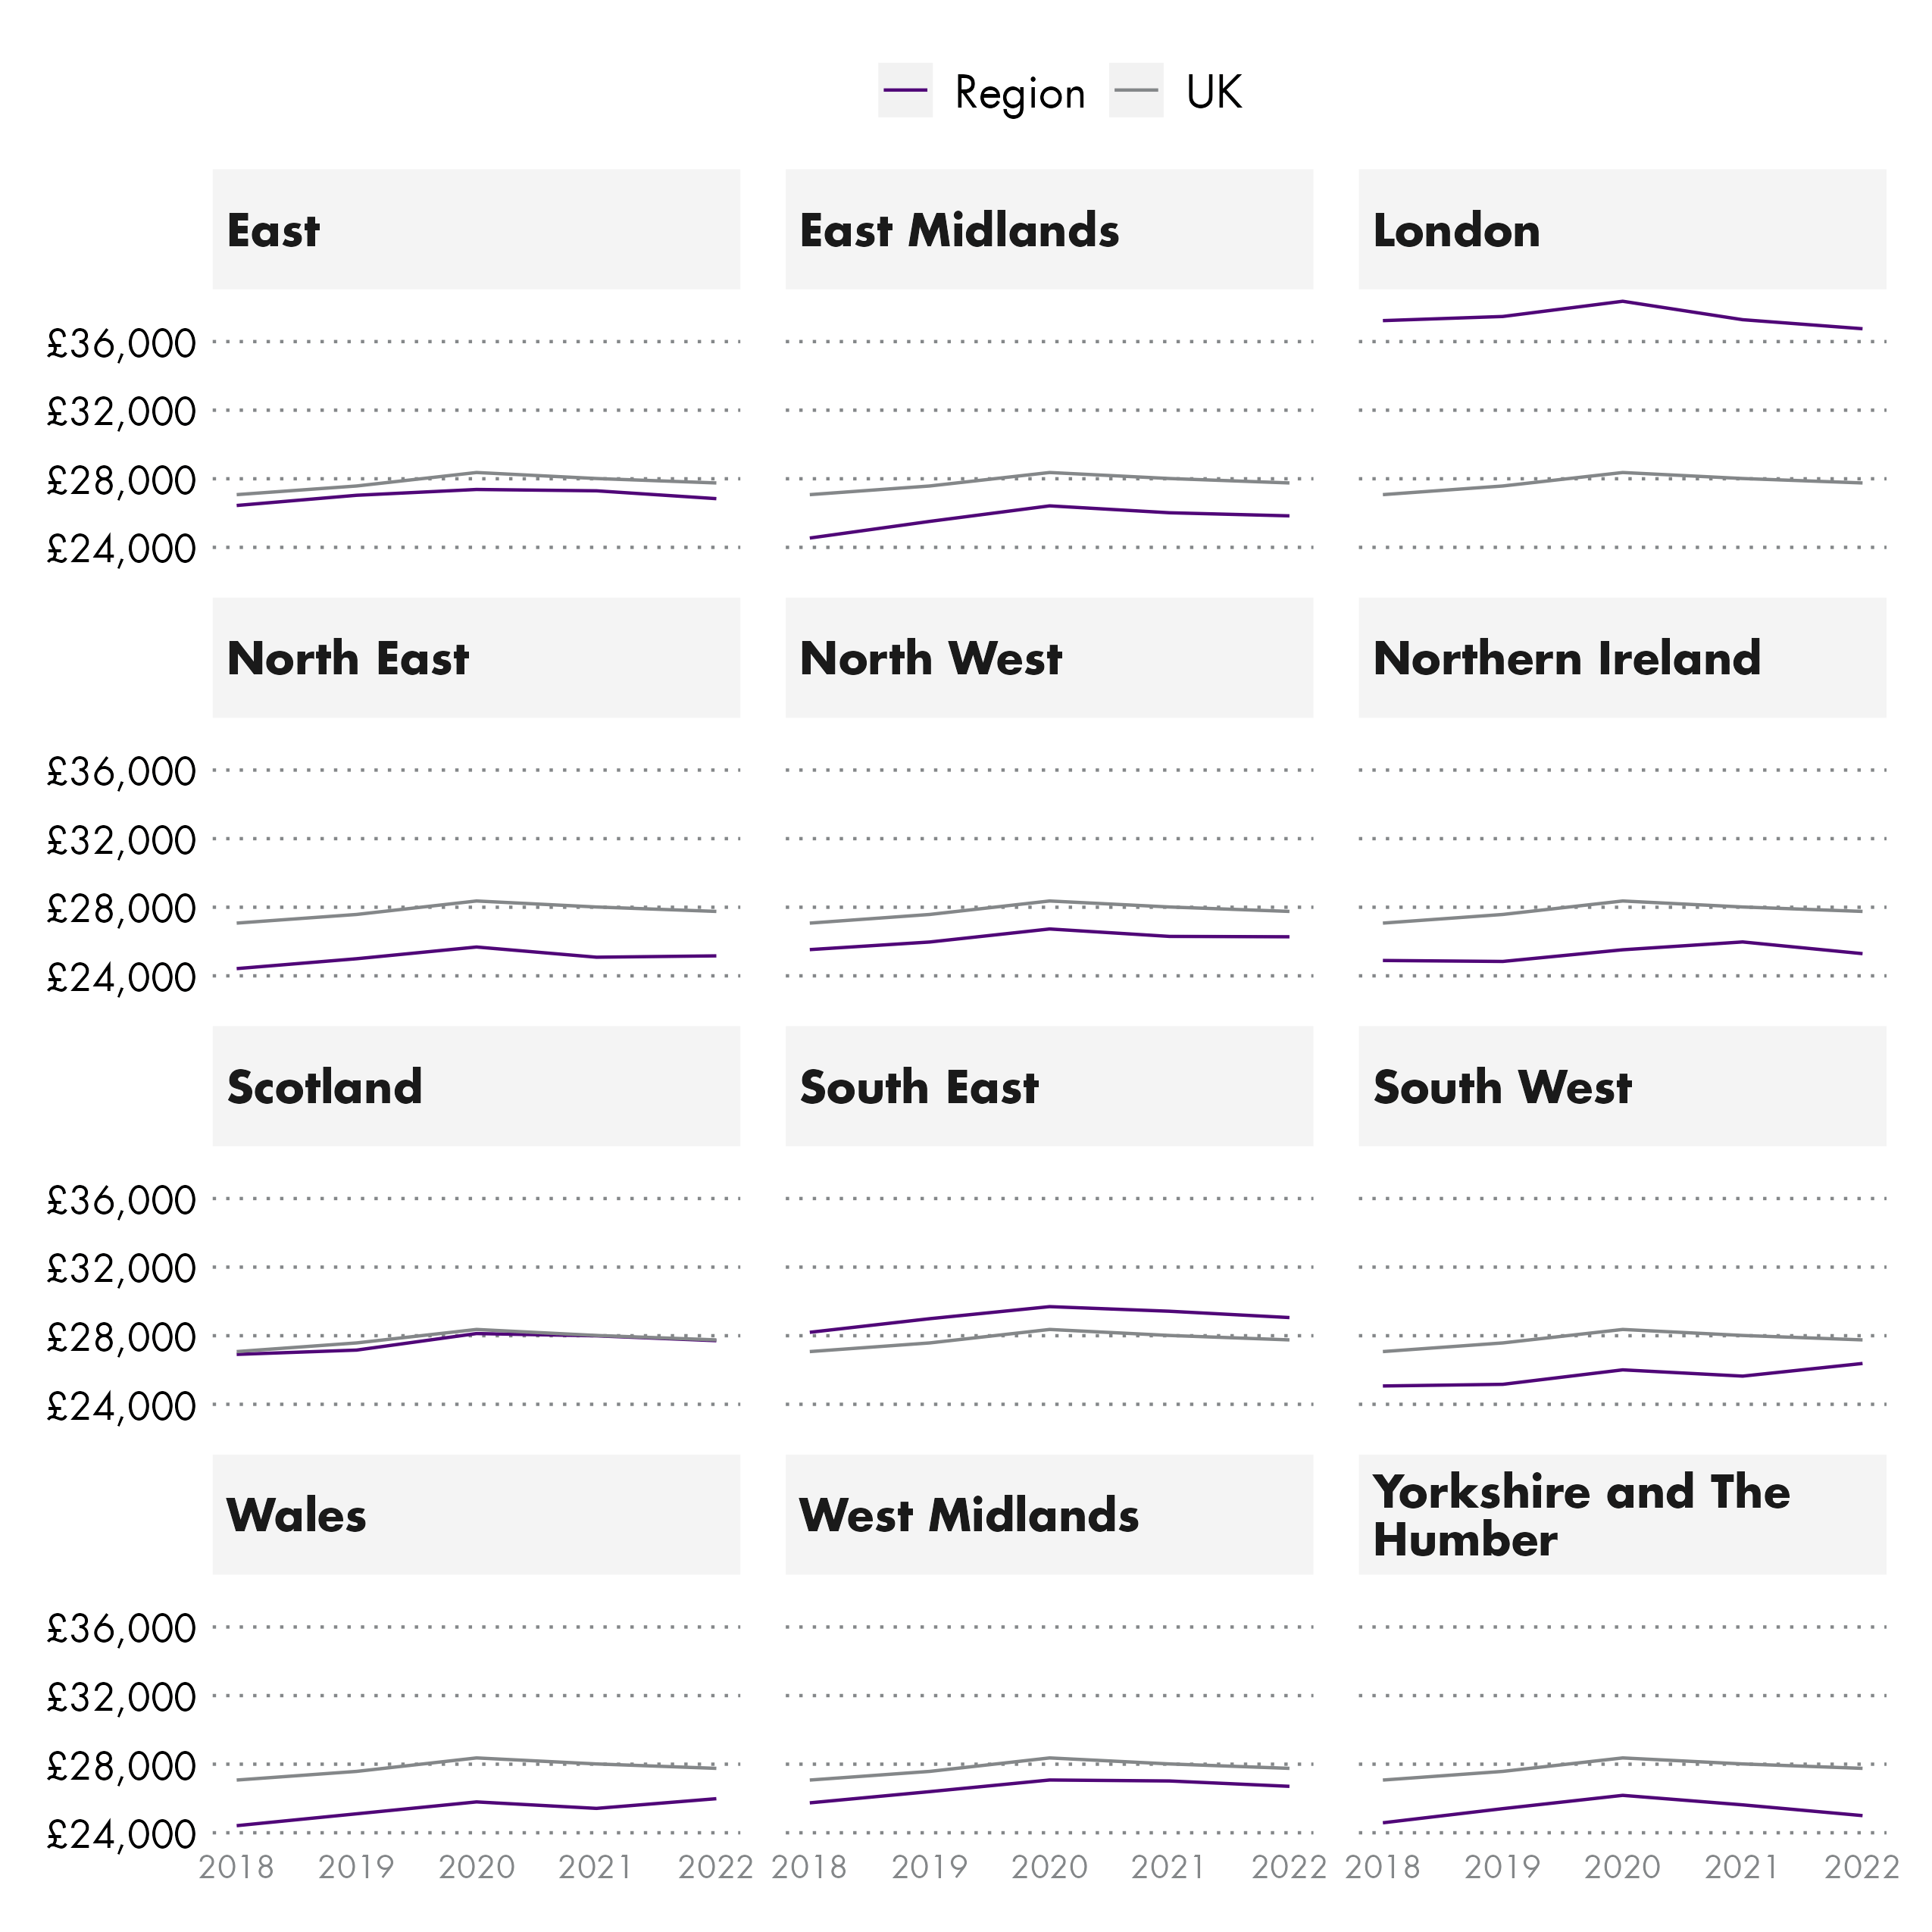
When looking at real terms growth from 2018 to 2022 we can see that annual pay has remained relatively flat across all nations and regions of the UK. The typical salary in Scotland has remained close to the UK overall. Despite the large fall between 2021 and 2022, all regions and nations of the UK, except London, have seen an increase in the typical salary, with Wales seeing the largest increase at 6.4%. Over the same period Scotland has seen an increase of 3.0%.
What is the typical salary for full-time employees in Scotland?
This section looks at typical salaries for full-time employees in Scotland and across the UK.
Fig 9: Median gross annual pay for full-time employees by nations and regions of the UK - 2022
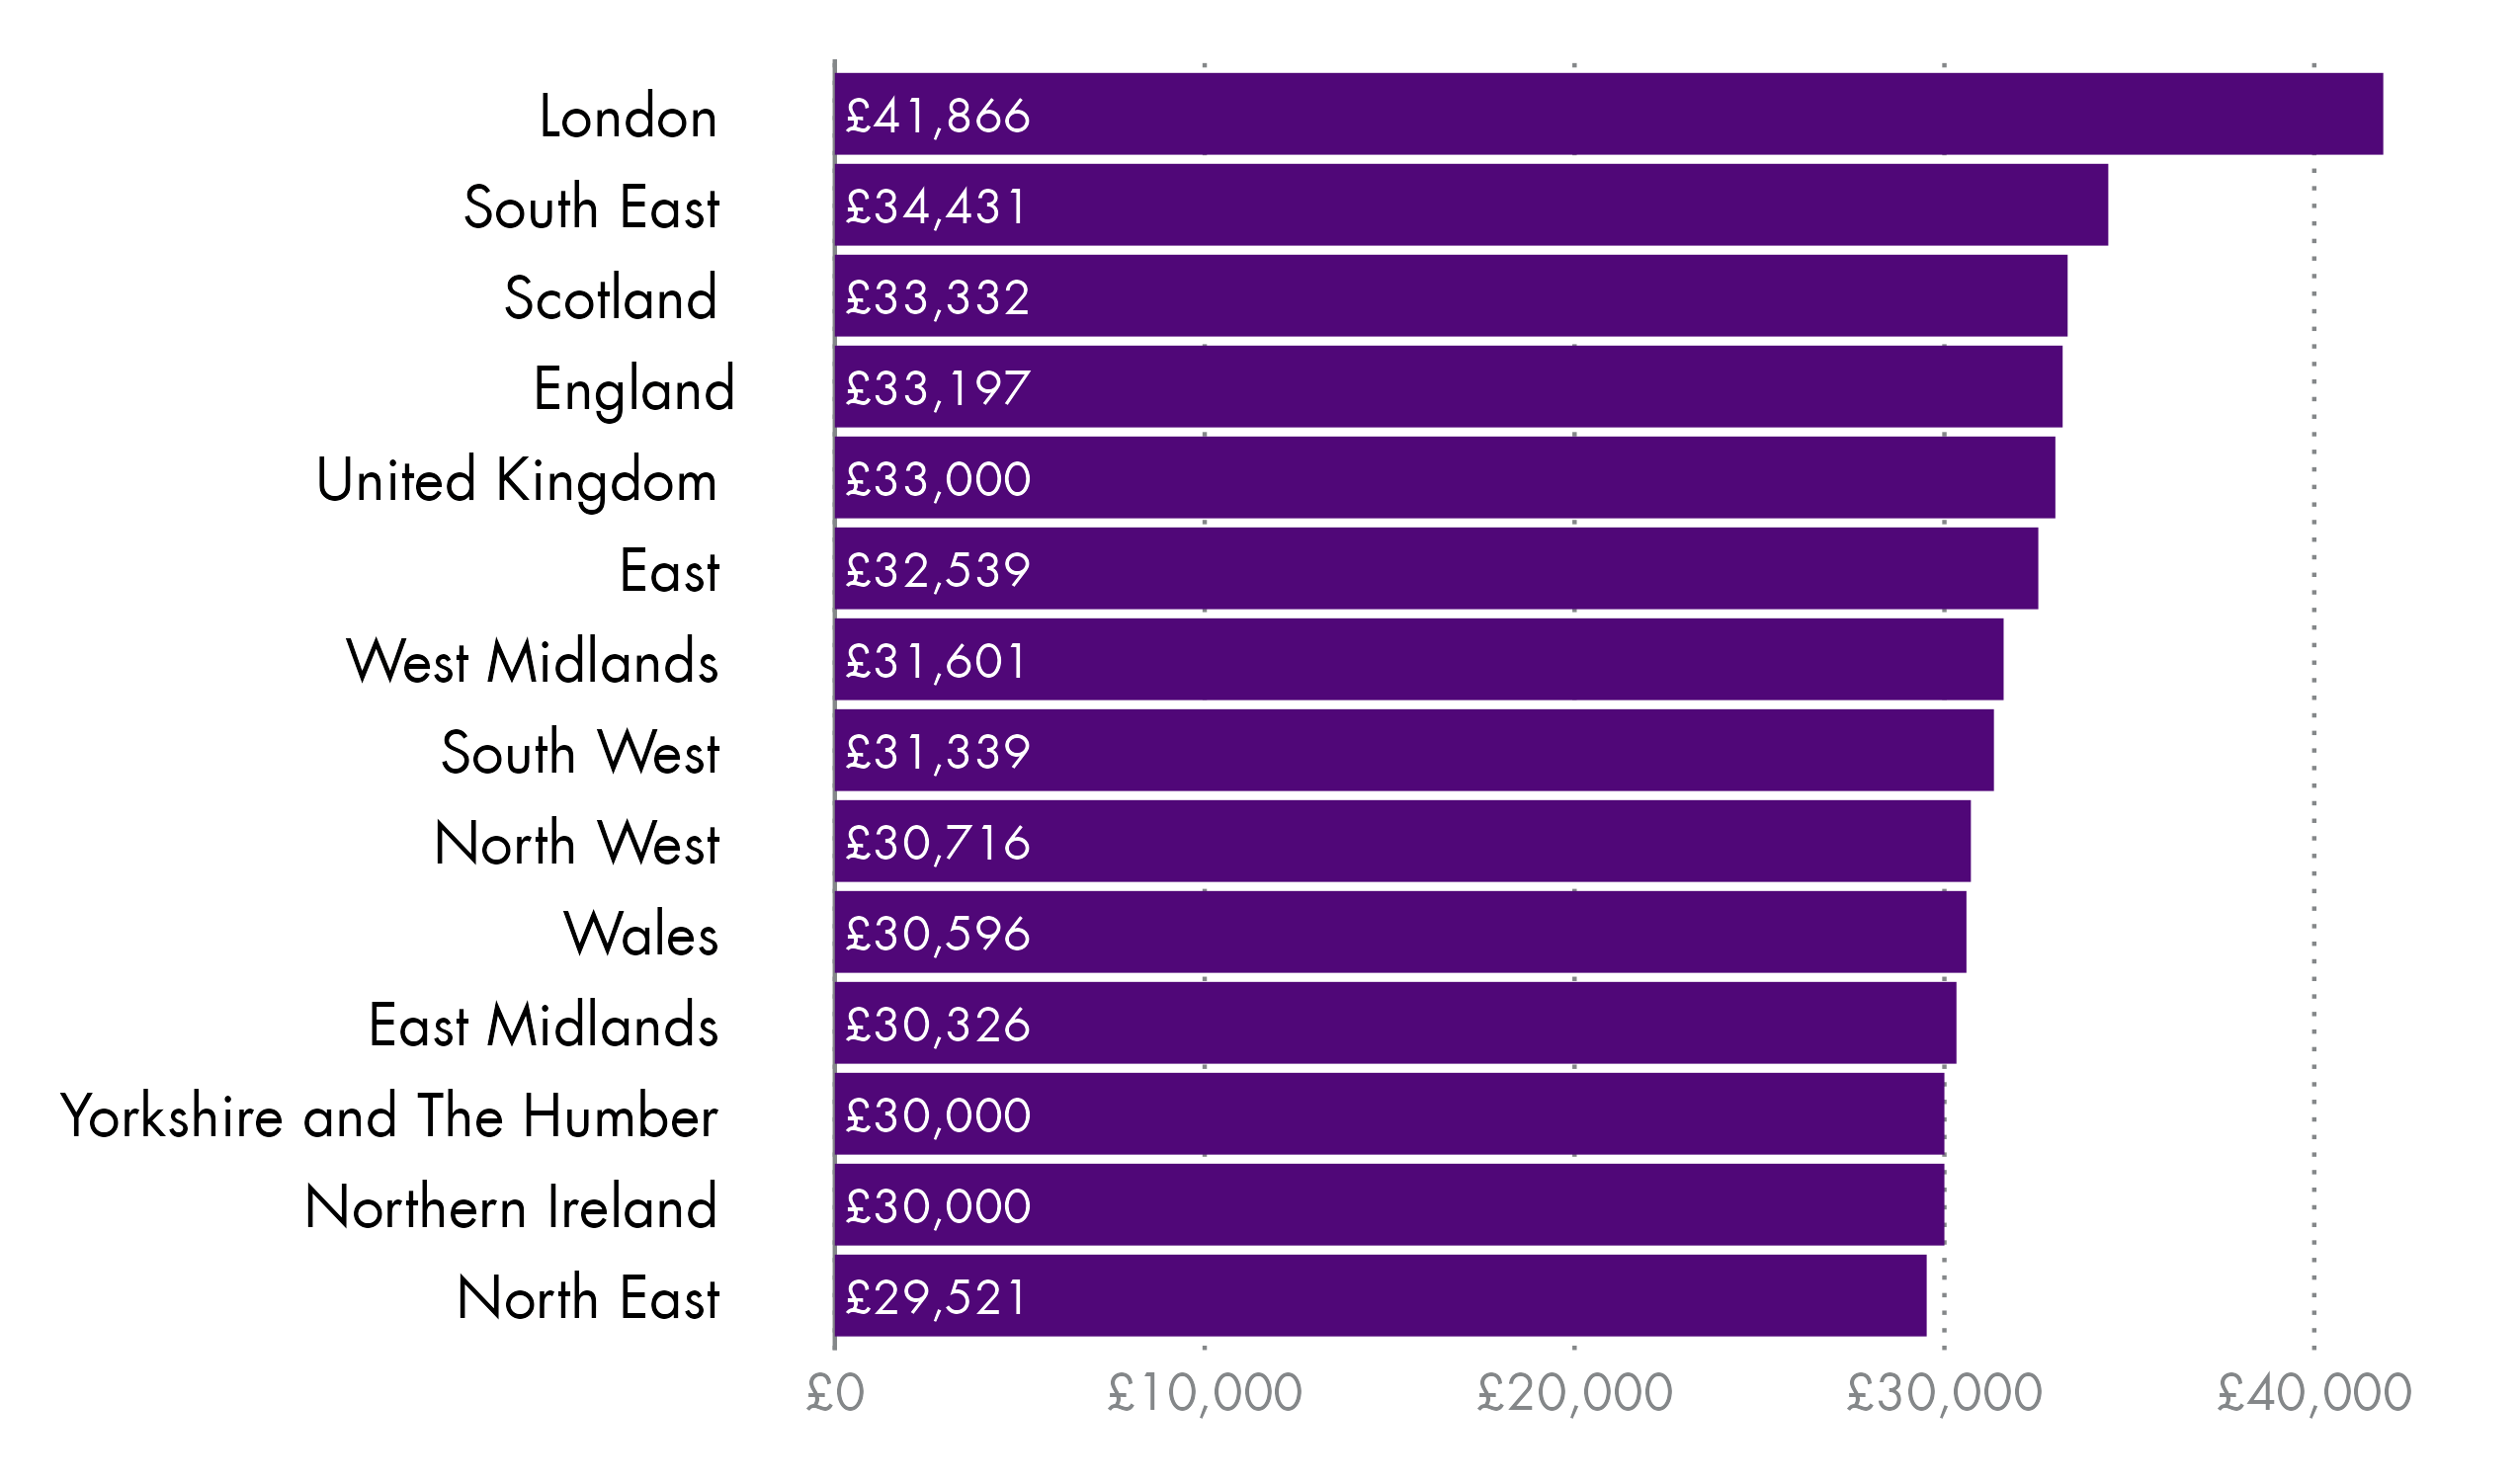
In April 2022, the typical salary for full-time employees in Scotland was £33,332, which is just above the UK wide figure of £33,000. London has the highest typical salary at £41,866 while the North East of England has the lowest at around £29,521.
Figure 10: Real terms median full-time gross annual pay by region and nation of the UK between 2018 and 2022
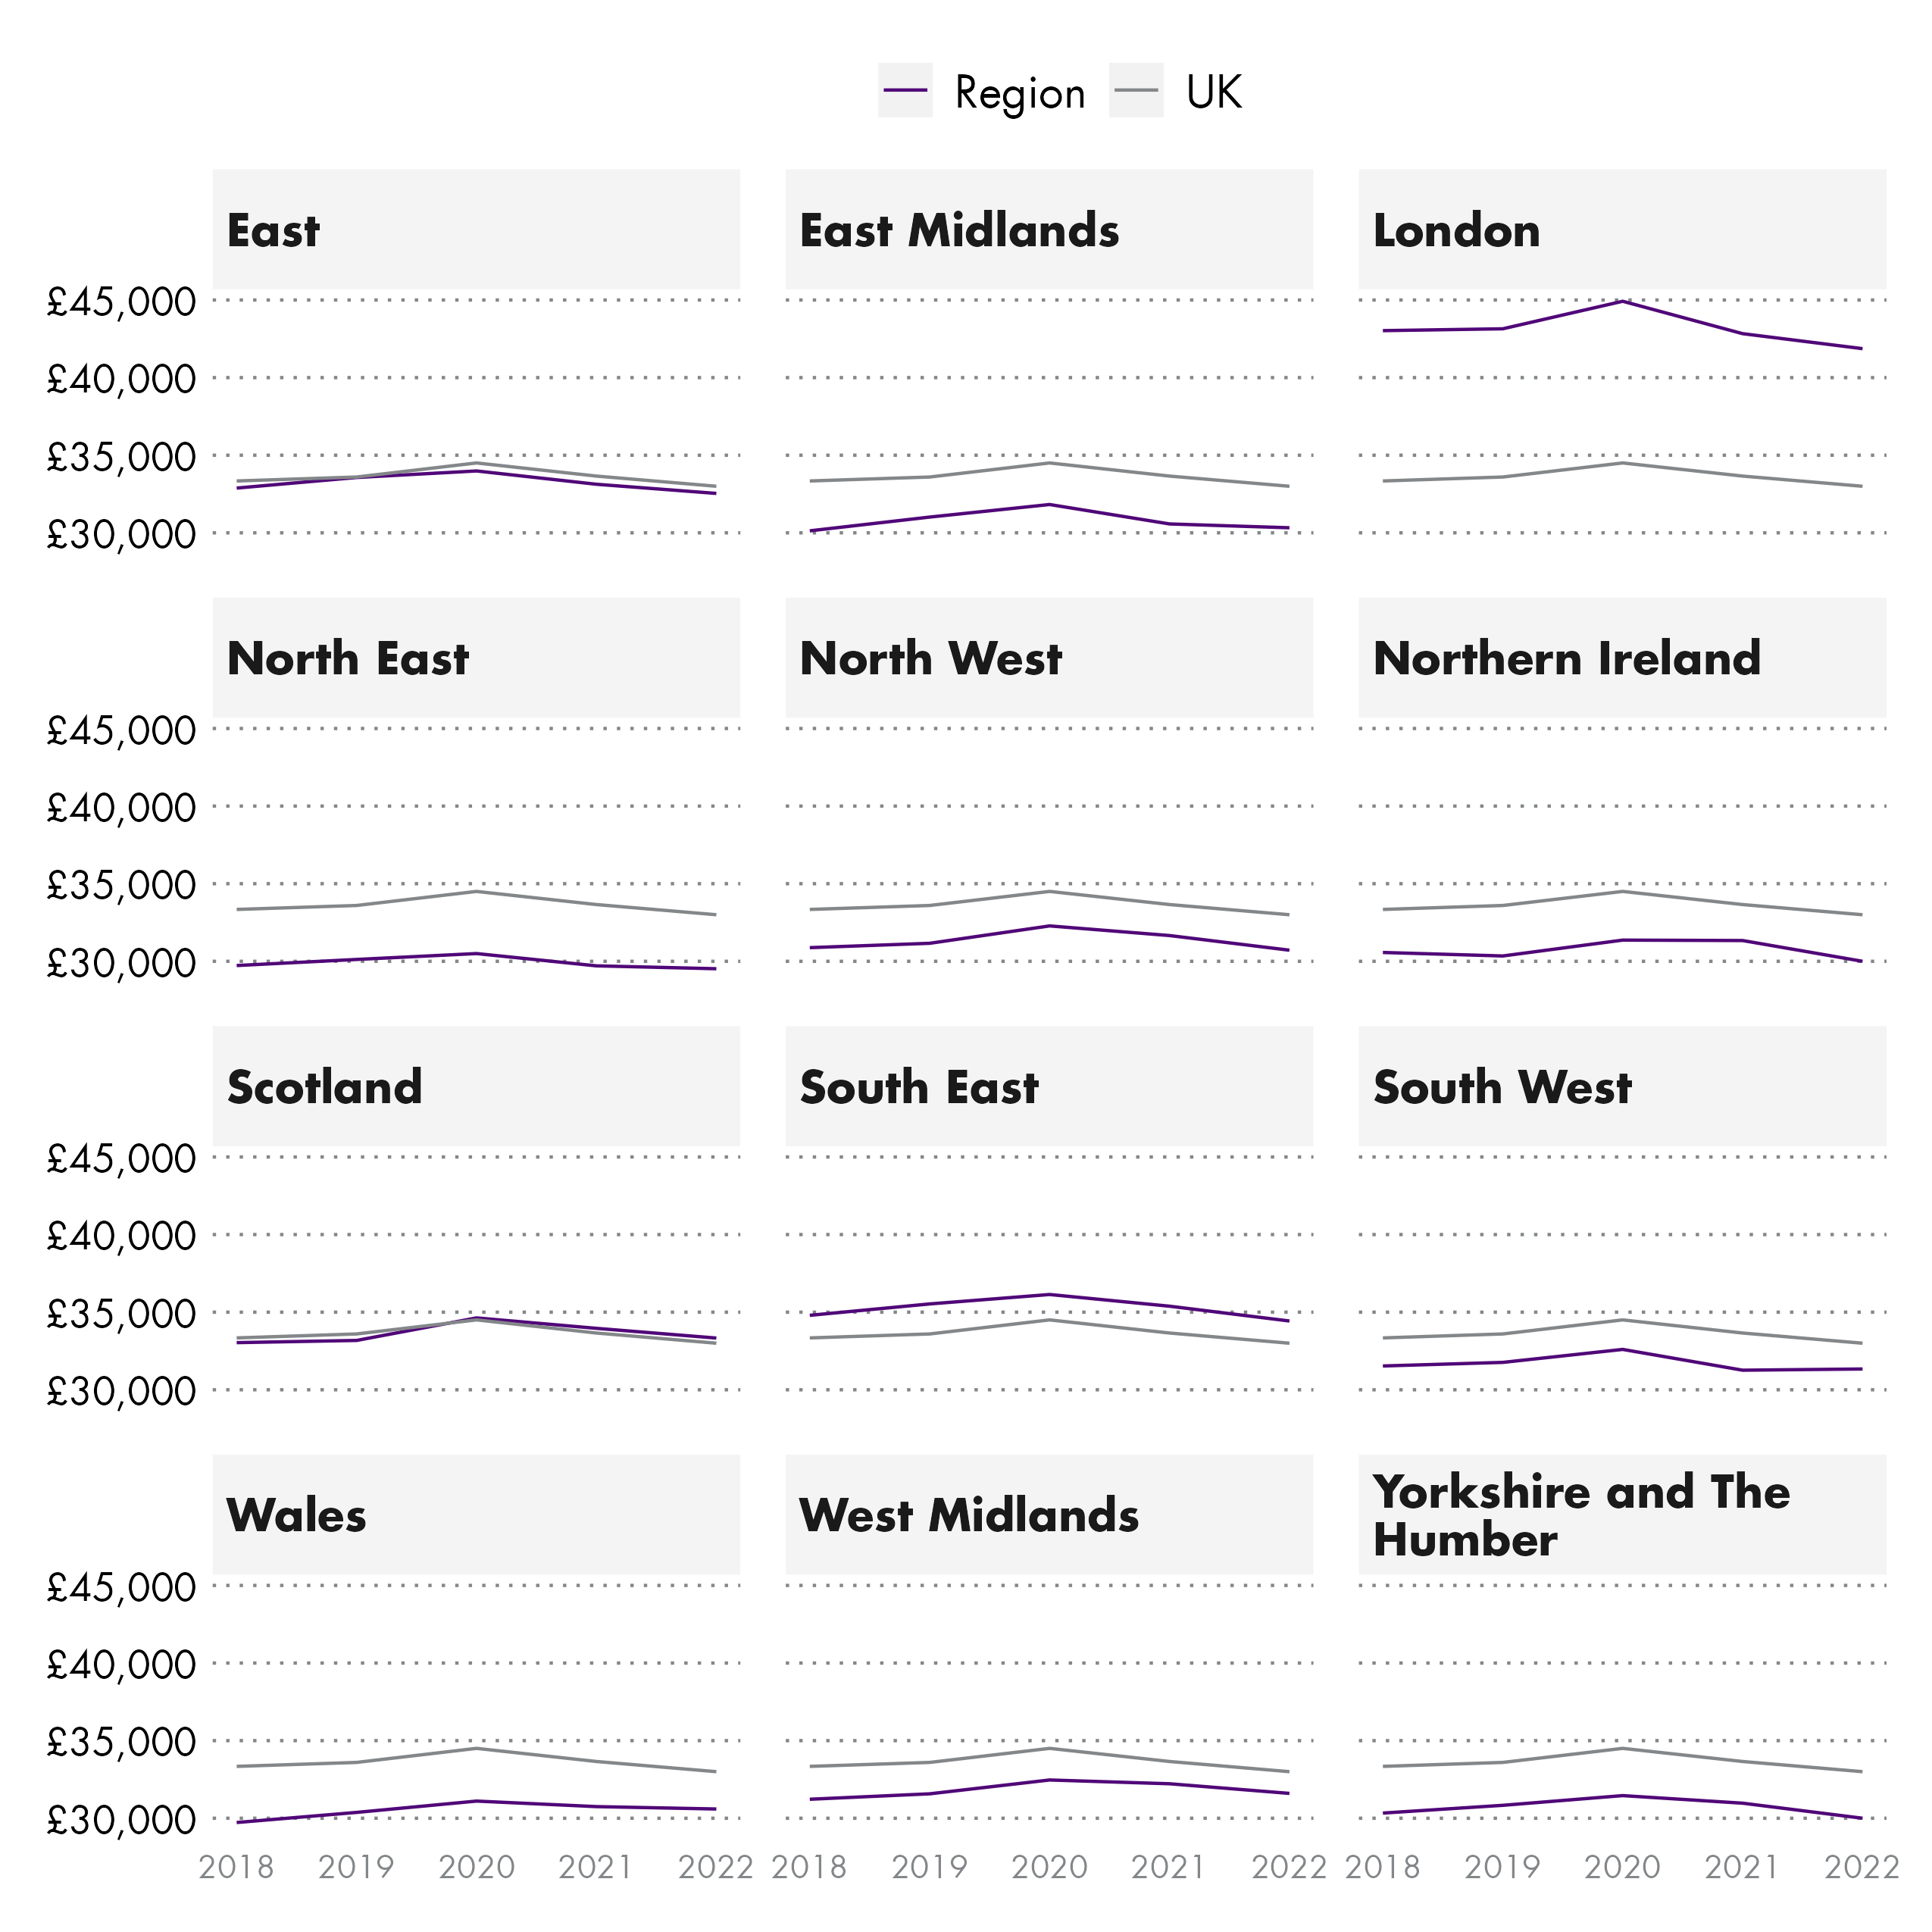
Only four of the nations and regions of the UK have seen real terms growth in gross annual full-time salaries between 2018 and 2022. Wales saw the largest increase, at 2.9% while Scotland saw an increase of 0.9%. London saw the largest fall, at 2.7%.
Care should be taken when interpreting these figures due to issues with this year's data. You can find out more in this in the "about the data" section of the briefing.
What is the typical salary for part-time employees in Scotland?
This section looks at typical salaries for part-time employees in Scotland and across the UK.
When looking at part-time pay it is important to note:
Part-time jobs tend to be more impacted by increases in National Minimum Wage rates, due to a typical lower hourly rate.
Flexible working patterns can change employee job profiles from full-time to part-time, whilst retaining higher hourly pay rates.
Figure 11: Real terms median gross annual pay for part-time employees by region and nation of the UK - 2022
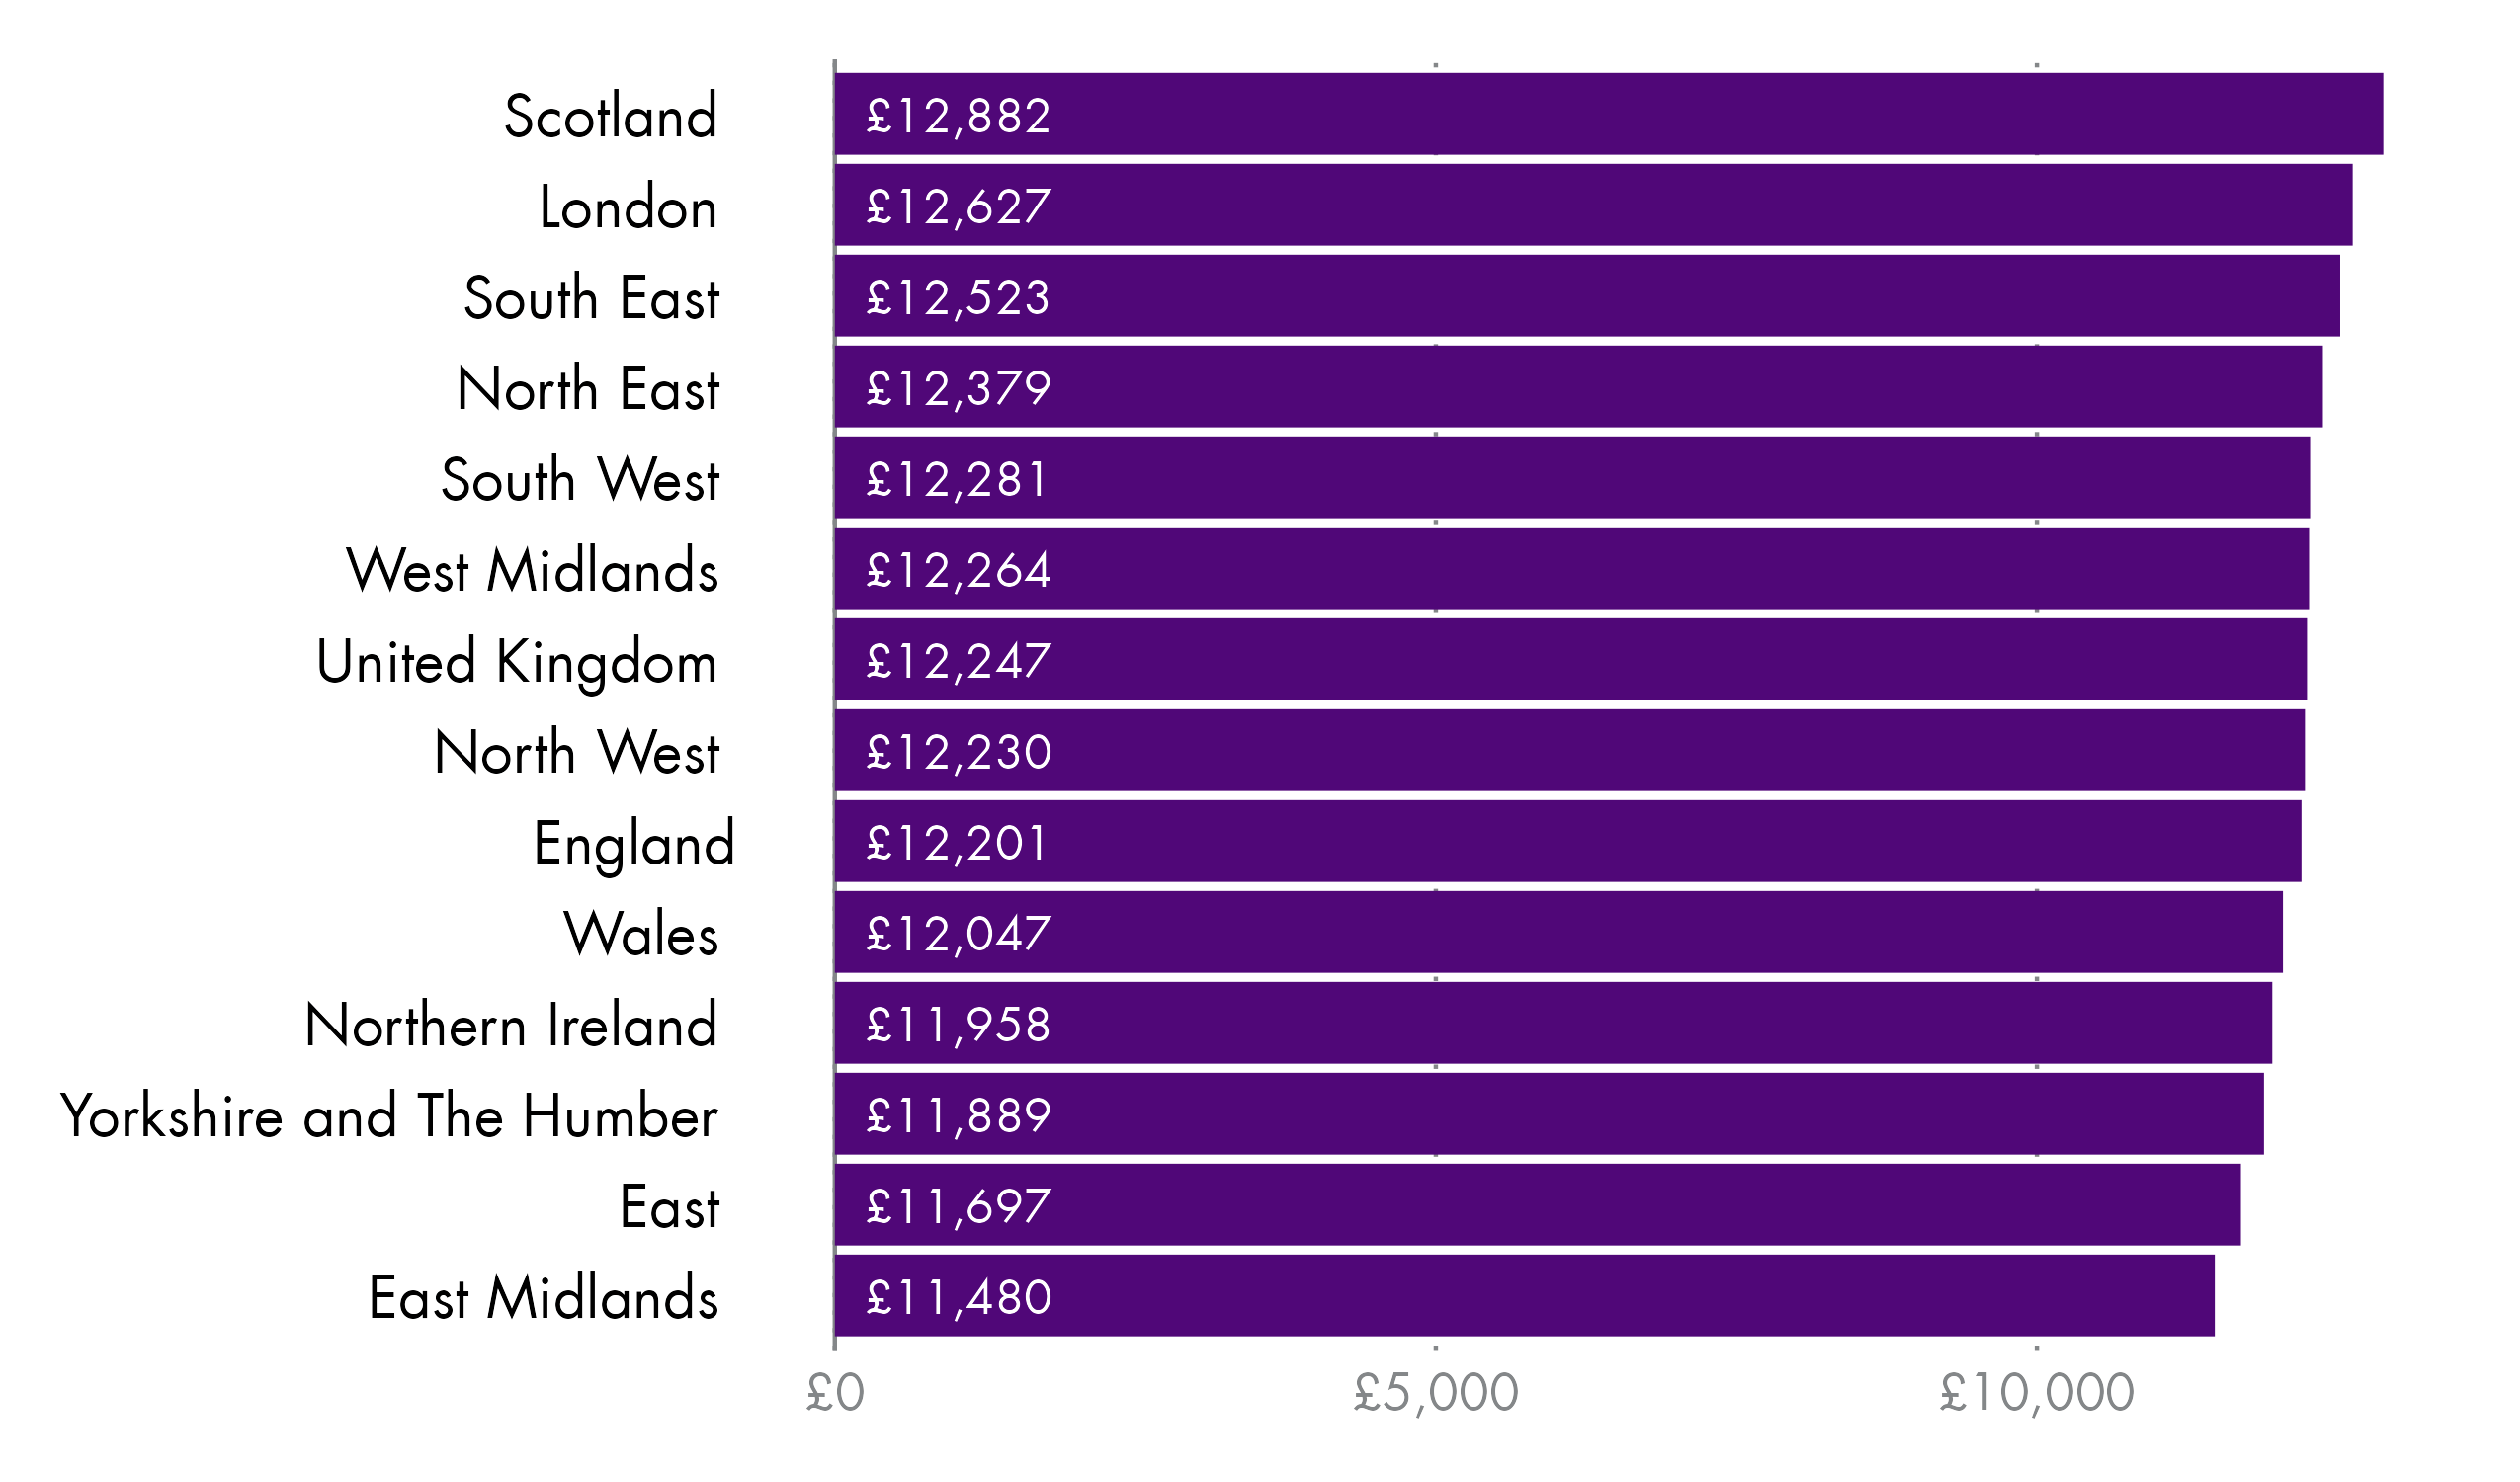
In April 2021, the typical salary for part-time employees in Scotland was £12,882, which is the highest across the UK. The East Midlands has the lowest at £11,480.
Figure 12: Real terms median gross annual pay for part-time employees by region and nation of the UK between 2018 and 2022
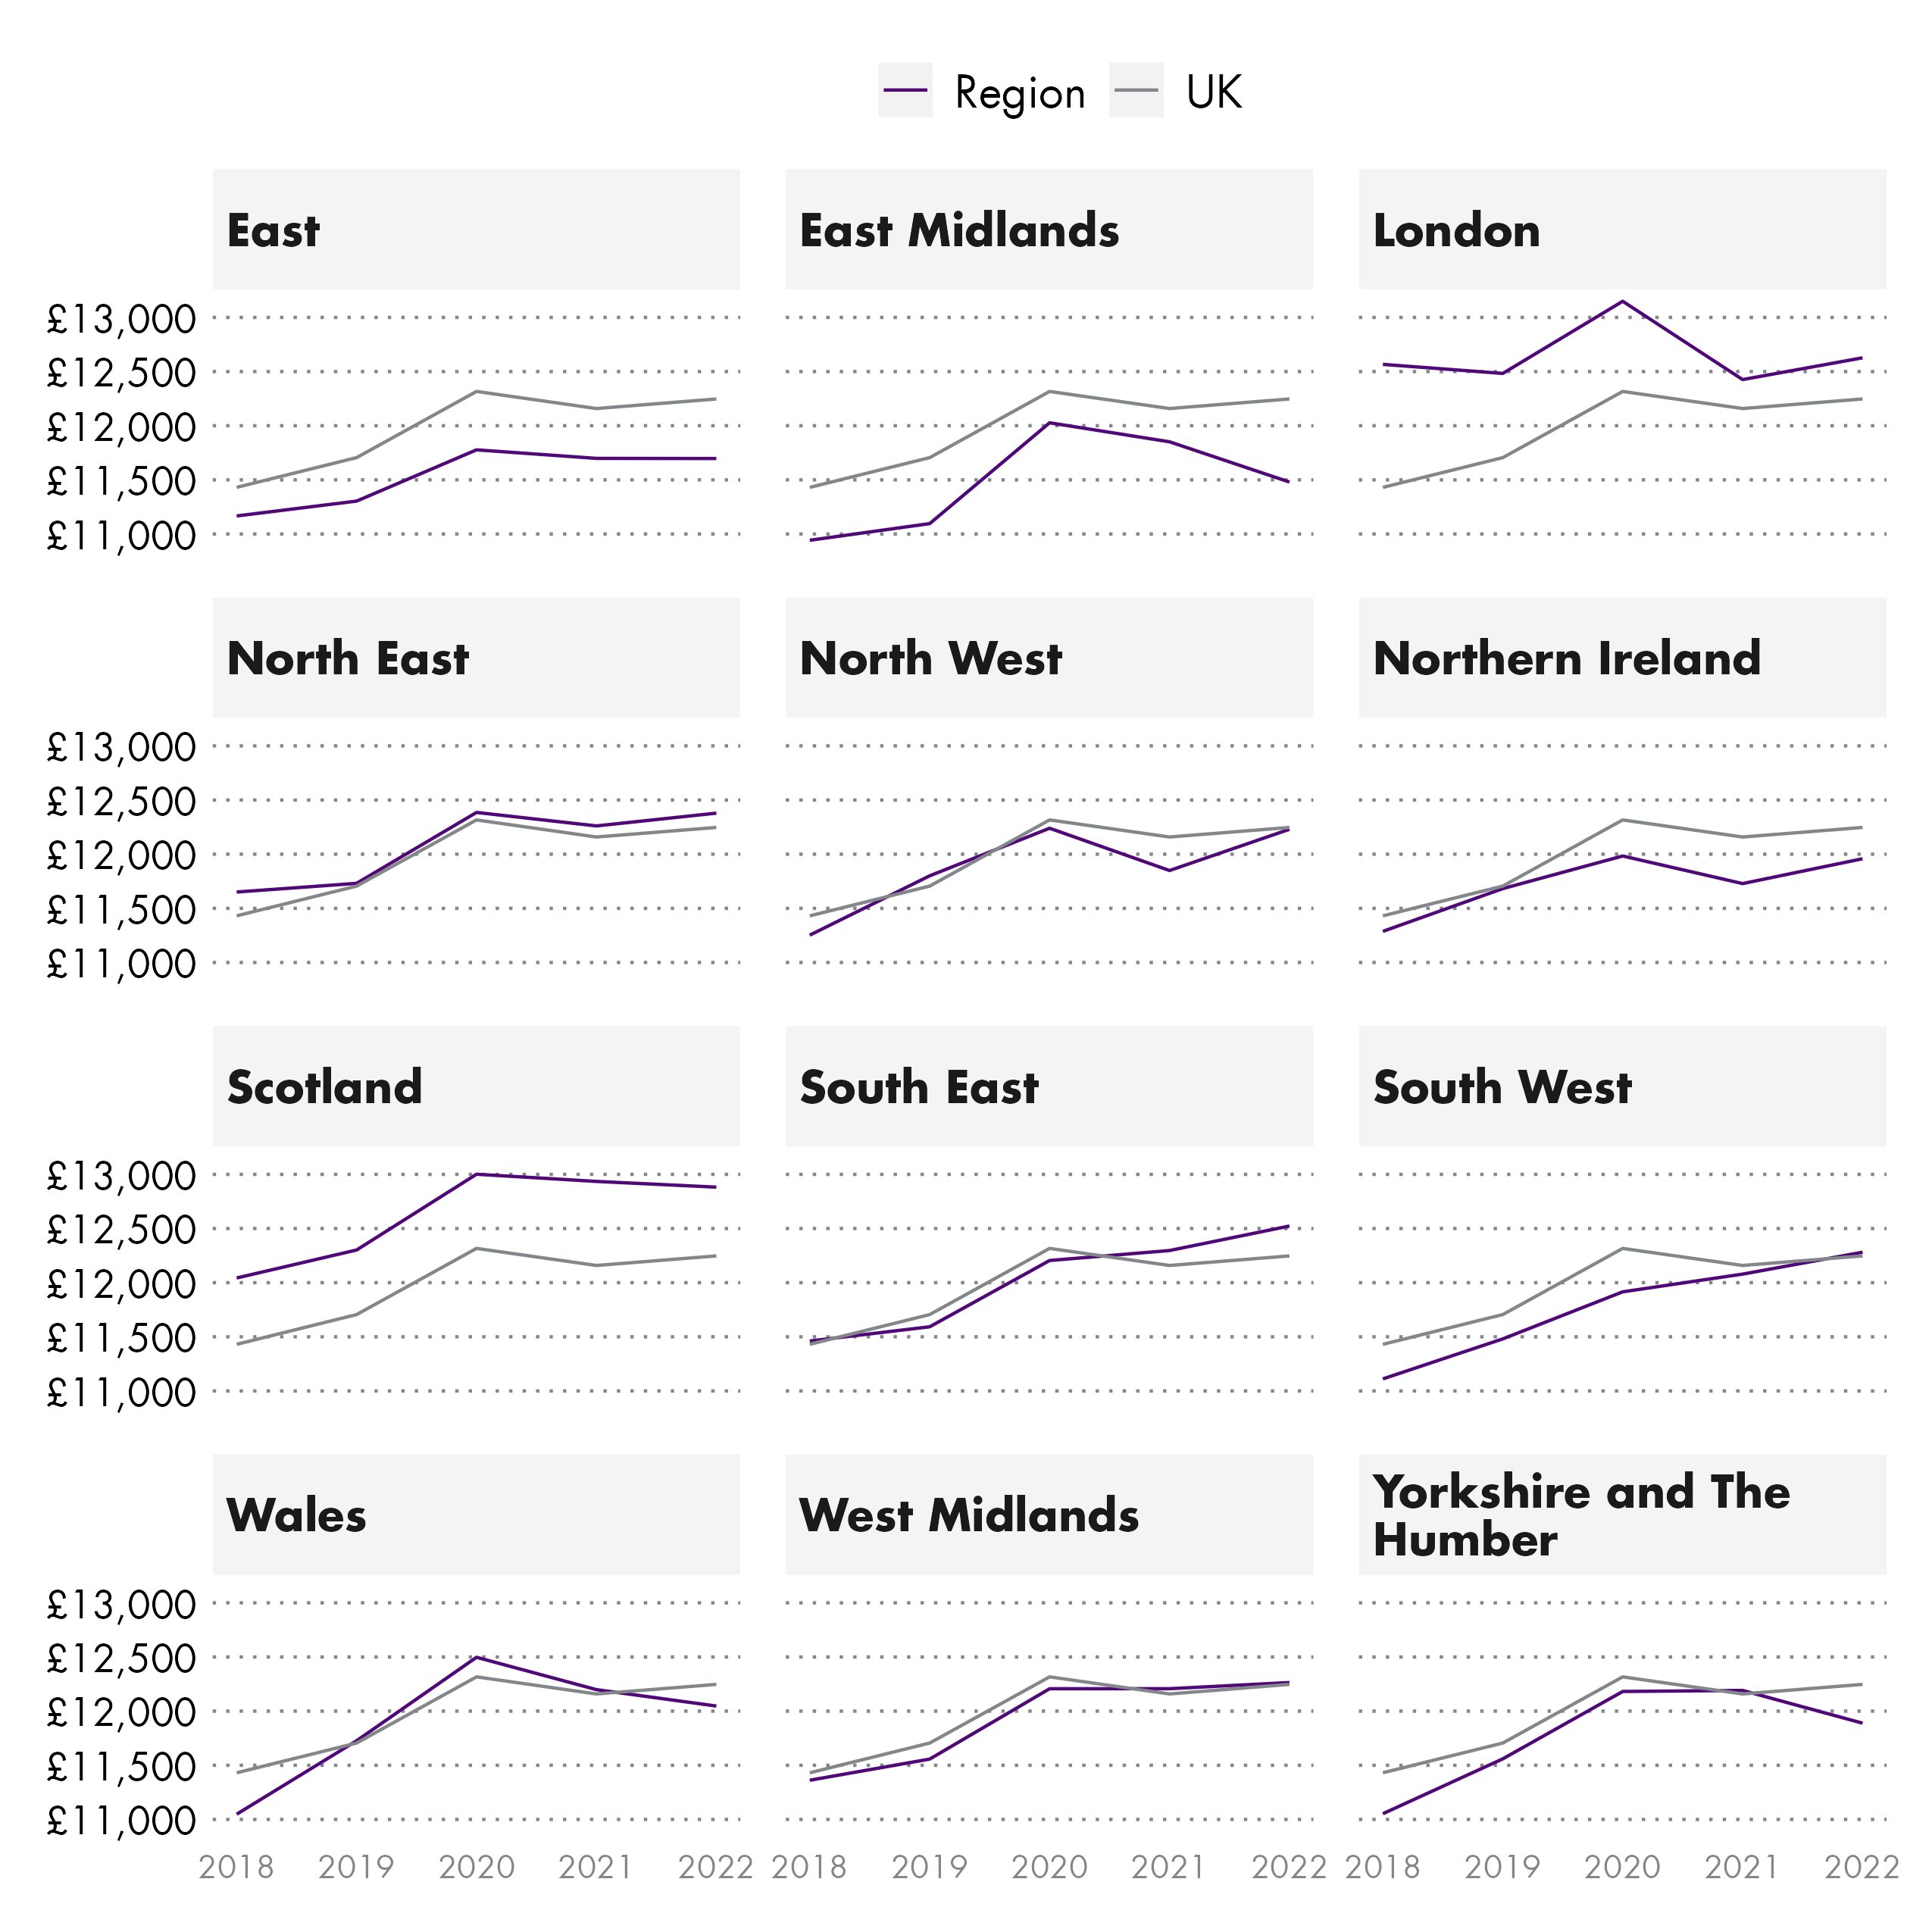
All nations and regions of the UK have seen increases in real terms part-time salaries. The South West of England has seen the largest at 10.5%, and London the lowest at 0.5%. Scotland has seen an increase of 7.0% over the same time period.
Typical weekly pay in Scotland
This section looks at weekly pay for all employees in Scotland, broken down by those in full-time and part-time employment, and how these numbers compare to the other regions and nations of the UK.
ASHE analyses for weekly earnings related to employees whose earnings for the survey pay period were not affected by absence. They do not include the earnings of those who did not work a full week, and whose earnings were reduced because of, for example, sickness.
Weekly pay is the main measure used by the ONS.
Due to the pandemic the ASHE data for 2020 and 2021 is subject to more uncertainly. We have therefore provided percentage changes from 2020 and 2019 as the ONS has recommended focusing on longer term trends. More information can be found in the About the data section.
What is typical weekly pay for all employees in Scotland?
This section looks at typical weekly pay for all employees in Scotland and across the UK.
Fig 13: Median gross weekly pay for all employees by nations and regions of the UK - 2022
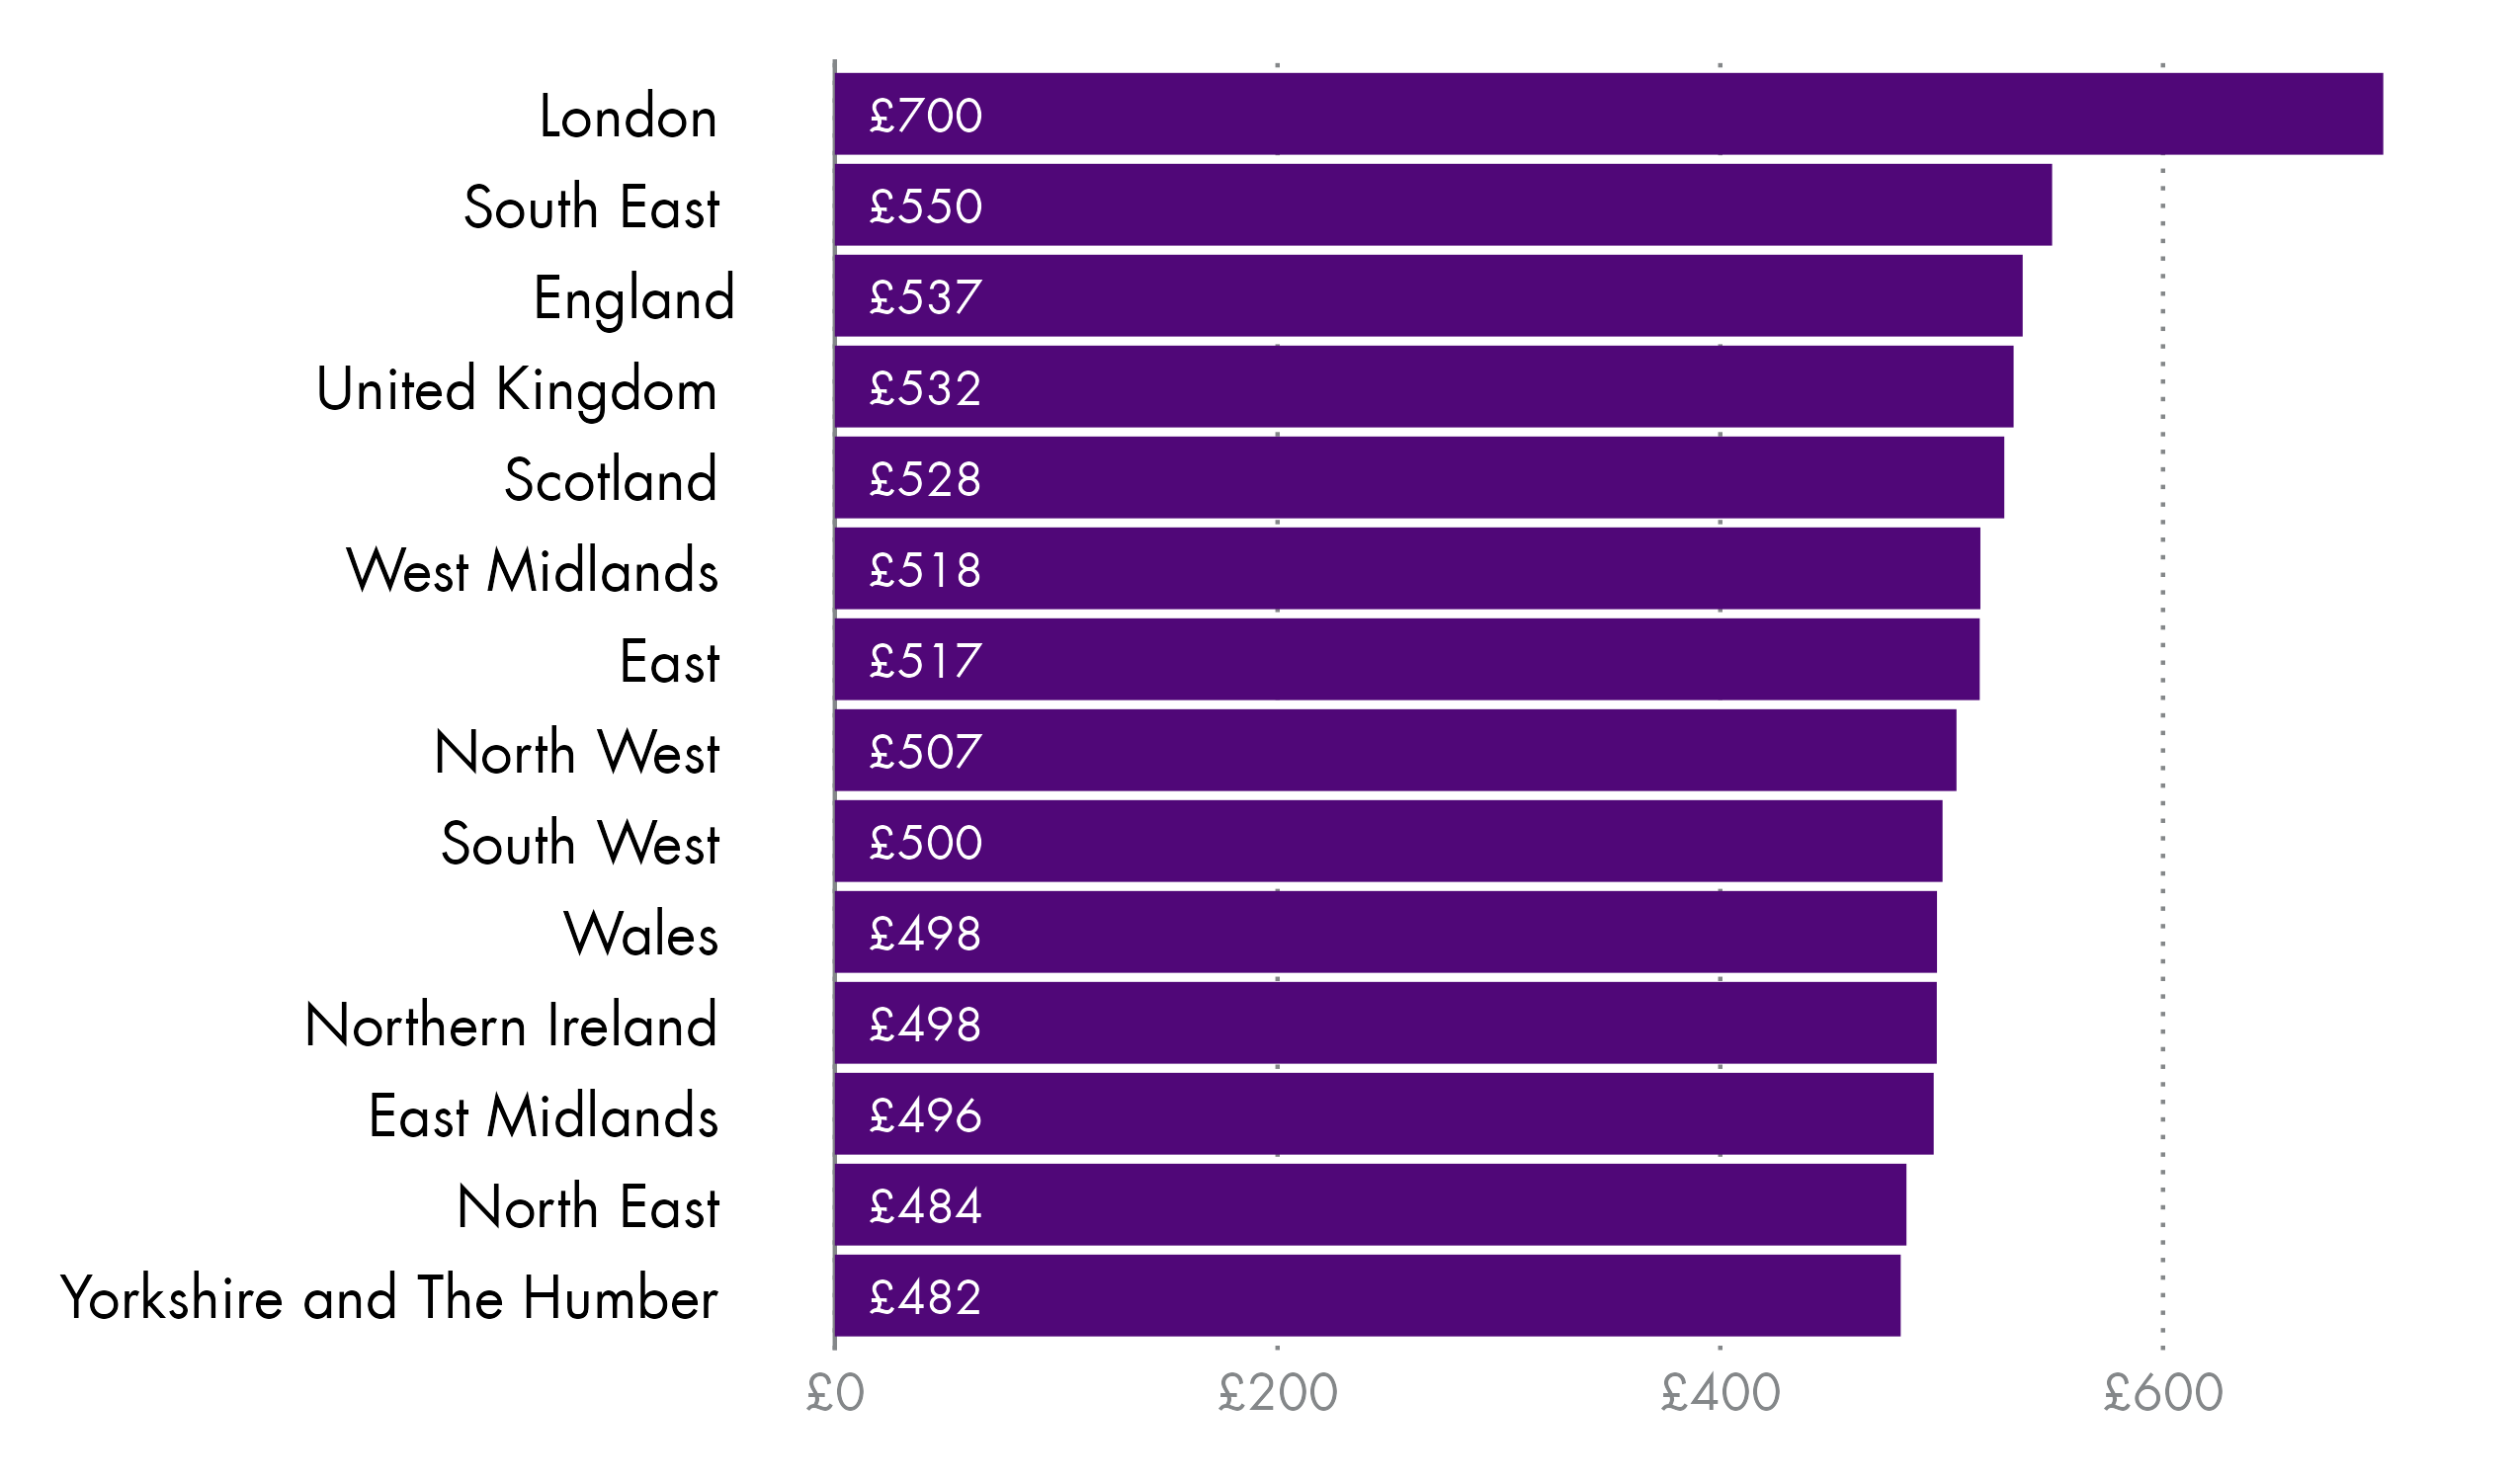
Typical gross weekly pay in Scotland is just below the UK wide figure at £528. London has the highest weekly pay at £700, while Yorkshire and the Humber has the lowest at £482.
Fig 14: Real terms median gross weekly pay for all employees by nations and regions of the UK - 2018 to 2022
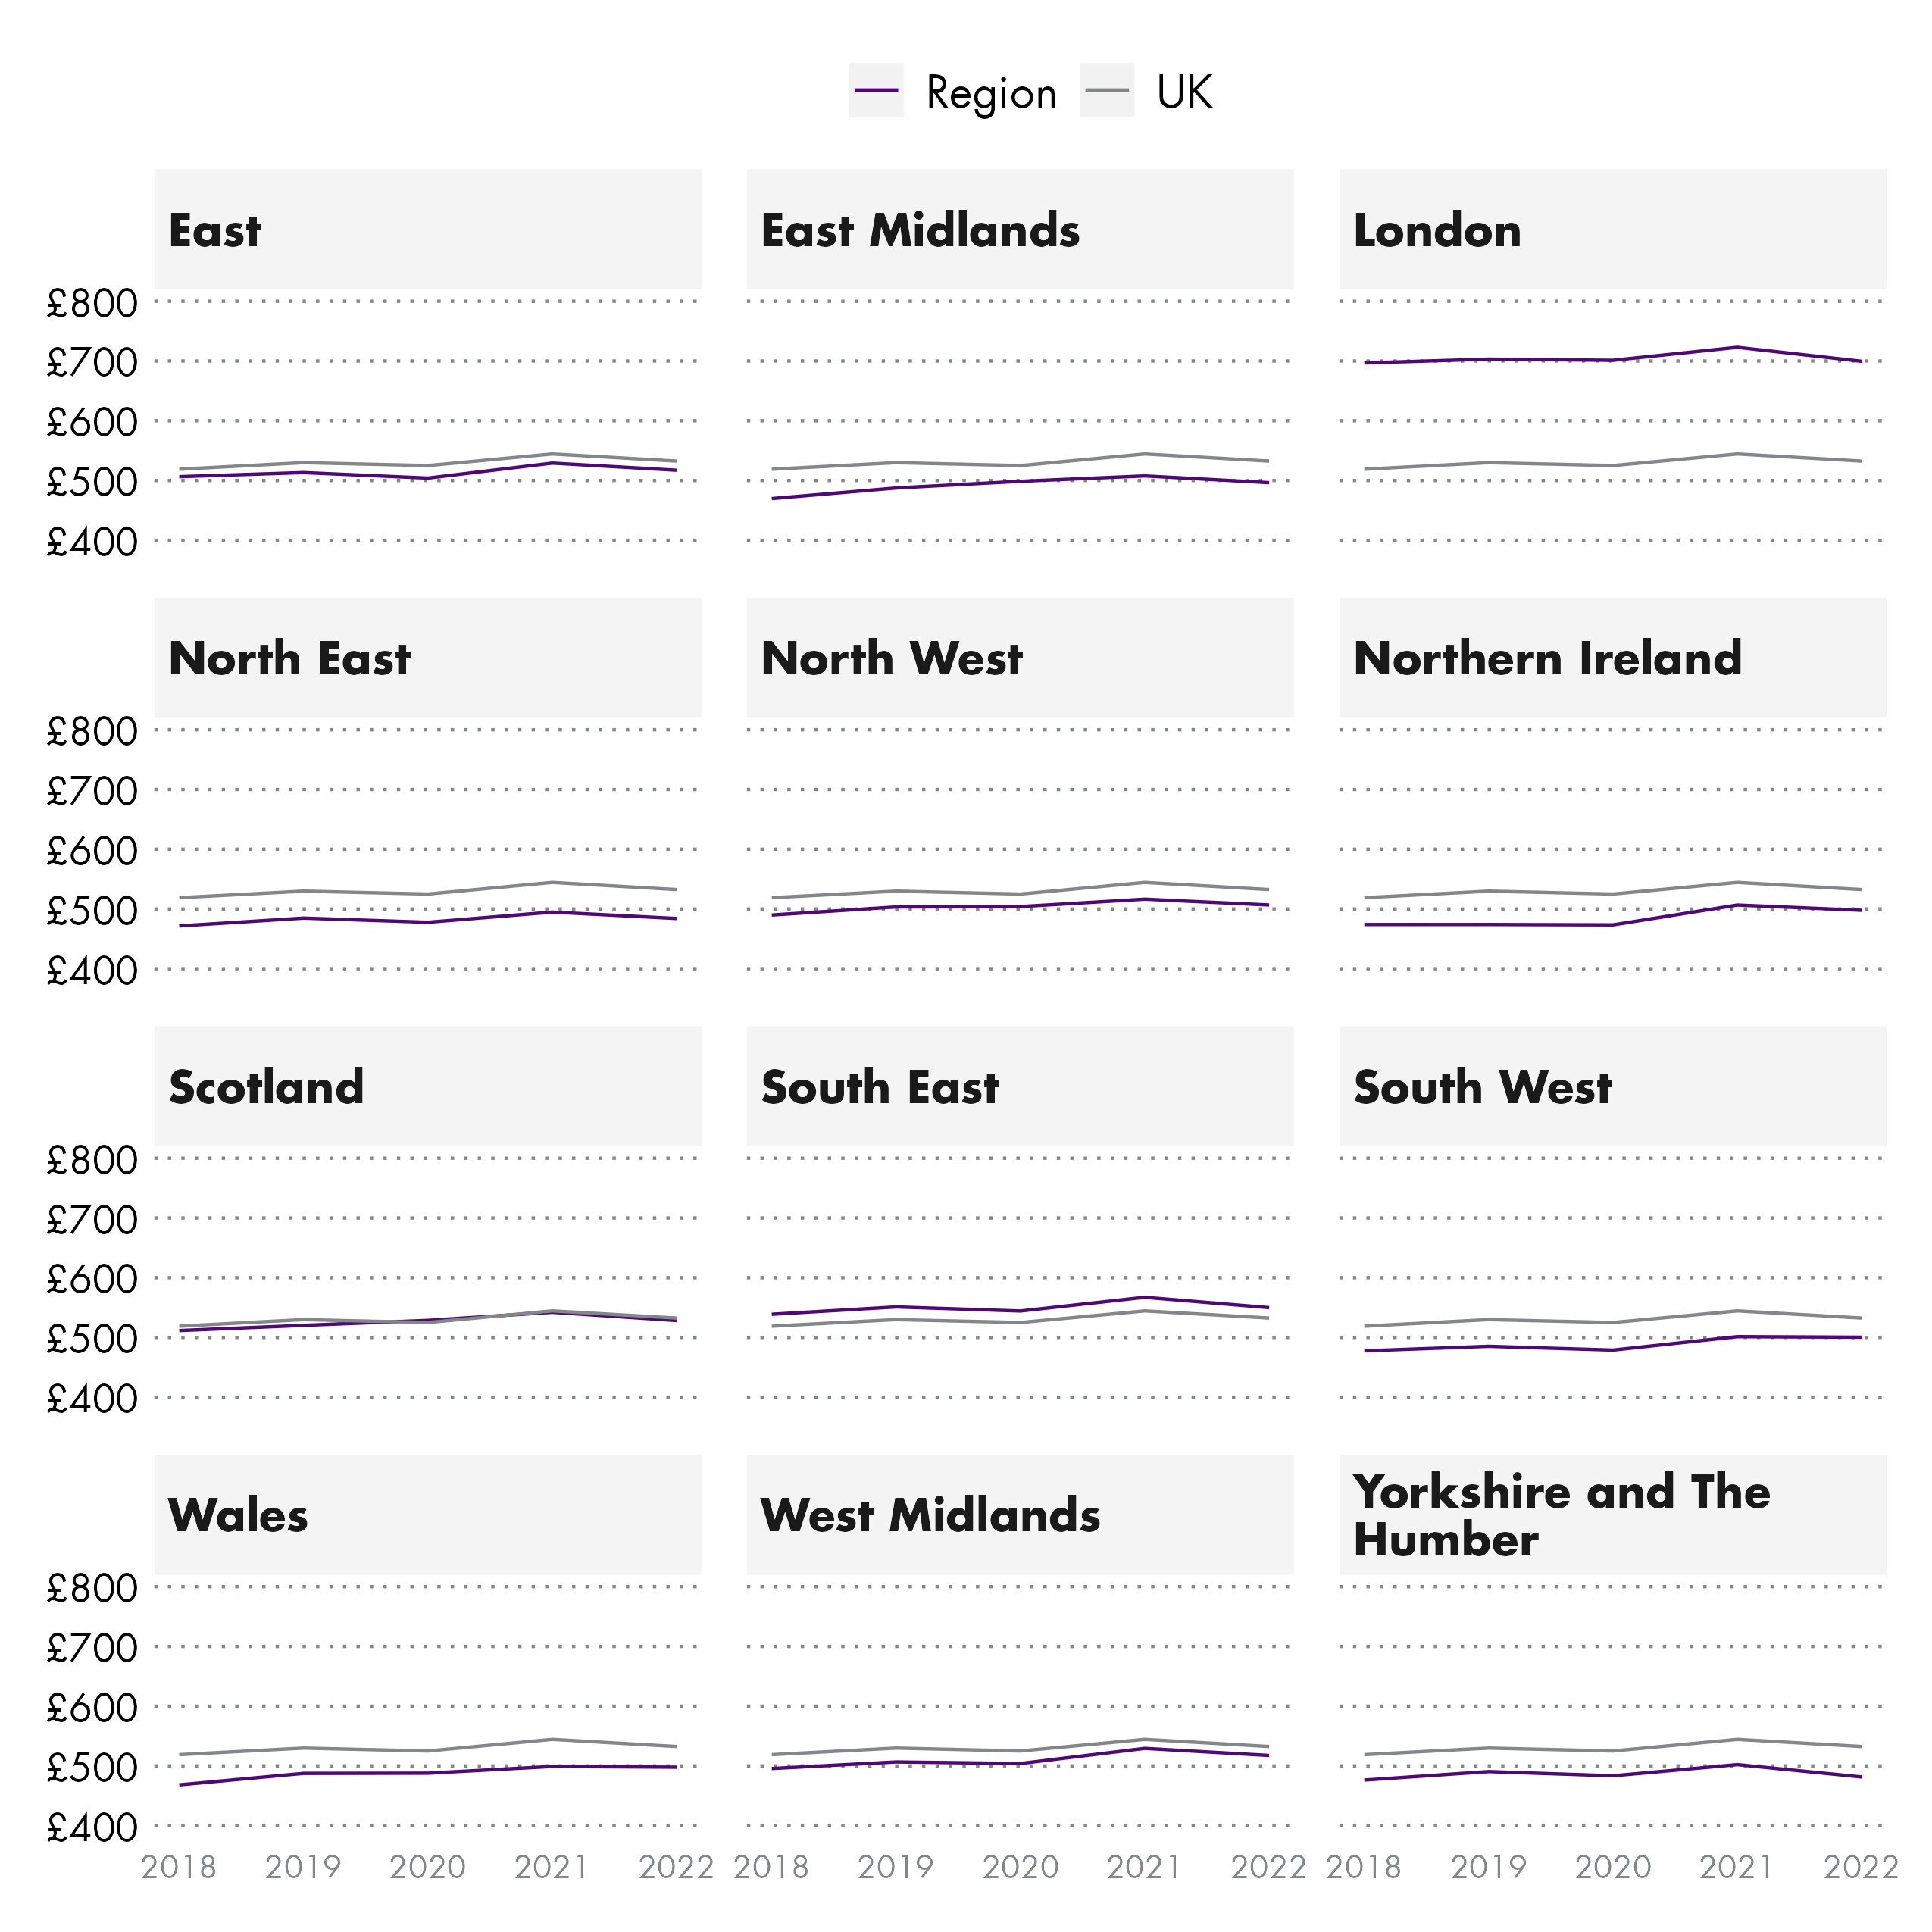
Similar to the typical annual pay for all employees, weekly pay for all employees has remained relativity flat in real terms between 2018 and 2022. Wales has seen the largest growth, at 6.3% between 2018 and 2022 while London saw the lowest at 0.4%. Real terms weekly pay for all employees in Scotland grew by 3.3%.
Weekly pay for all employees since 1997
This section looks at typical weekly pay for all employees in Scotland and across the UK and how it has since 1997.s. ASHE provides data on earnings by deciles. This means that the data provides nine points which split the data into 10 equal numbers of employees.
Figure 15: How deciles and the median work
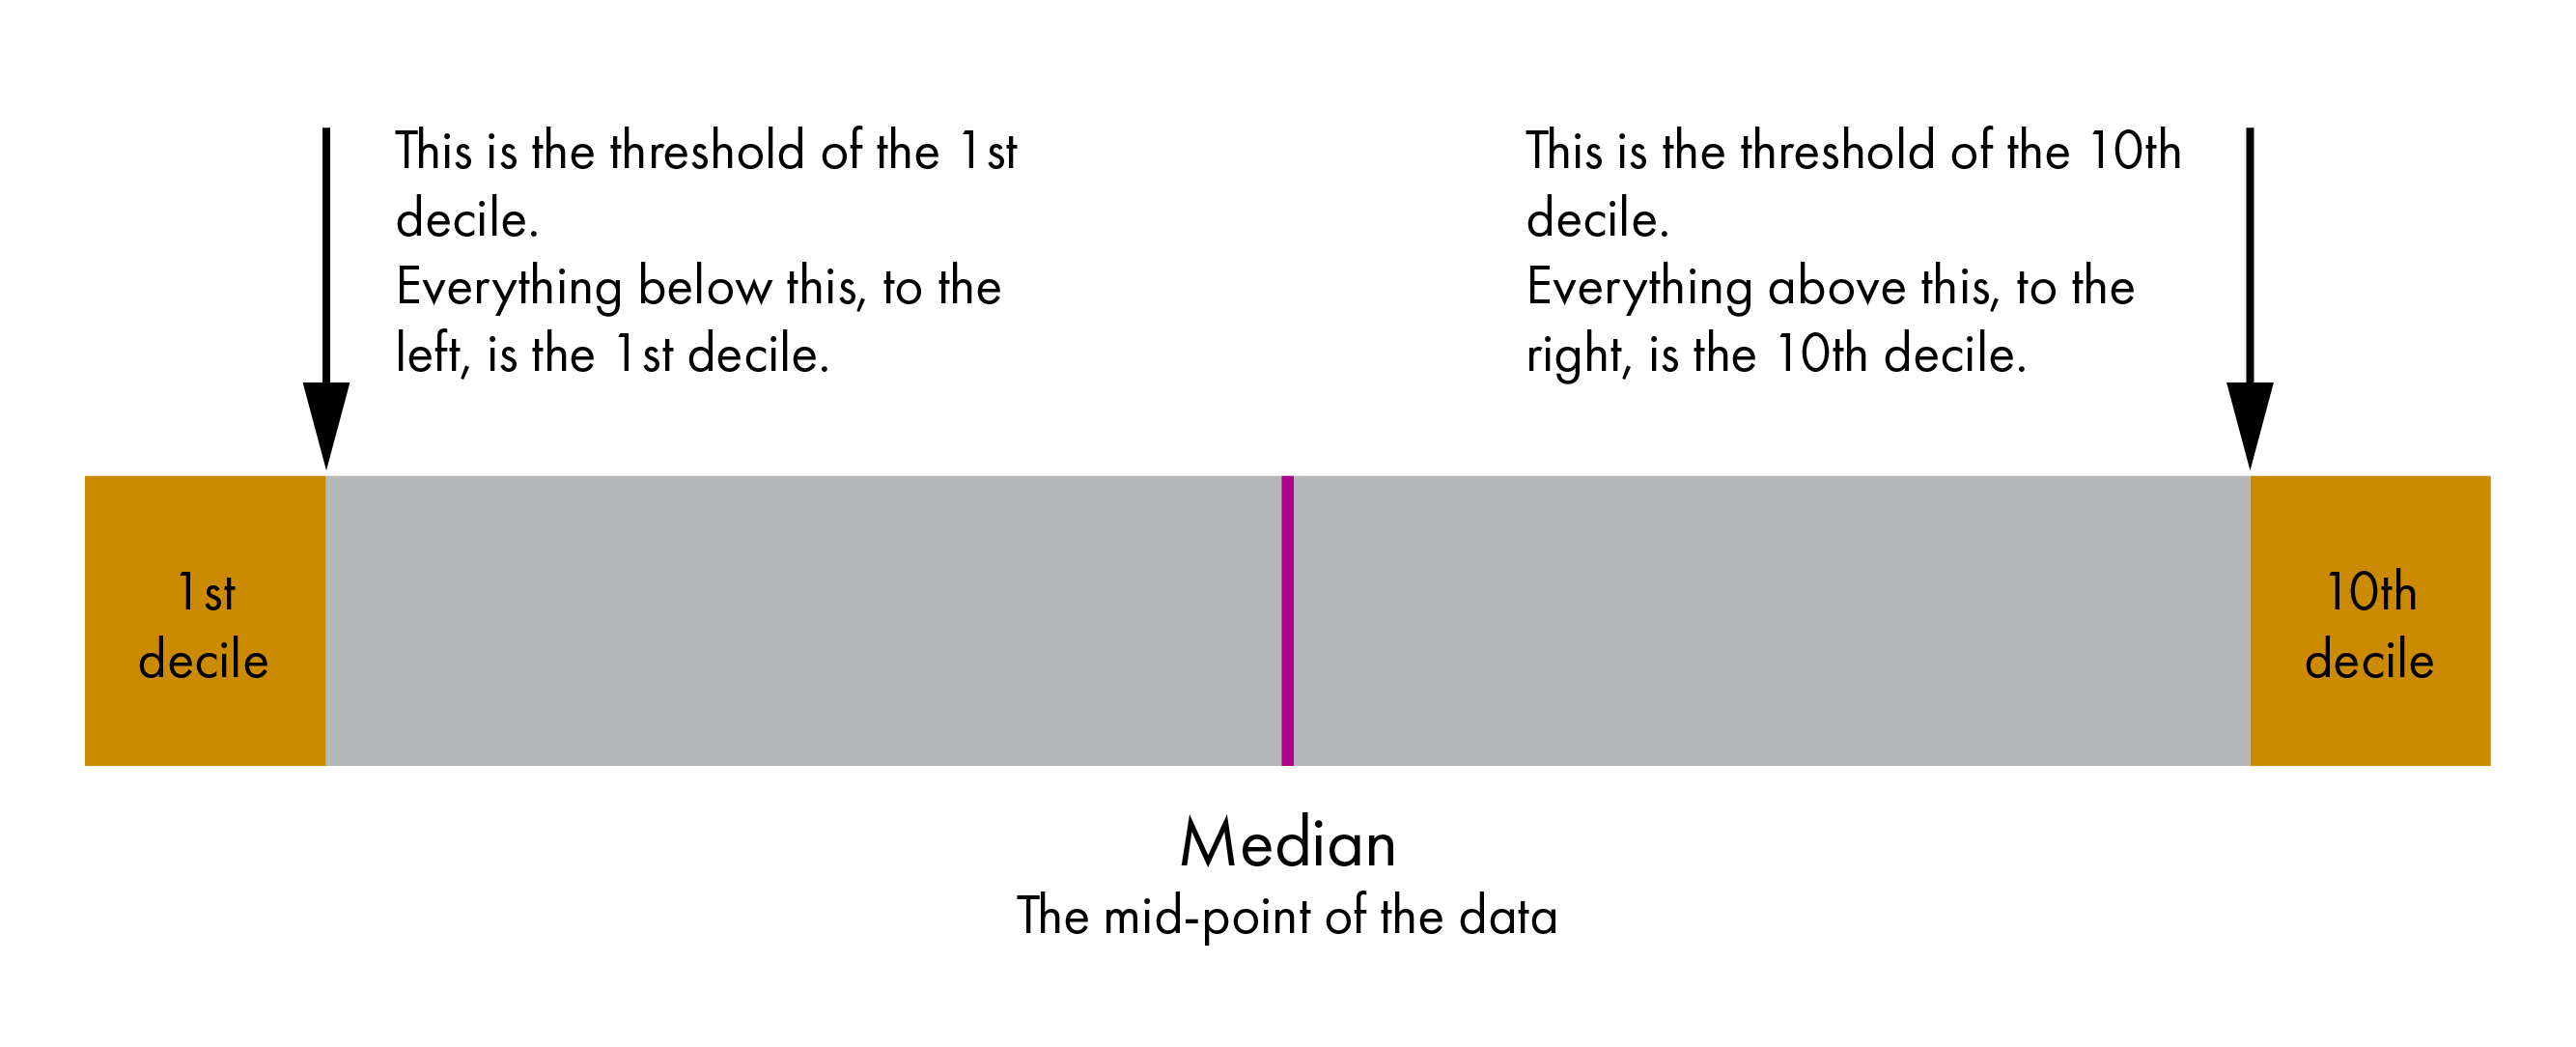
This section looks at growth the data at five different points:
1st decile or bottom 10%: This decile identifies the the bottom 10% of employee earnings. For example if the 1st decile is £174, then 10% of employees earn less than this.
The 25th percentile or bottom 25%: This identifies the amount that 25% of employees earn less than.
5th decile or median: This is the point which splits the number of employees in half.
75th percentile or top 25%: This identifies the amount that 25% of employees earn more than.
9th decile or top 10%: This decile identifies the the top 10% of employee earnings. For example, if the 9th decile is £989 then 10% of employees earn more than this.
Fig 16: Real terms median gross weekly pay for all employees for the UK and Scotland at different levels
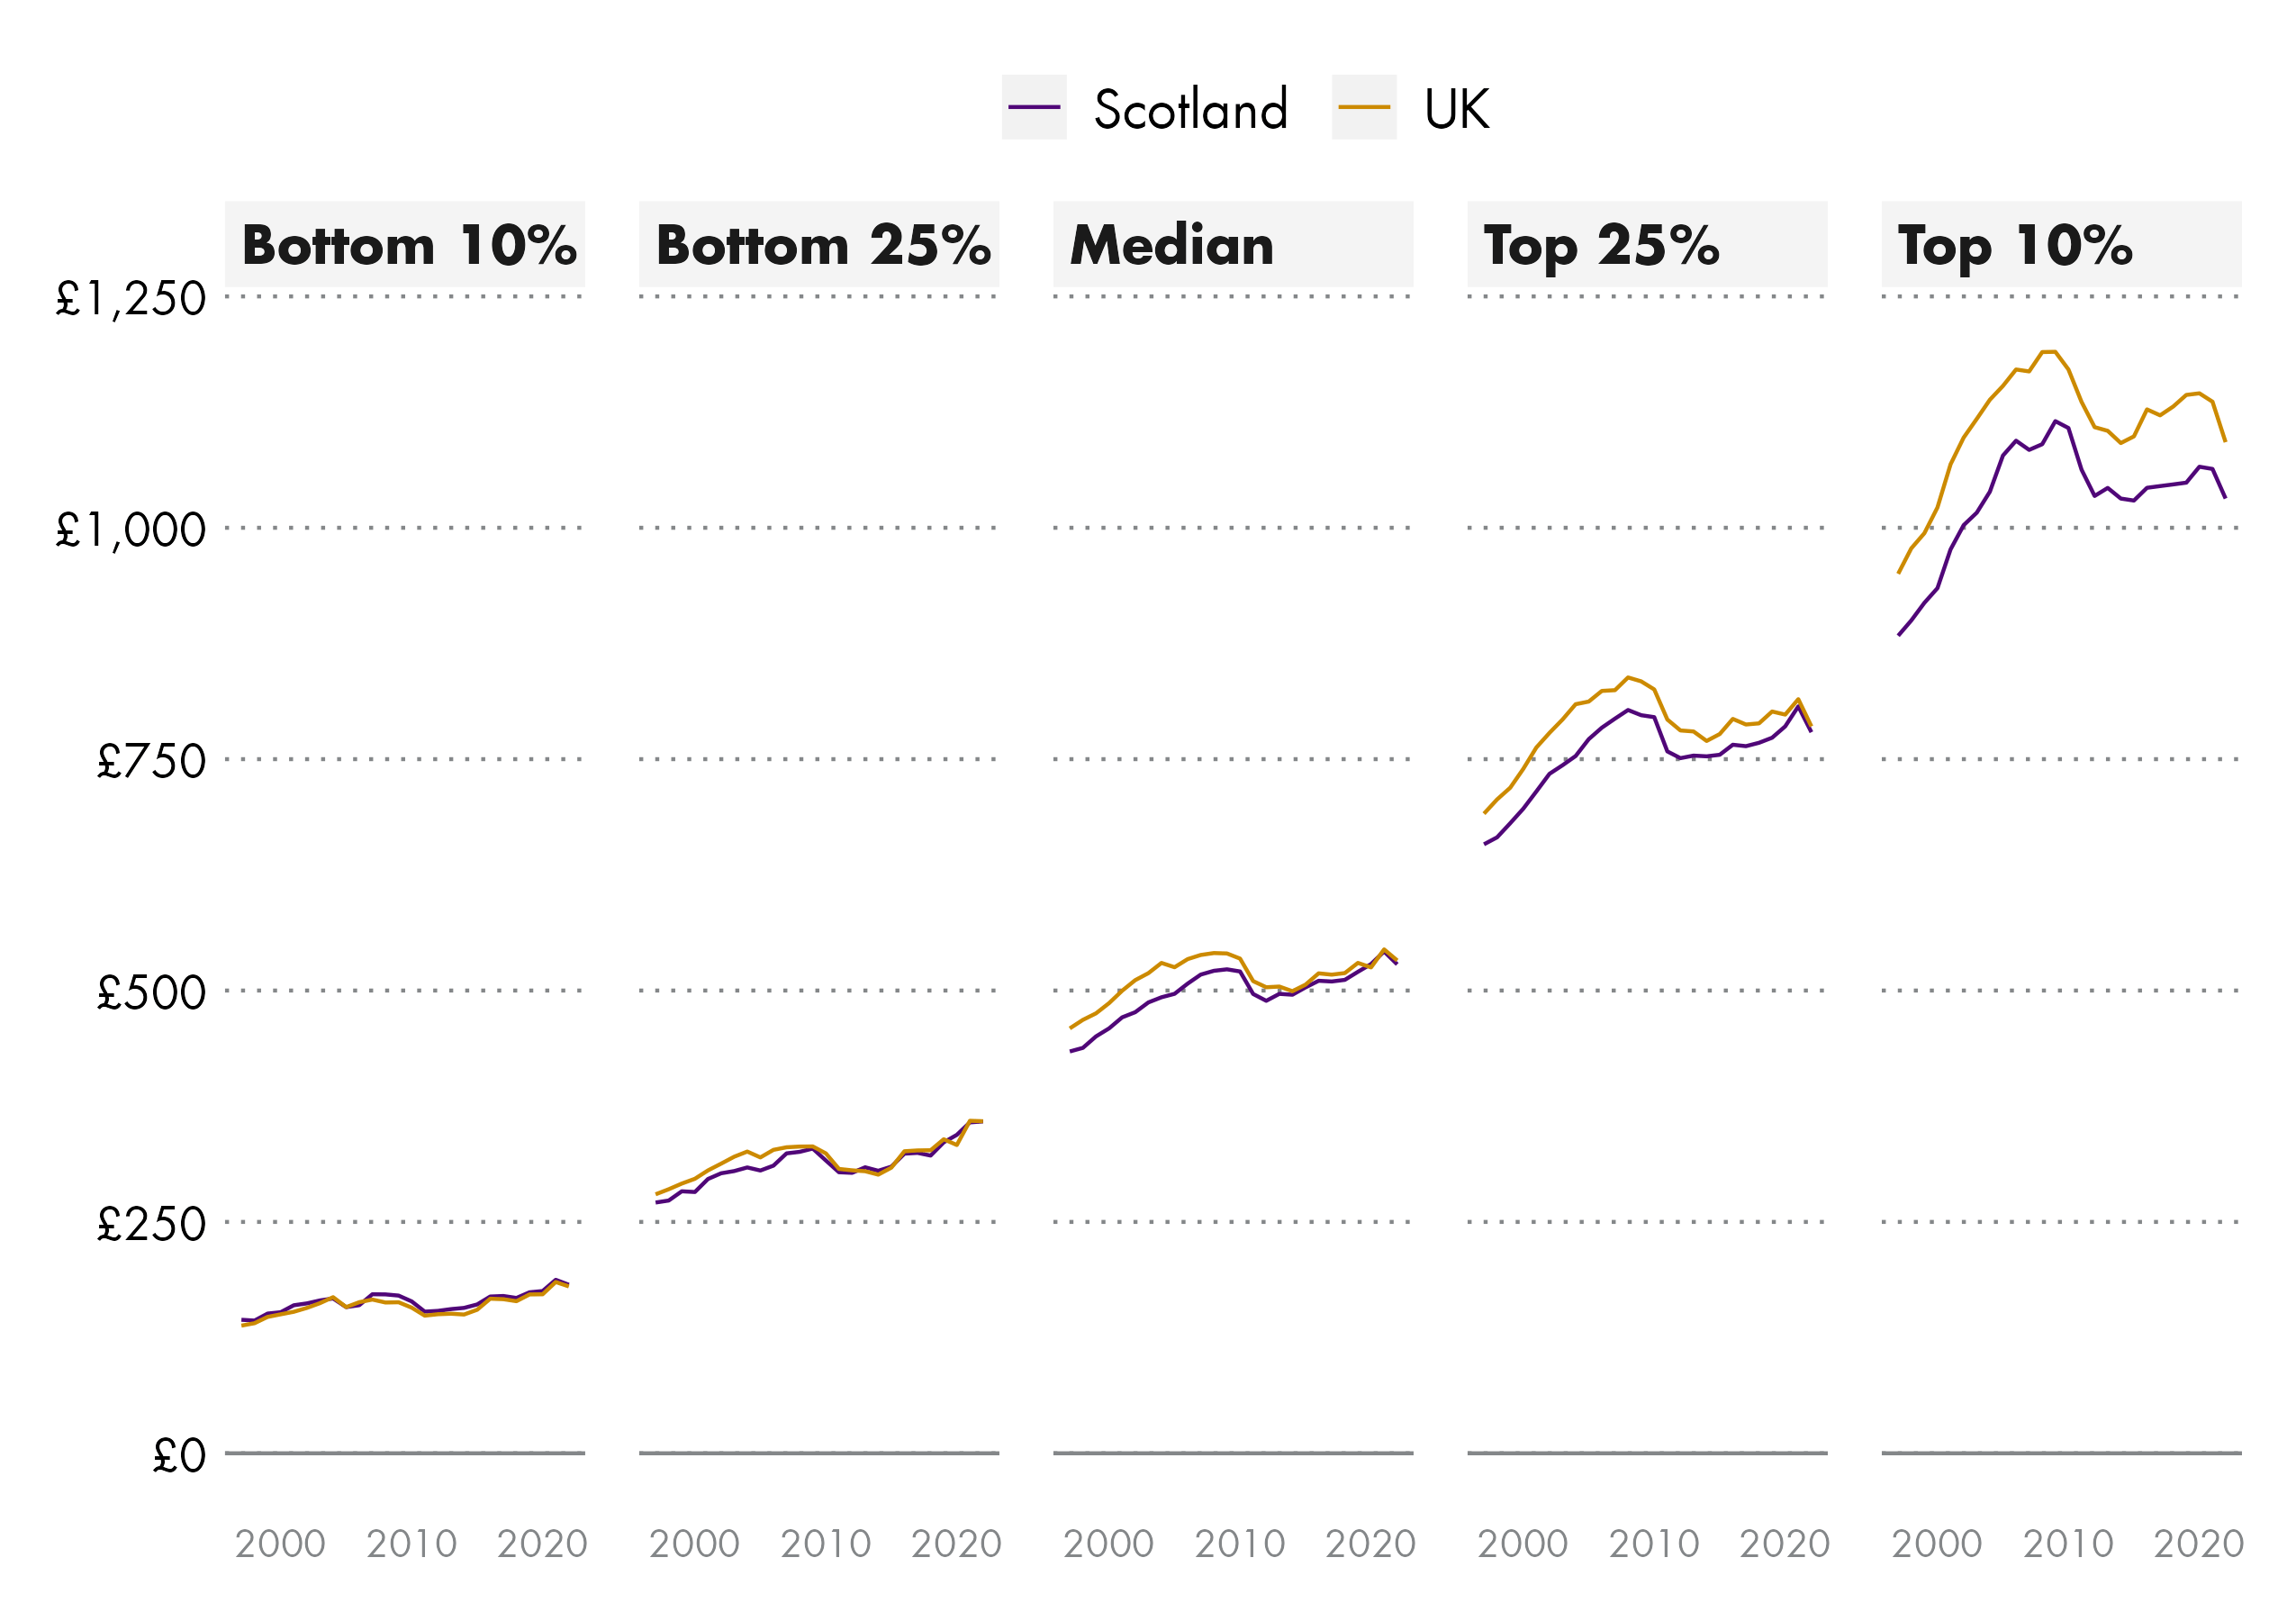
ASHE provides data from 1997 onwards. In Scotland, wages increased from 1997 up to the recession in 2008 to 2009 by around 20% for all off the highlighted pay points, except the top 10% which grew by 25%.
Since the financial crisis in Scotland:
Pay for the bottom 10% peaked in 2007 then fell by 11% from 2007 to 2011, with wages not returning to 2007 levels in real terms by 2019.
Pay for the bottom 25% peaked in 2009 then fell by 8% between 2009 and 2012, with real terms wages not returning to 2009 levels until 2019.
Median pay peaked in 2009 then fell by 7% between 2009 and 2012, with real terms wages not returning to 2009 levels until 2019.
Pay for the top 25% peaked in 2008 then fell by 6% between 2008 and 2014, with real terms wages not returning to 2009 levels until 2021, then falling below this again between 2021 and 2022.
Pay for the top 10% peaked in 2009 then fell by 8% between 2009 and 2014, and has yet recovered to 2009 real terms levels
When comparing Scotland to the UK, pay has generally caught up with the UK except for the top 10% of earners. This gap for top earners has narrowed between Scotland and the UK. Pay for top earners in the UK it was 10% higher than Scotland in 2003 and is now6% higher in 2022.
Care should be taken when interpreting these figures due to issues with this year's data. You can find out more in this in the "about the data" section of the briefing.
What is typical weekly pay for full-time employees in Scotland?
This section looks at typical weekly pay for full-time employees in Scotland and across the UK.
Fig 17: Median gross weekly pay for all full-time employees by nations and regions of the UK - 2022
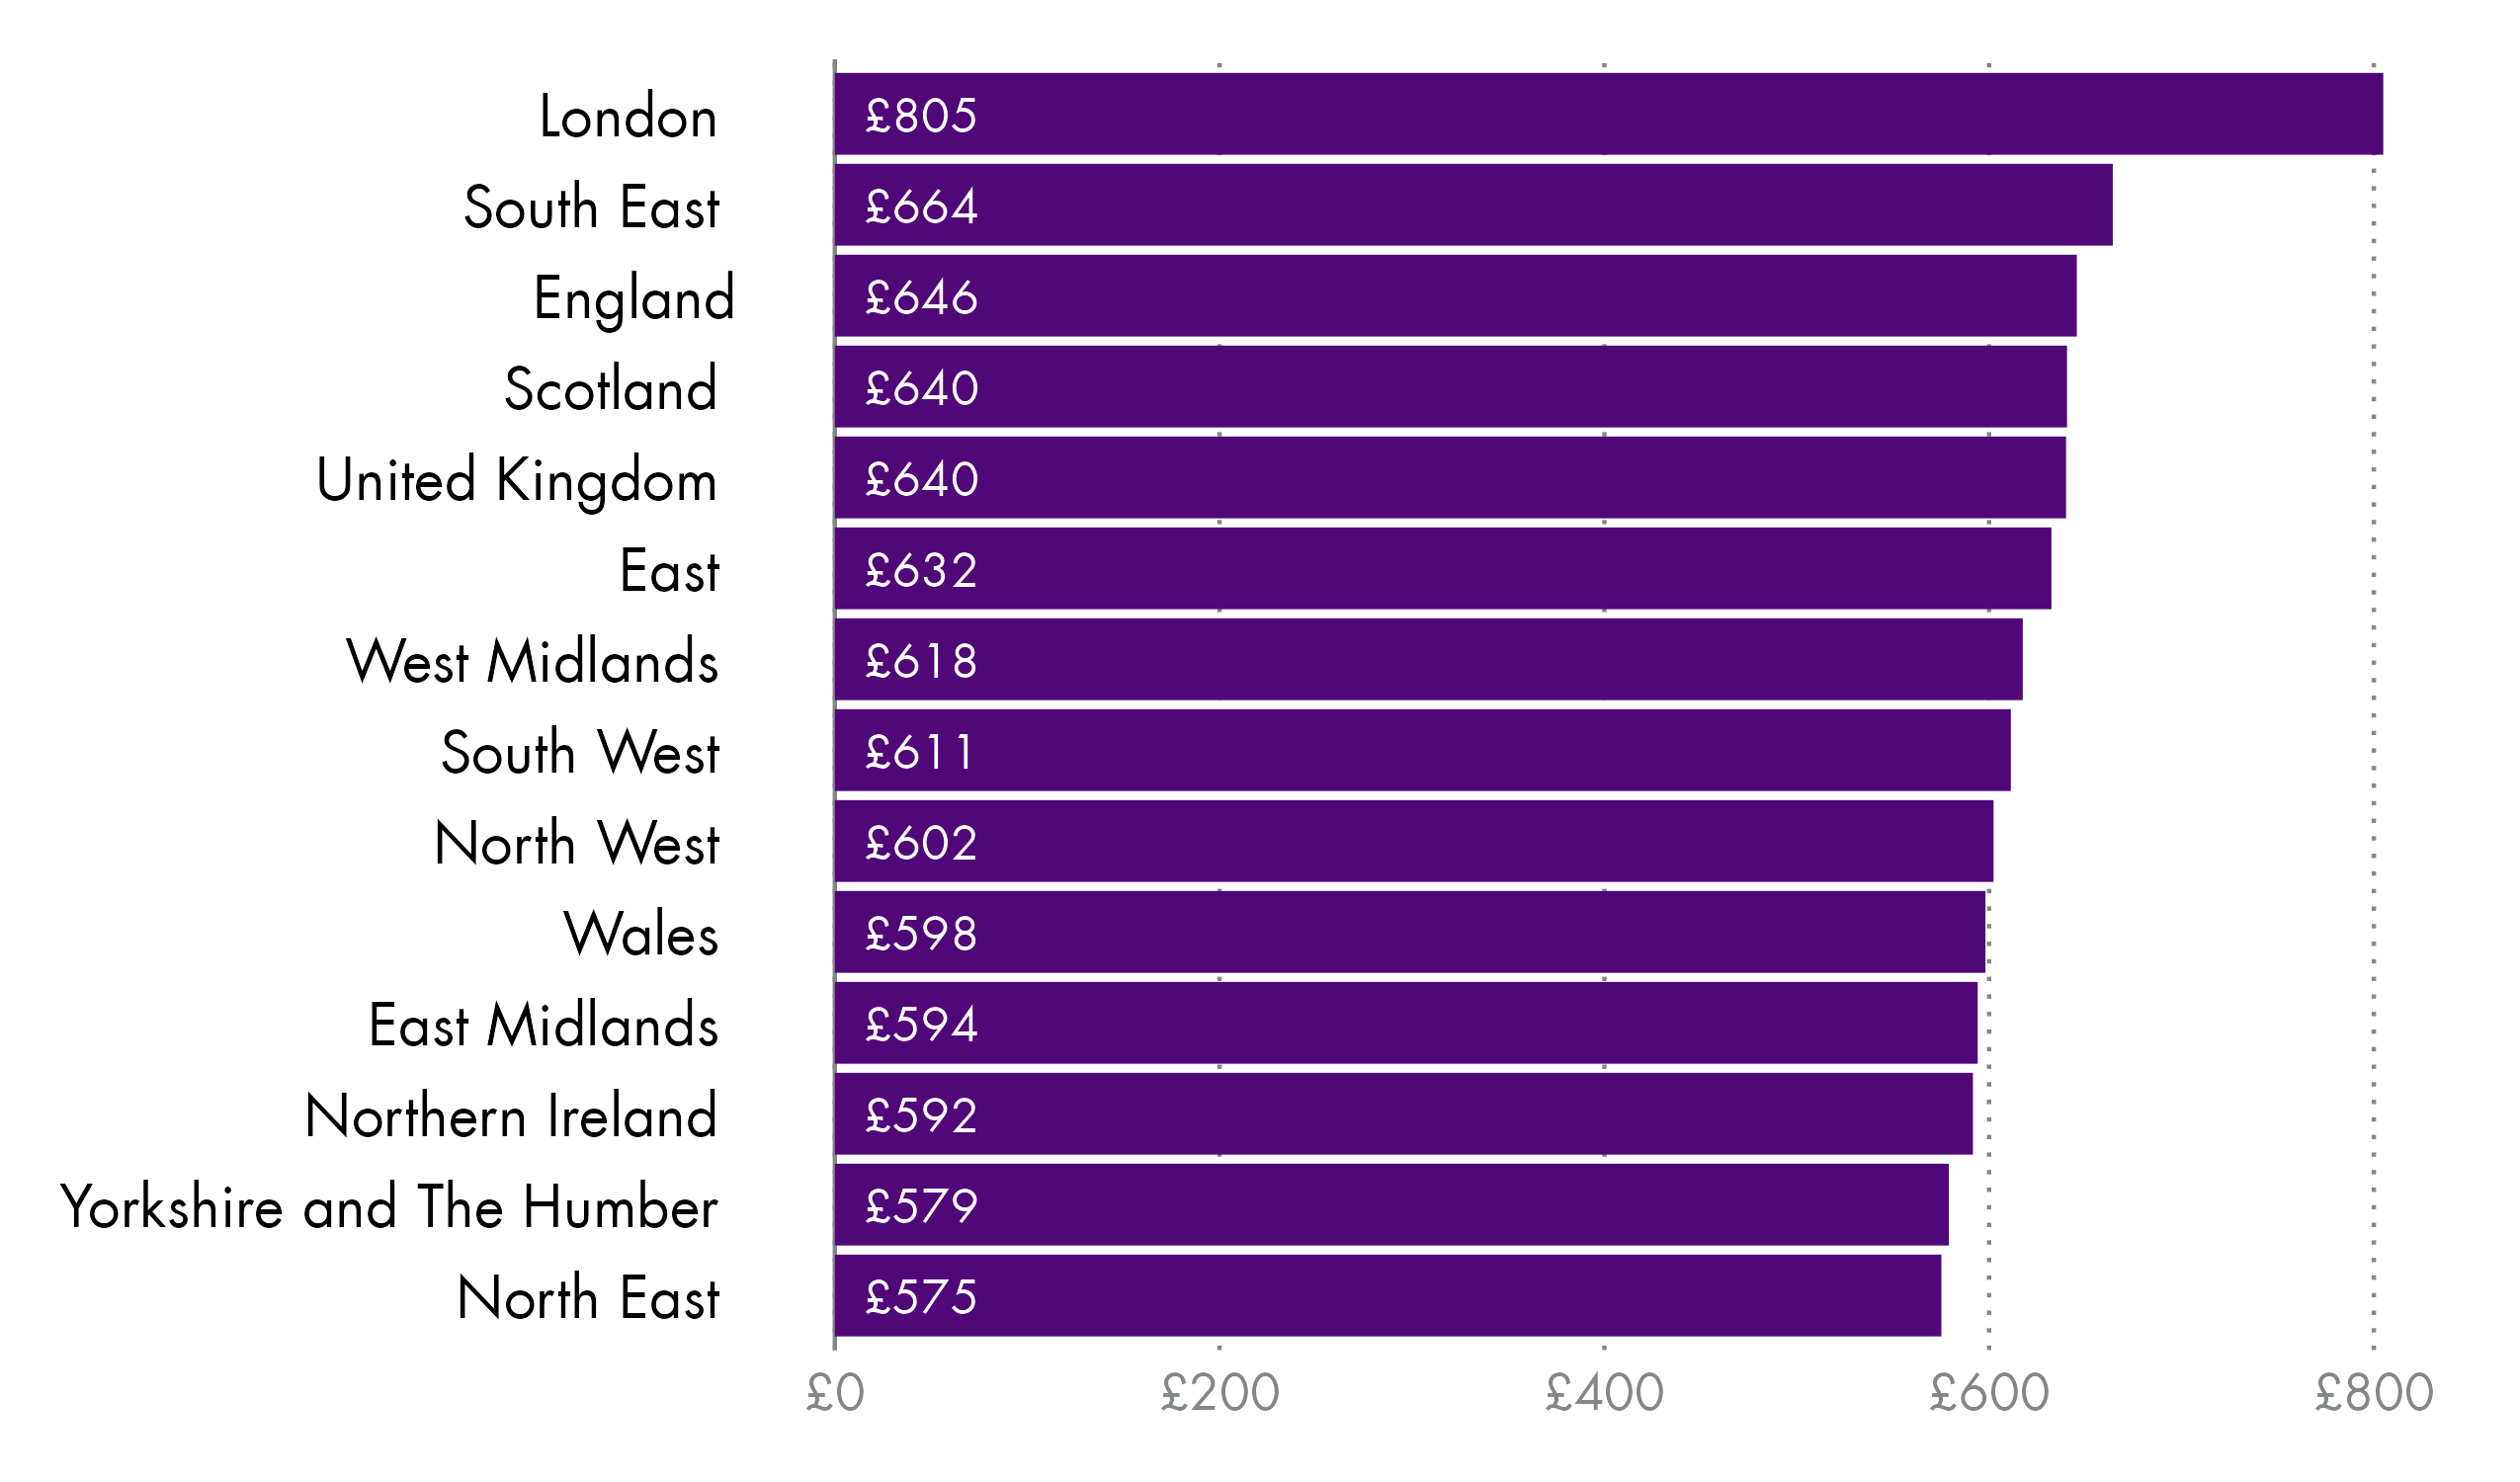
Weekly pay for full-time employees in Scotland was fourth highest across the nations and regions of the UK, at £640. London has the highest weekly pay at £805, while the North East of England has the lowest at £575.
Fig 18: Real terms median gross weekly pay for all full-time employees by nations and regions of the UK - 2018 to 2022
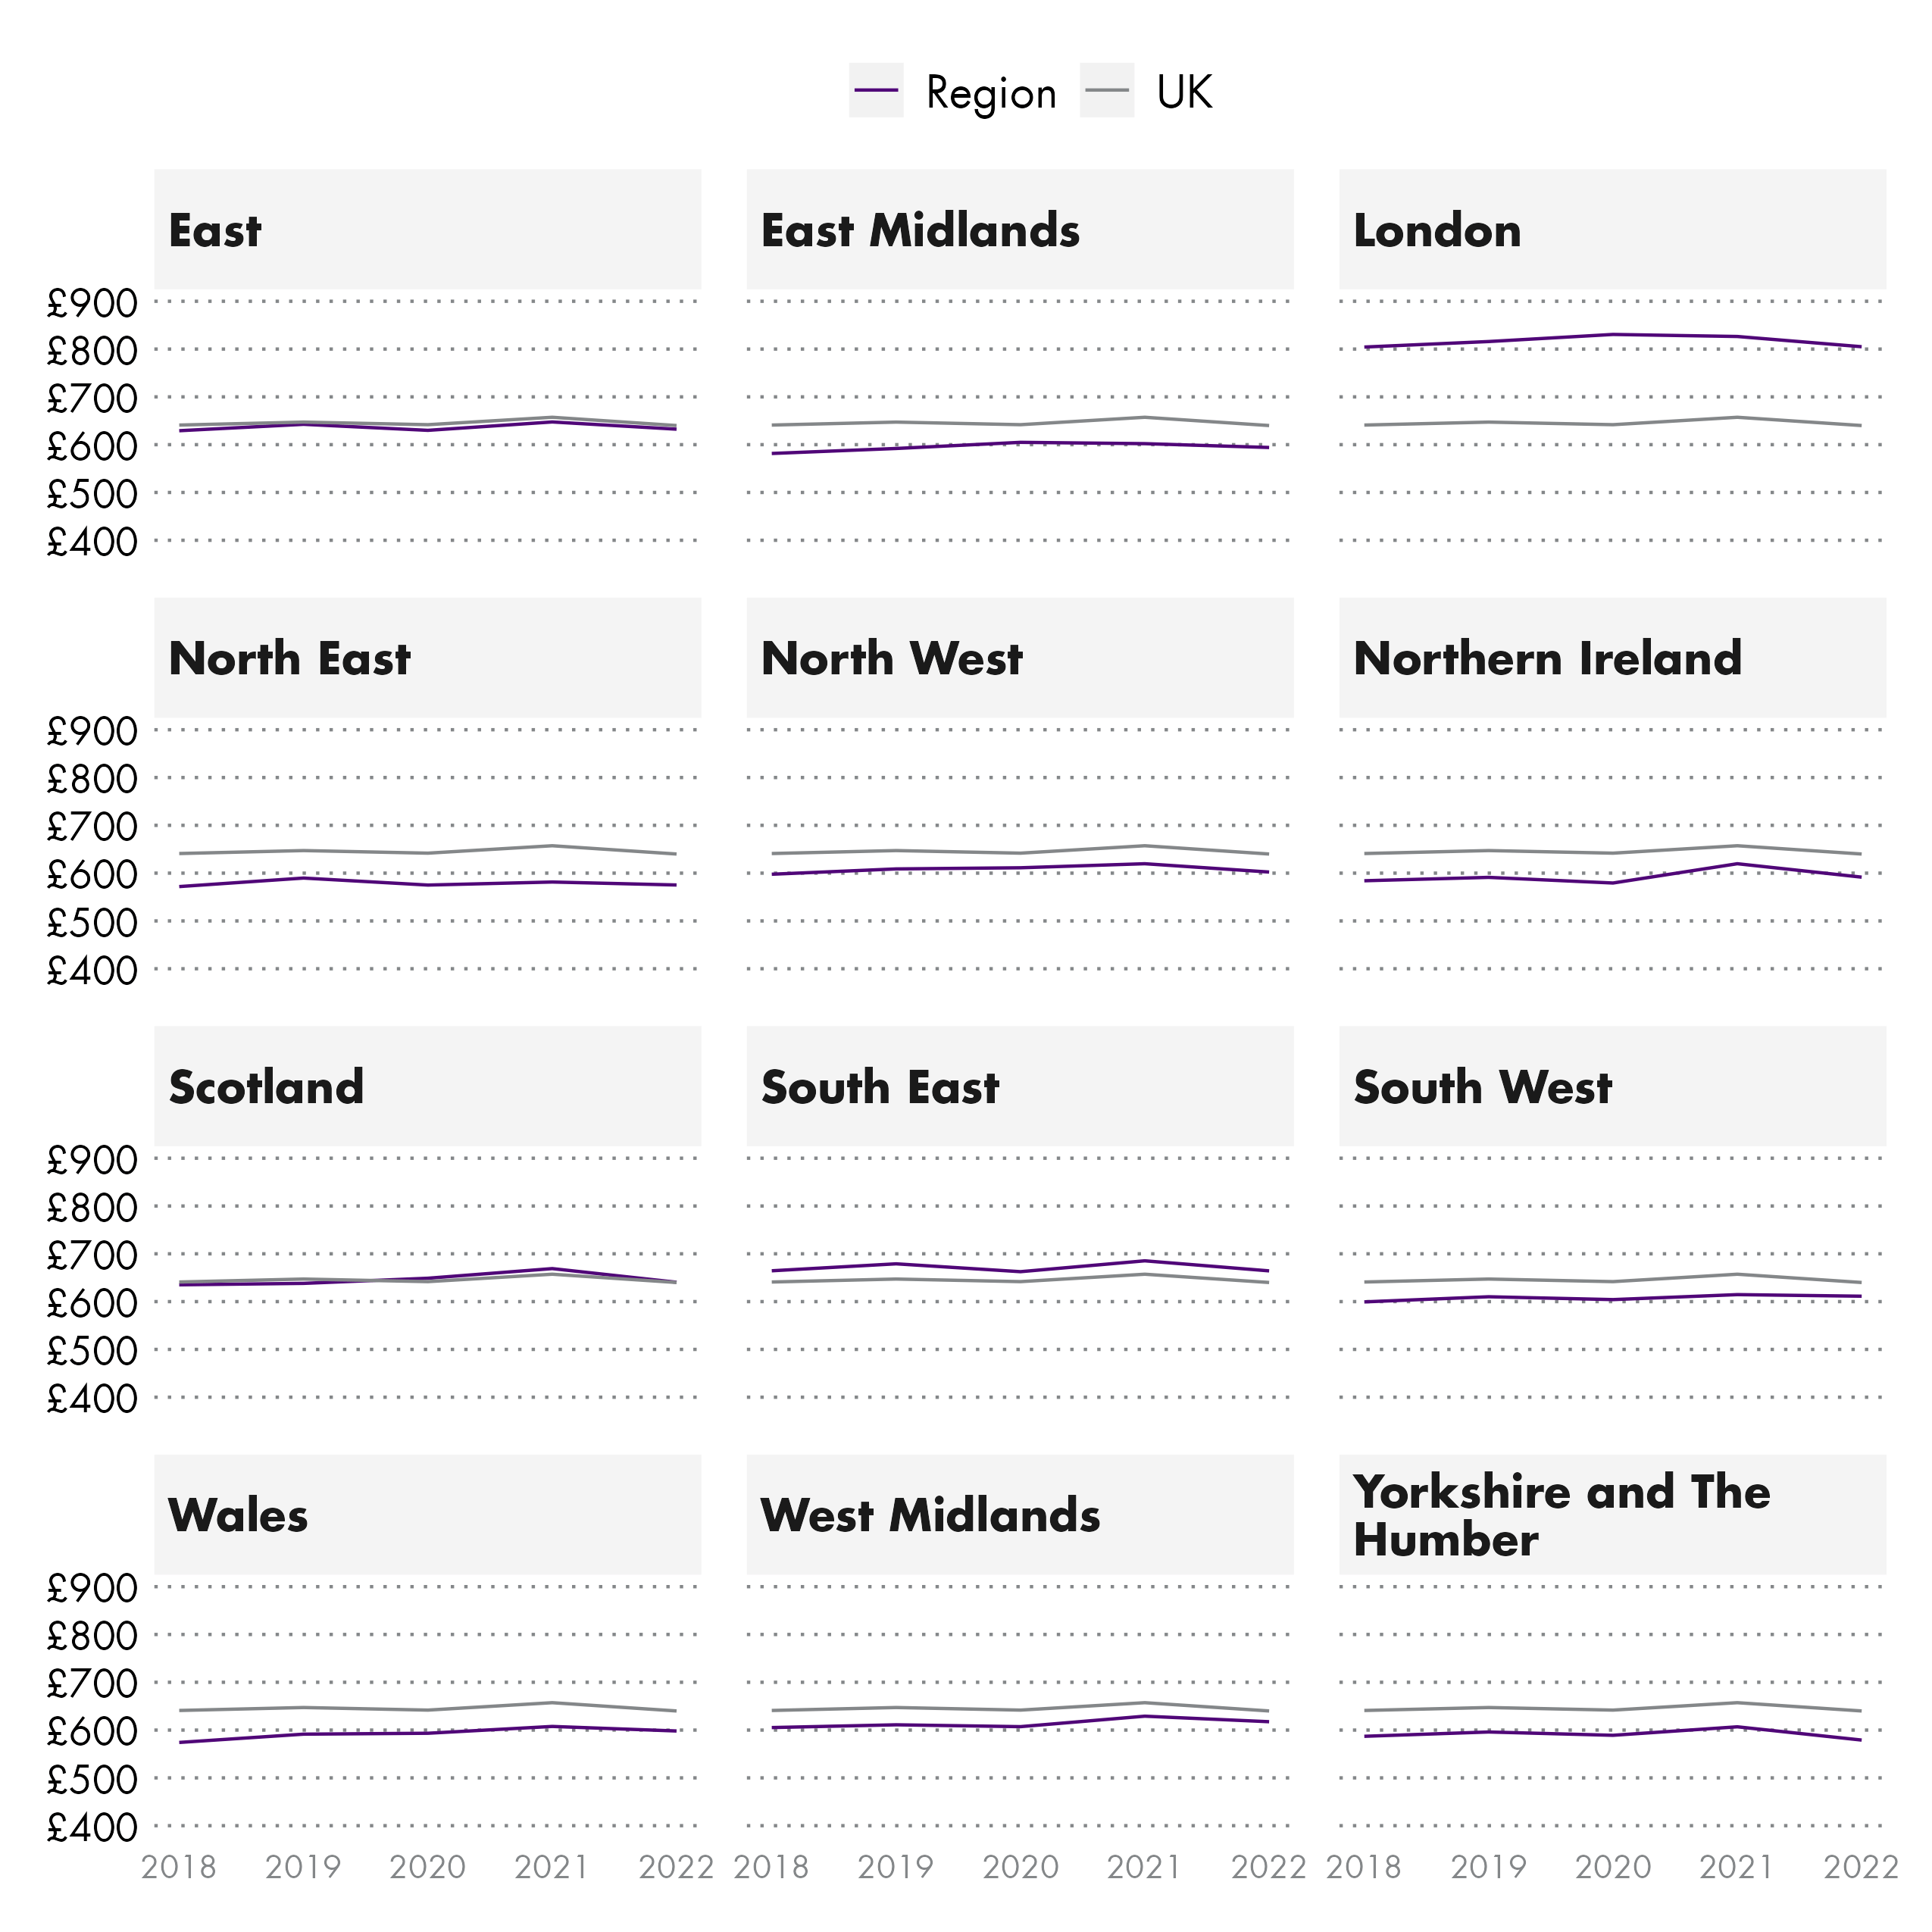
Wales saw the highest growth in real terms full-time gross weekly pay between 2018 and 2022, at 4.2%. Scotland saw 0.8% growth over the same period. Yorkshire and the Humber was the only area to see a fall, decreasing by 1.3%
Care should be taken when interpreting these figures due to issues with this year's data. You can find out more in this in the "about the data" section of the briefing.
What is typical weekly pay for part-time employees in Scotland?
This section looks at typical weekly pay for part-time employees in Scotland and across the UK.
When looking at part-time pay it is important to consider:
Part-time jobs tend to be more impacted by increases in National Minimum Wage rates, due to a typical lower hourly rate.
Flexible working patterns can change employee job profiles from full-time to part-time, whilst retaining higher hourly pay rates.
Fig 19: Median gross weekly pay for all part-time employees by nations and regions of the UK - 2022
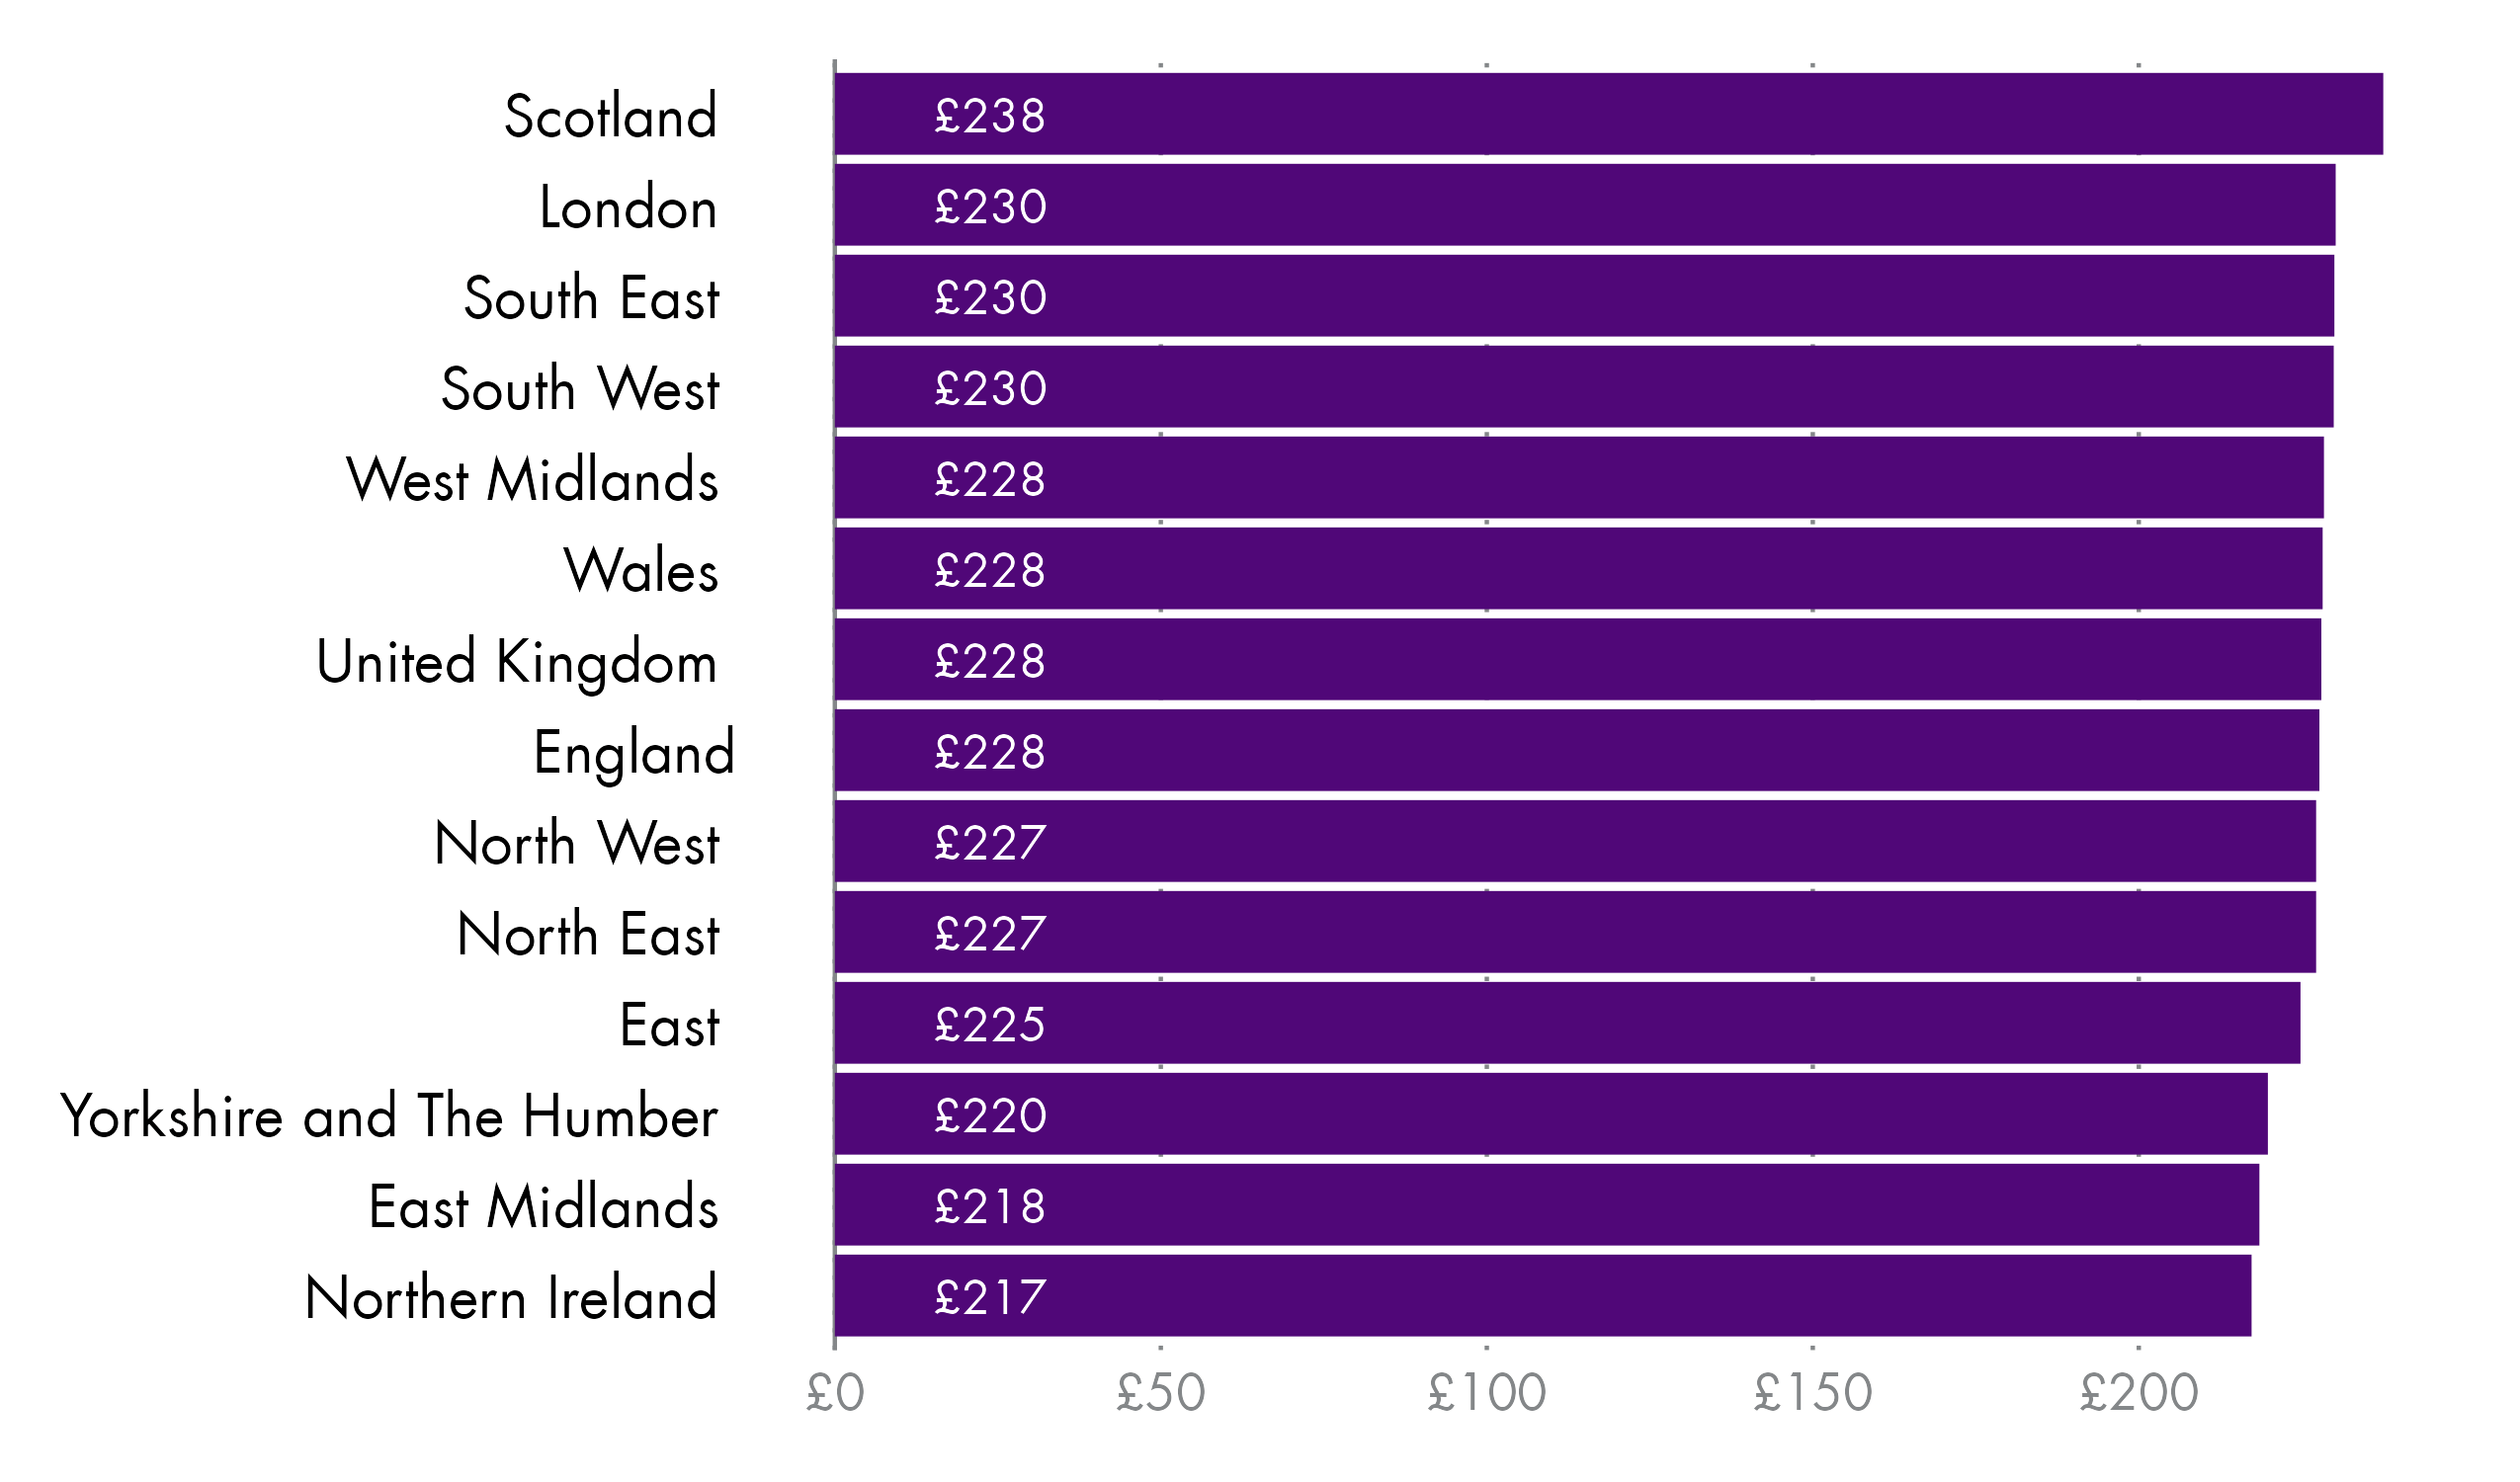
Scotland has the highest typical part-time weekly pay across the UK, at £238. Northern Ireland and have the lowest at £217.
Fig 20: Median gross weekly pay for all part-time employees by nations and regions of the UK - 2018 to 2022
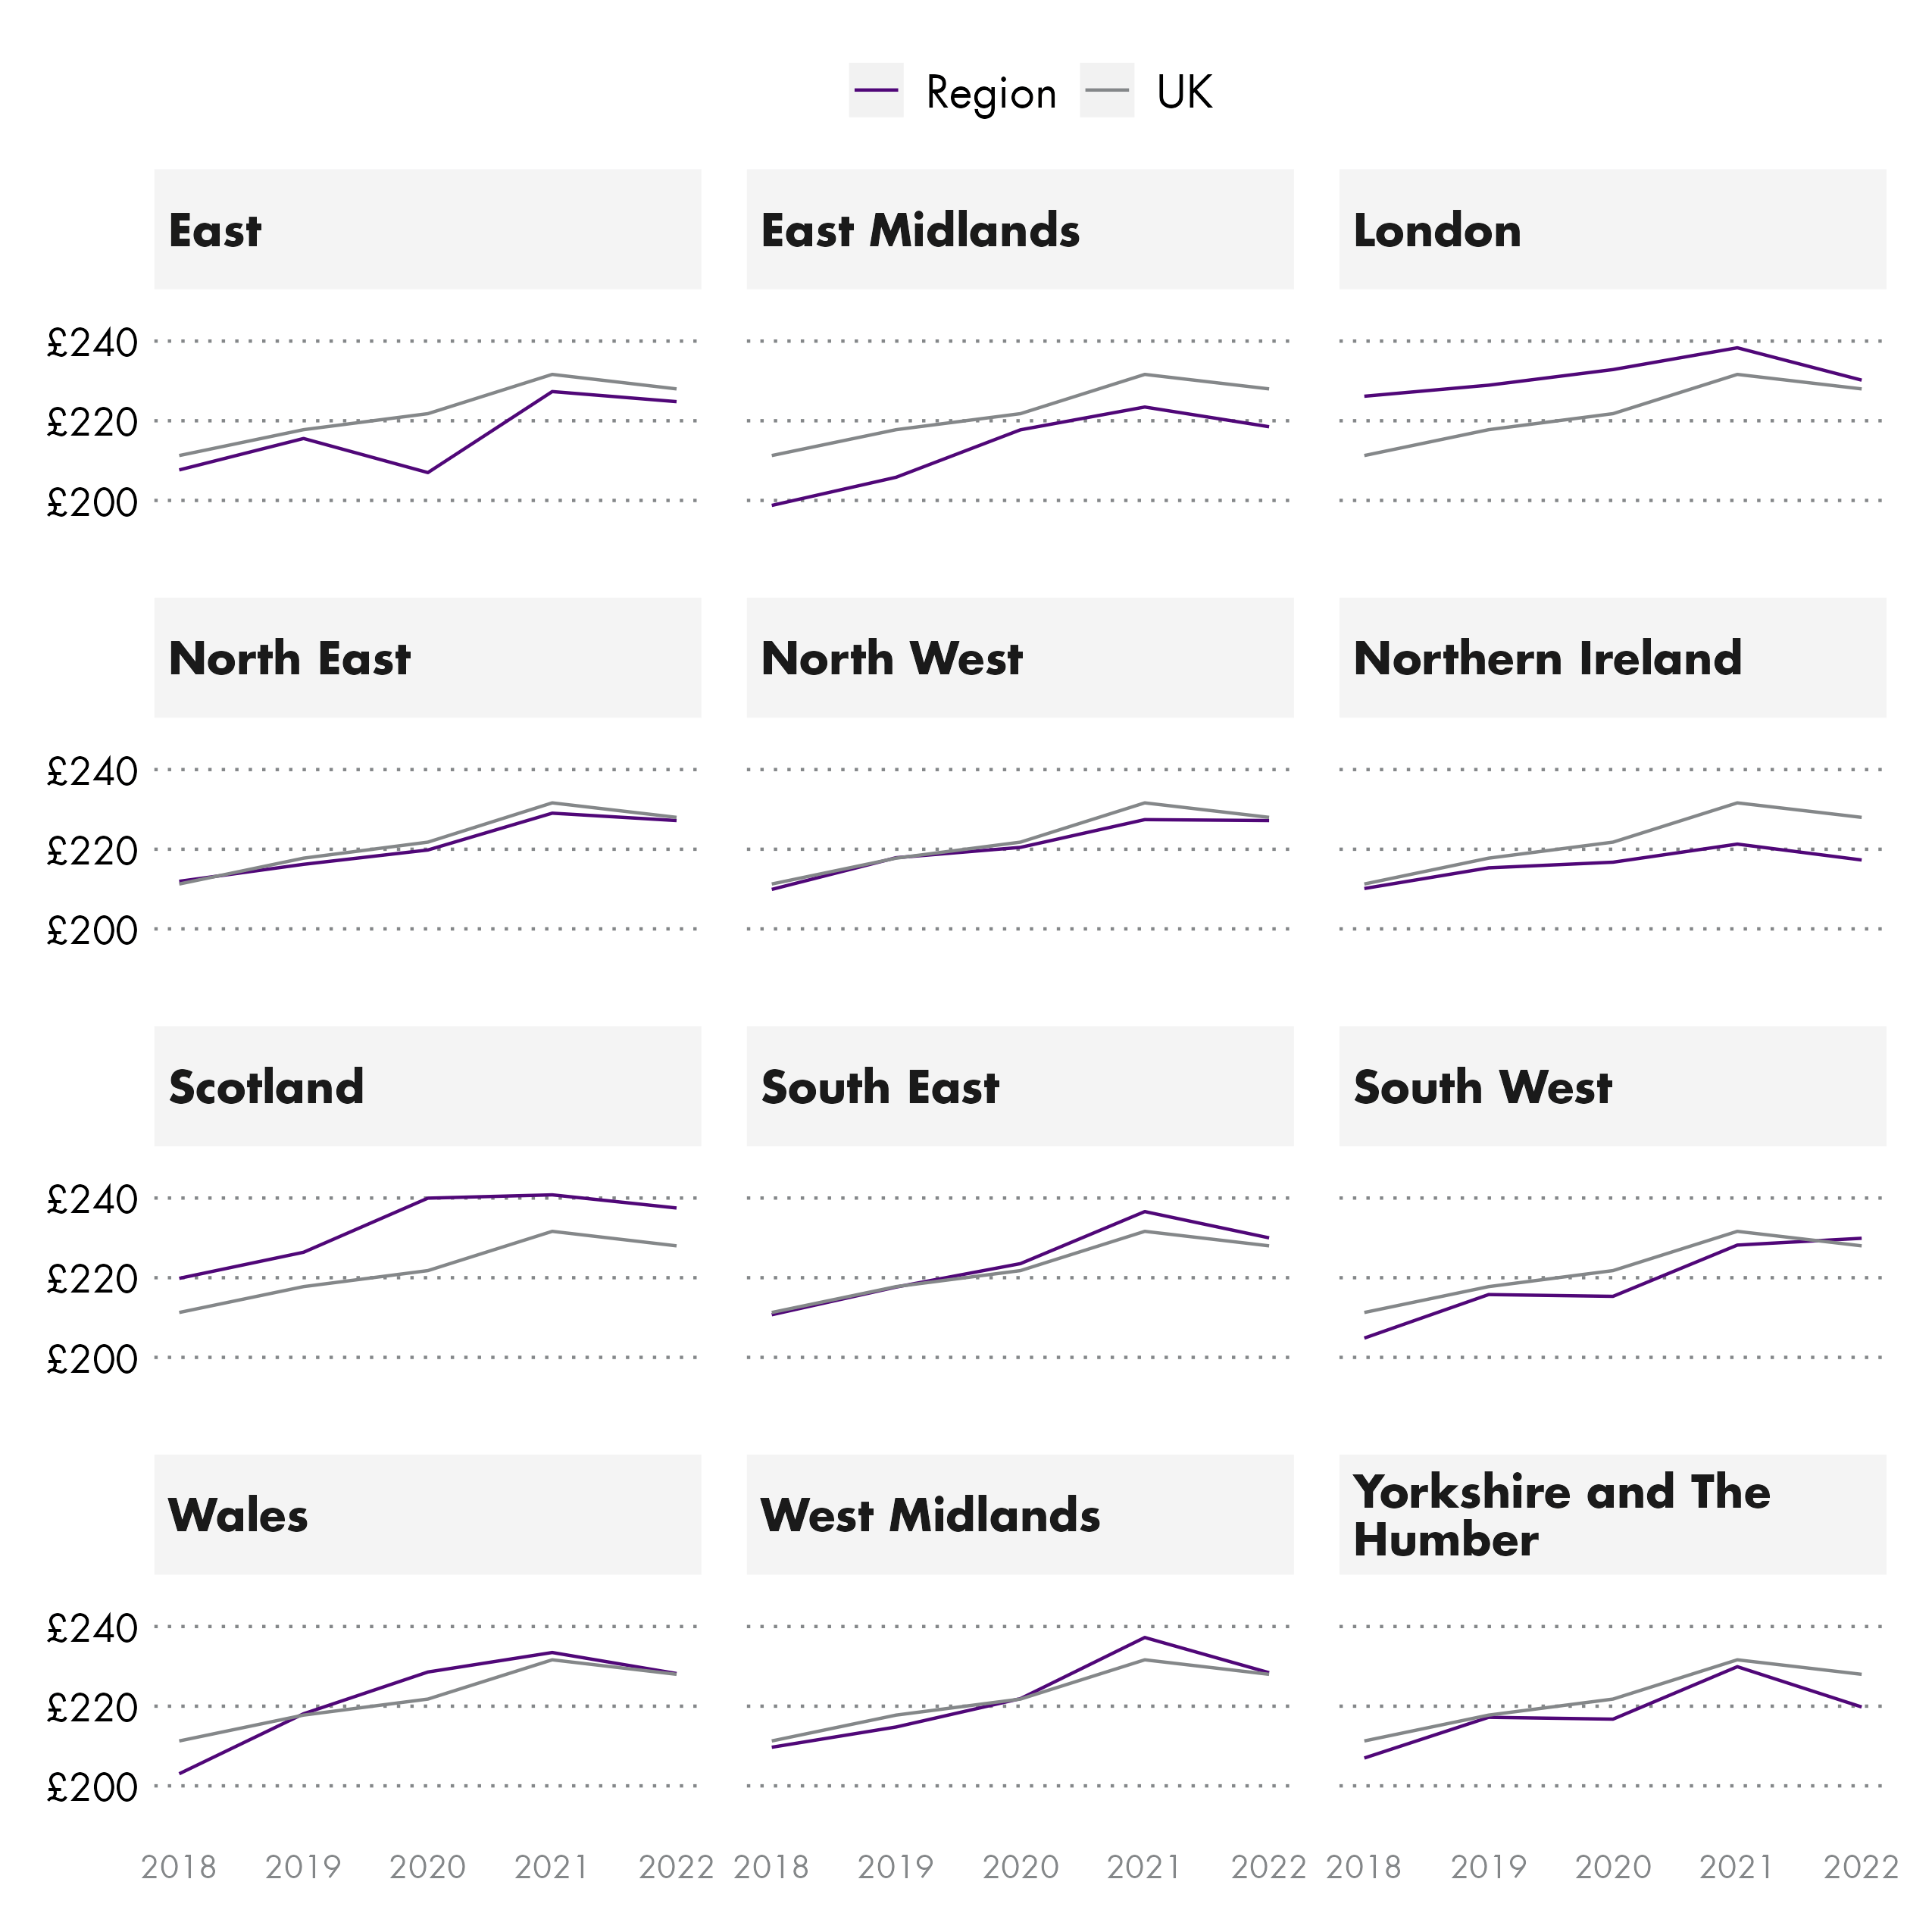
Wales saw the highest increase in part-time gross weekly pay at 12.4%, while London saw the lowest at 1.8% in real terms between 2018 and 2022. Scotland saw an increase of 8% over the same period.
Care should be taken when interpreting these figures due to issues with this year's data. You can find out more in this in the "about the data" section of the briefing.
Typical hourly pay in Scotland
This section looks at hourly pay, excluding overtime, for all employees in Scotland, broken down by those in full-time and part-time employment,and how these numbers compare to the other regions and nations of the UK.
ASHE analyses for hourly earnings related to employees whose earnings for the survey pay period were not affected by absence. It does not include the earnings of those who did not work a full week, and whose earnings were reduced because of, for example, sickness.
What is typical hourly pay for all employees in Scotland?
This section looks at typical hourly pay for all employees in Scotland and across the UK.
Fig 21: Median hourly pay excluding overtime for all employees - 2022
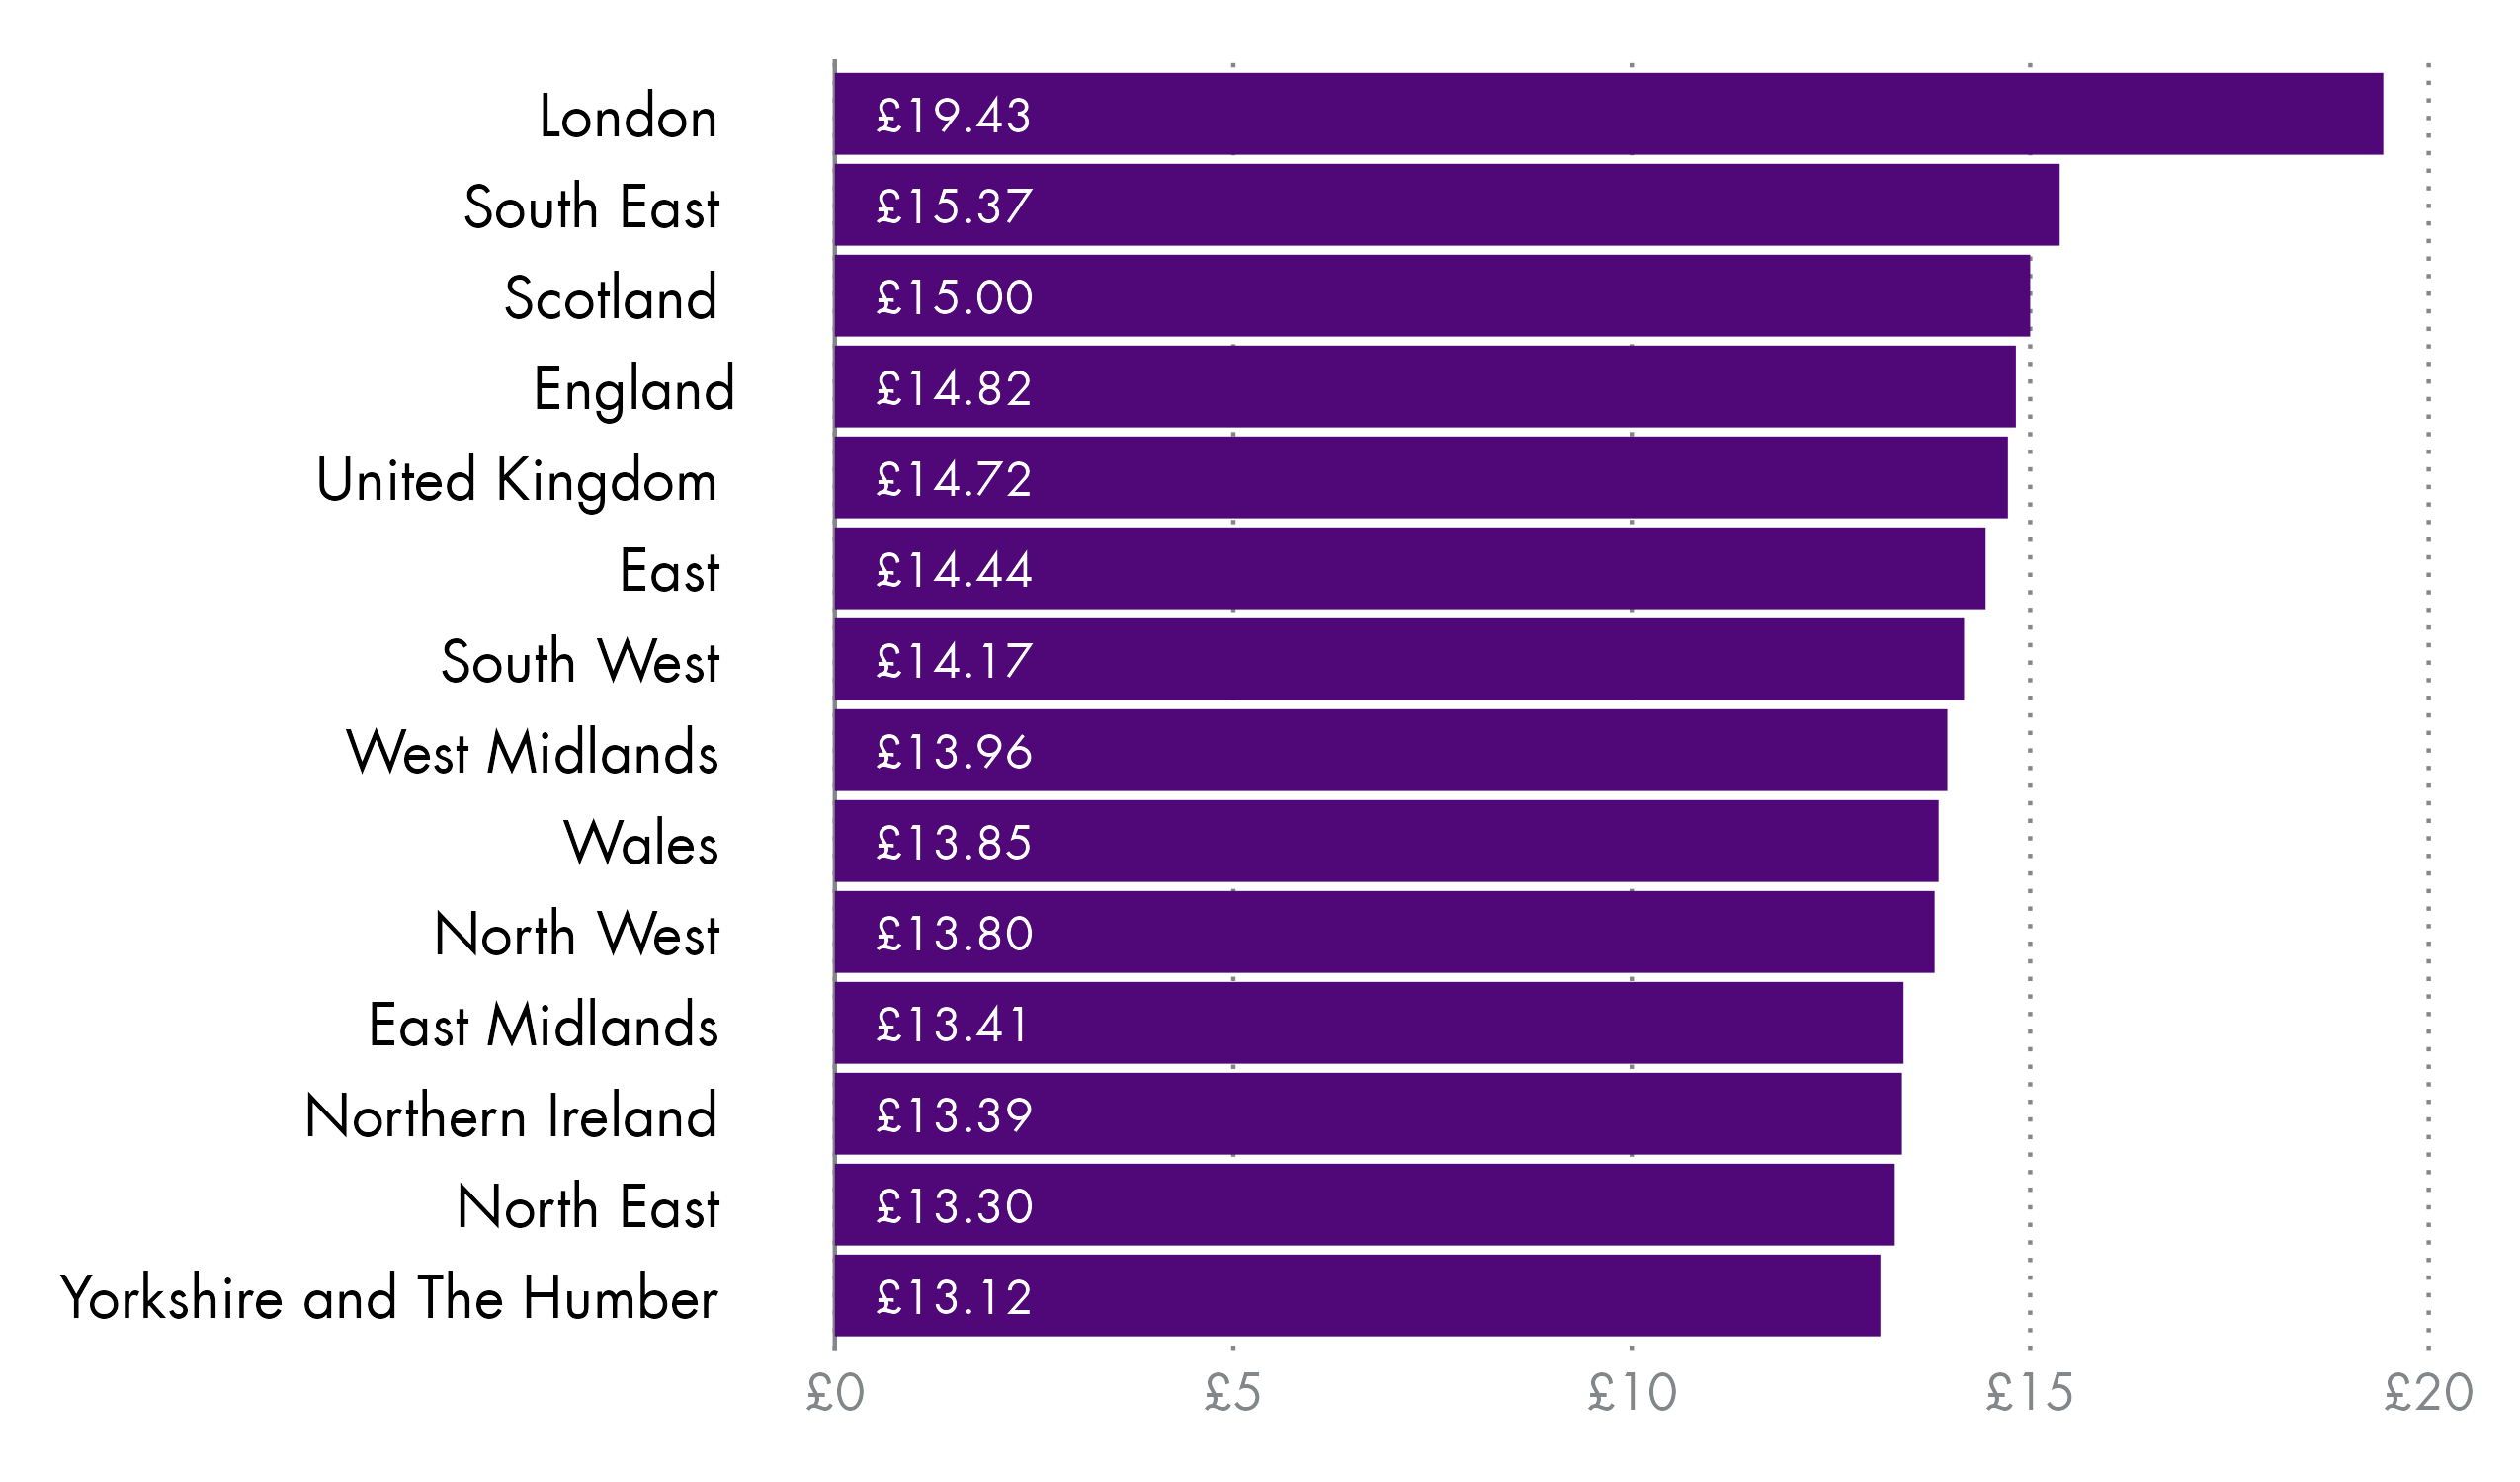
Hourly pay excluding overtime in Scotland is the third highest across the UK at £15.00. London has the highest at £19.43, while the Yorkshire and the Humber was the lowest at £13.12.
Fig 22: Real terms median hourly pay excluding overtime for all employees - 2018 to 2022
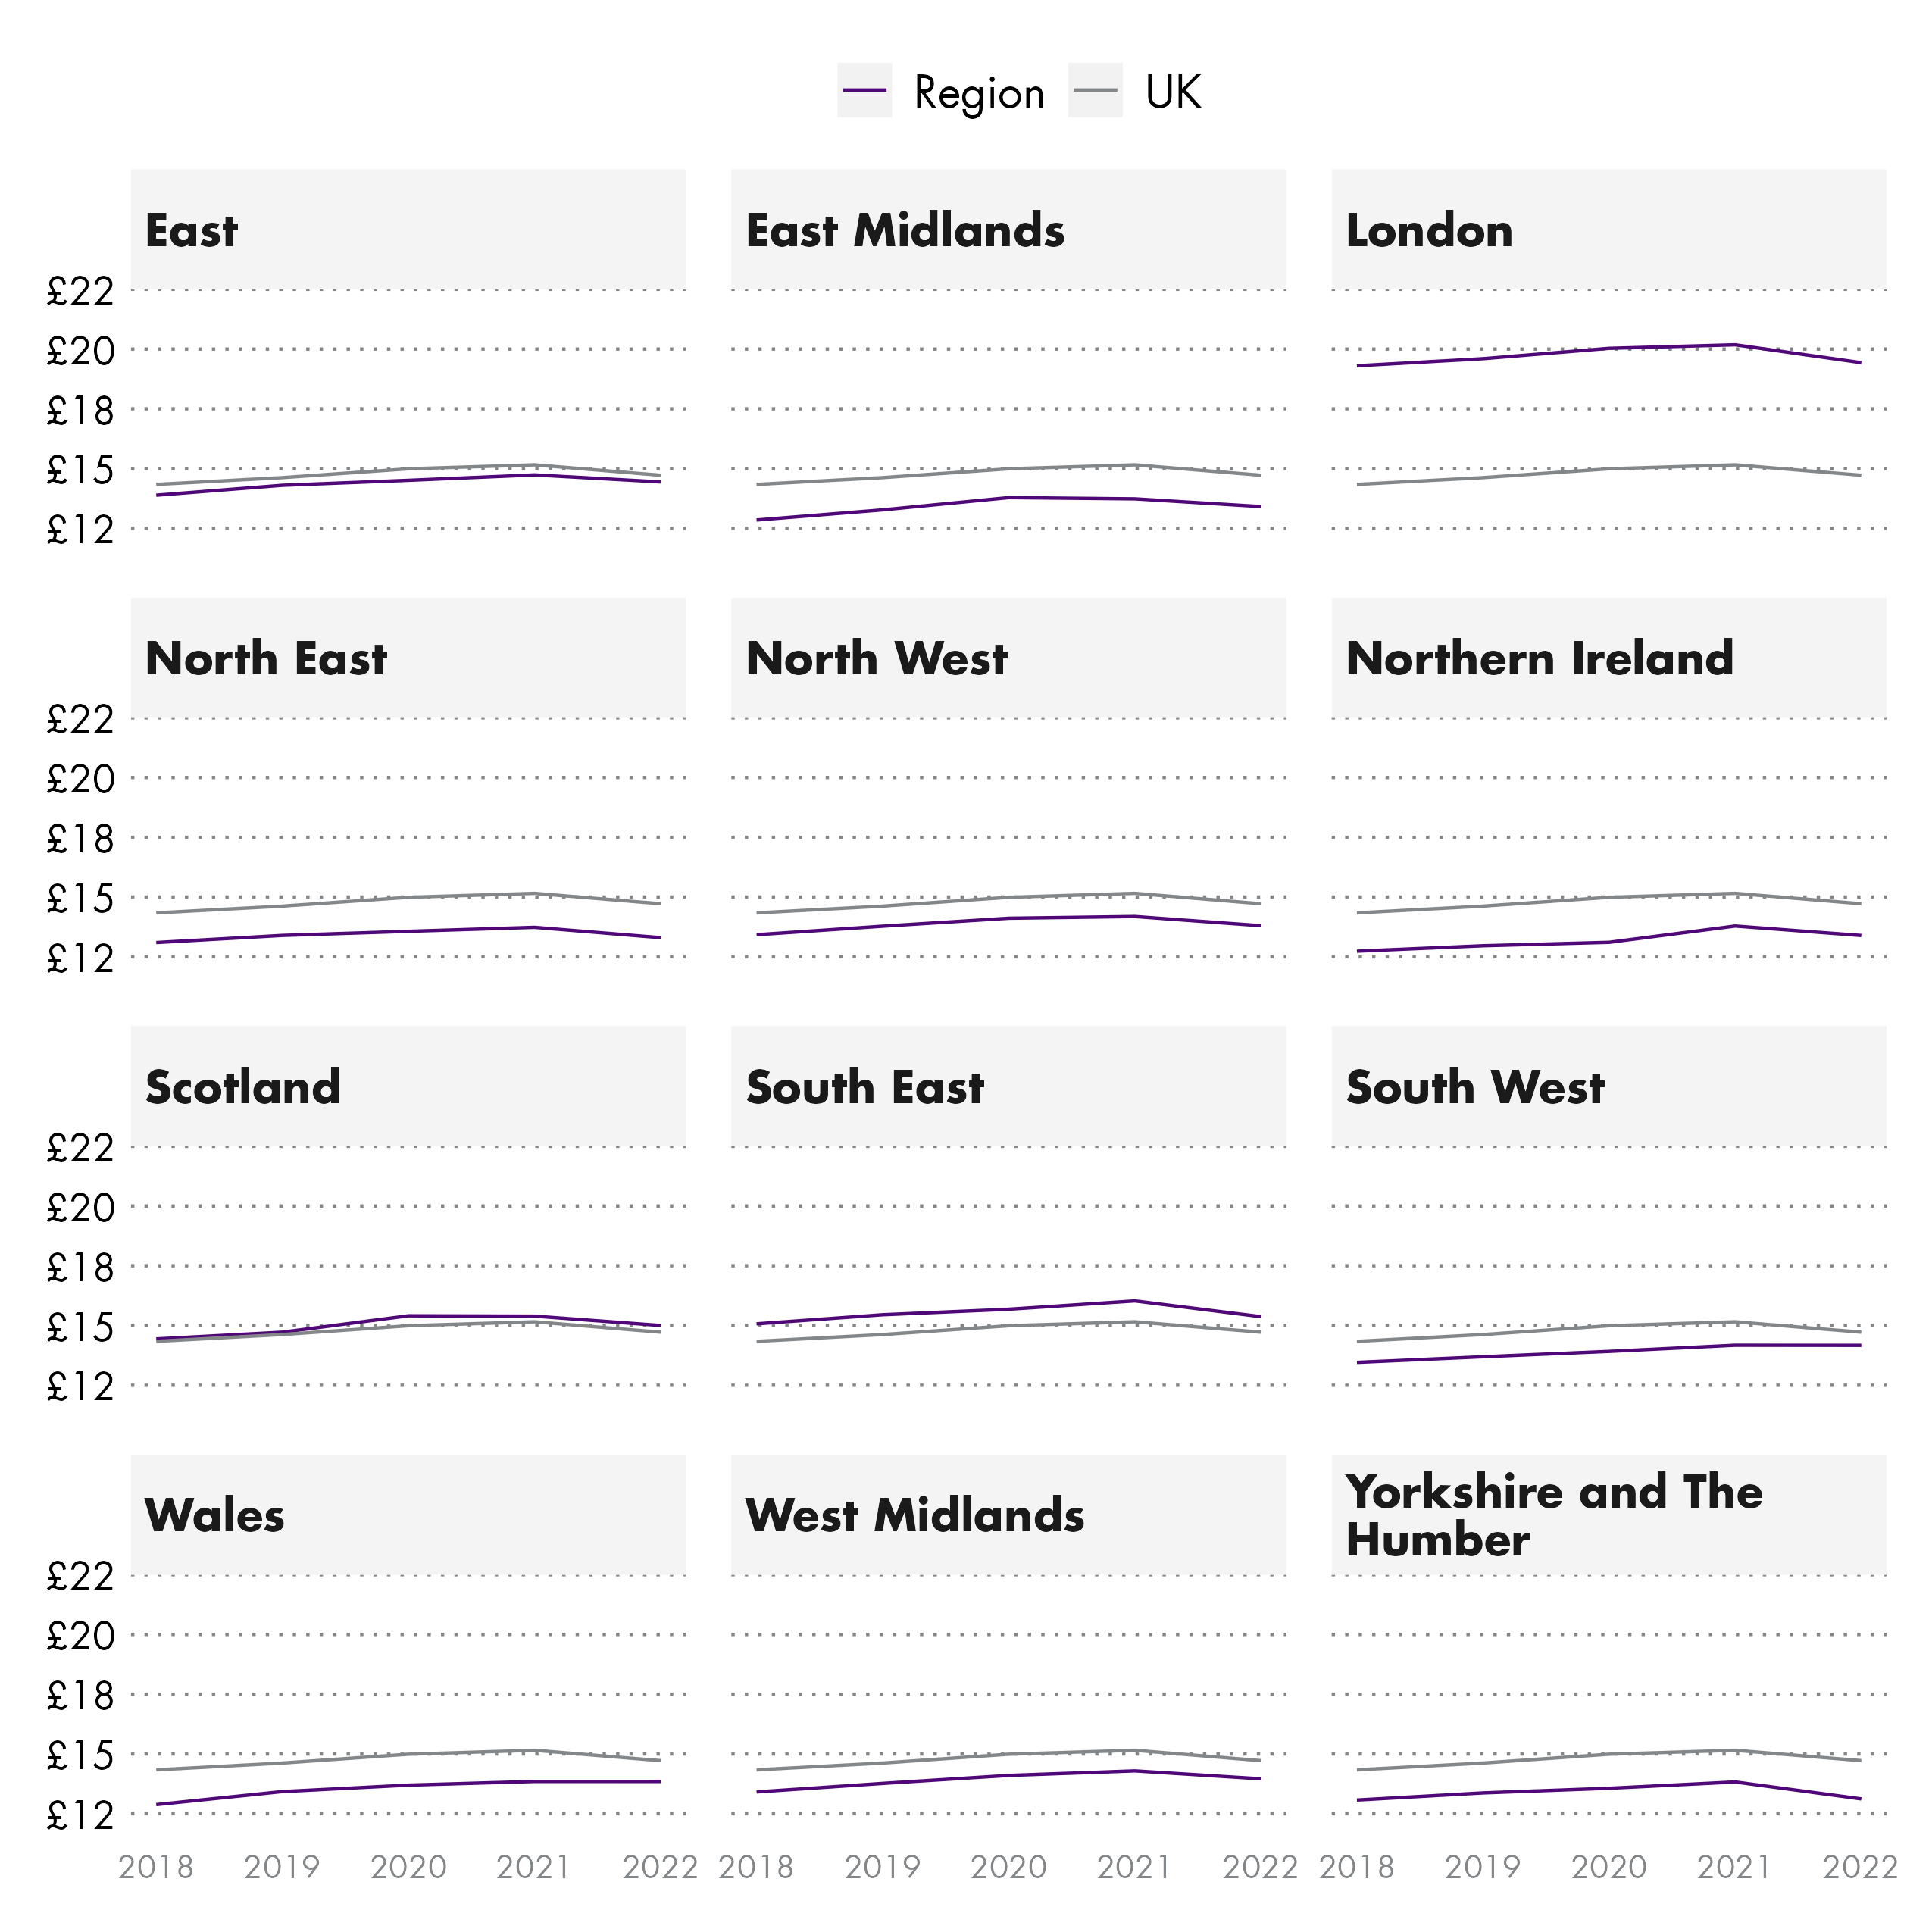
Wales saw the highest increase in median hourly pay excluding overtime in real terms between 2018 and 2022, at 7.5%. Yorkshire and the Humber saw the lowest at 0.4%. Scotland saw an increase of 3.9%
Care should be taken when interpreting these figures due to issues with this year's data. You can find out more in this in the "about the data" section of the briefing.
What is typical hourly pay for full-time employees in Scotland?
This section looks at typical hourly pay for full-time employees in Scotland and across the UK.
Fig 23: Median hourly pay excluding overtime for full-time employees - 2022
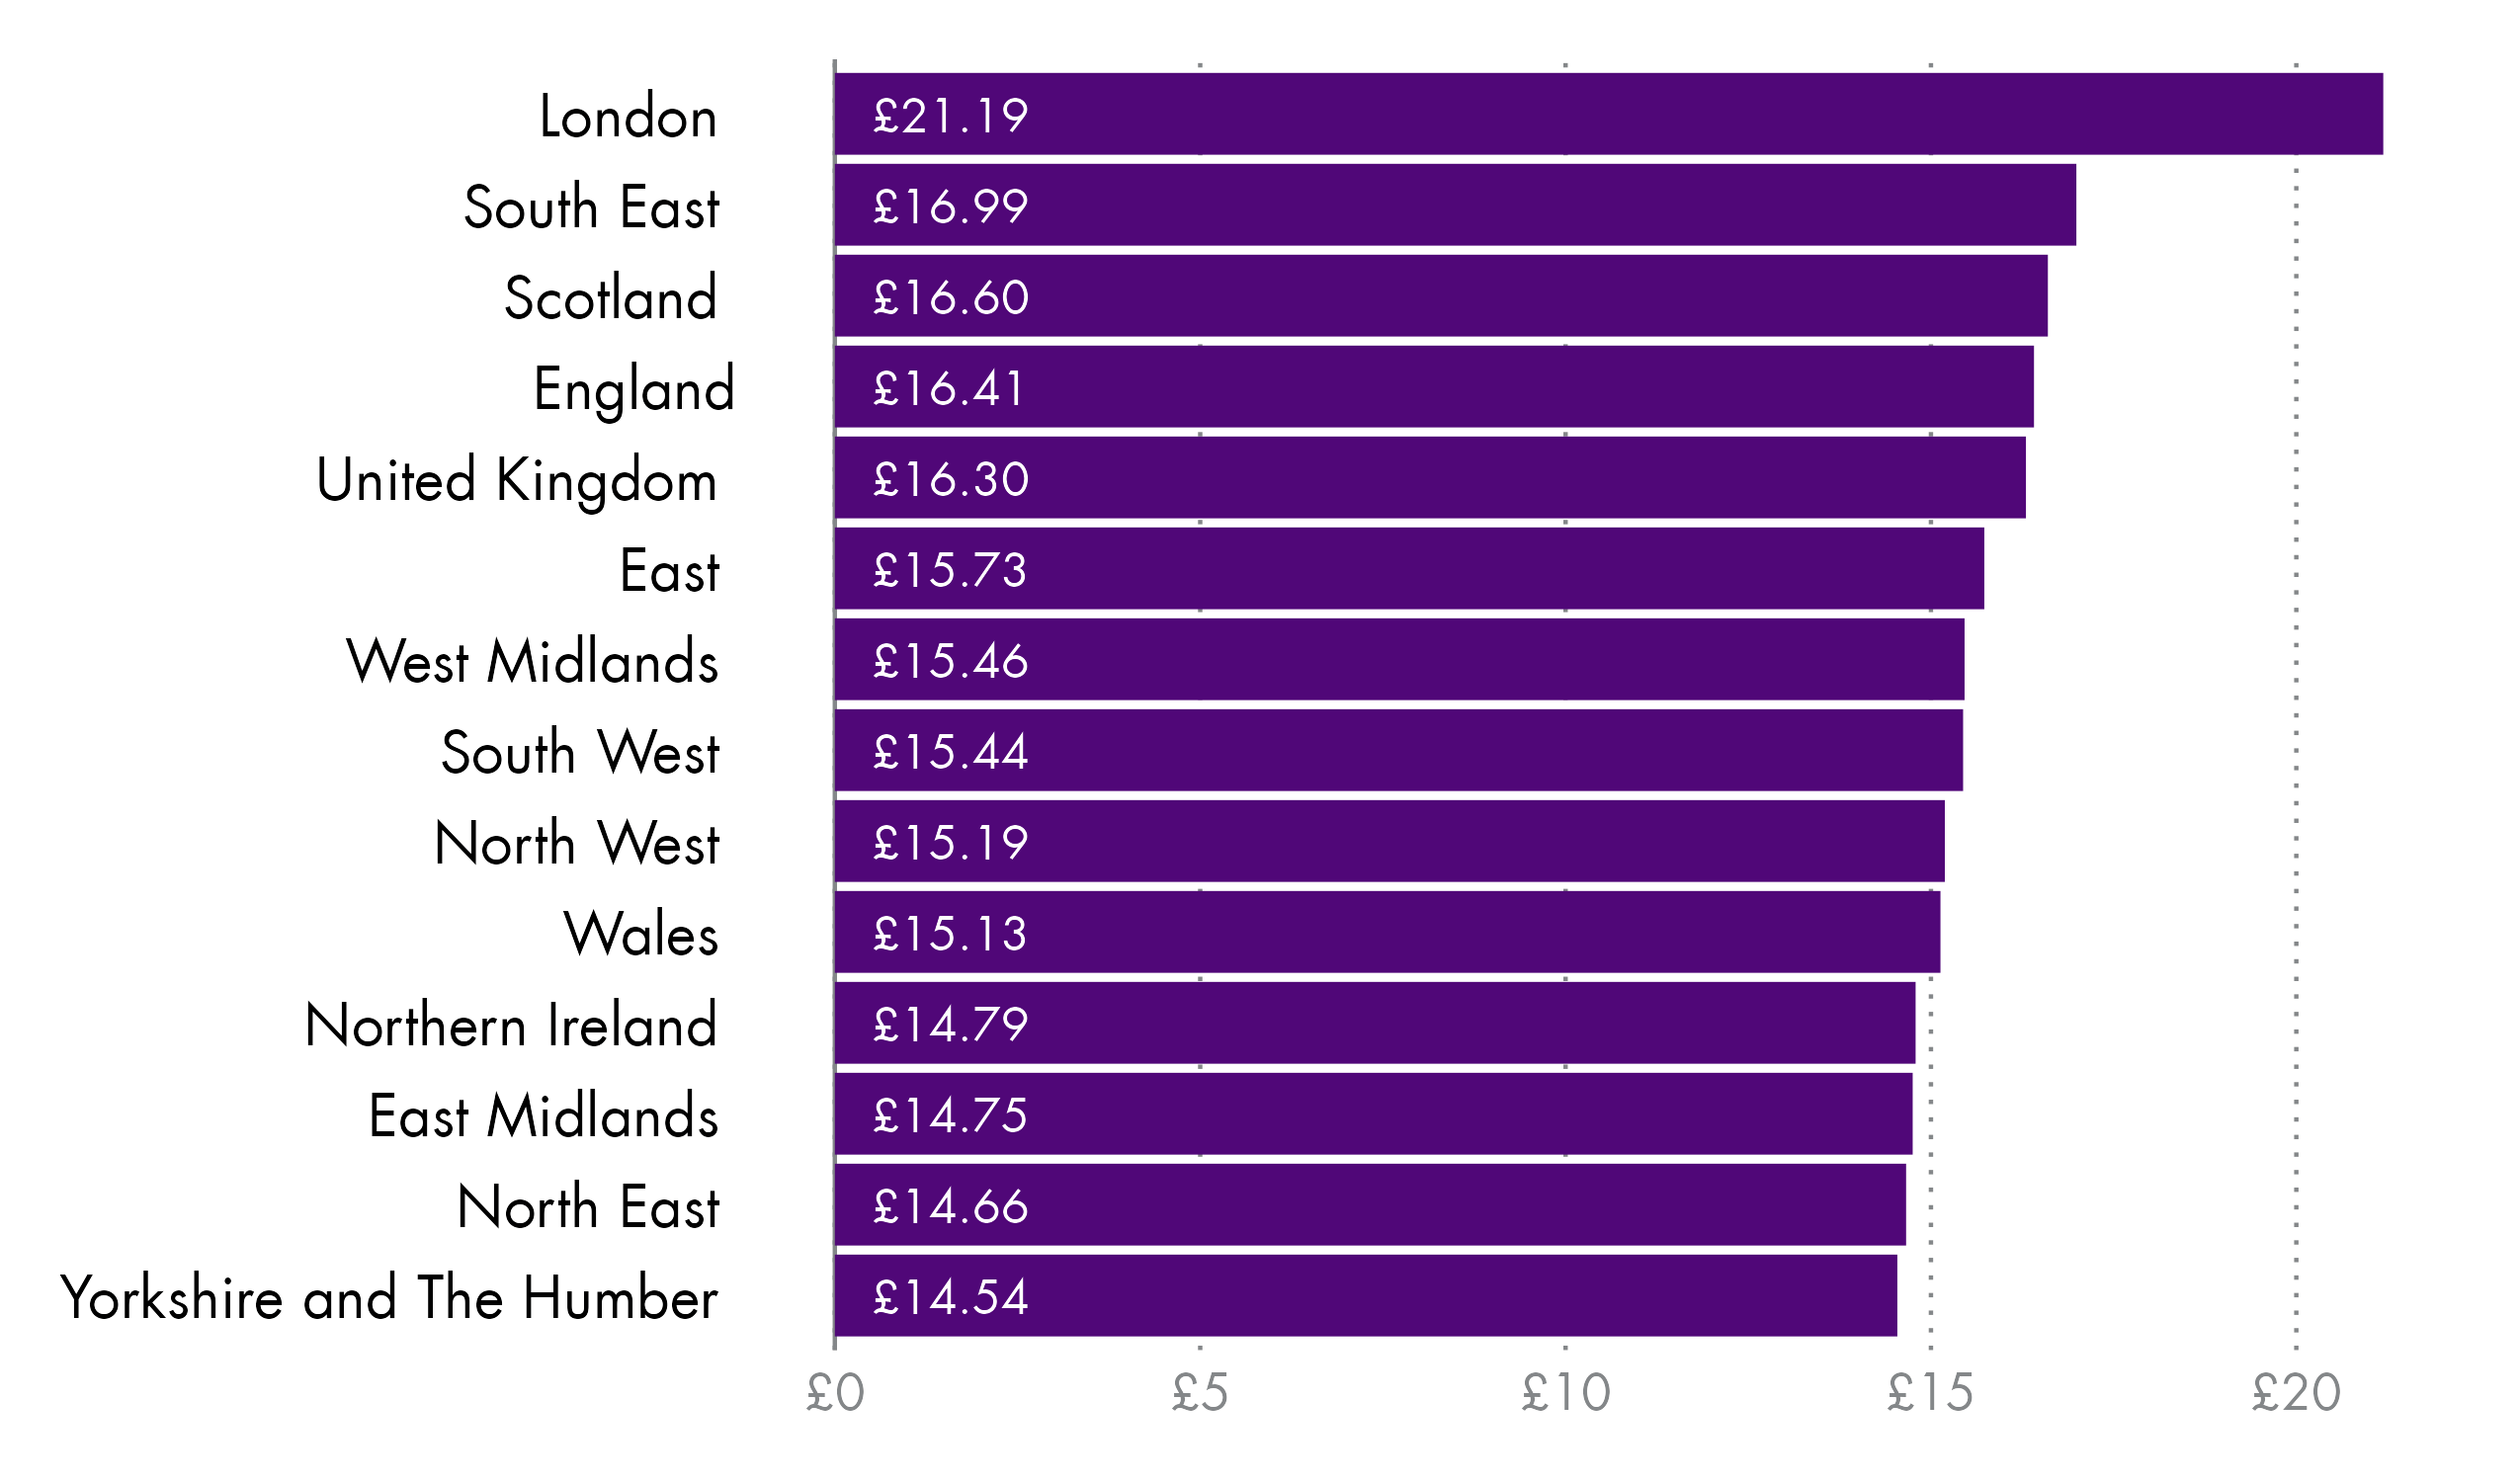
Scotland has the third highest median hourly pay excluding for full-time employees across the UK at £16.60. London has the highest at £21.19 while Yorkshire and the Humber has the lowest at £14.54.
Fig 24: Real terms median hourly pay excluding overtime for full-time employees - 2018 to 2022
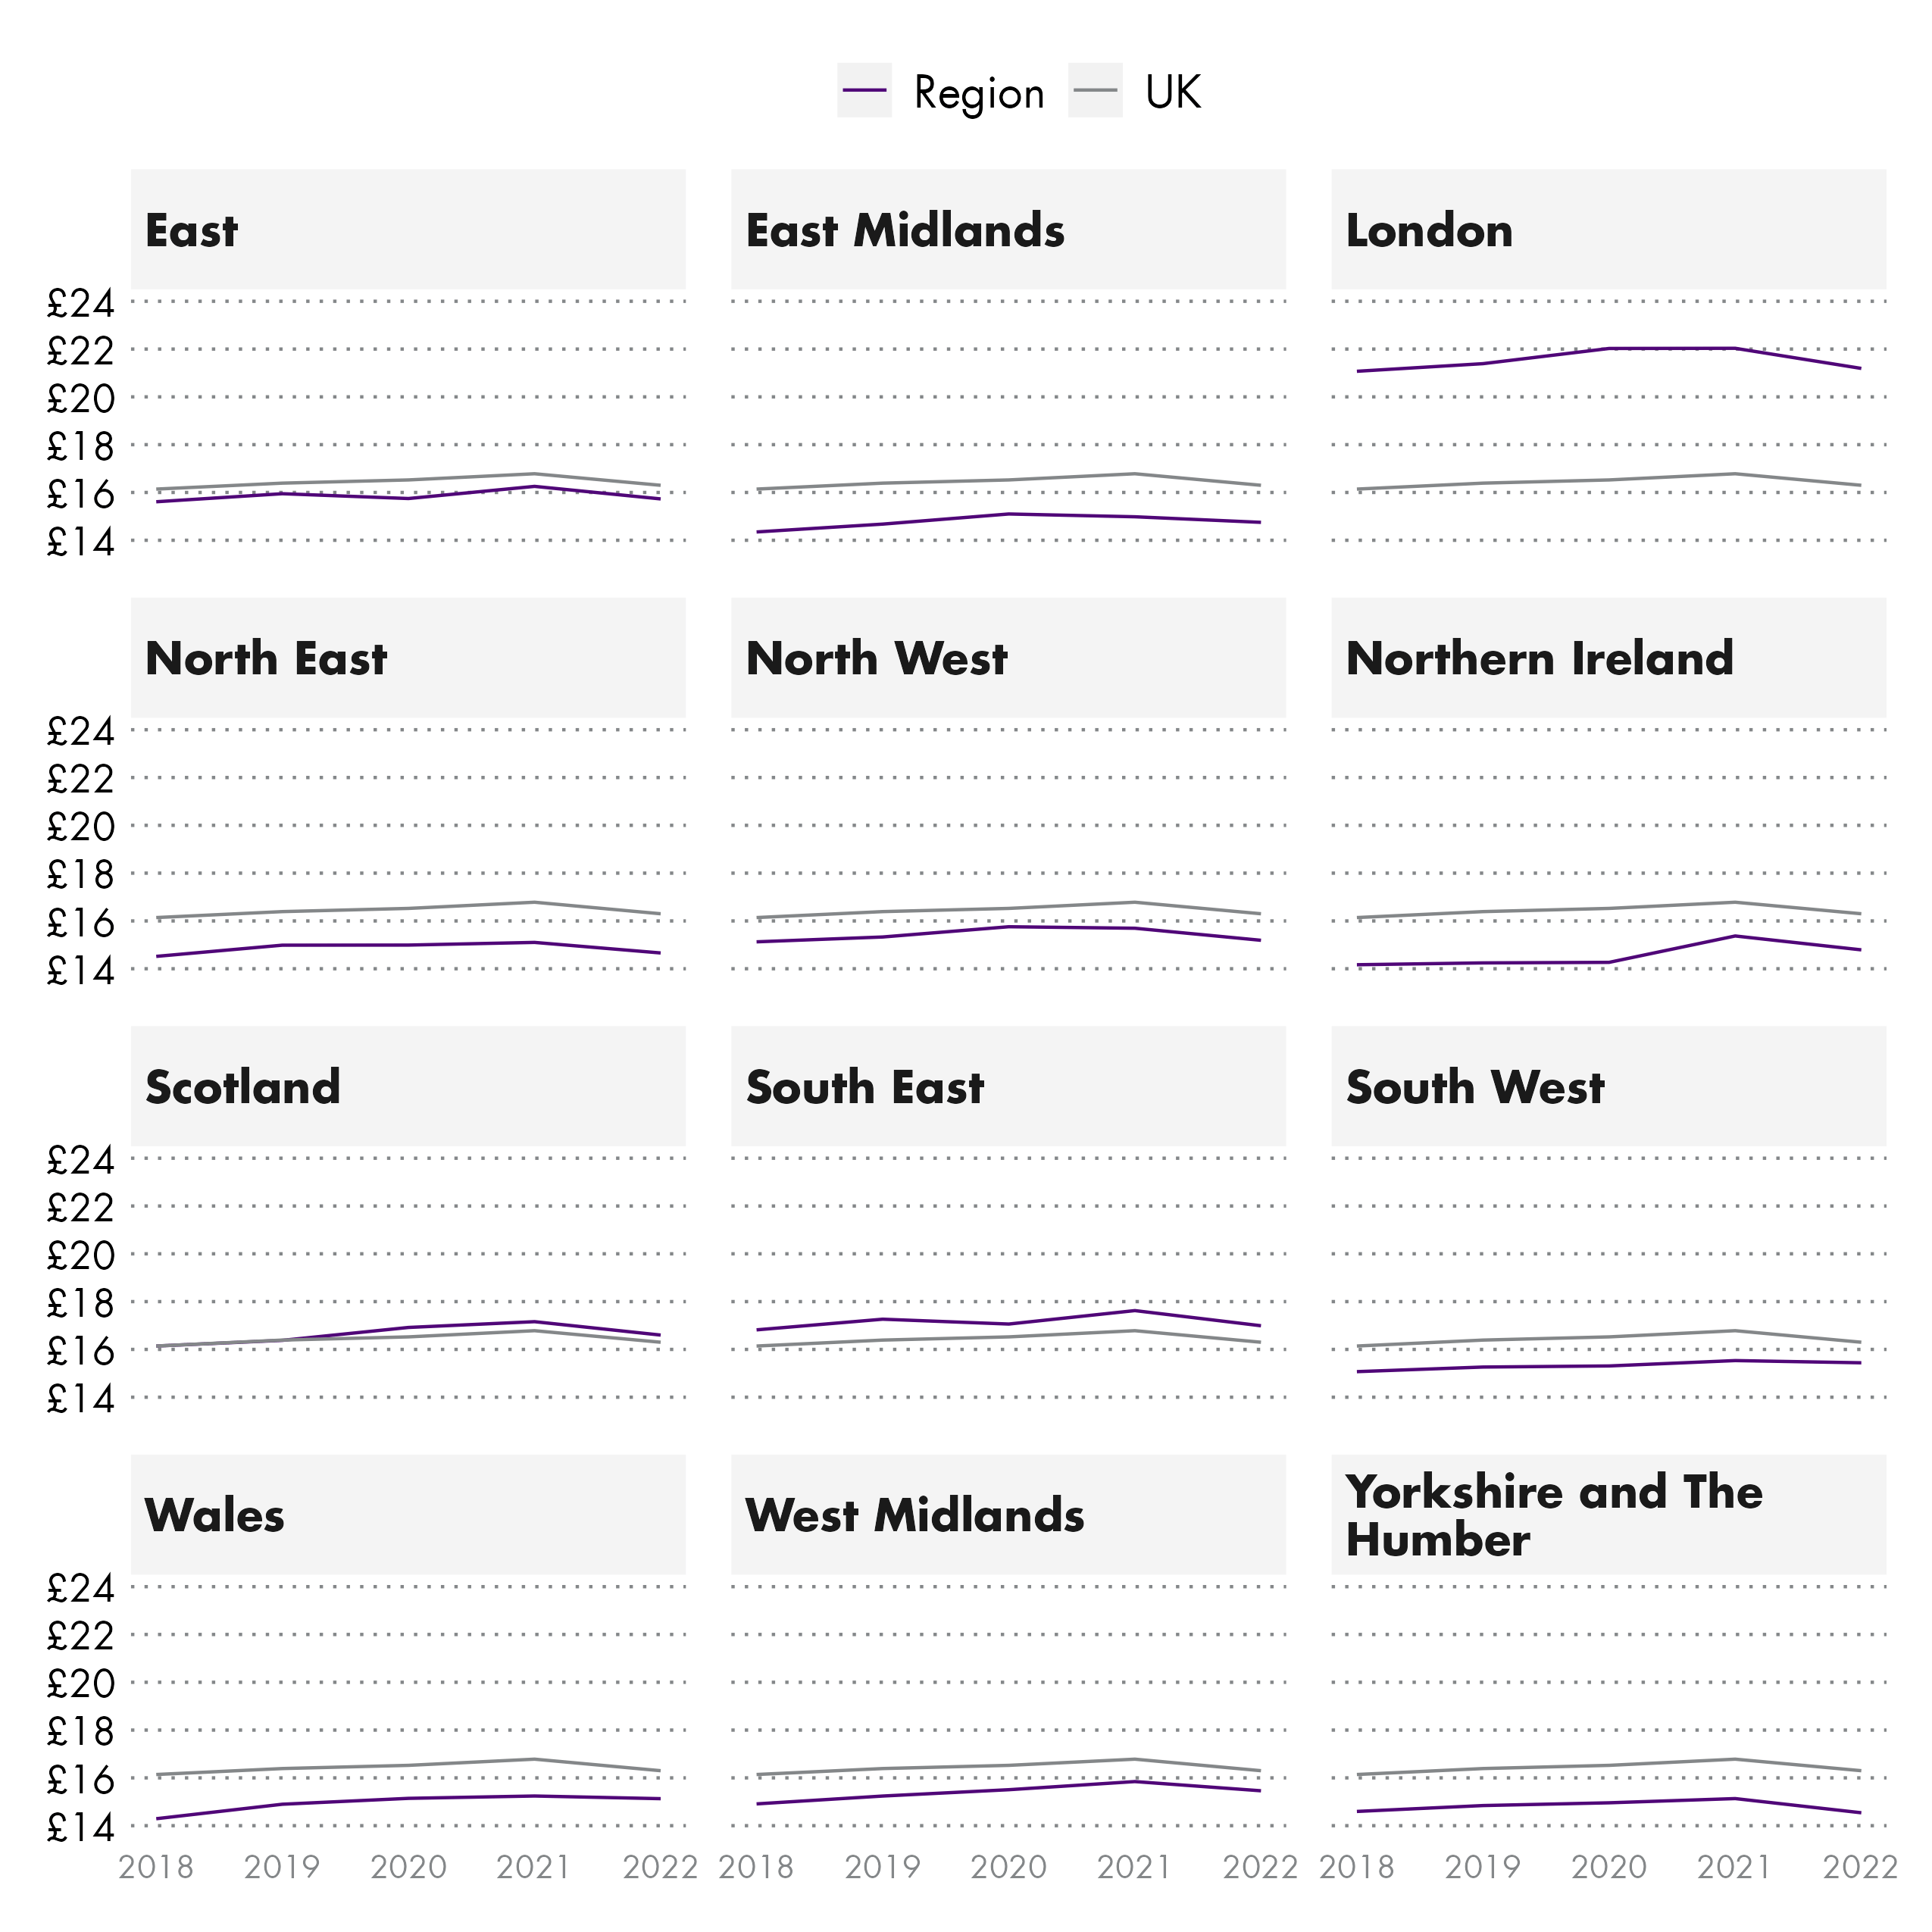
Wales saw the largest increase in real terms full-time median hourly pay excluding overtime increasing, by 5.9%. Yorkshire and the Humber was the only region to see a decrease, falling by 0.4%. Scotland saw an increase of 2.8%.
Care should be taken when interpreting these figures due to issues with this year's data. You can find out more in this in the "about the data" section of the briefing.
What is typical hourly pay for part-time employees in Scotland?
This section looks at typical hourly pay for part-time employees in Scotland and across the UK.
When looking at part-time pay it is important to consider:
Part-time jobs tend to be more impacted by increases in National Minimum Wage rates, due to a typical lower hourly rate.
Flexible working patterns can change employee job profiles from full-time to part-time, whilst retaining the higher hourly pay rates.
Fig 25: Median hourly pay excluding overtime for part-time employees - 2022
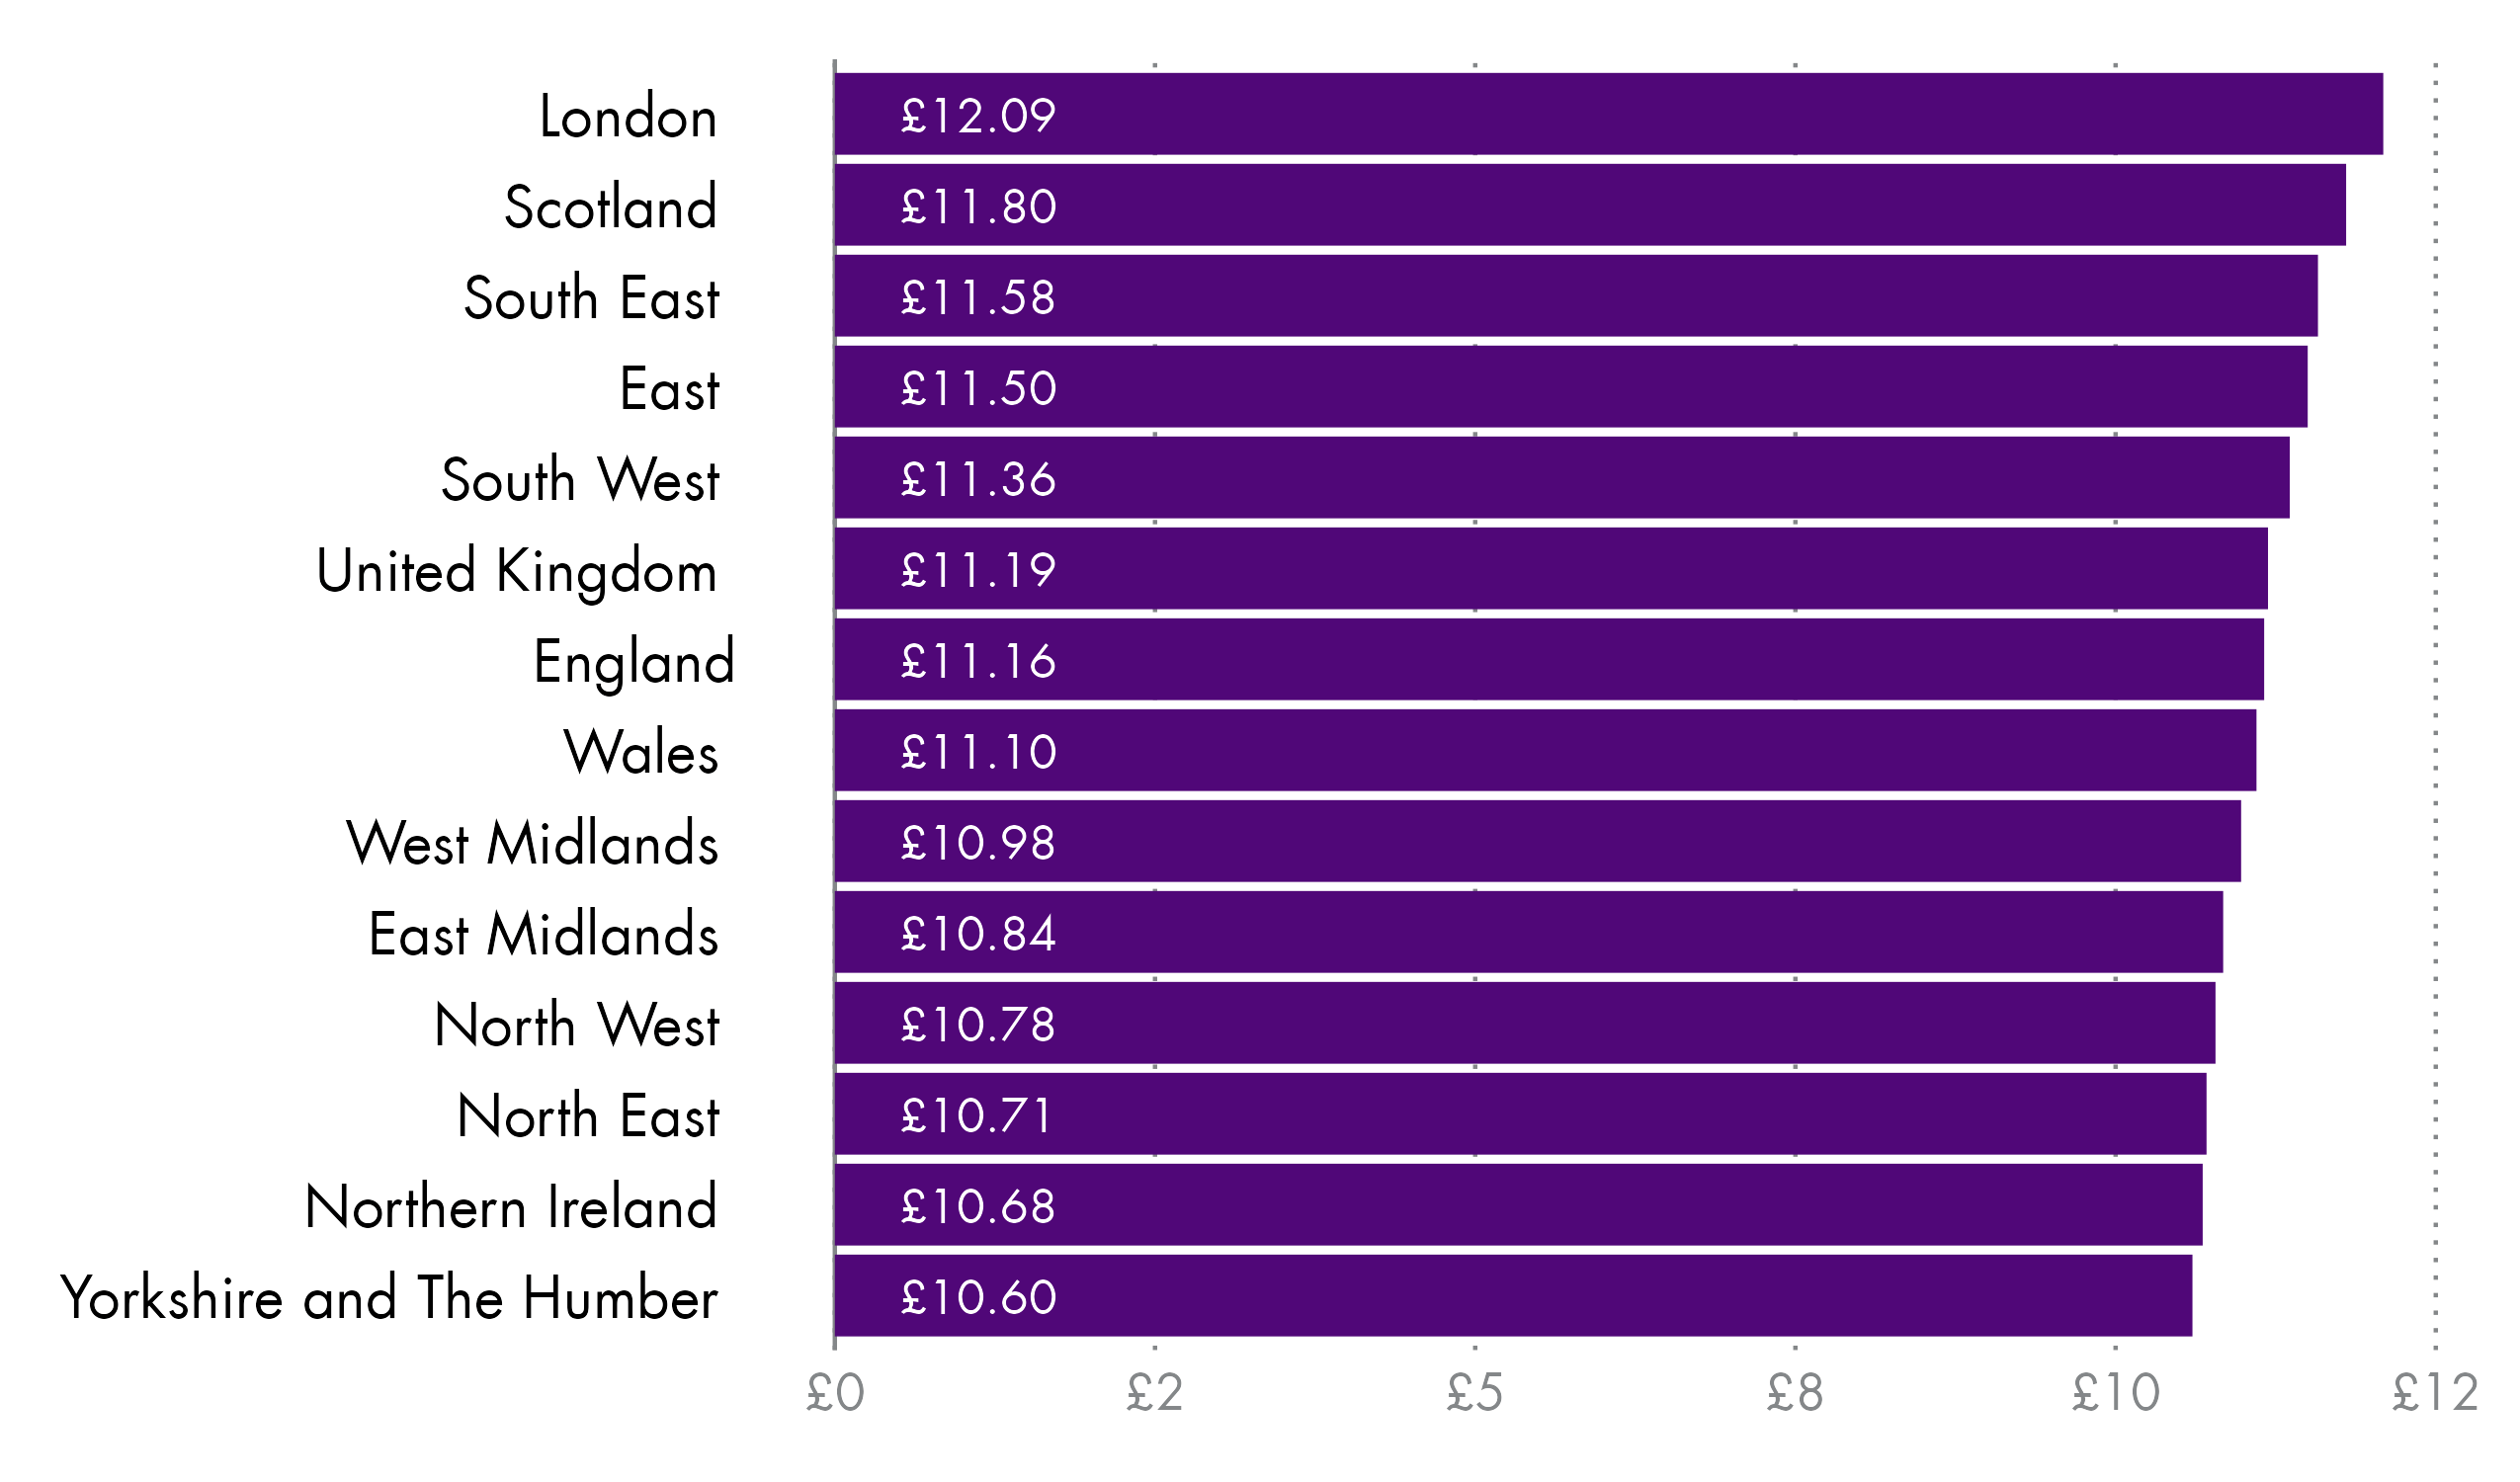
Scotland has the second highest part-time median hourly pay excluding overtime of the nations and regions of the UK, at £11.80. London has the highest at £12.09 and Yorkshire and the Humber the lowest at £10.60.
Fig 26: Real terms median hourly pay excluding overtime for part-time employees - 2018 to 2020
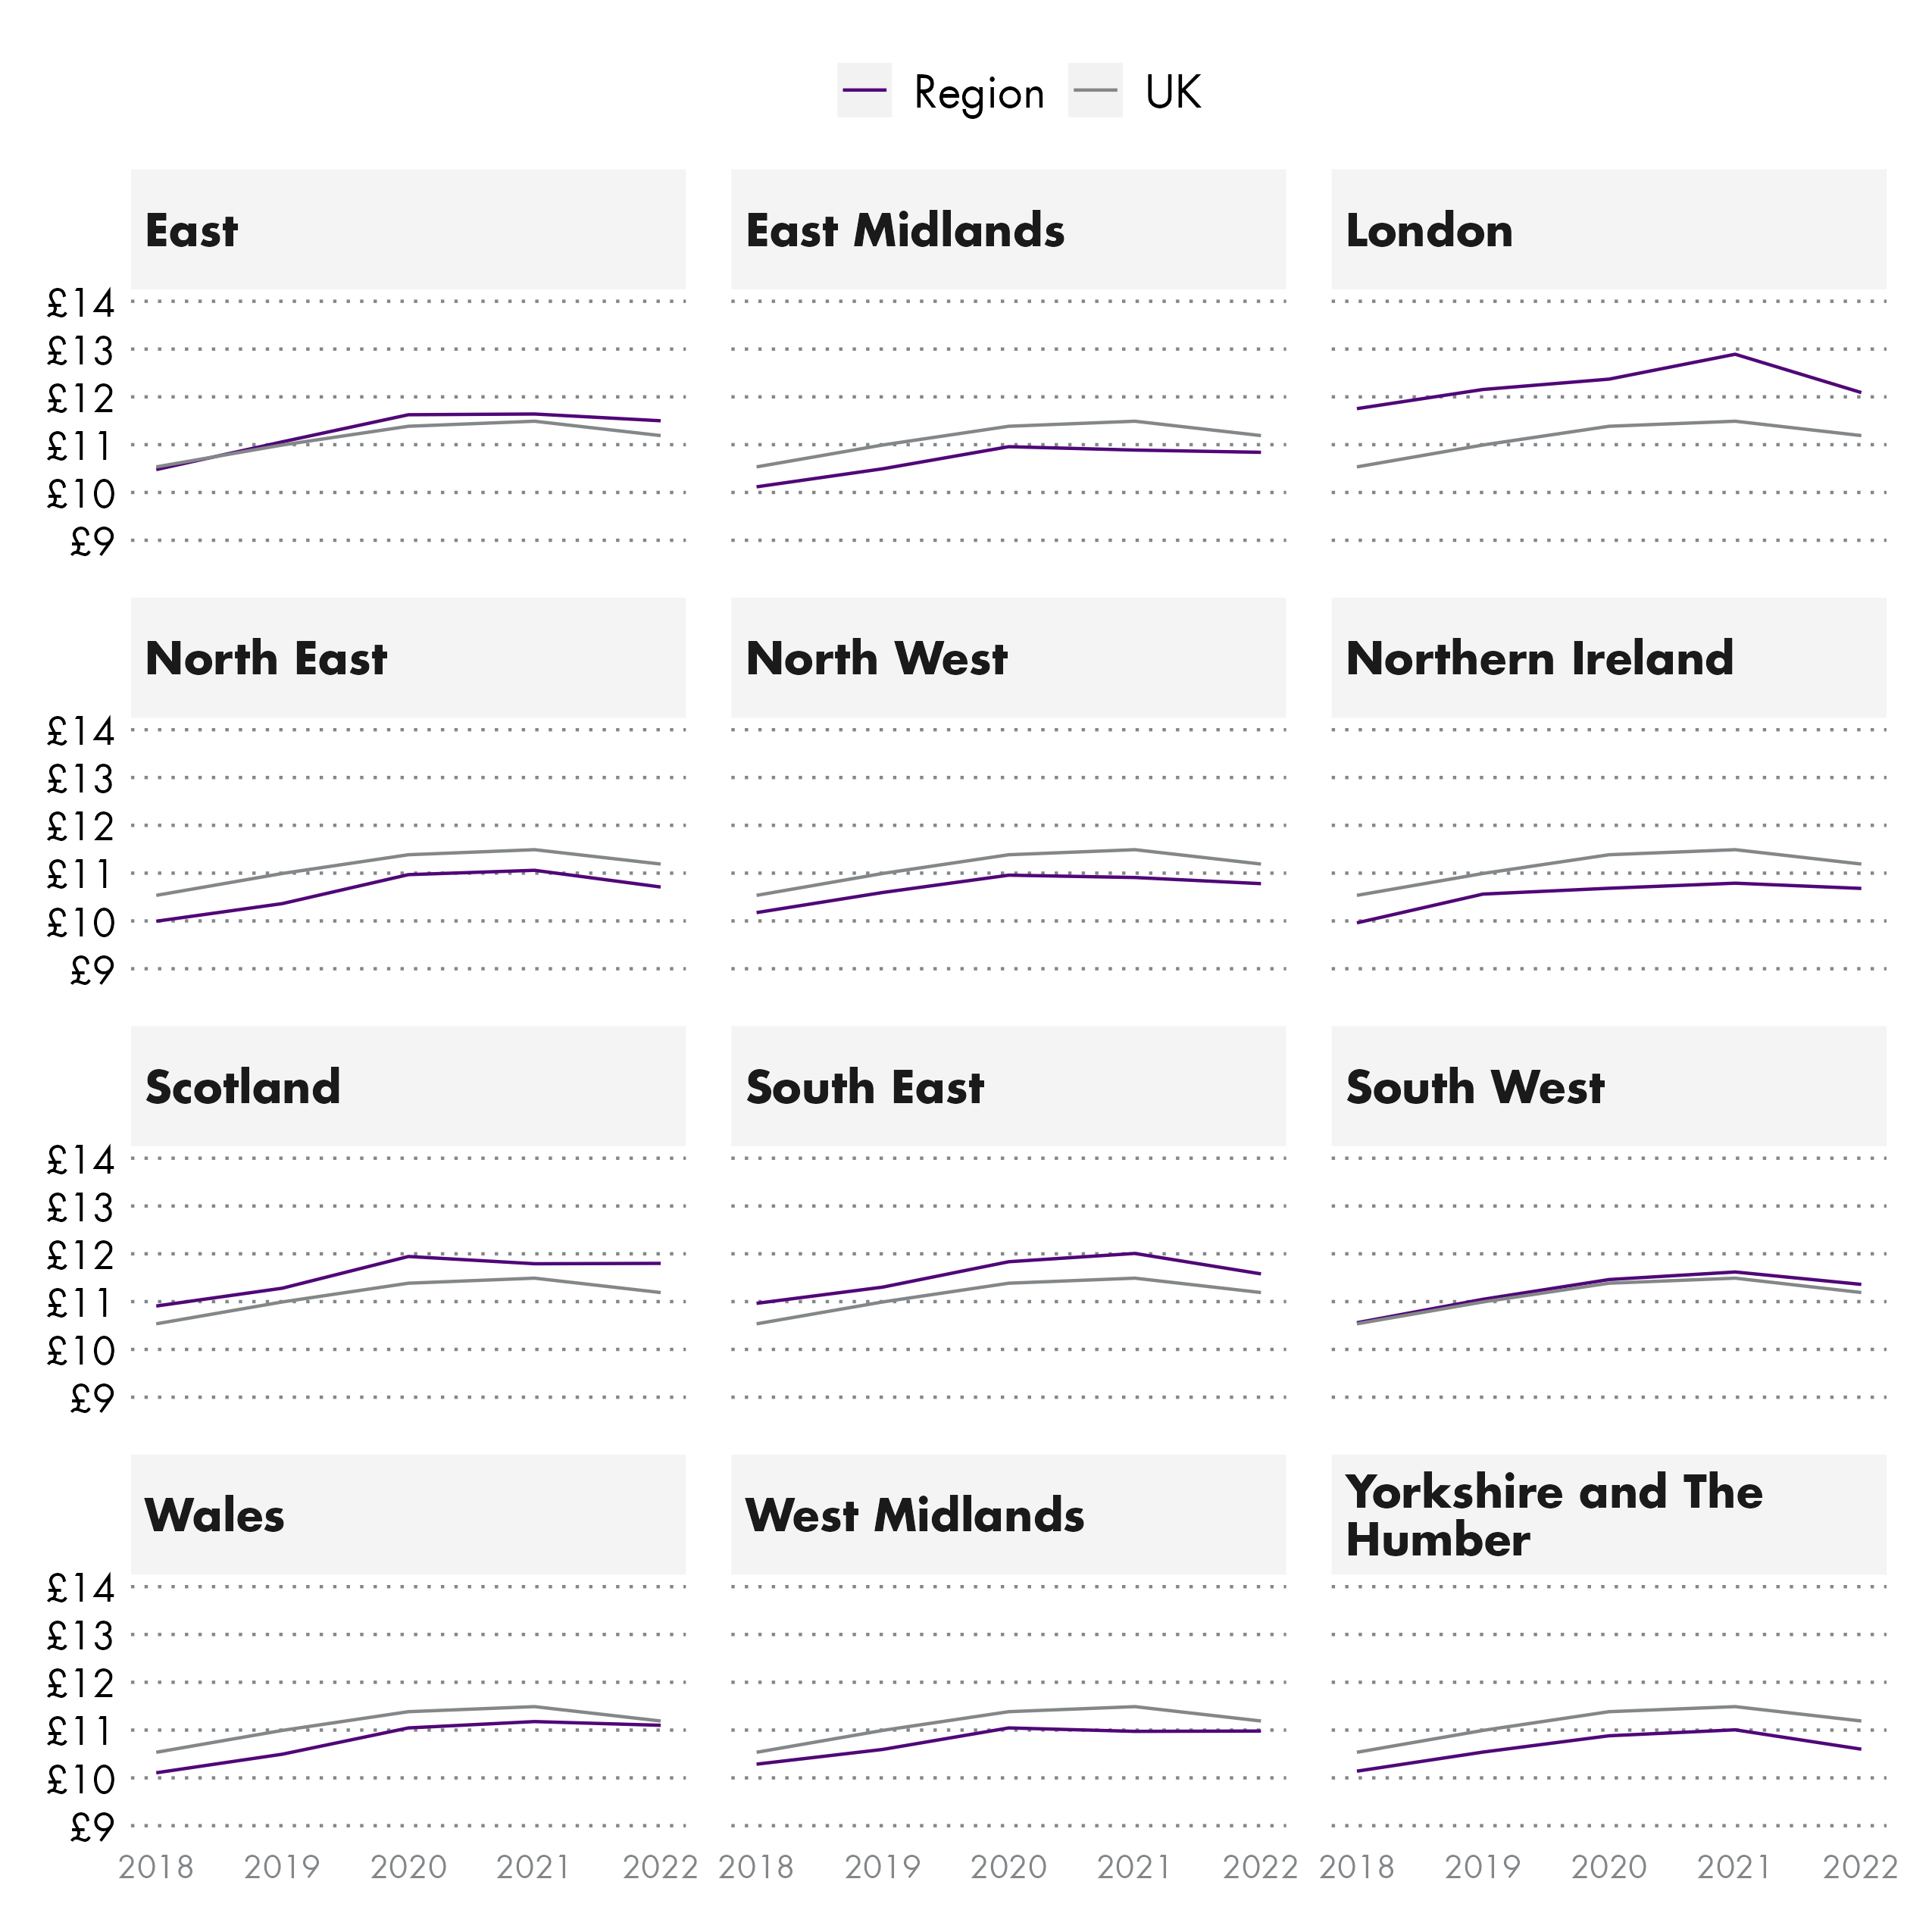
Wales saw the highest real terms increase in median part-time hourly pay excluding over time between 2018 and 2022, at 9.8%. London saw the lowest increase, at 2.9%. Scotland saw the third highest increase, at 8.2% over the same period.
Care should be taken when interpreting these figures due to issues with this year's data. You can find out more in this in the "about the data" section of the briefing.
Pay by industry
This section looks at pay by industry in Scotland, using median hourly pay excluding overtime for all employees, to control for different working patterns and working weeks across industries.
Fig 27: Median hourly pay excluding overtime for all employees by industry - 2022
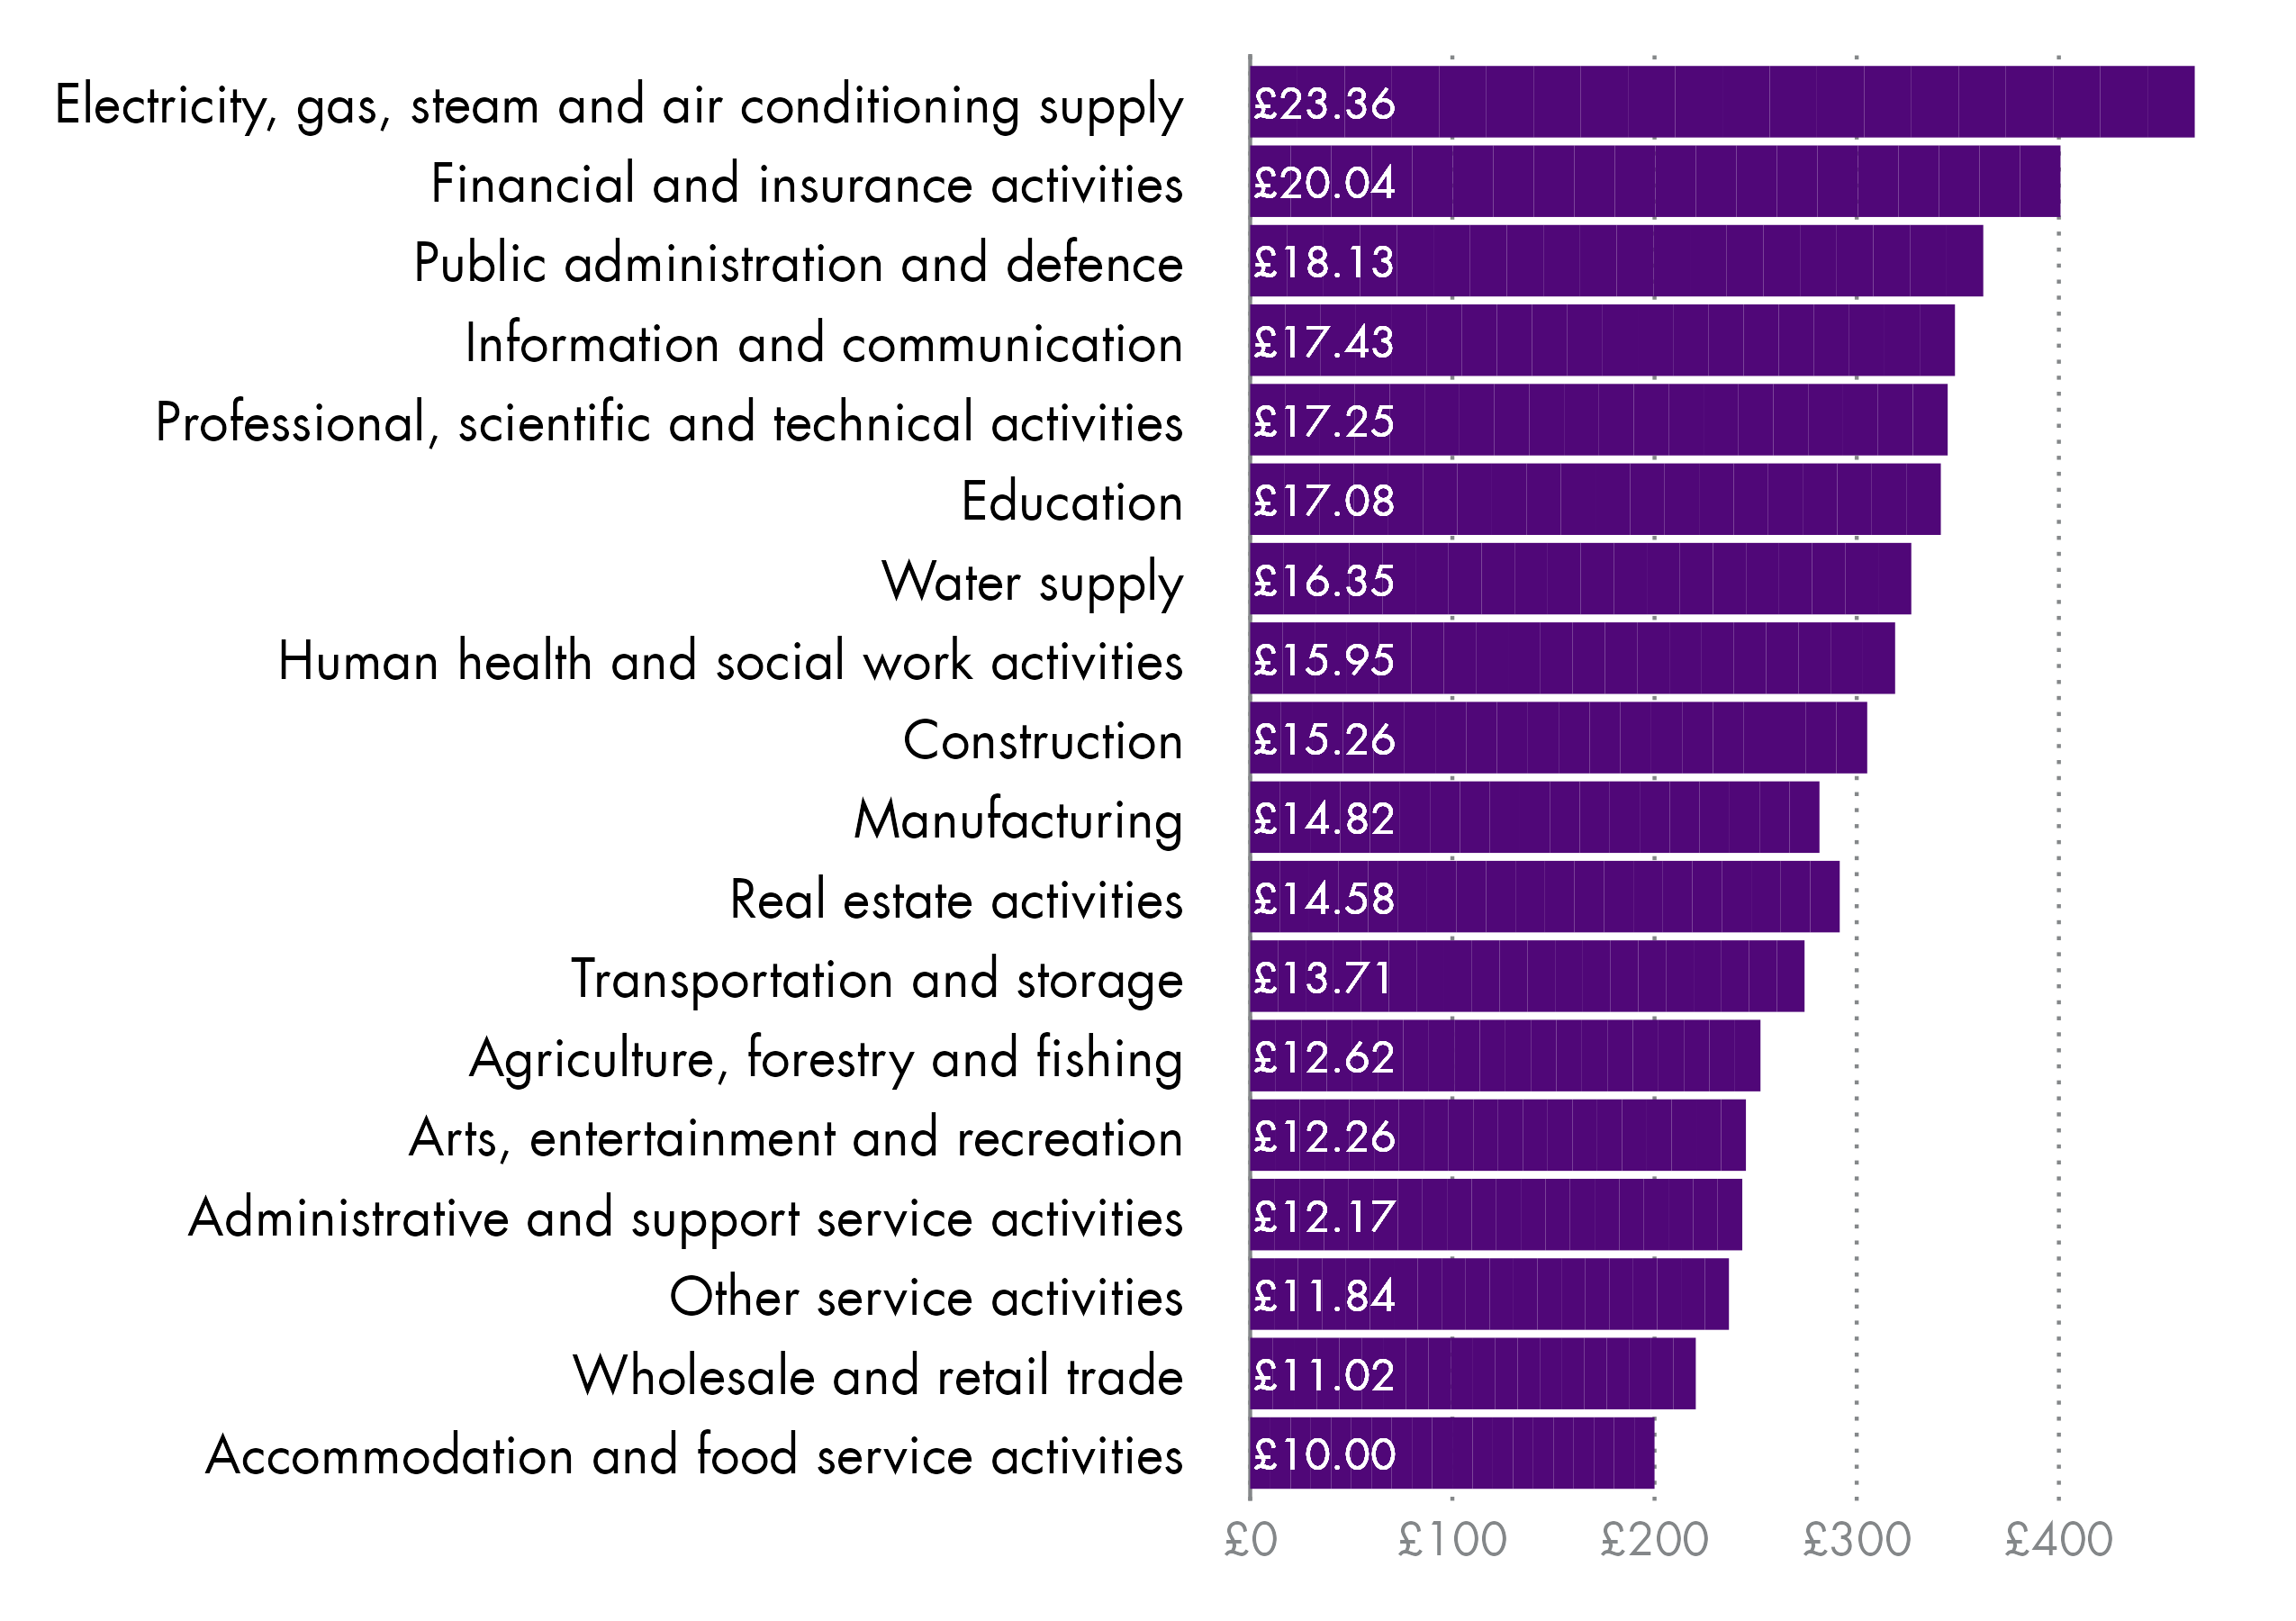
"Electricity, gas, steam and air conditioning supply" is the highest paid industry in Scotland with median hourly pay, excluding overtime, at £23.36. It is worth noting that while this sector has the highest, "Mining and Quarrying" may have a higher median, however the data is not robust enough to provide a median figure.
"Accommodation and food service" has the lowest pay of industries in Scotland at £10.00.
There were no industries with median pay below the living wage in Scotland in April 2022.
Fig 28: Real terms median hourly pay excluding overtime for all employees by industry - 2018 to 2022
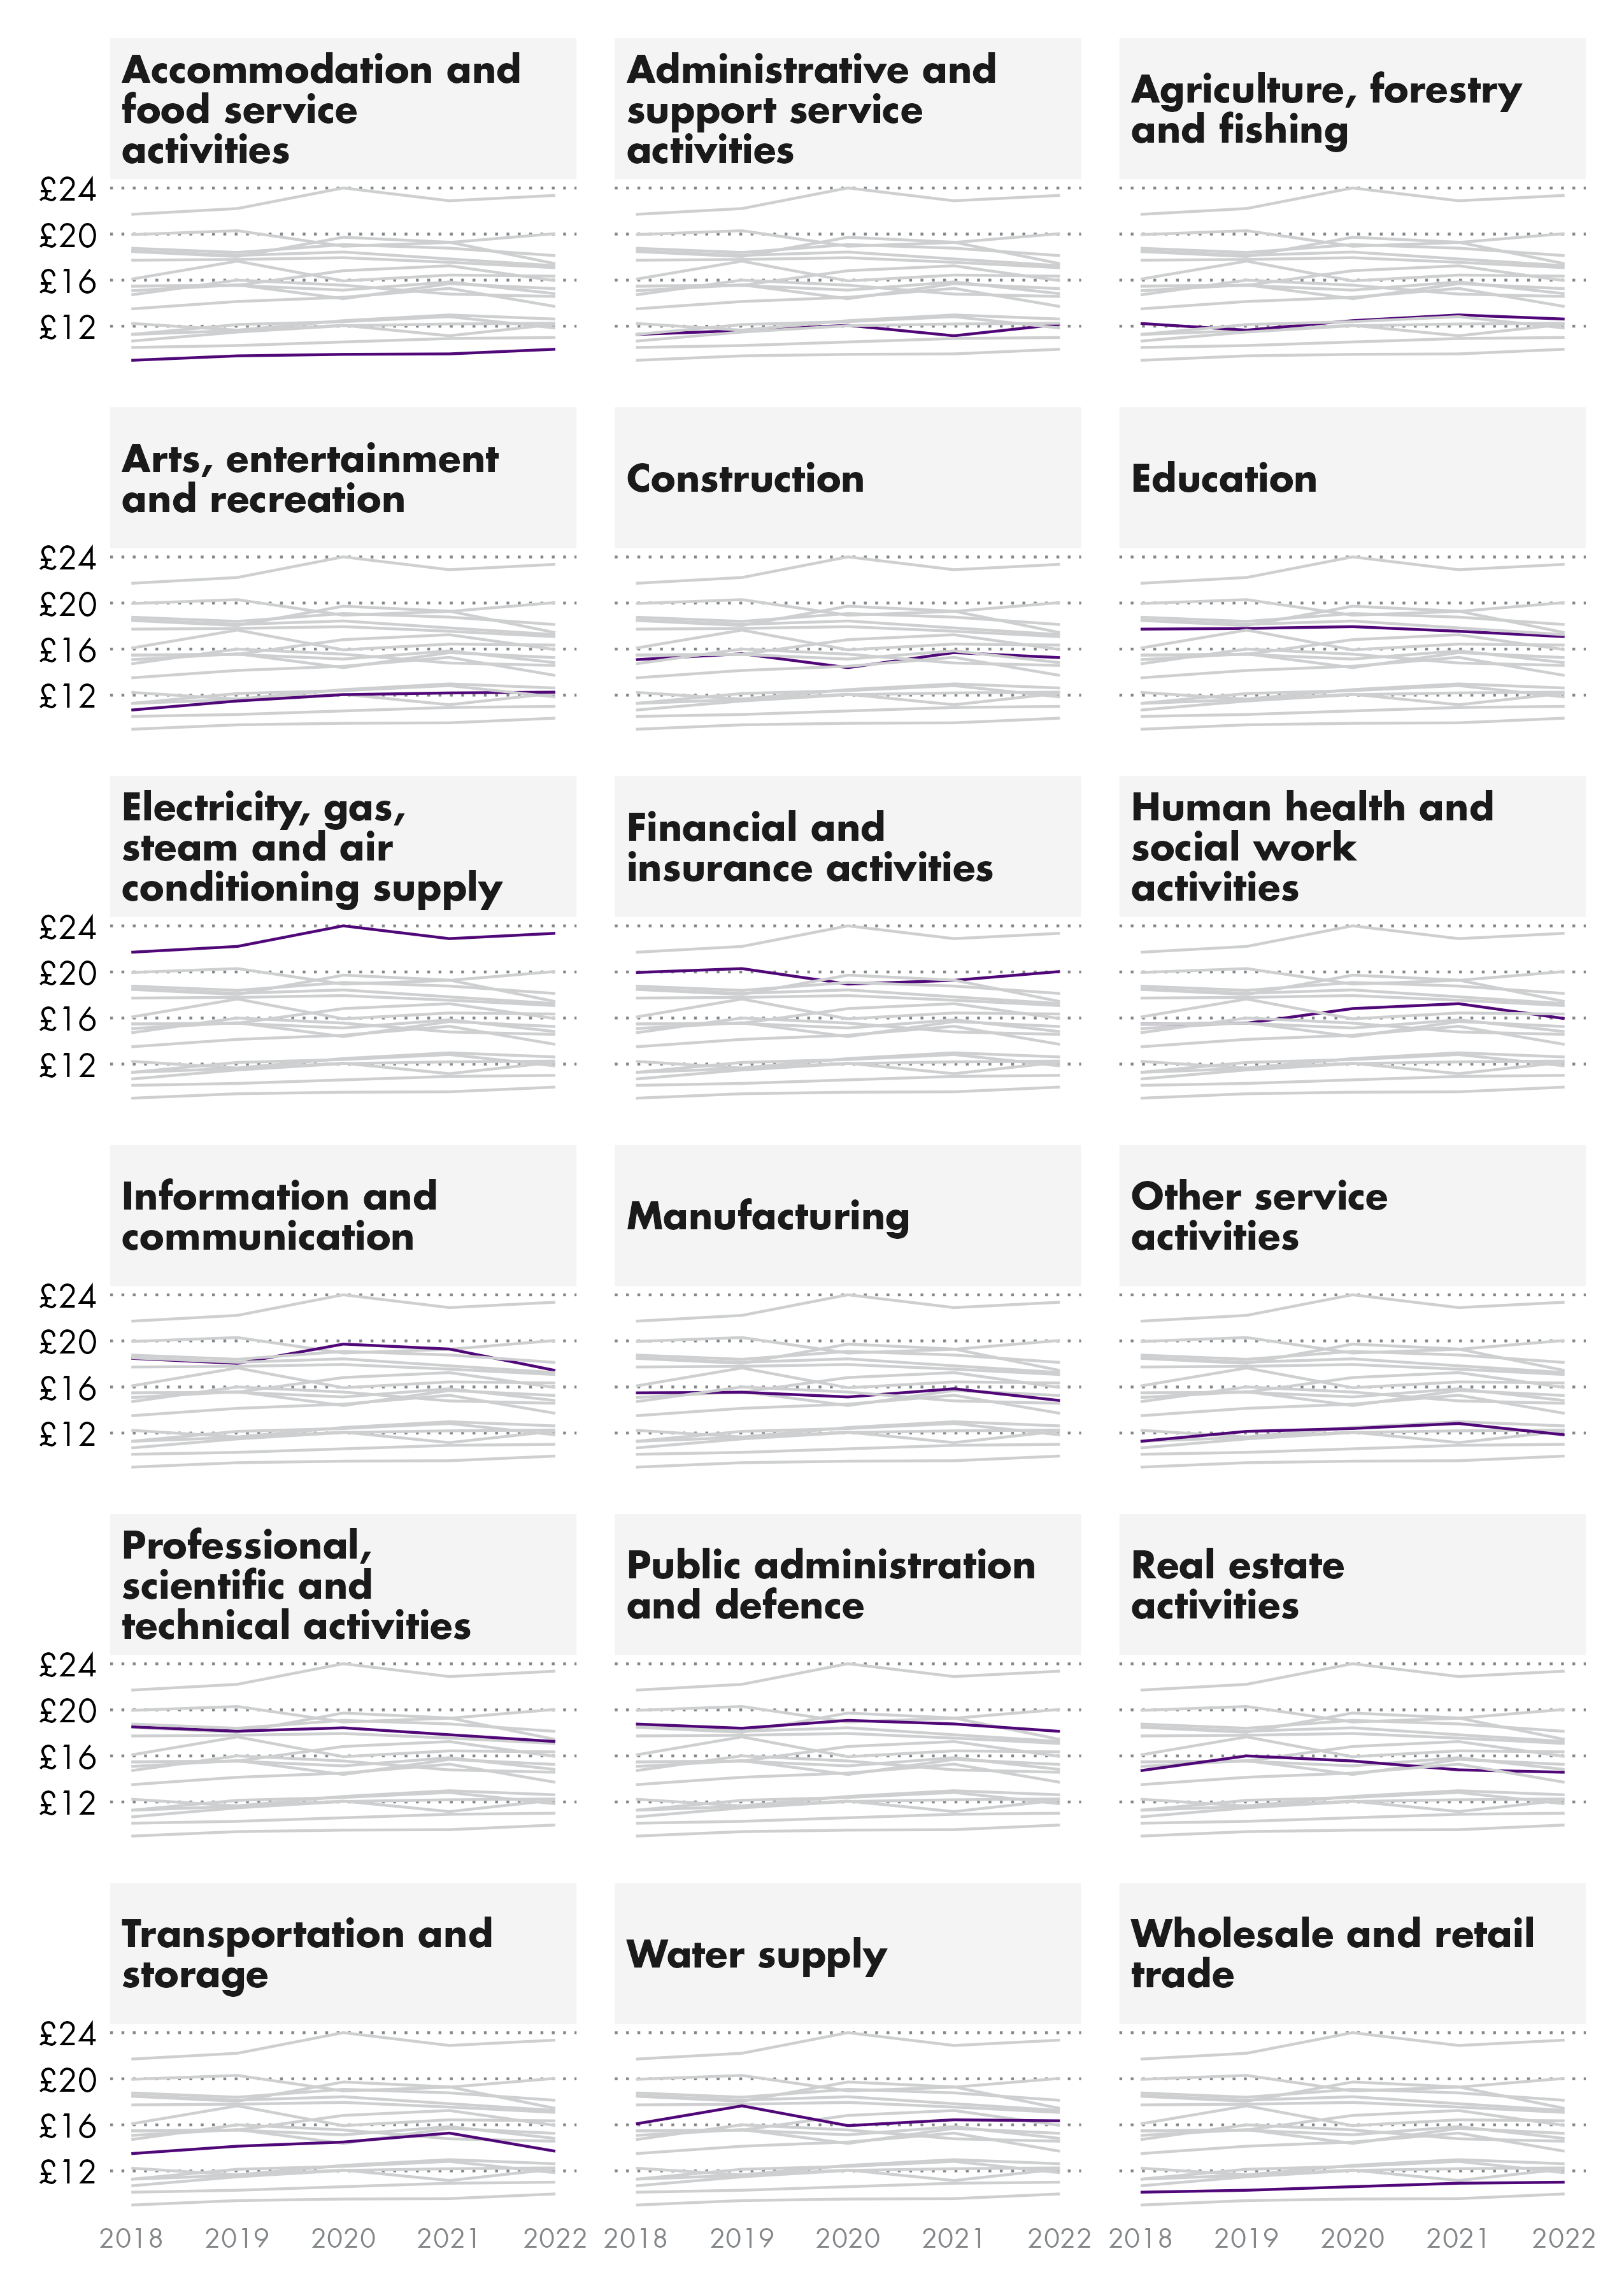
"Arts, entertainment and recreation" saw the highest increase in median hourly pay excluding overtime for all employees, increasing 15% between 2018 and 2022 in real terms, "Accommodation and food services" saw the second highest increase at 11%.
"Professional, scientific and technical activities" saw the largest decrease, falling by 7% between 2018 and 2022
Care should be taken when interpreting these figures due to issues with this year's data. You can find out more in this in the "about the data" section of the briefing.
Pay by occupation
This section looks at pay by occupation in Scotland, using median hourly pay excluding overtime, for all employees, to control for different working patterns and working weeks across occupations.
Fig 28: Median hourly pay excluding overtime for all employees by occupation- 2022
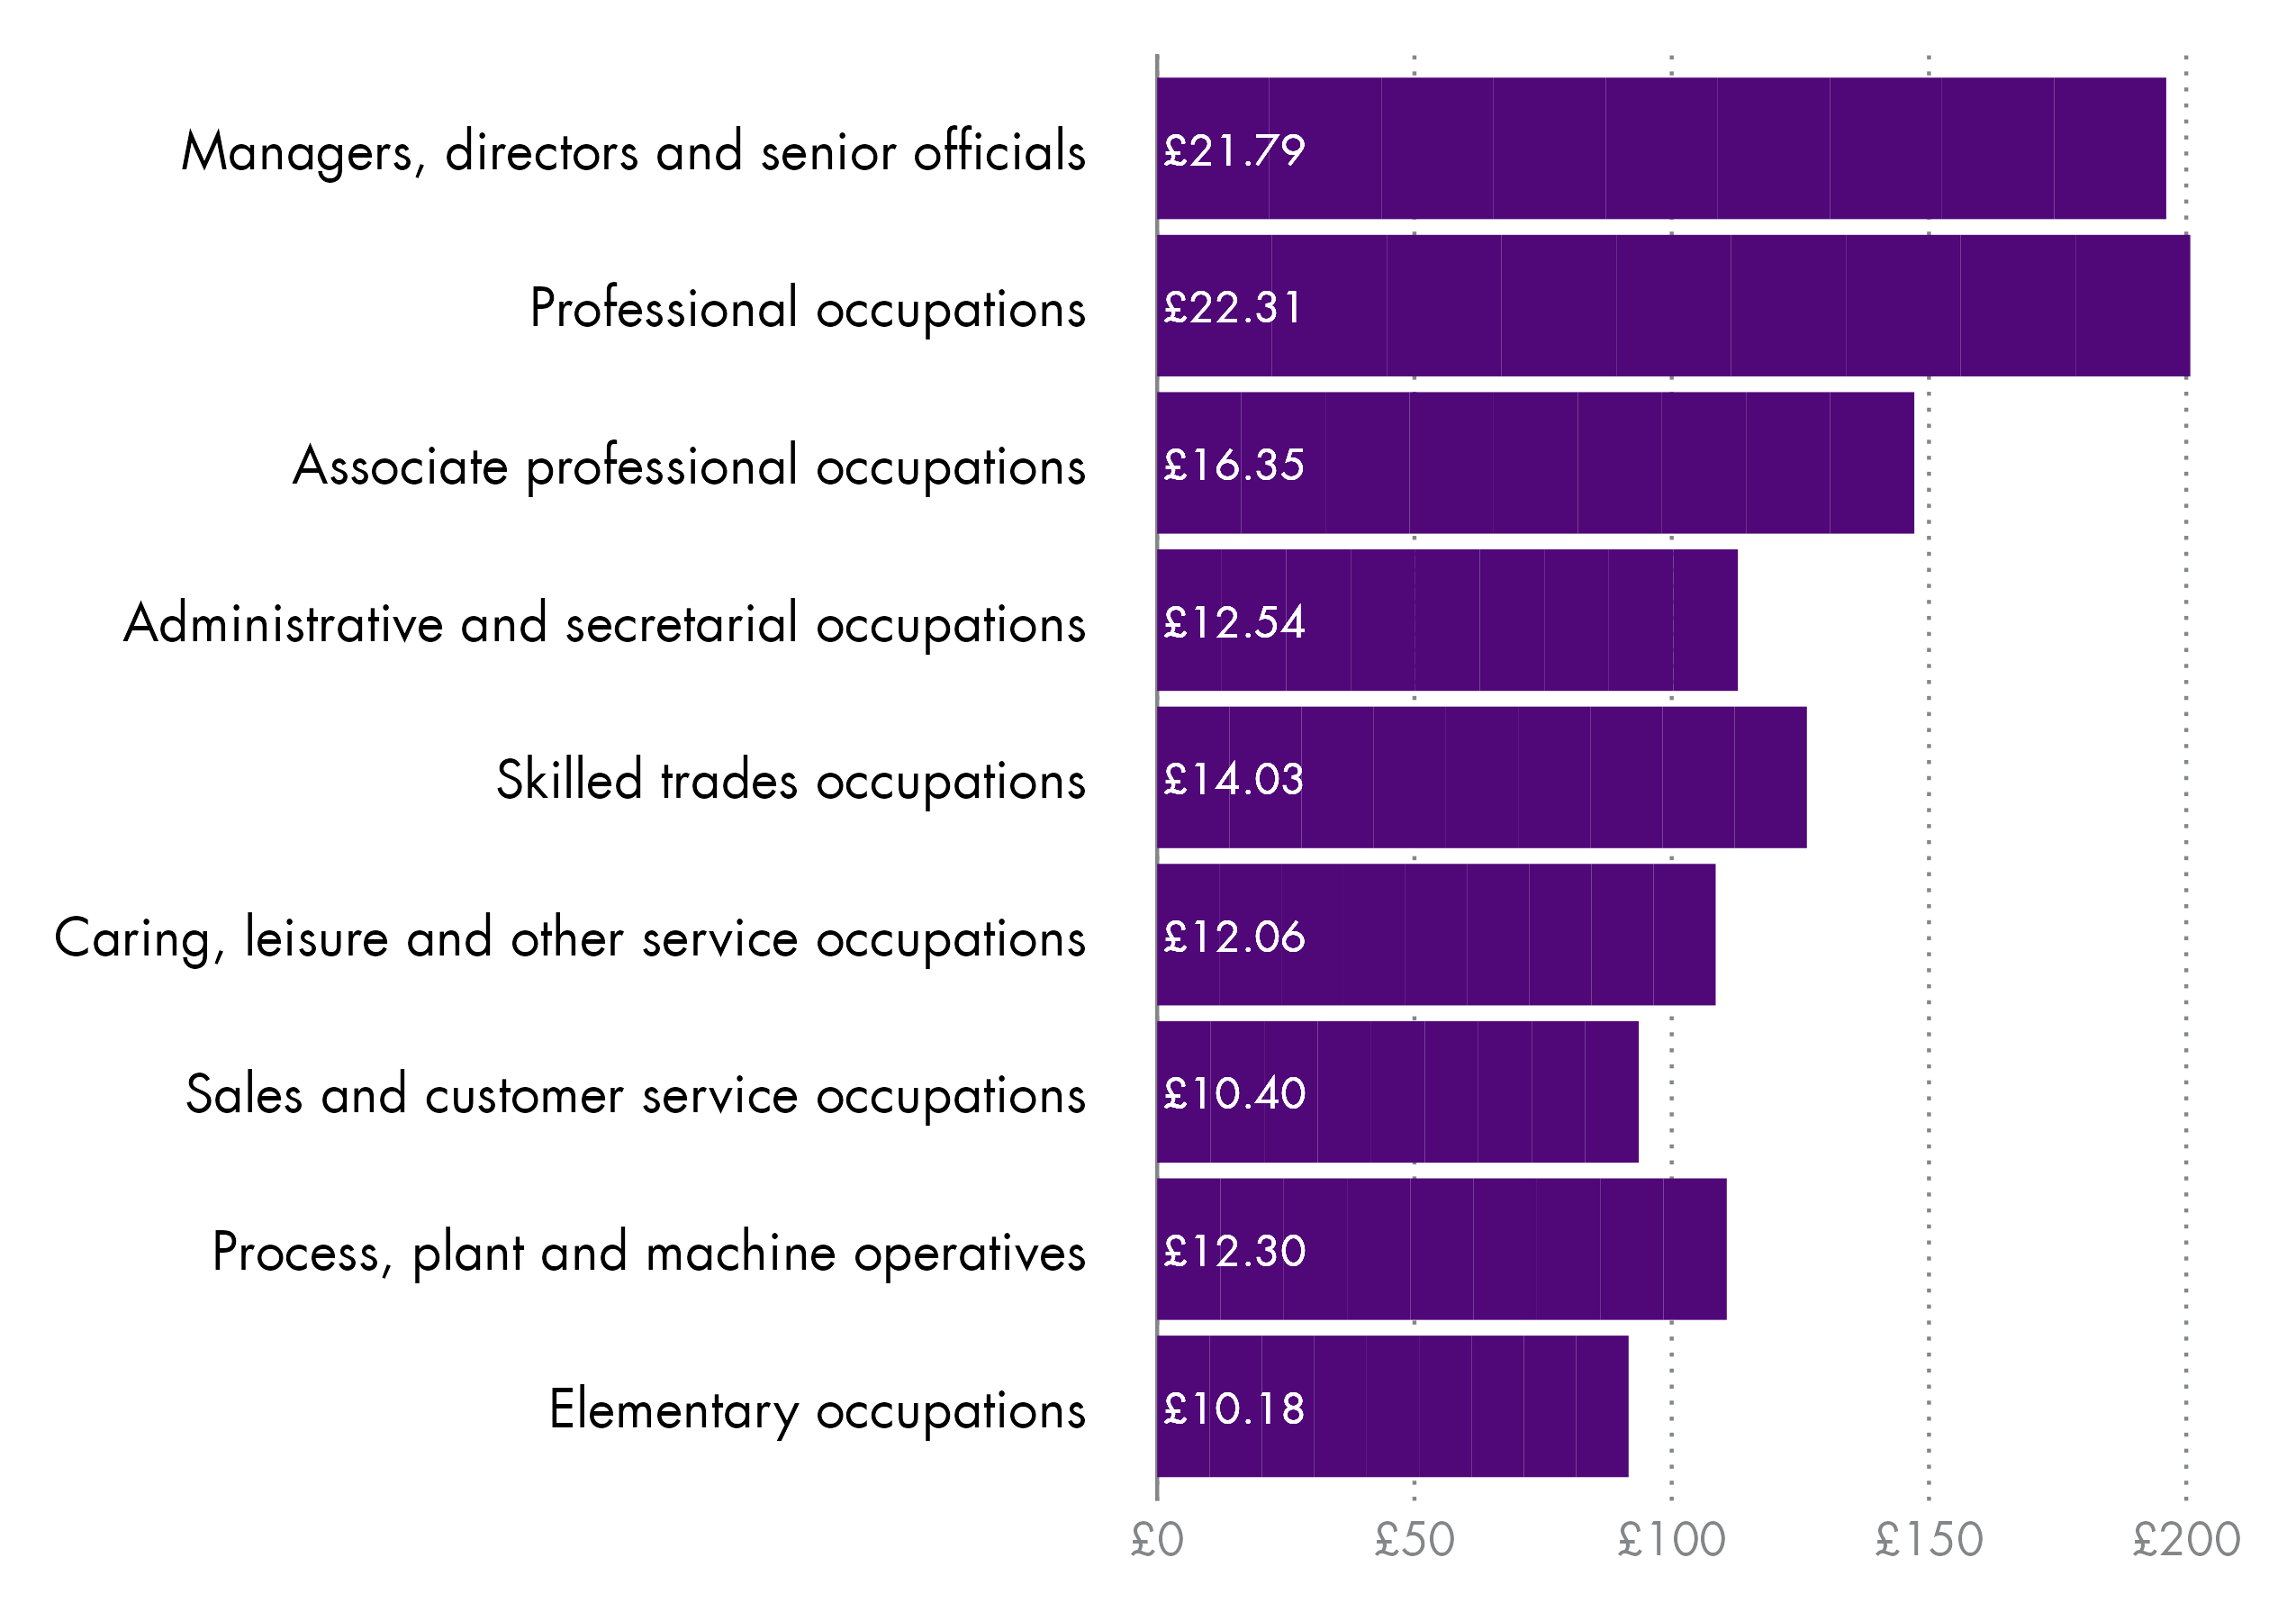
"Professional occupations" in Scotland have the highest median hourly pay, excluding overtime, at £21.79. "Elementary occupations" have the lowest pay at £10.18.
Fig 30: Real terms median hourly pay excluding overtime for all employees by occupation - 2018 to 2022
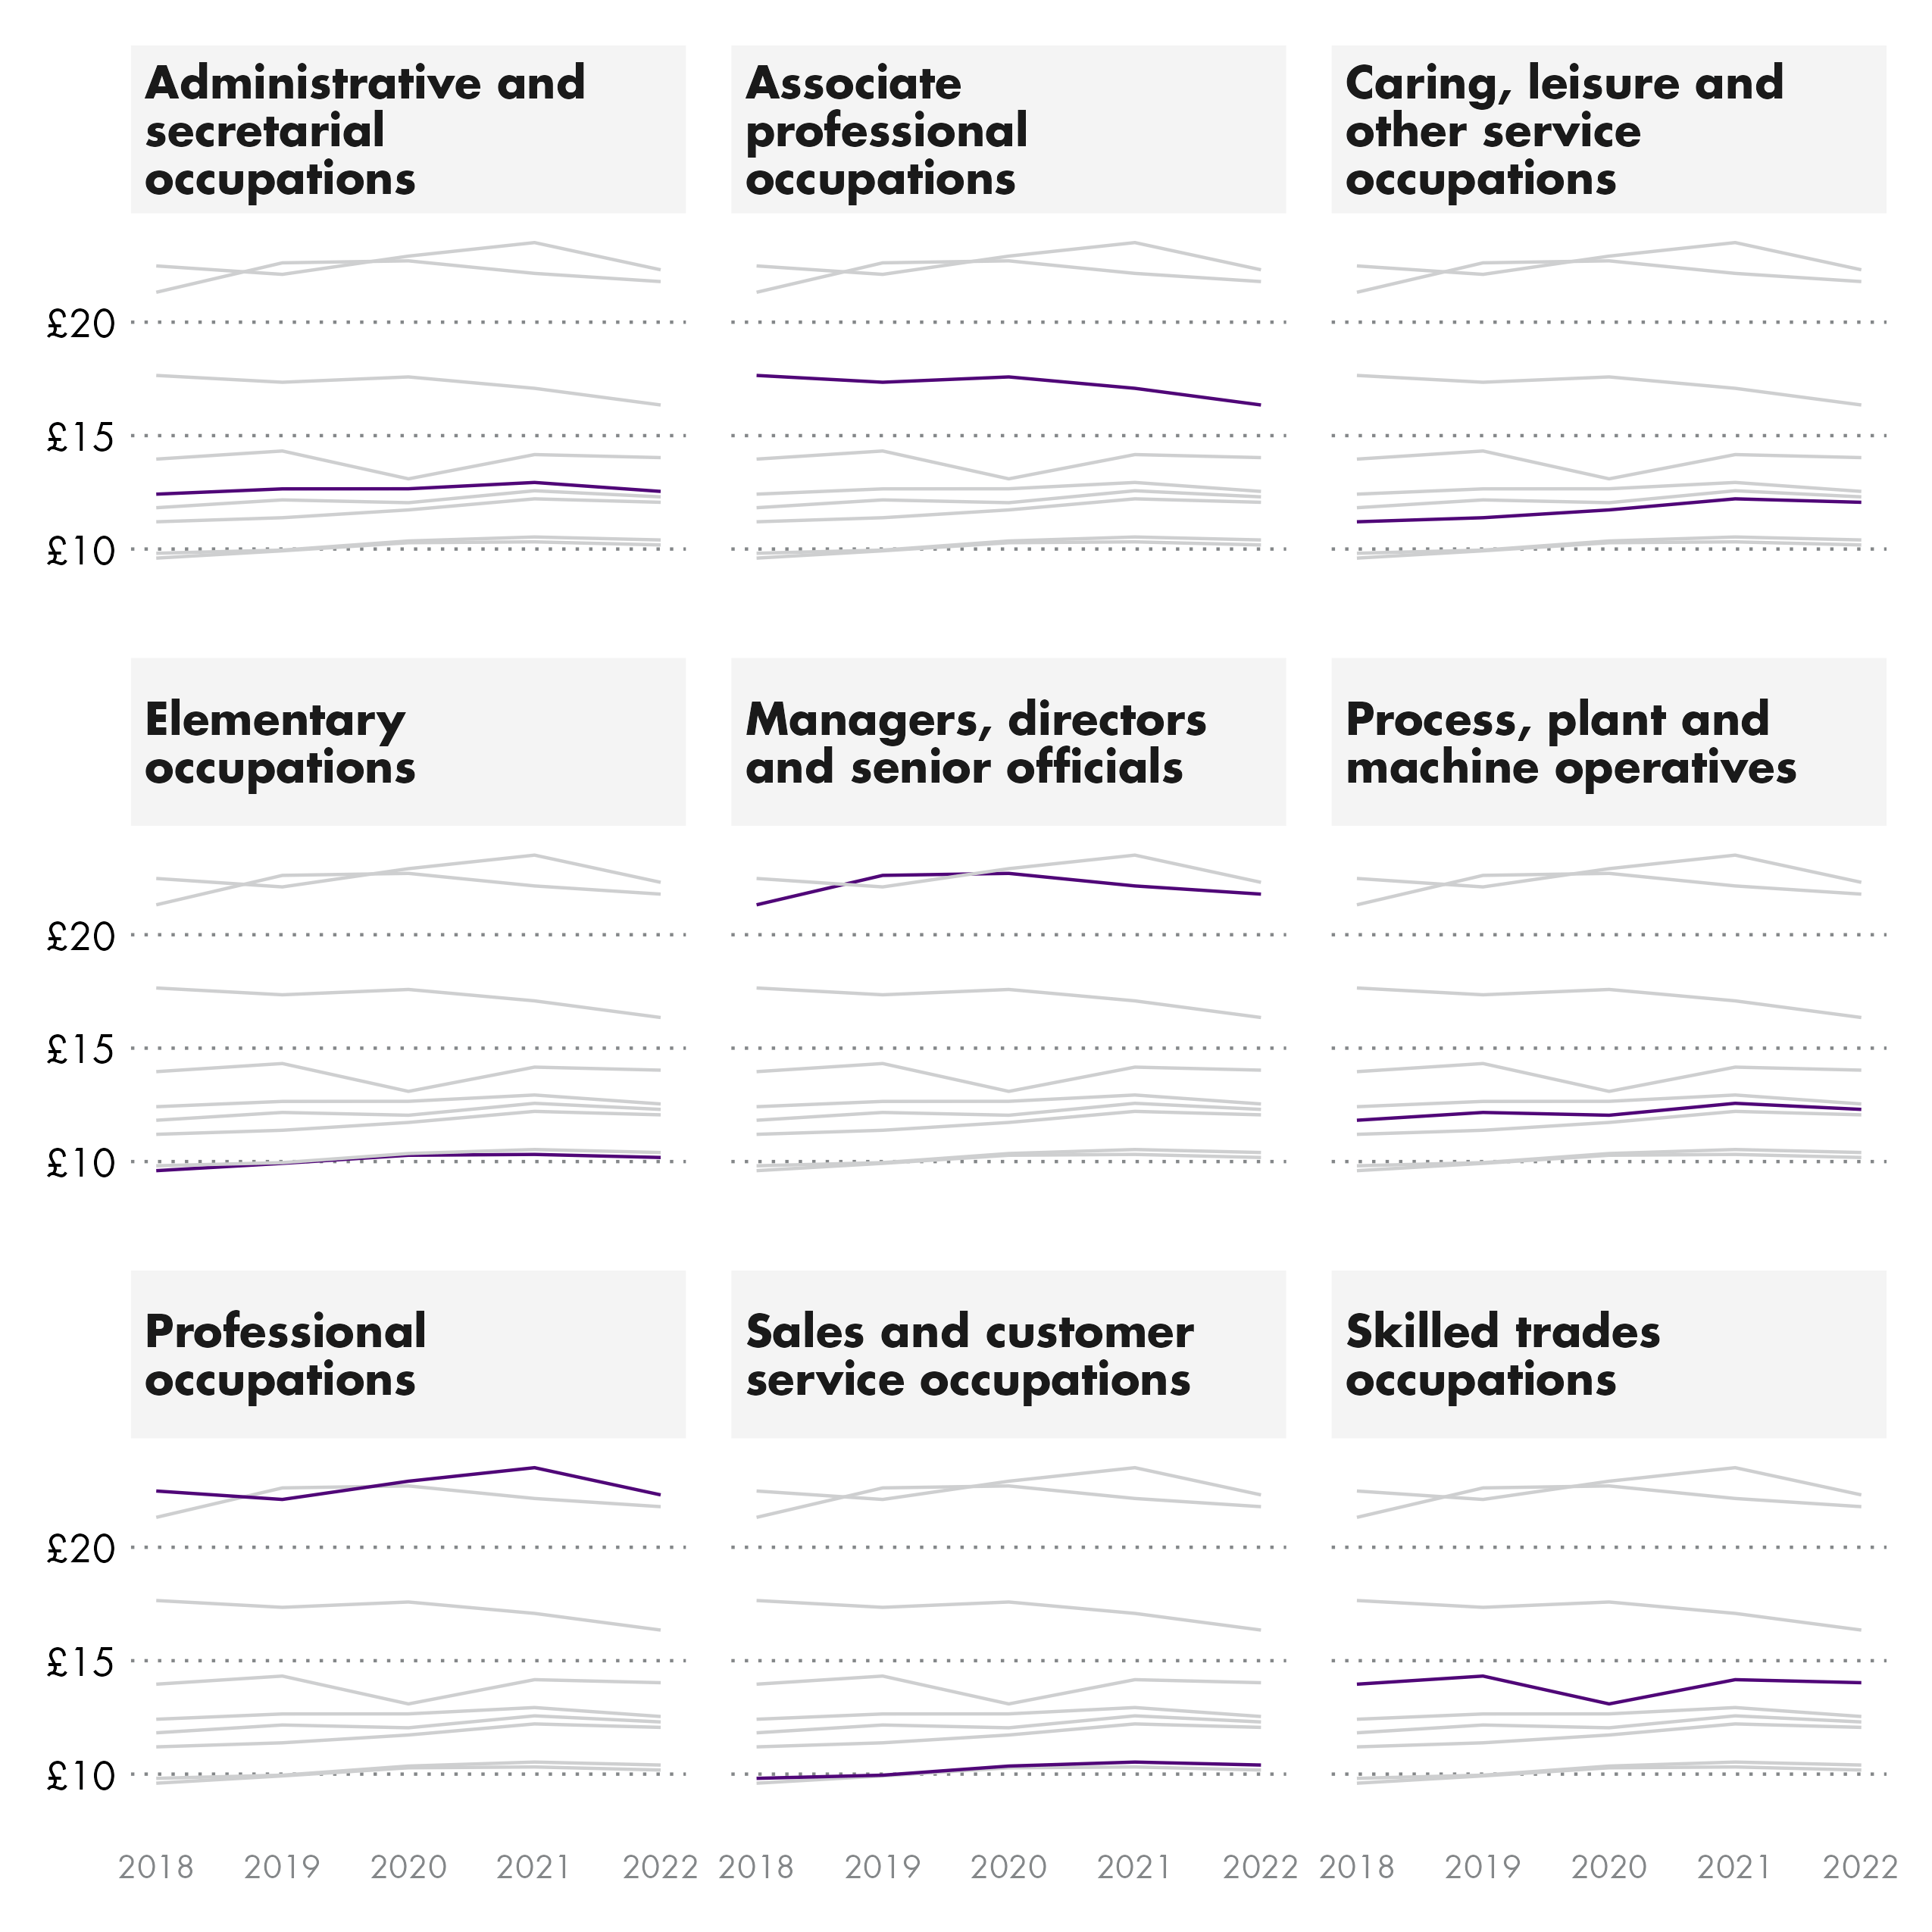
Between 2018 and 2022 real terms median hourly pay excluding overtime saw:
Largest increase - "Caring, leisure and other service occupations" grew by 7.7%.
Largest decrease - "Associate professional occupations" saw the largest decrease at 7.4%. The only other occupation group to see a decrease was "Professional occupations"
Care should be taken when interpreting these figures due to issues with this year's data. You can find out more in this in the "about the data" section of the briefing.
Pay by sector
The reasons for the differences in private and public sector pay levels are complex. According to the ONS this is "because of the different jobs and characteristics of the people within each sector". To address some of these issues, hourly pay excluding overtime is used for comparing the public and private sectors. This helps to control for the difference in the length of the working week.
Fig 31: Median hourly pay excluding overtime for all employees by sector - 2022
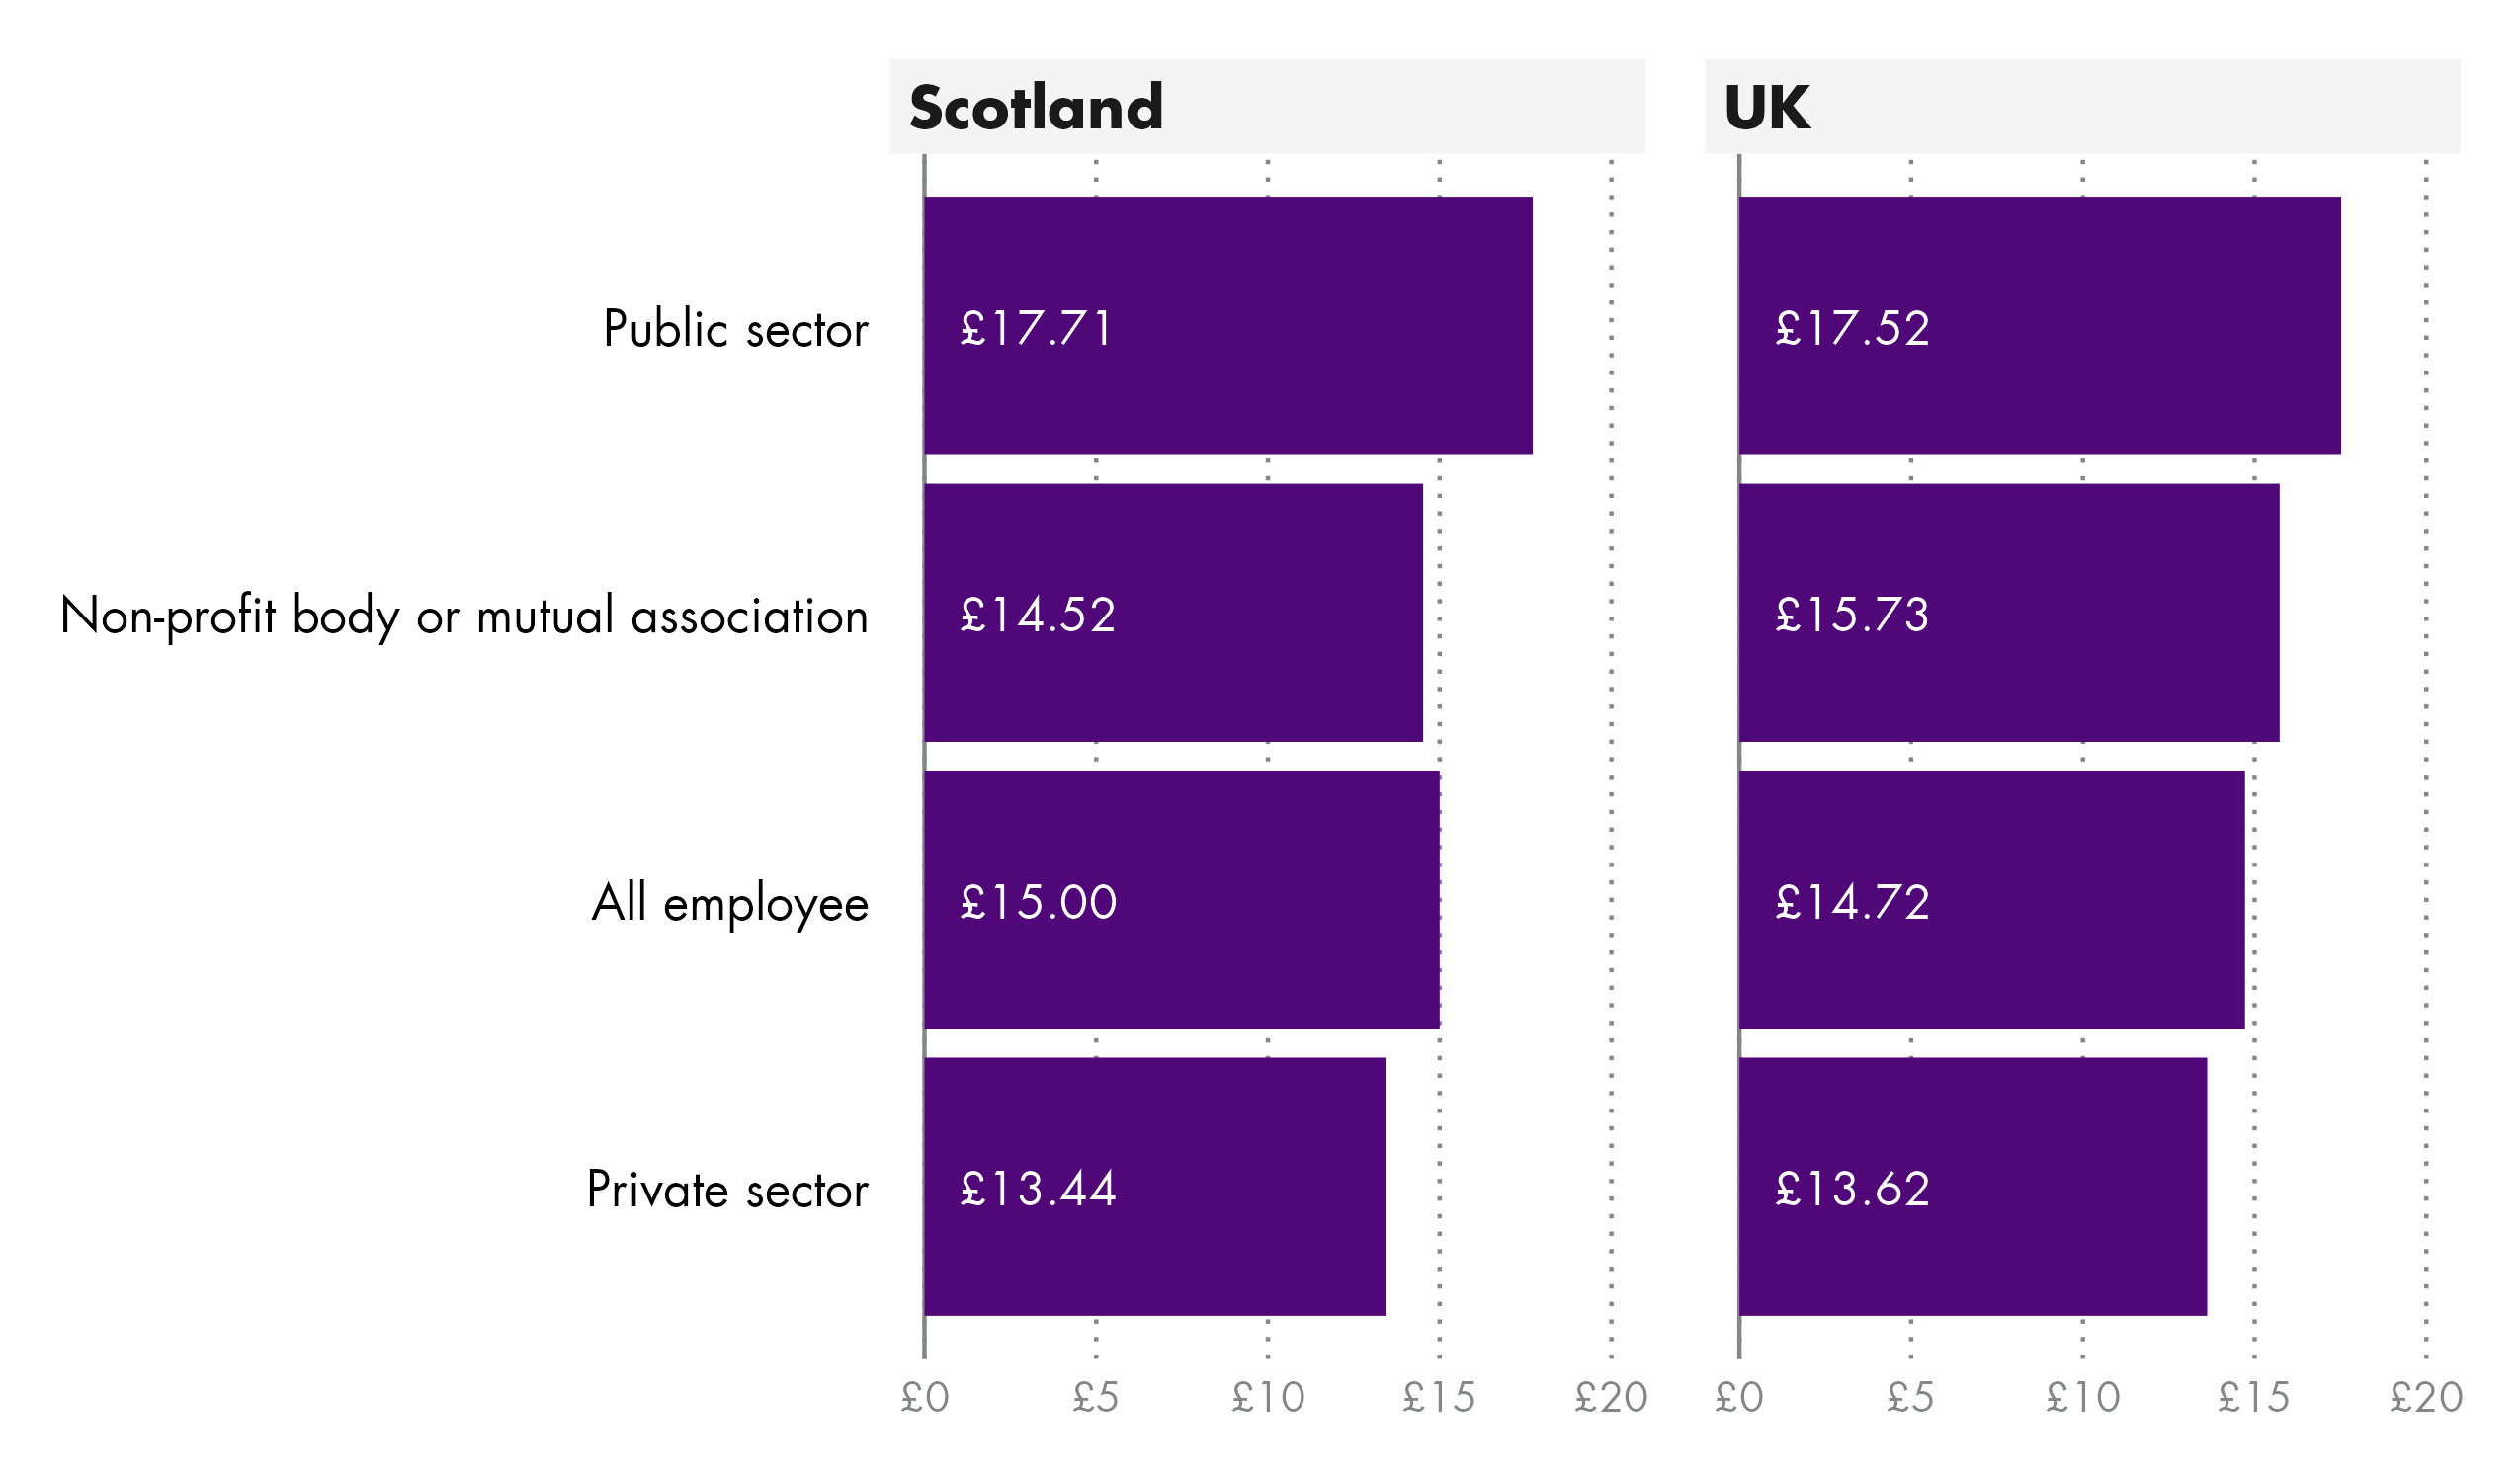
In both Scotland and the UK as a whole, the public sector has a higher median hourly pay, excluding overtime. The public sector in Scotland has a higher median hourly pay that the UK as whole, while the private sector the figure is lower in Scotland than the UK as a whole.
Fig 32: Real terms median hourly pay excluding overtime for all employees by sector - 2018 to 2022
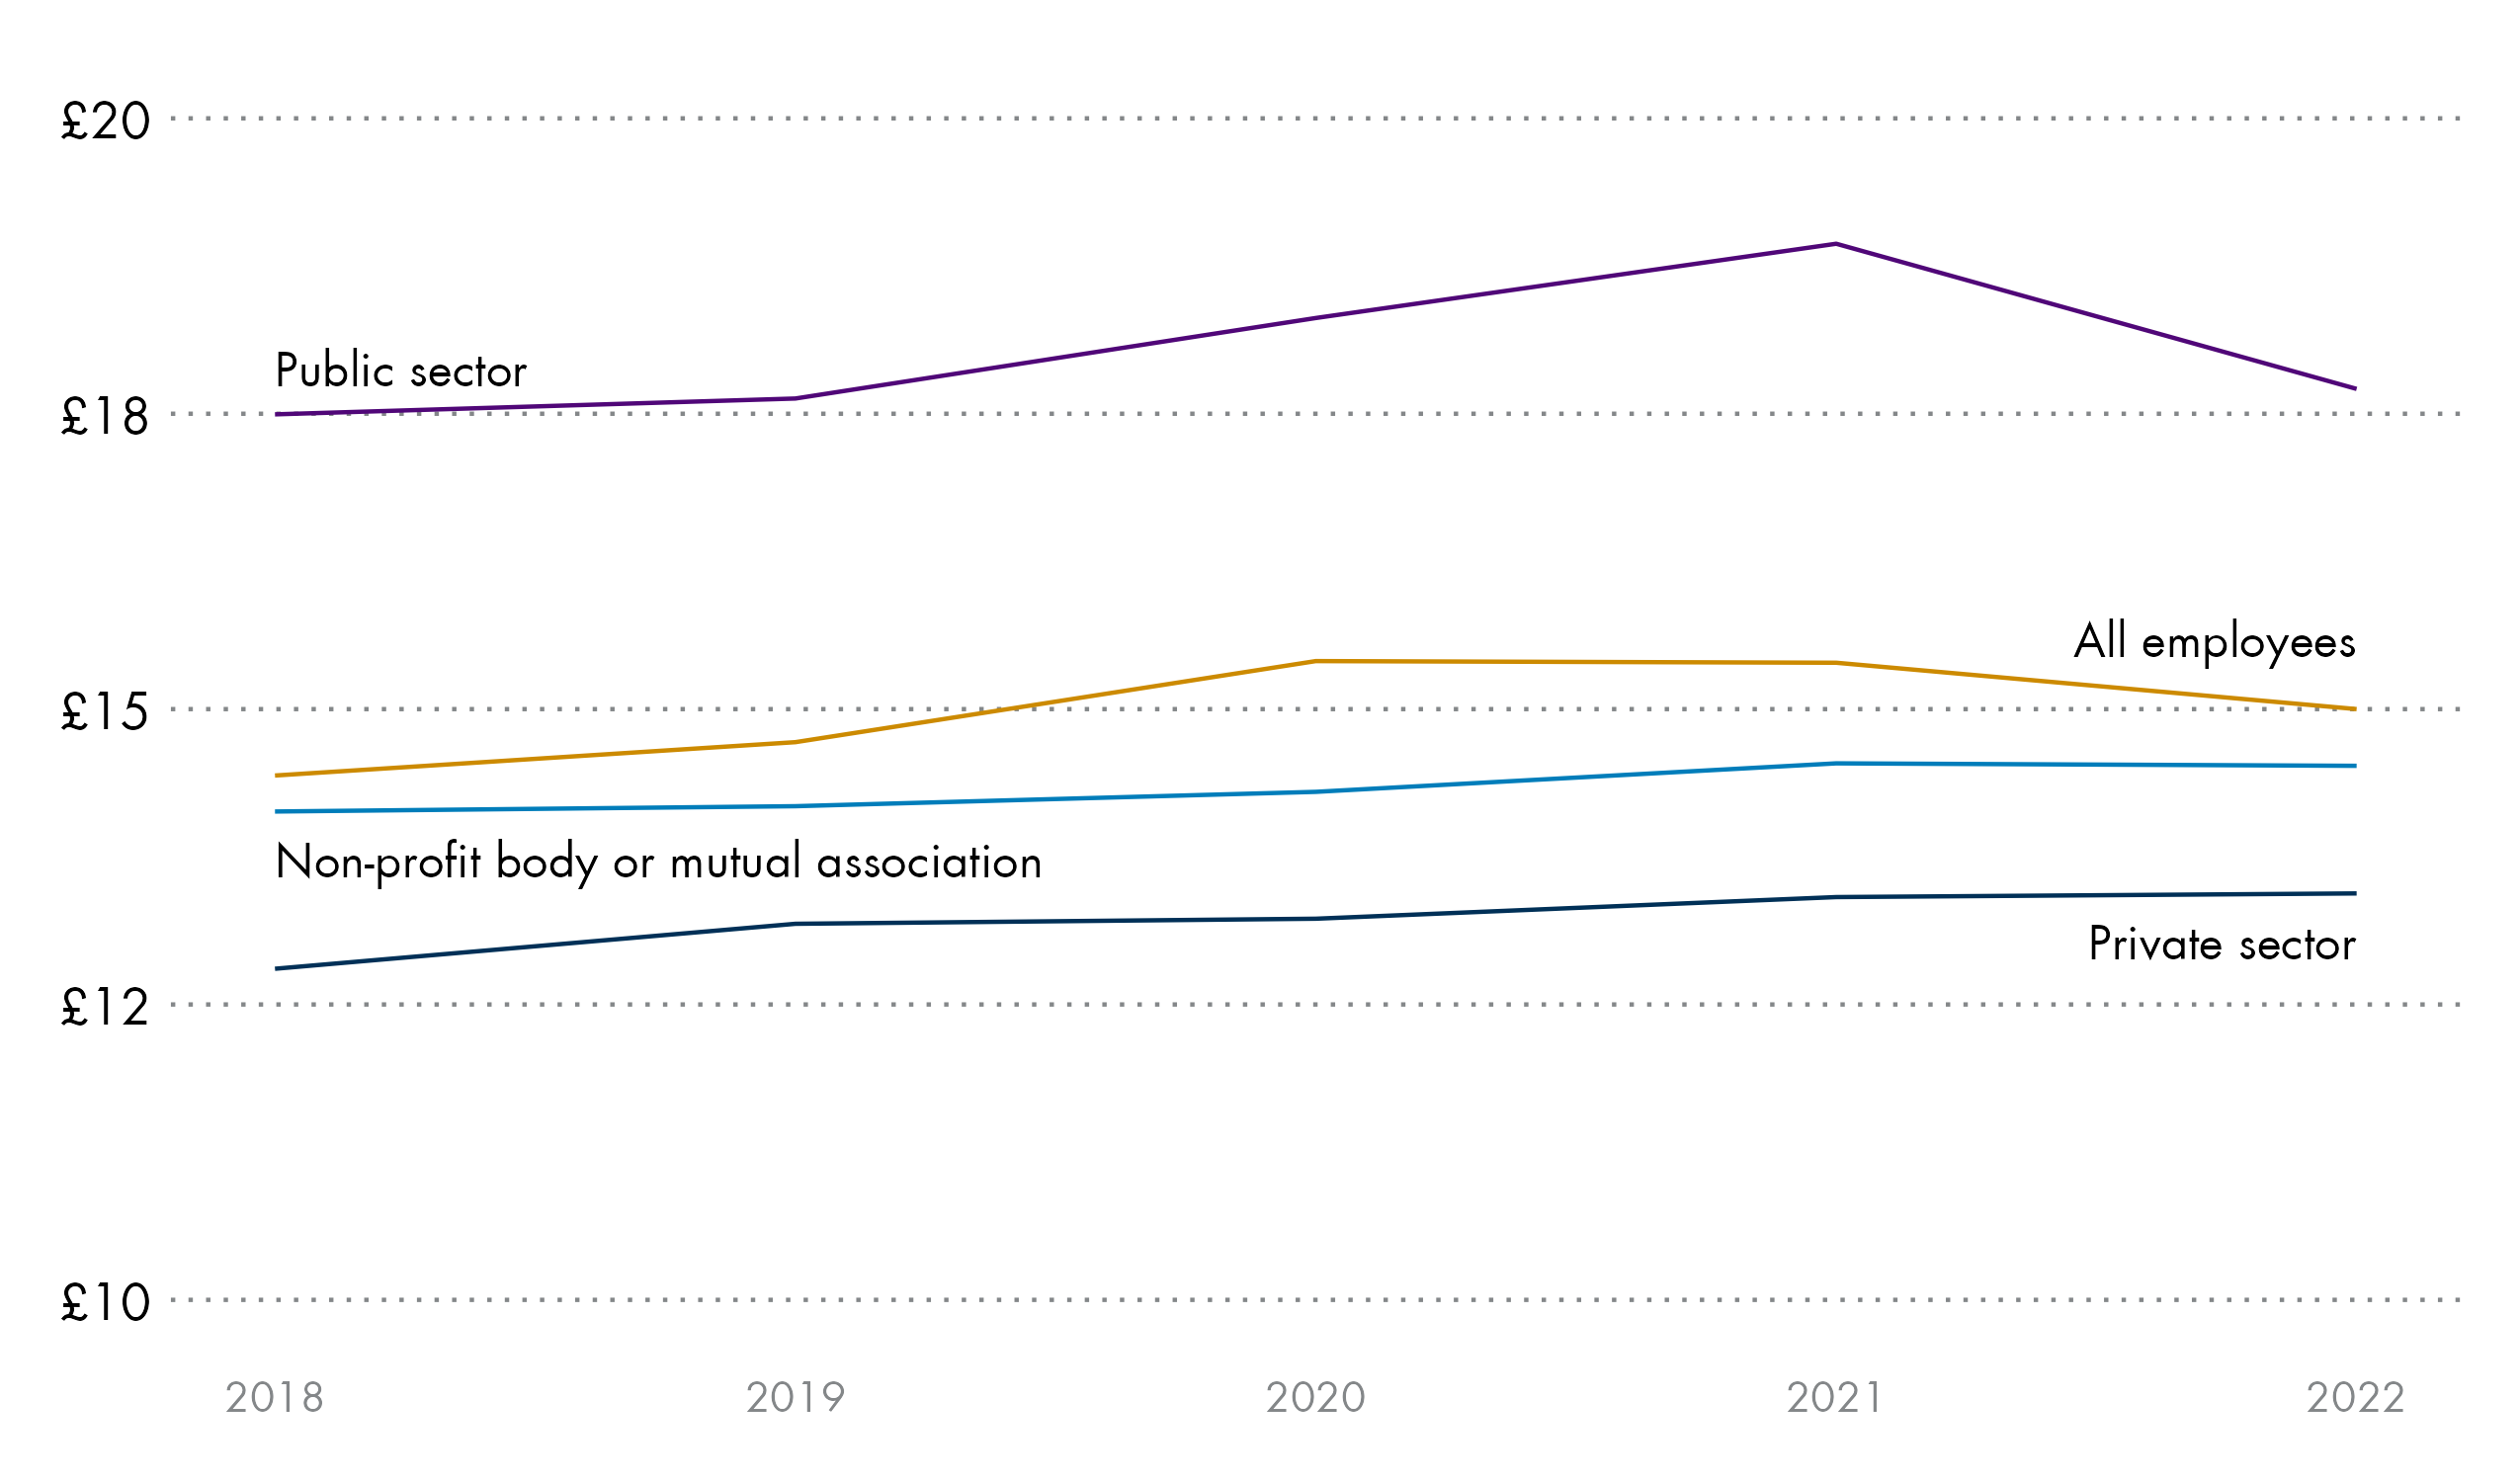
Between 2018 and 2022, median hourly pay excluding overtime for the private sector increased by 5.0% in real terms, compared to 1.2% in the public sector.
Care should be taken when interpreting these figures due to issues with this year's data. You can find out more in this in the "about the data" section of the briefing.
Pay by local authority area
ASHE provides figures on pay by local authority for those who live in the area, and those who work in the area. This section uses median hourly pay excluding overtime for all employees, to control for structural differences in local authority economies.
Fig 33: Median hourly pay excluding overtime for all employees by local authority and by where people work and where people live - 2022
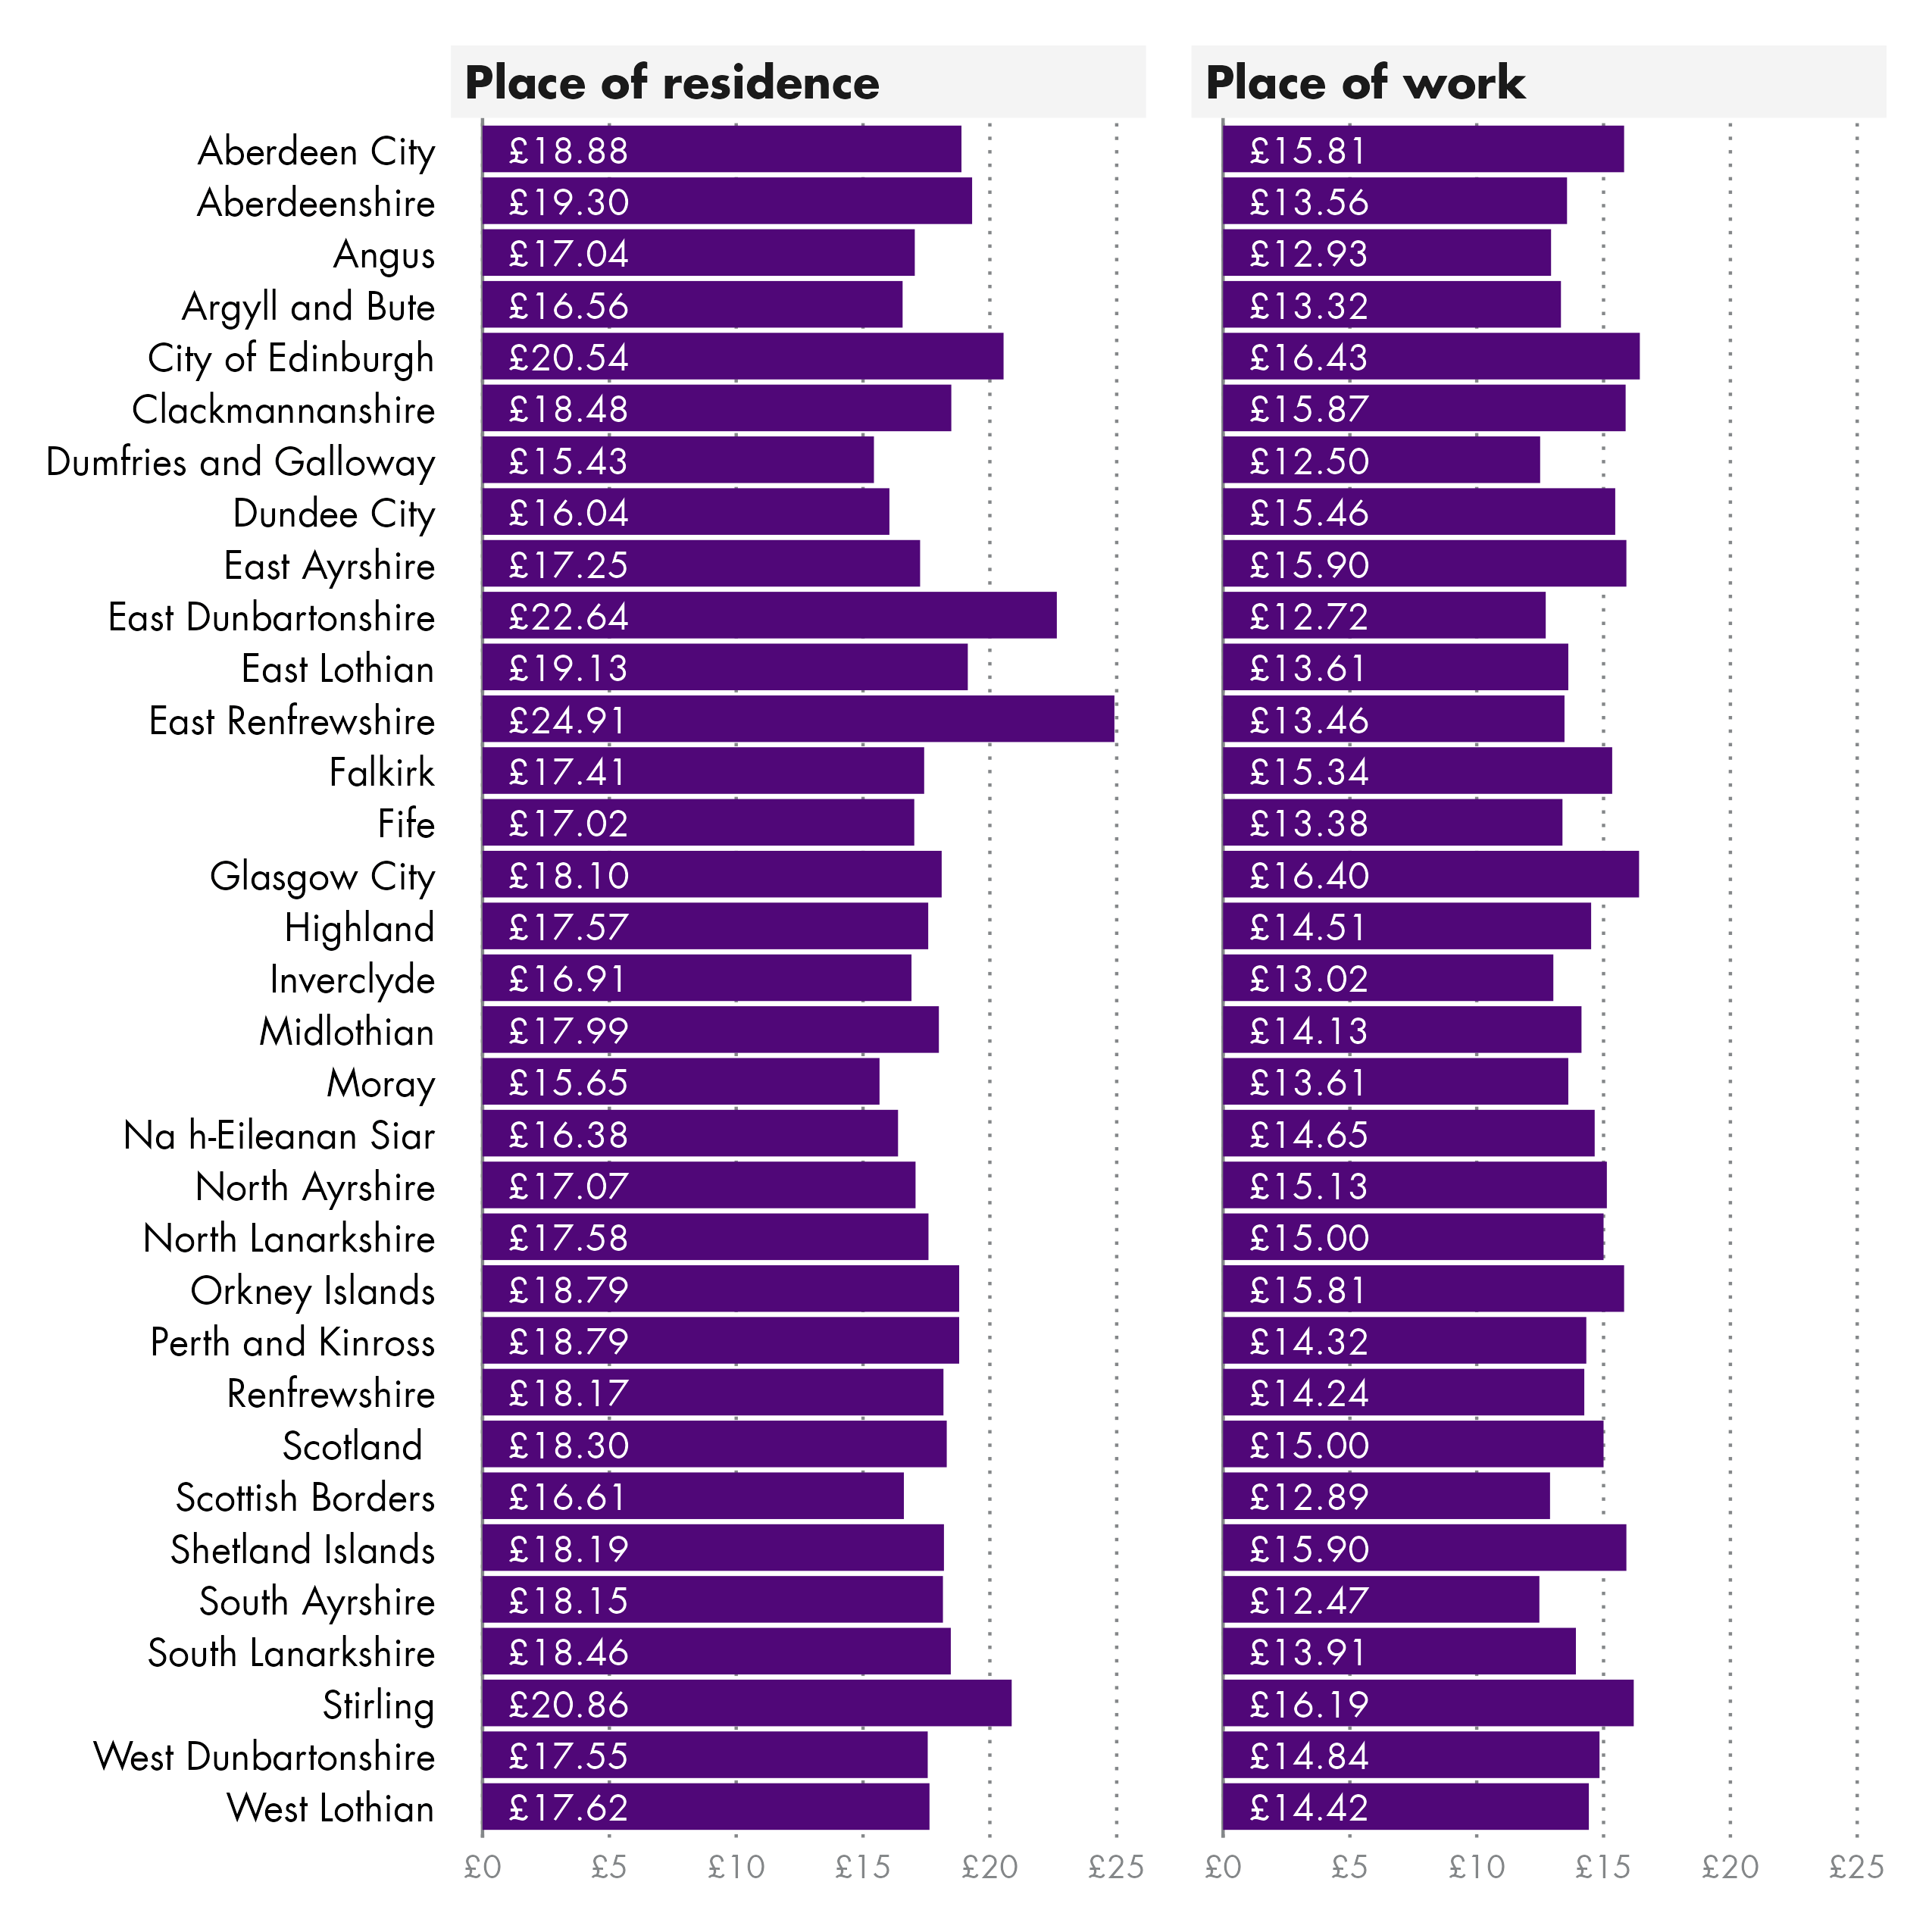
When looking at median hourly pay excluding overtime for where people live, East Renfrewshire has the highest pay at £24.91 per hour, and Dumfries and Galloway has the lowest, at £15.43 per hour. Most areas with high pay by this measure tend to have a high number of commuters.
When looking at the median hourly pay excluding overtime for where people work, the City of Edinburgh has the highest pay at £16.43 an hour. South Ayrshire has the lowest at £12.47 an hour. Glasgow, Stirling, East Ayrshire and Shetland make up the rest of the top five for highest paid work places.
Care should be taken when interpreting these figures due to issues with this year's data. You can find out more in this in the "about the data" section of the briefing.
Sources
Office for National Statistics. (2022, October 26). Employee earnings in the UK: 2022. Retrieved from <a href="https://www.ons.gov.uk/employmentandlabourmarket/peopleinwork/earningsandworkinghours/bulletins/annualsurveyofhoursandearnings/2022" target="_blank">https://www.ons.gov.uk/employmentandlabourmarket/peopleinwork/earningsandworkinghours/bulletins/annualsurveyofhoursandearnings/2022</a> [accessed 16 January 2023]