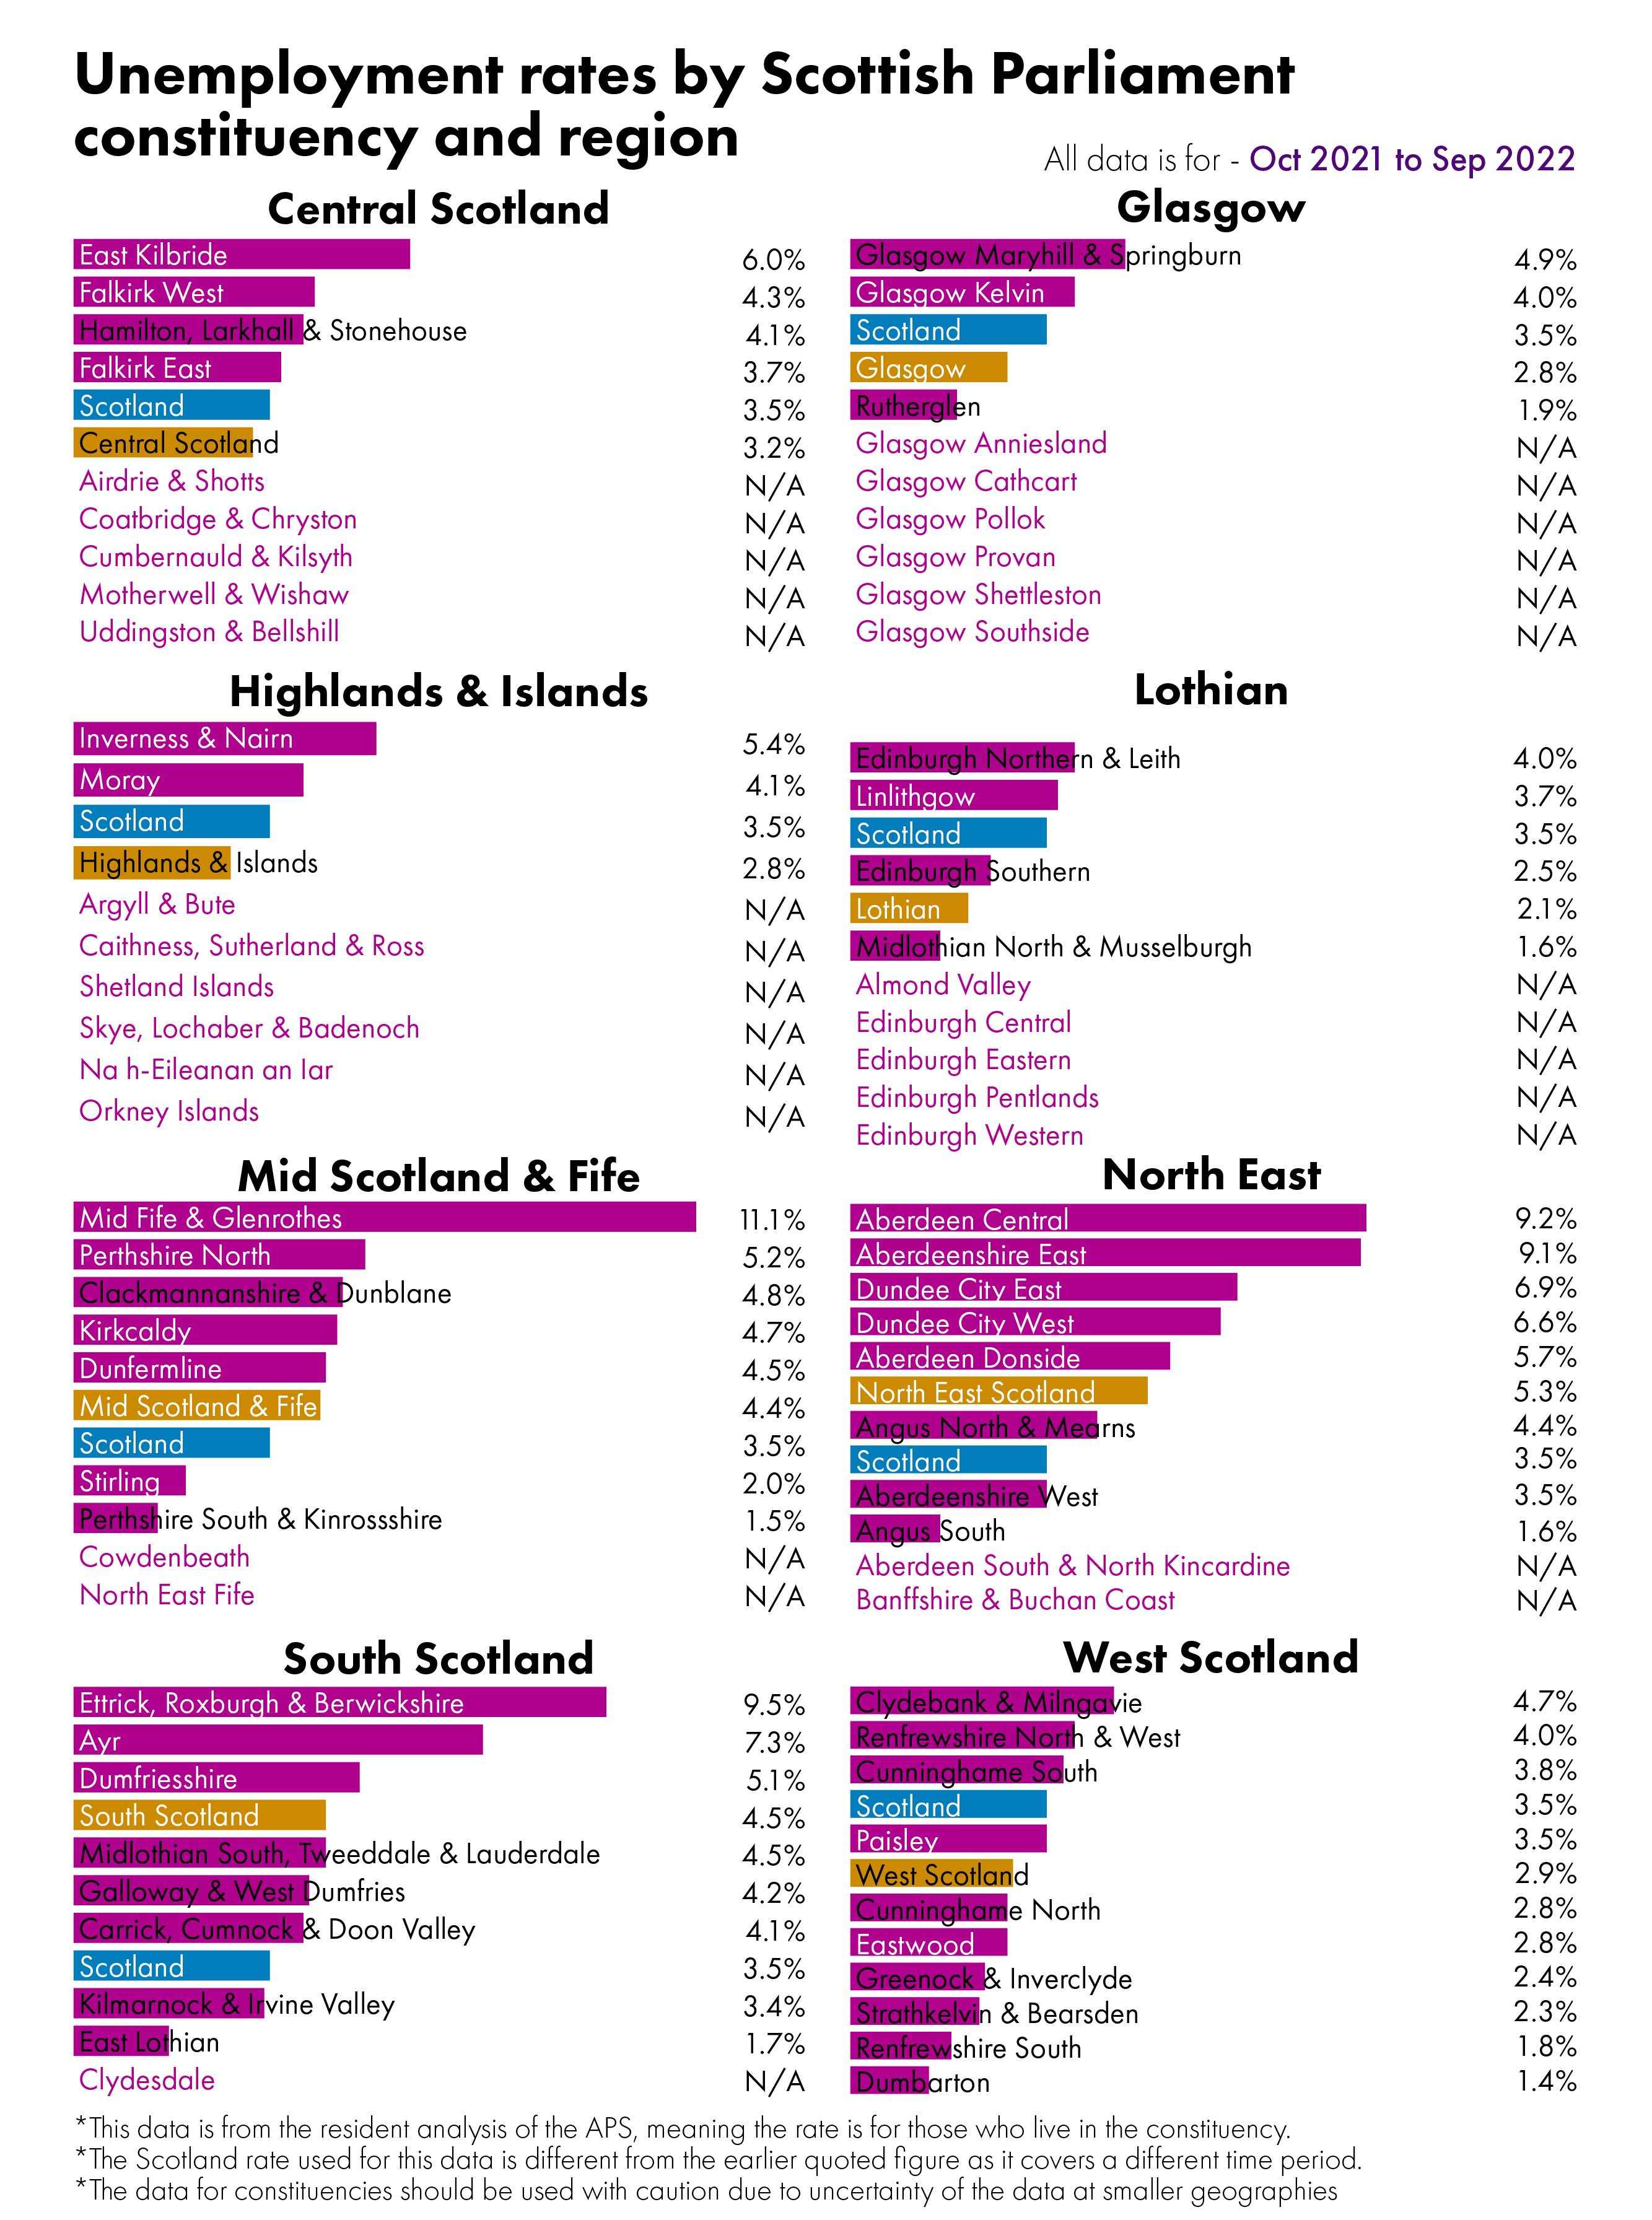
Labour market update: January 2023
This infographic looks at the latest labour market data for Scotland from the Office for National Statistics.
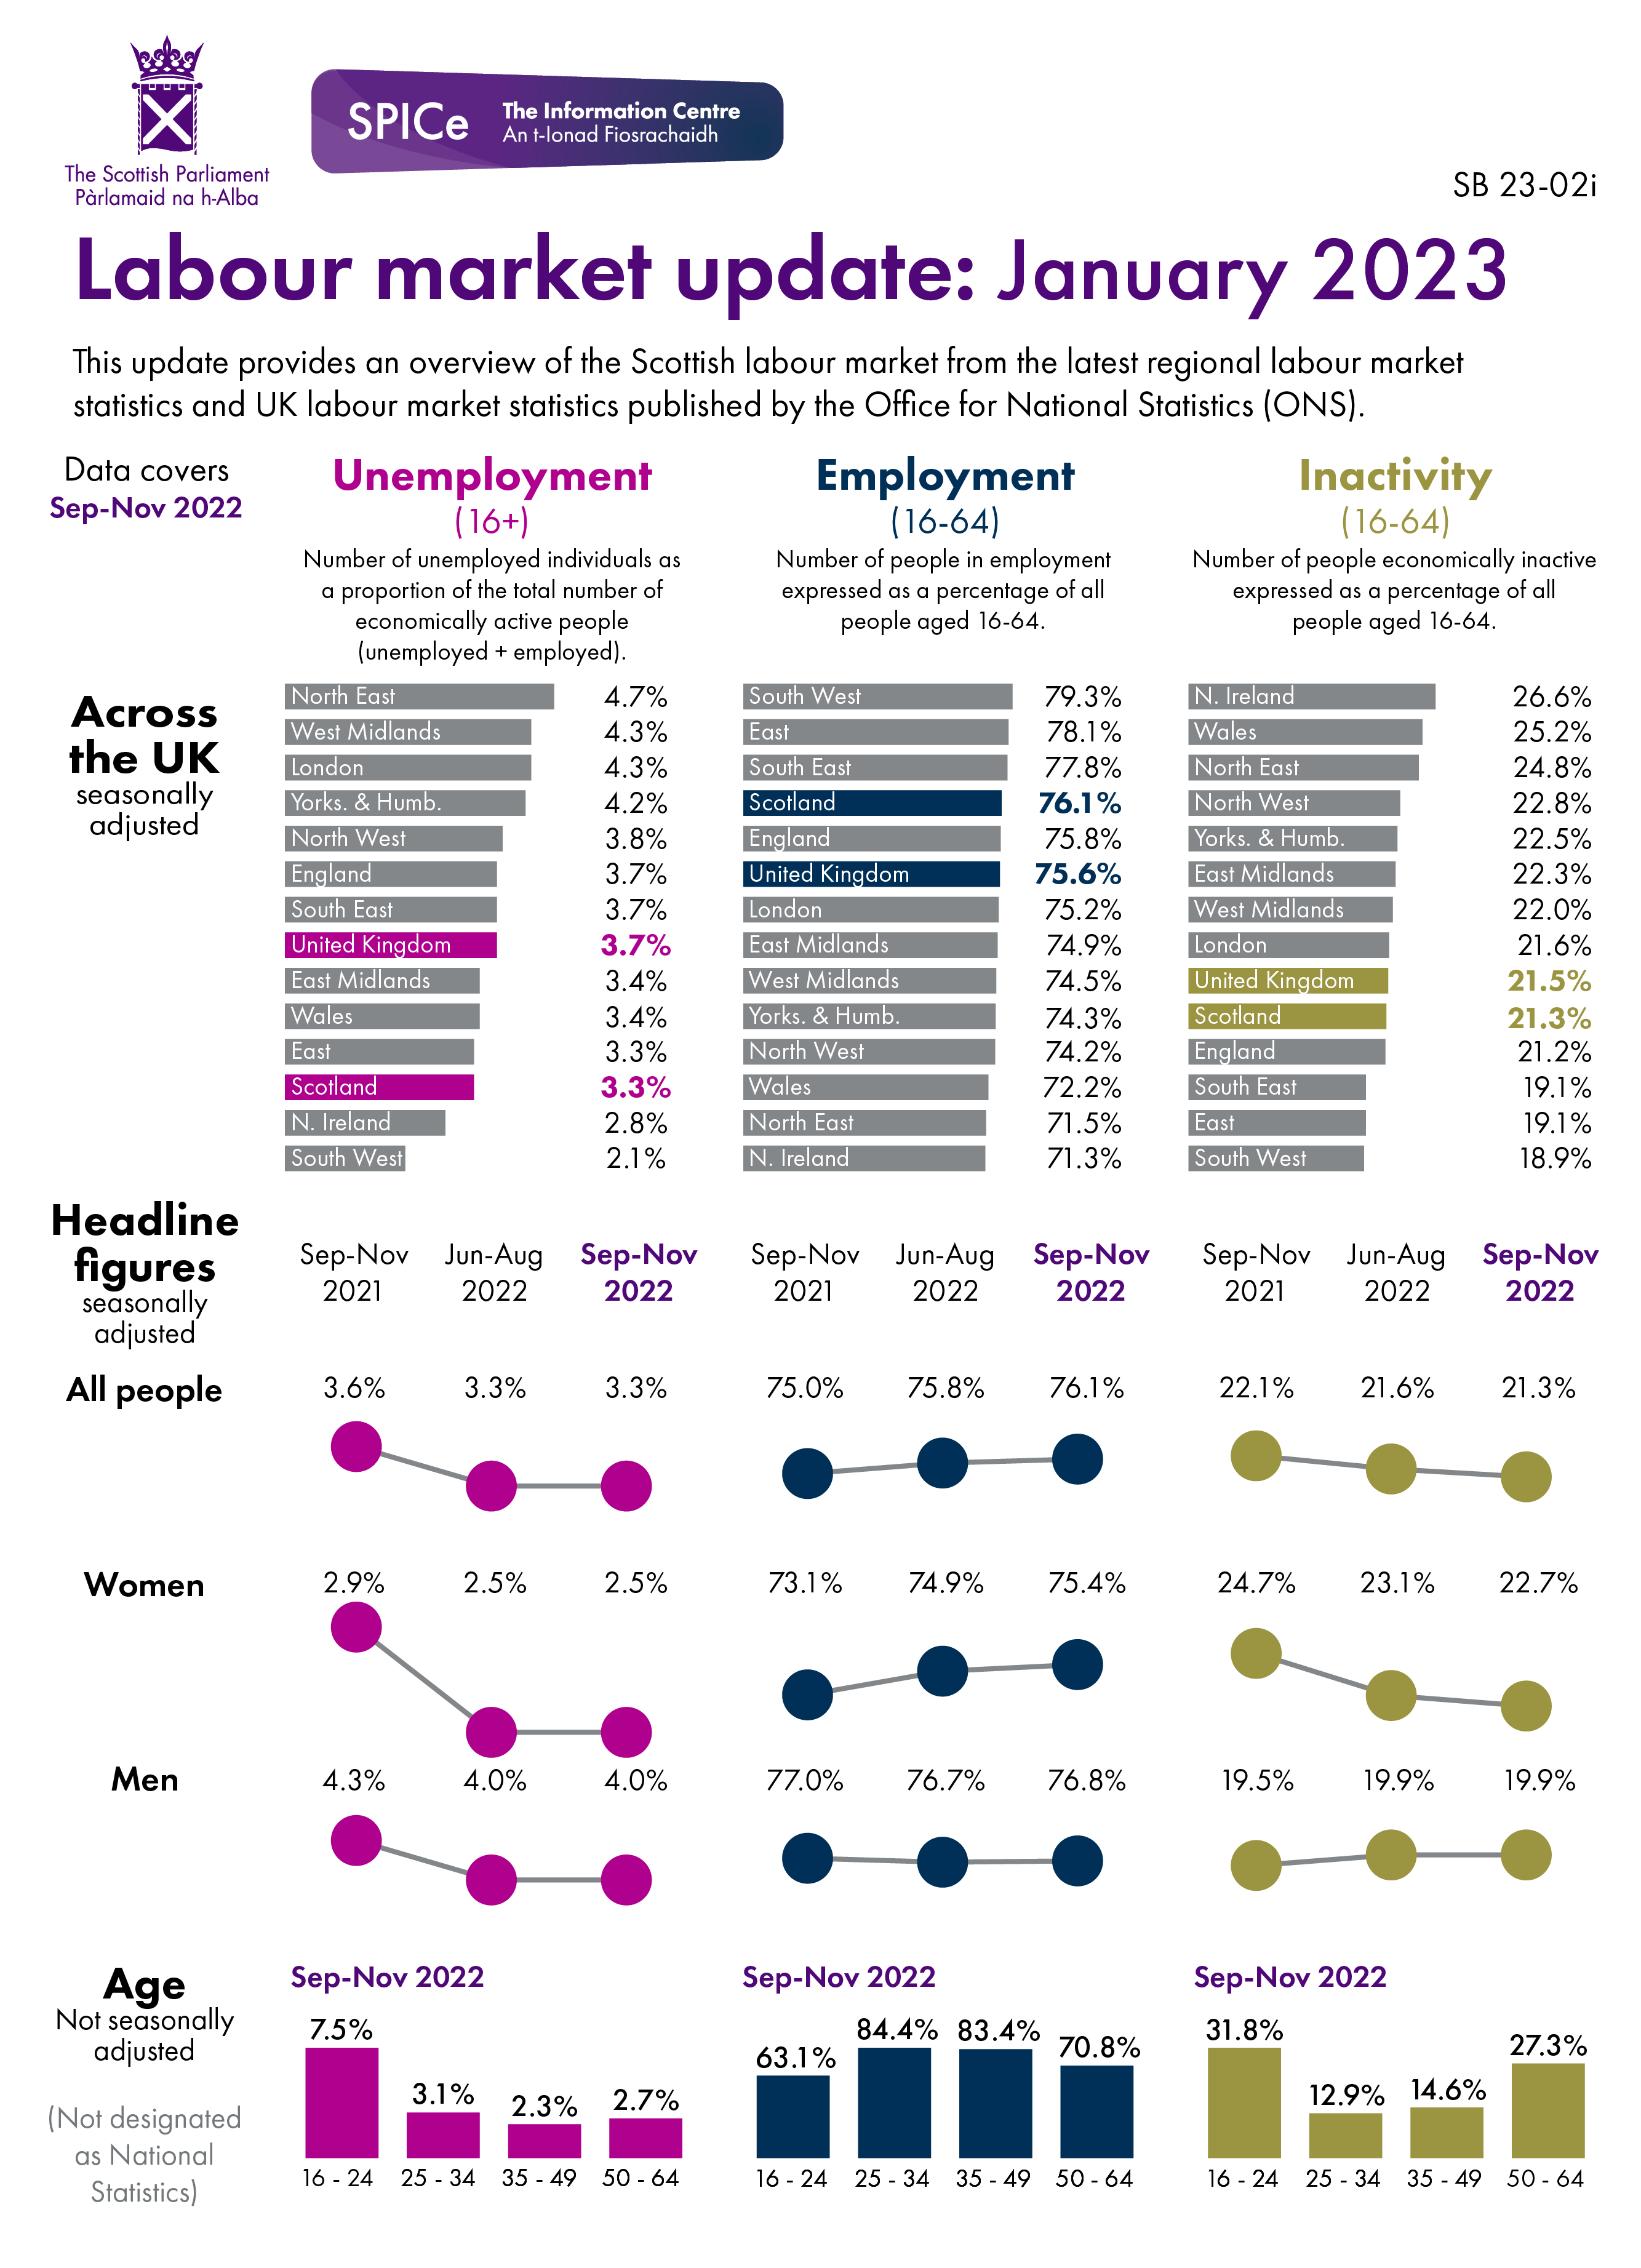
Source: nomis
Data
| Area | Employment | Unemployment | Economically inactive |
|---|---|---|---|
| United Kingdom | 75.6 | 3.7 | 21.5 |
| England | 75.8 | 3.7 | 21.2 |
| North East | 71.5 | 4.7 | 24.8 |
| North West | 74.2 | 3.8 | 22.8 |
| Yorkshire and The Humber | 74.3 | 4.2 | 22.5 |
| East Midlands | 74.9 | 3.4 | 22.3 |
| West Midlands | 74.5 | 4.3 | 22.0 |
| East | 78.1 | 3.3 | 19.1 |
| London | 75.2 | 4.3 | 21.6 |
| South East | 77.8 | 3.7 | 19.1 |
| South West | 79.3 | 2.1 | 18.9 |
| Wales | 72.2 | 3.4 | 25.2 |
| Scotland | 76.1 | 3.3 | 21.3 |
| Northern Ireland | 71.3 | 2.8 | 26.6 |
Source: UK labour market: January 2023
| Same quarter previous year | Previous quarter | Latest quarter | |
|---|---|---|---|
| Unemployment | 3.6 | 3.3 | 3.3 |
| Employment | 75.0 | 75.8 | 76.1 |
| Inactivity | 22.1 | 21.6 | 21.3 |
| Same quarter previous year | Previous quarter | Latest quarter | |
|---|---|---|---|
| Unemployment | 2.9 | 2.5 | 2.5 |
| Employment | 73.1 | 74.9 | 75.4 |
| Inactivity | 24.7 | 23.1 | 22.7 |
| Same quarter previous year | Previous quarter | Latest quarter | |
|---|---|---|---|
| Unemployment | 4.3 | 4.0 | 4.0 |
| Employment | 77.0 | 76.7 | 76.8 |
| Inactivity | 19.5 | 19.9 | 19.9 |
| 16 - 24 | 25 - 34 | 35 - 49 | 50 - 64 | |
|---|---|---|---|---|
| Employment | 63.1 | 84.4 | 83.4 | 70.8 |
| Unemployment | 7.5 | 3.1 | 2.3 | 2.7 |
| Inactivity | 31.8 | 12.9 | 14.6 | 27.3 |