Labour market update: August 2021
This infographic looks at the latest labour market data for Scotland from the Office for National Statistics.
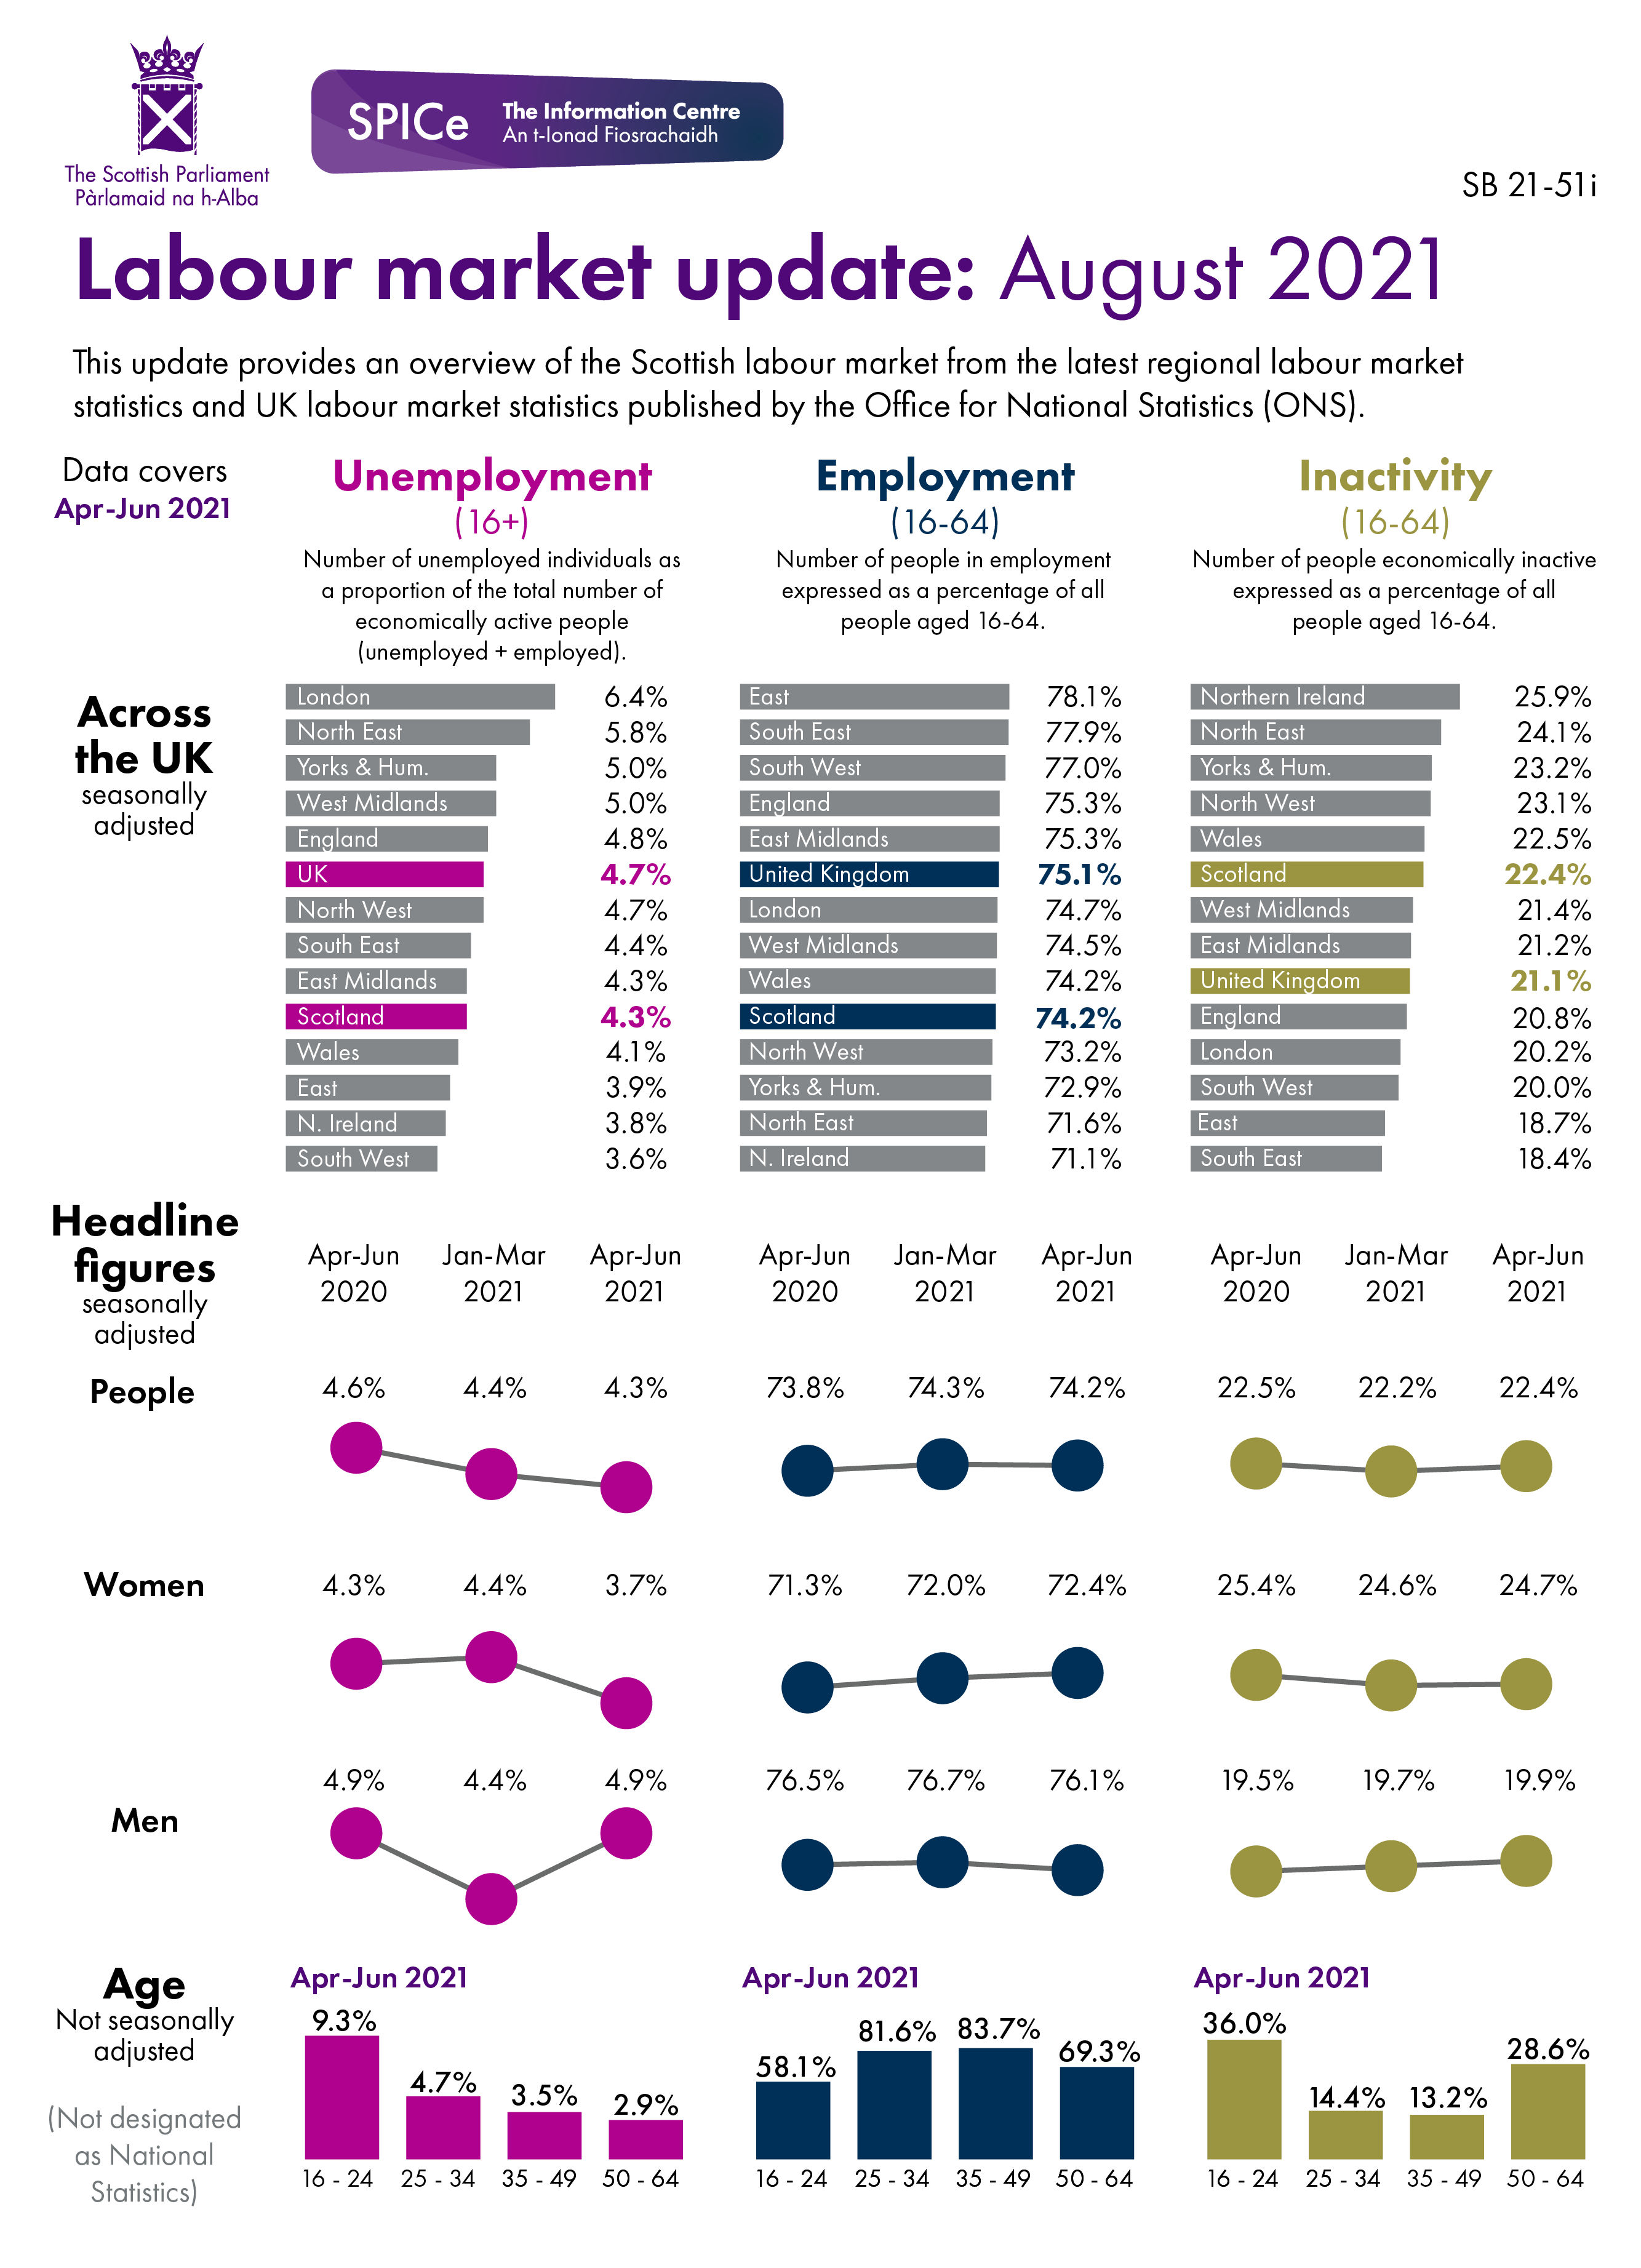
Data
| Employment | Unemployment | Inactivity | |
|---|---|---|---|
| East | 78.1 | 4.1 | 18.7 |
| East Midlands | 75.3 | 4.7 | 21.2 |
| England | 75.3 | 4.8 | 20.8 |
| London | 74.7 | 6.4 | 20.2 |
| North East | 71.6 | 5.8 | 24.1 |
| North West | 73.2 | 4.7 | 23.1 |
| Northern Ireland | 71.1 | 3.6 | 25.9 |
| Scotland | 74.2 | 4.3 | 22.4 |
| South East | 77.9 | 4.3 | 18.4 |
| South West | 77 | 3.8 | 20 |
| United Kingdom | 75.1 | 4.4 | 21.1 |
| Wales | 74.2 | 3.9 | 22.5 |
| West Midlands | 74.5 | 5 | 21.4 |
| Yorkshire and The Humber | 72.9 | 5 | 23.2 |
| Same quarter previous year | Previous quarter | Latest quarter | |
|---|---|---|---|
| Unemployment | 4.6 | 4.4 | 4.3 |
| Employment | 73.8 | 74.3 | 74.2 |
| Inactivity | 22.5 | 22.2 | 22.4 |
| Same quarter previous year | Previous quarter | Latest quarter | |
|---|---|---|---|
| Unemployment | 4.3 | 4.4 | 3.7 |
| Employment | 71.3 | 72.0 | 72.4 |
| Inactivity | 25.4 | 24.6 | 24.7 |
| Same quarter previous year | Previous quarter | Latest quarter | |
|---|---|---|---|
| Unemployment | 4.9 | 4.4 | 4.9 |
| Employment | 76.5 | 76.7 | 76.1 |
| Inactivity | 19.5 | 19.7 | 19.9 |
| 16 - 24 | 25 - 34 | 35 - 49 | 50 - 64 | |
|---|---|---|---|---|
| Employment | 58.1 | 81.6 | 83.7 | 69.3 |
| Unemployment | 9.3 | 4.7 | 3.5 | 2.9 |
| Inactivity | 36.0 | 14.4 | 13.2 | 28.6 |