Earnings in Scotland: 2020
This briefing looks at the latest data for Scotland from the Annual Survey of Hours and Earnings.
Summary
The 2020 Annual Survey of Hours and Earnings (ASHE) was released on 3 November 20201. Like most things in 2020, ASHE was affected by the Coronavirus (COVID-19) pandemic. We explore the impact of the the pandemic in economic terms and on the survey itself later in the briefing.
The visuals which look at pay for all employees, part-time and full-time employees compare Scotland to the overall UK-wide figure and highlight which nation or region has the highest and lowest pay levels. More information can be found in each section.
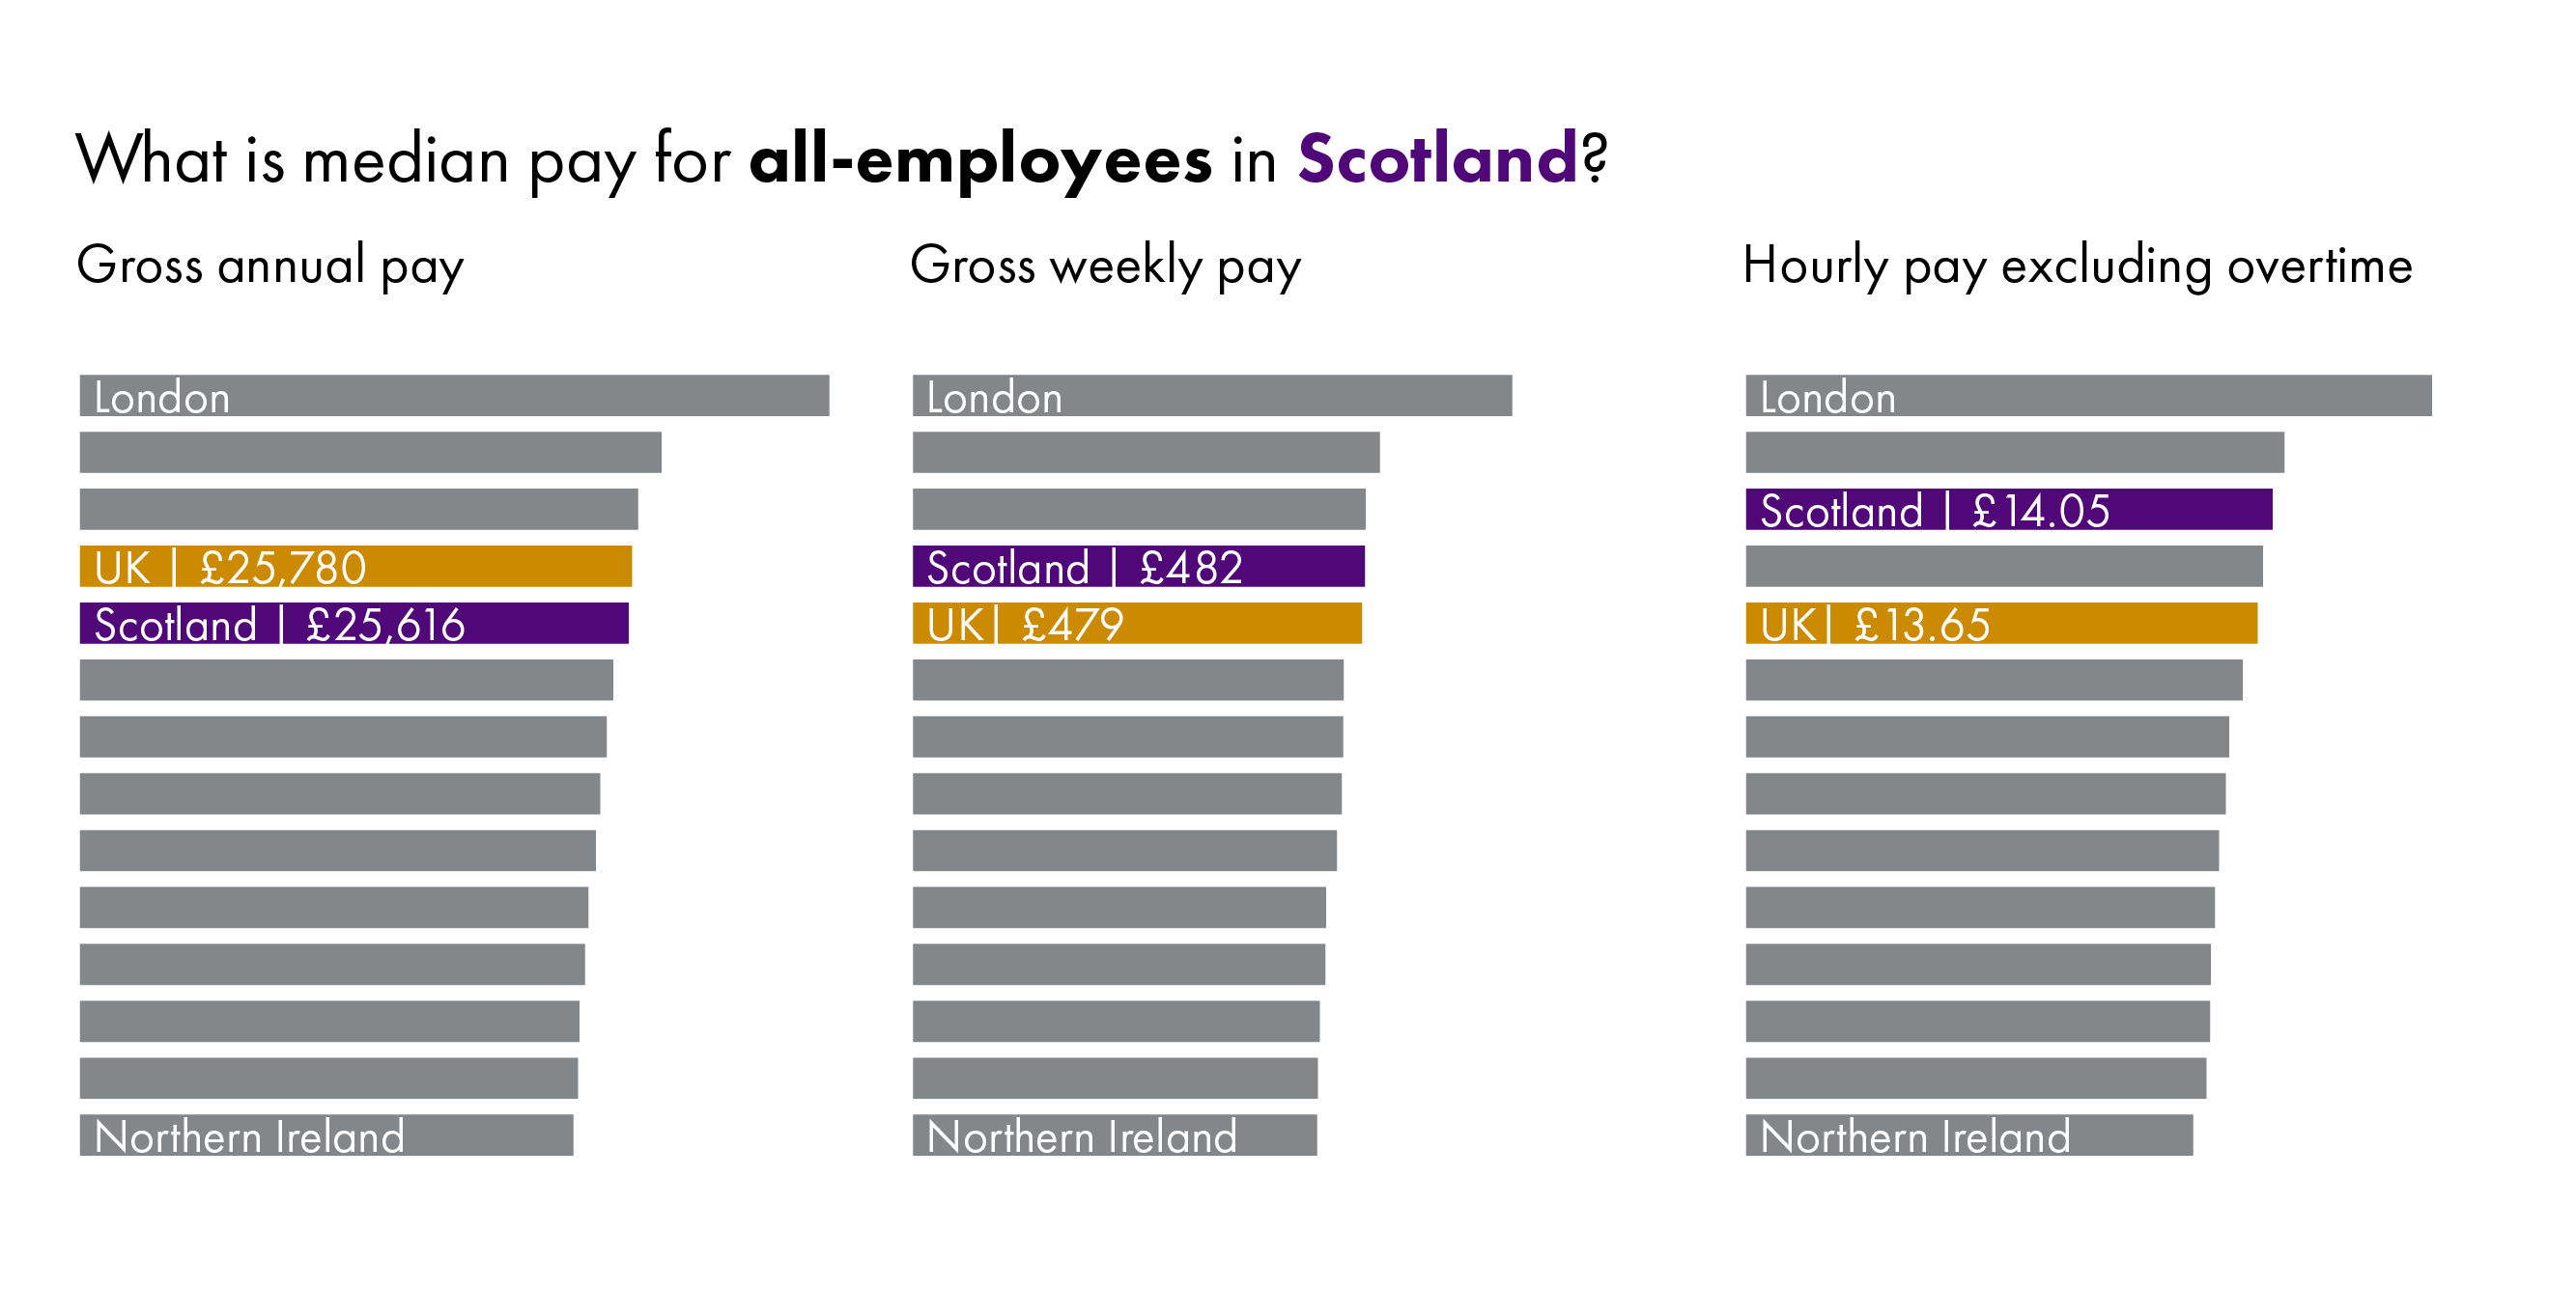
When looking at median pay for all employees:
At £25,616, annual pay in Scotland for all employees is fourth highest of the nations and regions of the UK, and just below the UK median.
At £482, weekly pay in Scotland for all employees is fourth highest of the nations and regions of the UK, and just above the UK median.
At £14.05, hourly pay excluding overtime for all employees in Scotland is third highest of the nations and regions of the UK, and above the UK median.
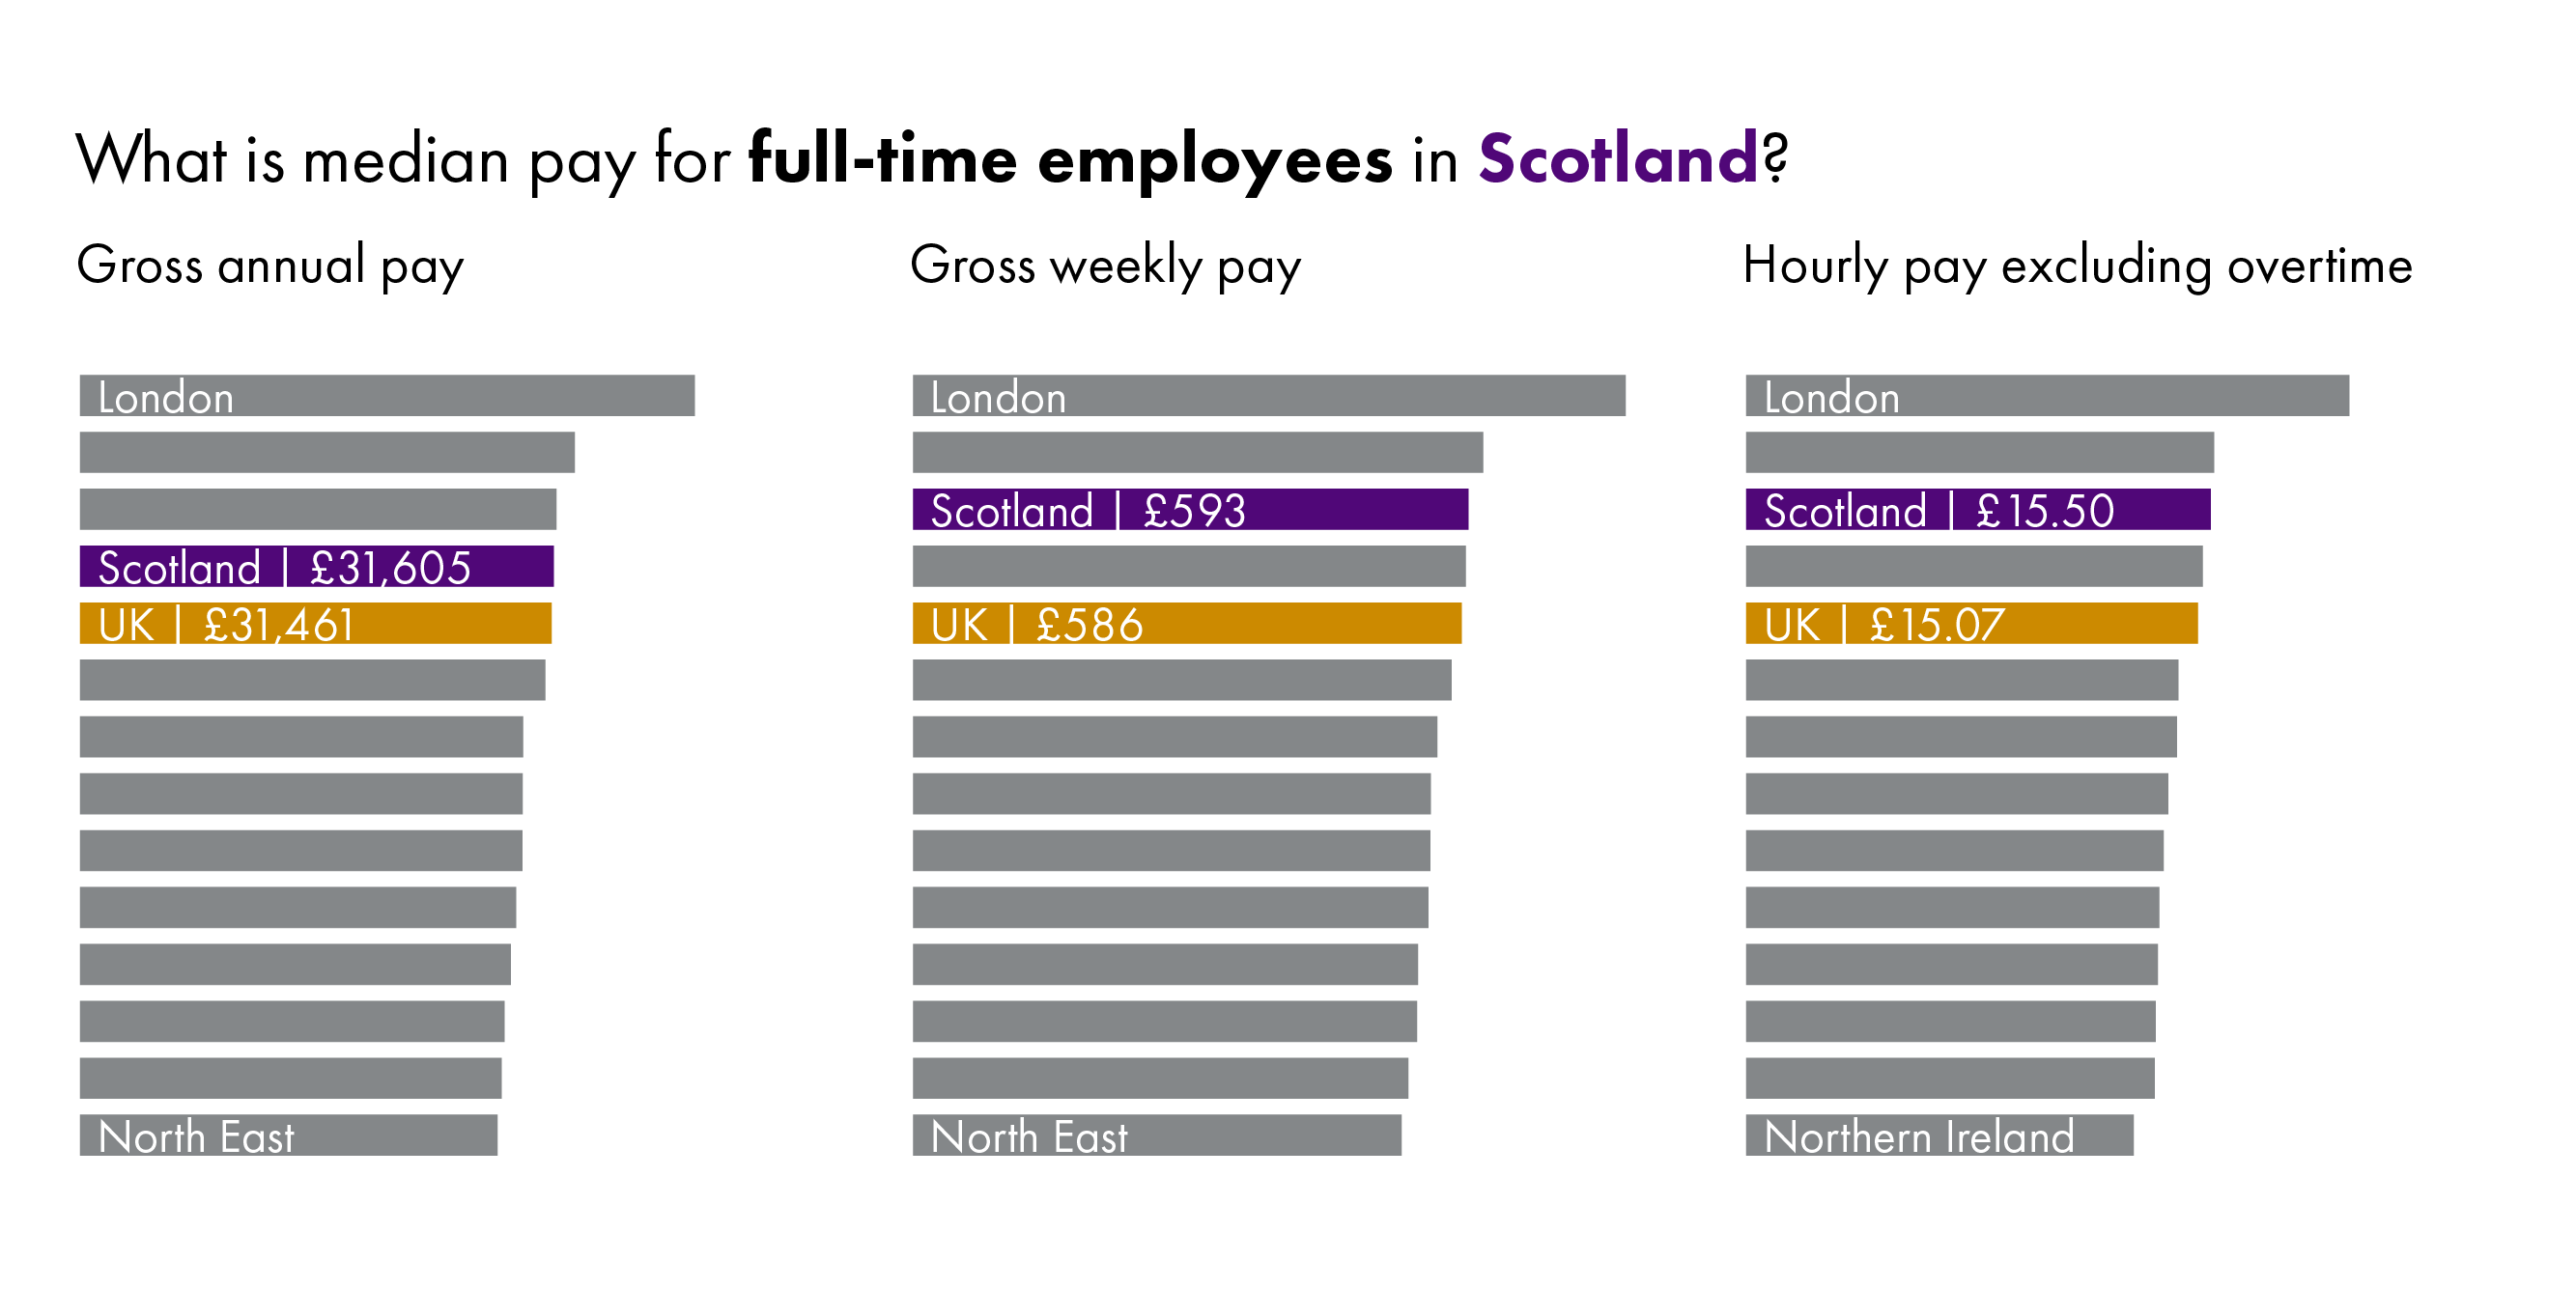
When looking at median pay for full-time employees:
At £31,605, annual pay in Scotland for full-time employees is fourth highest of the nations and regions of the UK and just below the UK median.
At £593, weekly pay in Scotland for full-time employees is third highest of the nations and regions of the UK, and above the UK median.
At £15.50, hourly pay excluding overtime for full-time employees in Scotland is third highest of the nations and regions of the UK and above the UK median.
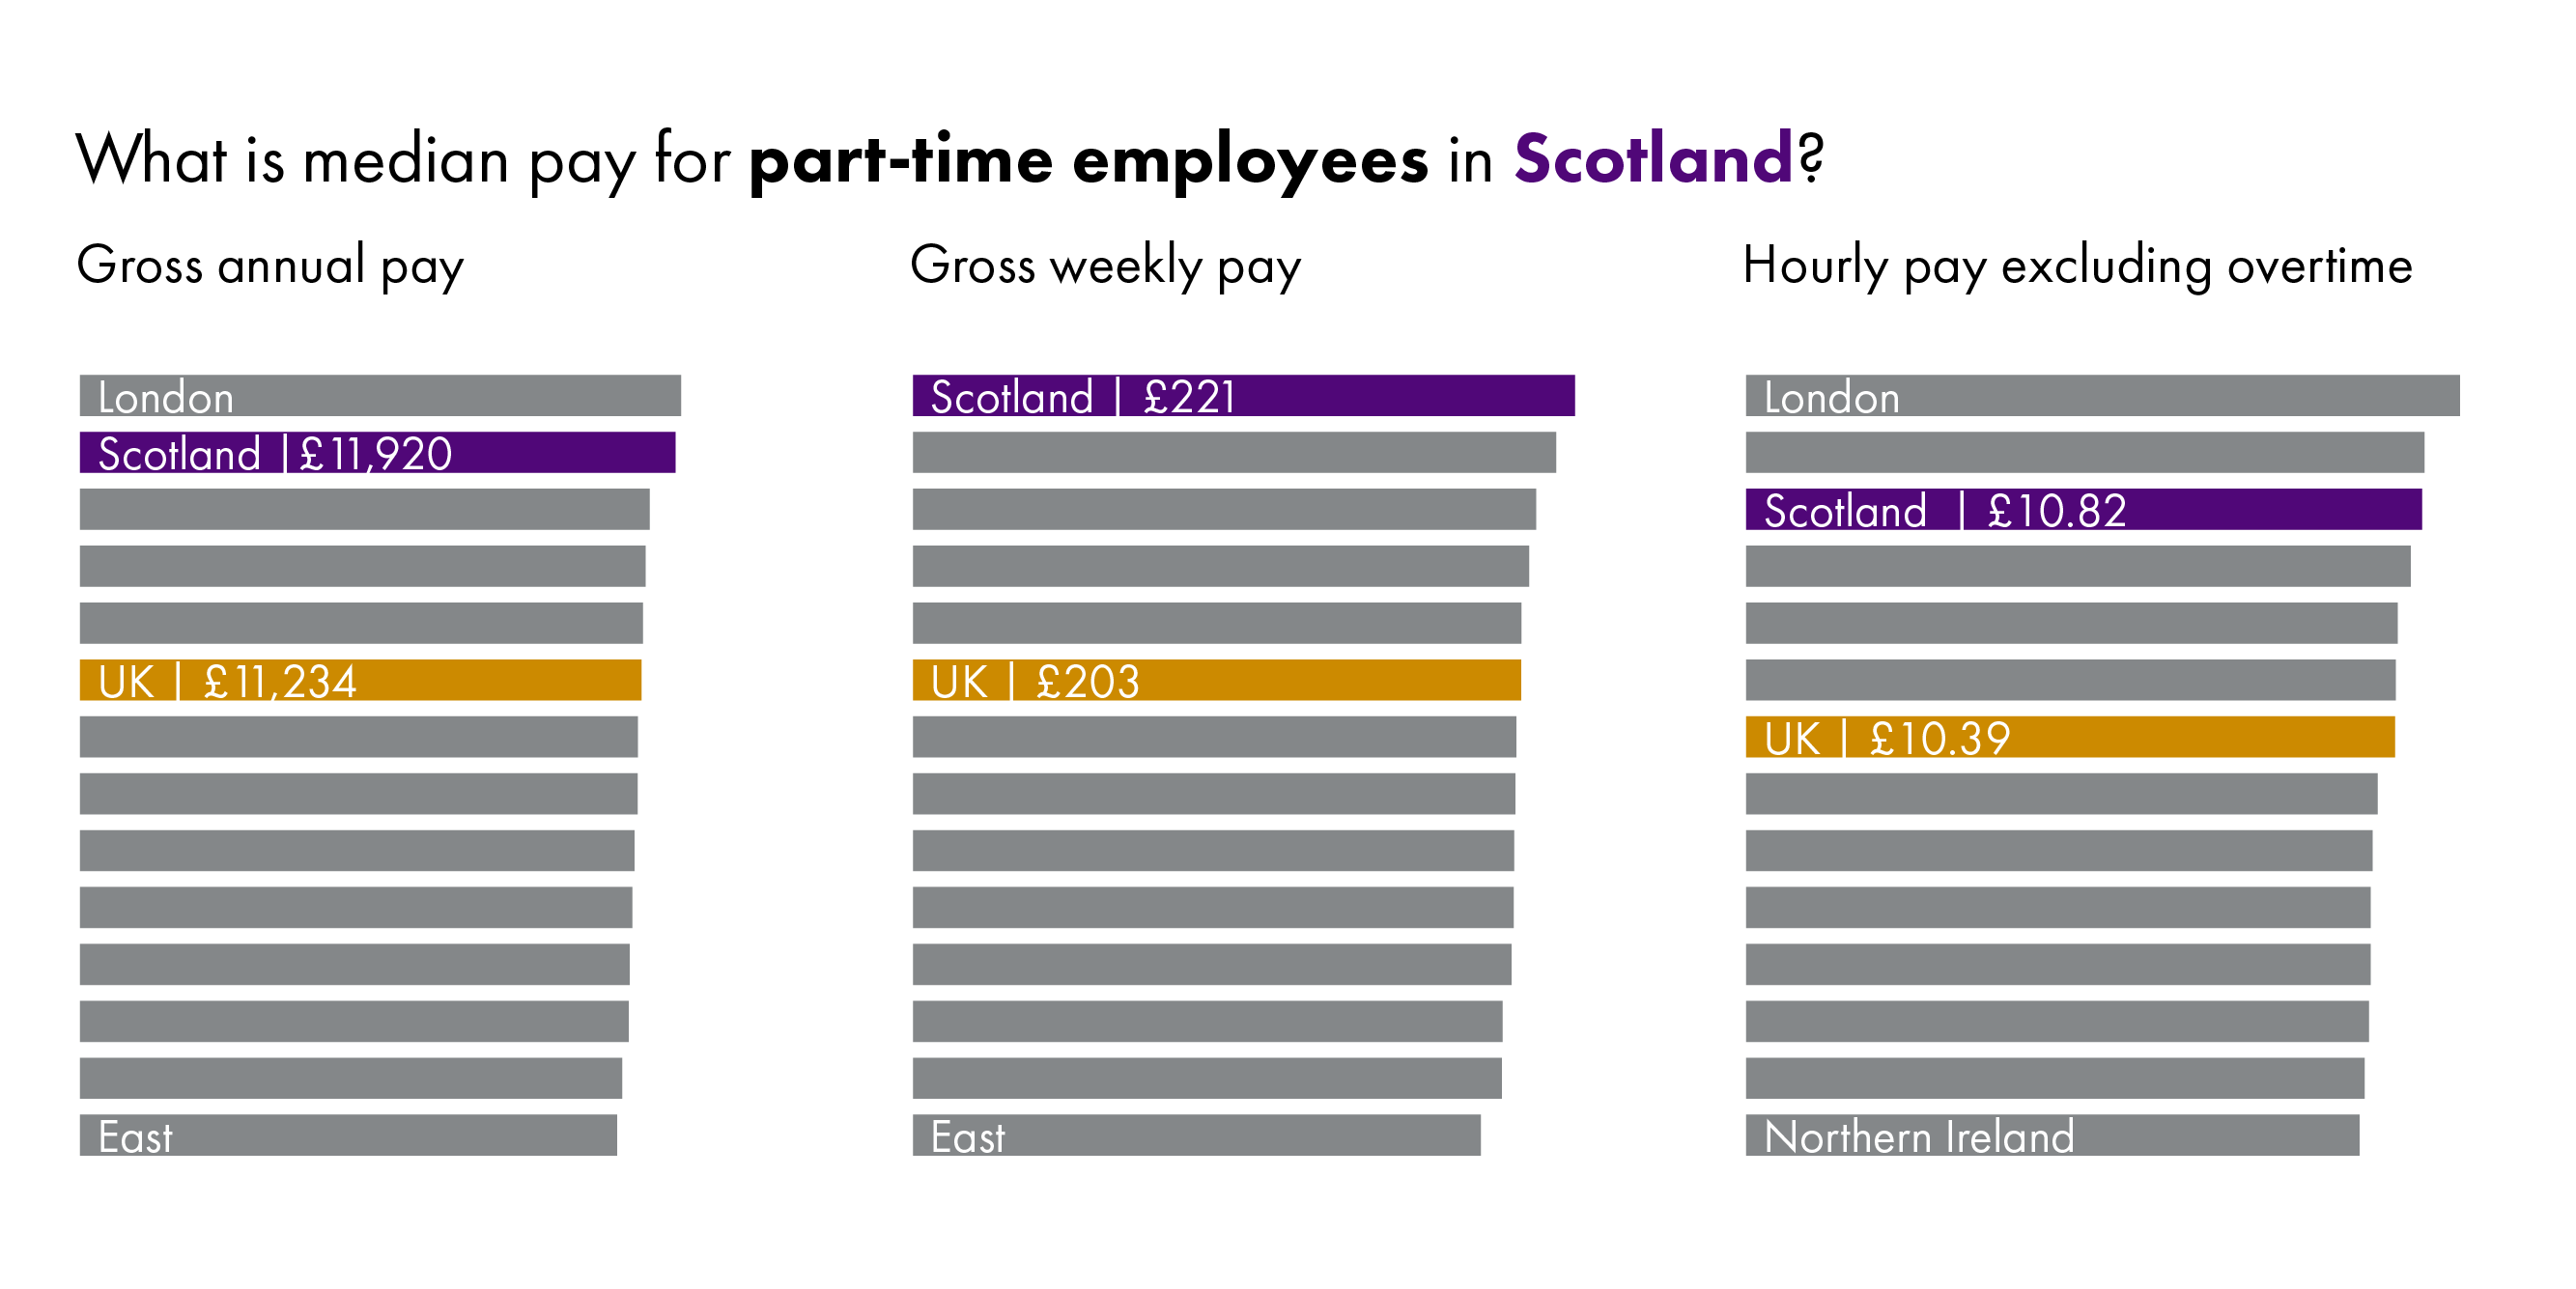
When looking at pay for part-time employees:
At £11,920, annual pay in Scotland for part-time employees is second highest of the nations and regions of the UK, and above the UK median.
At £221, weekly pay in Scotland for part-time employees is the highest of the nations and regions of the UK.
At £10.82, hourly pay in Scotland for part-time employees is third highest of the nations and regions of the UK, and above the UK median.
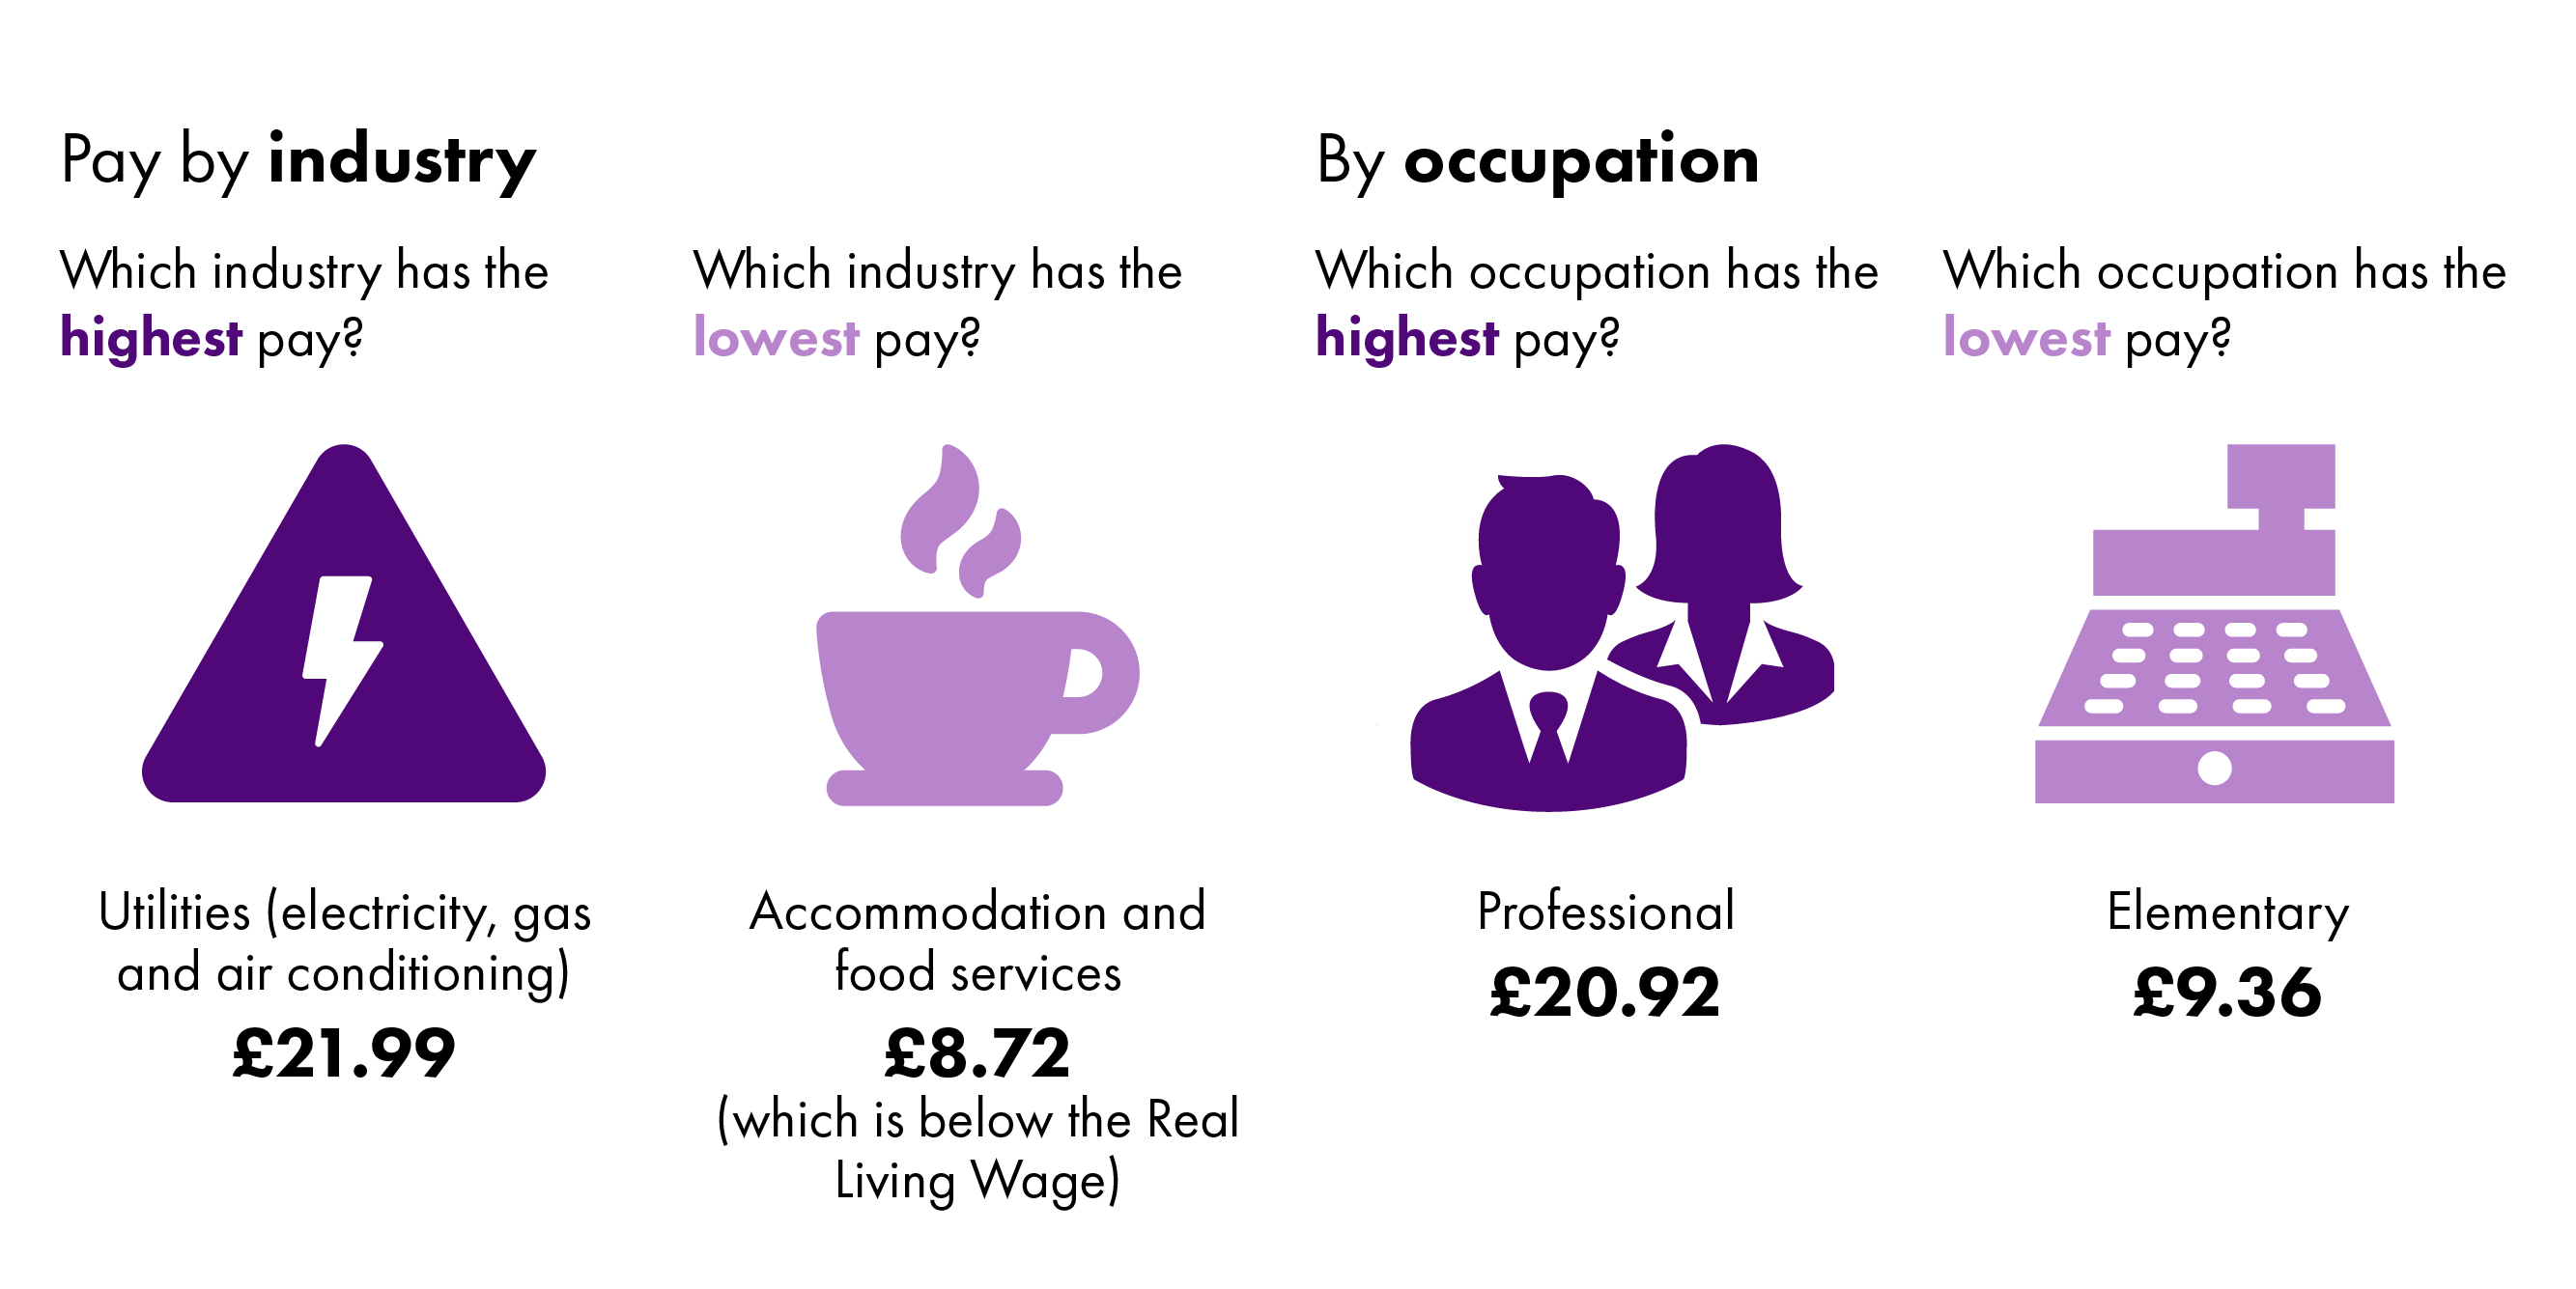
When looking at pay by industry and occupation:
At £21.99 per hour excluding overtime, "Utilities (electricity, gas and air conditioning)", has the highest median pay of all industries in Scotland. "Accommodation and food service" has the lowest median pay of all industries at £8.72 per hour excluding overtime, which is below the Real Living Wage at the time of the survey.
At £20.92 per hour excluding overtime, "Professional occupations" have the highest median pay in Scotland. While at £9.36 per hour excluding overtime, "Elementary occupations" have the lowest median pay in Scotland.
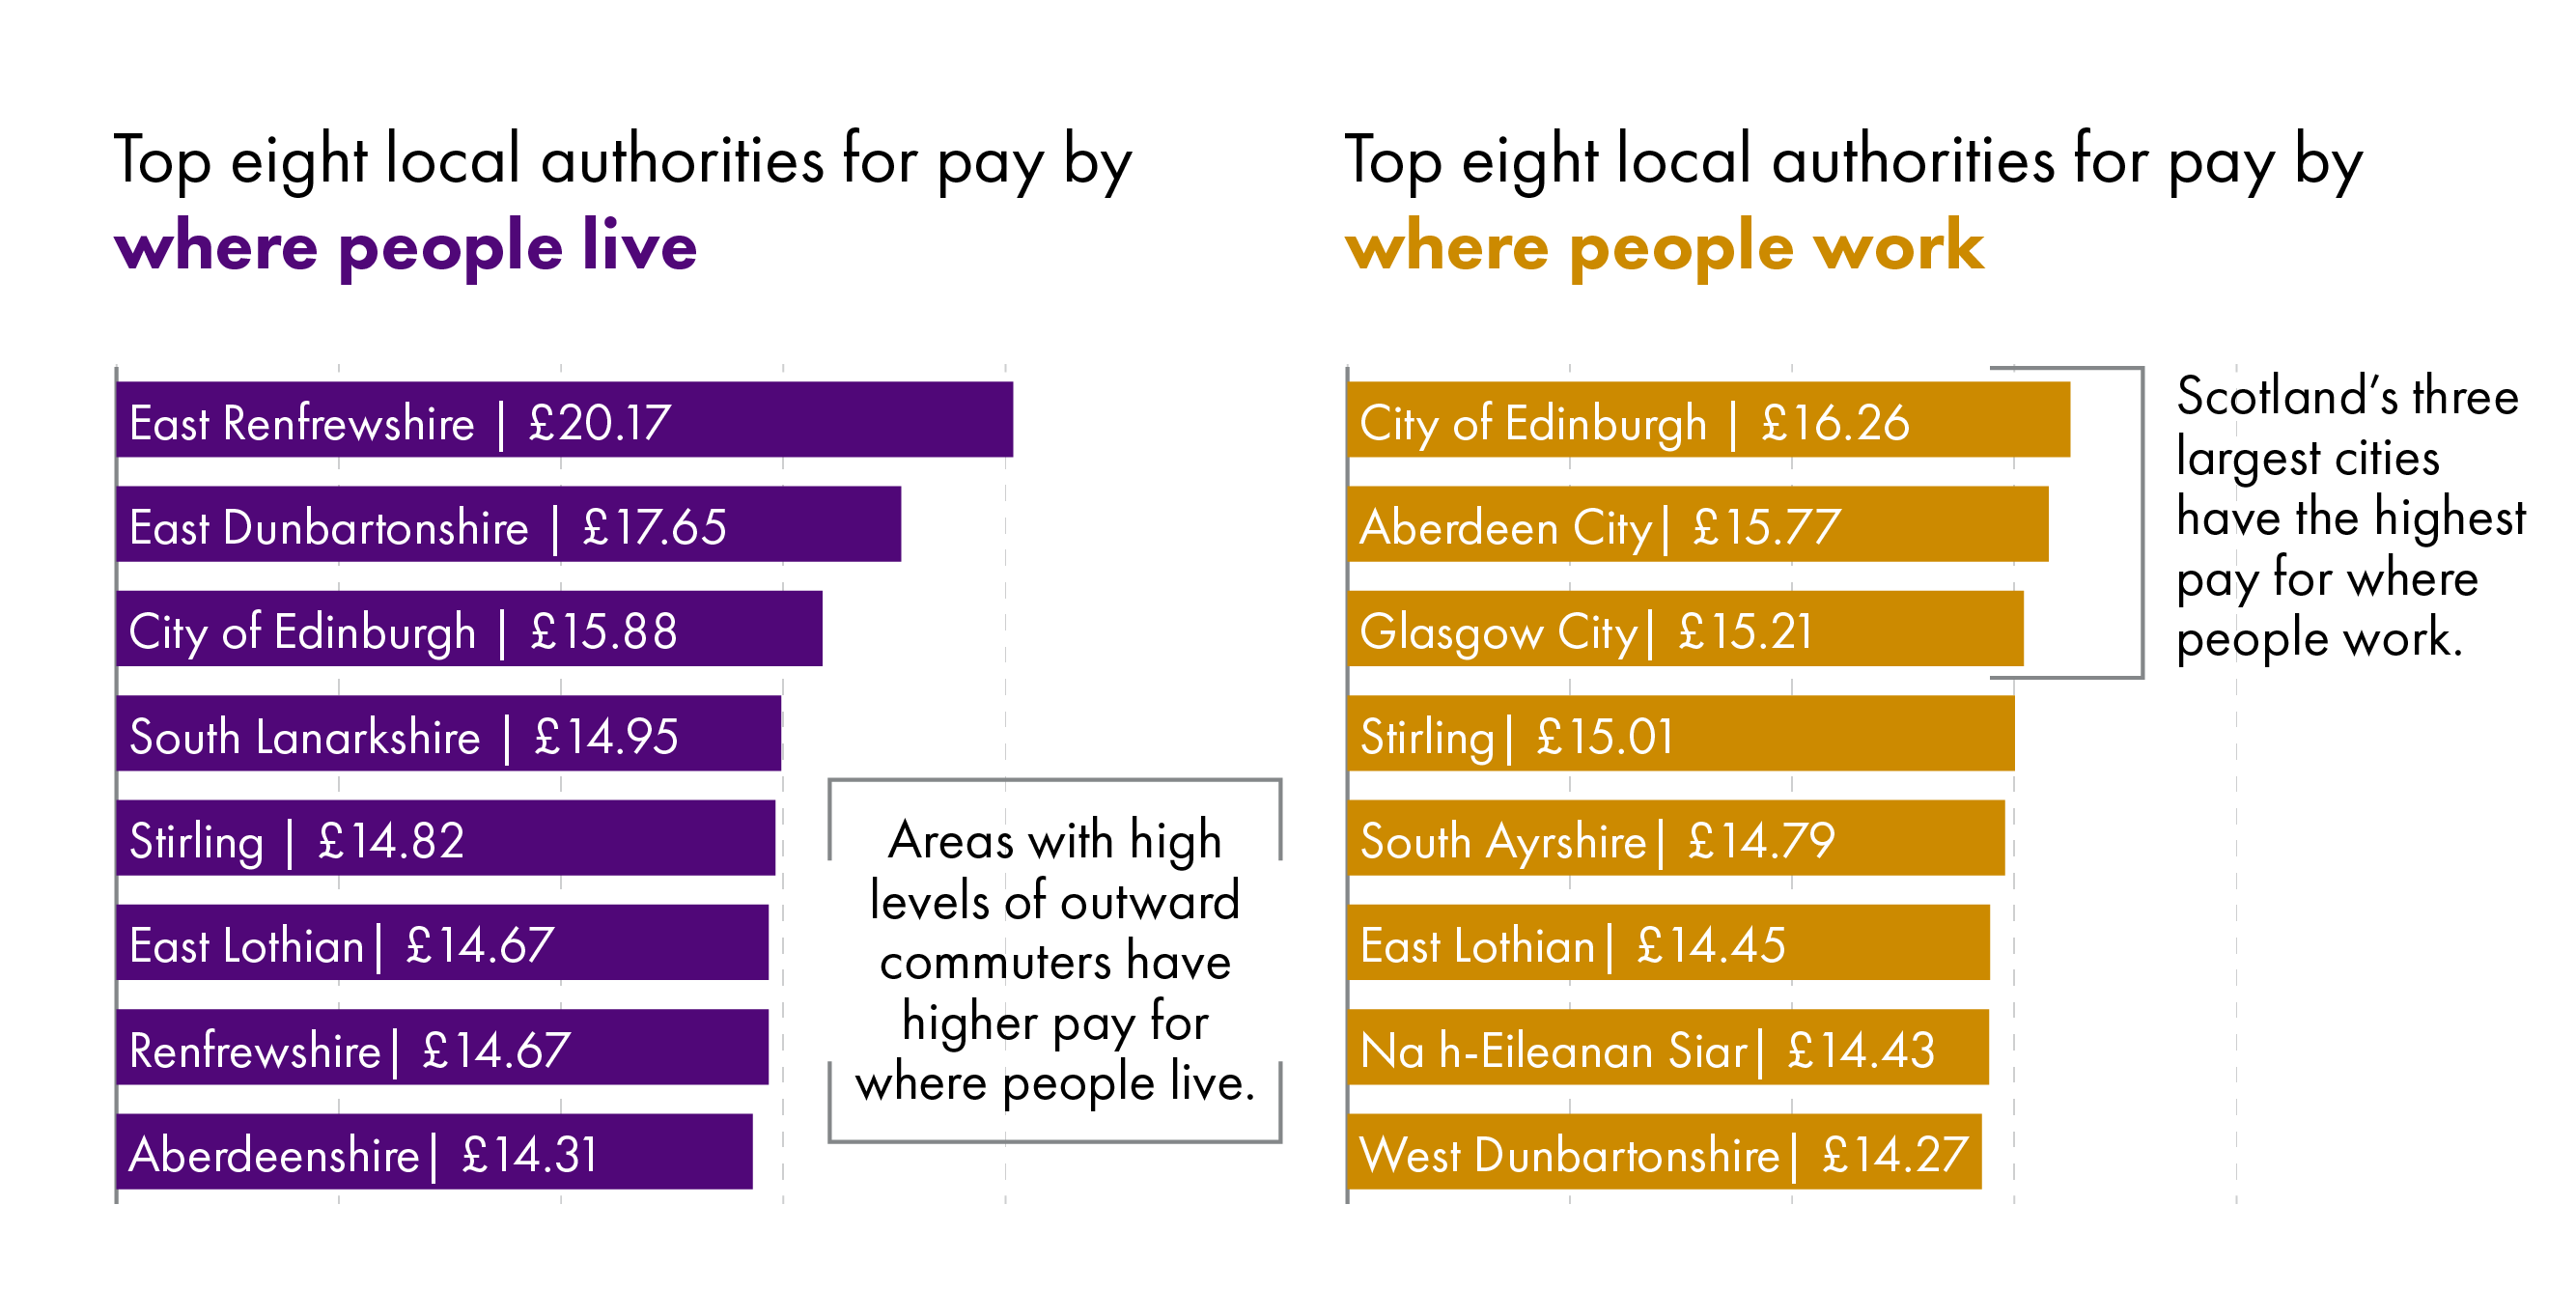
When looking at pay by local authority across Scotland:
Hourly pay excluding overtime for where people live tends to be higher in areas where there is a high number of outward commuters.
Hourly pay excluding overtime for where people work is highest in Scotland's three largest cities.
About the data
The data in this briefing are ASHE 2020 provisional results, published by the Office for National Statistics (ONS)1. The survey provides a range of earnings statistics for employees across the UK. ASHE provides data for hourly, weekly and annual income for all employees and part-time and full-time employees. It does not cover the self-employed. ASHE uses Pay As You Earn (PAYE) data to identify representative sub groups of employers and employees who they then survey to get information on employee hours and earnings.
Key points about the data:
Where figures are adjusted for inflation, the Consumer Prices Index including owner occupiers’ housing costs (CPIH) figure has been used (0.9% in the year to April 2020). CPIH is the most comprehensive measure of UK consumer price inflation, as it includes owner occupiers’ housing costs (OOH) and Council Tax.
Because of the potential for sampling errors for smaller groups, including local areas and small industries, there is a wider margin of error with some of the smaller data sets data than for Scotland as a whole.
Unless otherwise stated, the median estimate has been used rather than the mean, as it provides a better indication of ‘typical’ pay. Median values split the top 50 per cent from the bottom 50 per cent, meaning it is less likely to be skewed by the relatively small number of very high earners.
"Full-time" is defined as employees working 30 paid hours per week or more (or 25 or more for the teaching professions).
Methodological changes in 2004, 2006 and 2011 resulted in discontinuities in the ASHE time series, therefore care should be taken when making comparisons with earlier years.
Unless otherwise stated this briefing looks at the workplace analysis of the ASHE.
The collection of this year's data has been affected by the Coronavirus (COVID-19) pandemic.
The ONS has indicated1 that due to the health restrictions in place the survey saw a lower than usual response rate, with almost a quarter fewer responses. While they stated that the smaller sample size would have little impact on their analysis,the data has a higher level of uncertainty than usual.
The Fraser of Allander Institute explores the problems with this year’s data in more detail3.
The economic context
When looking at the latest ASHE data we need to look at the wider economic context to understand what is going on with the data. This section looks at how economic output and the jobs market have changed between the time of data collection for ASHE 2019 and 2020.
We go into further detail in the following sections, but the key points are:
In Scotland, between February 2020 and April 2020, economic output fell by 24%.
In Scotland, the number of full-time employee jobs fell by 2.2%, compared to a fall of 1.3% for the whole of the UK.
In Scotland, part-time employee jobs increased by 5.3% while the UK saw an increase of 2.0%, between June 2019 and June 2020.
There has been an increase in the proportion of all employees who work part-time, especially in the lower paid industries, between June 2019 and June 2020.
There was a bigger fall in full-time jobs in lower paid industries than in higher paid ones between June 2019 and June 2020.
Economic output
The Coronavirus (COVID-19) pandemic has affected the global economy. In Scotland, between February 2020 and April 2020, economic output fell by 24%.
Figure 1: Scottish GDP index, indexed to 2016 - March 2019 to June 2020
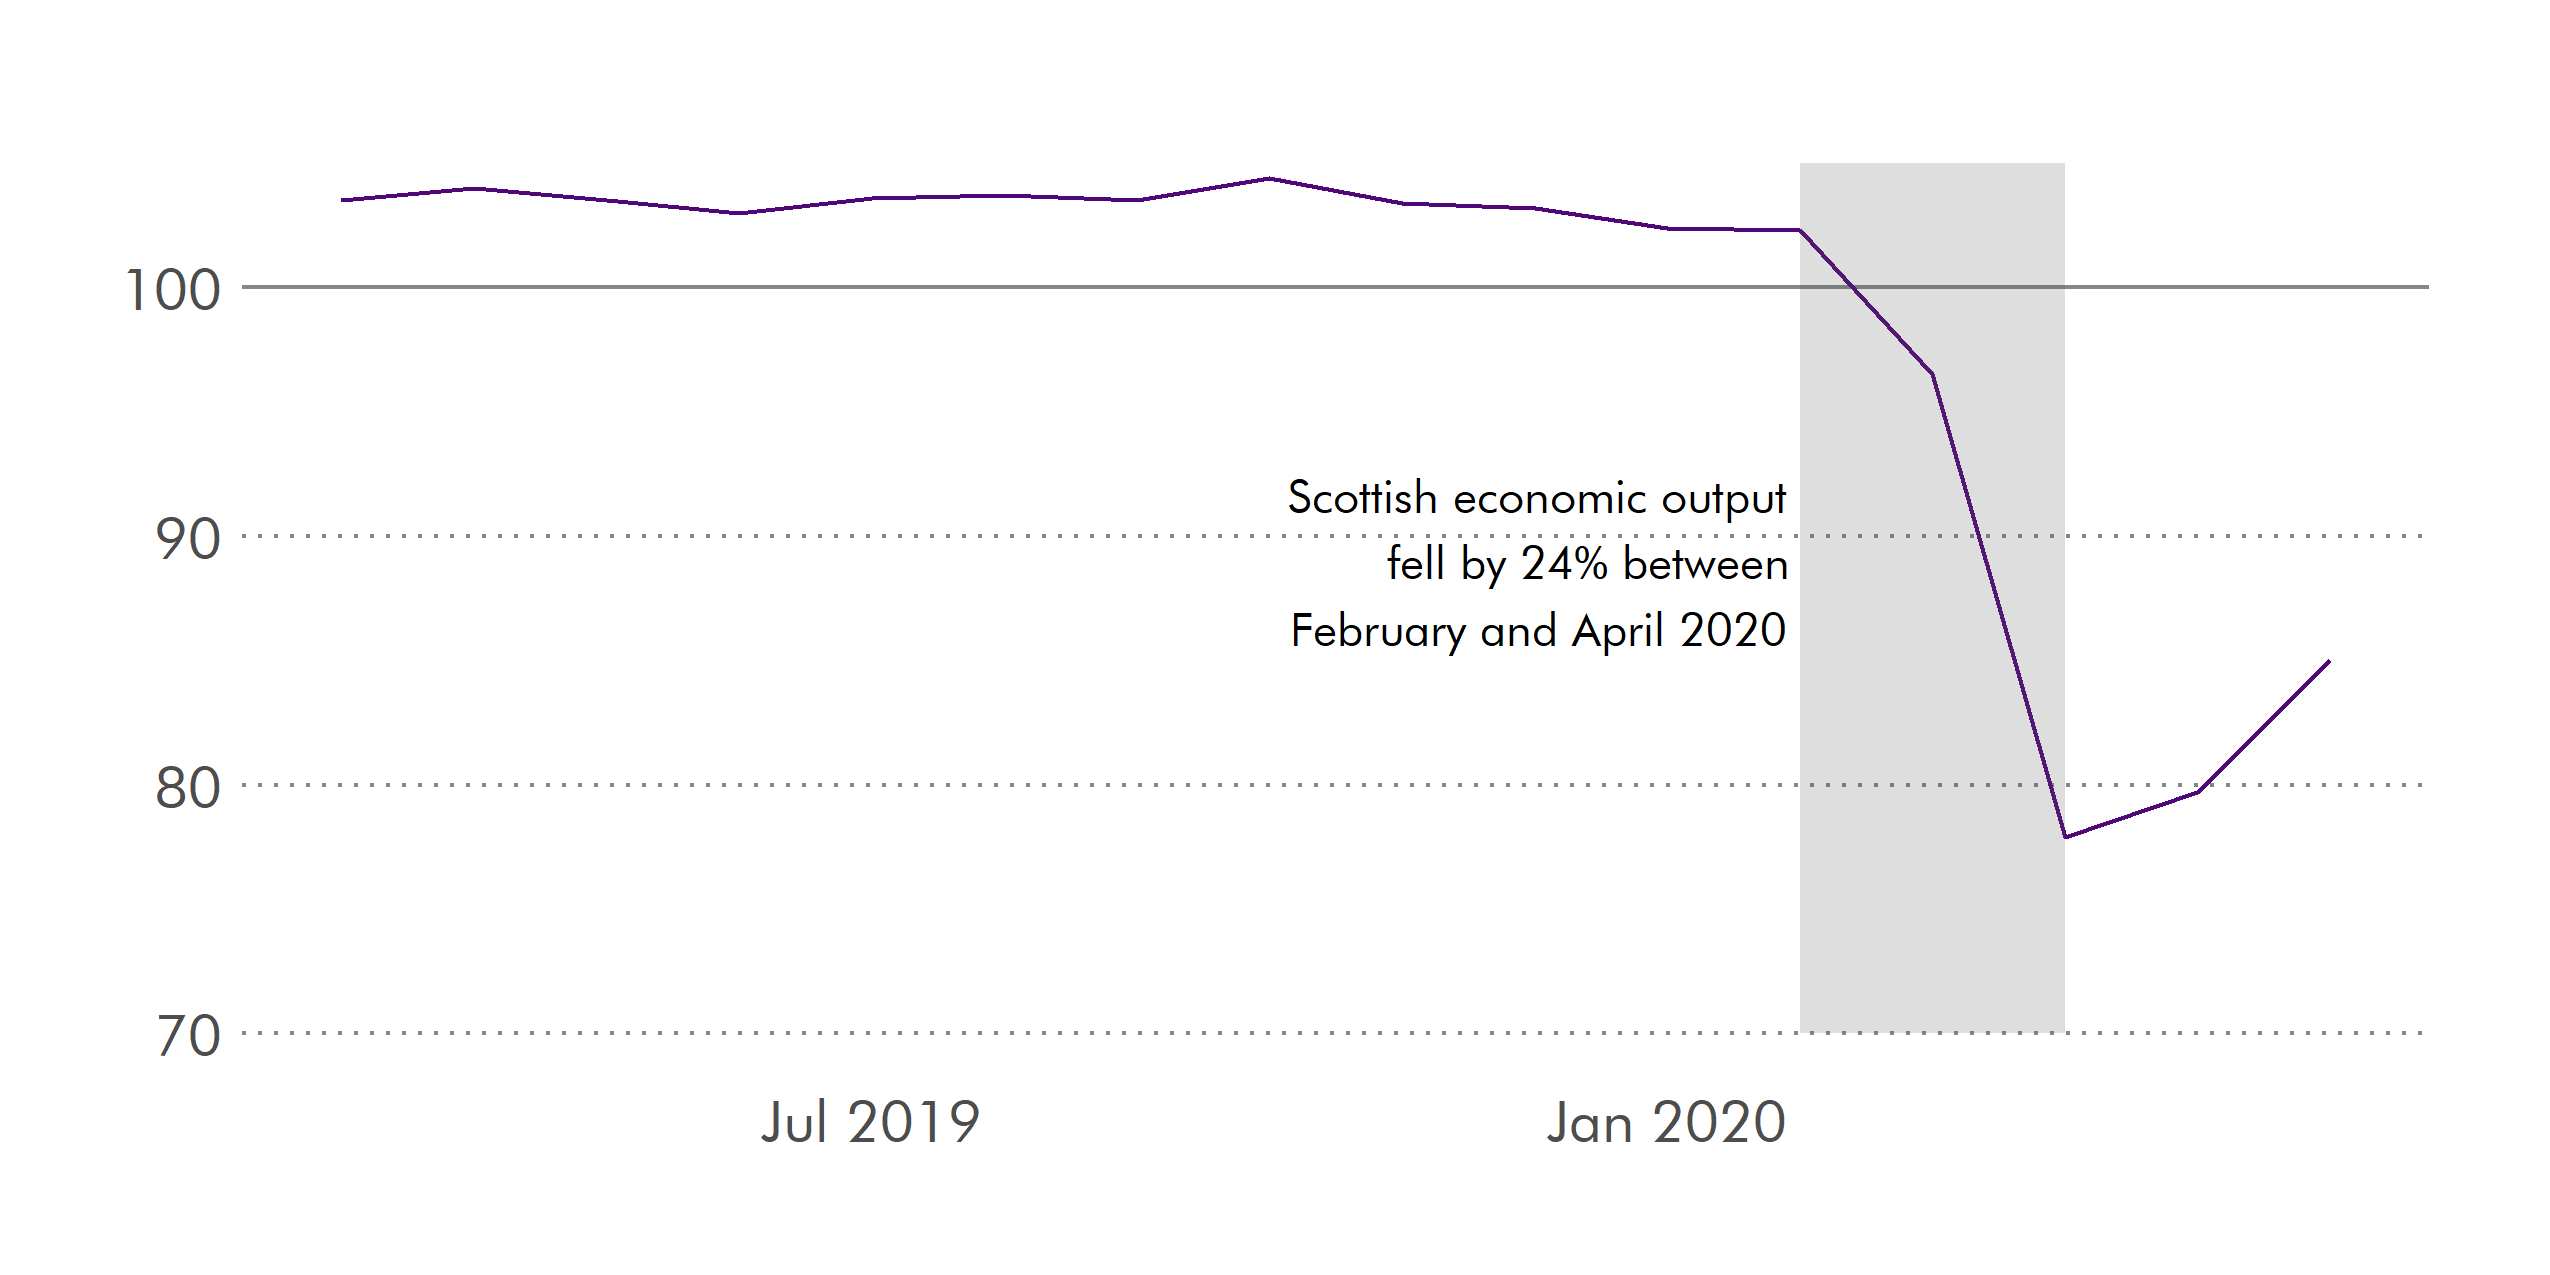
Source: Scottish Government
Falls in GDP have not been equal across all sectors. Looking across the broad sectoral groups we can see that the two largest industry groupings, services and production both fell by 23% and 22% respectively. However, within these broad groups there was wide variation. For example, in the service sector, there was no change in output for Public Administration and Defence while Accommodation and food services fell by 82%. Of the other broad sectors Agriculture, forestry and fishing fell by 7% and Construction fell by 52%.
Impact on employee jobs
The Office for National Statistics publishes information on the number of jobs in the UK through its Workforce Jobs (WFJ) publication. This is the preferred measure of the change in jobs by industry. The data allows us to look specifically at data for employee numbers (excluding the self-employed). This is useful as ASHE is based on Pay As Your Earn data which relates to employees. Therefore, this section focuses on employee data. We look at non-seasonally adjusted data as this allows us to look at a further breakdown by working pattern.
We have looked at changes in levels of employee jobs between June 2019 and June 2020 as this lets us see what impact the first lockdown period of the pandemic had on jobs. April 2020 saw the introduction of the Coronavirus Job Retention Scheme (CJRS). This scheme allowed companies to maintain jobs, with the UK Government paying 80% of normal pay, up to a maximum £2,500 a month. The ONS suggest that around half of employers topped up employee wages to 100%. Data shows that in Scotland 736,500 employees had been furloughed, as of 30 June.
Figure 2: Index of number of employees in Scotland and the UK by working pattern, indexed to June 2019
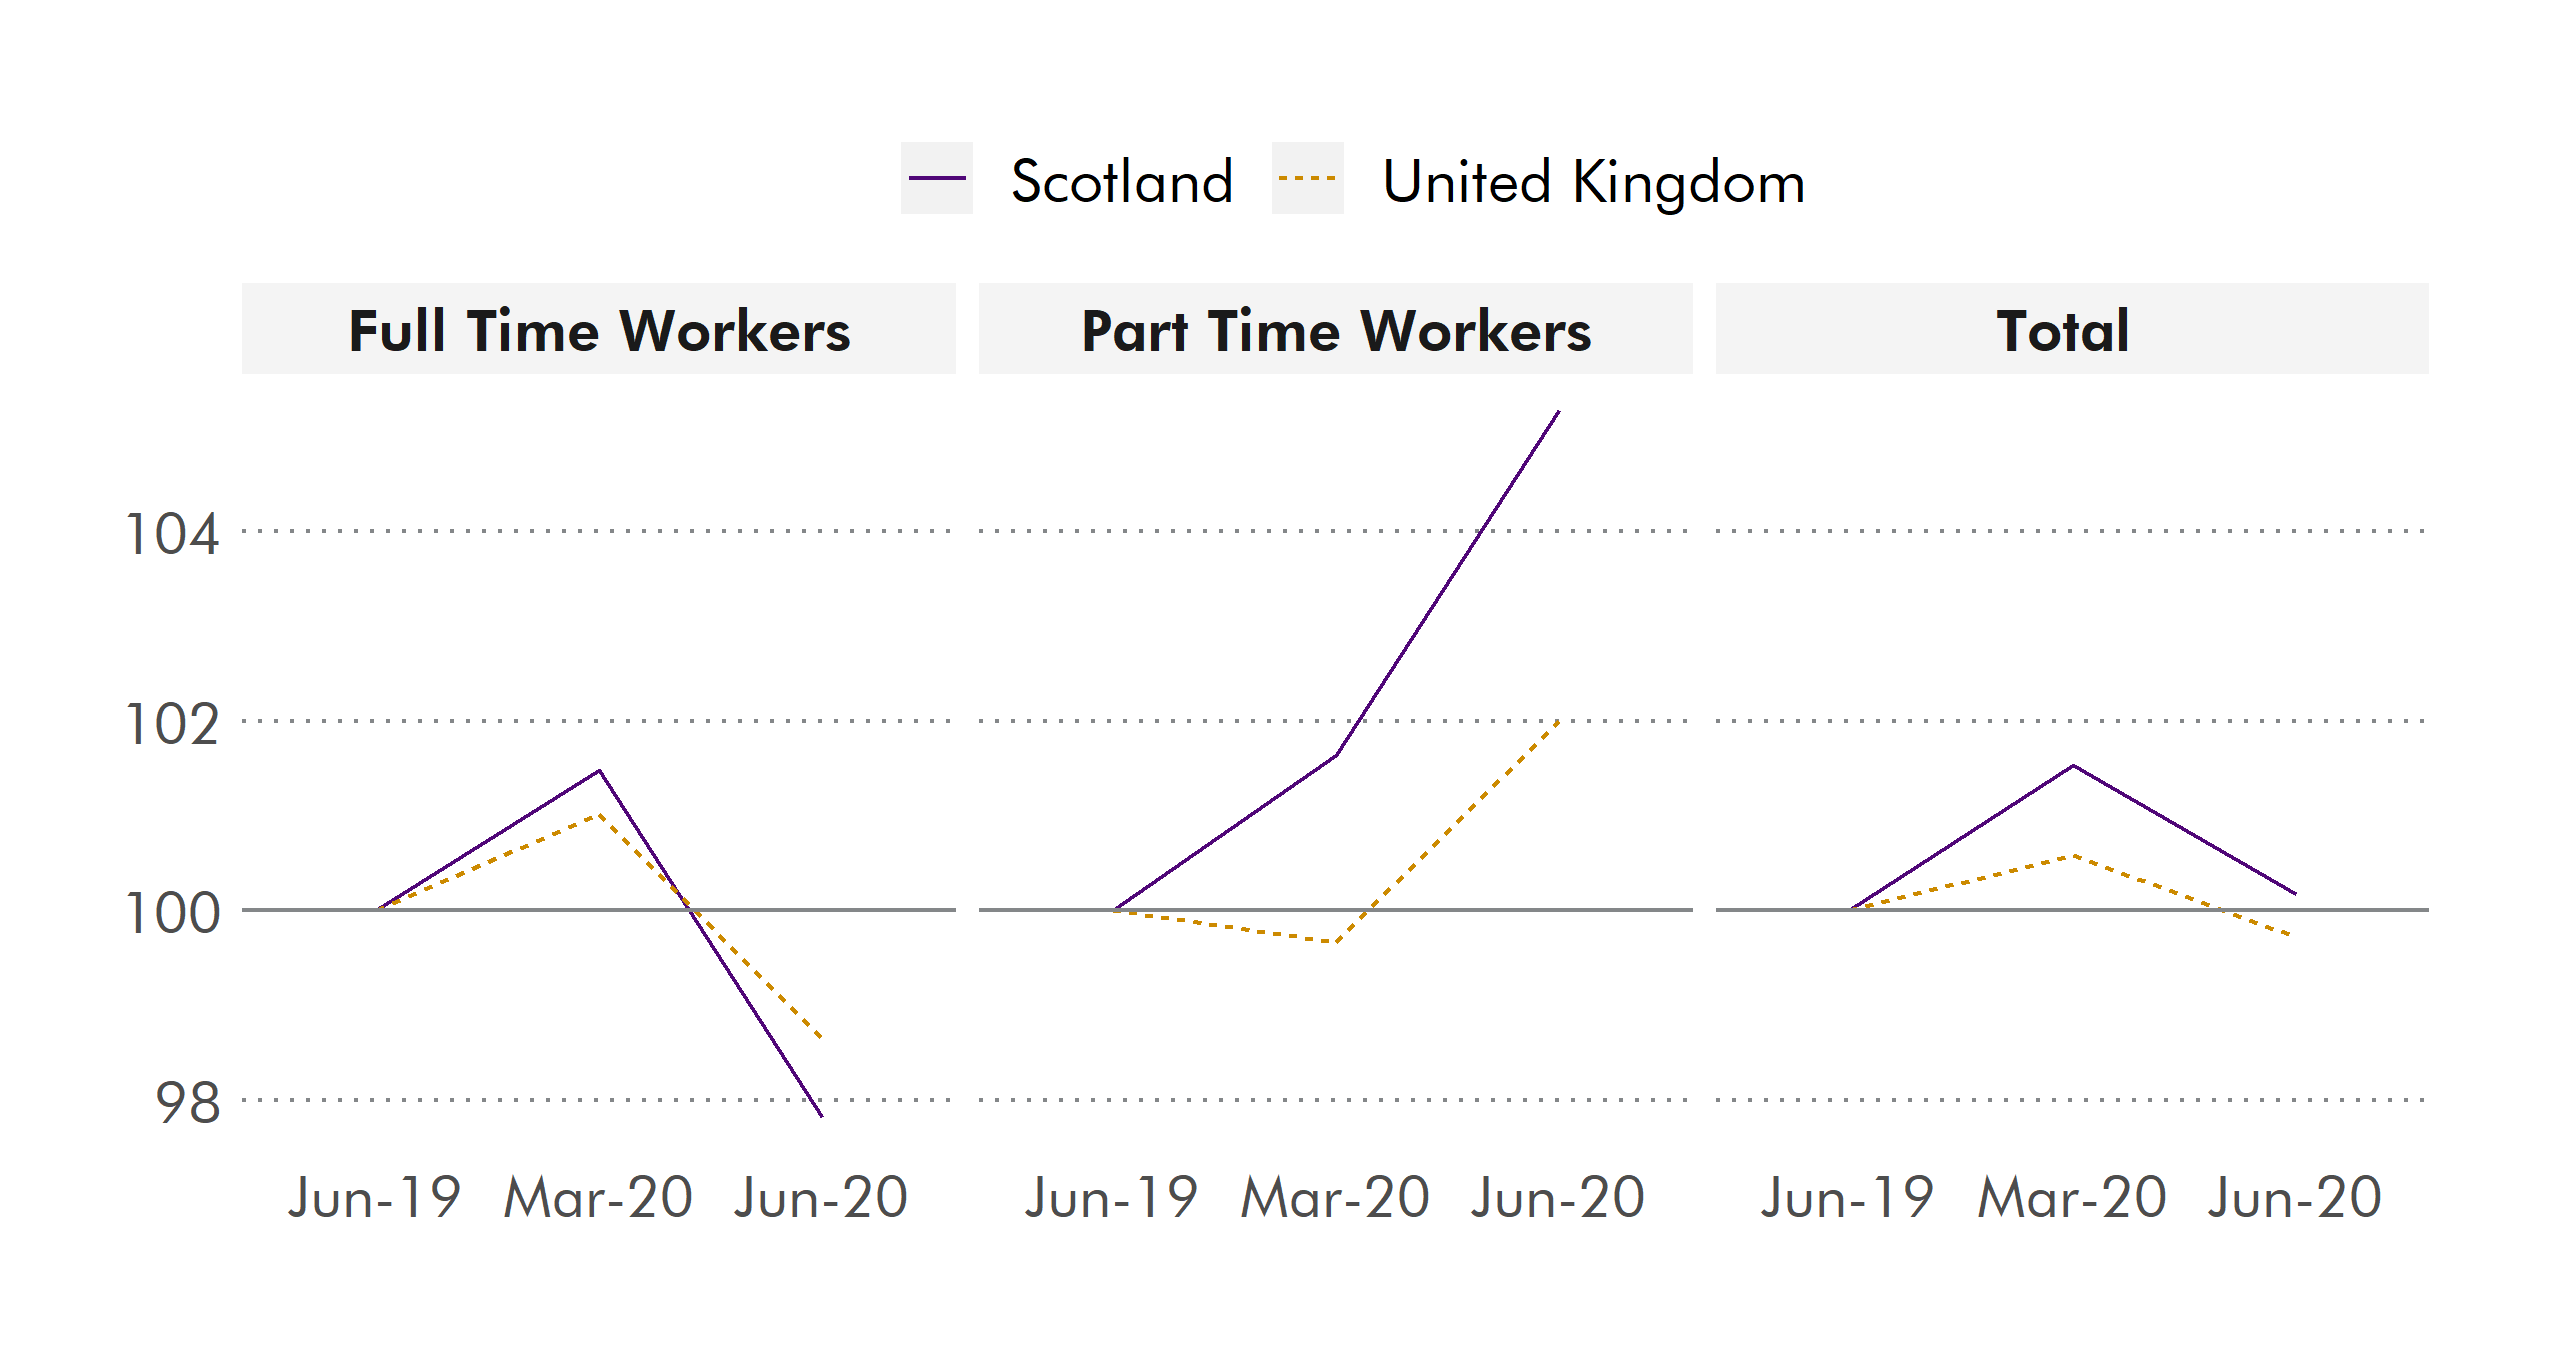
Source: Workforce Jobs via nomis
The data shows that between June 2019 and June 2020, the number of employees in Scotland increased by 4,200 or 0.2%, while the UK saw a fall of 86,000 or 0.3%. However, these headline figures mask what is going on beneath the surface.
The working pattern split shows a difference between Scotland the UK:
In Scotland, the number of full-time jobs fell by 2.2%, compared to a fall of 1.3% for the whole of the UK.
Looking at part-time employees, Scotland saw an increase of 5.3% while the UK saw an increase of 2.0%.
In this next section we discuss industry breakdowns grouped by whether the median pay for the sector is higher or lower than the median pay for all employees in Scotland. ASHE provides data on earnings by deciles. The data provides nine points which split the data into 10 equal numbers of employees - these are called deciles. This allows us to look at the distribution of pay within an industry.
Figure 3: Difference between the 1st and 9th pay decile of gross weekly pay for all employees of selected industries in Scotland - 2019
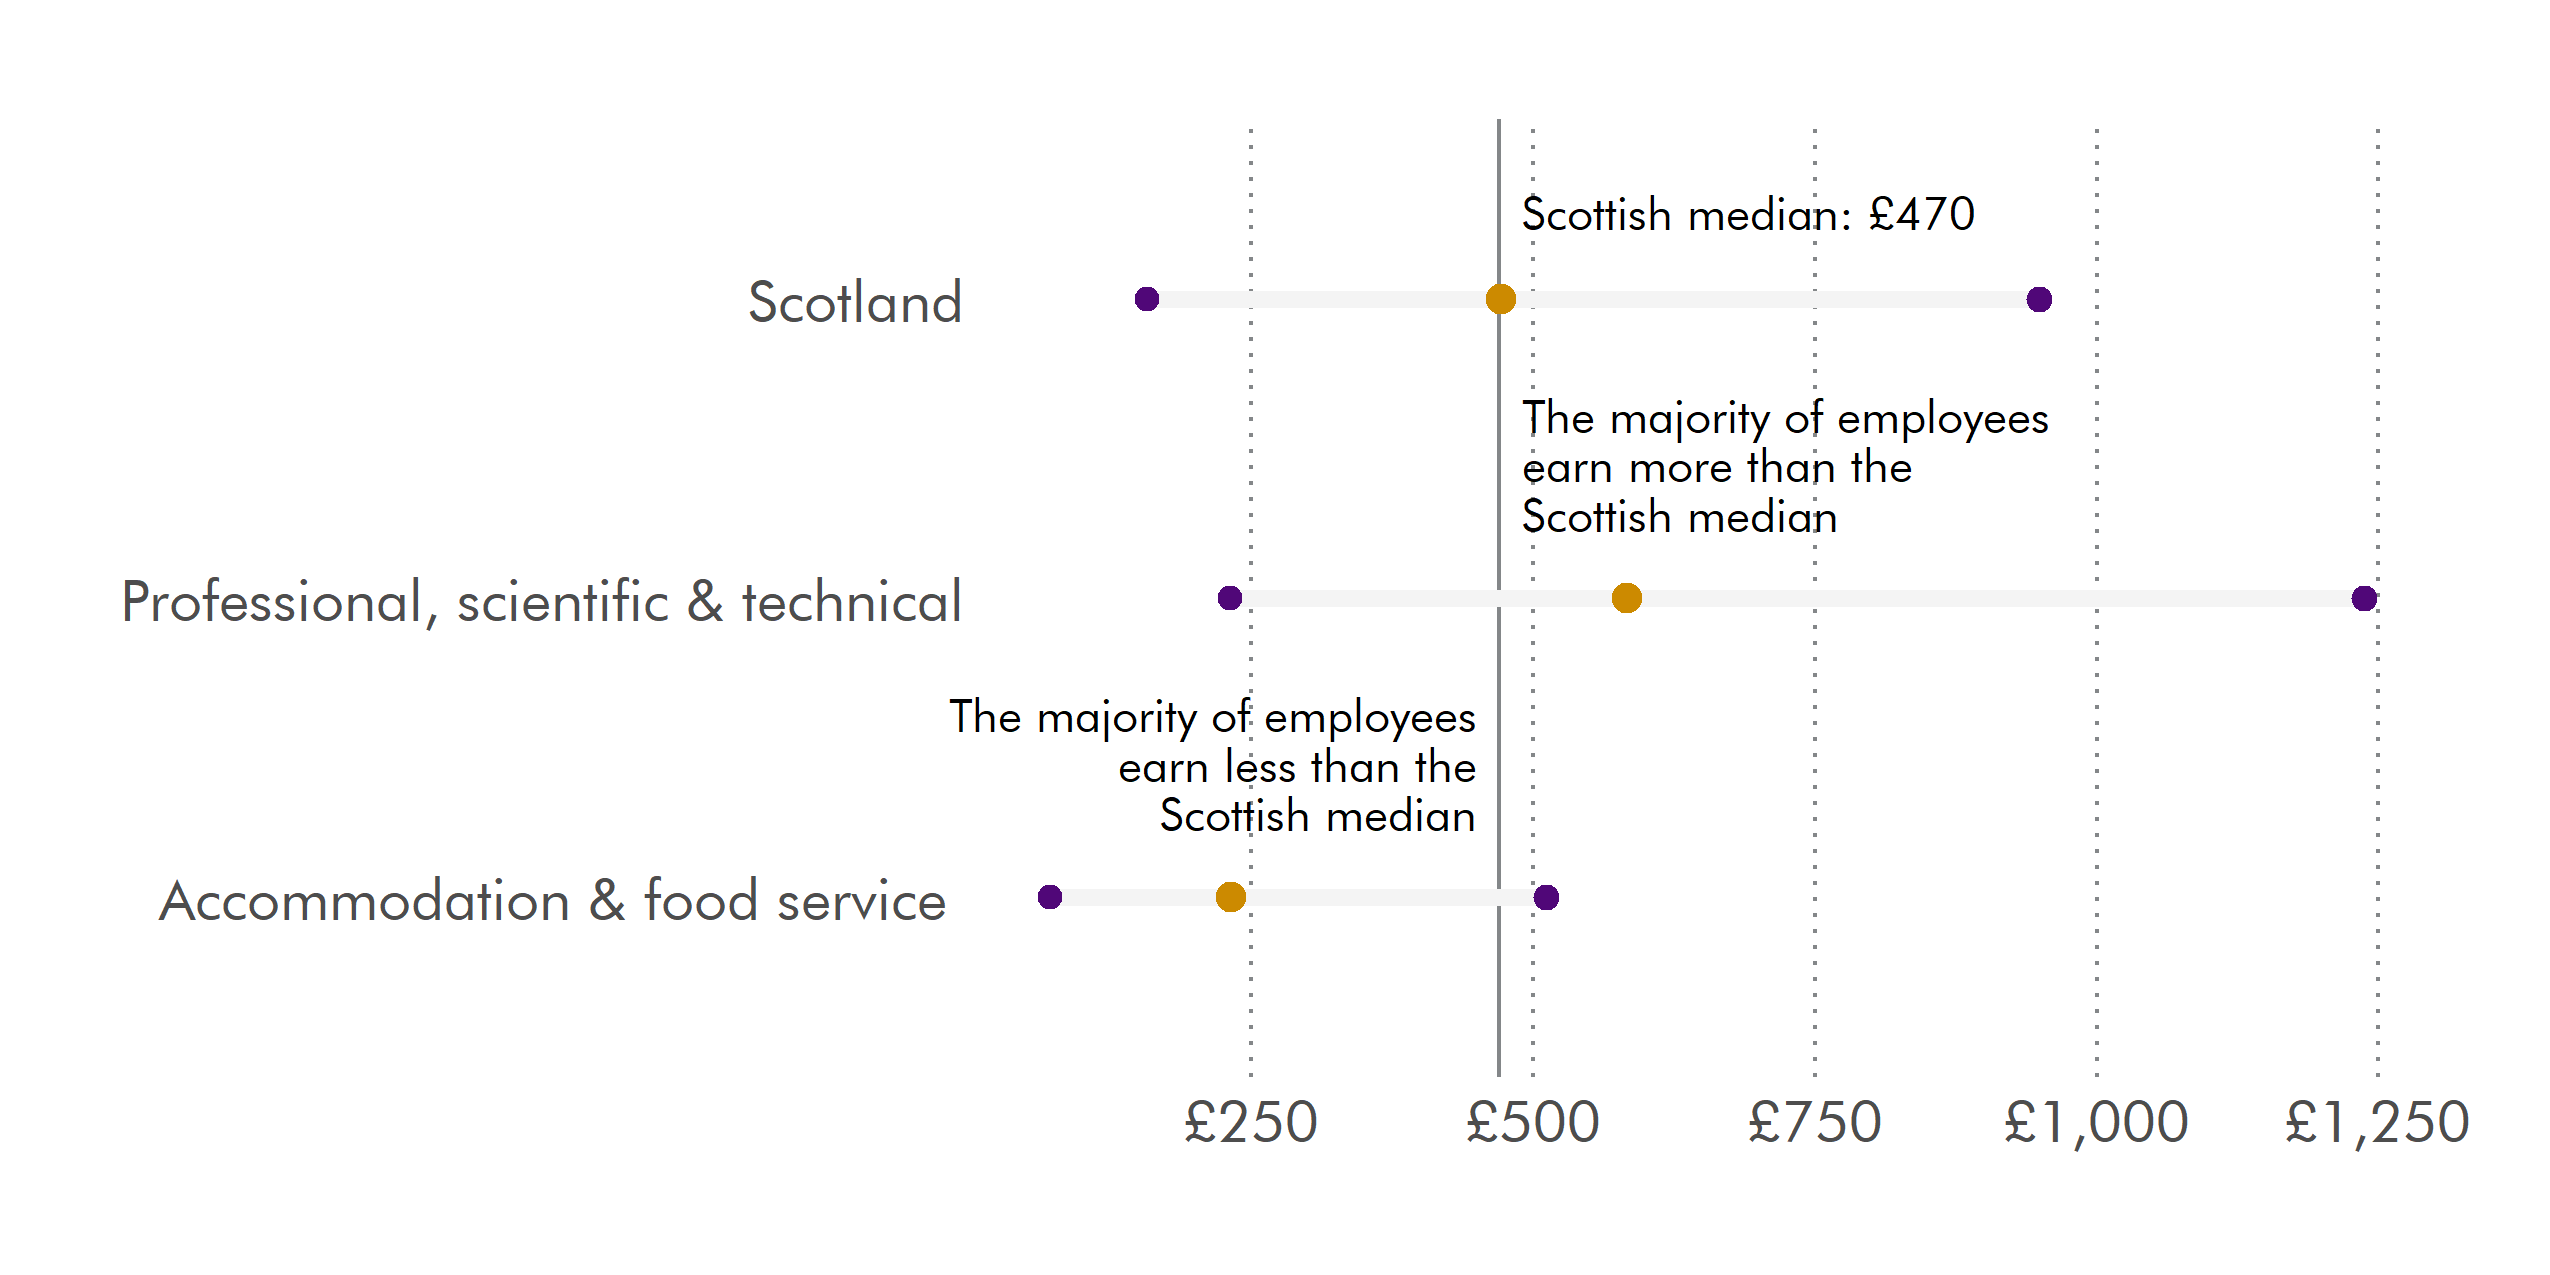
It is important to note that although an industry's median pay may be above or below the Scottish figure, there will be employees within those industries whose pay will be higher or lower than the Scottish median.
For example:
Accommodation and food service: the median is well below the Scottish figure, but there are still between 10 and 20% who earn more than the Scottish median.
Professional, scientific and technical industry: the median is above the Scottish figure, but between 30 and 40% earn less than the Scottish median.
Looking at this further shows that at least 90% of part-time employees, around a third of all employees in Scotland, earn less than the Scottish median. While for full-time employees, between 30% and 40% earn less than the Scottish median.
Figure 4: Proportion of part-time employees in industries grouped by median pay, 2019
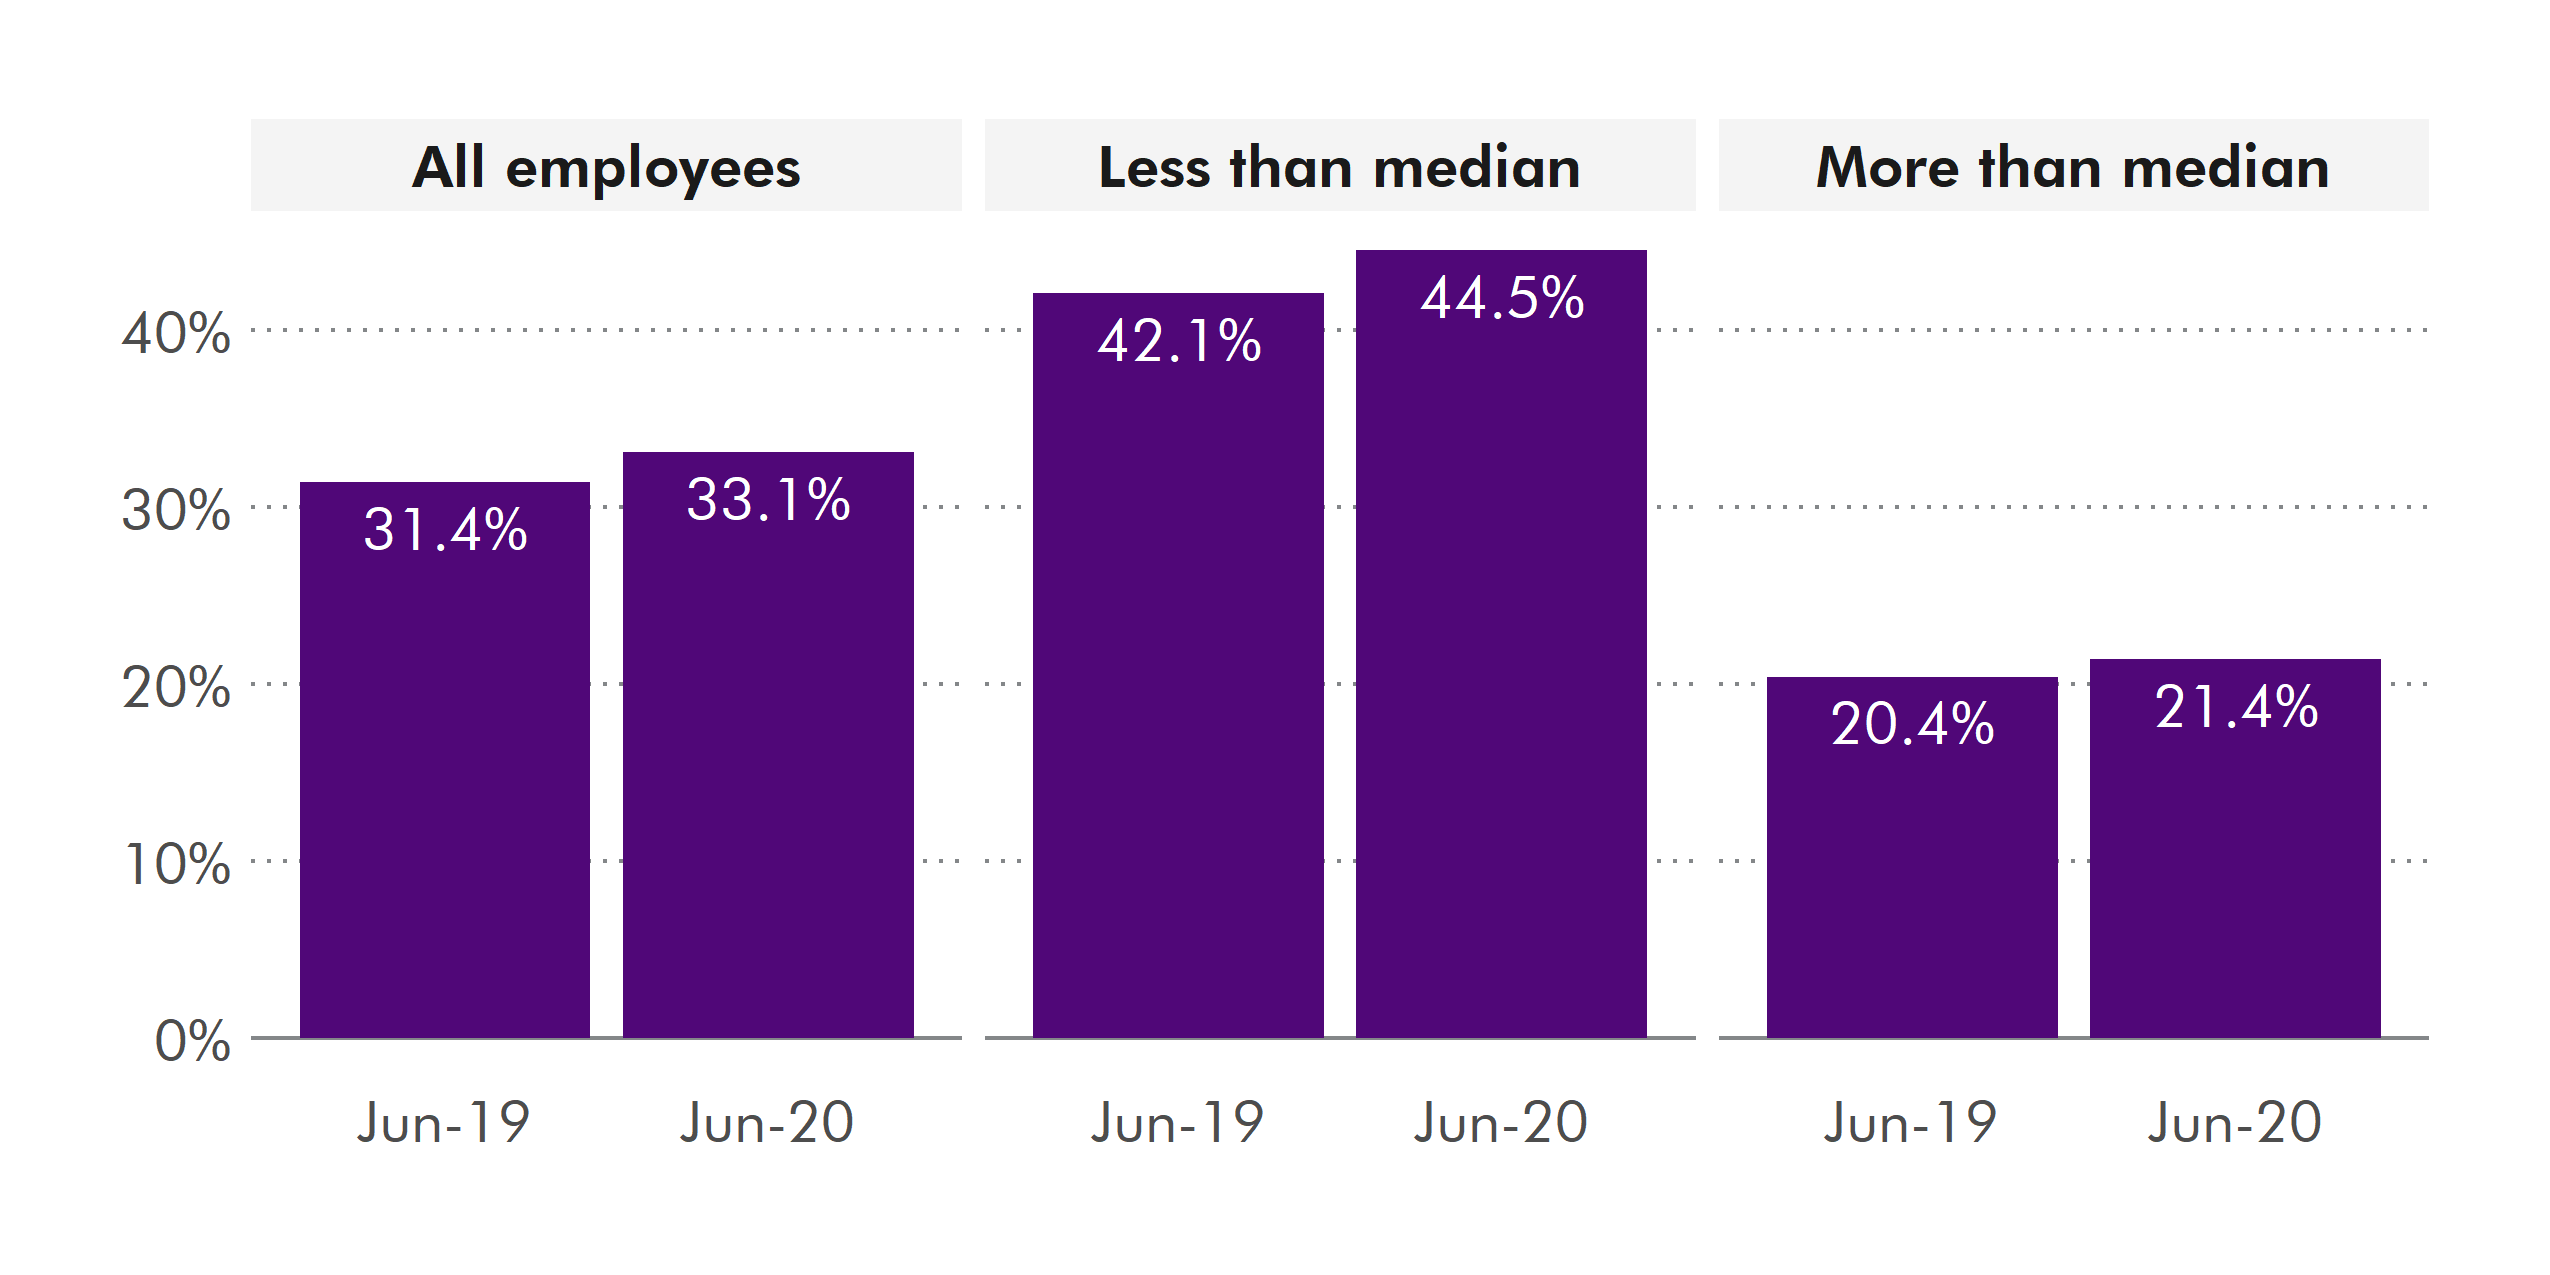
Between June 2019 and June 2020, the proportion of employees in Scotland working part-time increased from 31.4% to 33.1%. We broke this down by whether median pay in 2019 for the sector is above or below the Scotland-wide median for 2019. While there are employees within sectors that get paid either above or below the Scottish median, it gives a general idea of the importance that part-time work has on the overall pay figure.
So, industries where the median pay is below the Scottish median have seen a higher increase in part-time employees than higher paid industries . But why is this important? Part-time employment tends to be lower paid, and this could impact where median pay sits for individual industries.
Figure 5: Change in number of employees by working pattern, grouped by gross weekly median pay - 2019
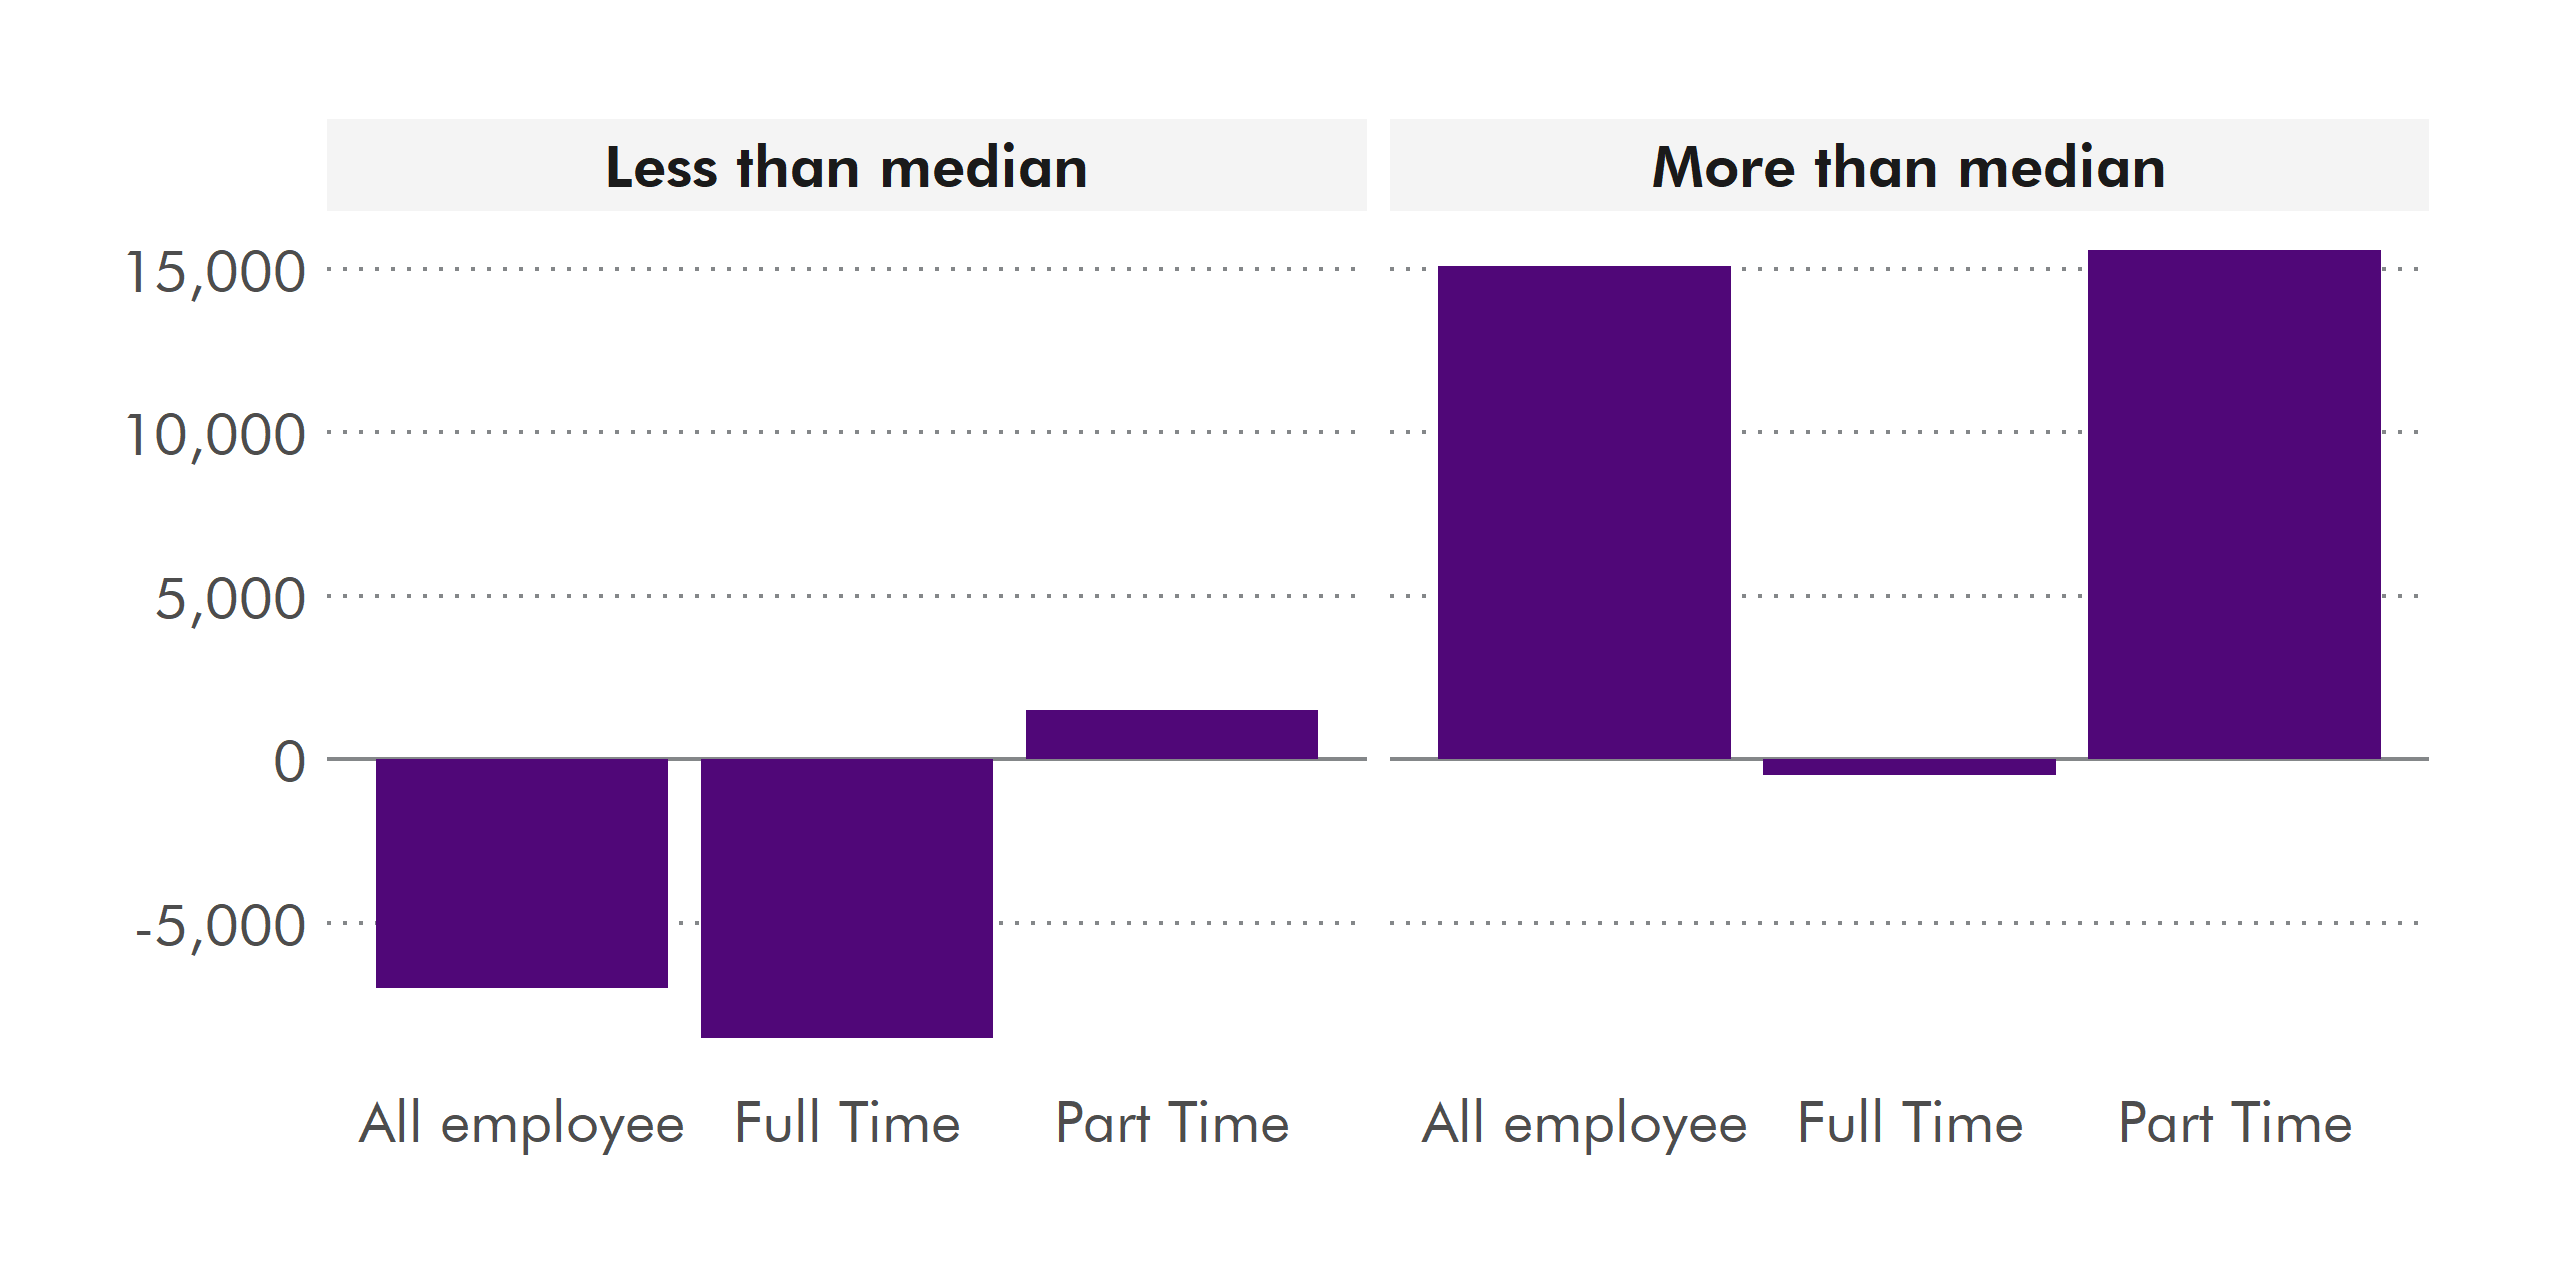
The total number of employees in Scotland increased by 5,600 between June 2019 and June 2020. We have again further broken this down by whether median pay for the sector is above or below the Scotland wide median for 2019. Using this measure shows that the number of jobs in lower-paid industries has fallen by around 10,000 while the number in higher-paid industries has increased by around 15,000.
Again, there will be jobs within these sectors which will be paid either above or below the Scottish median, but this does give an indication that there has been an increase in jobs in sectors with higher than median pay.
Typical salaries in Scotland
This section looks at annual salaries for all employees in Scotland, broken down by those in full-time and part-time employment,and how these numbers compare to the other regions and nations of the UK.
The ASHE analysis for annual earnings relates to employees who have been in the same job for more than one year. The ONS have stated the annual pay estimates are largely unaffected by the Coronavirus (COVID-19) pandemic.
What is the typical salary for all employees in Scotland?
This section looks at typical salaries for all employees in Scotland and across the UK.
Figure 6: Gross annual pay for all employees and real terms change from 2019 across the nations and regions of the UK - 2020
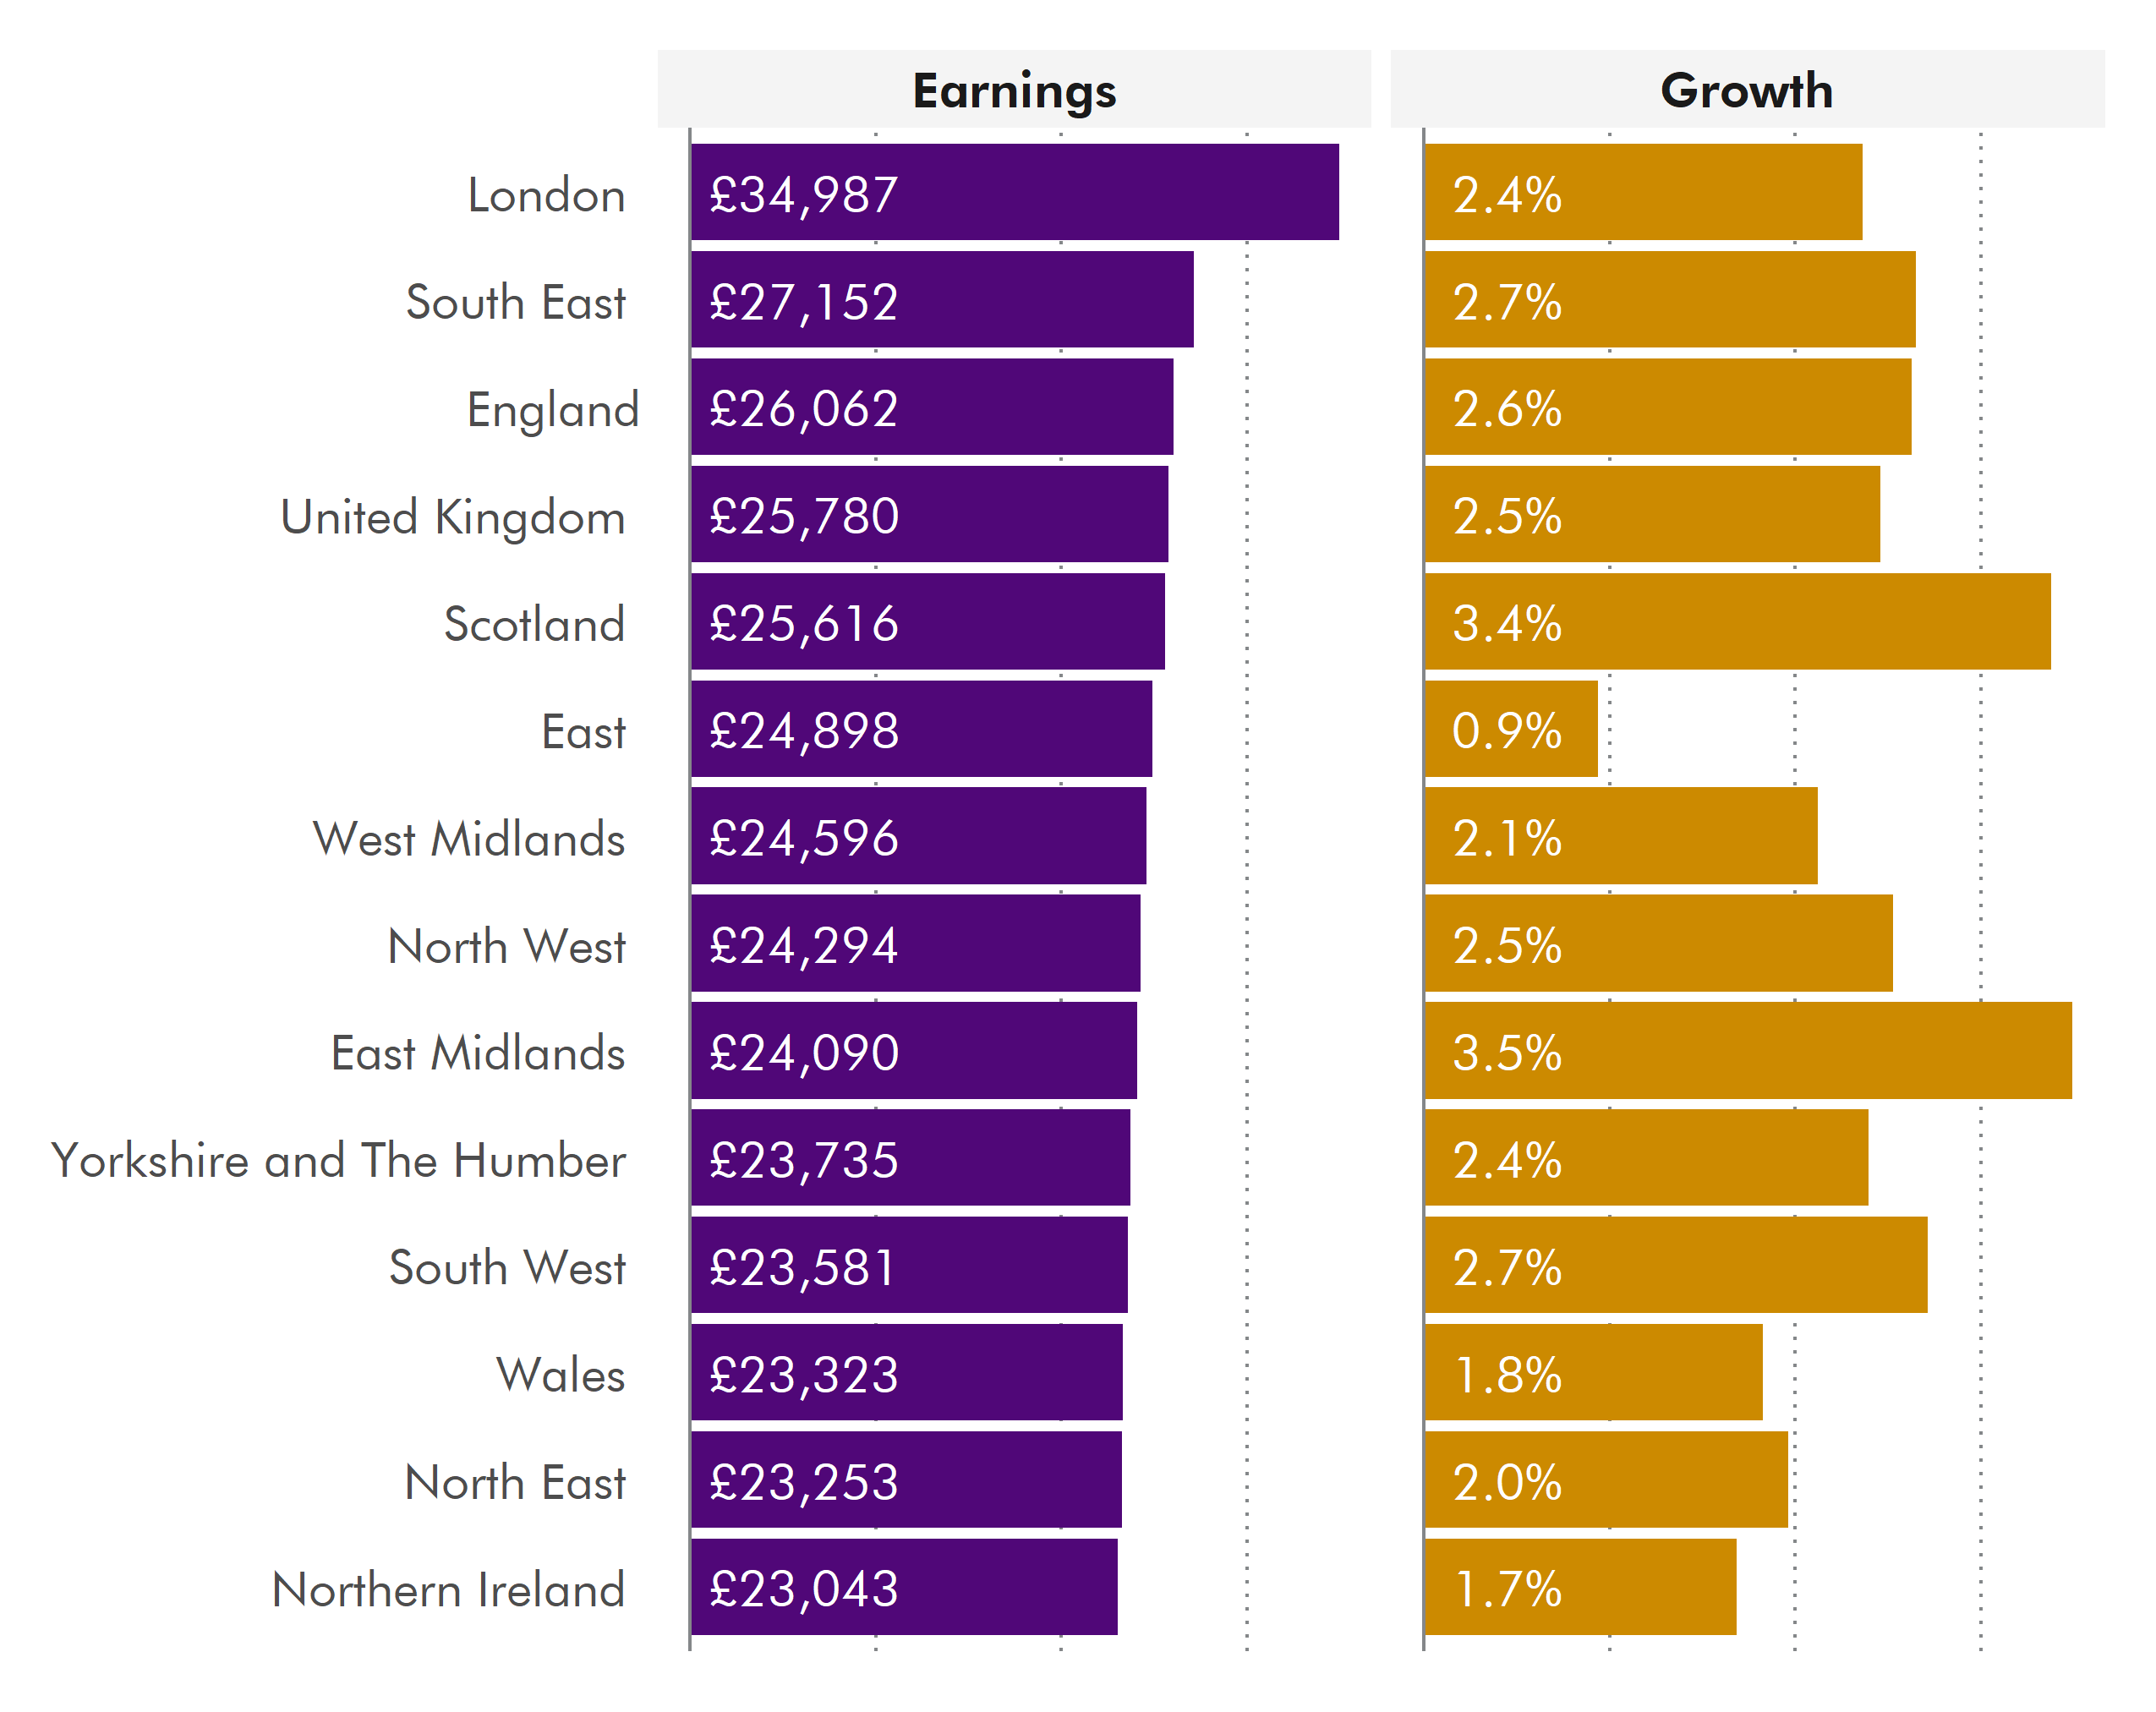
In April 2020 the typical salary for all employees in Scotland was £25,616, which is just below the UK wide figure of £25,780. London has the highest typical salary at £34,987 while Northern Ireland has the lowest at £23,043.
The typical salary in Scotland grew by 3.4% in real terms, which was higher than the UK wide figure of 2.5%. The East of England saw the lowest growth at 0.9% while the East Midlands saw the highest at 3.5%.
Care should be taken when interpreting these figures due to issues with this year's data. You can find out more in this in the "about the data" section of the briefing.
What is the typical salary for full-time employees in Scotland?
This section looks at typical salaries for full-time employees in Scotland and across the UK.
Figure 7: Gross annual pay for full-time employees and real terms change from 2019 across the nations and regions of the UK - 2020
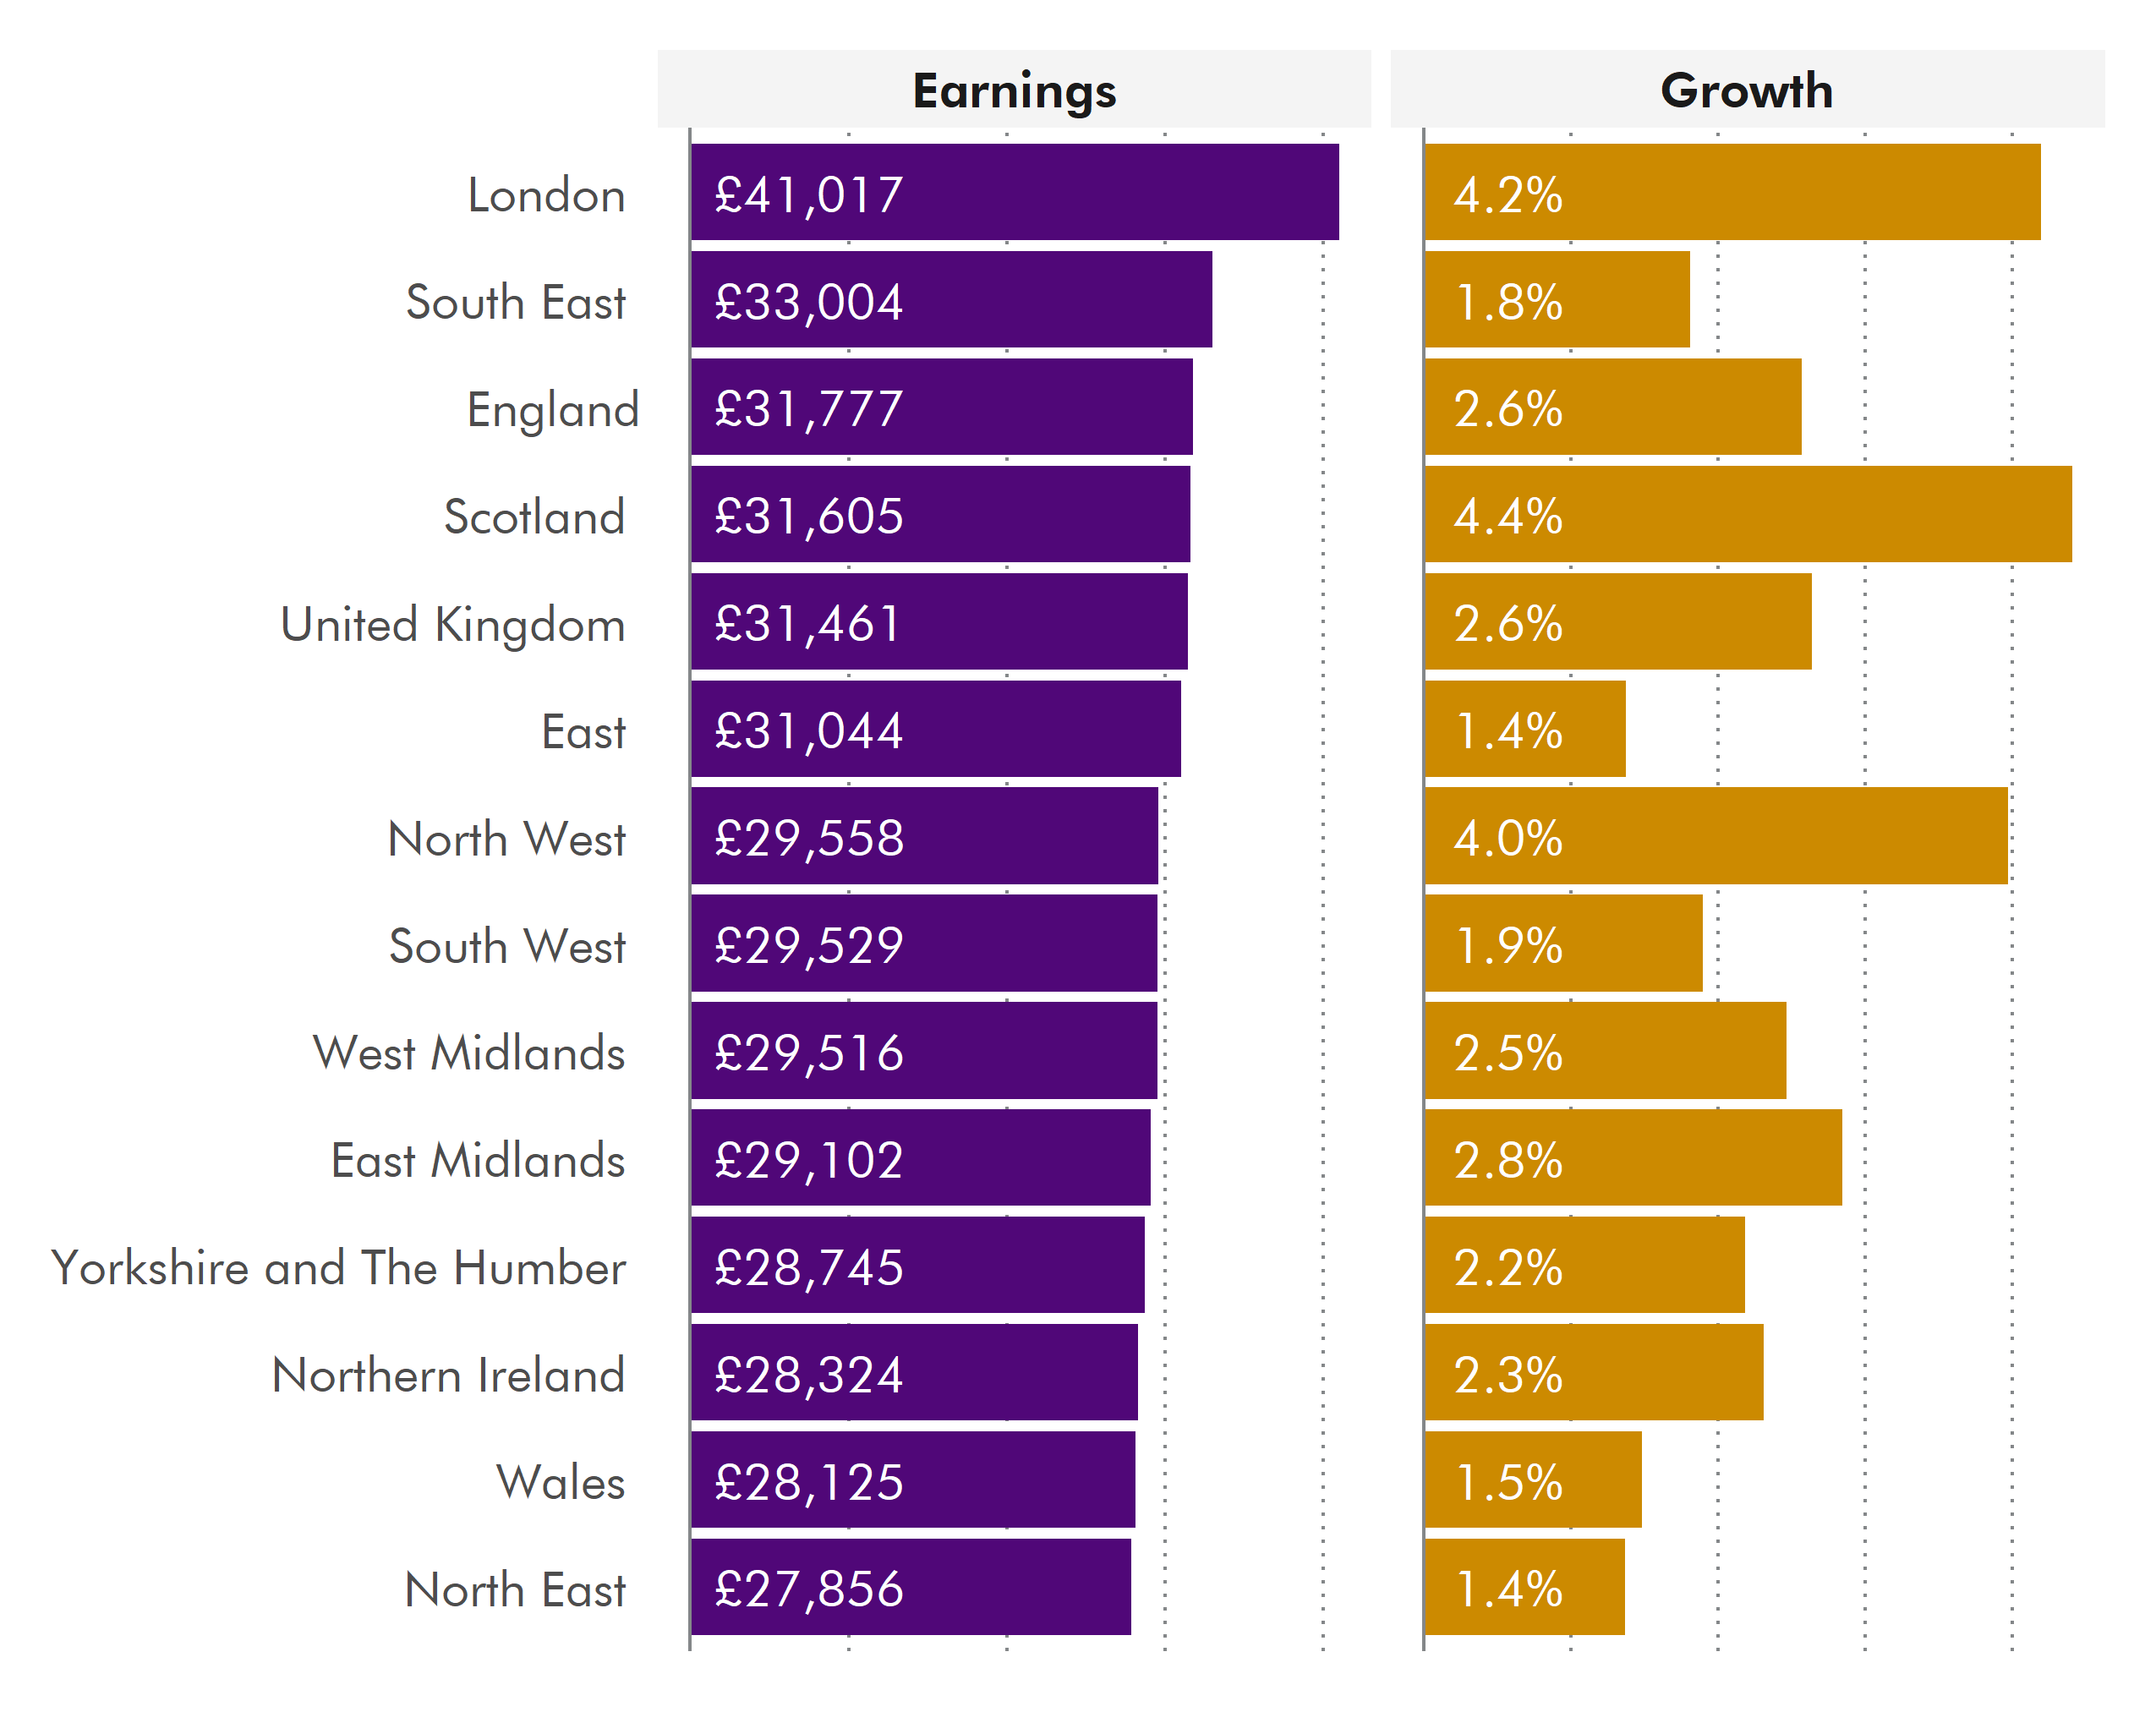
In April 2020 the typical salary for full-time employees in Scotland was £31,605, which is just above the UK wide figure of £31,461. London has the highest typical salary at£41,017 while the North East of England has the lowest at around £27,856.
The typical full-time salary in Scotland grew by 4.4% in real terms, which was the highest across the UK. The East and North East of England saw the lowest growth at 1.4%.
Care should be taken when interpreting these figures due to issues with this year's data. You can find out more in this in the "about the data" section of the briefing.
What is the typical salary for part-time employees in Scotland?
This section looks at typical salaries for part-time employees in Scotland and across the UK.
When looking at part-time pay it is important to note:
Part-time jobs tend to be more impacted by increases in National Minimum Wage rates, due to a typical lower hourly rate.
Flexible working patterns can change employee job profiles from full-time to part-time, whilst retaining the higher hourly pay rates.
Figure 8: Gross annual pay for part-time employees and real terms change from 2019 across the nations and regions of the UK - 2020
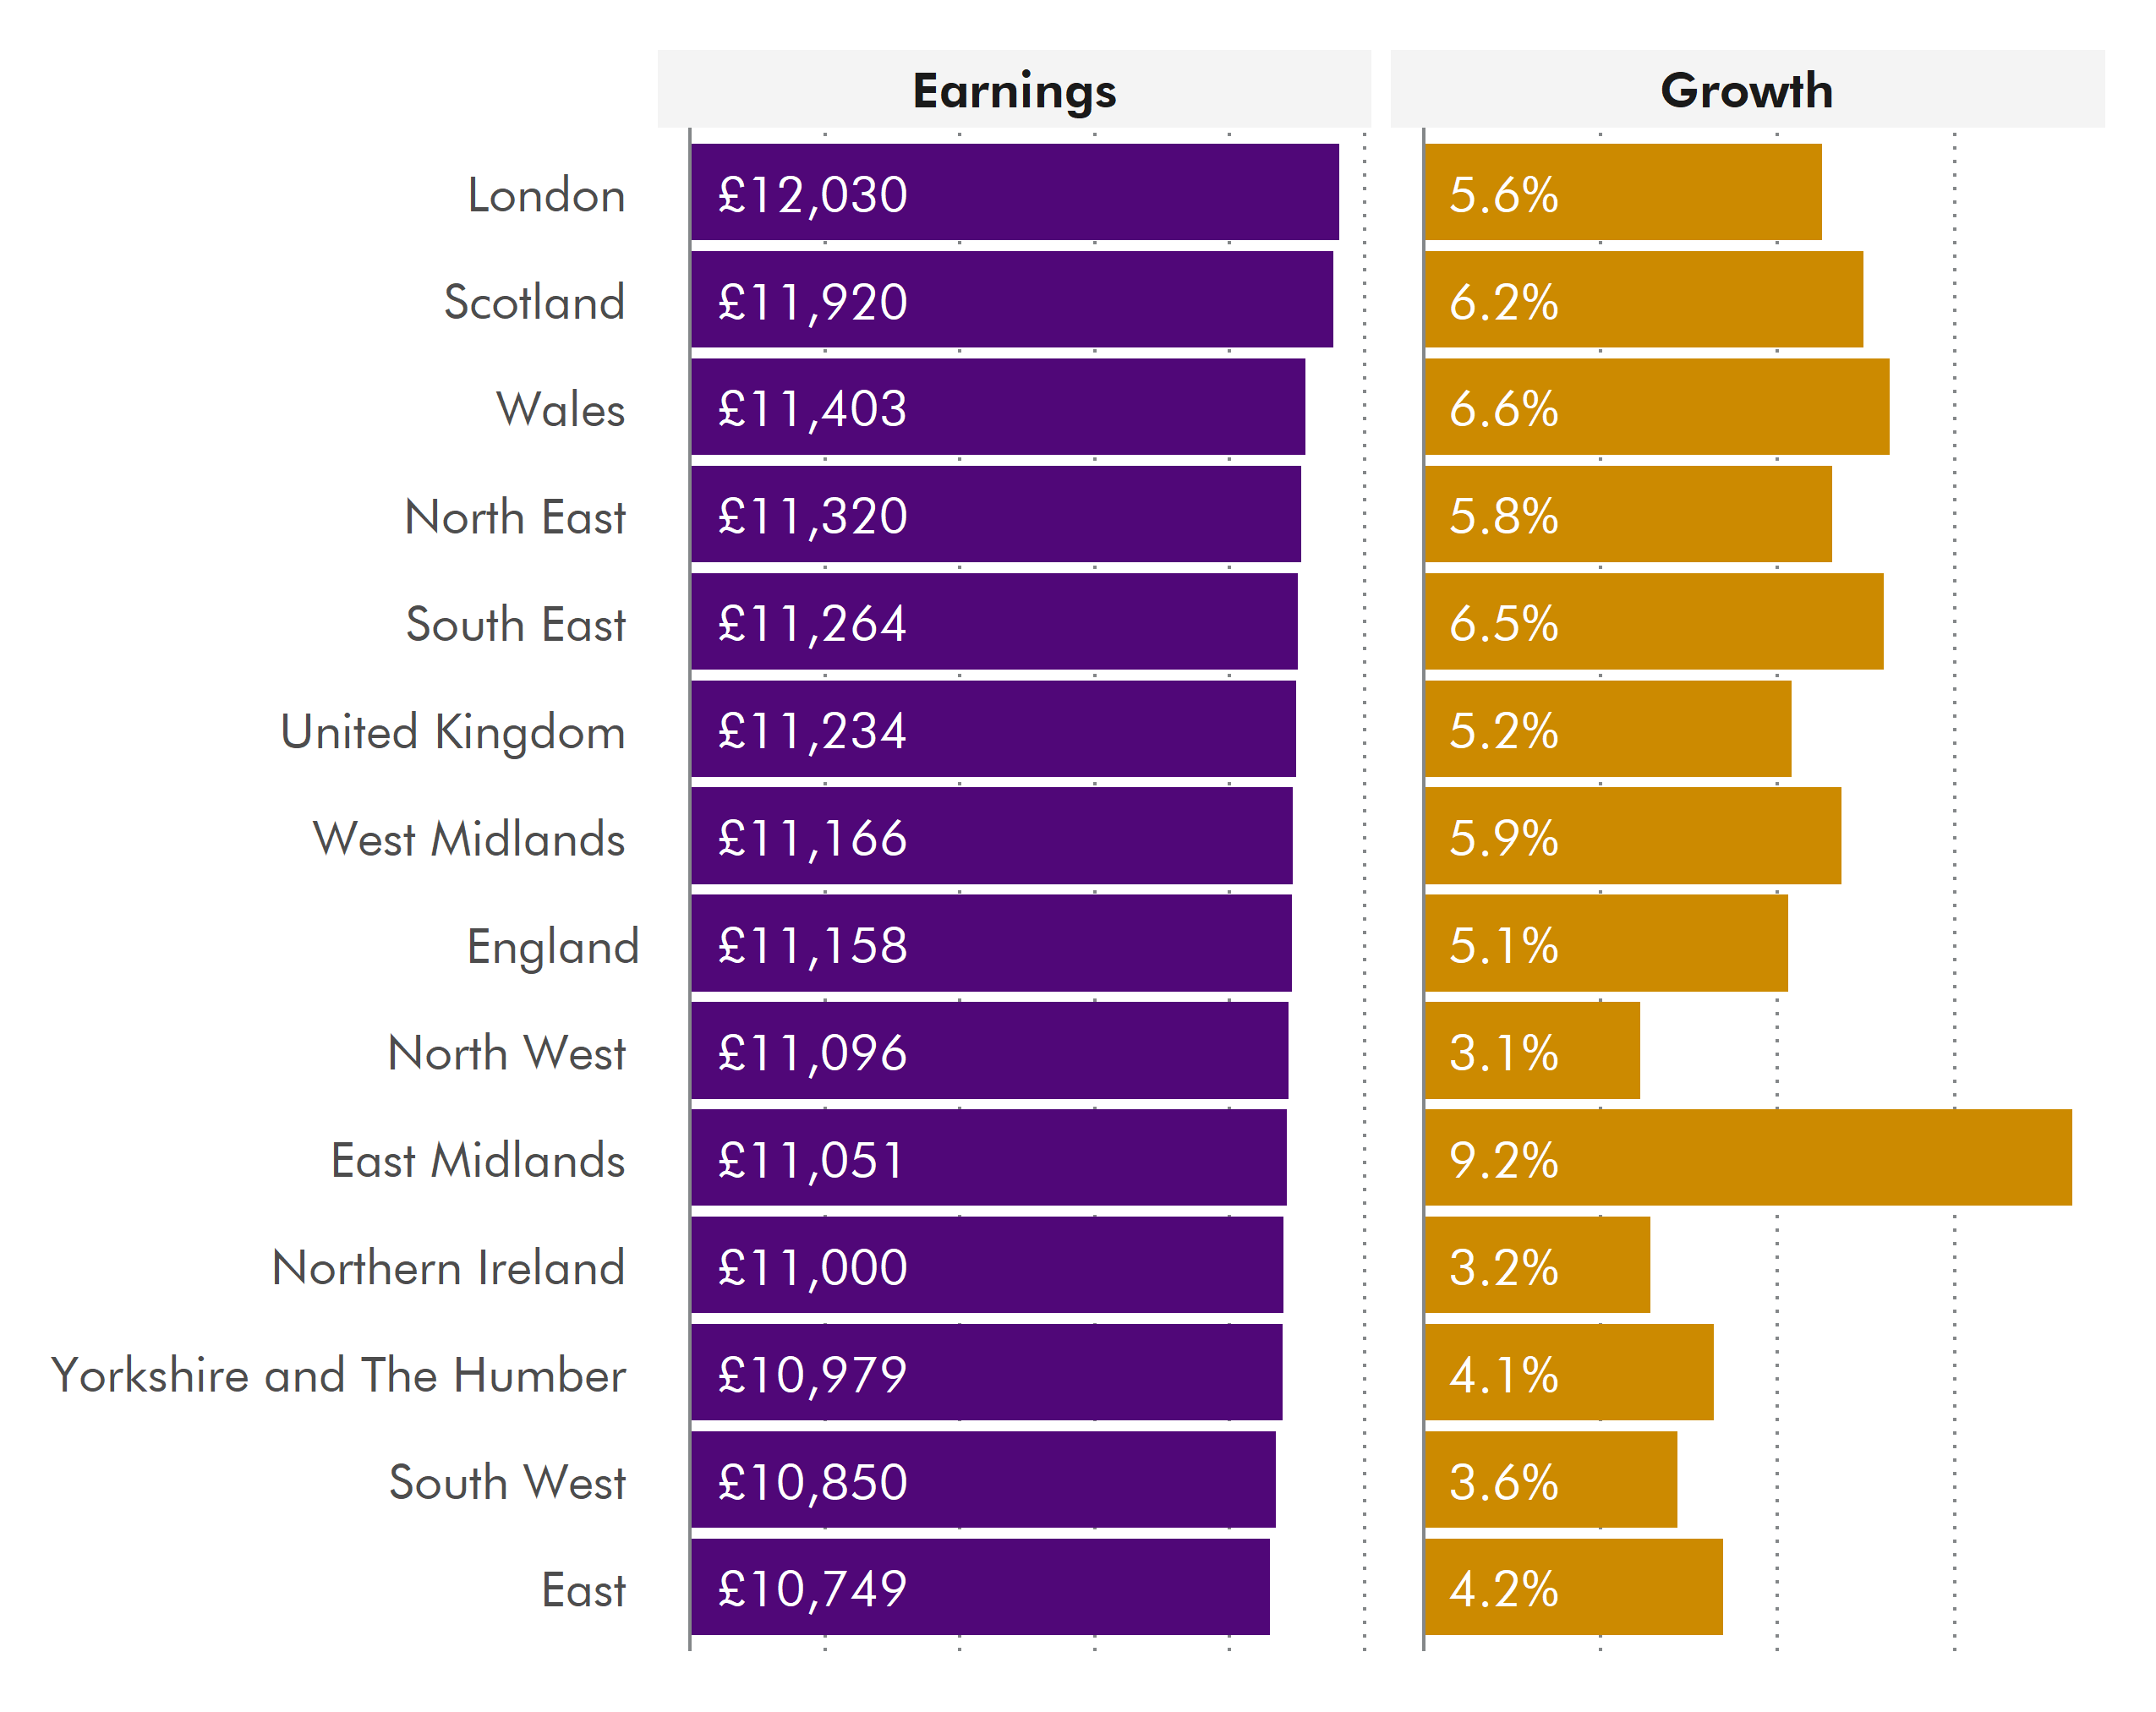
In April 2020 the typical salary for part-time employees in Scotland was £11,920, which is the second highest across the UK. London has the highest part-time salary at £12,030 while the East of England has the lowest at £10,749.
The typical part-time salary in Scotland grew by 6.2% in real terms, which was higher than the the UK as a whole, at 5.2%. The North West of England saw the lowest growth at 3.1%.
Care should be taken when interpreting these figures due to issues with this year's data. You can find out more in this in the "about the data" section of the briefing.
Typical weekly pay in Scotland
This section looks at weekly pay for all employees in Scotland, broken down by those in full-time and part-time employment,and how these numbers compare to the other regions and nations of the UK.
ASHE analyses for weekly earnings relate to employees on adult rates whose earnings for the survey pay period were not affected by absence. They do not include the earnings of those who did not work a full week, and whose earnings were reduced because of, for example, sickness.
Weekly pay is the main measure used by the ONS.
What is typical weekly pay for all employees in Scotland?
This section looks at typical weekly pay for all employees in Scotland and across the UK.
Figure 9: Gross weekly pay for all employees and real terms change from 2019 across the nations and regions of the UK - 2020
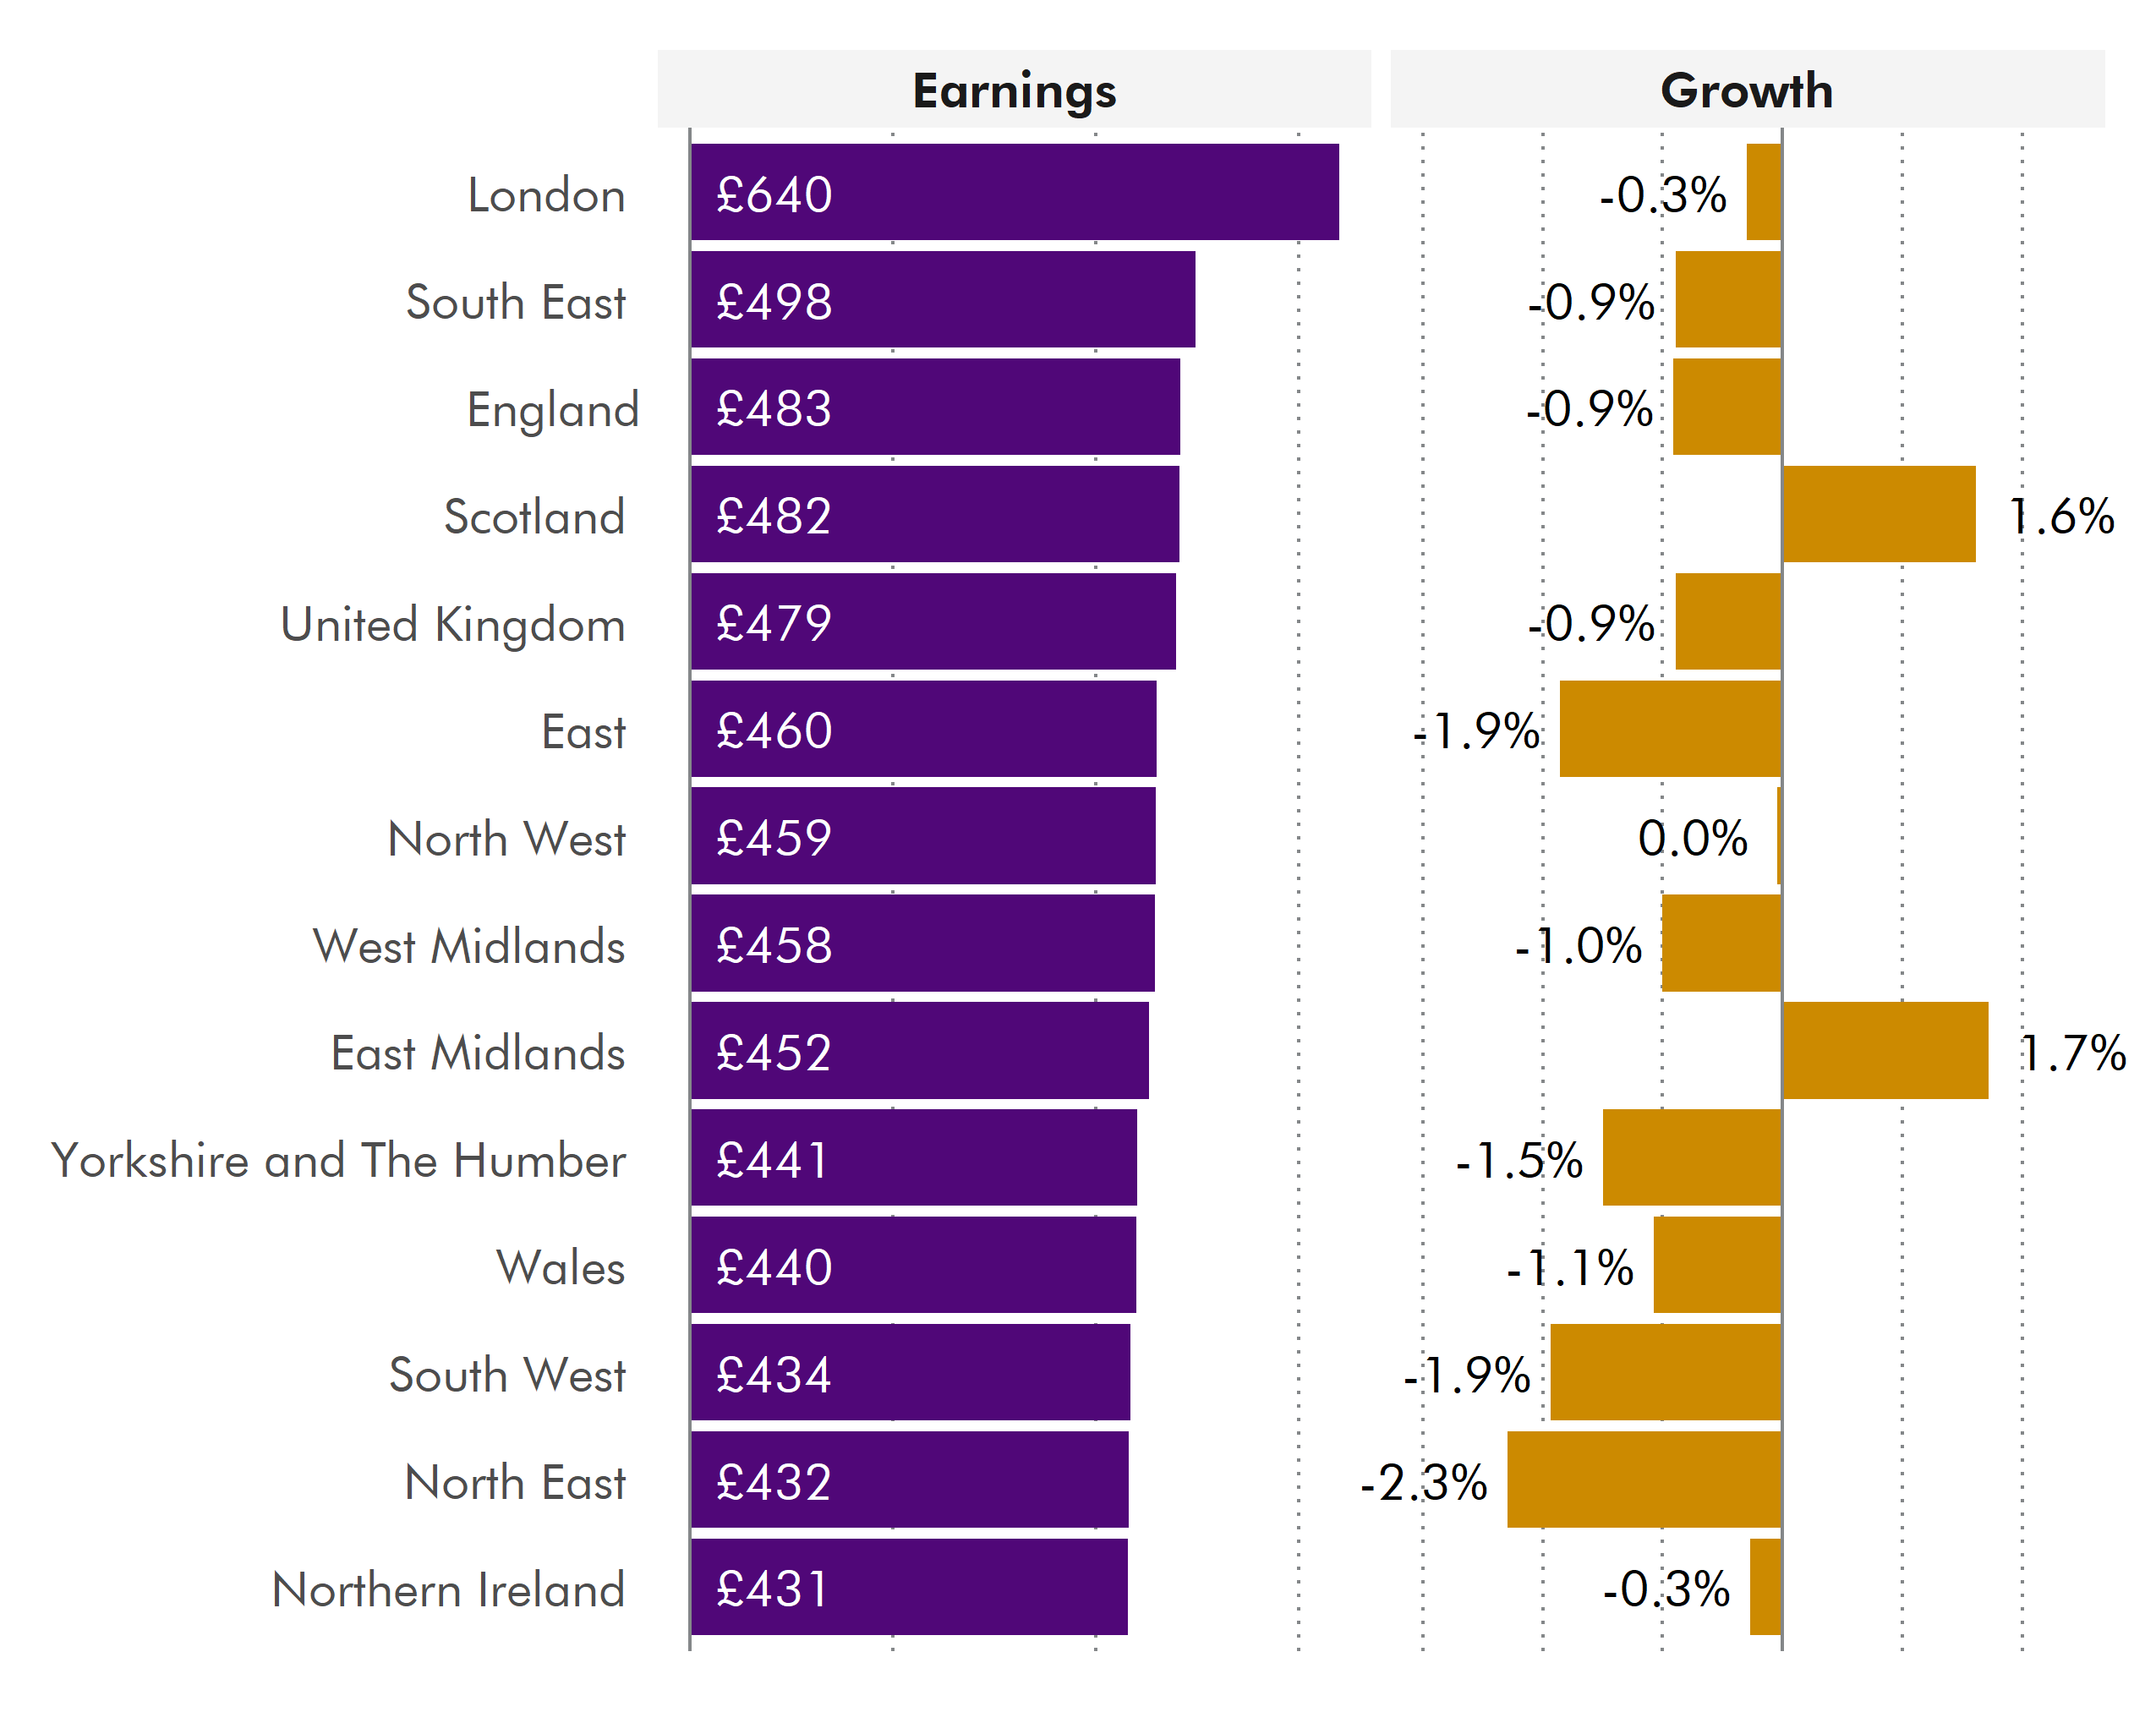
Gross weekly pay in Scotland is just higher than the UK, £482 compared to £479. London has the highest weekly pay at £640 while Northern Ireland has the lowest at £431. Only Scotland and the East Midlands saw increases to weekly pay in real terms. The North East of England saw the largest decrease at 2.3% in real terms.
Care should be taken when interpreting these figures due to issues with this year's data. You can find out more in this in the "about the data" section of the briefing.
Growth in weekly pay for all employees by decile
ASHE provides data on earnings by deciles. The data provides nine points which split the data into 10 equal numbers of employees. For example in Scotland the gross pay for the 1st decile is £161 per week, therefore 10% of employees earn between £0 and £161 per week. The ninth decile point is at gross pay of £971 per week and 10% of employees earn this and above.
Figure 10: Gross weekly pay for all employees and real terms change from 2019 across the nations and regions of the UK - 2020
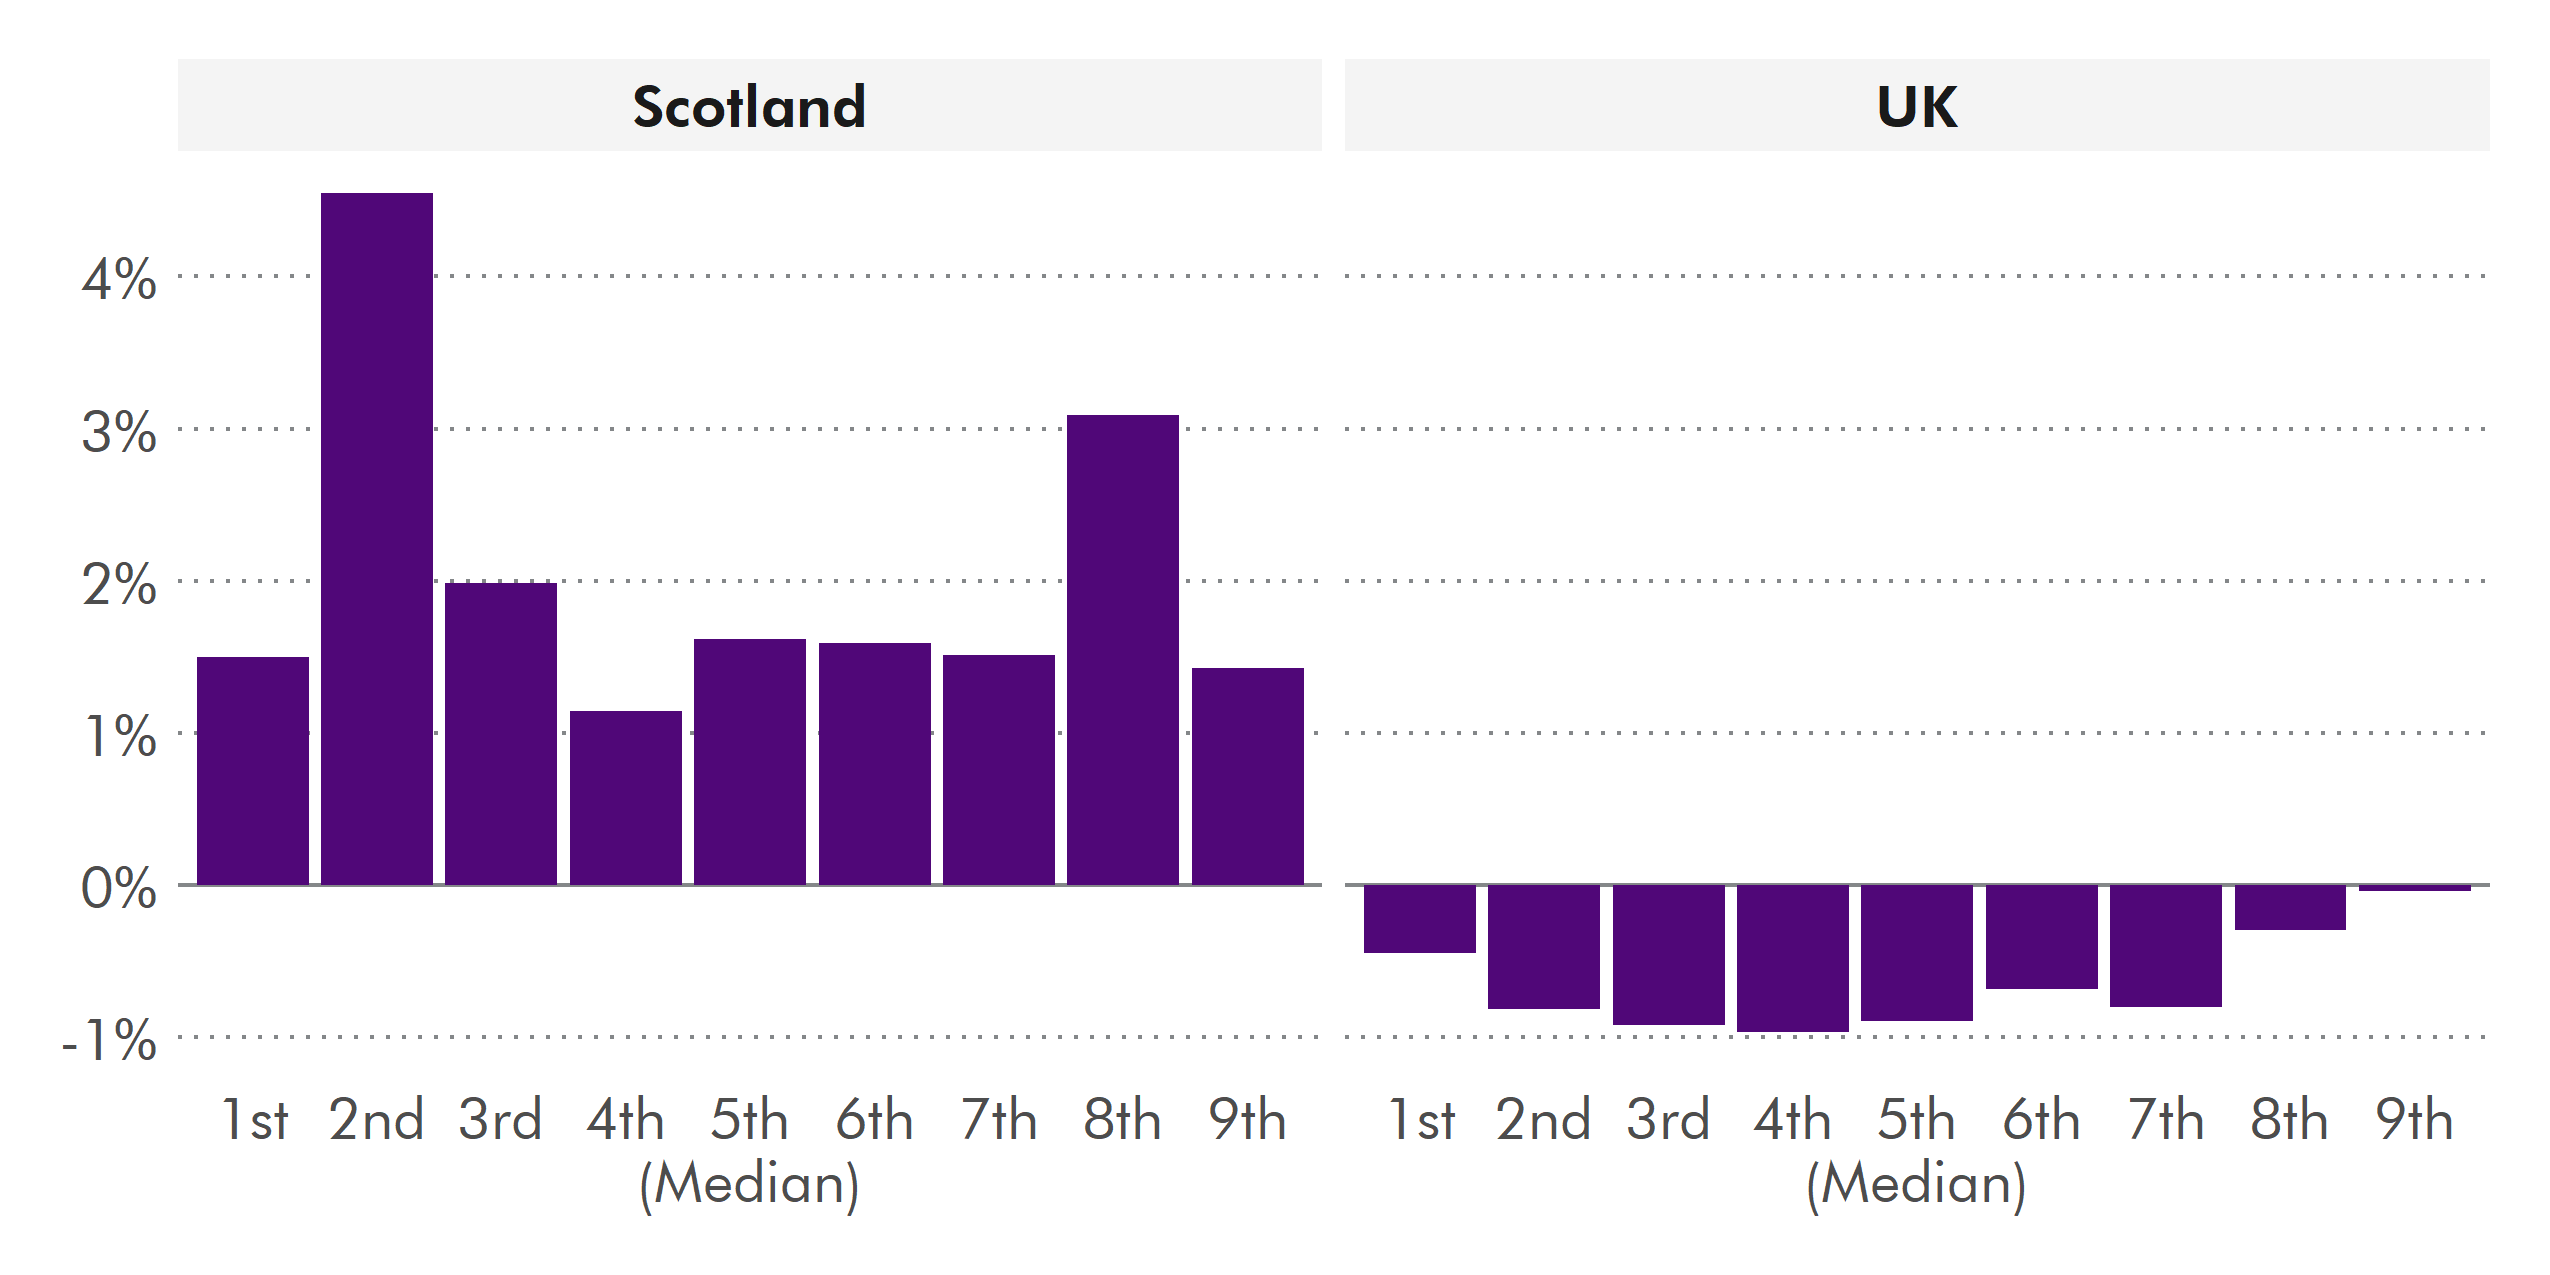
The difference between Scotland and the UK as a whole is stark. Scotland has seen increases at every decile in real terms while the UK has seen falls at every decile. It is difficult to explain why this is as there are many factors which could be behind this difference. For example, Scotland has seen an increase in the number of employees between 2019 and 2020 while the UK saw a decrease. We explore the change in the labour market in more detail in the economic "context section."
We can look at the ratio of the 9th point, or 90th percentile, and the 1st point, or the 10th percentile, to give us an idea of the difference between high and low earners. When looking at this measure the UK has a higher ratio than Scotland. The ratio is unchanged over the year in Scotland, due to rounding, while it has slightly increased in the UK.
| 2019 | 2020 | Growth | |
|---|---|---|---|
| UK | 5.66 | 5.69 | 0.03 |
| Scotland | 5.03 | 5.02 | 0.00 |
Care should be taken when interpreting these figures due to issues with this year's data. You can find out more in this in the "about the data" section of the briefing.
Ten-year change in weekly pay for all employees
This section looks at typical weekly pay for all employees in Scotland and across the UK and how it has changed over the last ten years. ASHE provides data on earnings by deciles. The data provides nine points which split the data into 10 equal numbers of employees.
This section looks at growth for three deciles:
1st decile or bottom 10%: This decile identifies the the bottom 10% of employee earnings. For example if the 1st decile is £160 then 10% of employees earn less than this.
5th decile or median: This is the point which splits the number of employees in half.
9th decile or top 10%: This decile identifies the the top 10% of employee earnings. For example if the 9th decile is £970 then 10% of employees earn more than this.
The figures in the section are in real terms based on the CPIH for the April of each year.
Figure 11: Real term gross weekly pay for all employees, indexed to 2010, for the bottom 10%, median and top 10% - 2010 to 2020
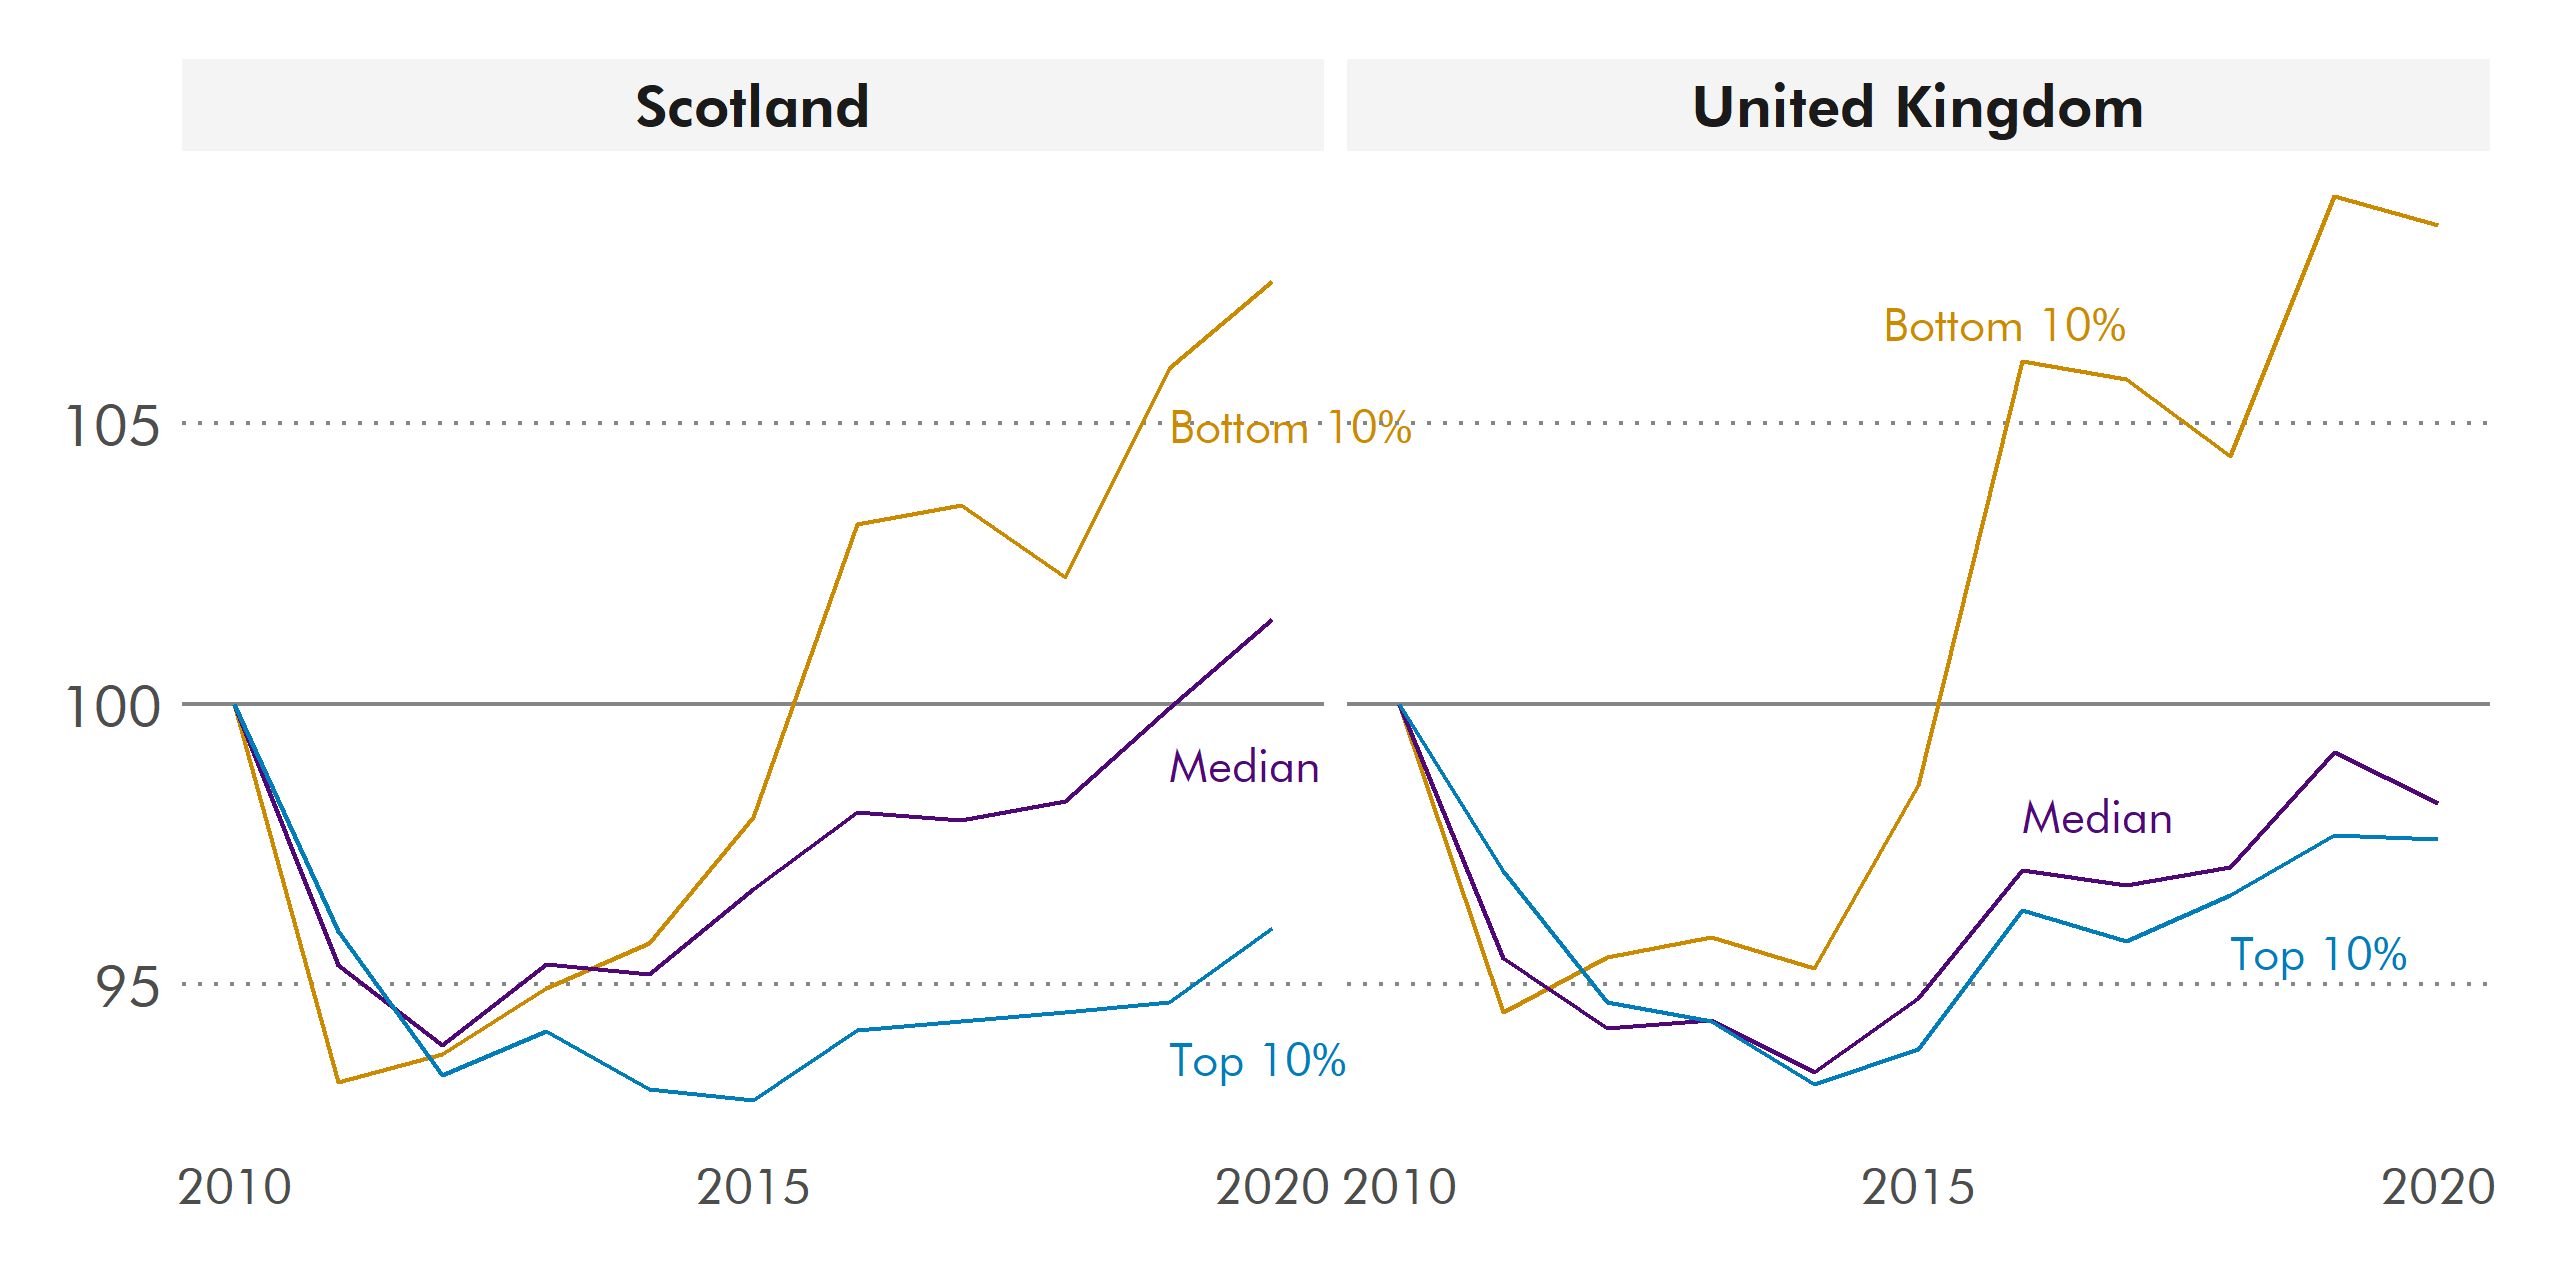
When we look at how gross weekly pay for all employees has changed in real terms between 2010 and 2020 we can see that:
Pay fell for all measures by more than 5% in the first 5 year of the decade.
The threshold for the bottom 10% has seen the most growth since hitting its low point in 2011. This is likely linked to increases to the National Minimum Wage.
In Scotland and the UK between 2011 and 2020 the threshold for the bottom 10% increased 15%.
The threshold of for the top 10% is still below 2010 levels in both Scotland and the UK.
While the median has recovered in Scotland it is still below 2010 levels for the UK as a whole.
What is typical weekly pay for full-time employees in Scotland?
This section looks at typical weekly pay for full-time employees in Scotland and across the UK.
Figure 12: Gross weekly pay for full-time employees and real terms change from 2019 across the nations and regions of the UK - 2020
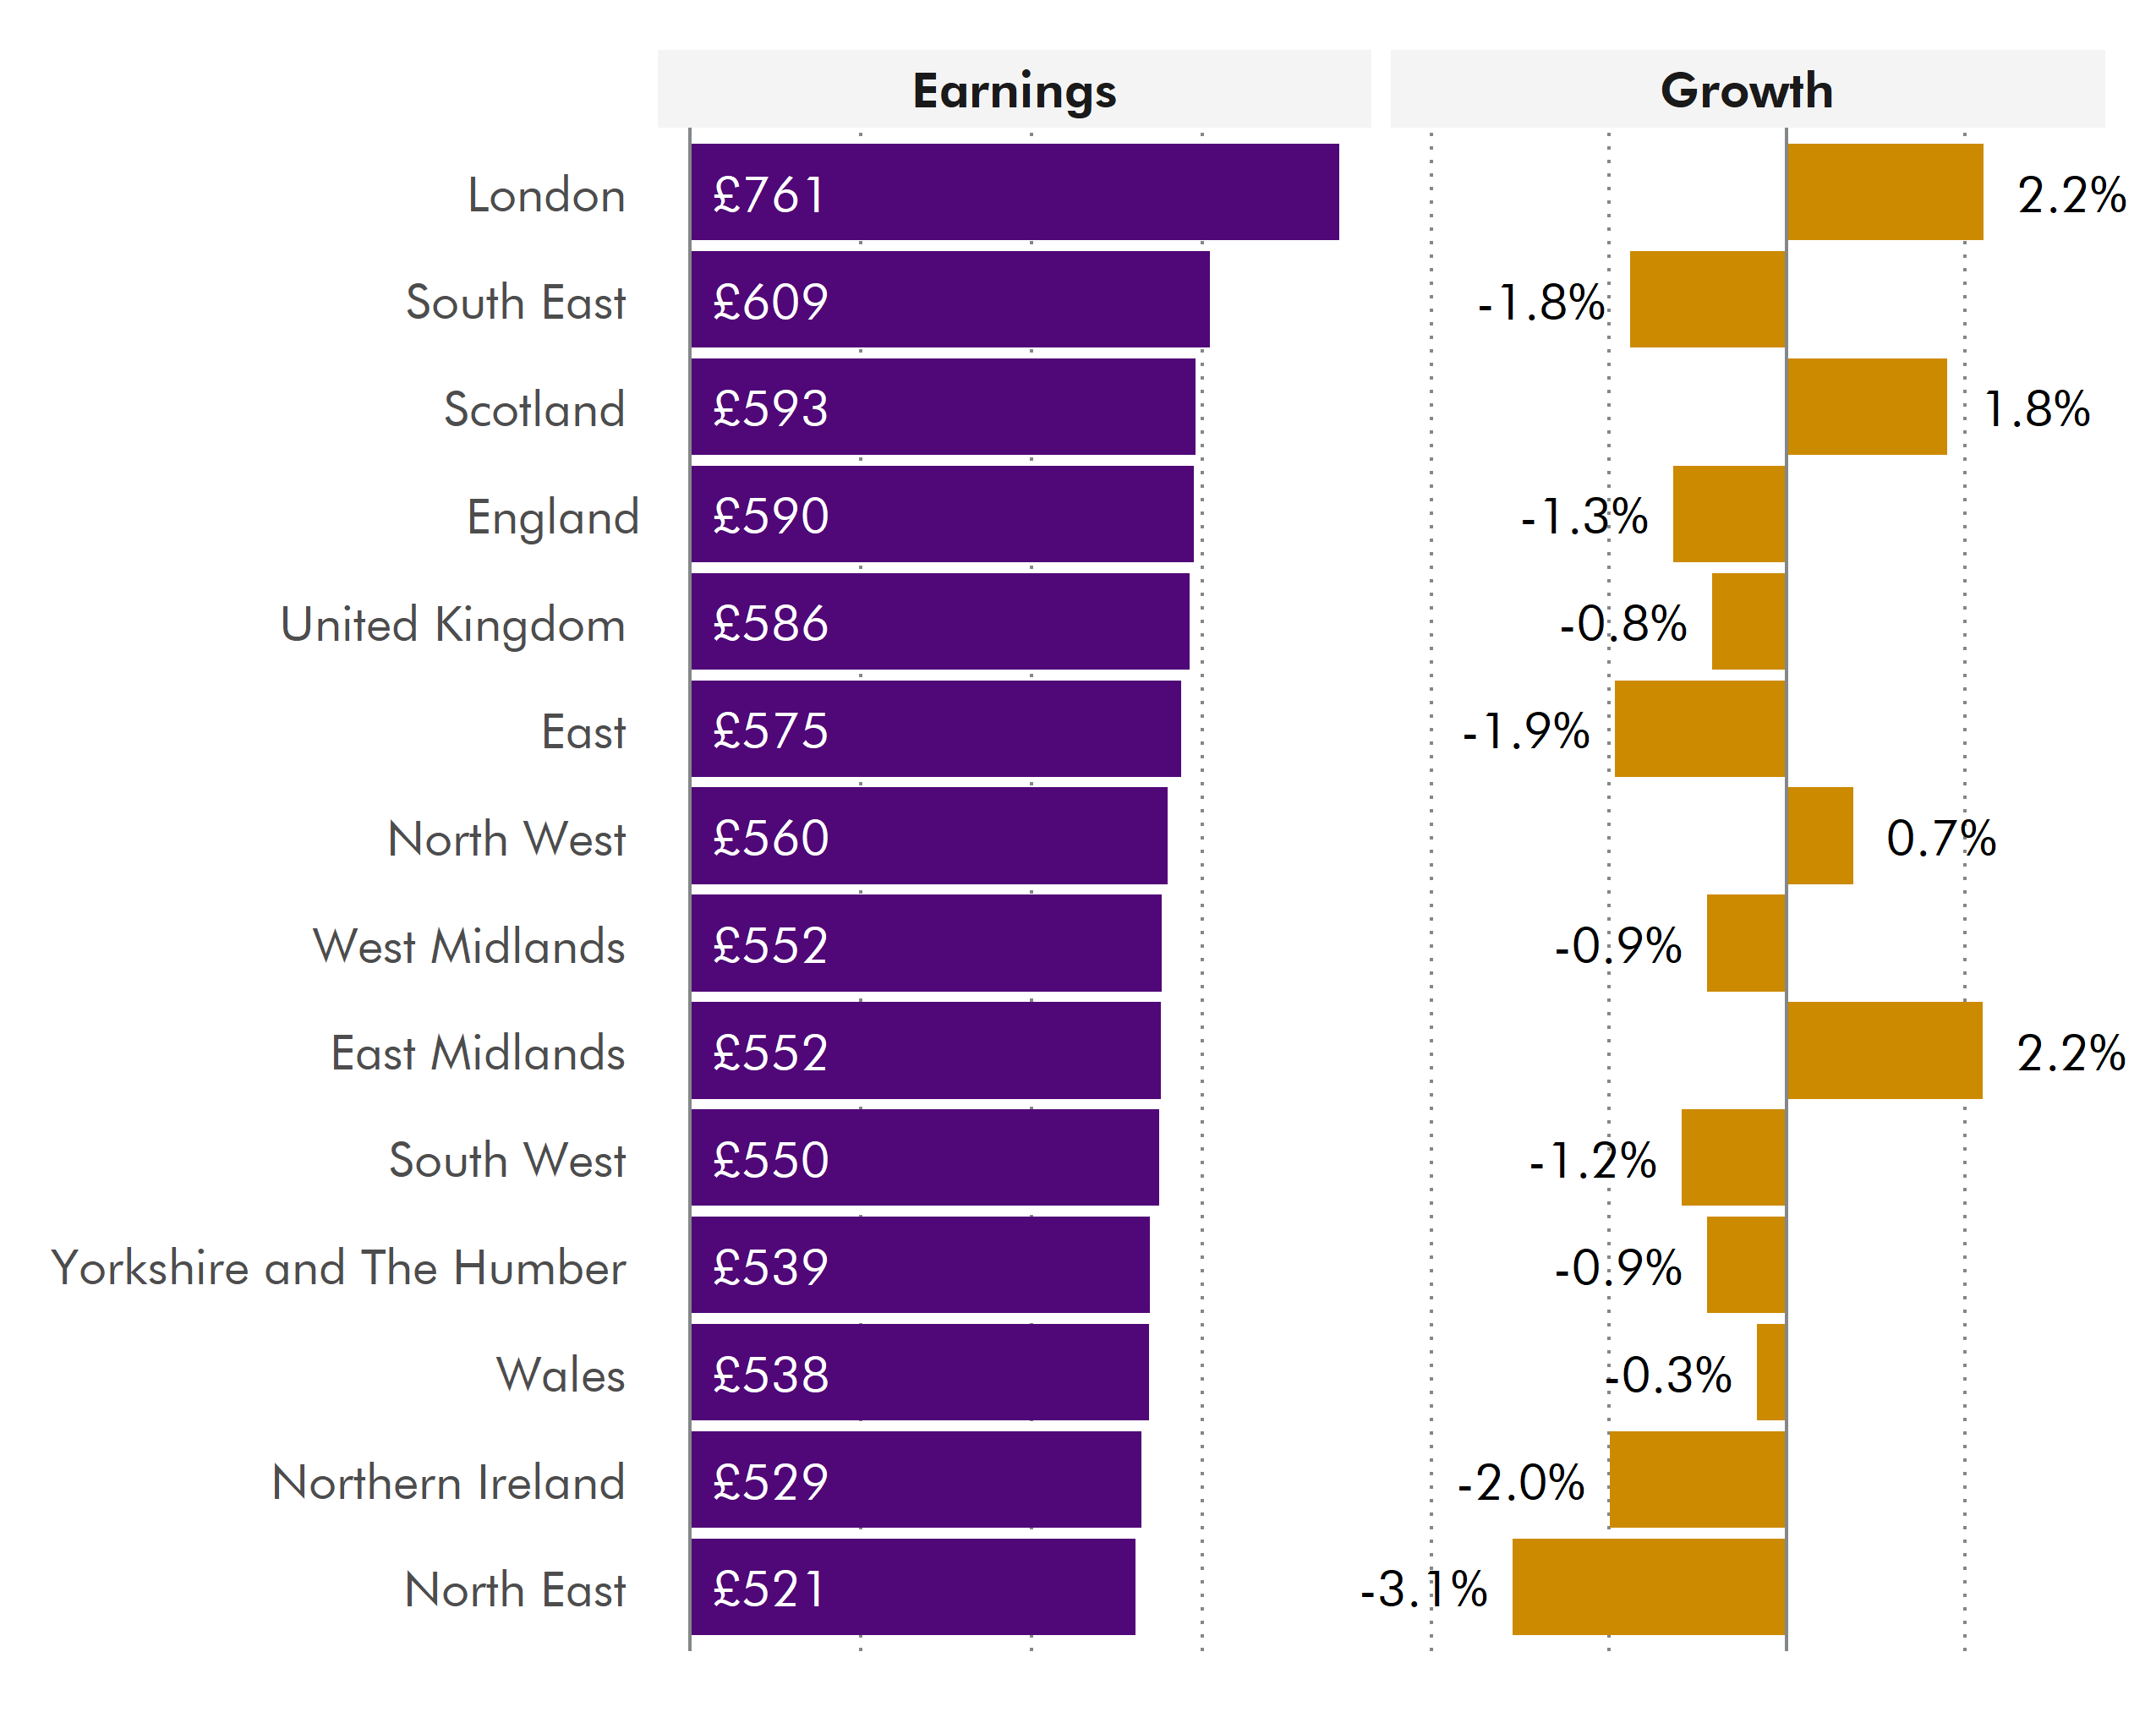
Weekly pay for full-time employees in Scotland was the third highest across the nations and regions of the UK at £593. London has the highest weekly pay at £761 while the north east of England has the lowest at £521.
Scotland was one of only four areas across the UK which saw an increase in full-time weekly pay in real terms, increasing by 1.8%. London and the East Midlands saw increases of 2.2% while the North West increased by 0.7%. The North East of England saw the largest fall at 3.1% in real terms.
Care should be taken when interpreting these figures due to issues with this year's data. You can find out more in this in the "about the data" section of the briefing.
What is typical weekly pay for part-time employees in Scotland?
This section looks at typical weekly pay for part-time employees in Scotland and across the UK.
When looking at part-time pay it is important to consider:
Part-time jobs tend to be more impacted by increases in National Minimum Wage rates, due to a typical lower hourly rate.
Flexible working patterns can change employee job profiles from full-time to part-time, whilst retaining the higher hourly pay rates.
Figure 13: Gross weekly pay for part-time employees and real terms change from 2019 across the nations and regions of the UK - 2020
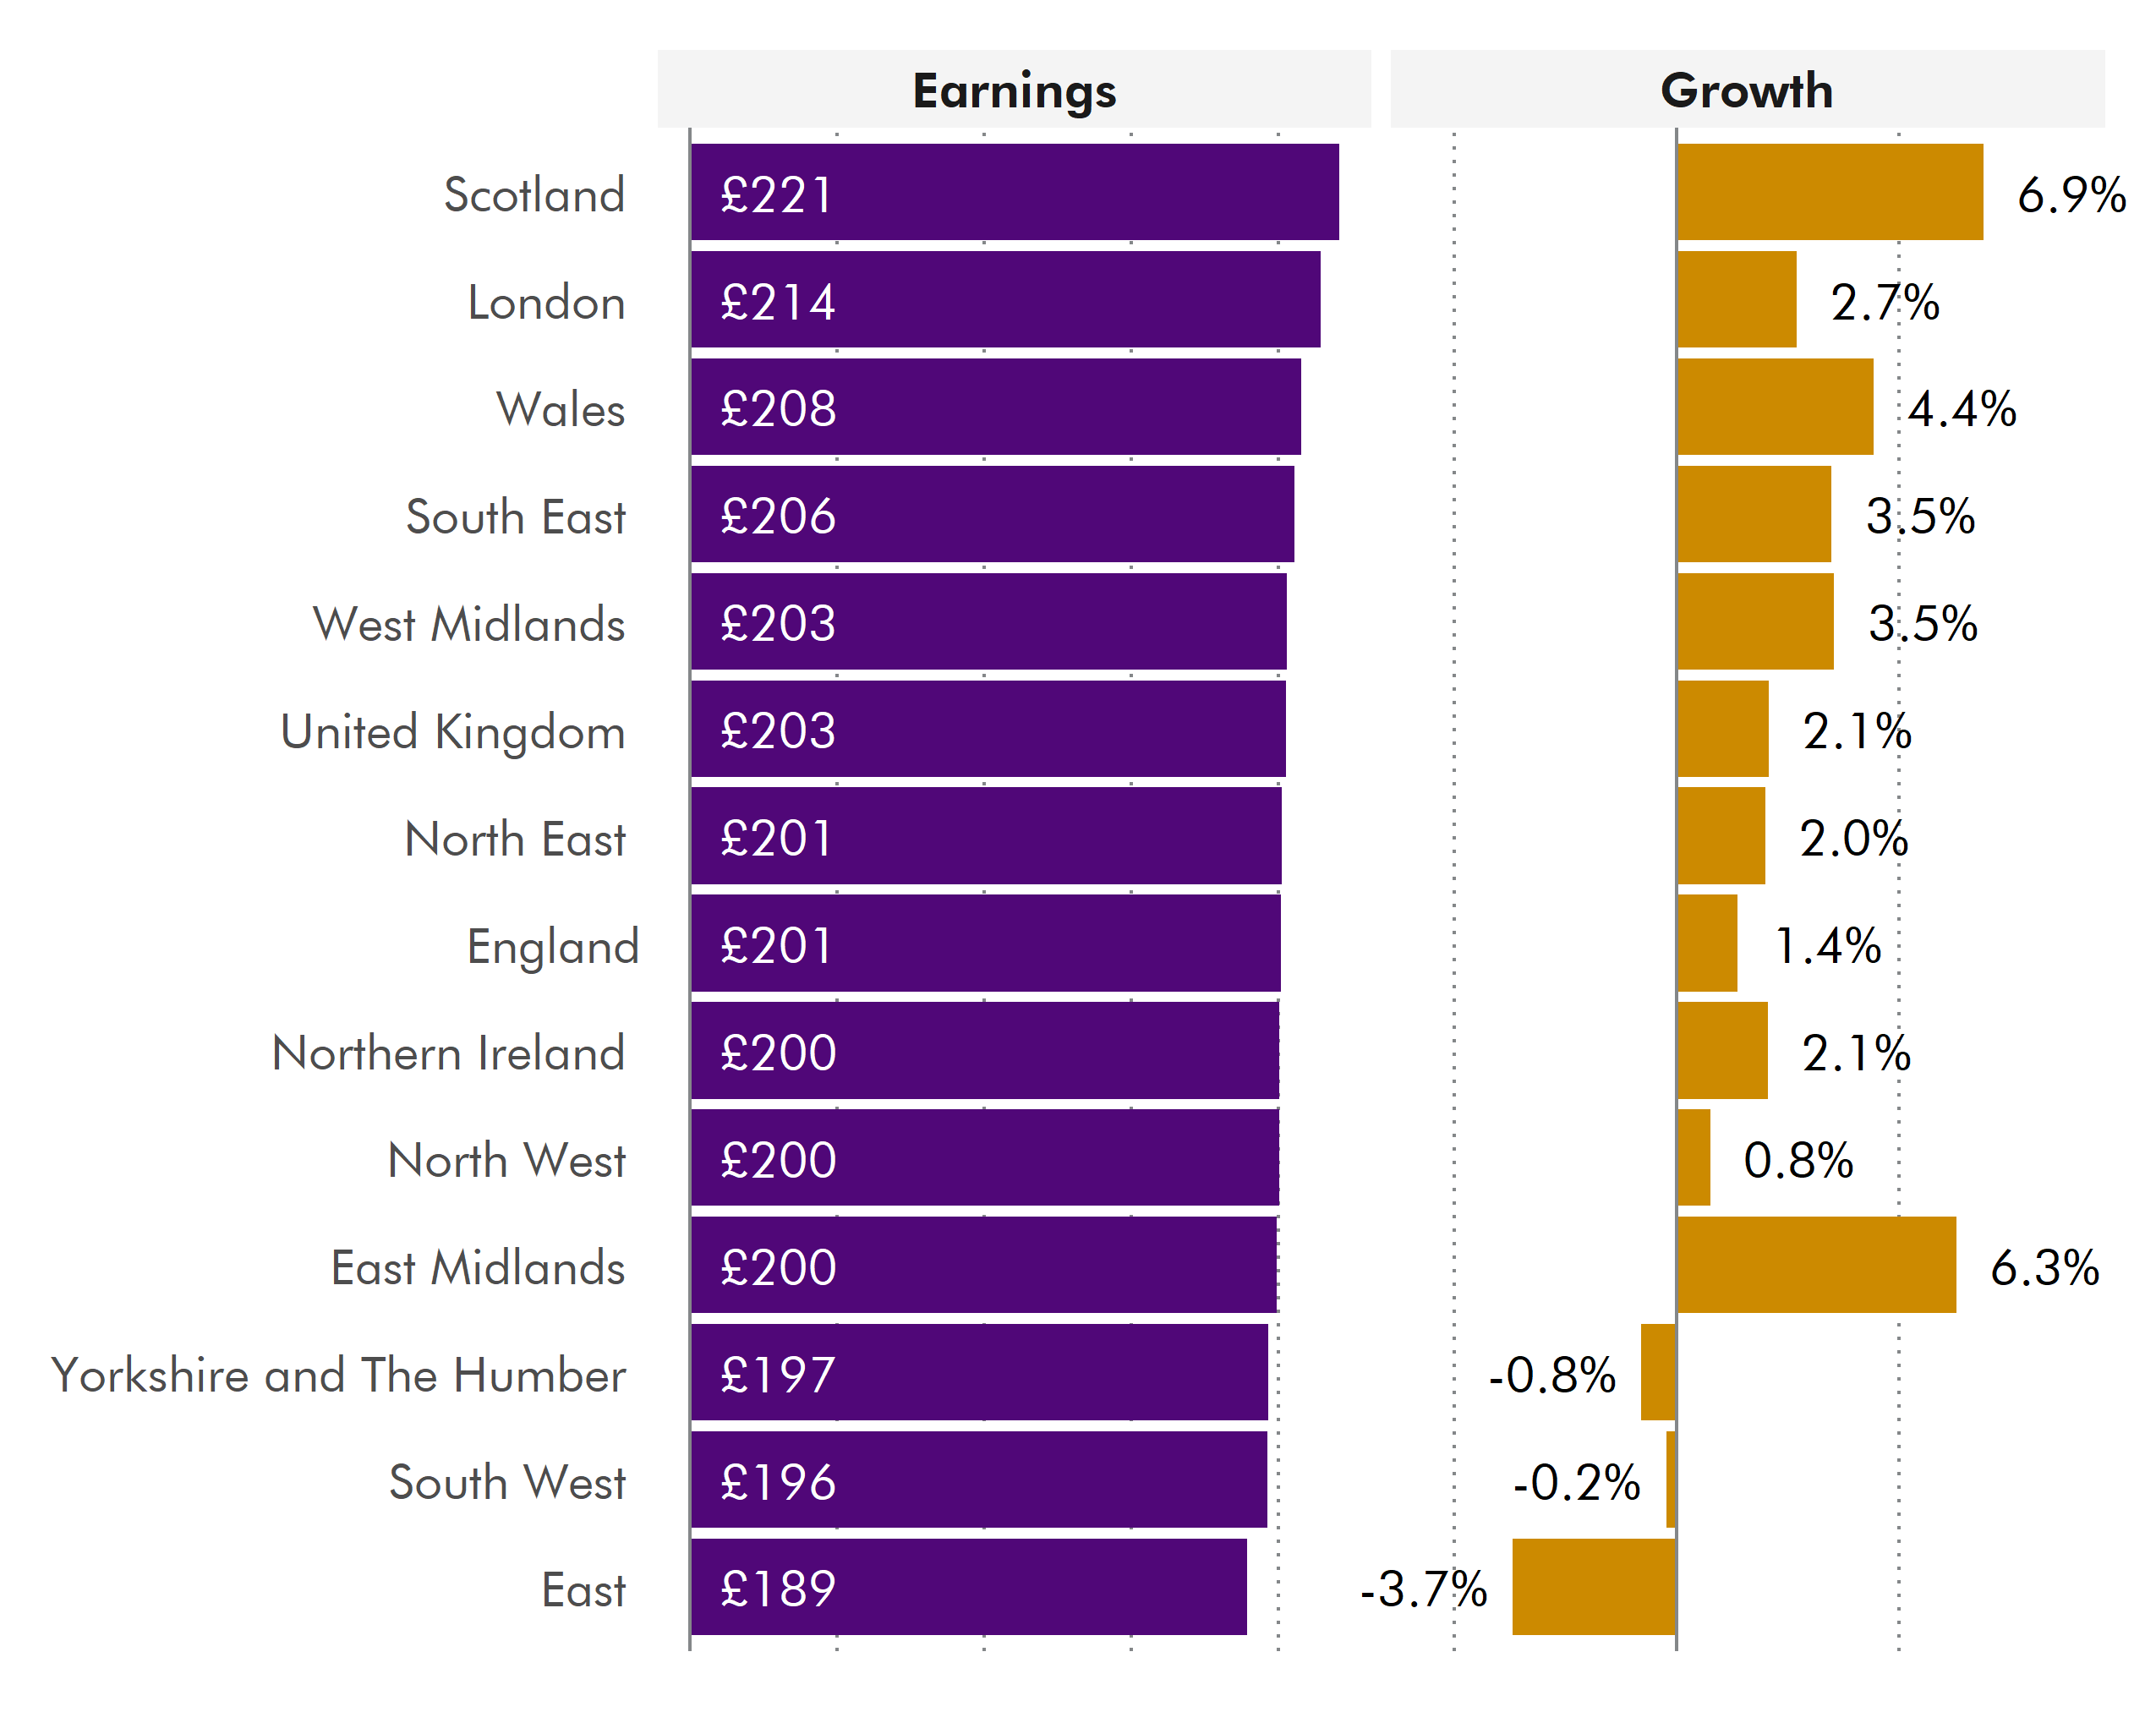
Scotland has the highest typical part-time weekly pay across the UK, at £221. The East of England has the lowest at £189.
Scotland also saw the highest real terms increase across the UK at 6.9%. The East of England saw the largest decrease at 3.7% in real terms
Care should be taken when interpreting these figures due to issues with this year's data. You can find out more in this in the "about the data" section of the briefing.
Typical hourly pay in Scotland?
This section looks at hourly pay, excluding overtime, for all employees in Scotland, broken down by those in full-time and part-time employment,and how these numbers compare to the other regions and nations of the UK.
ASHE analyses for hourly earnings relate to employees on adult rates whose earnings for the survey pay period were not affected by absence. They do not include the earnings of those who did not work a full week, and whose earnings were reduced because of, for example, sickness.
What is typical hourly pay for all employees in Scotland?
This section looks at typical hourly pay for all employees in Scotland and across the UK.
Figure 14: Hourly pay excluding overtime for all employees and real terms change from 2019 across the nations and regions of the UK - 2020
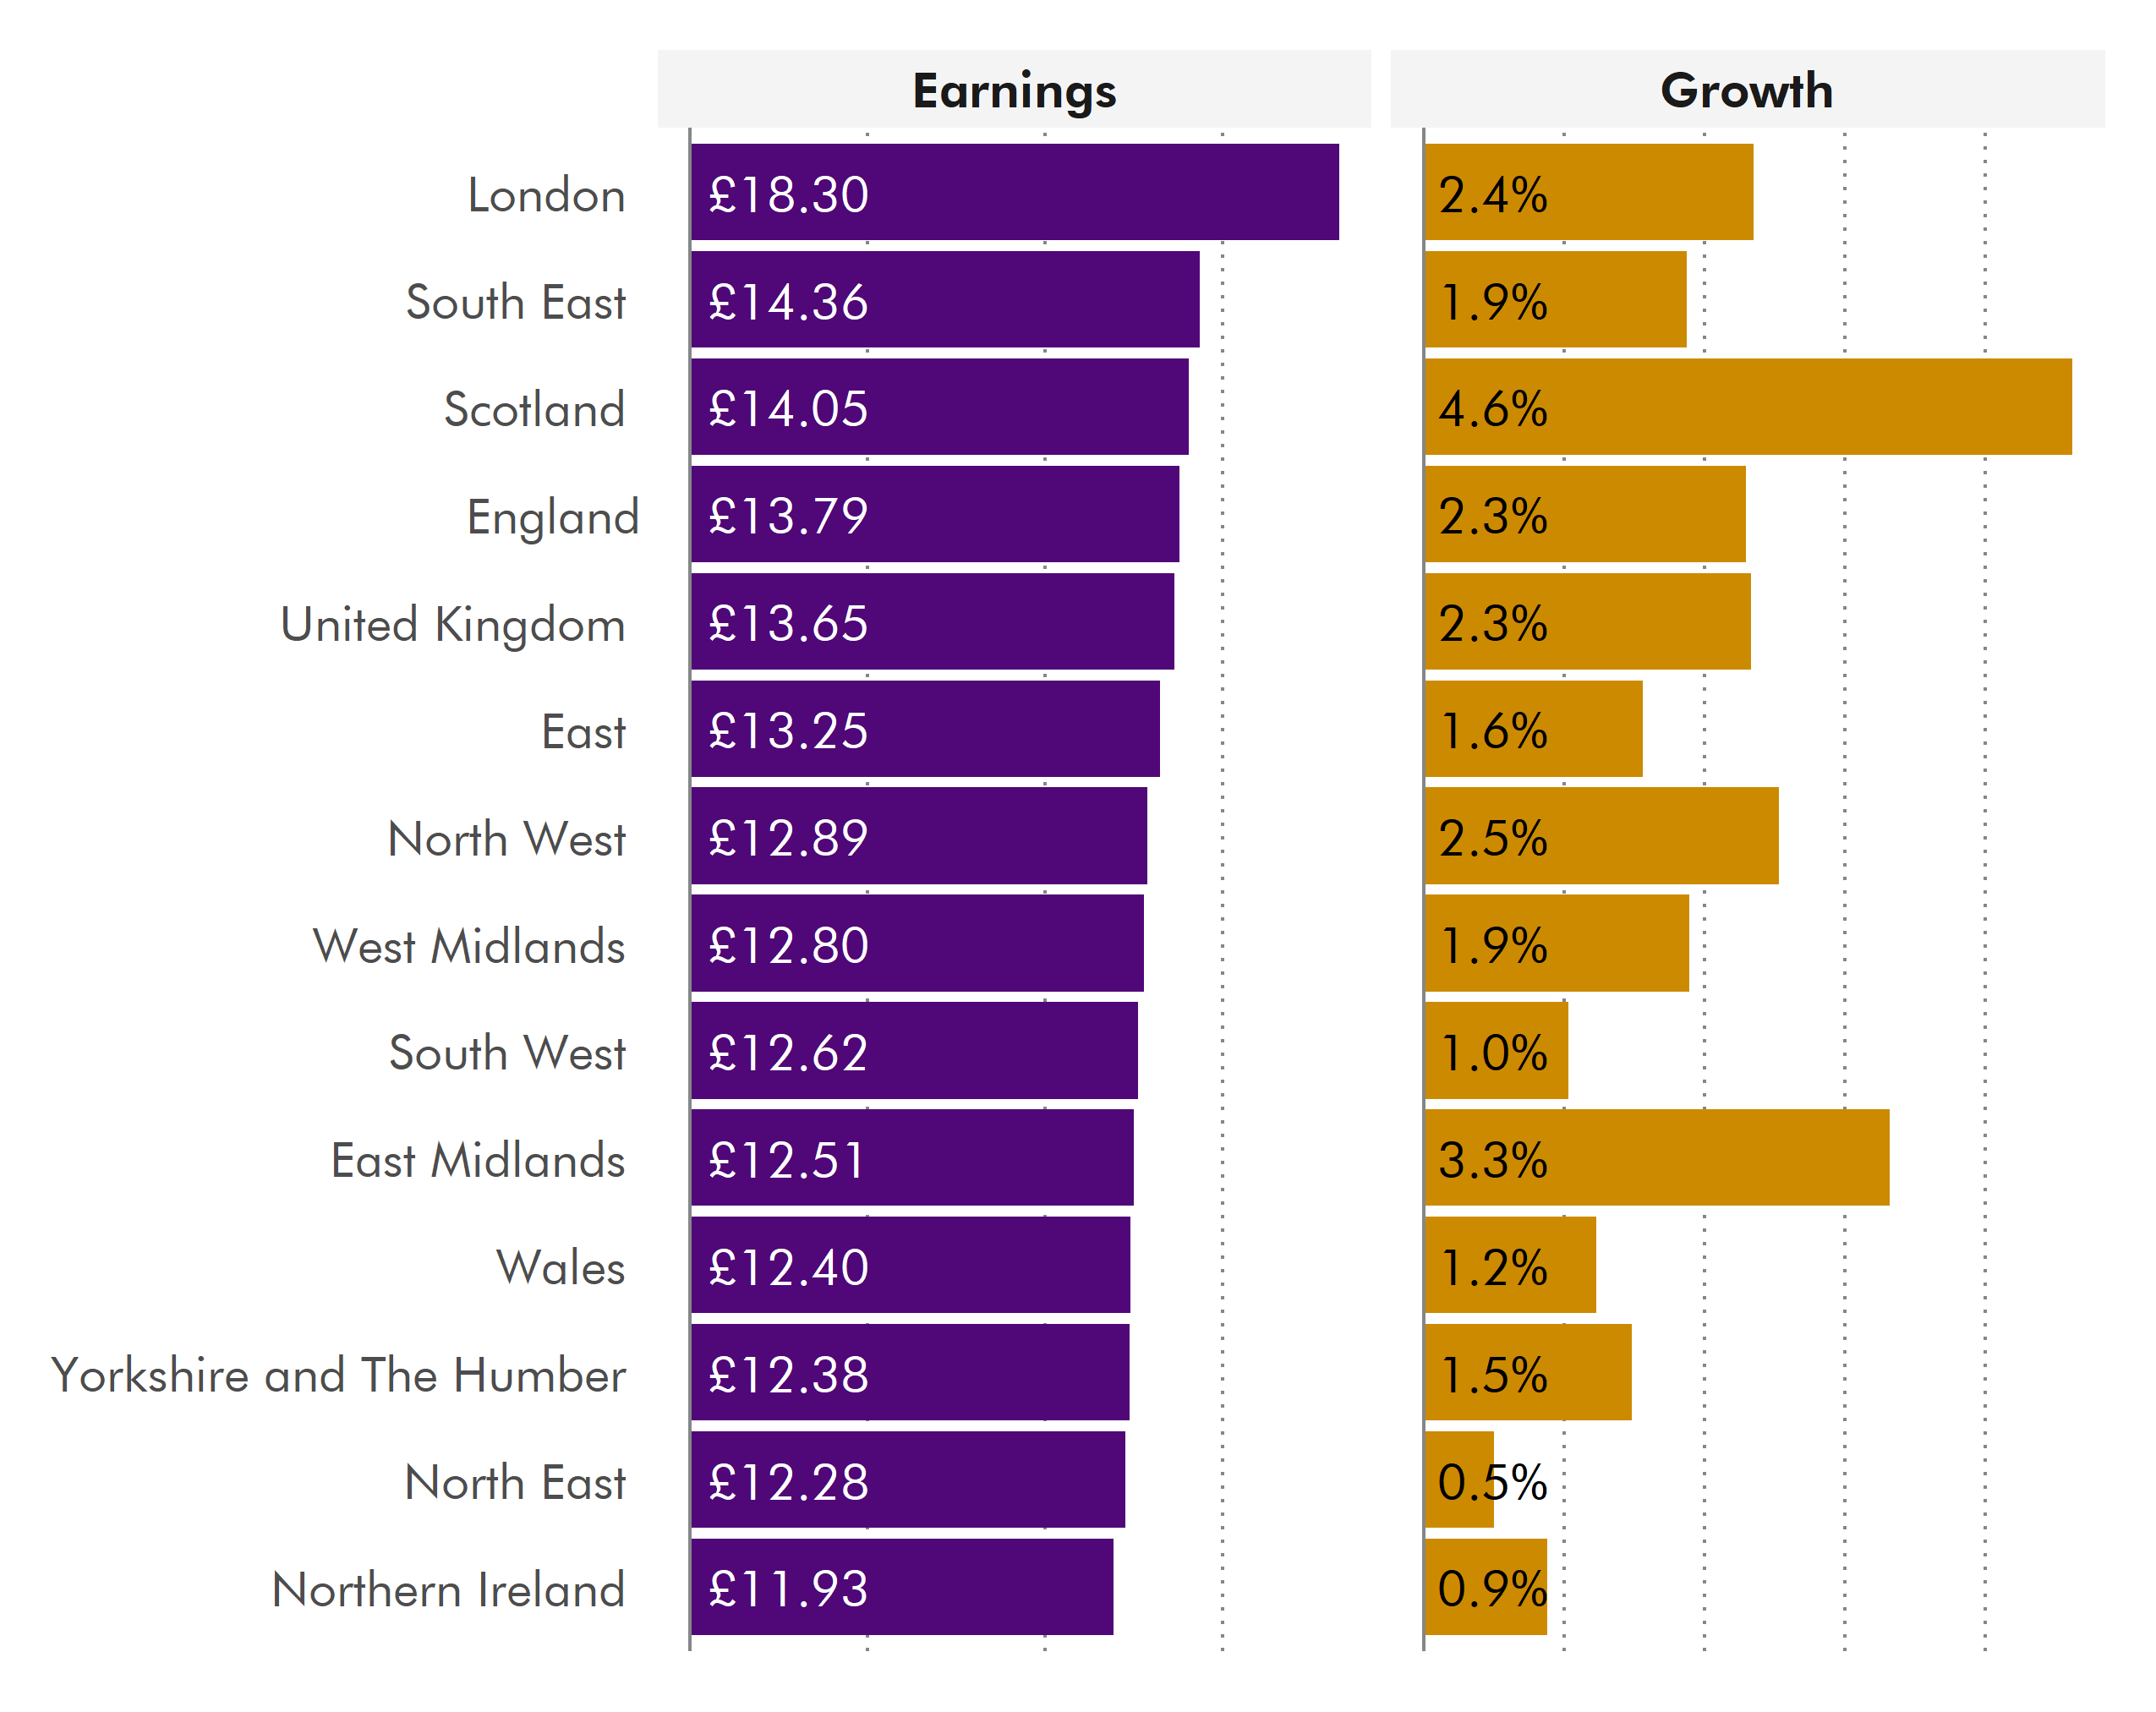
Hourly pay excluding overtime in Scotland is the third highest across the UK at £14.05. London has the highest at £18.30 while Northern Ireland has the lowest at £11.93.
All nations and regions of the UK saw an increase in real terms with Scotland seeing the largest increase at 4.6%. The North East of England saw the smallest increase at 0.5%.
Care should be taken when interpreting these figures due to issues with this year's data. You can find out more in this in the "about the data" section of the briefing.
What is typical hourly pay for full-time employees in Scotland?
This section looks at typical hourly pay for full-time employees in Scotland and across the UK.
Figure 15: Hourly pay excluding overtime for full-time employees and real terms change from 2019 across the nations and regions of the UK - 2020
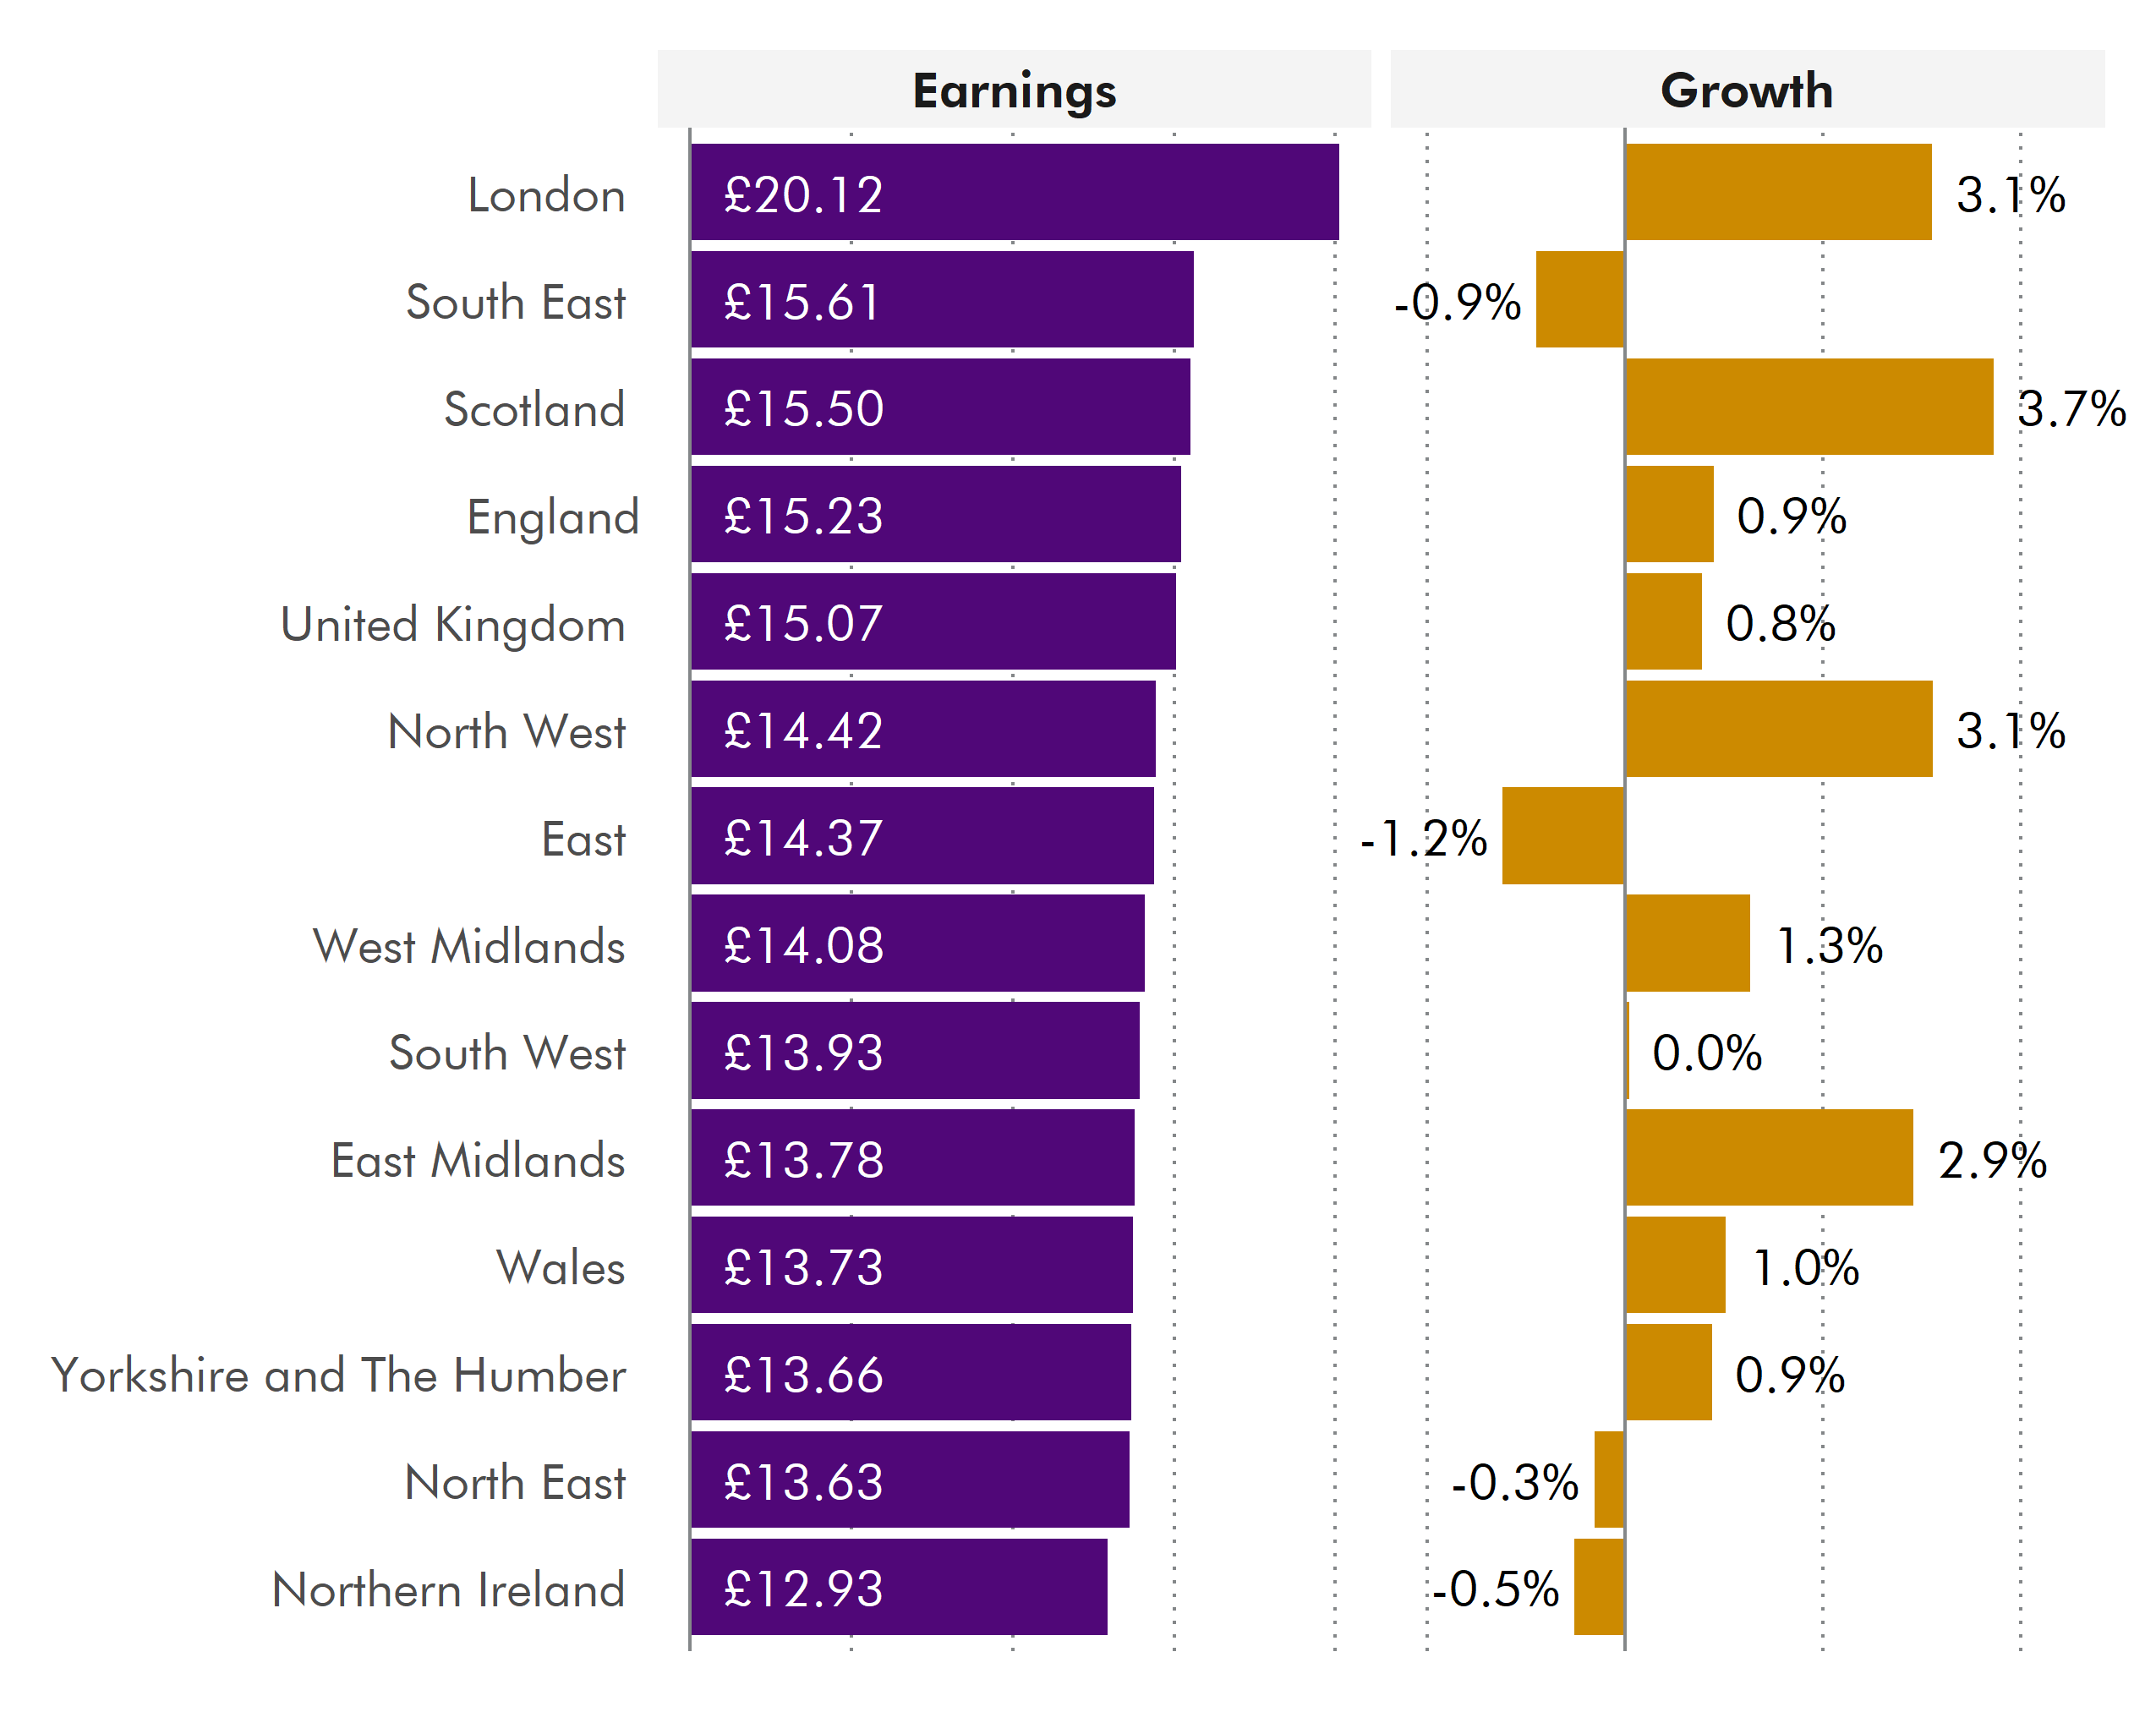
Scotland has the third highest median hourly pay excluding for full-time employees across the UK at £15.50. London has the highest at £20.12 while Northern Ireland has the lowest at £12.93.
Scotland saw the highest real terms increase in median hourly pay excluding overtime across the UK, at 3.7%. The East of England saw the largest decrease at 1.2%.
Care should be taken when interpreting these figures due to issues with this year's data. You can find out more in this in the "about the data" section of the briefing.
What is typical hourly pay for part-time employees in Scotland?
This section looks at typical hourly pay for part-time employees in Scotland and across the UK.
When looking at part-time pay it is important to consider:
Part-time jobs tend to be more impacted by increases in National Minimum Wage rates, due to a typical lower hourly rate.
Flexible working patterns can change employee job profiles from full-time to part-time, whilst retaining the higher hourly pay rates.
Figure 16: Hourly pay excluding overtime for part-time employees and real terms change from 2019 across the nations and regions of the UK - 2020
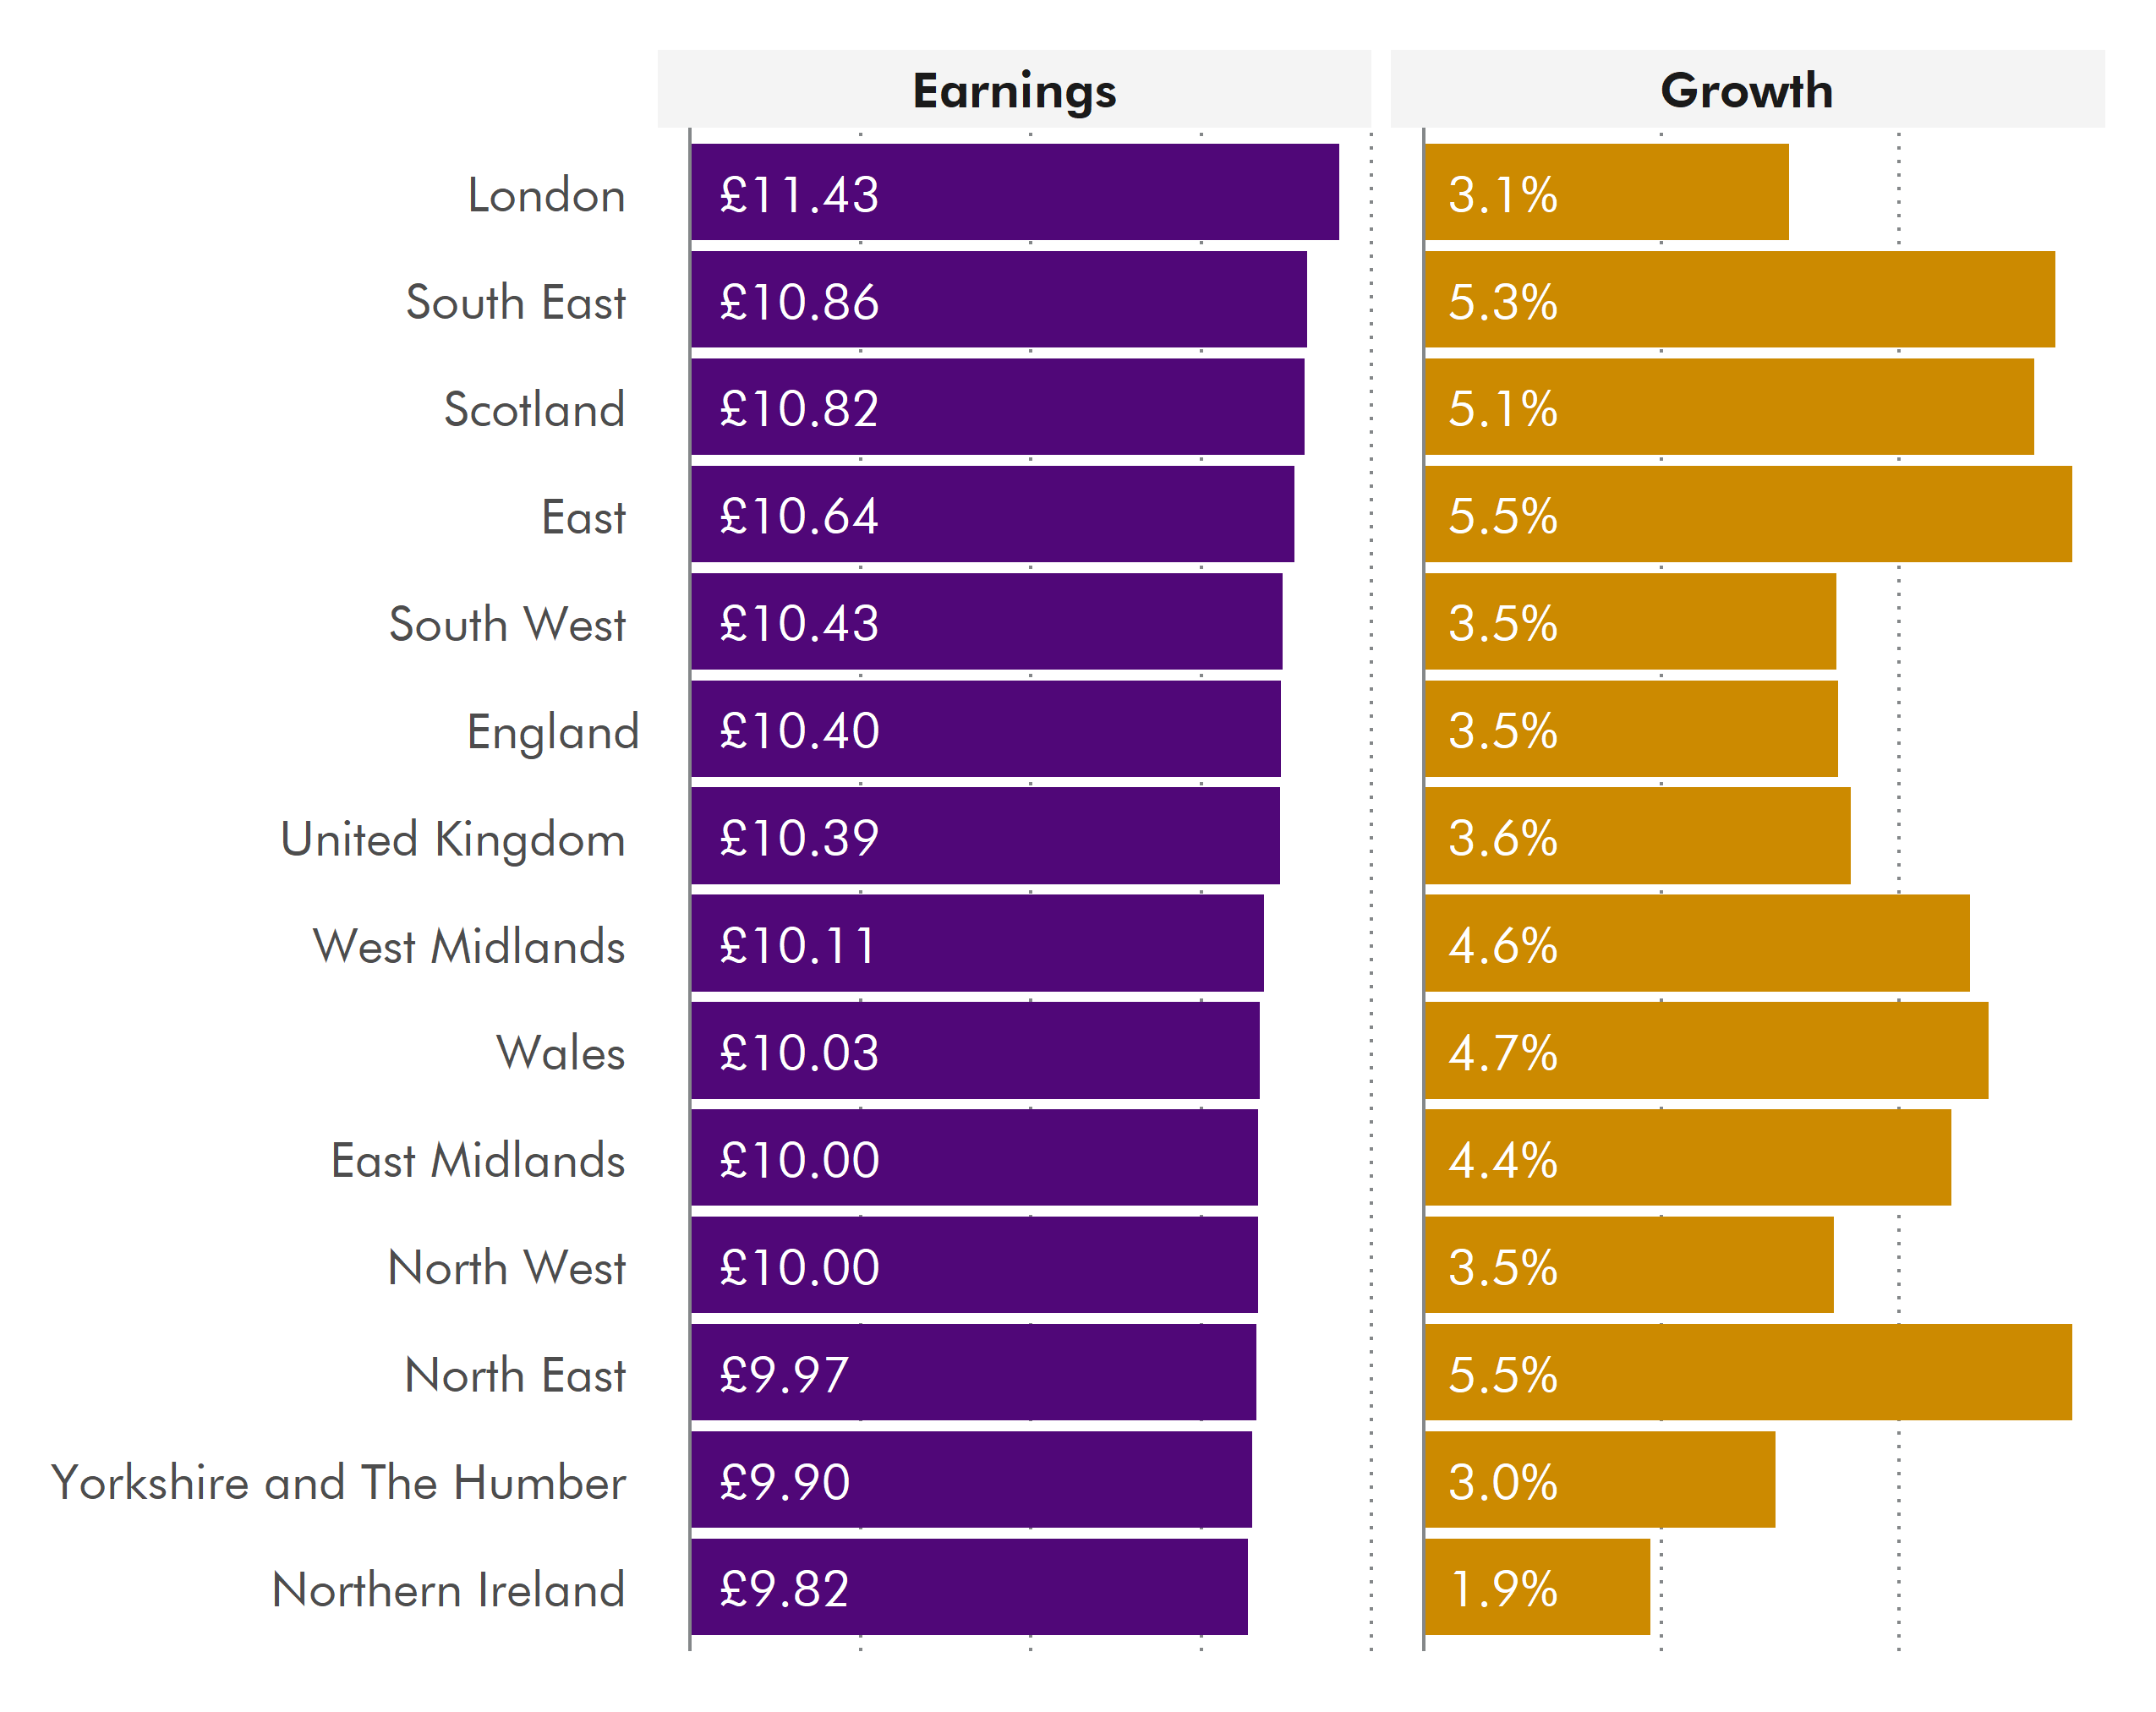
Scotland has the third highest median part-time hourly pay excluding overtime at £10.82. London has the highest at £11.43 while Northern Ireland has the lowest at £9.82.
In Scotland, median part-time hourly pay excluding overtime increased by 5.1%. The East and North East of England saw the largest increase at 5.5% while Northern Ireland saw the lowest at 1.9%
Care should be taken when interpreting these figures due to issues with this year's data. You can find out more in this in the "about the data" section of the briefing.
Pay by industry
This section looks at pay by industry in Scotland, using median hourly pay excluding overtime for all employees, to control for different working patterns and working weeks across industries.
Figure 17: Hourly pay excluding overtime for all employees and real terms change from 2019 by industry - 2020
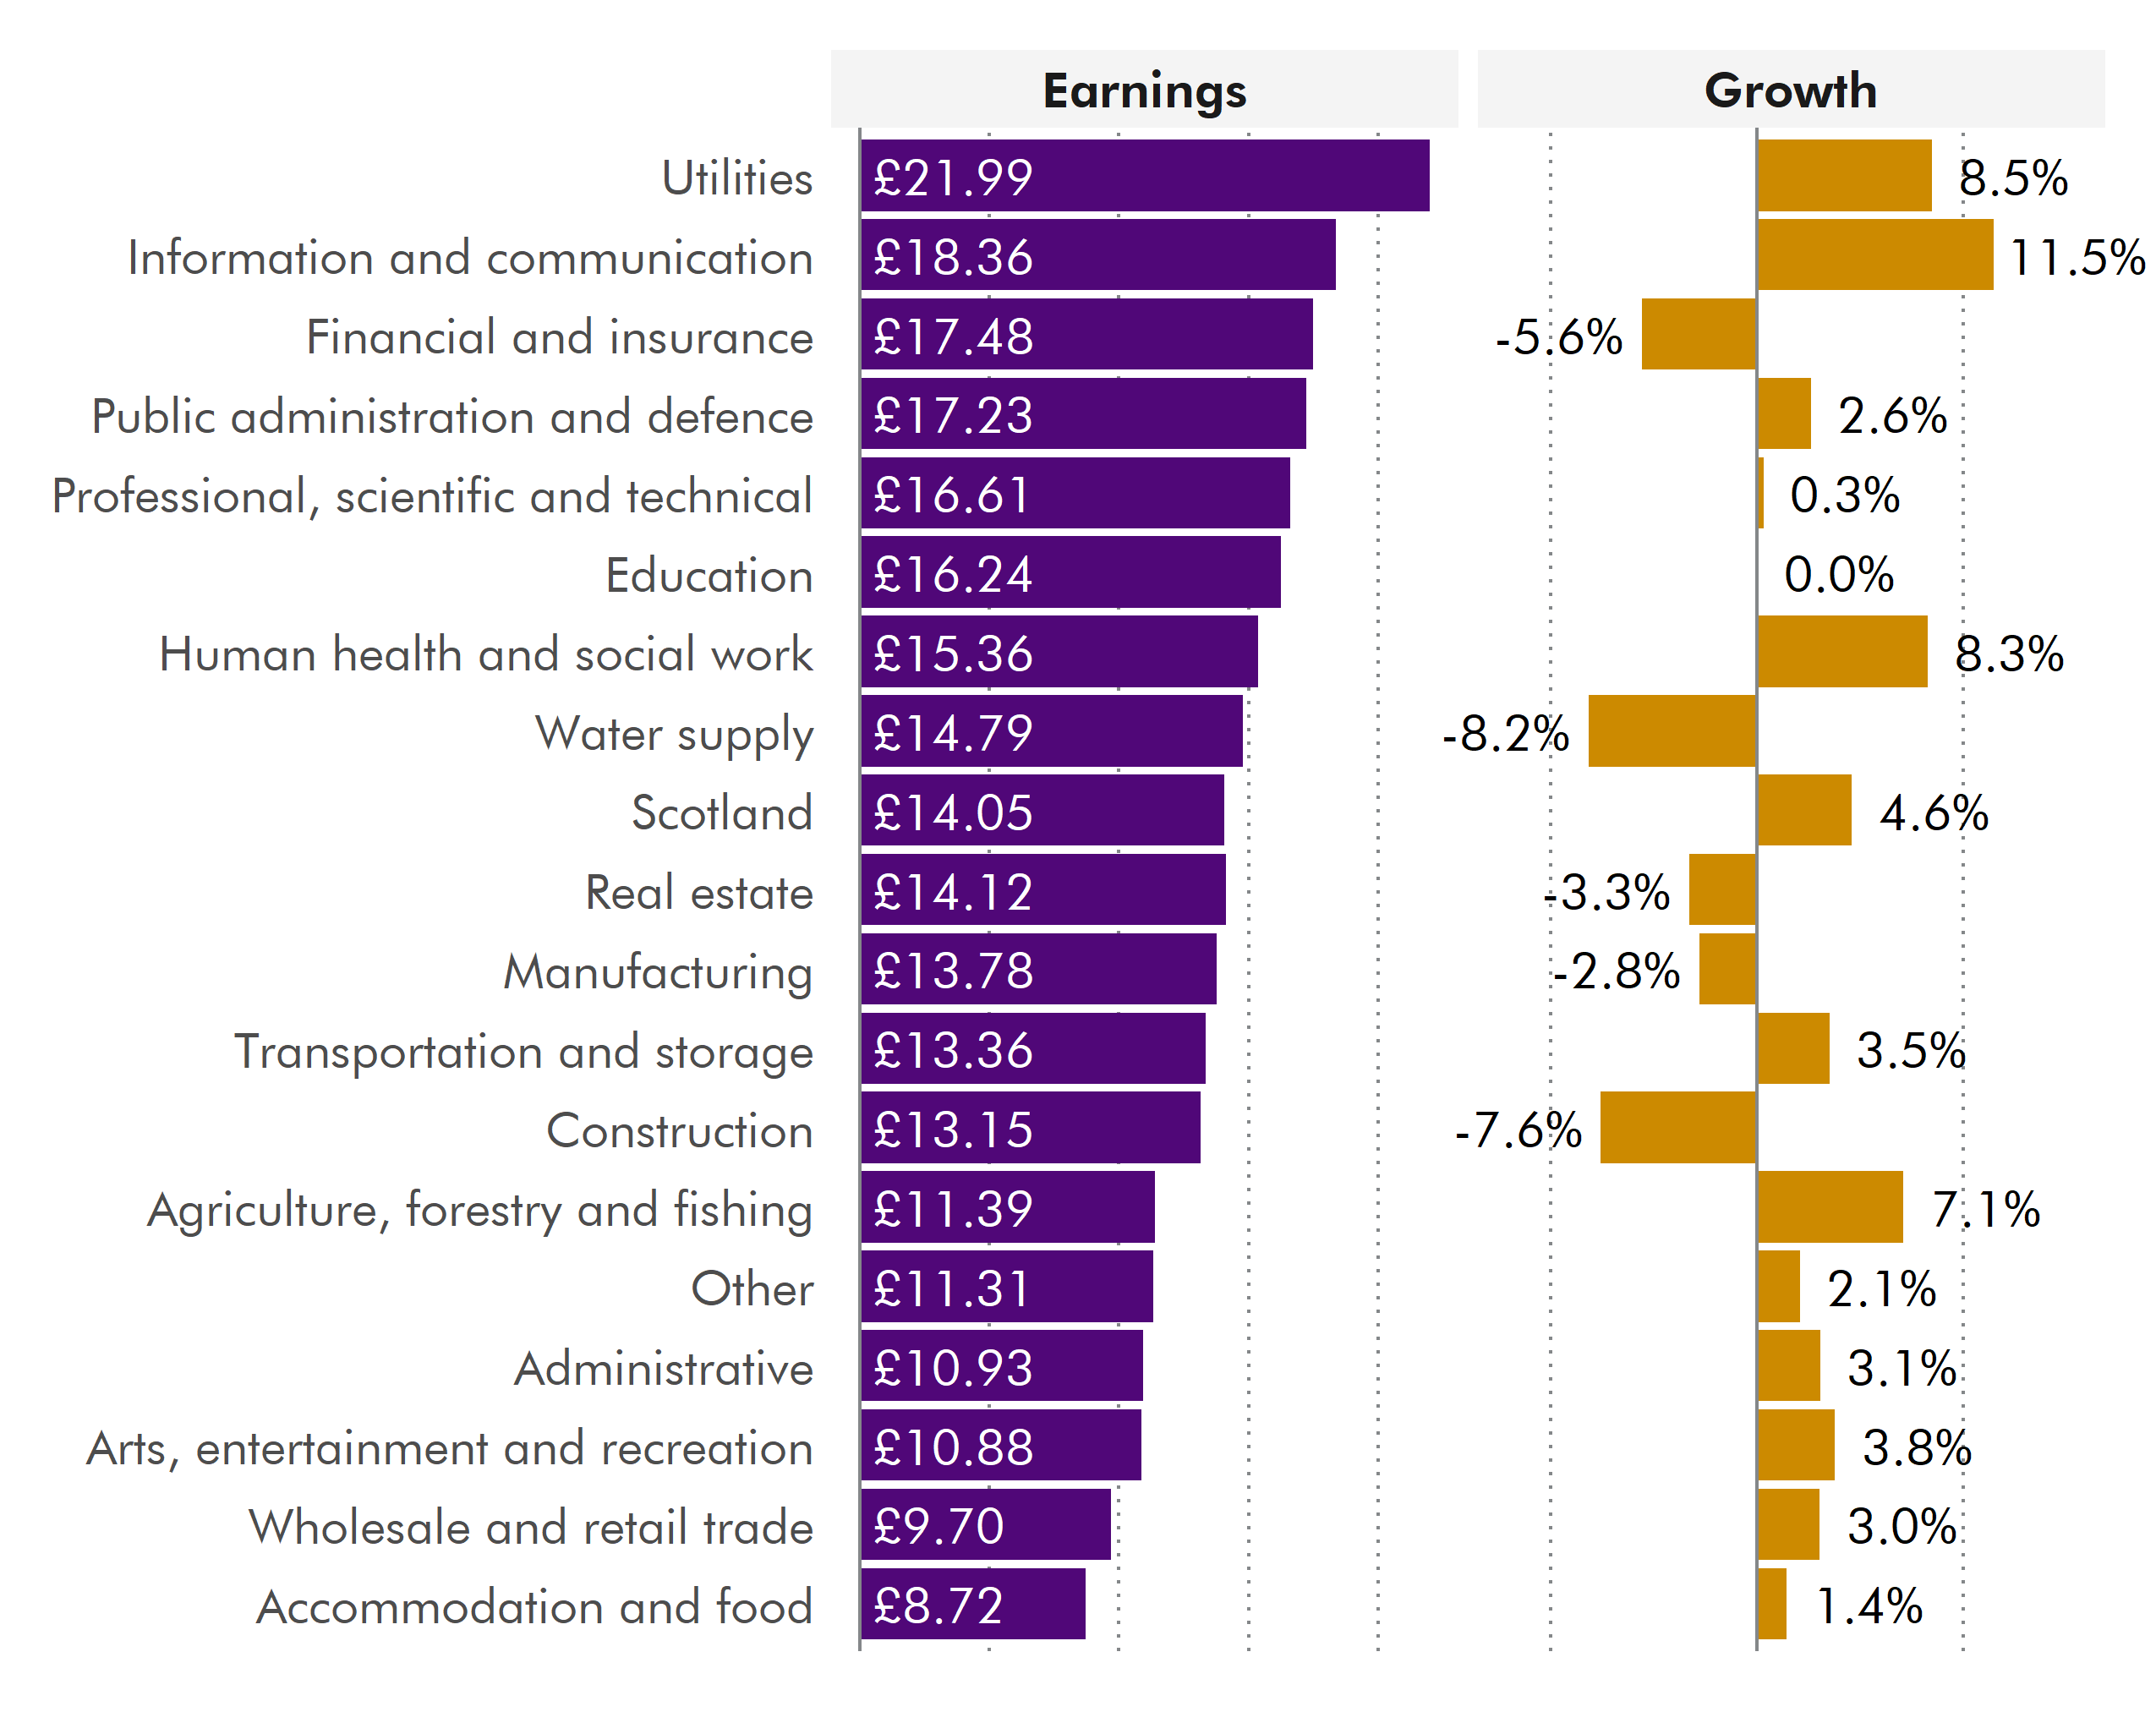
"Utilities (electricity, gas, steam and air conditioning supply)" is the highest paid industry in Scotland with a median hourly pay, excluding overtime, at £21.99.
It should be noted that due to uncertainties around the data there is no median figure for Mining and Quarrying, which includes extraction of oil and gas. However, it is estimated that the bottom 40% of earners in the industry earn between £17.74 and £26.61, with a central estimate of £22.18. We have not included Mining and Quarrying in the figure for median pay by industry as it was not accurate enough to publish.
"Accommodation and food service" has the lowest pay of industries in Scotland, with median pay below the real living wage rate at the time of the survey.
"Information and communication" saw the largest increase at 11.5% in real terms while the water supply industry saw the largest decrease at 8.2%.
Care should be taken when interpreting these figures due to issues with this year's data. You can find out more in this in the "about the data" section of the briefing.
Pay by occupation
This section looks at pay by occupation in Scotland, using median hourly pay excluding overtime, for all employees, to control for different working patterns and working weeks across occupations.
Figure 18: Hourly pay excluding overtime for all employees and real terms change from 2019 by occupation - 2020
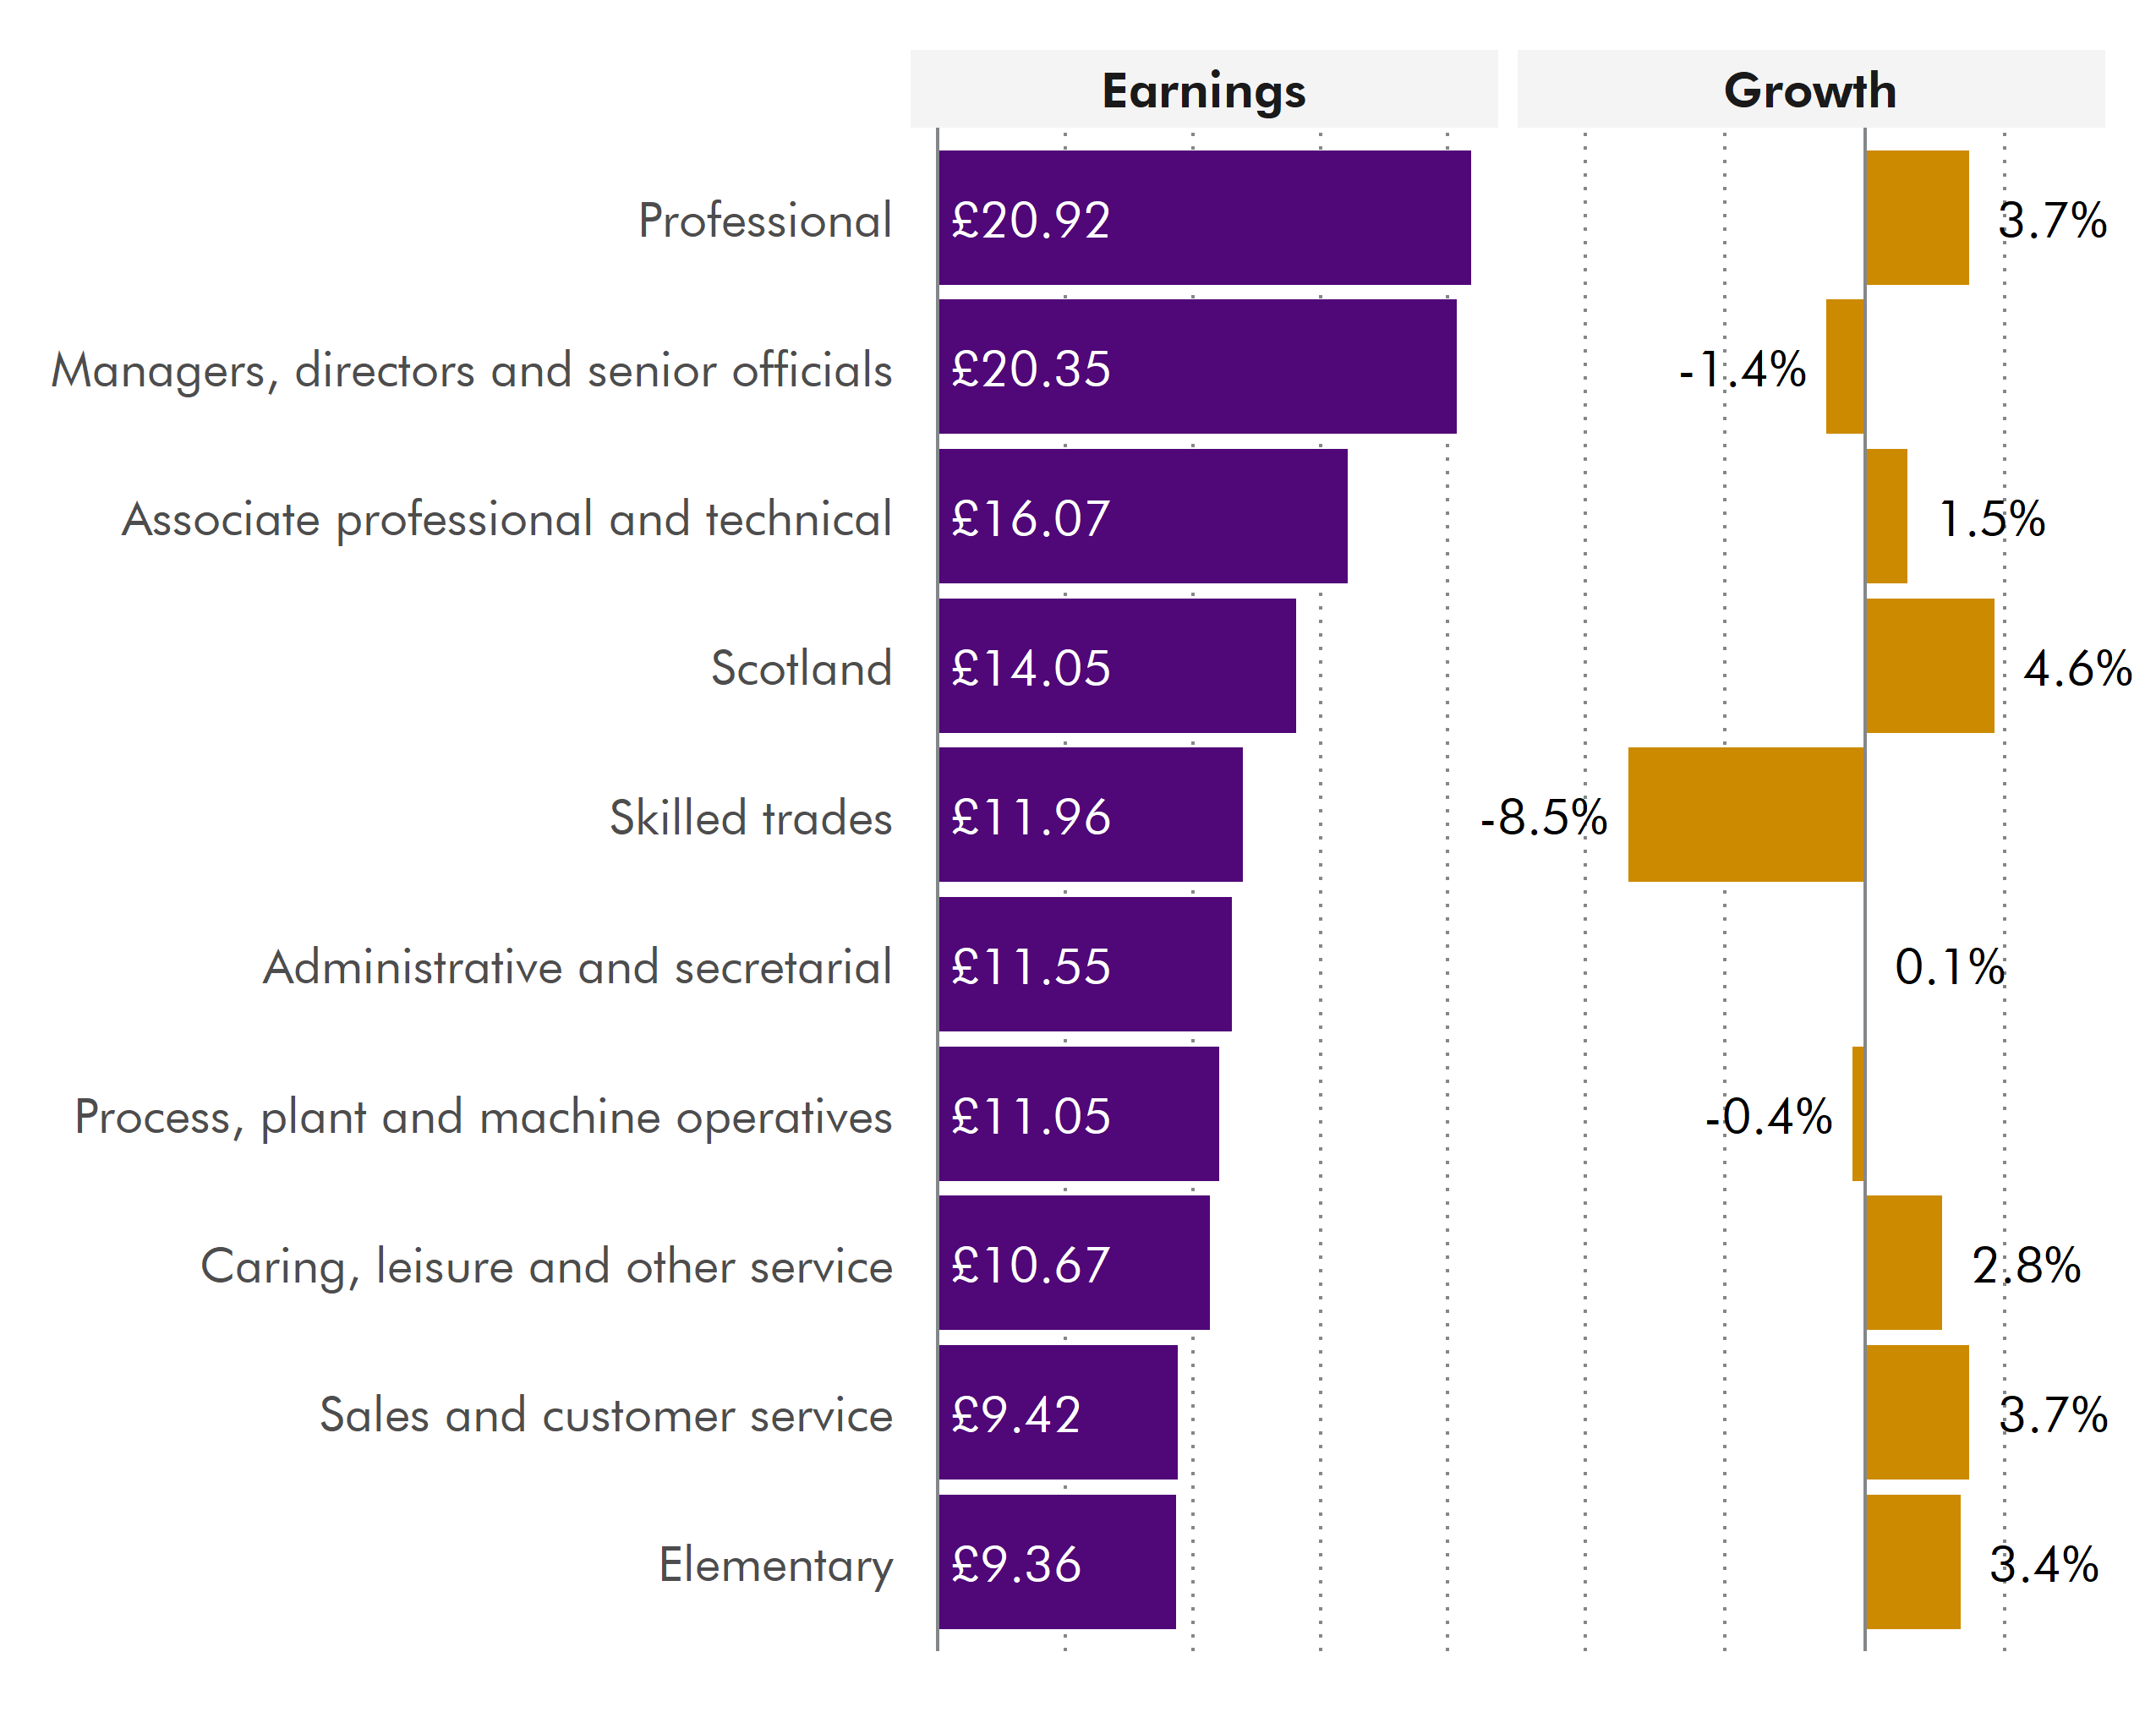
"Professional occupations" in Scotland have the highest median hourly pay, excluding overtime, at £20.92. "Elementary occupations" have the lowest pay at £9.36. Both elementary and "sales and customer service occupations" are paid below the real living wage at the time of the survey.
"Professional" and "sales and customer service" occupations saw the largest real terms increase at 3.7% while skilled trades saw the largest fall at 8.5%.
Care should be taken when interpreting these figures due to issues with this year's data. You can find out more in this in the "about the data" section of the briefing.
Pay by sector
The reasons for the differences in private and public sector pay levels are complex. According to the ONS this is "because of the different jobs and characteristics of the people within each sector". To address some of these issues, hourly pay excluding overtime is used for comparing the public and private sectors. This helps to control for the difference in the length of the working week.
Figure 19: Hourly pay excluding overtime for all employees and real terms change from 2019 by occupation - 2020
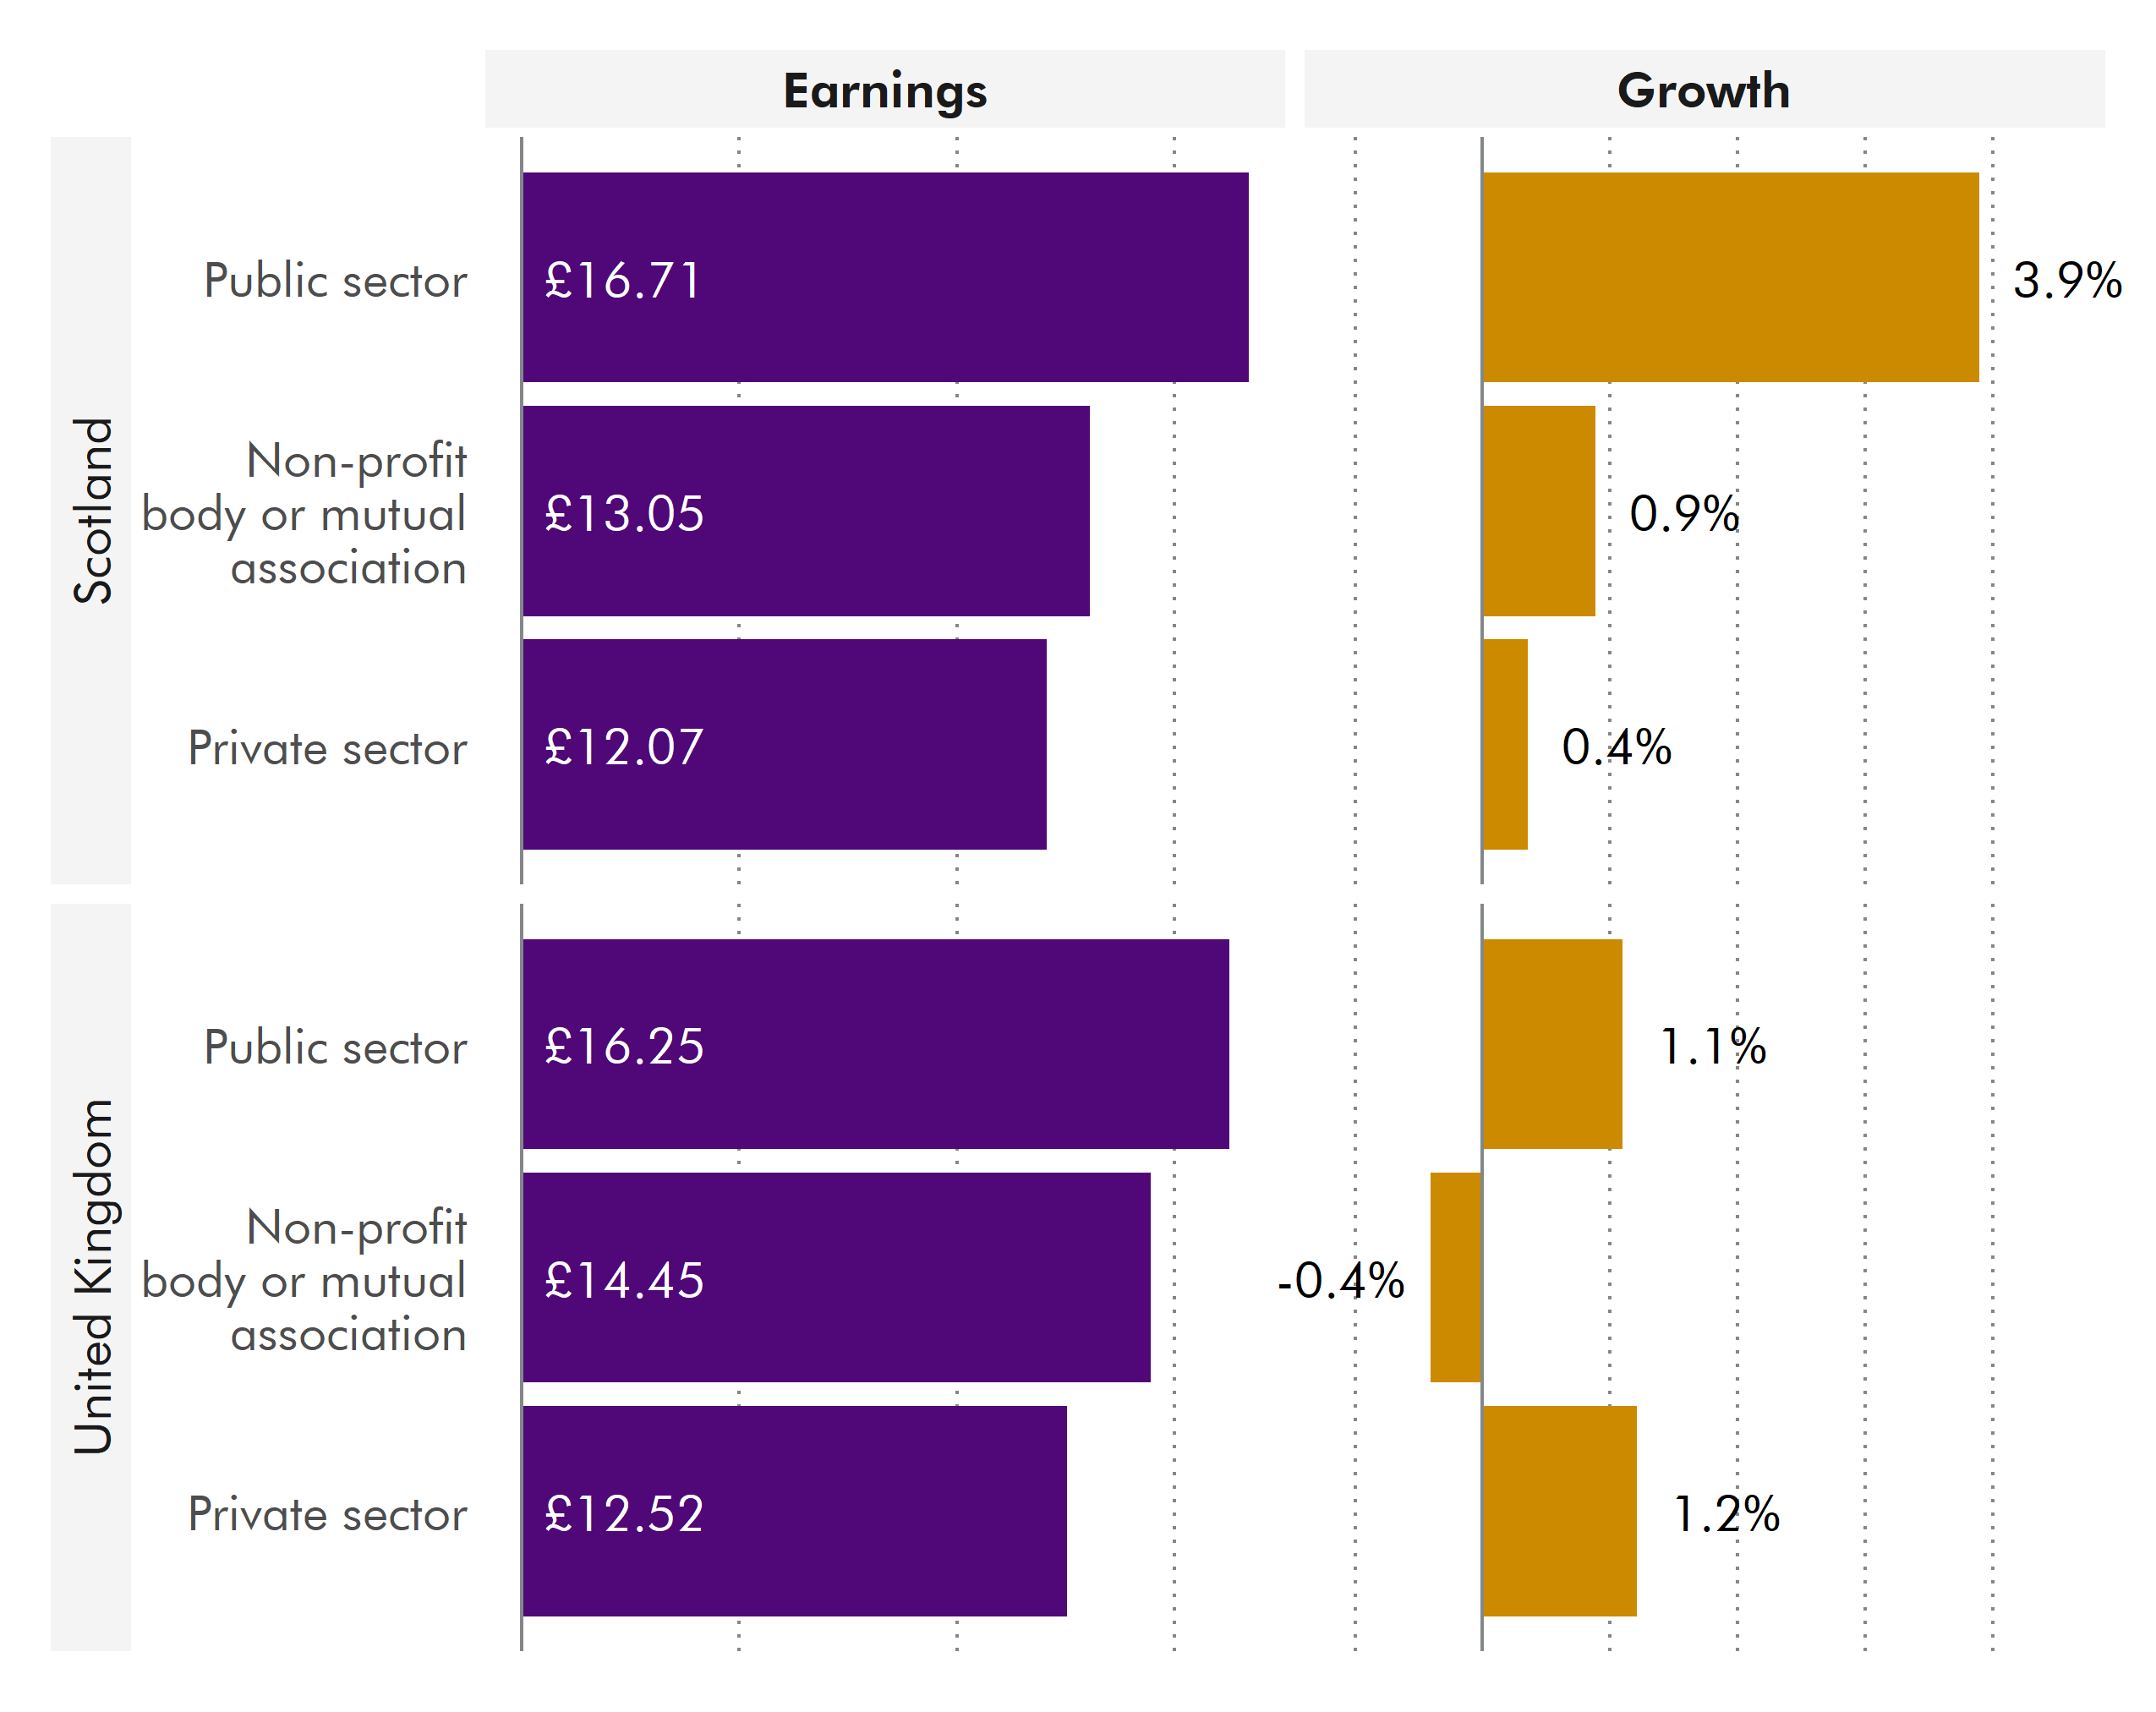
In both Scotland and the UK as a whole, the public sector has a higher median hourly pay, excluding overtime. The public sector in Scotland has a higher median hourly pay that the UK as whole while the private sector the figure is lower in Scotland than the UK as a whole.
Care should be taken when interpreting these figures due to issues with this year's data. You can find out more in this in the "about the data" section of the briefing.
Pay by local authority area
ASHE provides figures on pay by local authority for those who live in the area, and those who work in the area. This section uses median hourly pay excluding overtime for all employees, to control for different structural differences in local authority economies.
Figure 20: Hourly pay excluding overtime for all employees by local authority for place of residence and place of work- 2020
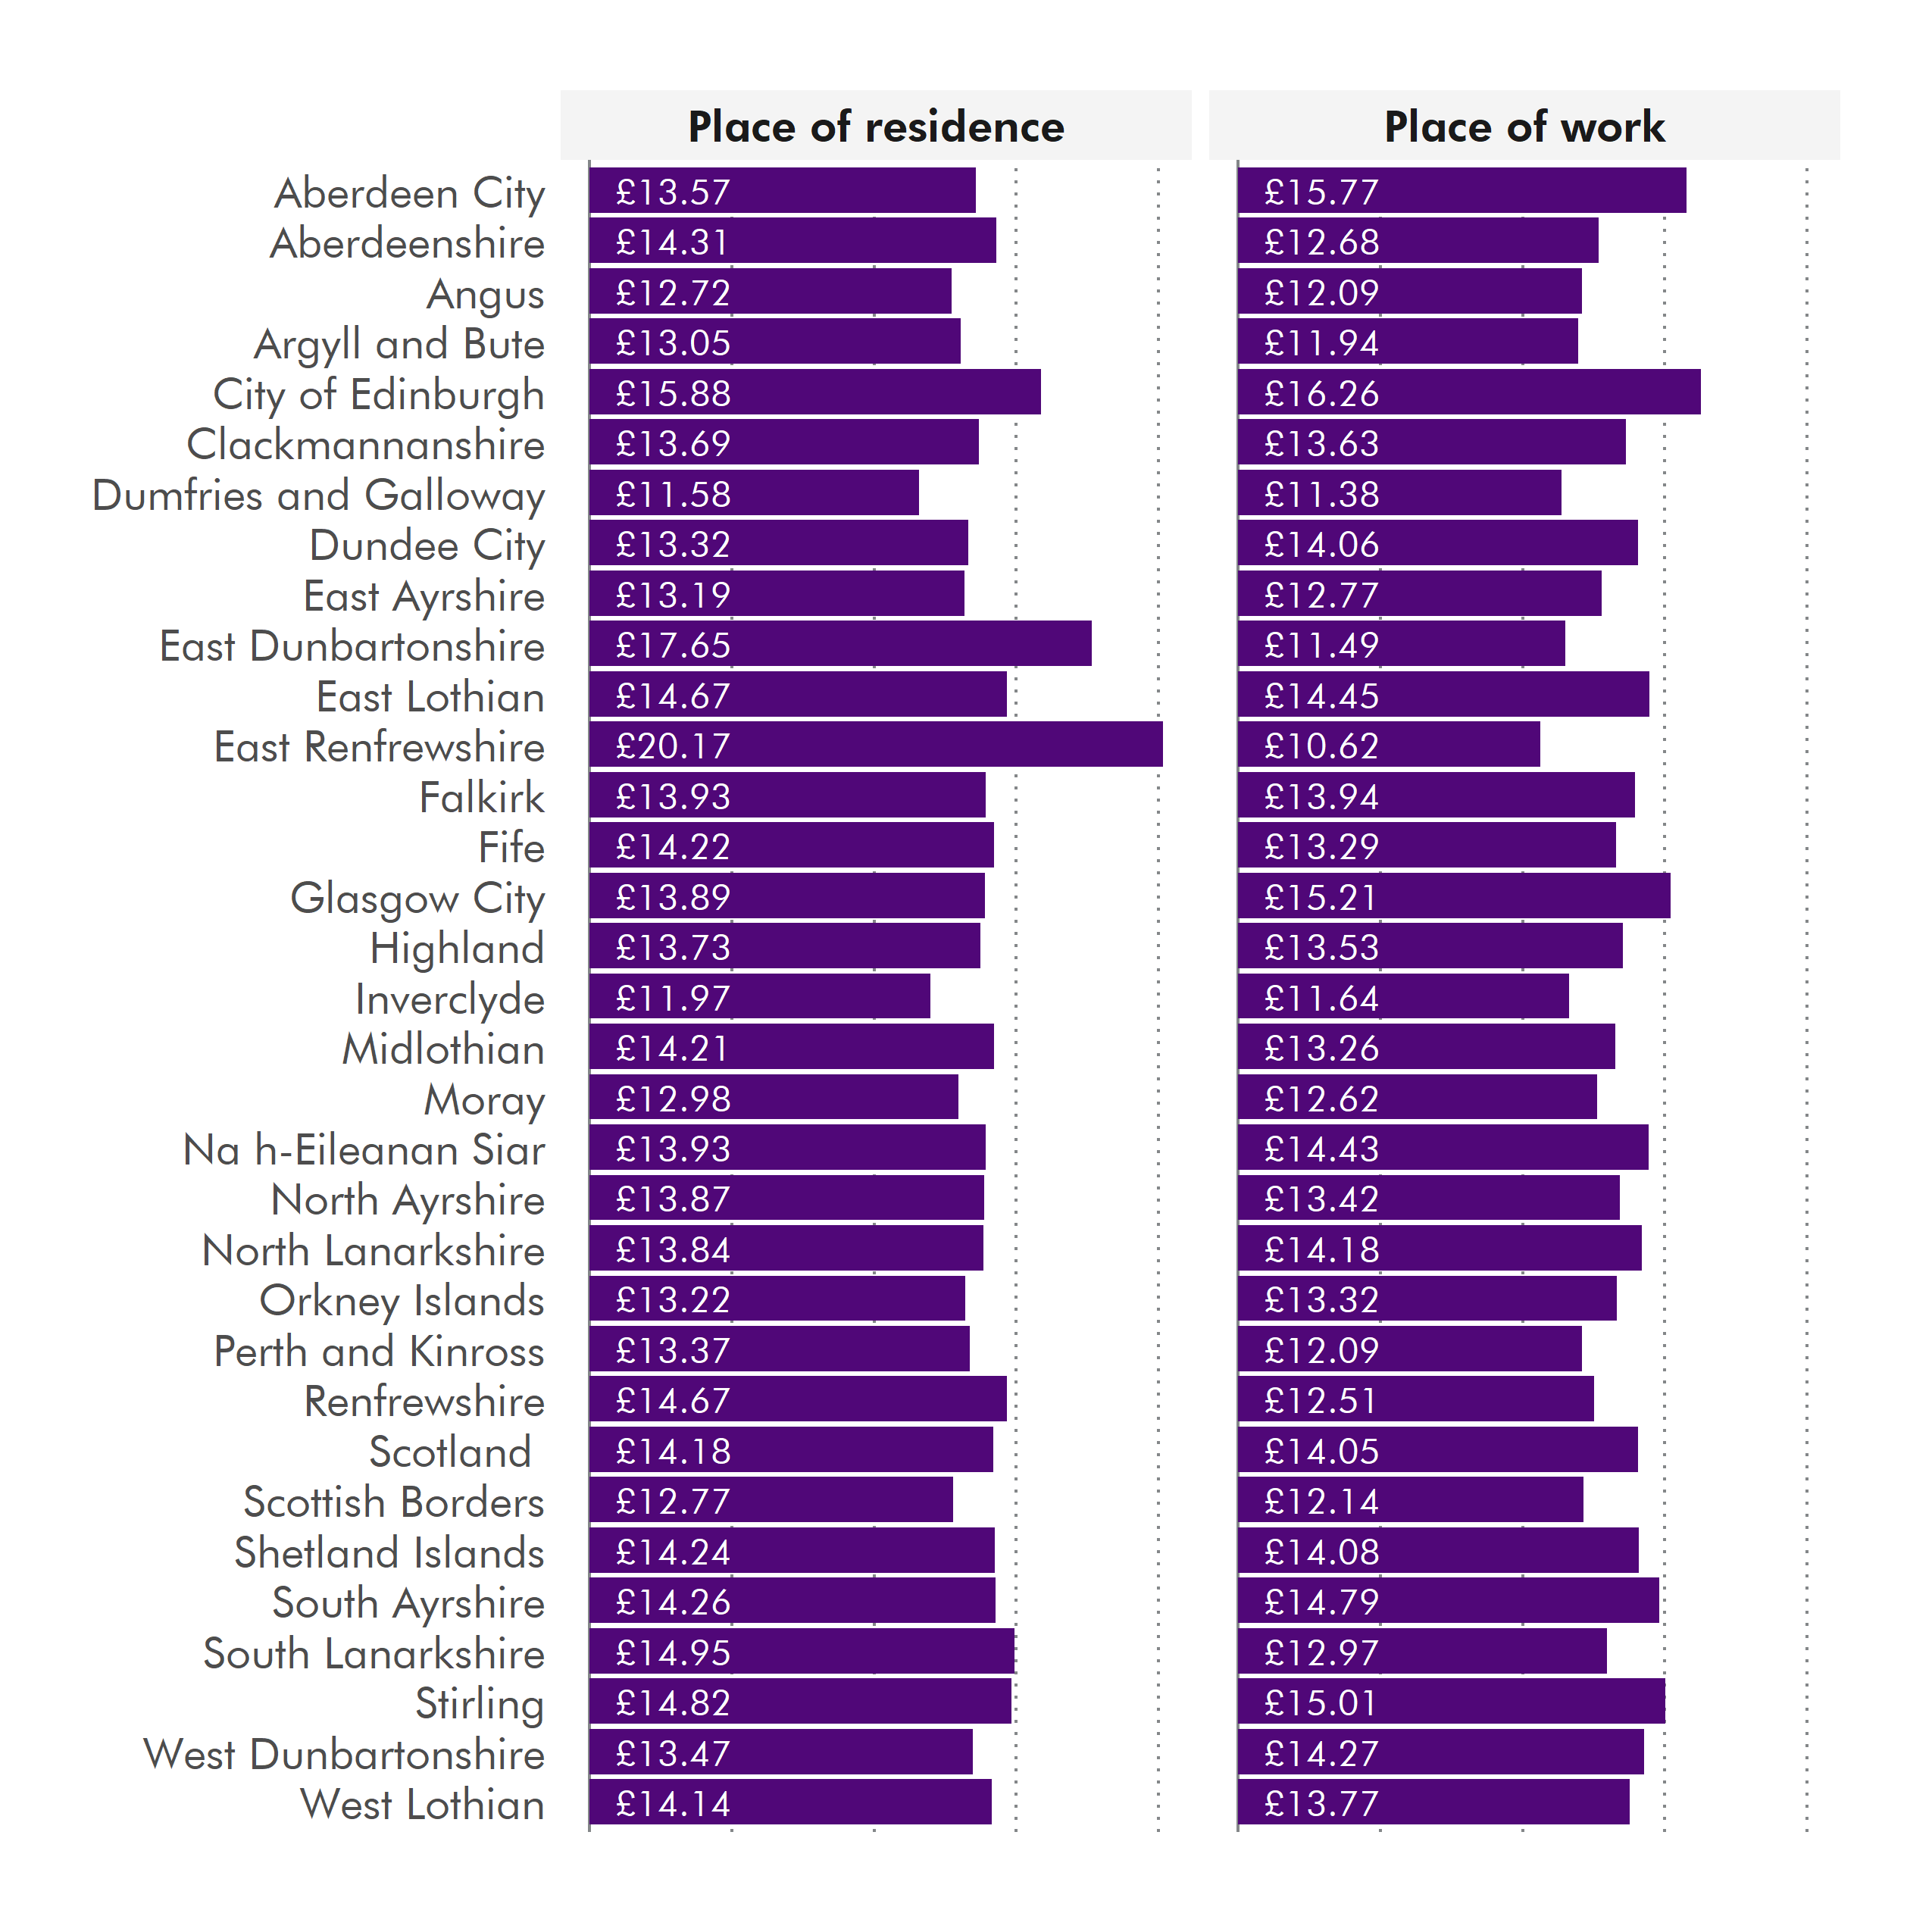
When looking at median hourly pay excluding overtime for where people live, East Renfrewshire has the highest pay at £20.17 per hour. Dumfries and Galloway has the lowest, at £11.58 per hour. Most areas with high pay by this measure tend to have a high number of commuters.
When looking at the median hourly pay excluding overtime for where people work, Edinburgh has the highest pay at £16.26 an hour. East Renfrewshire has the lowest at £10.56 an hour. The top three local authorities for workplace pay are Edinburgh, Aberdeen and Glasgow.
Care should be taken when interpreting these figures due to issues with this year's data. You can find out more in this in the "about the data" section of the briefing.
Sources
Office for National Statistics. (2020, November 3). Employee earnings in the UK: 2020. Retrieved from <a href="https://www.ons.gov.uk/employmentandlabourmarket/peopleinwork/earningsandworkinghours/bulletins/annualsurveyofhoursandearnings/2020" target="_blank">https://www.ons.gov.uk/employmentandlabourmarket/peopleinwork/earningsandworkinghours/bulletins/annualsurveyofhoursandearnings/2020</a> [accessed 10 December 2020]
Fraser of Allander Institute. (2020, November 4). A cautionary look at what the new earnings data can tell us about the impact of the pandemic.. Retrieved from <a href="https://fraserofallander.org/a-cautionary-look-at-what-the-new-earnings-data-can-tell-us-about-the-impact-of-the-pandemic/?utm_source=rss&utm_medium=rss&utm_campaign=a-cautionary-look-at-what-the-new-earnings-data-can-tell-us-about-the-impact-of-the-pandemic&utm_source=Fraser+Blog+and+subs+list&utm_campaign=641ca90373-Email-Blog-RSS&utm_medium=email&utm_term=0_c855ea57f7-641ca90373-73858393" target="_blank">https://fraserofallander.org/a-cautionary-look-at-what-the-new-earnings-data-can-tell-us-about-the-impact-of-the-pandemic/?utm_source=rss&utm_medium=rss&utm_campaign=a-cautionary-look-at-what-the-new-earnings-data-can-tell-us-about-the-impact-of-the-pandemic&utm_source=Fraser+Blog+and+subs+list&utm_campaign=641ca90373-Email-Blog-RSS&utm_medium=email&utm_term=0_c855ea57f7-641ca90373-73858393</a> [accessed 10 December 2020]