Child Poverty in Scotland since the 1960s
Child poverty is distinct from adult poverty because of its potentially adverse effects on children's biological, social, cognitive and emotional development. This briefing offers an overview of child poverty in Scotland from 1961, when data collection for Great Britain began, to the present day. Measuring child poverty is complex and often contentious. This briefing considers various approaches to measuring child poverty in Scotland, namely by expenditure, by income, by the median and by material deprivation. It also notes an increasing interest in food insecurity and the difficulties of measuring child poverty at the sub-national level.
About the author
Amanda Gavin is a doctoral researcher at the University of Glasgow, and completed this briefing under the UKRI Policy Internships Scheme, as part of the SPICe academic engagement programme. The programme aims to utilise Scotland's world-famous universities and academic capabilities to support the Parliament in its scrutiny and legislative roles.
Summary
The UK Government's Welfare Reform and Work Act 2016 repealed much of the 2010 Child Poverty Act, including the targets to reduce poverty and the measures of child poverty based on family income. However, the Child Poverty (Scotland) Act 2017 reintroduced targets for Scotland. The 2017 Act therefore marked a significant divergence from the rest of the UK in the approach to discussing and tracking child poverty.
This briefing offers an overview of child poverty in Scotland from the early 1960s, when data collection for Great Britain began, to the present day. Scotland-specific data is not available before 1994-95.
Measuring child poverty is complex and often contentious. This briefing considers various approaches to measuring child poverty in Scotland, namely by expenditure, by income, by the median and by material deprivation. It also details an increasing interest in food insecurity, and describes the difficulties of measuring child poverty at the sub-national level.
Some key points from the briefing are:
Child poverty is different from adult poverty because of its potentially adverse effects on children's biological, social, cognitive and emotional development.
Although the data for Scotland alone is sparse before 1994-95, when taken together, studies suggest a higher rate of poverty in Scotland than the rest of the UK in the 1960s and 1970s.
The results of the National Child Development Study, published in 1973 in a report entitled Born to Fail? found that 1 in 9 disadvantaged children had been in care at some stage before the age of 11. For comparison, of the children who were not deemed to be disadvantaged, 1 in 100 had been in care before the age of 11.1
Today, children who are in care are among some of the most vulnerable to poverty in Scotland. Children who are living in children's homes or hostels are not included in the Family Resources Survey, the data which is used by the Scottish Government to measure child poverty. The Scottish Government does not currently include children in care as one of the six priority groups at a higher than average risk of poverty.2
Post war trends of lower rates of relative poverty and inequality in the UK were reversed in the 1980s.3 The number of children living in poverty doubled and by 1990, children had displaced pensioners as the single largest group in poverty.4
Between the mid 1990s and 2008 child poverty fell significantly across the UK, with Scotland witnessing some of the largest falls. Since 2015 Scotland has had a child poverty rate around six percentage points lower than the rest of the UK, but overall progress has stalled since 2004-05.
The most recent Scottish Government figures (2019-20) show that child poverty was rising even before the pandemic, and it is too early to understand the true impact of the pandemic on child poverty in Scotland.
On 29 November 2021 the Scottish Government announced that the Scottish Child Payment will be doubled to £20 per week per child from April 2022.
What is child poverty?
The Child Poverty Action Group defines child poverty as growing up in a family without the resources to 'obtain the type of diet, participate in the activities and have the living conditions and amenities' which are the norm in Scotland today.1 The child poverty of today is not the same as the child poverty of the 1960s. In other words, poverty is relative. Today, a child may have three meals a day and a warm coat to go to school in but is still poor because their parents cannot afford to heat their home or pay for them to attend the same school trip as their classmates.1
Although there is a broad consensus in Scotland - and the rest of the UK - around the concept of poverty as a lack of material resources, or an inadequate standard of living as a consequence of a lack of material resources, there is an absence of public or political consensus on how child poverty should be defined and measured in exact terms.3
Why is child poverty different from adult poverty?
Child poverty is distinct from adult poverty. Childhood is a period of biological, social, cognitive and emotional development. Poverty is known to adversely affect children's development. A relatively short time by adult standards can, for children, mean spending a large part of your childhood years in poverty.1 The negative impacts of poverty start before birth and accumulate over the life course. For instance, infant mortality rates in the most deprived parts of Scotland are over 50% higher than in the least deprived areas.2 And almost twice as many babies are born with low birth weight in the most deprived areas compared to the least deprived (7% compared to 4%).2 The consequences of low birth weight include an increased risk of infant mortality, developmental problems in childhood and poorer health in later life.4
The Child Poverty (Scotland) Act 2017
Child poverty in Scotland is measured before housing costs (BHC) and after housing costs (AHC). However, the Child Poverty (Scotland) Act 2017 sets its targets on child poverty AHC. Measuring child poverty AHC recognises that high housing costs can push families below the poverty line. For instance, in Wales the rate of child poverty is particularly high after compared to BHC suggesting it is housing costs that are pushing many families below the poverty line.1 Lower rates of child poverty in Scotland have, in part, been attributed to lower housing costs than in England and Wales.1 Scotland has persistently had lower rates of child poverty than in England, Wales and Northern Ireland on both a BHC and AHC measure.1
The Child Poverty (Scotland) Act 2017 contains four measures of child poverty:
Relative poverty: a child is in relative poverty if they live in a household where equivalised income for the financial year in question is less than 60% of the median equivalised net income for that financial year.
Absolute poverty: a child is in absolute poverty if they live in a household with an income below 60% of the median equivalised net income in 2010-11.
Combined low income and material deprivation: a child is in combined low income and material deprivation if they live in a household with an income below 70% of the equivalised median net income for that year and are unable to afford a number of basic goods and services.
Persistent poverty: a child is in persistent poverty if they have been living in Scotland and in relative poverty for the past four years.
Relative poverty is low income relative to the rest of society.
Absolute poverty is low living standards relative to 2010-11.
Combined low and material deprivation is being unable to afford basic necessities.
Persistent poverty is being in poverty for several years.
In 2018 the Scottish Government published its Tackling Child Poverty Delivery Plan (2018-2022). The Plan focuses on increasing family incomes and reducing costs. The Scottish Government recognises that the risk of child poverty varies between different groups and identified a number of 'priority groups' from their statistics
Lone parents: 36% of children in relative poverty.
Disabled: 30% of children in relative poverty.
3+ Children: 30% of children in relative poverty.
Minority Ethnic: 37% of children in relative poverty.
Youngest Child Aged <1: 32% of children in relative poverty.
Mothers Aged <25: 44% of children in relative poverty.4
Measuring child poverty
Measuring child poverty is a complex and contested task. Poverty can be measured directly - using measures such as material deprivation - or indirectly, by measures such as by income. The Scottish Government uses a combination of direct and indirect measures of child poverty. Under the Child Poverty (Scotland) Act 2017, targets are set using an income-based measure of poverty.
In Scotland, children are considered to be living in poverty if they live in households with less than 60% of the median equivalised household income.
By expenditure
The Family Resources Survey (FRS) is the official source of both the UK and Scottish Government information about income and poverty. The FRS is a study of living standards and is used to measure expenditure, income and material deprivation.
The survey does not include those living in temporary accommodation, such as hostels, children's homes or care homes. Some children who may be at a higher risk of poverty are therefore not included in these statistics. For example, children in care and children who are refugees or asylum seekers are at a greater risk of poverty, and are more likely to be living in temporary accommodation.1
The FRS is considered to be among the most robust figures available for understanding poverty. However, estimates cannot be broken down by local authority area.
Before 1994, the main source of information on income and poverty in the UK comes from the Family Expenditure Survey (FES).
By income
Income-based measures of child poverty create a 'poverty line'. The Households Below Average Income (HBAI) statistics, based on the FRS, are used to create the poverty line. There are several advantages to an income-based measure of child poverty. Income is objective, well-defined and measurable.1 It also allows for comparisons with other advanced industrial societies.1 Some researchers have raised concerns that data on incomes may be unreliable, especially if derived from surveys, as it is in Scotland.3
A significant disadvantage of an income-based measure of child poverty is the lack of power children have over how family income is distributed and spent within the household.4 A key assumption underlying the Scottish Government's definition of poverty is that all individuals in a household benefit equally from the combined household income. In practice, this is not always the case.
In instances where there is an unequal distribution of household income it is often women and children who are deprived. Financial abuse disproportionately impacts adults who have children.5Financial abuse is where a perpetrator uses or misuses money which limits and controls their partner's current or future actions. It can include using credit cards without permission, putting contractual obligations in their partner's name, and gambling with family assets.
A 2015 survey by Opinium for the Co-Op and Refuge found that as many as 1 in 5 women had experienced financial abuse at some point in their lives.6 Financial abuse can leave women - and children - with no money for food or clothing. In these circumstances, women are known to subjugate their own needs in order to safeguard those of their children. One respondent to the 2015 survey said: 'I had to scrape and beg to feed the children and went without food to give it to them.'6
These findings may undermine the Scottish Government's definition of poverty that, as it is based on income, by implication assumes all individuals benefit equally from the combined household income.
By the median
The Scottish Government consider children to be in poverty if they live in households with less than 60% of equivalised median household income. This is the primary measurement used by both the Scottish Government and the UK Government, and by the European Union. Median income is the middle point in the income range, with equal numbers of households on incomes above and below that point.1 For measuring poverty, the median income is generally preferred as it is unaffected by a few large incomes, but the mean value is not.2 (Mean - or average - income is the sum of all incomes divided by the number of incomes.)
There are several benefits to using such a measure. Using a median-related threshold gives a strong indicator of what is considered normal in contemporary society. It provides a simple measure of how the poorest members of society are doing in relation to the middle. It enables comparisons over time and between countries.3
Equivalisation acknowledges that a larger household needs more income than a smaller household to achieve a similar standard of living. The equivalisation process is often criticised for failing to take into account circumstances that will mean a family requires greater resources, such as disability. The rate of child poverty for those experiencing a disability in the family may be underestimated.4
Median-related indicators of child poverty have faced some criticism, however. For example, one criticism levelled at this measure is that in times of recession, relative poverty may be seen to fall because median incomes fall.5 The issue can also be seen in times where the economy is 'booming' and incomes at the bottom do not grow as quickly as the median income. This is known as the 'Irish paradox' after the Irish boom of the late 1990s which witnessed rising relative poverty because incomes at the bottom, although increasing, did so less rapidly than median income.6
Some economists have also criticised the 60% measure as being arbitrary, pointing out that 50% is used by some countries, such as Australia and New Zealand. With that being said, the Minimum Income Standards Project has consistently found that their minimum incomes come out at around or, in most cases, above the 60% threshold.3 Despite the limitations of the 60% median indicator, most researchers advocate for supplementary indicators, not scrapping it.
In four dimensions
Peter Adamson (2012) suggested measuring child poverty in 'three dimensions':
Measuring the number of children who fall below the poverty line
Measuring how far children fall below the poverty line
Measuring how long children remain below the poverty line
To put it another way, Adamson suggests that child poverty should be measured not only by how many children fall below the poverty line but how far and for how long.1 Writing specifically about Scotland, Prof Stephen J. McKinney et al suggest a fourth dimension:
How far above the poverty line children are, and yet still experience the effects of poverty.2
By material deprivation
Material deprivation is an additional way of measuring living standards for children. It refers to the self-reported inability of individuals or households to afford certain goods or activities that the public have agreed are necessities at that point in time. This indicator provides a measure of children's living standards that is not solely based on income. The index of material deprivation distinguishes between adult and child poverty. They have shown that parents are more deprived than their children as they sacrifice their own needs to protect their children.1
Respondents with children included in the FRS are asked whether they have 21 goods and services, including child, adult and household items. The questions concerning children are:
outdoor space or facilities nearby to play safely
enough bedrooms for every child of 10 or over of a different sex to have their own bedroom
celebrations on special occasions such as birthdays, Christmas or other religious festivals
leisure equipment such as sports equipment or a bicycle
a family holiday away from home for at least one week a year
a hobby or leisure activity
friends around for tea or a snack once a fortnight
go on school trips
toddler group/nursery/playgroup at least once a week
attends organised activity outside school each week
fresh fruit and vegetables eaten by children every day
warm winter coat for each child.
Measures of material deprivation can give a clearer picture of a household's funds than income-based measures alone. For example, children living in a household with a disabled person(s) can have lower rates of relative poverty than other priority groups but 1 in 5 are living in material deprivation.2 Disability benefits are paid to cover the additional cost of living with a disability, such as equipment for your home. And recent research by SCOPE found that disability related benefits do not always cover the full additional costs of living with a disability.3 The rate of child poverty for those experiencing disability in the family are likely underestimated.
Food insecurity
Food insecurity can be defined as lack of secure access to sufficient, safe and nutritious food.1 There is no population-wide monitoring of food insecurity in Scotland. There is a growing interest in this area of study, however. Each year the Scottish Government publishes School Healthy Living Survey statistics on the registration for free school meals, the uptake of paid and free school meals and PE. And since 2019, the FRS has measured household food insecurity.2
Food insecurity has physical and psychological consequences for children. Children who have experienced hunger are more likely to have poorer physical health; they are more likely to have diminished academic, behavioural and social functioning, and negative mental health outcomes. Research shows that children are aware of food insecurity in their families and internalise responsibility for managing food resources to alleviate pressure on their carers.3
Research commissioned by the Children and Young People's Commissioner Scotland (2016) found that children had a good understanding of the physical health implications of them not having enough of the food they need. Children were also concerned about the psychological consequences of food insecurity i.e. 'feeling poor.'4
In the UK, it is estimated that food insecurity affects 19.5% of children below the age of 15. Some of those affected will seek help from food banks. A third of people who are dependent on food banks in Scotland are children.4 Dr Juliet Wakefield and Dr Mhairi Bowe (2018) suggest that food bank usage can be used as a measure of the impact of poverty on the lives of children and families in the UK.6
Child poverty at the sub-national level
Chart 2 uses the DWP statistics 'Children in low income families: local area statistics' (March 2021). The data provides the number and percentage of children aged 0-15 years who are living in households below 60% median income before housing costs. The data below combines the DWP local indicators with information about housing costs at the local level to estimate poverty rates after housing costs.
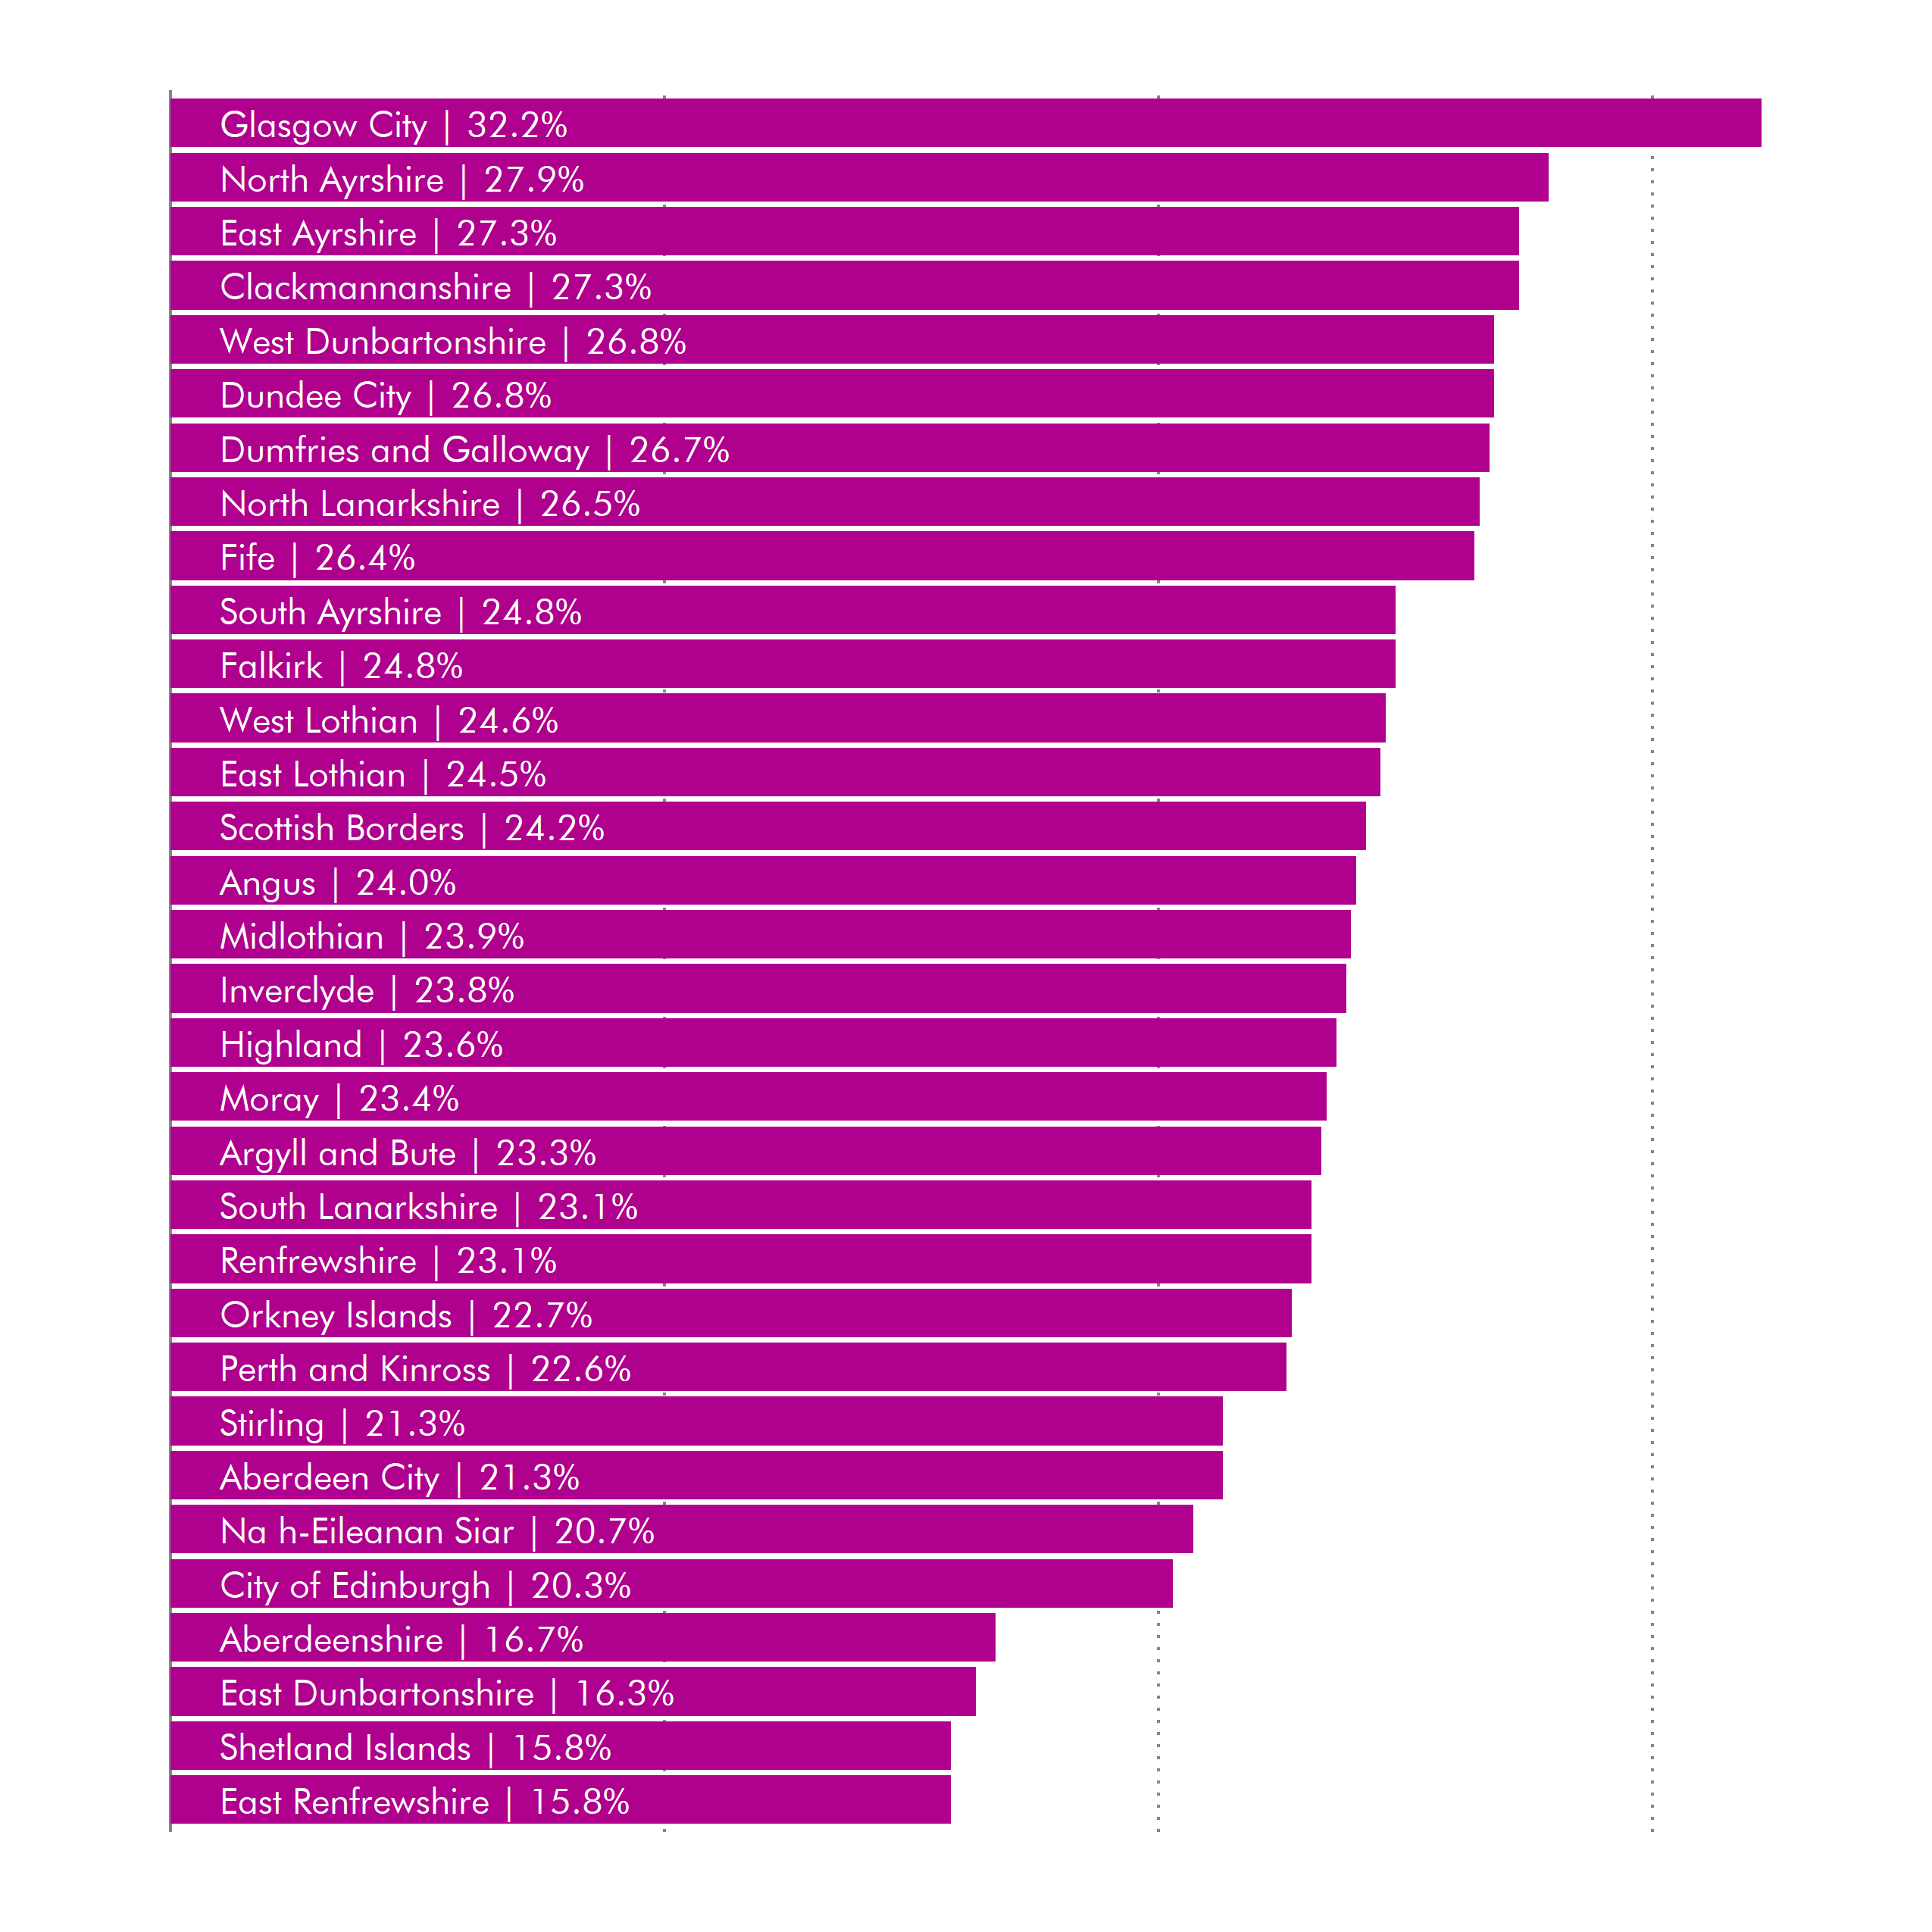
DWP Children in Low Income Families: Local Area Statistics
The FRS and therefore the Households Below Average Income statistics are only available nationally.
Place-based measurements, such as the Scottish Index of Multiple Deprivation (SIMD) tend to fail to identify localised pockets of poverty in rural areas. Poverty in rural areas is often dispersed - unlike poverty that can be concentrated in urban housing developments - and interspersed amongst pockets of wealth.1 In other words, poverty in rural Scotland is often harder to measure and less visible. This is important, as rural poverty accounts for 16% of all poverty in Scotland.2 Rural Scotland accounts for 17% of the total population.
Using low income as an indicator of child poverty can also be challenging in rural areas owing to the considerable variation in living costs.2 Living costs can be significantly higher in rural Scotland than in urban areas. It costs 10% to 30% more for families with children to live rurally than in an urban area in Scotland.2 A car can be a necessity, not a luxury. Public transport is often poor or non-existent .1 Higher domestic fuel costs are also a significant challenge and can push people into poverty over the colder months. Both of these factors make people particularly vulnerable to the recent rise in fuel costs and may push more children into poverty.The higher cost of living in remote rural, remote small town and island areas was recognised in an amendment to the Fuel Poverty Bill which raised the Minimum Income Standard used in the measurement of fuel poverty.
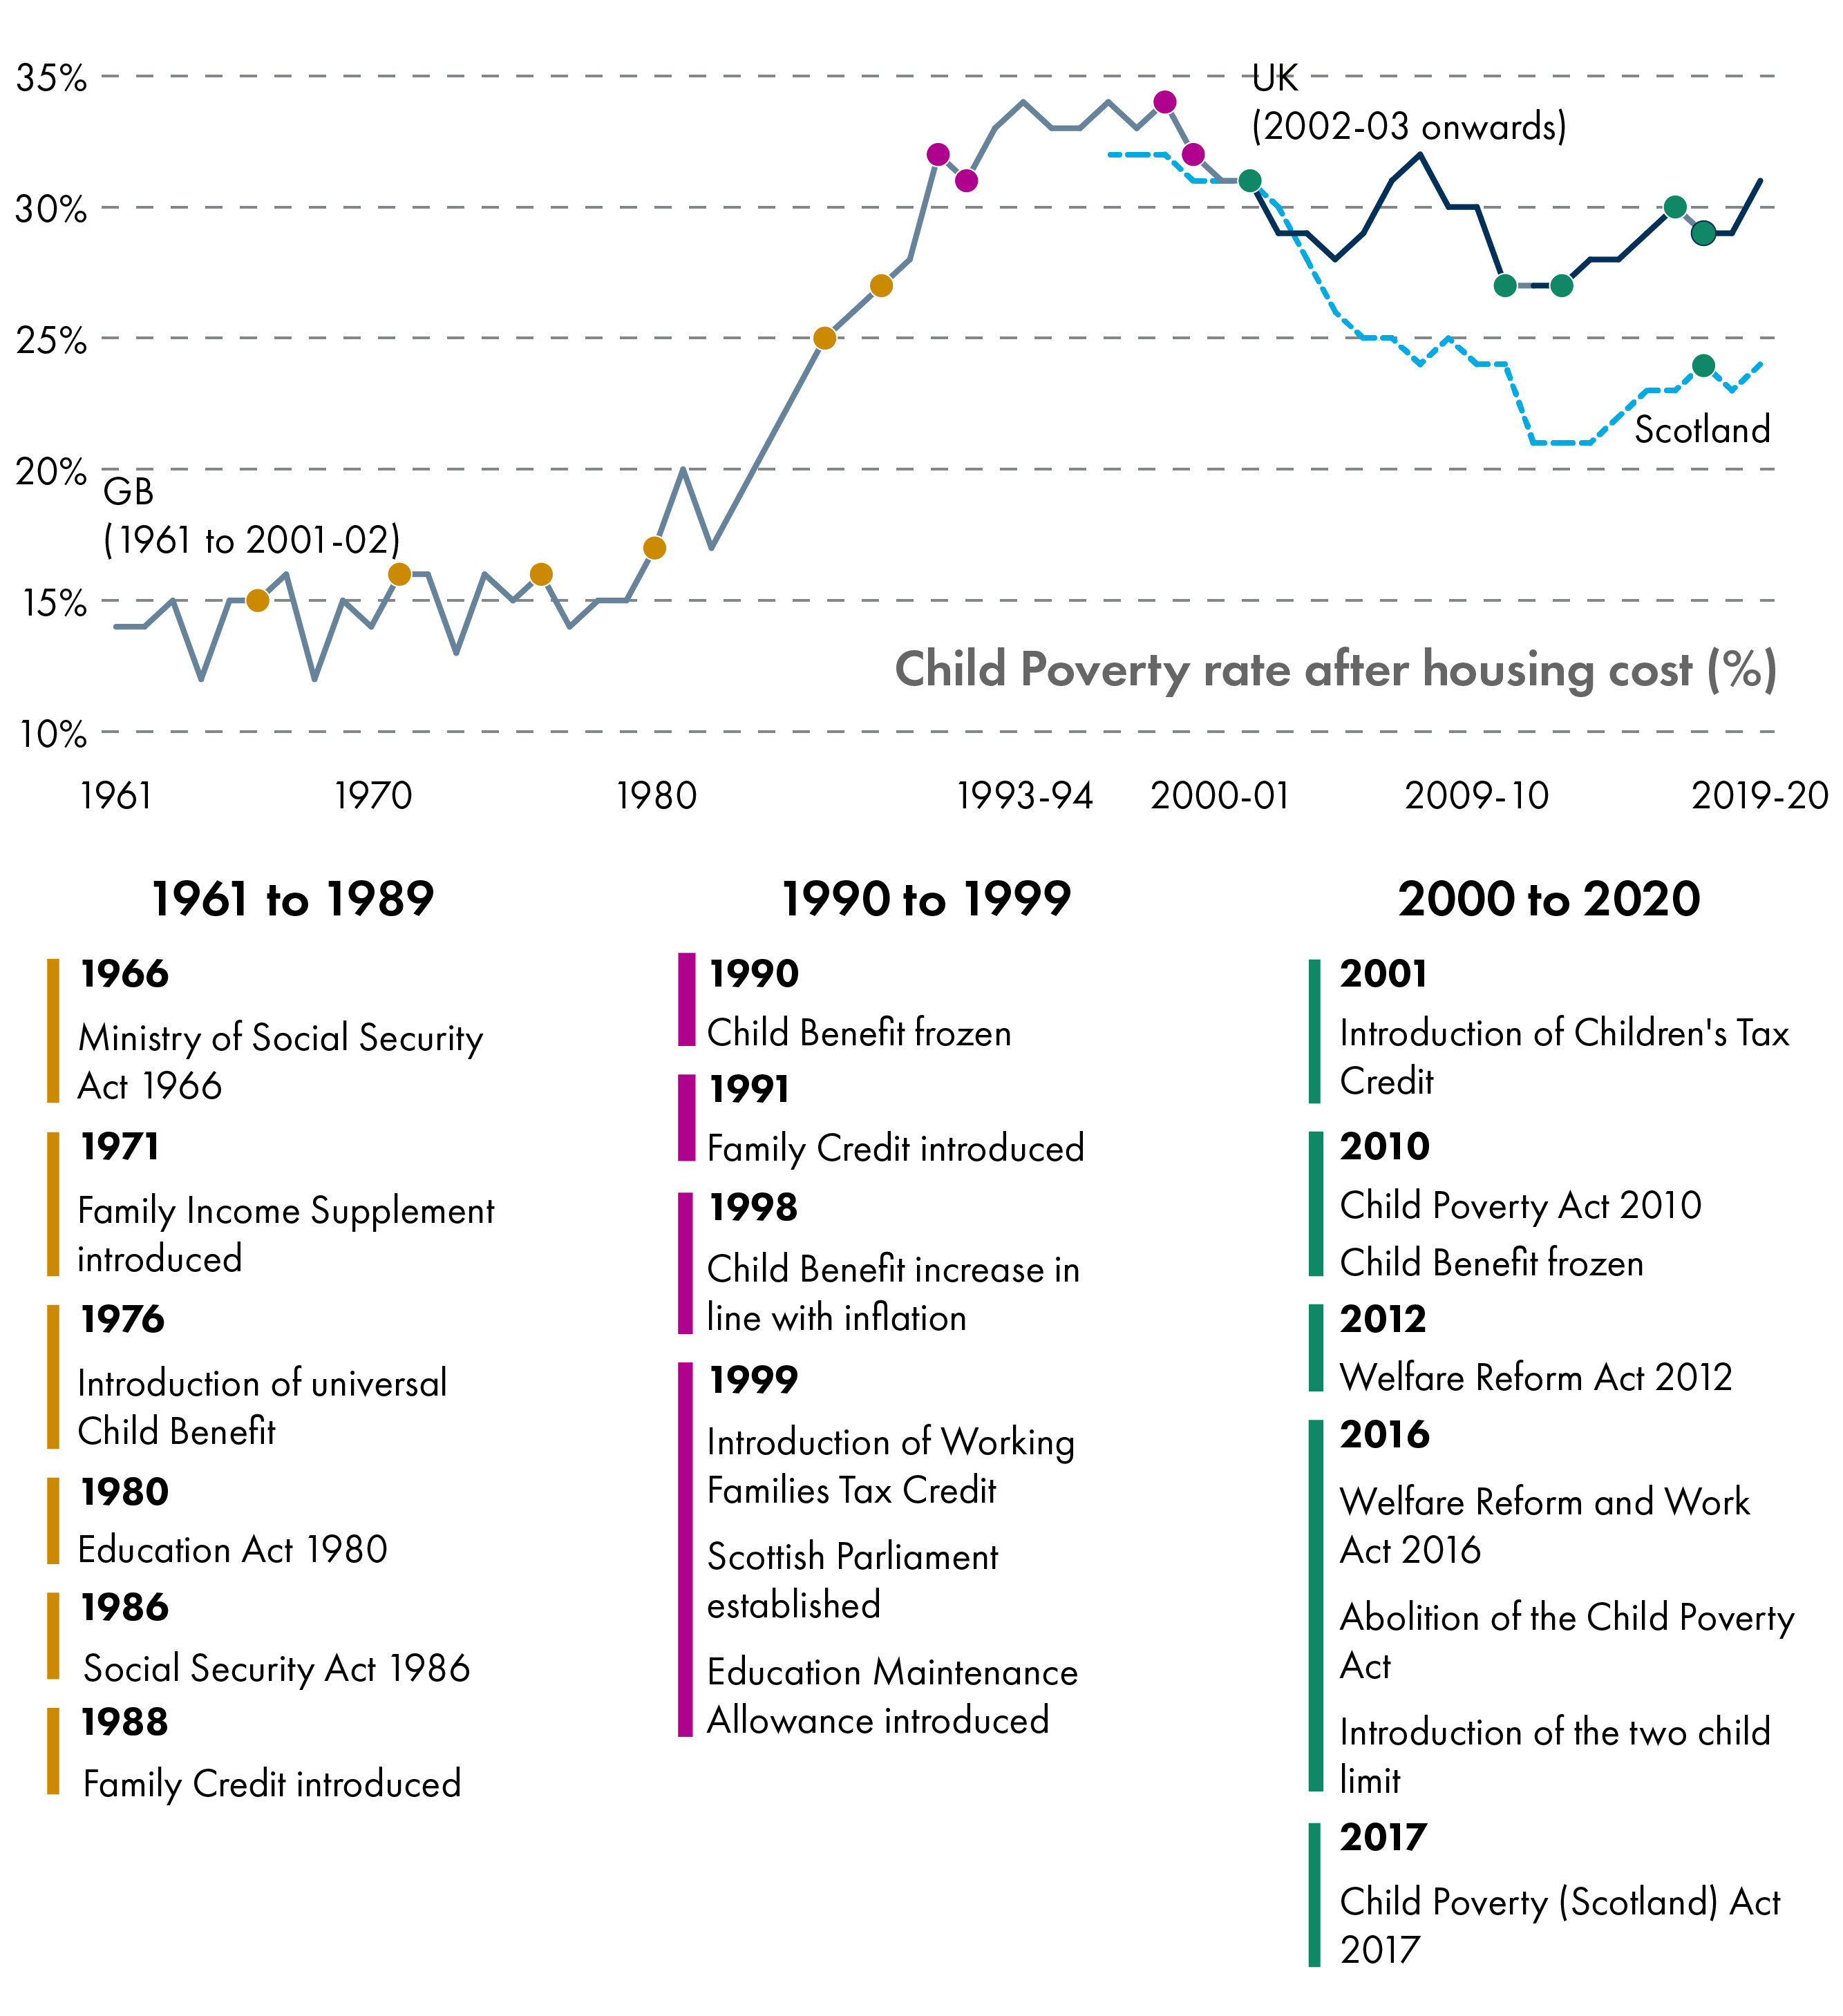
Measuring child poverty over time - UK
Child poverty trends can be identified for Great Britain, and later the UK as a whole, using statistics going back to the 1960s. Chart 3 (below) uses the primary measurement of child poverty used by the Scottish Government, i.e. children living in households with less than 60% of equivalised median household income. Data for the UK as a whole is available, to some extent, from 1961 onwards; however, Scotland-only data is only available from 1994/95. The chart also includes a timeline of some of the major policy interventions in this area. A number of these are discussed in more detailed in later sections.
IFS analysis of the FES (1961-93) and the FRS (1993-2020); Scottish Government analysis of the FRS (1994-2020)
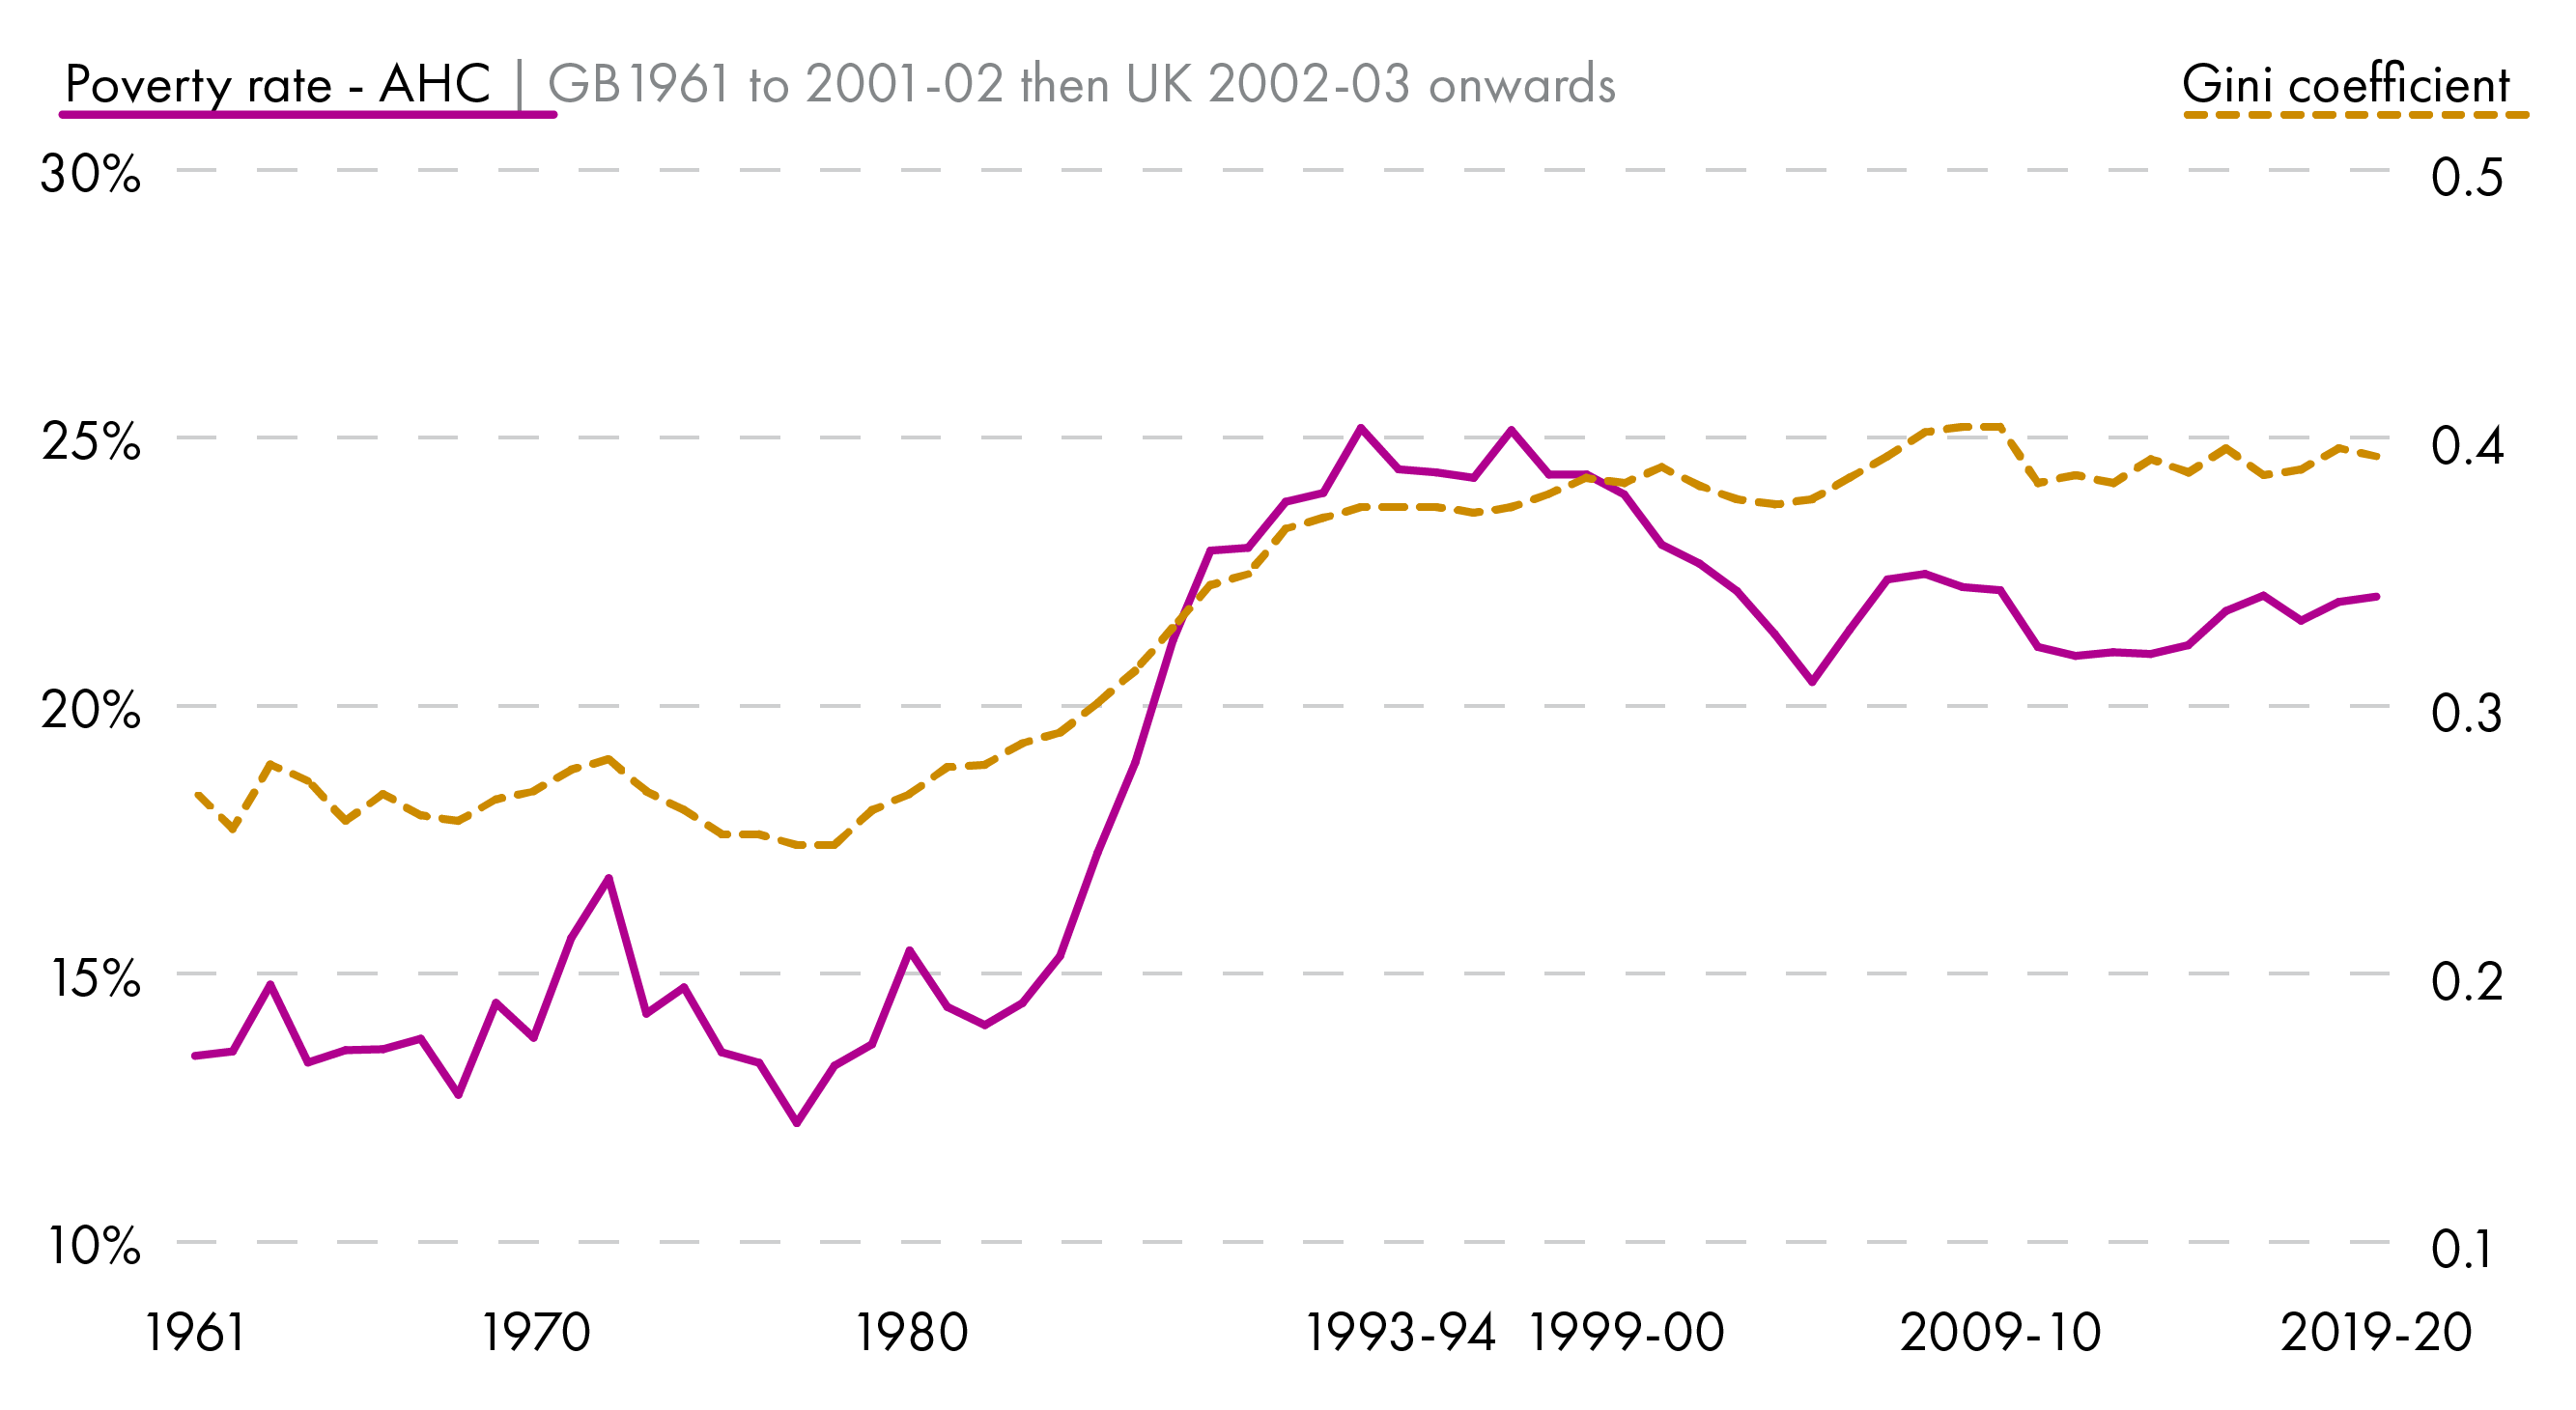
Measures based on median income allow for rates of child poverty in the UK to be tracked across time. Chart 4 shows the rate of child poverty for the UK since 1961 alongside levels of income inequality Gini coefficient.
Gini coefficient is a statistic which quantifies the amount of income inequality in a population.
As Chart 4 highlights, median-related measures are intrinsically linked to levels of inequality in a society. The 1960s and 1970s had similar levels of income inequality; households generally saw their incomes grow. Levels of income inequality are significantly higher today than they were in 1961. This means it is challenging to show levels of child poverty in the UK in a consistent way in the 1960s and 1970s.
IFS
In stark contrast, the 1980s witnessed a rapid rise in income inequality. From the late 1970s to the mid 1990s, income inequality grew at a faster rate in the UK than even in the US.1 In the 1980s income inequality rose faster in the UK than any other OECD country, and wage inequality reached an all-time measured high.2 As Chart 3 shows, there was a substantial increase in the number of children in poverty in the 1980s. By 1990, children had displaced pensioners as the single largest group in poverty.3 Although a very useful measure of long term trends in child poverty, these statistics tell us nothing about regional differences, or about disability, race or gender differences, all of which impact children's risk of poverty. It also cannot tell us how children experience poverty.
Measuring child poverty over time - Scotland
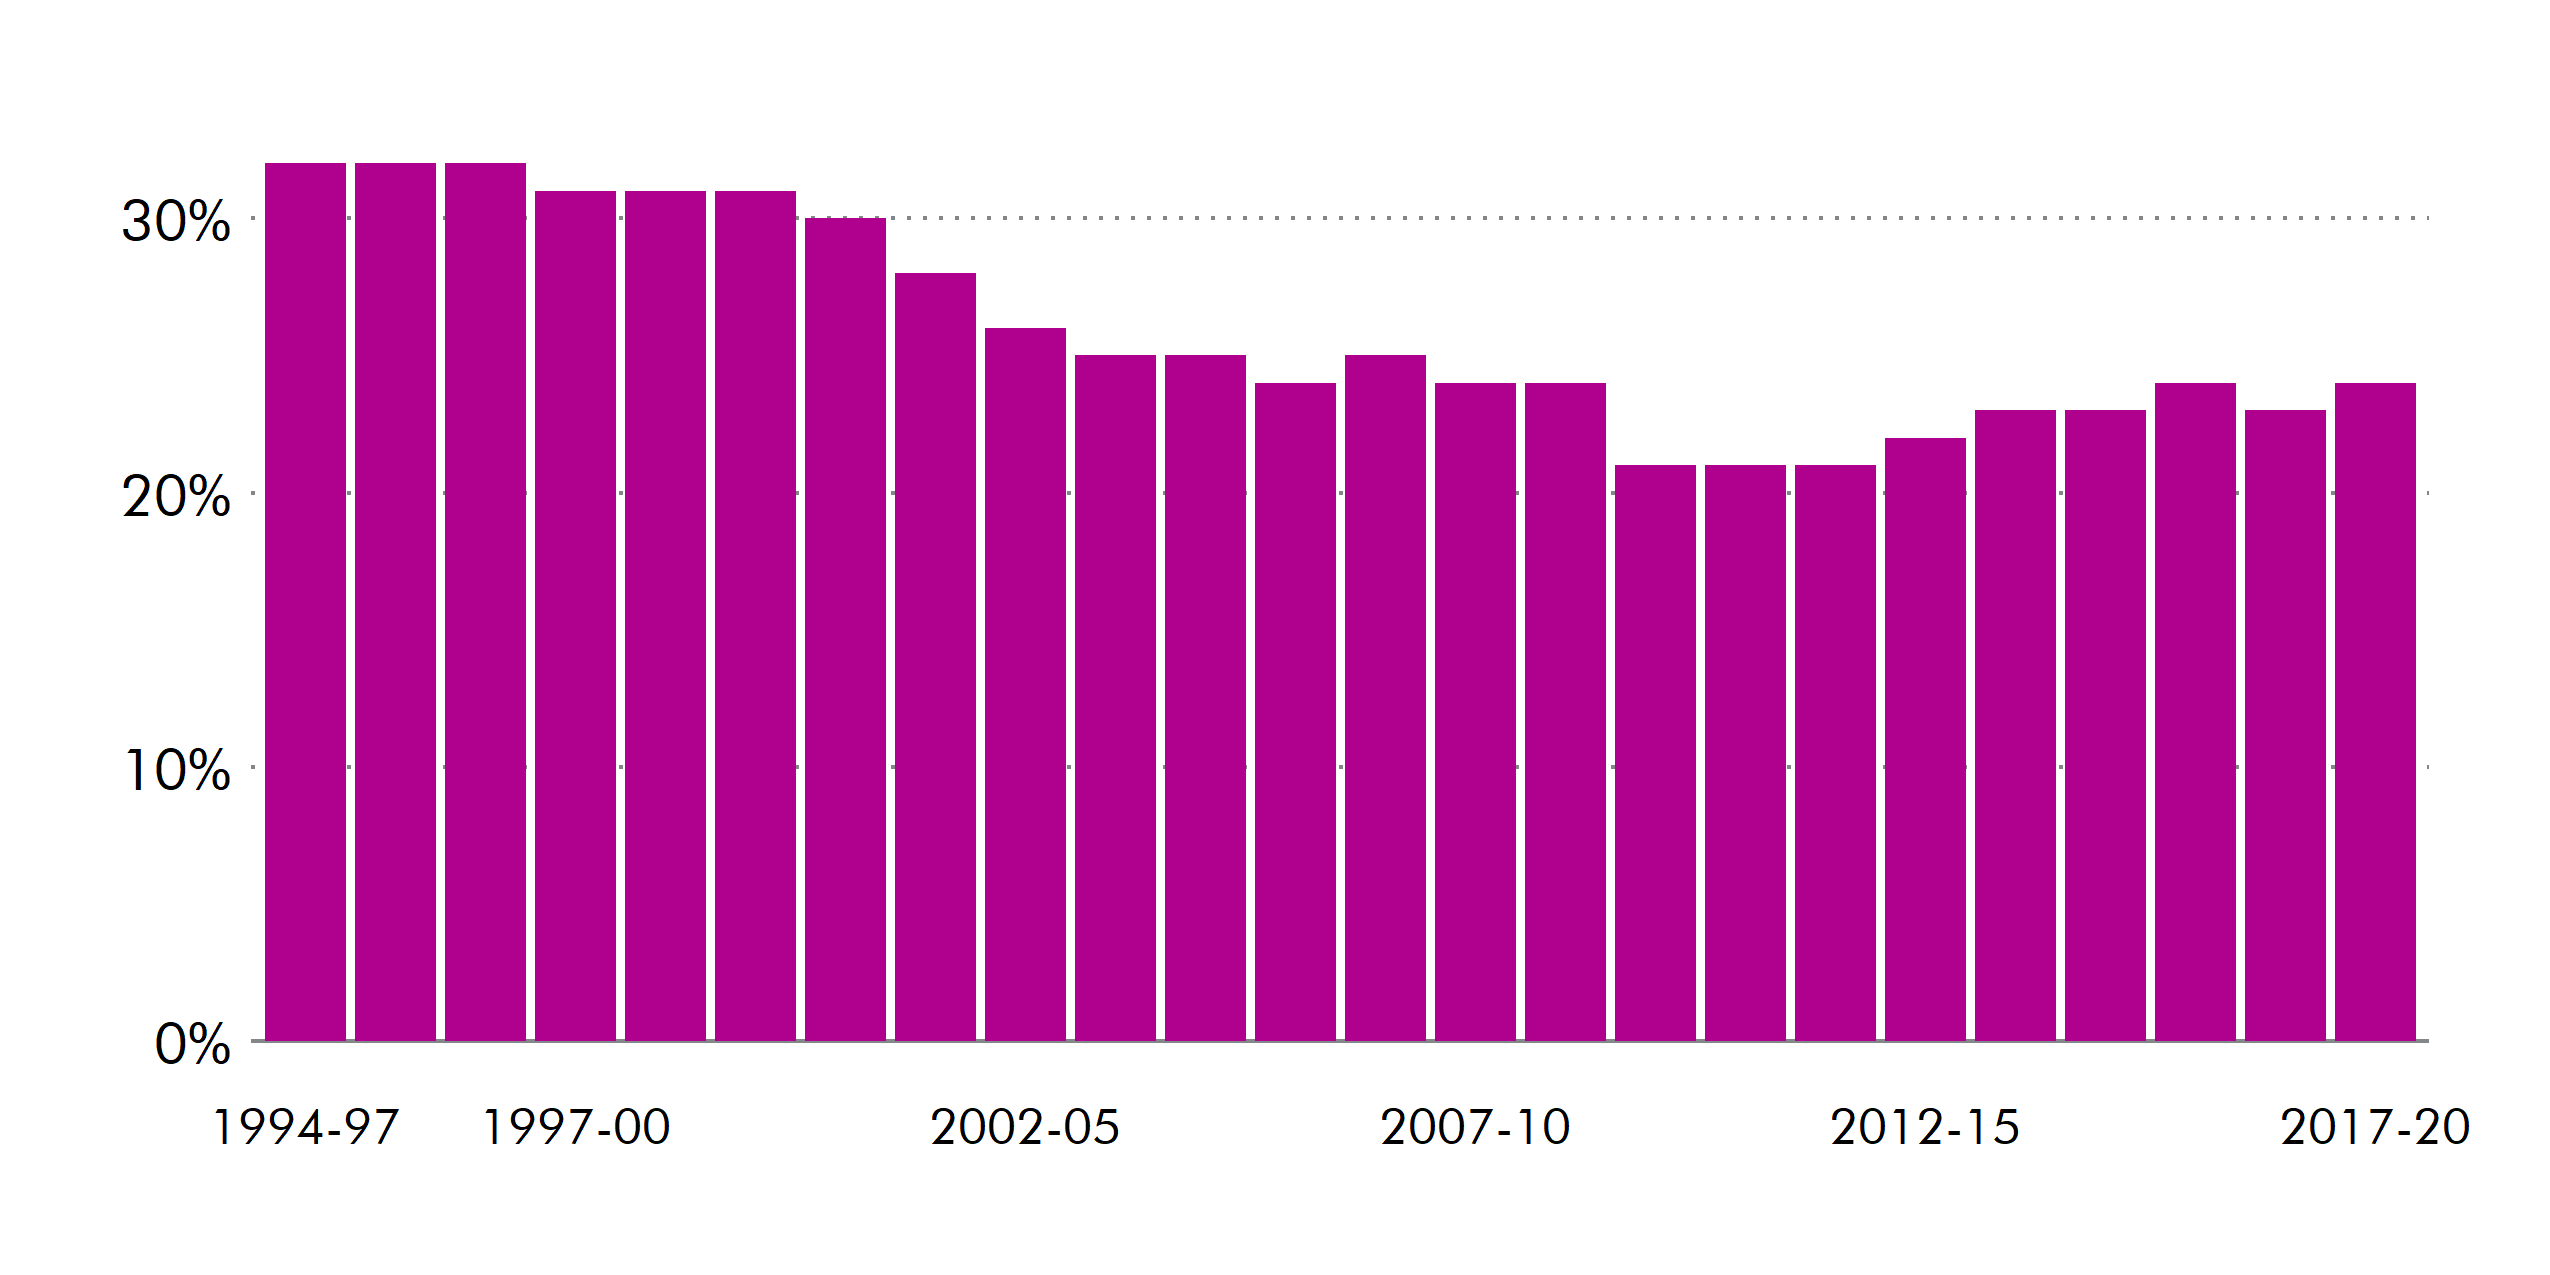
Chart 5 measures the rate of child poverty in Scotland using a measurement of households below 60% of the median equivalised income after housing costs. Chart 5 shows that child poverty in Scotland fell between 1997-00 and 2011-14. Since then, child poverty has been increasing in Scotland.
Scottish Government analysis of the FRS
It is difficult to measure levels of poverty in Scotland in the postwar period. As Prof Nick Bailey points out, individual studies provide glimpses into this period, but these use a variety of data sources and measurements of poverty. Individually, these studies are often inconclusive. With that being said, when taken together, these studies give the impression that poverty rates were slightly higher in Scotland than the UK average.1 For example, Townsend (1979) used data from 1968 and 1969 and a poverty measure of households with an income below 140% of the Supplementary Benefit level. He found that Northern Ireland was, by far, the poorest region with a 44% poverty rate. Scotland, with a poverty rate of 29%, was just above the UK average.2 And Norris (1977) used FES data from 1972 and 1973 . He used a poverty threshold of 110% of the Supplementary Benefit level. Using this measure, Norris found poverty was slightly higher in Scotland, with a rate of 14% compared to 13% for the UK.3
Research commissioned by the Joseph Rowntree Foundation (2007) combined the analysis of early FES and data from the UK Censuses of 1971, 1981, 1991 and 2001 to map the patterns of poverty in the UK. Using the same methodology as the Breadline Britain indices, the research assessed the changing geographies of poverty and wealth over the last three decades of the 20th century.4 Some key points arising from the overall figures were:
Poverty and core poverty (defined as being income poor, materially deprived and subjectively poor) levels fell through the 1970s.
They both then increased, returning by 1990 to similar levels to 1970.
During the 1980s, while poverty levels were increasing, so were the proportion of asset wealthy households.
The 1990s saw a continuing rise in breadline poverty (defined as living below the poverty line) levels, but a concurrent decline in core poverty.4
In 1970 it found higher rates of breadline poverty in the north of England, Wales and Scotland, especially in Glasgow. Only 32 of the 1,282 tracts (approximately half of a UK parliamentary consistency in 2001) showed an increase in household poverty of the 1970s. Two of the top three were in Scotland; Livingston Central and Easterhouse. Between 1970 and 1980 three of the tracts with the largest decrease in poverty were all in Scottish cities: Aberdeen Queens Cross, Edinburgh North and Edinburgh Holyrood.4
By 1980, the study found that poverty decreased almost everywhere but high pockets remained in Glasgow alongside London and some cities in the north of England. By 1990, rates of poverty had risen everywhere, but again, levels were especially high in Glasgow. By 2000, poverty declined across Britain but still remained high in Glasgow.4
Geographical patterns of poverty offer some much needed context to the UK-wide data from the early FES.
1960s - the rediscovery of poverty
The 1960s witnessed a so-called 'rediscovery of poverty.' Many people wrongly believed that poverty had been eradicated by the post war welfare state. There were clear reasons behind such optimism. For instance, since the end of the Second World War average earnings had increased by about 50% and unemployment had remained low.1 For most of the population, their standard of living rose. The establishment of a comprehensive welfare state aimed to look after its citizens from 'cradle to grave.'
This widely held belief was undermined by Brian Abel-Smith and Peter Townsend's 1965 study of poverty in post war Britain, The Poor and the Poorest. The authors found the proportion of households living in poverty had increased from 10.1% in 1953/4 to 17.9% in 1960. Perhaps their most surprising finding was that in 1960 there were 2.25 million children living in poverty, challenging the widely held belief that poverty was mostly confined to the elderly.2
In The Poor and the Poorest Abel-Smith and Townsend defined poverty as living on an income at or below 140% of the current National Assistance level. In other words, they measured poverty in relation to social security levels. They also set out an explicitly relative definition of poverty:
The approach we have adopted follows from the principle that the minimum level of living regarded as acceptable by a society increases with rising national prosperity.2
The idea that poverty is relative began to gain traction in the 1960s and is now central to the measurement of poverty.
The 'rediscovery of poverty' prompted by The Poor and the Poorest had a considerable impact on the policy agenda of the 1960s.4 It also led to the formation of the Child Poverty Action Group (CPAG). Its publication was timed to attract maximum sympathy from the public during the Christmas period. It largely succeeded. As set out by CPAG, on Christmas Eve Brian Abel-Smith appeared on the 9pm ITV news and the 10pm BBC radio news, and the BBC screened a documentary about children in poor families. The documentary makers were so moved that they returned with toys and food for the families.4
In 1967, a government study, The Circumstances of Families supported the findings of Abel-Smith and Townsend. It found that large numbers of working families, especially large families, were in poverty due to low pay. In response to both studies and pressure from the Child Poverty Action Group, the government increased family allowances for the fourth and subsequent children from 50p to 75p per week in October 1966. Then, in April 1967, to 75p for the second child and 85p for each subsequent child. This increase did not help only children.6
1970s - A higher rate of child poverty in Scotland
At the start of the 1970s, poverty was higher in Scotland than in the rest of the UK. 1 It is difficult to consistently measure levels of poverty - including child poverty - in Scotland in the 1970s. With that being said, individual studies from that period all suggest that poverty rates were between 1-2 percentage points higher in Scotland than the UK average. It is likely that rates of child poverty were also higher in Scotland than the rest of the UK in 1970s.
Scotland experienced rapid de-industrialisation from the 1970s onwards, particularly in manufacturing and mining. In the 1980s the UK as a whole had experienced the effects of de-industrialisation. By the mid 1980s, 1 in 16 children in Britain were severely disadvantaged by social and economic circumstances. In Scotland, this number was 1 in 12 children.2
The Strathclyde region bore the brunt of economic decline in Scotland.i3 Children living in the peripheral housing estates in the West of Scotland - Castlemilk, Drumchapel, Pollok - were among the hardest hit by economic decline of the 1970s and 1980s.4 The geographical patterns of poverty identified by the Joseph Rowntree Foundation suggest that Scotland, especially Glasgow, experienced even higher levels of child poverty than the data from the FES might suggest.
Data from the FES suggests that the child poverty rate for the UK in 1975 was around 15% - in Scotland it was likely somewhere between 16% and 17%. In areas particularly hardest hit by the loss of manufacturing and mining, such as Paisley, Airdrie and Kirkcaldy, it was likely higher again.
At a UK level, there were no substantive policy interventions aimed specifically at tackling rising levels of child poverty. Perhaps one exception was a new Family Income Supplement introduced by the UK Government in 1970. It was a means-tested supplement to incomes, payable to men or lone mothers. The Supplement increased with the number of children and included the first born child. The Supplement fell as earnings rose, however, and it was criticised by the Child Poverty Action Group for disincentivising work. The take up was low. By 1974 half of all recipients were lone parents, two thirds with just one child.5
In 1973 the results of the National Child Development Study were published by the National Children's Bureau in a report entitled Born to Fail? The National Child Development Study followed the progress of all of the children in England, Scotland and Wales who were born in the week 3-9 March 1958. Born to Fail? looked only at the children on whom there was complete data; 10,504 children. It used the most recent information available which was a snapshot from when the children were aged 11 in 1969. The study defined low income as those who were in receipt of supplementary benefit. It acknowledged that the proportion of children living in low income families was likely underestimated as eligible families often fail to take up benefits. Despite the likely underestimate, the study found that 1 in 7 children - or 14% - were living in a low income household.6 Data from the FES finds that around 15% of children were living in relative poverty in 1969.
The study defined social disadvantage as children who were in all three of the following categories:
in a one-parent family or a large family
living in poor housing
with a low income.6
By this measure, 1 in 16 children were socially disadvantaged across Britain. In Scotland, however, 1 in 10 children were disadvantaged. 6The study demonstrated that children living in places with concentrations of poor housing, unemployment and social problems were disadvantaged in their subsequent life chances. Greater Glasgow had a disproportionate number of children living in such conditions.9 By age 11, disadvantaged children were:
more likely to be absent from school because of ill-health or emotional disorder
more likely to have received a burn, scald or serious flesh wound as a result of an accident at home
more likely to suffer from hearing loss and speech difficulties.6
Children who were in the care of a local authority or other children's organisation were excluded from Born to Fail? The National Children's Bureau found that 1 in 9 of the disadvantaged group had been in care at some stage before the age of 11. For comparison, of the children who were not deemed to be disadvantaged, 1 in 100 had been in care before the age of 11.6 Children who are living in children's homes or hostels are not included in the FRS, the data which is used by the Scottish Government to measure child poverty. Children who are in care are among some of the most vulnerable to poverty in Scotland. The Scottish Government does not currently include children in care as one of the six priority groups at a higher than average risk of poverty.12
Strathclyde Regional Council's Multiple Deprivation Strategy
In the 1970s, Strathclyde Regional Council (SRC) faced pressure from the press and central government to respond to the newly discovered problem of 'multiple deprivation'. Local services, such as child care, education and housing expanded quickly in the post war years. Until the 1980s, local authorities in Scotland owned three quarters of the housing stock, whilst running 90% of education and most local services, including buses. SRC, created in 1975 by the Local Government (Scotland) Act 1973 and abolished in 1996, was the largest local authority in the UK serving 2.5 million people. Stretching from Mull and Oban to South Ayrshire, SRC was responsible for education, social work, policing, fire, sewage, strategic planning, roads and transport for around half of Scotland's population. It was the largest unit of local government in Europe.
At that time, there was a widespread - and incorrect - belief that the new peripheral housing estates had a disproportionate amount of money spent on them. The National Children's Bureau report was used by some in SRC to persuade their colleagues that the conditions in the housing estates were unacceptable. In 1976 SRC drew up a strategy to tackle multiple deprivation:1
Positive Discrimination: studies of the allocation of resources in Strathclyde found that wealthier areas received more funding and services than poorer areas. Part of the SRC's multiple deprivation strategy was to allocate resources on a more equitable basis.
Community Development: the aim to find more creative organisational forms which would release the ideas and energies of residents and local officials in marginalised areas.
Inter-Agency Cooperation: in 1976-77 an intensive round of dialogues were held with District Councils, Central Government, Health Boards, Universities and Voluntary Organisations. It took until the 1980s before there were material results from these dialogues, such as the Joint Area Initiatives in the larger Glasgow Housing Schemes.
Information and Income-Maximisation: SRC distributed information and advice to ensure people were getting their entitlements from welfare benefits.1
The information and income-maximisation campaigns of the 1970s brought in millions of pounds to the Strathclyde Region.1 In anticipation of changes to social security in 1980, SRC distributed 100,000 postcards with details on how to make a claim under the existing regulations; more than 15,000 were returned to the Department of Health and Social Security (DHSS) . At that time it was estimated that in the Strathclyde Region there were £75 million in unclaimed benefits.4
There is no framework or method in which to easily measure the success of SRC's strategy in relation to child poverty. And the wider historical context of rising unemployment and cuts to social security and to local government budgets throughout the 1980s adds a layer of complexity in trying to determine tangible results.
1980s - Rising child poverty
Post war trends of lower rates of relative poverty and inequality were reversed in the 1980s.1Although the standard of living rose for the majority of the population, a substantial number of people, of whom children were the largest single group, were left in poverty.1 The impact of changing economic conditions and changes to social policy in the 1980s fell most heavily on children.1 A high level of unemployment was exacerbated by the government policy of reducing inflation. By January of 1982 there were 3 million unemployed (12.5% of the workforce). In some parts of Scotland, more than 15% of the workforce were unemployed.4 The number of children living in poverty doubled and by 1990, children had displaced pensioners as the single largest group in poverty.5 The rapid rise in child poverty was in spite of the fact family size and the number of families with children was falling.6
Prof David Gordon, Director of the Bristol Poverty Institute, notes that during the 1980s no report published by the UK Government included the word 'poverty'.7 In 1989, the then Secretary of State for Social Security, John Moore stated that absolute poverty had been eradicated, relative poverty did not exist and that is was 'the end of the line for poverty.' However, by several different measures, the governments of the 1980s presided over perhaps the largest increase in poverty and inequality in modern times.1
Using a relative measure of 60% below the median household income, there were 3.2 million children living in poverty in 1989.
The proportion of children in poverty rose from 1 in 10 to about one third. In 1974, 6.4% of all under 16-year-olds relied on means tested assistance. By 1994, the figure was around 25%. For younger children the rise was from 6.6% to 29.1%.
The incomes of the poorest 10% of people decreased by 9% in real terms while there was an overall increase in real income of 44%. This suggests that targeting and means testing did not improve the relative position of those with the lowest incomes.1
The Social Security Act 1986 claimed to be the greatest overhaul of the social security system since Beveridge. It aimed to simplify a complex system while increasing incentives to work. The Act broke the link between long-term benefits - including child benefit - with wage or price levels, whichever was higher. Instead, it linked them to price levels only, which rose more slowly.10 The value of benefits was eroded over time. The Act abolished Family Income Supplement, replacing it with Family Credit from 1988. It was mainly paid to fathers with their wages. Following pressure from the Child Poverty Action Group amongst others, family credit was then paid to the main carer - mainly mothers. It was claimed by far fewer than were eligible.1
Further changes to the social security system, enacted by the Social Security Act 1988, caused half a million school children to lose their entitlement to free school meals across the UK.10 Between 1979 and 1988 the proportion of children in primary school receiving school meals fell from 64% to 43%.1 Prof Pat Thane and Dr Ruth Davidson point out that some lost from the changes to social security and some gained, but overall they did not reduce poverty or increase employment. And the costs of social security were not reduced owing to rising unemployment.10
Demographic changes have also been identified as contributing to the increase in prevalence of child poverty in the 1980s. Between 1961 and 1986, the proportion of lone parent families doubled to 14% of all families with children. In 1990 there were 1.6 million children in families headed by a lone parent, 90% of whom were women.5 The incidence of poverty was - and still is - much higher in lone parent families. In 1989 an estimated 70% of lone parent families were living in or on the margins of poverty.5 With that being said, researchers have pointed to comparable nations who were able to better protect their children against the financial consequences of these demographic changes.17
1990s - The highest rate of child poverty in the EU
Child poverty in the UK was higher than any other country in the European Union in the 1990s. Throughout industrialised nations, levels of child poverty in the UK were only exceeded by Russia and the US.1
As in the 1980s, there were no policy initiatives at a national level that aimed to specifically tackle high levels of child poverty in the early 1990s. One driver of child poverty identified at the time was the rising number of lone-parent families (mainly mothers). In 1981, lone-parent families made up 12% of all families; by 1991 they were 20% of all families.1 The official rhetoric surrounding lone mothers was increasingly hostile in the 1980s and 1990s. For example, in 1983 leaked government papers referred to support for one parent families as ‘subsidising illegitimacy and immorality.'3
The Child Support Act 1991 was introduced at a time where family structure was changing. The rate of marriage declined, the divorce rate increased and there was a large rise in the number of single parent families, in which the incidence of poverty is much greater than in two parent households. The Act intended to compel absent fathers to provide financial support for their children. Its impetus was parental responsibility, not child poverty. It did not improve children's financial situation. Any money received by a lone mother was deducted from her benefits.1
By 1997 around 1 in 3 children were living below the poverty line in Scotland (Source: Scottish Government analysis of the FRS). On the lead up to the 1997 General Election, the UK Labour Party had promised to halve child poverty by 2010. In 1999 the then Prime Minister, Tony Blair, committed to ending child poverty "in a generation".
By both absolute and relative measures, poverty fell considerably among children. From 1997-98 to 2009-10 the number of children in relative poverty in the UK fell by around 800,000 before housing costs, or by around 300,000 after housing costs (Source: Households Below Average Income, 1994/5 to 2017/18). There were several measures taken to combat child poverty, although the details are largely beyond the scope of this briefing:
higher rates of benefits including an increase in Child Benefit in 1998
introduction of Children's Tax Credit in 2001
extended Disability Living Allowance to three and four year old children
the Sure Start programme introduced in 1998
Education Maintenance Allowance introduced in 1999
introduction of a National Minimum Wage in 1998, increased financial support for childcare and for undertaking training courses to assist parents in finding paid work.
Writing in 2001, the renowned academic Jonathan Bradshaw reflected on the success of anti child poverty measures introduced by New Labour in their first term in government:
...the task is going to get harder - it has been relatively painless in terms of revenue (and taxation) to shift large numbers of poor children a little below the threshold to a little above it. But to lift those a long way below the threshold and every child some way above it will require more substantial investments, in particular in the level of income support for those who do not have access to the labour market...To achieve the objective of abolishing child poverty will eventually entail policies which are much tougher politically and much more redistributive...That means increasing taxation on those who can afford to pay.5
It is challenging to disentangle the impact of policy from economic and demographic factors. Increases in employment during this time did have a small, but detectable, effect on levels of income poverty. The substantial falls in child poverty during this period were largely driven by additional spending on benefits and tax credits, however. Modelling by the IFS suggested that without those increases in spending, child poverty would have stayed at the same level or risen.6
2000s - Falling child poverty
Between the mid 1990s to 2008 child poverty fell significantly across the UK, with Scotland experiencing some of the biggest falls. Levels of debt and deprivation also fell, and child well-being improved.1 Families spent more on fruit and vegetables, children's clothes and books and less on tobacco and alcohol.2 The educational attainment gap began to close.3
The goal of reducing child poverty remained firmly on the policy agenda for both the UK government and the newly established Scottish Executive. The UK Government's target of reducing child poverty by one quarter between 1999 and 2005 was missed in the UK as a whole but was met in Scotland.4 Child poverty reduced further in Scotland than in other UK regions during this decade, but progress stalled in 2004-05.
The main fiscal policy levers to tackle child poverty were reserved to the UK Government; tax credits and taxation, and social security benefits.4 The first two (Labour-Liberal Democrat coalition) devolved Scottish administrations (1999-2003; 2003-2007) shared the UK Government's approach to tackling child poverty. The SNP, elected in 2007 as a minority government, shared with its predecessors a commitment to reducing poverty, but diverged in the approach taken.
The Scottish Government (2007 - 2011) positioned its anti-poverty strategy within its wider economic strategy. The Scottish Government expanded its focus to those on the margins of poverty (the lowest income 30%). Its reasoning was that 'attention should not be directed to those currently below the poverty line at the expense of those on the margins of poverty.'6 Some commentators expressed concern that this could involve the dilution of resources focused on those experiencing the most severe poverty. In particular, the risk that the focus of anti-poverty activity would shift away from children in workless households.7
In summary, the Scottish Government's anti-poverty strategy was 'encouraging work by removing barriers to employment; supporting those who cannot work for example through income maximisation; and making work pay.'8 The Scottish Government repeatedly stated that reducing income inequality would involve increasing the incomes of the poorest without lowering those of higher earners.4 Other measures introduced by the Scottish Government to address child poverty were:
providing free school meals for children in primary 1 - 3 in 2010
increasing nursery provision for children aged three to four by 50%
abolishing prescription charges in 2011.4
Since 2003-04 Scotland has had a lower rate of poverty than the rest of the UK. Two major factors have been identified as driving this divergence from the rest of the UK. First, Scotland's economic position improved relative to the rest of the UK. Second, the relative improvement in Scotland's housing costs. Prof Nick Bailey, writing in 2014, asserts that this is not owing to deliberate policy in Scotland but of policy choices in England, as well as a failure of policy there to cope with housing demand pressures, especially in London and the South East.11
Others have credited the fall in child poverty in Scotland to rising parental employment between 1998-99 and 2004-05.12 With that being said, data from the FRS indicates that between 2000 and 2005 around half of all children in poverty in Scotland were living in a household with at least one adult in paid work. Today, around 68% of children living below the poverty line are in a household with at least one adult in paid work. The Child Poverty Action Group attributes in-work poverty in Scotland to the nature of the labour market - low wages, insecure work and underemployment.13 Other researchers point towards the increases in tax credits and out-of-work benefits, rather than parents entering employment, as key reasons for the fall in child poverty in Scotland during this period.4
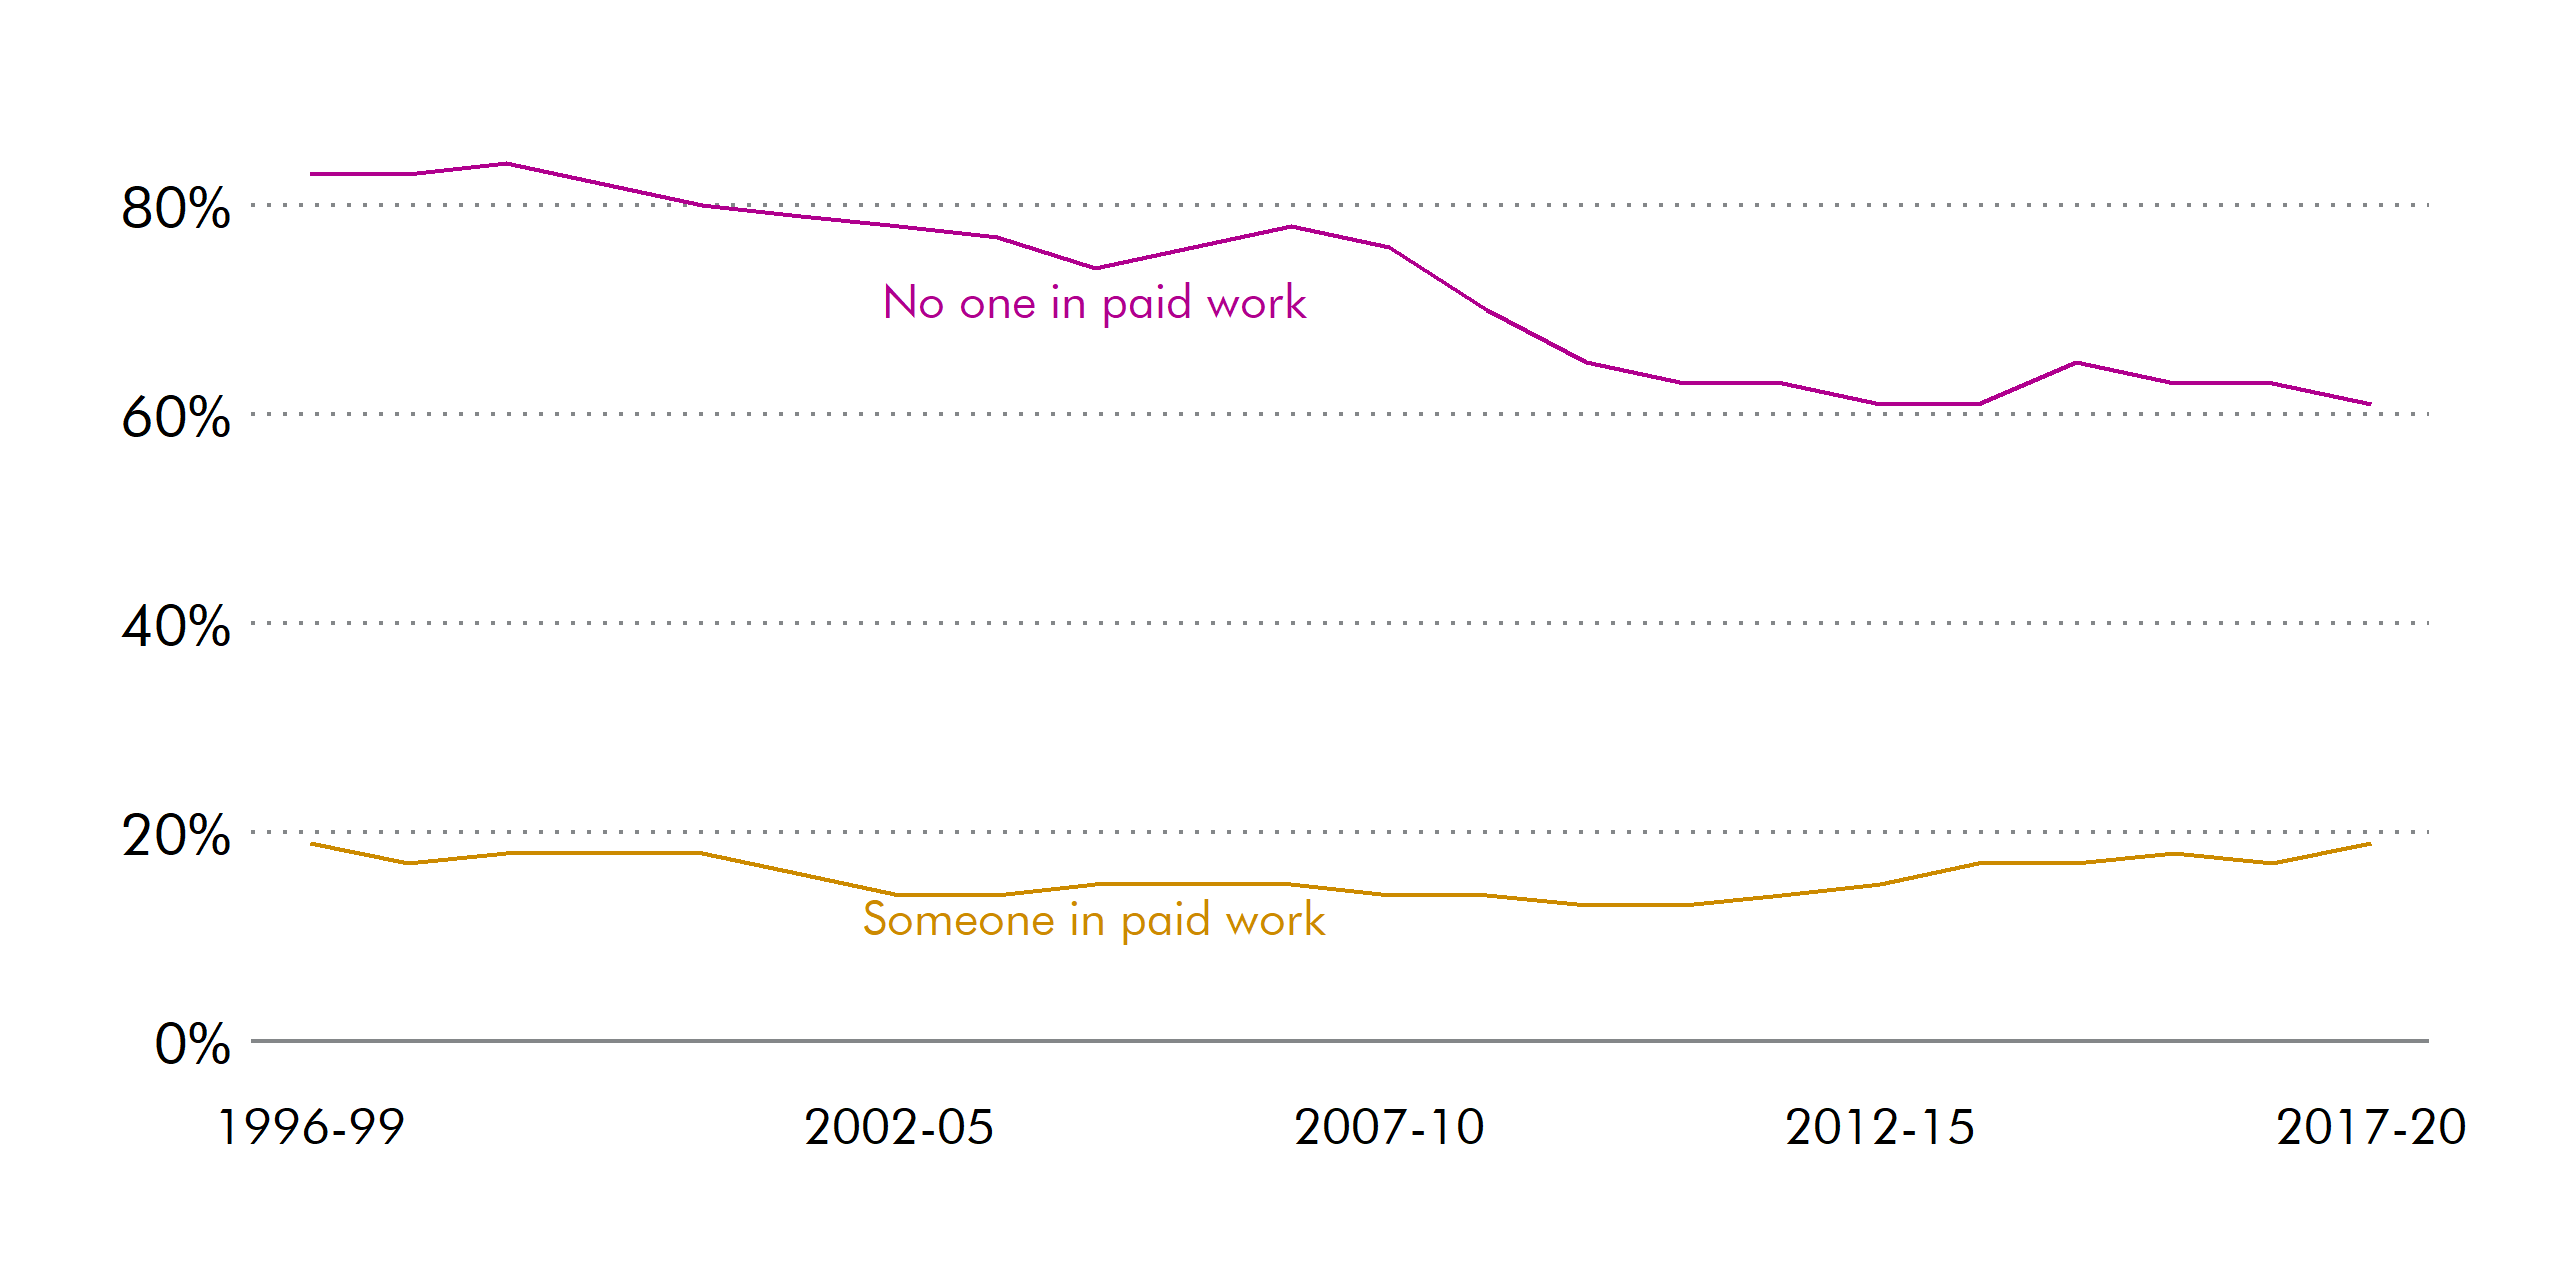
Chart 6 shows a decrease over the period in the proportion of children living in workless households who are in relative poverty. In 1996-99, 83% of children living in workless households were in relative poverty. This had reduced to 61% by 2017-20. On the other hand, the number of children in relative poverty living in households where at least one person is in work was the same in 2017-20 as it was in 1996-99.
Scottish Government analysis of the FRS
2010s - Scotland diverges from the rest of the UK
In 2010, the UK Government's commitment to eradicating child poverty was enshrined into law. The Child Poverty Act 2010 set time-limited goals and received cross-party support. The Act also imposed a legal duty on governments to produce a child poverty strategy. It received Royal Assent just six weeks before the 2010 General Election. The income targets related to a median household income and are set out below:
Relative low income: Less than 10% of children living in households with an income below 50% of the 2020 median.
Combined low income and material deprivation: Less than 5% of children living in households with both (a) an income below 70% of the 2020 median, and (b) material deprivation.
Absolute low income: Less than 5% of children living in households with an income below 60% of the 2010 median.
Persistent poverty: Less than 7% of children living in households with an income below 60% of the median in the given year for at least three out of a four-year period.
The UK Government's Welfare Reform and Work Act 2016 repealed much of the 2010 Child Poverty Act, including the targets to reduce poverty and the measures of child poverty based on family income. The amended act, re-named the Life Chances Act, only requires the UK Government to report to Parliament on the number of children living in workless households, and educational outcomes at GCSE level. Following campaigning from various organisations, such as the Child Poverty Action Group, the UK government agreed to create a statutory duty to regularly publish data on the number of children in poverty. It does not set targets for the reduction of child poverty.
Since 2015 the rate of child poverty in Scotland has been around 24%, which is around 6 percentage points lower than the rest of the UK. When measuring poverty before housing costs, Scotland is largely comparable to the rest of the UK. When measuring poverty after housing costs, however, Scotland has a lower rate of poverty. Research has shown that higher rates of social housing in Scotland, and lower housing costs more generally are a key factor in explaining this difference.1
The Child Poverty (Scotland) Act 2017 re-introduced targets for Scotland. The targets of the 2010 legislation are retained and strengthened under this legislation. Under this Act, the Scottish Government must publish Child Poverty Delivery plans in 2018, 2022 and 2026, together with annual progress reports. The Poverty and Inequality Commissionwas established on a statutory basis to monitor progress. In addition, Planning Partnerships - comprising of bodies such as local authorities, health boards, colleges, housing associations and the police - must report every three years on what they are doing to tackle child poverty. The Act marks the beginning of a significant divergence from the rest of the UK in approach to child poverty in Scotland.
In order for the Scottish Government to meet the 2023-24 interim target (to reduce relative child poverty to 18%) 50,000 children will need to be lifted out of poverty. The End Child Poverty Coalition in Scotland, made up of 120 organisations including Together, The Poverty Alliance and One Parent Families Scotland, has called for the doubling of the Scottish Child Payment. Together said it is 'the single most impactful action that could be taken to help meet the interim child poverty targets in 2023.'2 The Scottish Government has committed to doubling it to £20 per week, per child by the end of this parliament.3 On 29 November 2021 the Scottish Government announced that the Scottish Child Payment will be doubled to £20 per week per child from April 2022.
Analysis by SPICe, earlier this year, suggested that if eligibility was extended to under 16s and the payment per child was also doubled to £20, then child poverty would be at 19% in 2021 rather than the 24% estimated level of child poverty with no Scottish Child Payment.4
All these estimates will be affected by changes in the wider economy. Actual child poverty figures for child poverty in 2020-21 will be published in March 2022. The most recent Scottish Government figures (2019-20) show that child poverty was rising even before the pandemic, and it is too early to understand the true impact of the pandemic on child poverty in Scotland.
Sources
Wedge, P., & Prosser, H. (1973). Born to Fail?. (n.p.): The National Children's Bureau.
Scottish Government. (2021, June 23). Tackling Child Poverty: Third Year Progress Report 2020-2021. Retrieved from <a href="https://www.gov.scot/publications/tackling-child-poverty-third-year-progress-report-2020-2021/" target="_blank">https://www.gov.scot/publications/tackling-child-poverty-third-year-progress-report-2020-2021/</a> [accessed 24 November 2021]
Hendrick, H. (2003). Child Welfare: Historical Dimensions, Contemporary Debate. (n.p.): (n.p.).
Spencer, N.J. (1991). Child Poverty and Deprivation in the UK. Archives of Disease in Childhood.
Child Poverty Action Group, . (2021). What is Poverty?. Retrieved from <a href="https://cpag.org.uk/child-poverty/what-poverty" target="_blank">https://cpag.org.uk/child-poverty/what-poverty</a> [accessed 28 September 2021]
Child Poverty Action Group, . (2021). What is Poverty?. Retrieved from <a href="https://cpag.org.uk/child-poverty/what-poverty" target="_blank">https://cpag.org.uk/child-poverty/what-poverty</a> [accessed 28 September 2021]
Adamson, P. (2012). Measuring Child Poverty: New League Tables of Child Poverty in the World's Richest Countries. (n.p.): UNICEF Innocenti Research Centre.
Treanor, M.C. (2020). Child Poverty: Aspiring to Survive. (n.p.): Policy Press.
NHS Scotland. (2018). Child poverty in Scotland: Health Impact and Health Inequalities. (n.p.): (n.p.).
NHS Scotland. (2018). Child poverty in Scotland: Health Impact and Health Inequalities. (n.p.): (n.p.).
Nuffield Trust. (2021, July 29). Low Birth Weight. Retrieved from <a href="https://www.nuffieldtrust.org.uk/resource/low-birth-weight" target="_blank">https://www.nuffieldtrust.org.uk/resource/low-birth-weight</a> [accessed 18 October 2021]
Treanor, M.C. (2020). Child Poverty: Aspiring to Survive. (n.p.): Policy Press.
Treanor, M.C. (2020). Child Poverty: Aspiring to Survive. (n.p.): Policy Press.
Treanor, M.C. (2020). Child Poverty: Aspiring to Survive. (n.p.): Policy Press.
Scottish Government. (2018, March). Every Child, Every Chance: The Tackling Child Poverty Delivery Plan, 2018-22. Retrieved from <a href="https://www.gov.scot/binaries/content/documents/govscot/publications/strategy-plan/2018/03/child-chance-tackling-child-poverty-delivery-plan-2018-22/documents/00533606-pdf/00533606-pdf/govscot%3Adocument/00533606.pdf" target="_blank">https://www.gov.scot/binaries/content/documents/govscot/publications/strategy-plan/2018/03/child-chance-tackling-child-poverty-delivery-plan-2018-22/documents/00533606-pdf/00533606-pdf/govscot%3Adocument/00533606.pdf</a> [accessed 17 November 2021]
Treanor, M.C. (2020). Child Poverty: Aspiring to Survive. (n.p.): Policy Press.
Alcock, P. (2006). Understanding Poverty. (n.p.): Palgrave MacMillan.
Alcock, P. (2006). Understanding Poverty. (n.p.): Palgrave MacMillan.
Adamson, P. (2012). Measuring Child Poverty: New League Tables of Child Poverty in the World's Richest Countries. (n.p.): UNICEF Innocenti Research Centre.
Treanor, M.C. (2020). Child Poverty: Aspiring to Survive. (n.p.): Policy Press.
Butt, E. (2020). Know Economic Abuse 2020 Report. (n.p.): Refuge.
Sharp-Jeffs, N. (2015). Money Matters: Research into the Extent and Nature of Financial Abuse within Intimate Relationships in the UK. (n.p.): (n.p.).
Sharp-Jeffs, N. (2015). Money Matters: Research into the Extent and Nature of Financial Abuse within Intimate Relationships in the UK. (n.p.): (n.p.).
Mack, J. (2016, January 21). Income Threshold Approach. Retrieved from <a href="https://www.poverty.ac.uk/definitions-poverty/income-threshold-approach" target="_blank">https://www.poverty.ac.uk/definitions-poverty/income-threshold-approach</a> [accessed 23 November 2021]
Kämpke, T. (2014). The Use of Mean Values vs. Medians in Inequality Analysis. Retrieved from <a href="https://www.fawn-ulm.de/wp-content/uploads/2014/06/Median.pdf" target="_blank">https://www.fawn-ulm.de/wp-content/uploads/2014/06/Median.pdf</a> [accessed 23 November 2021]
Lansley, S., & Mack, J. (2011). Review: A New Understanding of Poverty. Retrieved from <a href="https://www.poverty.ac.uk/economic-policy-inequality-poverty-measurement/new-understanding-poverty" target="_blank">https://www.poverty.ac.uk/economic-policy-inequality-poverty-measurement/new-understanding-poverty</a> [accessed 29 September 2021]
Treanor, M.C. (2020). Child Poverty: Aspiring to Survive. (n.p.): Policy Press.
Stewart, K., & Roberts, N. (2019). Child Poverty Measurement in the UK: Assessing Support for the Downgrading of Income-Based Poverty Measures. Social Indicators Research, 142, 523-542.
Hills, J. (2004). Inequality and the State. (n.p.): Oxford.
Lansley, S., & Mack, J. (2011). Review: A New Understanding of Poverty. Retrieved from <a href="https://www.poverty.ac.uk/economic-policy-inequality-poverty-measurement/new-understanding-poverty" target="_blank">https://www.poverty.ac.uk/economic-policy-inequality-poverty-measurement/new-understanding-poverty</a> [accessed 29 September 2021]
Adamson, P. (2012). Measuring Child Poverty: New League Tables of Child Poverty in the World's Richest Countries. (n.p.): UNICEF Innocenti Research Centre.
McKinney, S.J., Hall, S., & Lowden, K. (2020). Poverty in Education Across the UK: A Comparative Analysis of Policy and Place. (n.p.): Policy Press.
Treanor, M.C. (2014). Deprived or not Deprived? Comparing the Measured Extent of Material Deprivation Using the UK Government's and the Poverty and Social Exclusion Surveys' Method of Calculating Material Deprivation. Quality and Quantity: International Journal of Methodology, 48, 1337-1346.
Cebula, C., Birt, C., Hay, D., & Evans, J. (2021). Poverty in Scotland 2021. (n.p.): Joseph Rowntree Foundation.
John, E. (2019, February 27). Life Costs More for Disabled Children and Their Families. Retrieved from <a href="https://www.scope.org.uk/news-and-stories/life-costs-more-for-disabled-children-and-their-families/" target="_blank">https://www.scope.org.uk/news-and-stories/life-costs-more-for-disabled-children-and-their-families/</a> [accessed 19 October 2021]
Food and Agriculture Organisation of the United Nations. (2021). Hunger and Food Insecurity. Retrieved from <a href="http://www.fao.org/hunger/en/" target="_blank">http://www.fao.org/hunger/en/</a> [accessed 1 October 2021]
Loopstra, R. (2019). Food Insecurity Measurement on the Family Resources Survey. Retrieved from <a href="https://enuf.org.uk/research-blogs/food-insecurity-measurement-family-resources-survey" target="_blank">https://enuf.org.uk/research-blogs/food-insecurity-measurement-family-resources-survey</a> [accessed 18 November 2021]
Fram, M.S., Frongillo, E.A., Jones, S.J., Williams, R.C., Burke, M.P., DeLoach, K.P., … Blake, C.E. (2011). Children are Aware of Food Insecurity and Take Responsibility for Managing Food Resources. The Journal of Nutrition, 141(6), 1114-1119.
Children and Young People's Commissioner Scotland. (2016). "Living is More Important Than Just Surviving": Listening to What Children Think About Food Insecurity. (n.p.): (n.p.).
Children and Young People's Commissioner Scotland. (2016). "Living is More Important Than Just Surviving": Listening to What Children Think About Food Insecurity. (n.p.): (n.p.).
Wakefield, J., & Bowe, M. (2018). Foodbank Use and Food Insecurity in the United Kingdom: Submission for the UN Special Rapporteur on Extreme Poverty and Human Rights. (n.p.): (n.p.).
Atterton, J. (2019). Rural Poverty: Under the Radar?. Retrieved from <a href="https://policyscotland.gla.ac.uk/rural-poverty-under-the-radar/" target="_blank">https://policyscotland.gla.ac.uk/rural-poverty-under-the-radar/</a> [accessed 10 October 2021]
Glass, J., Bynner, C., & Chapman, C. (2020). Children and Young People and Rural Poverty and Social Exclusion: A Review of Evidence. (n.p.): (n.p.).
Glass, J., Bynner, C., & Chapman, C. (2020). Children and Young People and Rural Poverty and Social Exclusion: A Review of Evidence. (n.p.): (n.p.).
Glass, J., Bynner, C., & Chapman, C. (2020). Children and Young People and Rural Poverty and Social Exclusion: A Review of Evidence. (n.p.): (n.p.).
Atterton, J. (2019). Rural Poverty: Under the Radar?. Retrieved from <a href="https://policyscotland.gla.ac.uk/rural-poverty-under-the-radar/" target="_blank">https://policyscotland.gla.ac.uk/rural-poverty-under-the-radar/</a> [accessed 10 October 2021]
Joseph Rowntree Foundation. (2007). Poverty, Wealth and Place in Britain, 1968-2005. (n.p.): (n.p.).
Gregg, P., Harkness, S., & Machin, S. (1999). Poor Kids: Trends in Child Poverty in Britain, 1968-96. Fiscal Studies, 20(2), 163-187.
Spencer, N.J. (1991). Child Poverty and Deprivation in the UK. Archives of Disease in Childhood, 66, 1255-1257.
Bailey, N. (2014). Lower Poverty in Scotland: Pinning Down the Change. (n.p.): University of Glasgow: Policy Scotland.
Townsend, P. (1979). Poverty in the United Kingdom. (n.p.): (n.p.).
Norris, G. (1977). Poverty in Scotland: An Analysis of Official Statistics. (n.p.): University of Glasgow.
Joseph Rowntree Foundation. (2007). Poverty, Wealth and Place in Britain, 1968-2005. (n.p.): (n.p.).
Joseph Rowntree Foundation. (2007). Poverty, Wealth and Place in Britain, 1968-2005. (n.p.): (n.p.).
Joseph Rowntree Foundation. (2007). Poverty, Wealth and Place in Britain, 1968-2005. (n.p.): (n.p.).
Joseph Rowntree Foundation. (2007). Poverty, Wealth and Place in Britain, 1968-2005. (n.p.): (n.p.).
Gazeley, I., Gutierrez Rufrancos, H., Newell, A., Reynolds, K., & Searle, R. (2017). The Poor and the Poorest, 50 Years on: Evidence from British Household Expenditure Surveys of the 1950s and 1960s. Journal of the Royal Statistical Society, 180(2), 455-474.
Abel-Smith, B., & Townsend, P. (1965). The Poor and the Poorest. (n.p.): (n.p.).
Abel-Smith, B., & Townsend, P. (1965). The Poor and the Poorest. (n.p.): (n.p.).
Thane, P., & Davidson, R. (2016). The Child Poverty Action Group, 1965 to 2015. (n.p.): (n.p.).
Thane, P., & Davidson, R. (2016). The Child Poverty Action Group, 1965 to 2015. (n.p.): (n.p.).
Thane, P., & Evans, T. (2012). Sinners? Scroungers? Saints?: Unmarried Motherhood in Twentieth-Century England. (n.p.): (n.p.).
Bailey, N. (2014). Lower Poverty in Scotland: Pinning Down the Change. (n.p.): University of Glasgow: Policy Scotland.
Pacione, M. (1988). The Urban Crisis: Poverty and Deprivation in the Scottish City. Scottish Geographical Magazine, 105(2), 101-115.
Fraser, N., & Sinfield, A. (1987). The Scottish Labour Force in Recession: Trends in Employment and Unemployment. Scottish Government Yearbook .
Crawford, F., Beck, S., & Hanlon, P. (2007). Will Glasgow Flourish? Learning from the Past, Analysing the Present and Planning for the Future. (n.p.): (n.p.).
Thane, P., & Evans, T. (2012). Sinners? Scroungers? Saints?: Unmarried Motherhood in Twentieth-Century England. (n.p.): (n.p.).
Wedge, P., & Prosser, H. (1973). Born to Fail?. (n.p.): The National Children's Bureau.
Wedge, P., & Prosser, H. (1973). Born to Fail?. (n.p.): The National Children's Bureau.
Wedge, P., & Prosser, H. (1973). Born to Fail?. (n.p.): The National Children's Bureau.
Young, R.G. (1999). From Multitple Deprivation to Social Exclusion: A Case Study in Organisational Learning and Political Amnesia. (n.p.): (n.p.).
Wedge, P., & Prosser, H. (1973). Born to Fail?. (n.p.): The National Children's Bureau.
Young, R.G. (1999). From Multitple Deprivation to Social Exclusion: A Case Study in Organisational Learning and Political Amnesia. (n.p.): (n.p.).
Young, R.G. (1999). From Multitple Deprivation to Social Exclusion: A Case Study in Organisational Learning and Political Amnesia. (n.p.): (n.p.).
Young, R.G. (1999). From Multitple Deprivation to Social Exclusion: A Case Study in Organisational Learning and Political Amnesia. (n.p.): (n.p.).
Dial to Know Your RIghts - Before it is Too Late. (1980). Wishaw Press.
Hendrick, H. (2003). Child Welfare: Historical Dimensions, Contemporary Debate. (n.p.): (n.p.).
Hendrick, H. (2003). Child Welfare: Historical Dimensions, Contemporary Debate. (n.p.): (n.p.).
BBC. (1982, January 26). UK Unemployment Tops Three Million. Retrieved from <a href="http://news.bbc.co.uk/onthisday/hi/dates/stories/january/26/newsid_2506000/2506335.stm" target="_blank">http://news.bbc.co.uk/onthisday/hi/dates/stories/january/26/newsid_2506000/2506335.stm</a> [accessed 18 October 2021]
Gregg, P., Harkness, S., & Machin, S. (1999). Poor Kids: Trends in Child Poverty in Britain, 1968-96. Fiscal Studies.
Gordon, D. (2017). Poverty and Social Exclusion in the UK: Vol 1: The Nature and Extent of the Problem, ed. Esther Dermott and Gill Main. (n.p.): (n.p.).
Hendrick, H. (2003). Child Welfare: Historical Dimensions, Contemporary Debate. (n.p.): (n.p.).
Hendrick, H. (2003). Child Welfare: Historical Dimensions, Contemporary Debate. (n.p.): (n.p.).
Thane, P., & Davidson, R. (2016). The Child Poverty Action Group, 1965 to 2015. (n.p.): (n.p.).
Hendrick, H. (2003). Child Welfare: Historical Dimensions, Contemporary Debate. (n.p.): (n.p.).
Thane, P., & Davidson, R. (2016). The Child Poverty Action Group, 1965 to 2015. (n.p.): (n.p.).
Hendrick, H. (2003). Child Welfare: Historical Dimensions, Contemporary Debate. (n.p.): (n.p.).
Thane, P., & Davidson, R. (2016). The Child Poverty Action Group, 1965 to 2015. (n.p.): (n.p.).
Spencer, N.J. (1991). Child Poverty and Deprivation in the UK. Archives of Disease in Childhood.
Spencer, N.J. (1991). Child Poverty and Deprivation in the UK. Archives of Disease in Childhood.
Bradshaw, J. (2001). Child Poverty under Labour. (n.p.): Child Poverty Action Group.
Hendrick, H. (2003). Child Welfare: Historical Dimensions, Contemporary Debate. (n.p.): (n.p.).
Hendrick, H. (2003). Child Welfare: Historical Dimensions, Contemporary Debate. (n.p.): (n.p.).
Thane, P., & Evans, T. (2012). Sinners? Scroungers? Saints?: Unmarried Motherhood in Twentieth-Century England. (n.p.): (n.p.).
Hendrick, H. (2003). Child Welfare: Historical Dimensions, Contemporary Debate. (n.p.): (n.p.).
Bradshaw, J. (2001). Child Poverty under Labour. (n.p.): Child Poverty Action Group.
Joyce, R., & Sibieta, L. (2013, June 6). Labour's Record on Poverty and Inequality. Retrieved from <a href="https://ifs.org.uk/publications/6738" target="_blank">https://ifs.org.uk/publications/6738</a> [accessed 18 October 2021]
DWP. (2019). Households Below Average Income: 1994/5 - 2017/18. (n.p.): (n.p.).
Gregg, P., Waldfogel, J., & Washbrook, E. (2005). That's the Way it Goes: Expenditure Patterns as Real Incomes Rise for the Poorest Families with Children. (n.p.): (n.p.).
Hirsch, D. (2012). Ending Child Poverty by 2020: Progress Made and Lessons Learned. (n.p.): CPAG.
Sinclair, S., & McKendrick, J.H. (2009). Child Poverty in Scotland: Taking the Next Steps. (n.p.): Joseph Rowntree Foundation.
Sinclair, S., & McKendrick, J.H. (2009). Child Poverty in Scotland: Taking the Next Steps. (n.p.): Joseph Rowntree Foundation.
Scottish Government. (2008). Achieving Our Potential: A Framework to Tackle Poverty and Income Inequality - Evidence Session. (n.p.): (n.p.).
Strelitz, J. (2008). Ending Severe Child Poverty. (n.p.): Joseph Rowntree Foundation.
Scottish Government. (2008). Achieving Our Potential: A Framework to Tackle Poverty and Income Inequality in Scotland. (n.p.): (n.p.).
Sinclair, S., & McKendrick, J.H. (2009). Child Poverty in Scotland: Taking the Next Steps. (n.p.): Joseph Rowntree Foundation.
Sinclair, S., & McKendrick, J.H. (2009). Child Poverty in Scotland: Taking the Next Steps. (n.p.): Joseph Rowntree Foundation.
Bailey, N. (2014). Lower Poverty in Scotland: Pinning Down the Change. (n.p.): University of Glasgow: Policy Scotland.
Brewer, M., Browne, J., Joyce, R., & Sibieta, L. (2010). Child Poverty in the UK since 1998-99: Lessons from the Past Decade. (n.p.): IFS.
Child Poverty Action Group. (2021). What Causes Child Poverty in Scotland?. Retrieved from <a href="https://cpag.org.uk/scotland/child-poverty/cause" target="_blank">https://cpag.org.uk/scotland/child-poverty/cause</a> [accessed 18 October 2021]
Sinclair, S., & McKendrick, J.H. (2009). Child Poverty in Scotland: Taking the Next Steps. (n.p.): Joseph Rowntree Foundation.
Treanor, M.C. (2020). Child Poverty: Aspiring to Survive. (n.p.): Policy Press.
Together. (2021, August 20). Together Joins Calls to Double Scottish Child Payment. Retrieved from <a href="https://www.togetherscotland.org.uk/news-and-events/news/2021/08/together-joins-calls-to-double-scottish-child-payment/" target="_blank">https://www.togetherscotland.org.uk/news-and-events/news/2021/08/together-joins-calls-to-double-scottish-child-payment/</a> [accessed 18 October 2021]
Scottish National Party. (2021). SNP Manifesto 2021. Retrieved from <a href="https://www.snp.org/2021-families-manifesto/" target="_blank">https://www.snp.org/2021-families-manifesto/</a> [accessed 19 October 2021]
Kidner, C., & Hudson, N. (2021, July 13). Scottish Child Payment. Retrieved from <a href="https://digitalpublications.parliament.scot/ResearchBriefings/Report/2021/7/13/c9019cbc-3242-4f2c-9d37-fa7cb34f1376" target="_blank">https://digitalpublications.parliament.scot/ResearchBriefings/Report/2021/7/13/c9019cbc-3242-4f2c-9d37-fa7cb34f1376</a> [accessed 19 October 2021]