Gender Pay Gap - 2021
This infographic looks at the gender pay gap in Scotland based on the latest data from the Annual Survey of Hours and Earnings from the Office for National Statistics.
What is the gender pay gap?
Men's and women's earnings are compared by looking at the difference between their earnings as a percentage of men's earnings. This is known as the gender pay gap. To calculate the pay gap, the Office for National Statistics (ONS) uses median hourly pay excluding overtime, as it controls for men being more likely to work overtime. Using hourly pay also means it does not matter whether the individual is working full-time or part-time.
More information on the gender pay gap can be found in the SPICe briefing The gender pay gap facts and figures 2018.
It is also worth noting that the 2020 and 2021 Annual Survey of Hours and Earnings have been affected by the pandemic. The Coronavirus Job Retention Scheme (CJRS) and lower response rates has meant more uncertainty around the data. This is looked at in more detail in the Earnings in Scotland - 2021 SPICe blog.
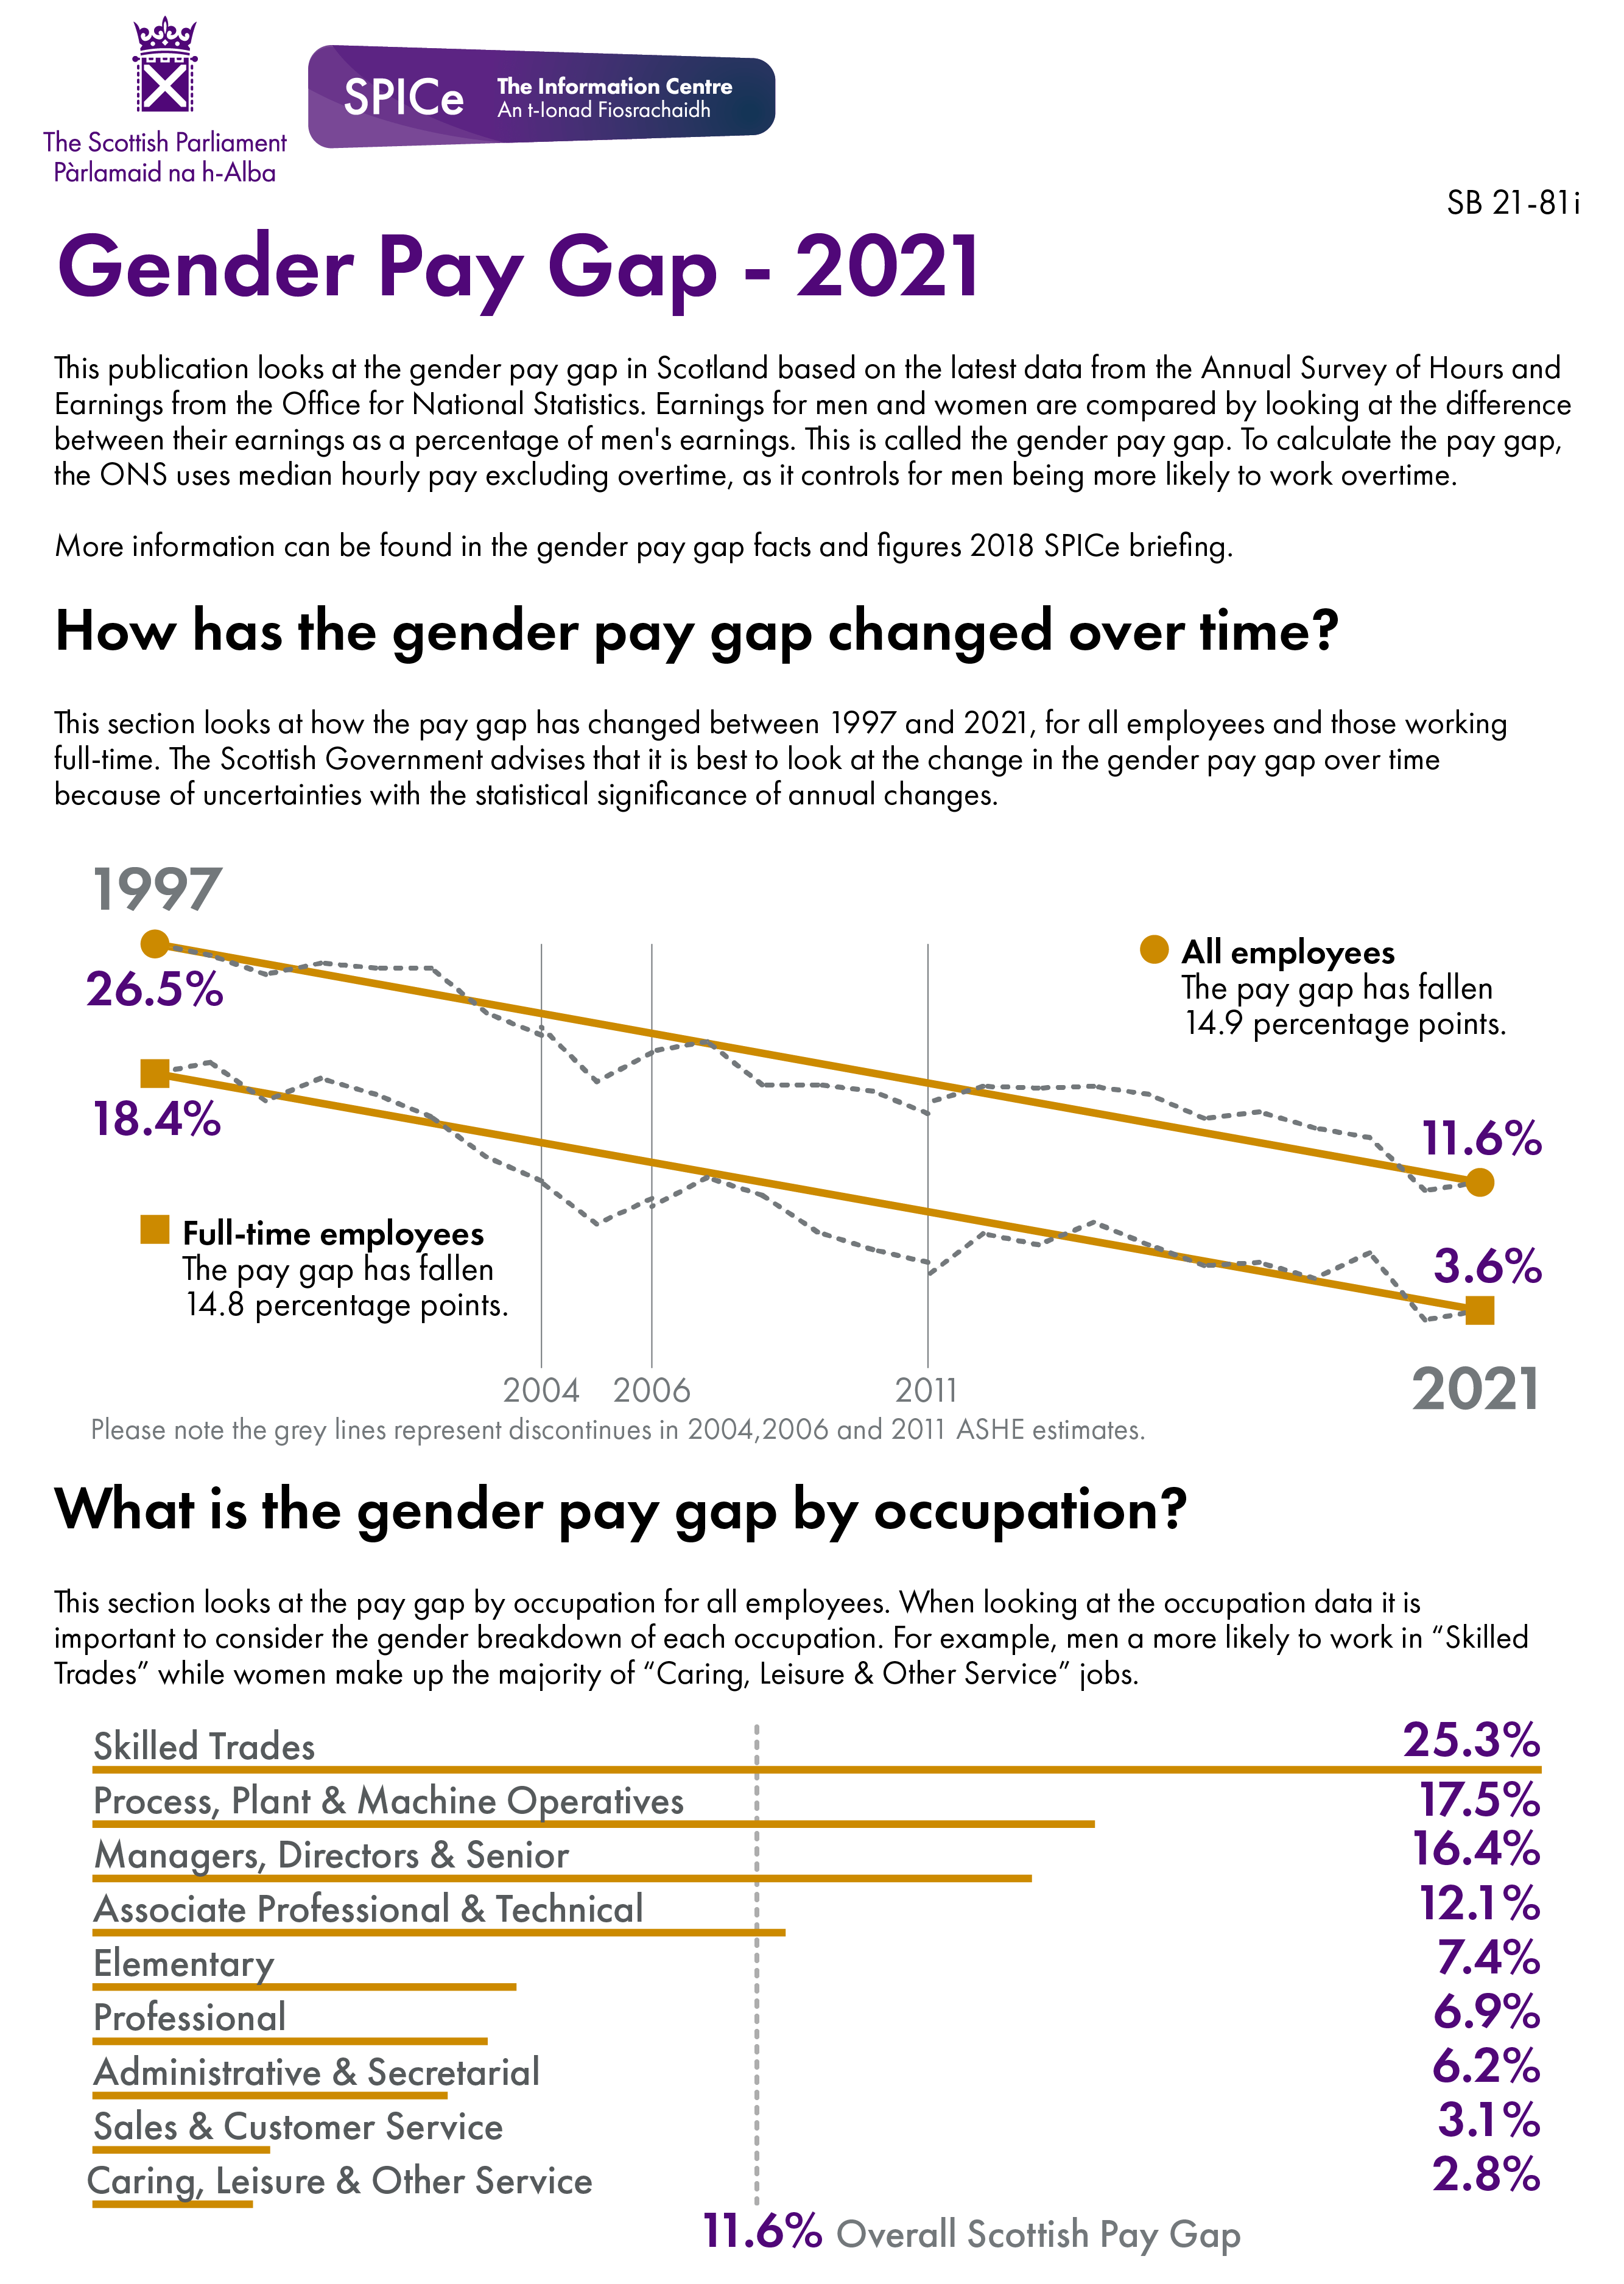
Source: Gender pay gap
Source: Gender pay gap
Data
| Year | All employees | Full-time employees |
|---|---|---|
| 1997 | 26.5 | 18.4 |
| 1998 | 25.8 | 19.1 |
| 1999 | 24.6 | 16.7 |
| 2000 | 25.3 | 18.1 |
| 2001 | 25.0 | 17.1 |
| 2002 | 25.0 | 15.7 |
| 2003 | 22.2 | 13.2 |
| 2004 | 20.8 / 21.3 | 11.7 / 11.6 |
| 2005 | 17.9 | 9.0 |
| 2006 | 19.7 / 19.8 | 10.6 / 10.1 |
| 2007 | 20.4 | 11.9 |
| 2008 | 17.7 | 10.8 |
| 2009 | 17.7 | 8.5 |
| 2010 | 17.3 | 7.4 |
| 2011 | 15.9 / 16.6 | 6.6 / 5.8 |
| 2012 | 17.6 | 8.4 |
| 2013 | 17.5 | 7.7 |
| 2014 | 17.6 | 9.1 |
| 2015 | 17.1 | 7.7 |
| 2016 | 15.6 | 6.4 |
| 2017 | 16.0 | 6.6 |
| 2018 | 15.0 | 5.6 |
| 2019 | 14.4 | 7.2 |
| 2020 | 11.1 | 3.0 |
| 2021 | 11.6 | 3.6 |
Source: Gender pay gap
Please note there are discontinuities in 2004, 2006 and 2011 ASHE estimates due to changes in the way the data was captured.
| Occupation | Pay gap |
|---|---|
| Skilled Trades | 25.3 |
| Process, Plant & Machine Operatives | 17.5 |
| Managers, Directors & Senior | 16.4 |
| Associate Professional & Technical | 12.1 |
| Elementary | 7.4 |
| Professional | 6.9 |
| Administrative & Secretarial | 6.2 |
| Sales & Customer Service | 3.1 |
| Caring, Leisure & Other Service | 2.8 |
Source: Gender pay gap
| Industry | Pay gap |
|---|---|
| Financial & Insurance | 27.9 |
| Other Service Activities | 25.9 |
| Real Estate | 23.3 |
| Professional, Scientific & Technical | 20.6 |
| Utilities | 18.9 |
| Health & Social Work | 18.8 |
| Education | 17.4 |
| Manufacturing | 16.4 |
| Agriculture, Forestry & Fishing | 15.3 |
| Information & Communication | 13.6 |
| Electricity, Gas, Steam & Air Conditioning Supply | 12.9 |
| Public Administration | 9.7 |
| Administrative & Support | 9.4 |
| Wholesale & Retail Trade | 8.8 |
| Transportation & Storage | 4.5 |
| Arts, Entertainment & Recreation | 4.2 |
| Accommodation & Food | 2.1 |
| Construction | 1.9 |
Source: Gender pay gap
| Age group | Pay gap |
|---|---|
| 18-21 | -2.4 |
| 22-29 | -2.6 |
| 30-39 | 5.2 |
| 40-49 | 16.9 |
| 50-59 | 20.7 |
| 60+ | 13.9 |
Source: Gender pay gap