Local Government Finance: Budget 2020-21 and provisional allocations to local authorities
This briefing focuses on both the overall local government budget for 2020-21, and the provisional allocations to local authorities. Another briefing has been published by SPICe, covering the overall Budget 2020-21.
Executive summary
This briefing sets out a summary and analysis of the local government budget for 2020-21, and the provisional allocations to local authorities.
In recent years, the amount of money going to local government has dominated the parliamentary debate on the spending side of the budget. This year's settlement is more generous than in recent years. However, as ever with the local government budget there are a wide range of interpretations that can be produced, depending on what is included in the calculation.
First, using the numbers in the Budget document:
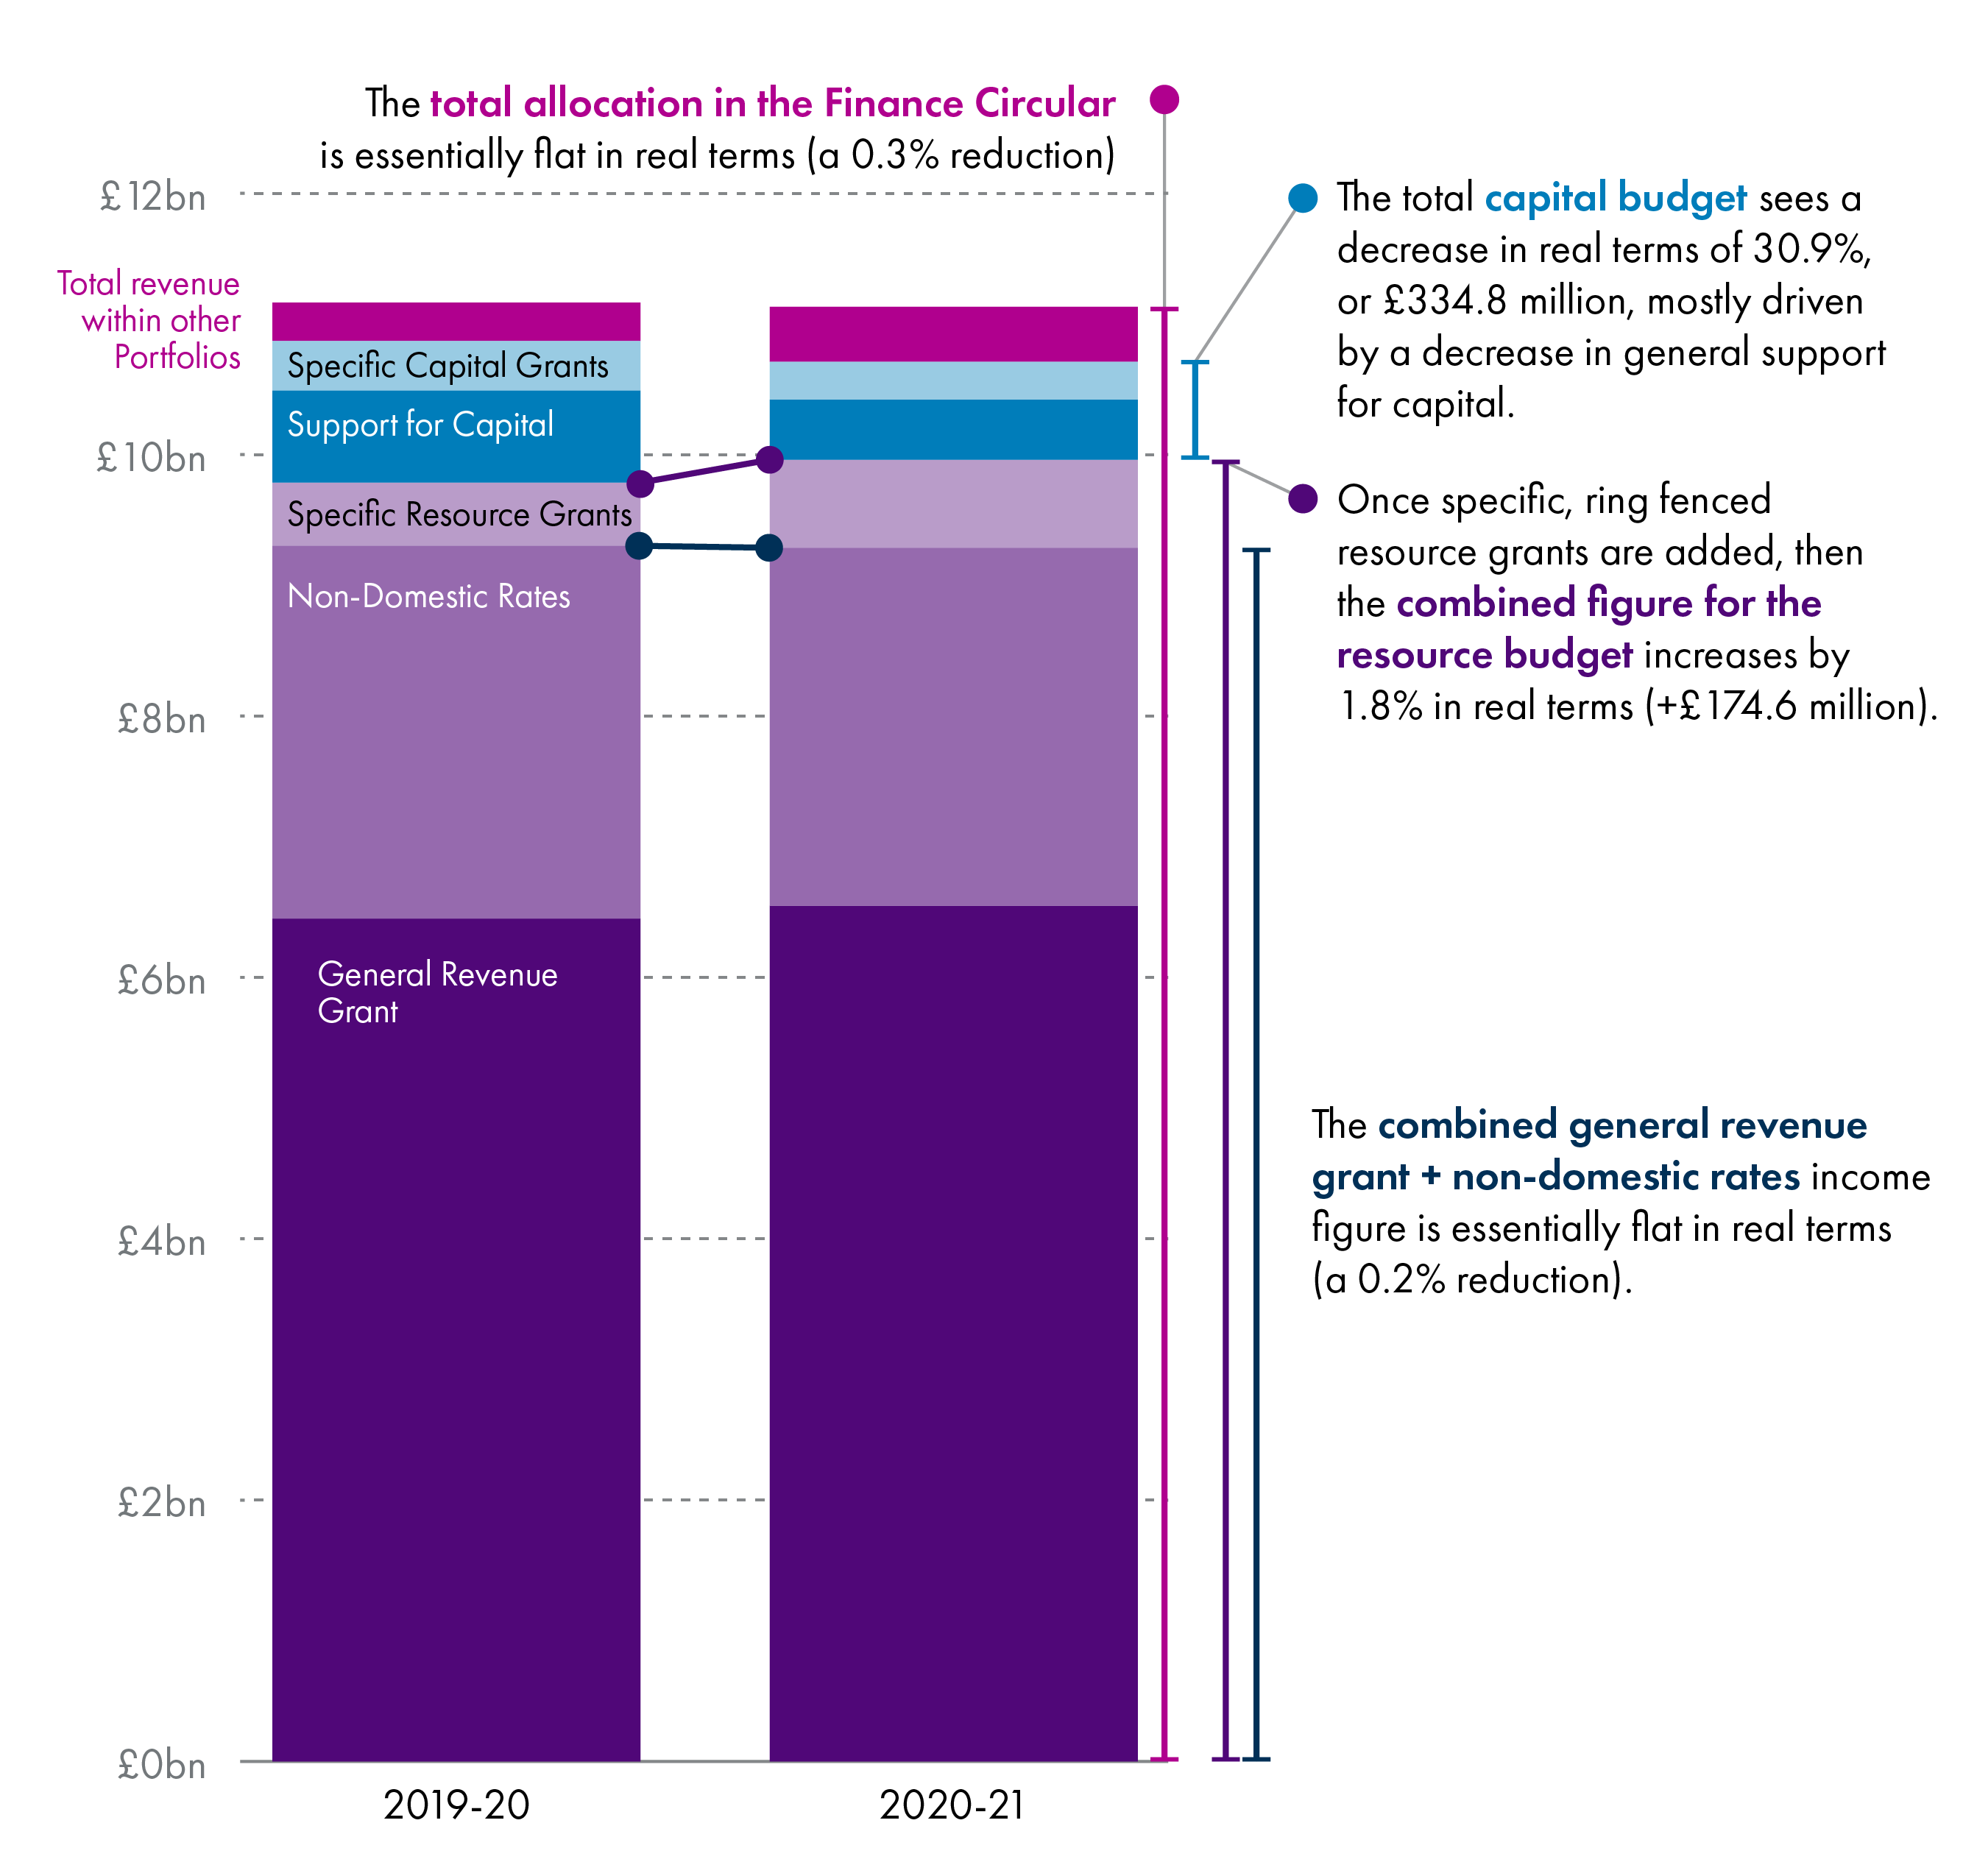
The combined general revenue grant + non-domestic rates income figure (i.e. the amount of money to deliver services over which local authorities have control) falls slightly in real terms in 2020-21, by 0.2%, or by £15.0 million.
Once specific, ring-fenced resource grants are included, then the combined figure for the resource budget increases by 1.8% in real terms, or by £174.6 million.
The total capital budget sees a decrease in real terms this year, of 30.9%, or £334.8 million, mostly driven by a decrease in general (as opposed to specific) support for capital.
Note: these headline numbers are slightly different from those presented in the SPICe Briefing on the Scottish Budget 2020-21, due to a minor issue with real terms calculations.
In her statement, the Minister for Public Finance and Digital Economy stated that the budget provided “a real terms increase in local government revenue support.” This was based on comparing the March 2019 local government finance circular figure for “total revenue” to the same figure in the circular published on 6 February 2020, and results in a 3.0% real terms increase, or an increase of £303.2 million.
However, while acknowledging that there was a “cash increase of £495 million” (this is the cash terms equivalent of the Minister's £303.2 million figure), in its initial budget response, COSLA stated that “the reality behind this figure unfortunately is quite different” and that in their view there was “a cut to Local Government core budgets of £95 million.”
This, COSLA says, is because alongside the £495 million cash terms increase, there is also £590 million worth of Scottish Government commitments.
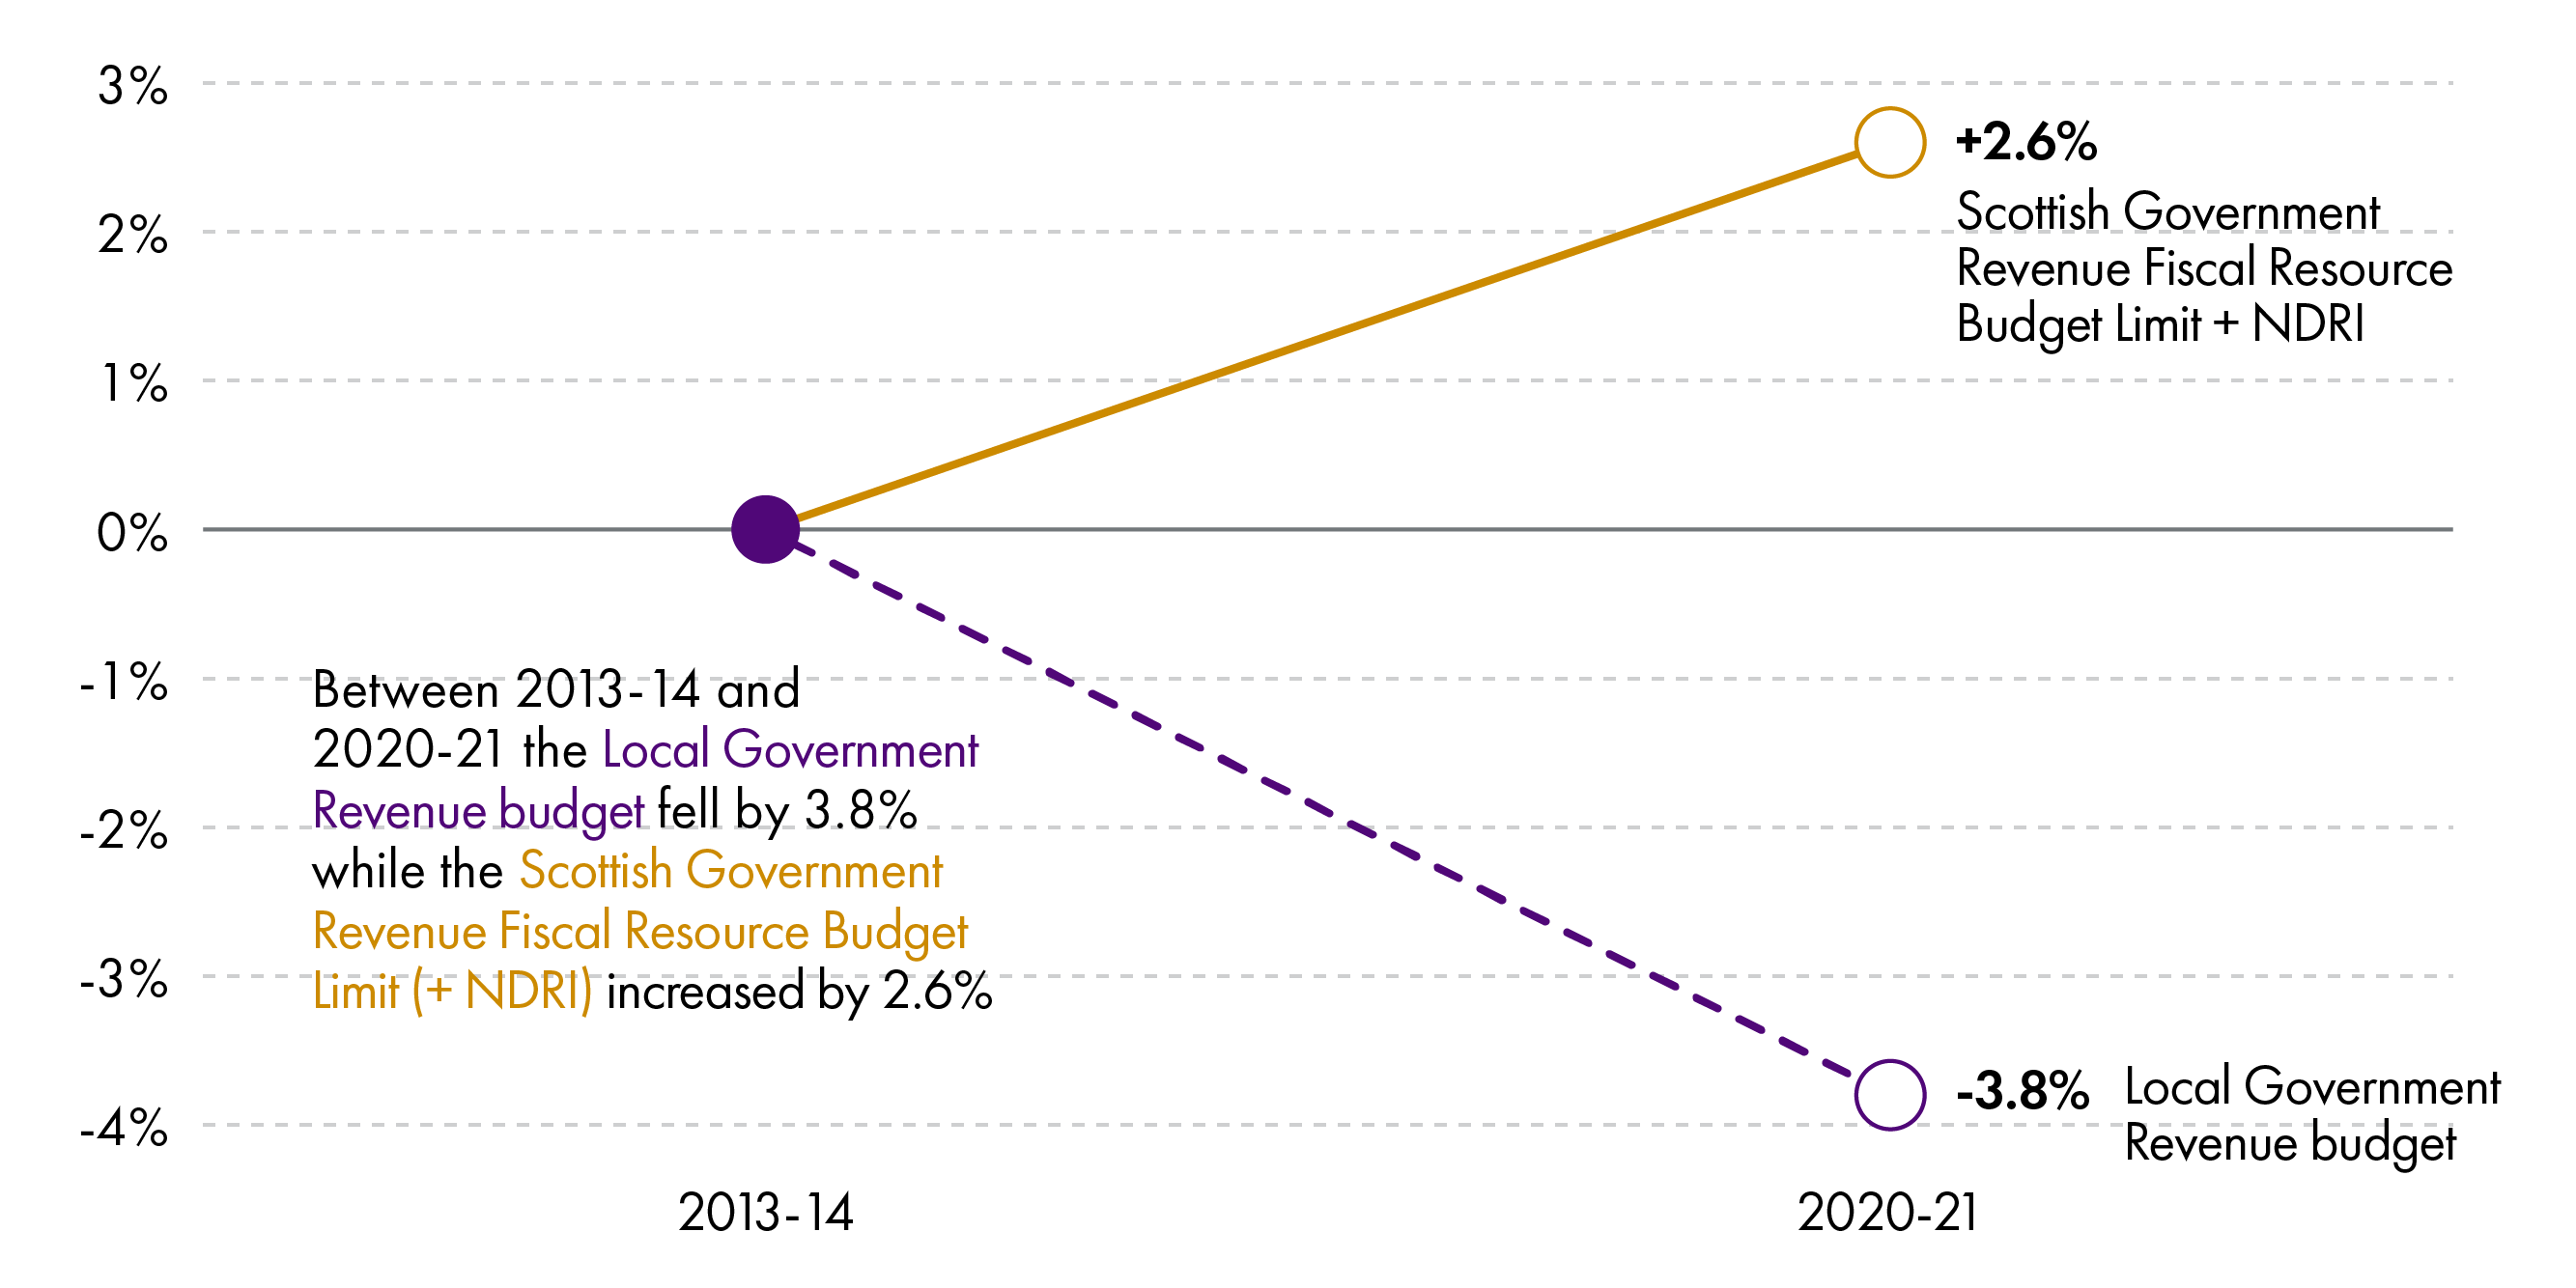
Looking at the historic allocations to local government, compared to the Scottish Government's allocation from the UK Government, from 2013-14 to 2020-21, local government total revenue reduced by 3.8% in real terms (or -£404.8 million). The Scottish Government's fiscal resource budget limit from HM Treasury, plus NDRI, increased in real terms over the same period, by 2.6% (or £795.2 million).
On Council Tax, the Budget sets out that the Government and COSLA have agreed that increases will be capped at 3% in real terms - i.e. inflation plus 3%. This means that the maximum increase in Council Tax for 2020-21 will be 4.84%. In 2019-20, 12 councils increased Council Tax by the maximum.
Allocations in the circular are provisional and subject to consultation, therefore local authorities should not set their final budgets on the basis of these figures. Previous Finance Circulars set out a deadline for local authorities to agree to the offer and associated terms. However, this year's circular is phrased slightly differently, and only asks local authorities to inform COSLA of any "discrepancies or changes required" by 14 February 2020, and does not appear to offer the opportunity for local authorities not to agree to the offer.
It is worth noting that government grant is only one element of individual local authority budgets. Therefore when "savings" figures are calculated by local authorities, they generally take their combined revenue grant from the Scottish Government, plus their assumed Council Tax income on one side, and then assumptions of demand for services on the other side. So, although in the Briefing shows that all local authorities receive a real terms increase in their total revenue allocations from the Scottish Government, that does not mean that authorities will not need to make hard choices about service delivery in their areas.
Understanding the local government budget
Funding for local authorities in Scotland is drawn from a number of sources, but by far the greatest portion of funding comes from the settlement from the Scottish Government.
As discussed in other budget blogs and briefings, the delay to the UK Government's Budget timings as a result of the December 2019 election has complicated matters for the 2020-21 Budget. Under the terms agreed by the Scottish Parliament and Government, in a normal year the Scottish budget process begins when the Scottish Budget is published around three weeks after the UK Government publishes its budget. Originally set for 6 November last year, as a result of the election the UK Budget will not be announced until 11 March 2020, which throws up a number of difficulties, as detailed in a SPICe Blog on the revised timetable.
This creates additional challenges where the local government funding settlement is concerned. The Scottish Government needs to provide certainty about funding to Scottish public bodies for the next financial year. In the case of local government, under the Local Government Finance Act 1992, there is a requirement on local authorities to set their council tax for the next year before 11 March.
Presenting the figures
As covered in previous SPICe briefings on the Scottish Government Budget and local government finance settlement, the presentation of figures in the Budget and associated documents has changed over time. Again, SPICe welcomes the presentational changes that have made to increase transparency of this complicated and contested area of the Budget.
Presentation of the headline figures for local government can be complicated by:
Which number is used for presenting the Scottish Government's direct grants to local authorities. For instance, taking any of the approaches below could result in a very different presentation:
the "Total Local Government" line (which includes capital, and specific, ring-fenced grants)
the sum of "General Resource Grant + Non-Domestic Rates Income"
or the "Total Revenue" line from the Finance Circular.
Whether figures are presented in cash or real terms.
Whether figures for "Total Estimated Expenditure" are used, which also include income raised from Council Tax.
Whether "Revenue funding within other Portfolios" is included, such as funding for Health and Social Care.
And finally, which financial year is used as the base year in calculations.
Taken together, different combinations of these issues can lead to huge variations in the headline £ million and percentage change figures that are presented.
The local government funding formula
The Scottish Government estimates how much local government needs to fund the services it provides. It then applies a needs-based formula to allocate the total available funding. Once these initial allocations are calculated, the Scottish Government adjusts these initial figures using the Main Funding Floor, to ensure that no council is disproportionately disadvantaged in its year-on-year funding allocations. This provides those local authorities with reducing need an opportunity to reduce their spending to match their reducing funding. From this total, Council Tax income, Distributable Non-Domestic Rates income, and specific revenue grants are deducted to obtain the General Resource Grant (GRG), which together with the Distributable Non-Domestic Rates income makes up the guaranteed non-ring-fenced funding the Scottish Government provides to local government. A further funding floor is applied to ensure that no local authority receives less than 85% of the Scottish average of per head Revenue funding, and finally, a figure for Distributable revenue funding is reached.
The Scottish Government agrees with COSLA the Total Revenue funding that will be made available for the duration of the Spending Review. However, in recent years, the Draft Budget has been presented as a single-year budget. This is the same for the 2020-21 Budget.
The funding formula for local government is set out in full in the 'Green Book' for Grant Aided Expenditure, and the local government funding formula, as well as how the Scottish Government takes into account income from Council Tax and Non-Domestic Rates, is discussed in detail in the SPICe briefing Local Government Finance: The funding formula and local taxation income1.
Budget 2020-21 - Local government funding
Local government total allocations
The total allocation to local government in the 2020-21 Budget 1 is £10,907.0 million. This is mostly made up of General Revenue Grant (GRG) and Non-Domestic Rates Income (NDRI), with smaller amounts for General Capital Grant and Specific (or ring-fenced) Resource and Capital grants.
Once Revenue funding within other portfolios (but still within the totals in the Finance Circular) is included, the total is £11,335.7 million. Further, once a number of funding streams attached to particular portfolio policy initiatives, but outside the totals in the Circular are included, the total rises to £11,916.0 million. Figure 1 below illustrates these different funding streams.
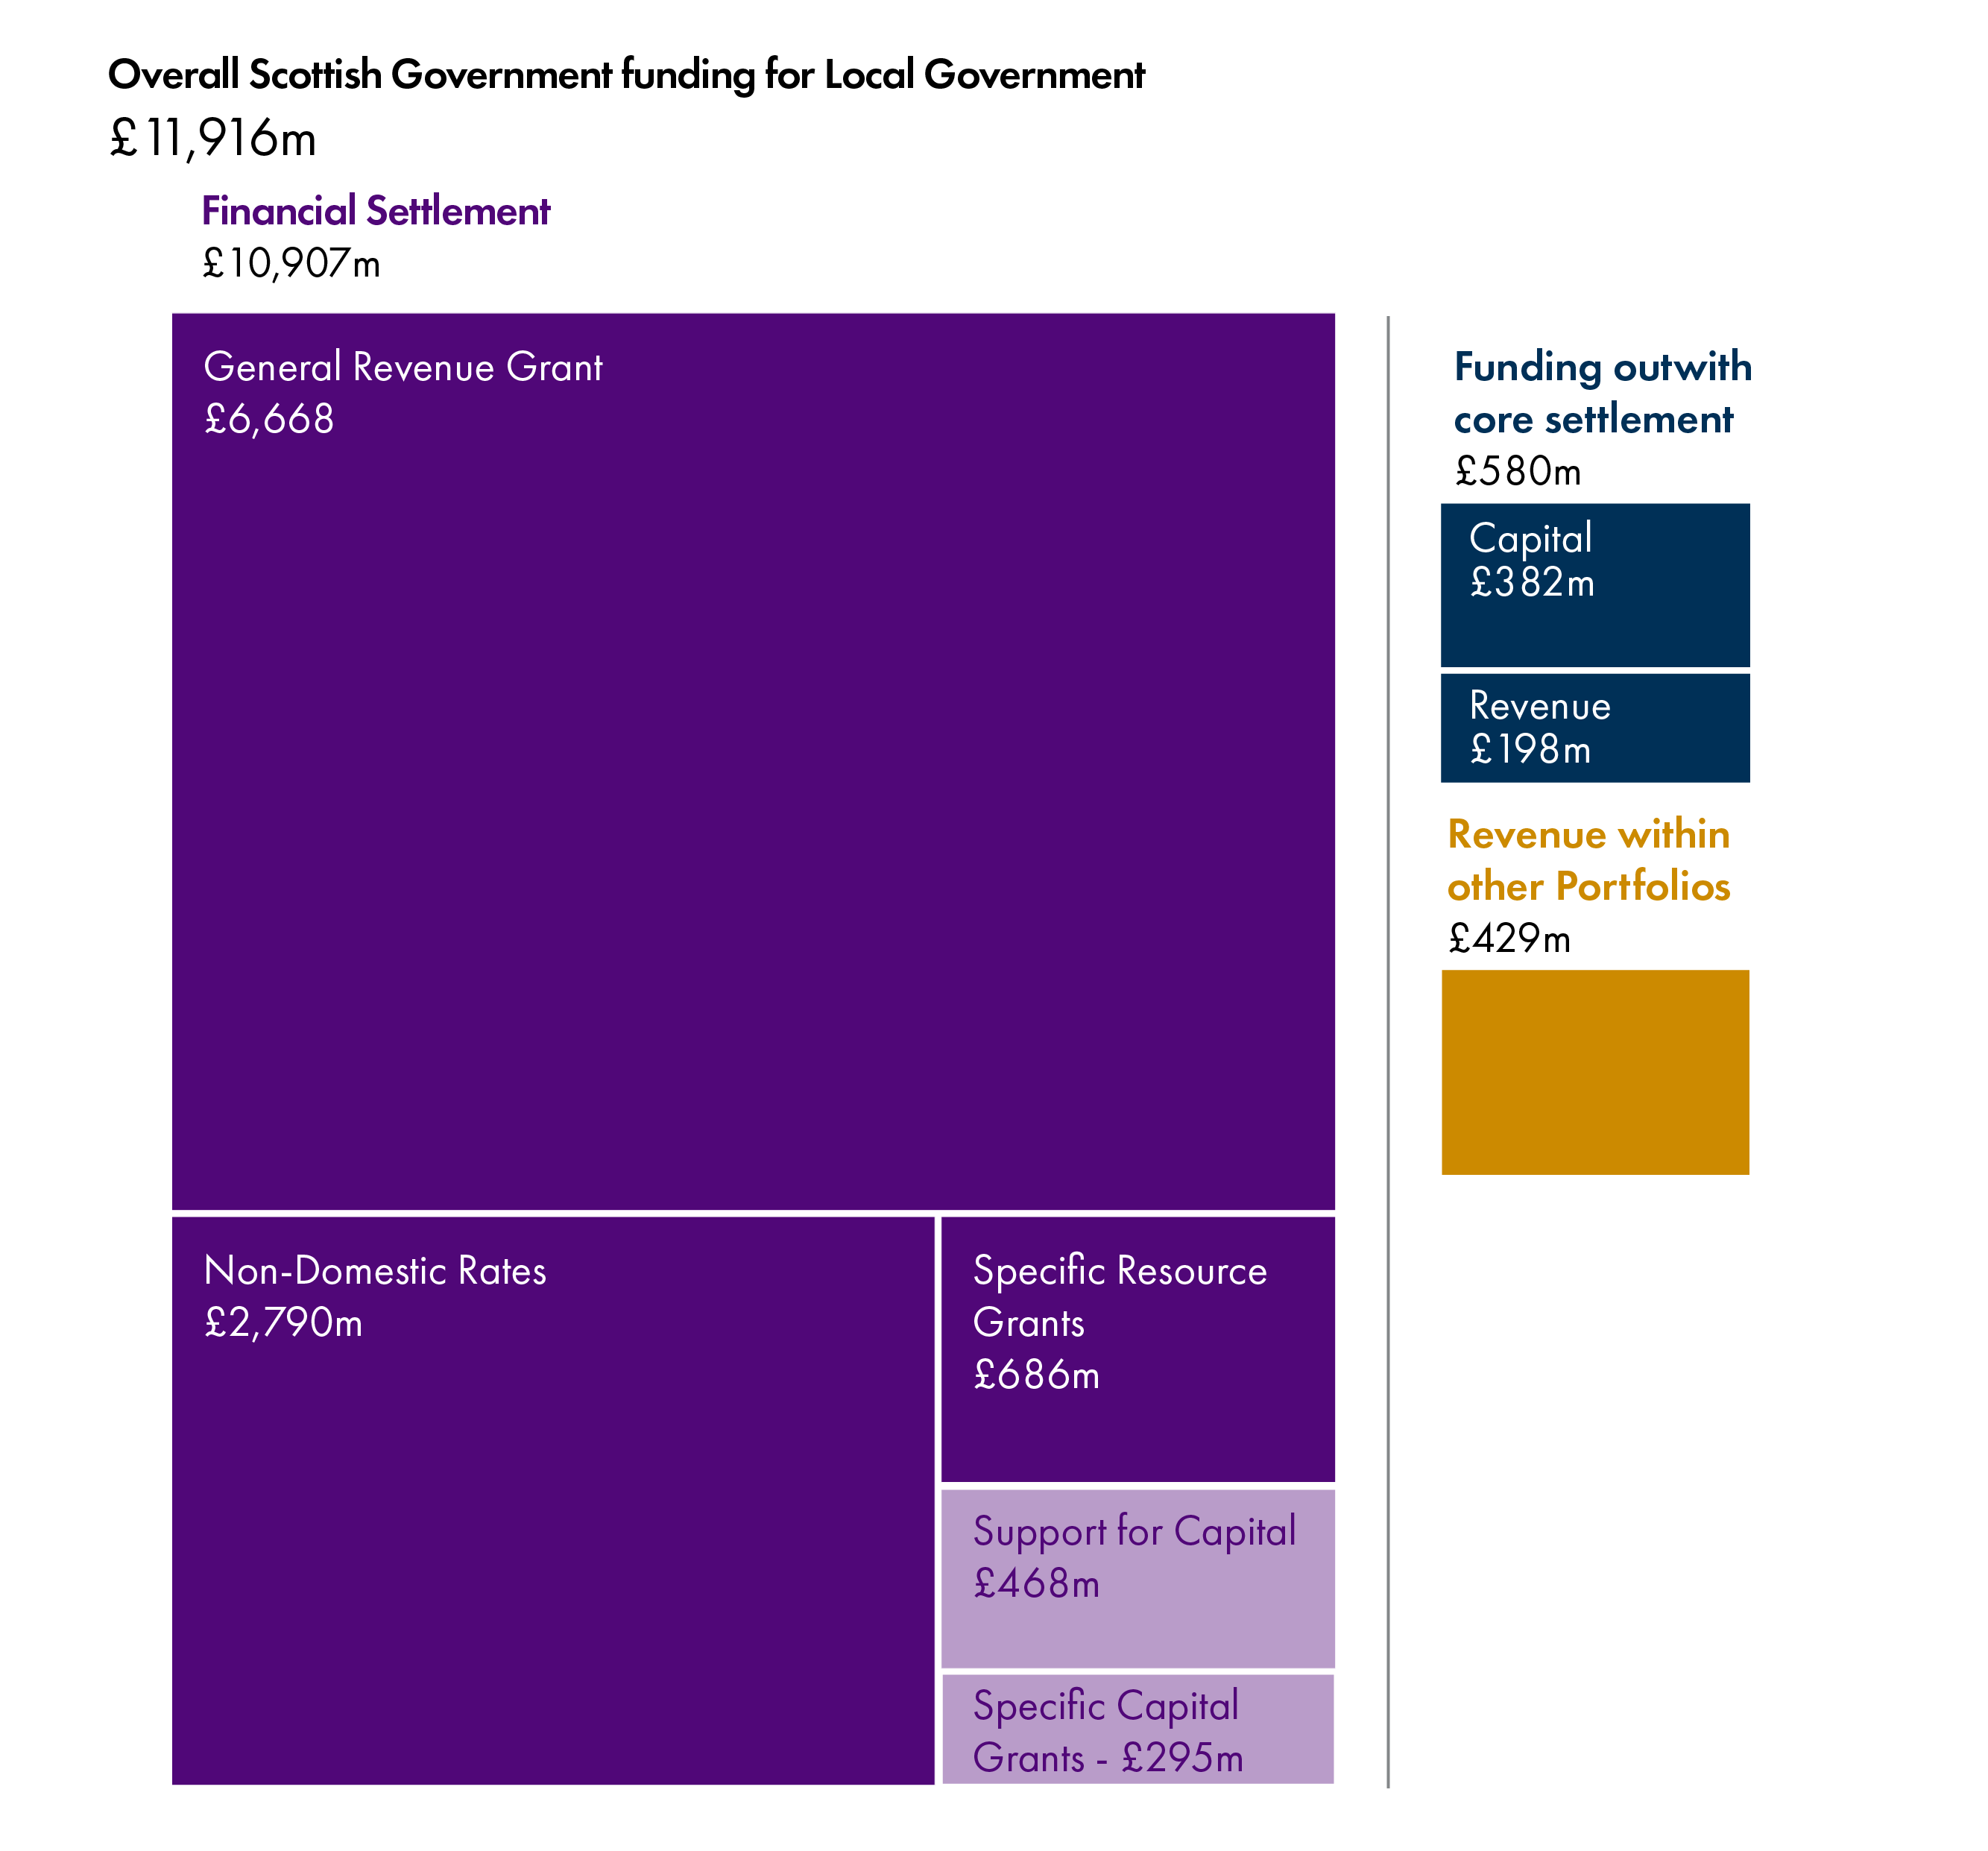
Data: Annex Table 1
Of course, aside from government grant, Non-Domestic Rates Income, and income from Council Tax, local authorities also receive a range of other income, mainly from sales, and fees and charges for services. However, while this is an important part of the bigger picture of local authority finance, this other income does not play a part in the annual budget process. In addition, amounts are generally not known until outturn data is available, often around a year after the end of the fiscal year in question.
Central and local government, and different political parties, will have different preferences for what to include when discussing funding for local government. In this briefing, as before, SPICe has set out how different figures are arrived at, to allow for the greatest transparency in parliamentary scrutiny.
Our approach
In the total allocations section, we set out the different totals for local government. However, in the remainder of this section of the briefing, which focuses on the year on year change figures, we concentrate on the numbers within the central local government budget - that is, the breakdown of the £10,907.0 million million figure in Table 6.11 of the Budget, and the headline numbers in the Local Government Finance Circular.
The Scottish Government guarantees the combined GRG and distributable NDRI figure, approved by Parliament, to each local authority. If NDRI is lower than forecast, this is compensated for by an increase in GRG and vice versa. Therefore, to calculate Local Government's Revenue settlement, the combined GRG + NDRI figure is used. Further detail on NDRI within the Budget 2020-21 can be found in the main SPICe briefing on the Budget 2020-21.1
This briefing, reflecting recent changes to the Budget process and in line with the Scottish Government's presentation, compares Budget 2020-21 figures to those 2019-20 figures presented in the Budget document. Individual allocations to local authorities are compared to the local government finance circular published in March 2019, which accompanied the Local Government Finance Order. Figures are given in both cash and real (2019-20), £million and percentage, terms.
In this briefing we sometimes refer to the "core" revenue settlement. We use this as shorthand to refer to the discretionary element of the local government revenue settlement - i.e. the amount of money to deliver services over which local authorities have control. There is no agreed definition of what constitutes the "core" - COSLA in "Fair Funding for Essential Services 2019-20" goes into detail on its view of the core budget, and makes a clear distinction between "core" and "initiative" funding. However, the Scottish Government's view is that core revenue funding should include specific, ring-fenced grants, in addition to GRG and NDRI as this also provides funding to support delivery of core services such as education.
Change in the local government budget from 2019-20
Headline figures
Revenue, or resource, funding, is used by local authorities to deliver services. While local authorities appear to have discretion over much of this side of the budget, some areas of the budget are “ring-fenced” for a specific purpose. As well as these specific, ring-fenced areas, there is also a debate about how much of the “discretionary” budget is actually fully under the control of local government, and how much is allocated to Scottish Government priorities. This is discussed in more detail below, in the section on COSLA’s response.
The Scottish Government guarantees the combined GRG and distributable NDRI figure, approved by Parliament, to each local authority. If NDRI is lower than forecast, this is compensated for by an increase in GRG and vice versa.
This combined GRG+NDRI (i.e. the amount of money to deliver services over which local authorities have control) falls slightly in real terms in 2020-21, by 0.2%, or by £15.0 million.
Once specific, ring-fenced resource grants are included, then the combined figure for the resource budget increases by 1.8% in real terms, or by £174.6 million.
Note: these headline numbers are slightly different from those presented in the SPICe Briefing on the Scottish Budget 2020-21, due to a minor issue with real terms calculations.
Figure 2 shows how the different elements of the local government budget have changed in real terms from 2019-20 to 2020-21.
Data: Annex Table 1
In her statement, the Minister for Public Finance and Digital Economy stated that the budget provided “a real terms increase in Local Government revenue support.” This was based on comparing the March 2019 local government finance circular figure for “total revenue” to the same figure in the circular published on 6 February 2020, and results in a 3% real terms increase, or an increase of £303.2 million.
Alongside the revenue budget, used to pay for public services, local government also receives a capital budget, again made up of general (i.e. discretionary) and specific (i.e. ring-fenced) grants. Overall, the total capital budget sees a decrease in real terms this year, of 30.9%, or £334.8 million, mostly driven by a decrease in general (as opposed to specific) support for capital.
However, the nature of the capital budget is that it is subject to large changes from year to year as projects and programmes of capital investment start and finish. The Government states that much of this reduction is due to one-off sums for capital in the 2019-20 budget. It is worth noting though that the 2020-21 total capital budget is still substantially lower than the 2018-19 capital budget.
COSLA's response
While acknowledging that there was a “cash increase of £495 million” (this is the cash terms equivalent of the Minister's £303.2 million figure), in its initial budget response , COSLA stated that “the reality behind this figure unfortunately is quite different” and that in their view there was “a cut to Local Government core budgets of £95 million.” This, COSLA says, is because alongside the £495 million cash terms increase, there is also £590 million worth of Scottish Government commitments. On capital, again using Scottish Government commitments, COSLA states that in their view the reality is a £117 million cash terms cut in the core capital budget.
In terms of ring-fencing and “protection” of the budget, before the 2020-21 Budget was published, COSLA indicated that in its view, 61% of the 2019-20 Budget was in some way subject to “ring fencing, national policy initiatives and protections in education, health and social care.”1
COSLA, in its capital analysis, indicates that even stripping out these one-off sums leads to a £117 million cash cut, as noted above.
Table 1 below sets out what COSLA sees as making up the additional £590 million of new commitments on the revenue side.
| Scottish Government commitment | £m |
|---|---|
| Early Learning and Childcare | 201 |
| Teachers’ pay and pensions | 253 |
| Additional support for Learning | 15 |
| Living Wage | 25 |
| Free Personal care uplift | 2 |
| Carers Act | 12 |
| School Counselling | 4 |
| Integrated Authority ring-fenced funding | 57 |
| Other | 21 |
| Total Scottish Government commitments | 590 |
On core responsibilities, I think that you would be hard pressed to find local authorities that would say that providing education and early learning and childcare are not their core responsibilities. My point is that we are supporting local authorities to deliver their responsibilities. When there is something that we want to deliver in partnership with them, we recognise it. Early learning and childcare is a great example of a policy that was developed in close partnership with local authorities. They identified their revenue needs, and we have funded those needs.
Historic changes
The briefing, Local government finance: facts and figures 2013-14 to 2019-201 looked at real terms change over time, comparing the local government settlement to the Scottish Government budget. Figures 3 and 4 below show the change in the local government revenue budget compared to the best comparable figures for the Scottish Government's revenue budget.
We use 2013-14 as the base year for these calculations as that was the year that responsibility for police and fire services (and the associated funding) was transferred to the new central organisations. Doing completely accurate comparisons prior to 2013-14 is impossible, as estimates and assumptions have to be made to account for the police and fire issue. However, going from 2013-14 onwards removes this uncertainty.
Data: Annex Table 2
Figure 4 below shows the change from year to year, between 2013-14 and 2020-21
Data: Annex Table 2
Local Government figures are based on "Total Revenue" figures from Annex A of the relevant Local Government Finance Circulars, published each year after the Local Government Finance Order is agreed by the Parliament, and include ring-fenced grants and NDRI. Scottish Government figures are based on the Scottish Government's Fiscal Resource Budget Limit from HM Treasury, plus NDRI. NDRI is included in the Government side for comparability purposes, as it is also included on the local government side.
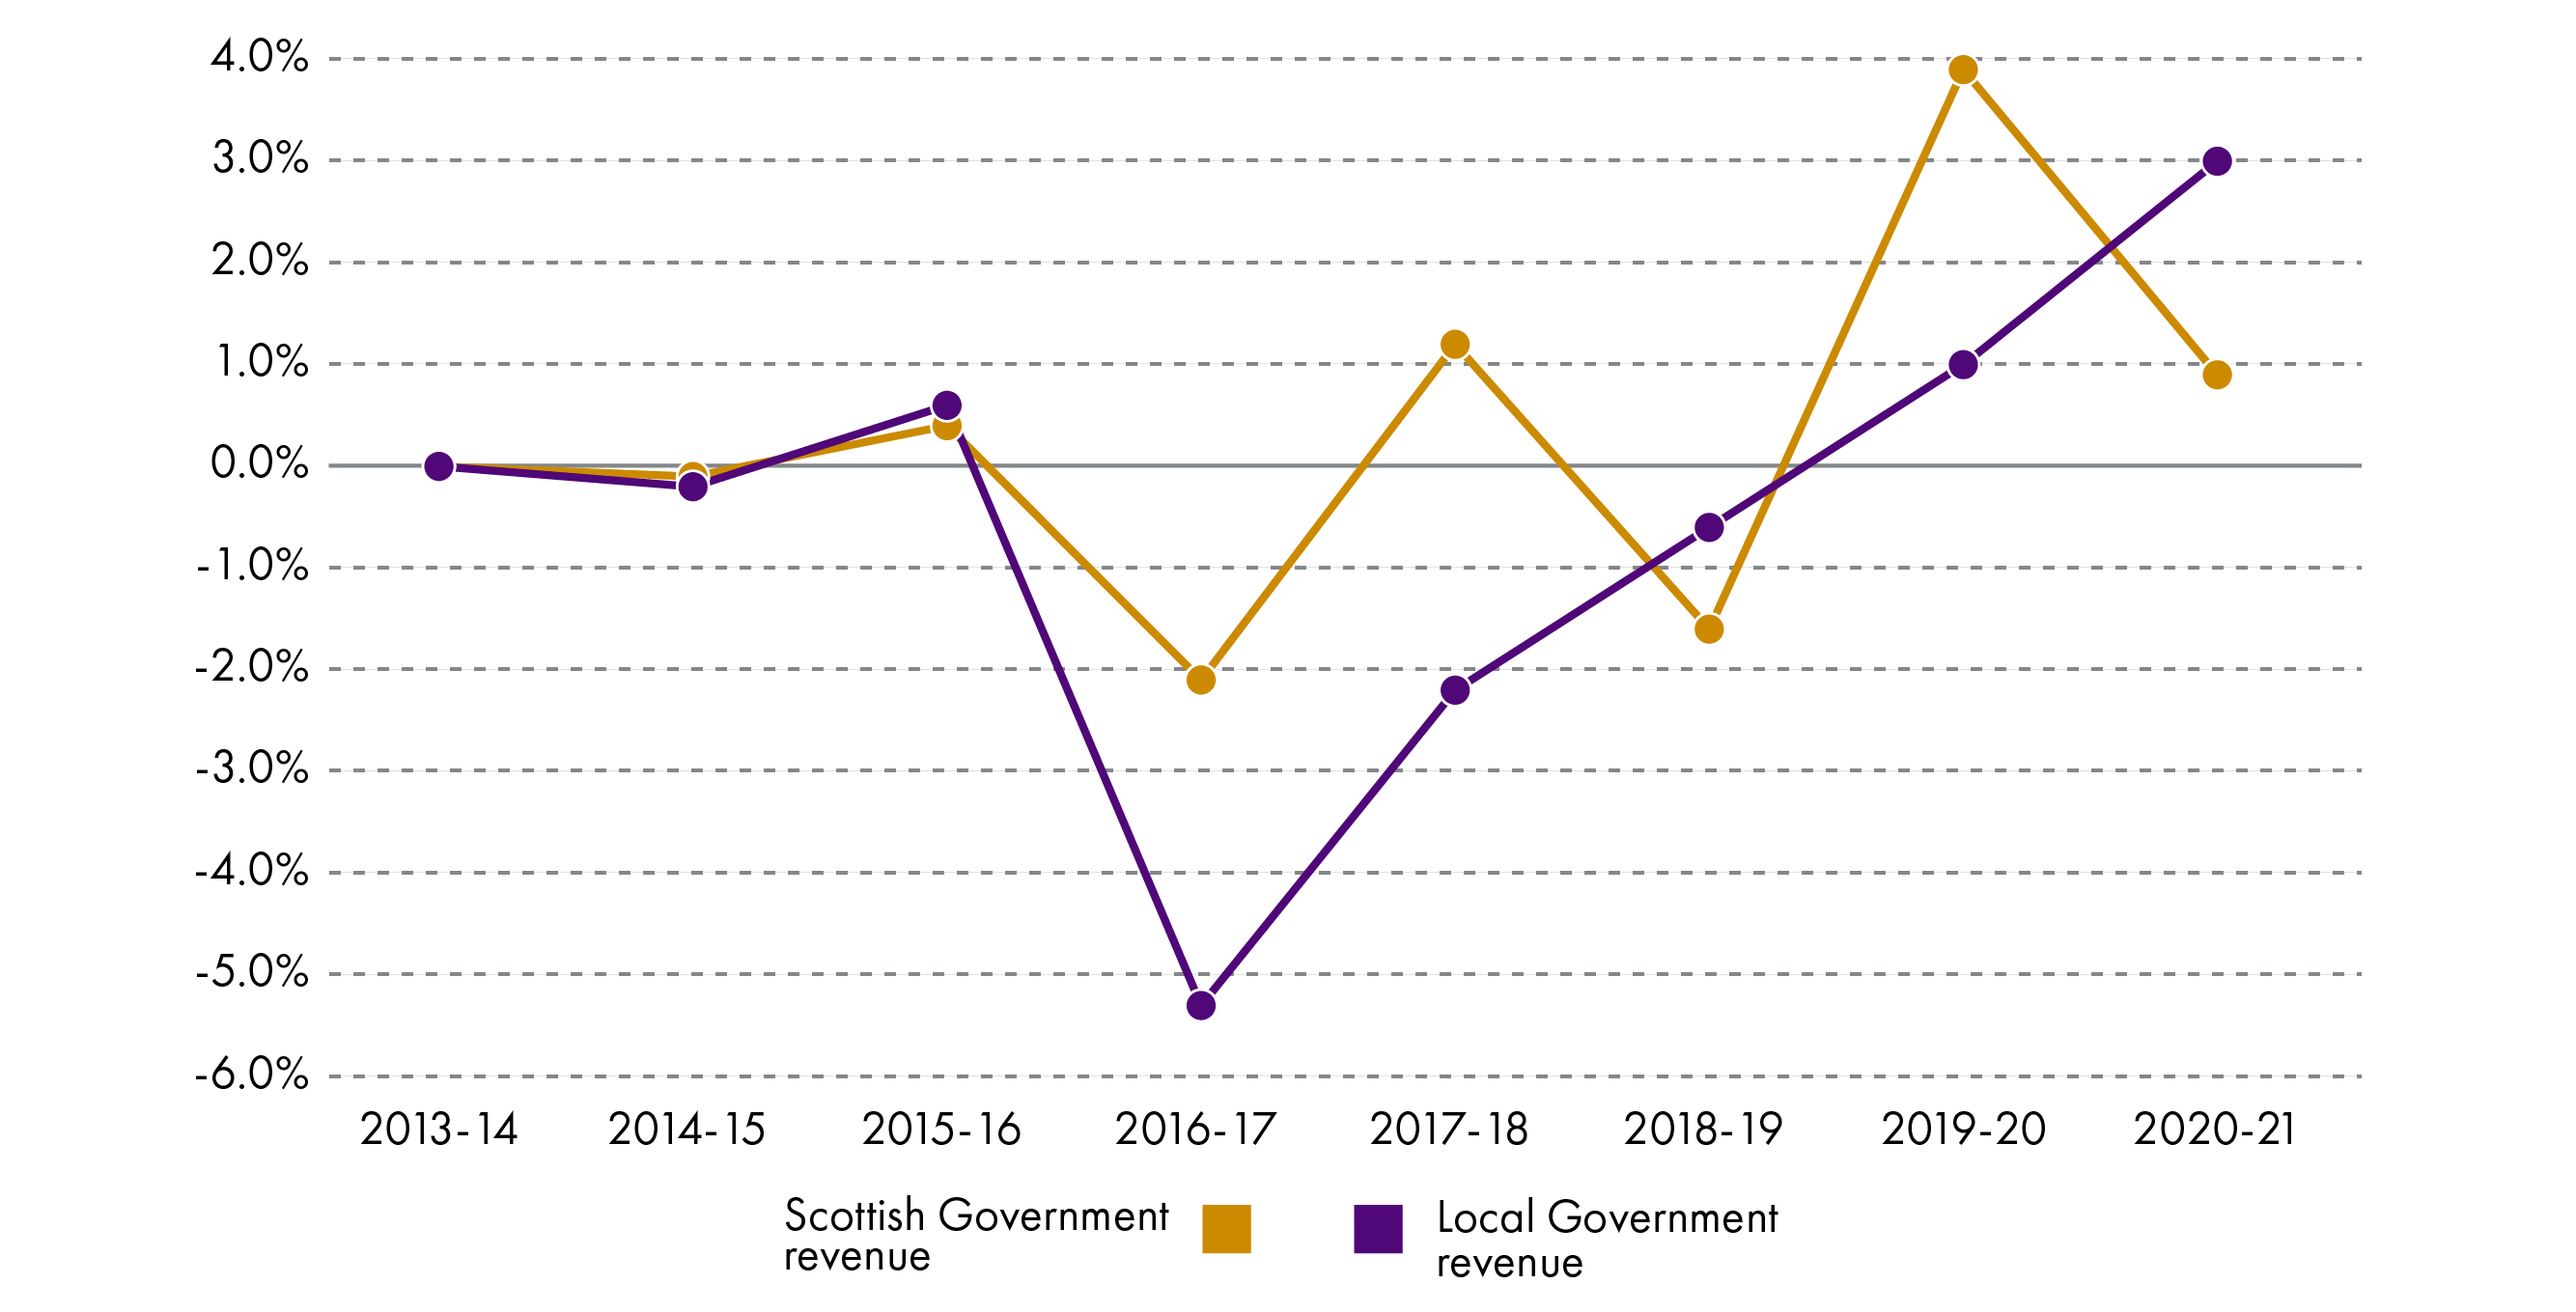
Figure 3 shows clearly that, overall from 2013-14 to 2020-21, the local government revenue budget has reduced compared to the Scottish Government equivalent budget from the UK Government, which has increased. However, the year to year picture presented in Figure 4 shows a more mixed position, and that in recent years the overall position for local government has improved.
Figure 3 shows that, from 2013-14 to 2020-21, the local government total revenue budget reduced by 3.8% in real terms (or -£404.8 million). The Scottish Government's fiscal resource budget limit from HM Treasury, plus NDRI, increased in real terms over the same period, by 2.6% (or +£795.2 million).
Non-Domestic Rates and Council Tax
The SPICe Briefing on the overall budget contains detailed analysis of the Government's policy proposals on Non-Domestic Rates and the Scottish Fiscal Commission's forecasts.
One additional area not covered previously is the Government's innovative and complex use of the Non-Domestic Rating Account, which was introduced last year. In the previous budget for 2019-20, the Government stated that it had brought forward £100 million of anticipated future NDRI into the 2019-20 budget. However in the 2020-21 Budget, the Government states that:
This decision to bring forward some of the forecast growth in NDR receipts from 2020‑21 and 2021‑22 was intended to support continued investment in local government and stimulate the economy. In the event the latest SFC NDR income estimates confirm that the NDR pool will actually show a surplus of £25 million for 2019‑20. Since we did not utilise this facility in 2019‑20, our budget plans therefore propose to bring forward some of the forecast growth from 2021‑22 and 2022‑23 and allocate £100 million more in 2020‑21 than is forecast to be collected in the pool.
So, having not in fact needed to use this additional money in 2019-20 as originally planned, the Government now says it intends to do the same in 2020-21, and that it intends to bring the pool back into balance in 2022-23.
Turning to Council Tax, the Budget sets out that the Government and COSLA have agreed that increases will be capped at 3% in real terms - i.e. inflation plus 3%. This means that the maximum increase in Council Tax for 2020-21 will be 4.84%. In 2019-20, 12 councils increased Council Tax by the maximum. An overview of Council Tax policy changes and impacts over recent years can be found in SPICe's 2019 Local Government Finance: facts and figures briefing.1
Allocations to local authorities
Local Government Finance Circular 1/20201 was published on the same day as the Budget, and contains provisional allocations to local authorities.
Allocations in the circular are provisional and subject to consultation, therefore local authorities should not set their final budgets on the basis of these figures. Previous Finance Circulars set out a deadline for local authorities to agree to the offer and associated terms by a specific date. However, this year's circular is phrased slightly differently, and only asks local authorities to inform COSLA of any "discrepancies or changes required" by 14 February 2020, and does not appear to offer the opportunity for local authorities not to agree to the offer.
Consultation on the figures presented in the circular will take place between the Scottish Government and COSLA in advance of the Local Government Finance (Scotland) Order 2020 being presented to the Scottish Parliament. Final allocations will be published in a circular in early March.
Much of the media coverage following publication of the Budget and Finance Circular has focused on local authorities publishing their own budget plans for 2020-21, and the levels of "savings" required. For example, City of Edinburgh Council has stated that it will require to make £35 million of savings in 2020-21.
It is worth noting that government grant is only one element of individual local authority budgets. These "savings" figures are generally calculated by local authorities taking their combined revenue grant from the Scottish Government, plus their assumed Council Tax income on one side, and then assumptions of demand for services on the other side. So, although this section of the Briefing shows that all local authorities receive a real terms increase in their total revenue allocations from the Scottish Government, that does not mean that authorities will not need to make hard choices about service delivery in their areas.
Provisional Revenue allocations
Year to year comparisons in this section of the Briefing are made between the new Finance Circular (1/2020) and the Finance Circular published in March 2019 (2/2019).
Figures for real terms change, per head allocations and percentage of the Scottish average are based on Total Revenue funding settlements, as set out in Column 12 of Annex B of the Local Government Finance Circulars.
Real terms change, 2019-20 to 2020-21
Figure 5 shows that all local authorities receive a real terms increase in their total revenue support from 2019-20. Midlothian and Highland Councils received the highest percentage increase, and the three island authorities receive the lowest increase.
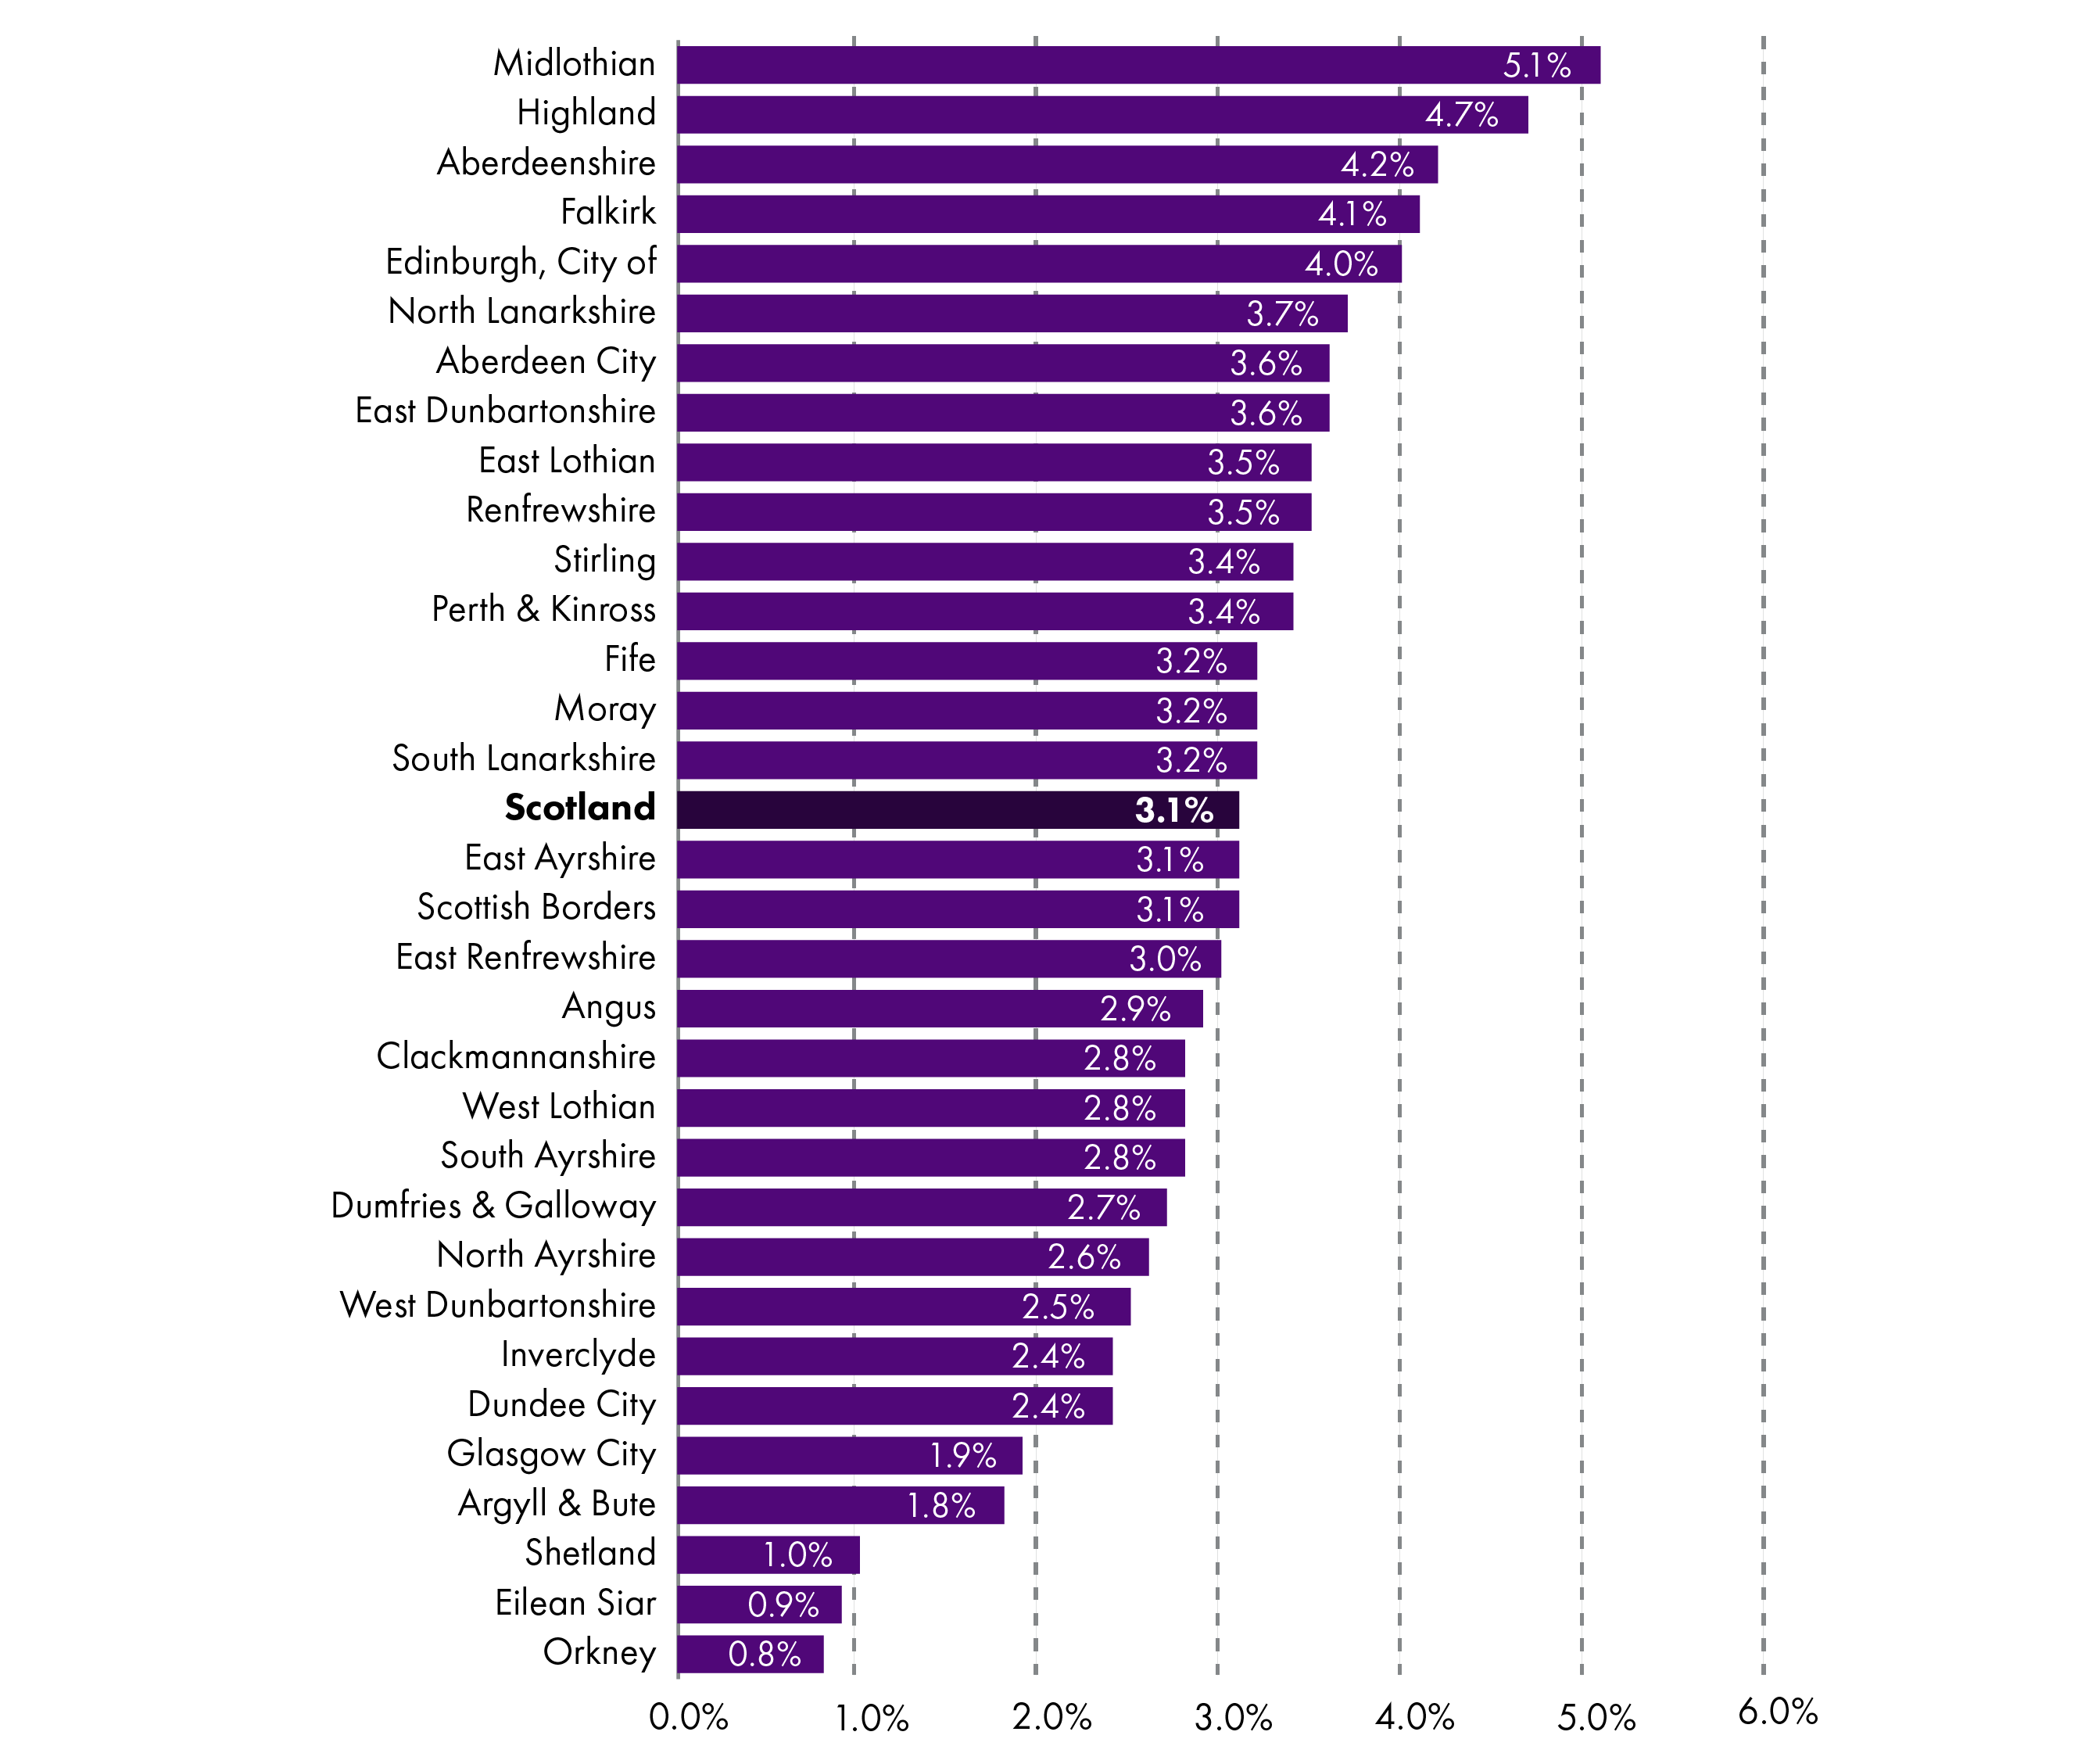
Data: Annex Table 3
Revenue allocations per head
Figure 6 below shows the provisional revenue allocations on a per head basis.
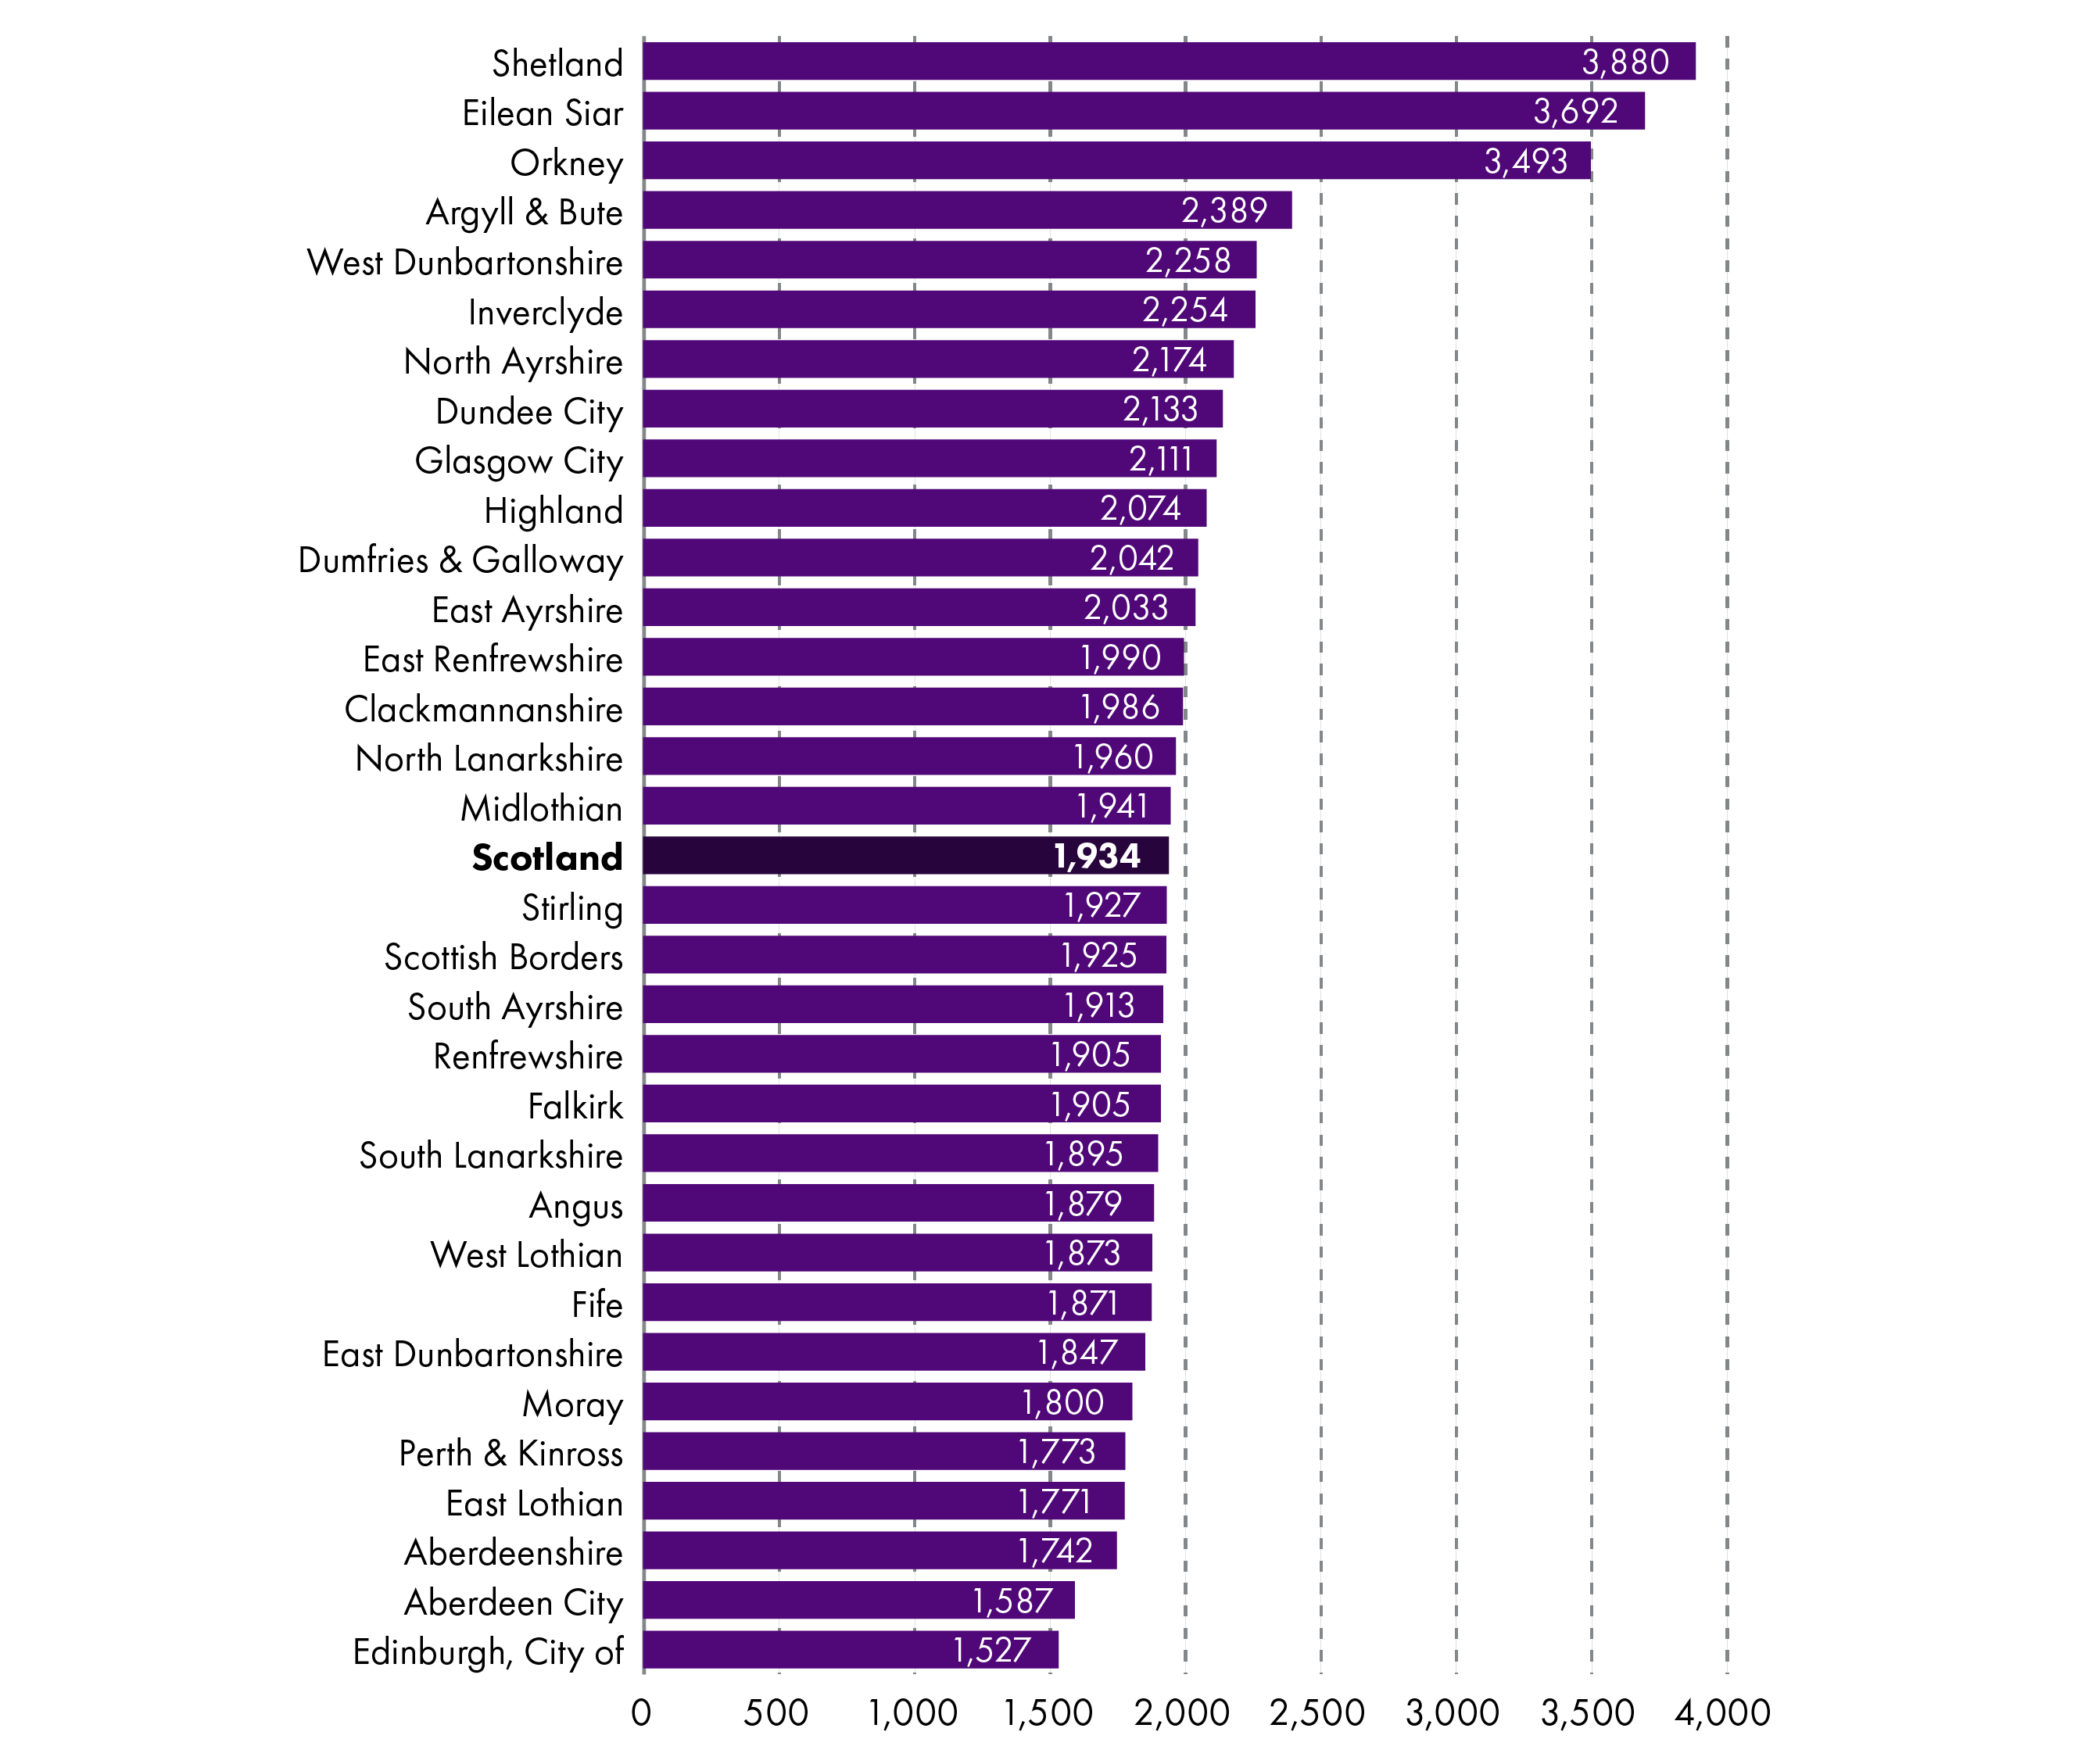
Data: Annex Table 4
As in previous years, the three island authorities receive the greatest amount of Total Revenue funding per head, which reflects the particular circumstances of delivering public services in island communities1.
The City of Edinburgh and Aberdeen City have the lowest allocations per head. As detailed in the SPICe briefing Local Government Finance: The funding formula and local taxation income2, these councils receive a high proportion of income from Council Tax.
The Scottish Government has made the commitment that no local authority will receive less than 85% of the Scottish average per head in terms of Revenue support. This includes funding from Council Tax income. The only local authority affected by this adjustment in 2020-21 is City of Edinburgh.
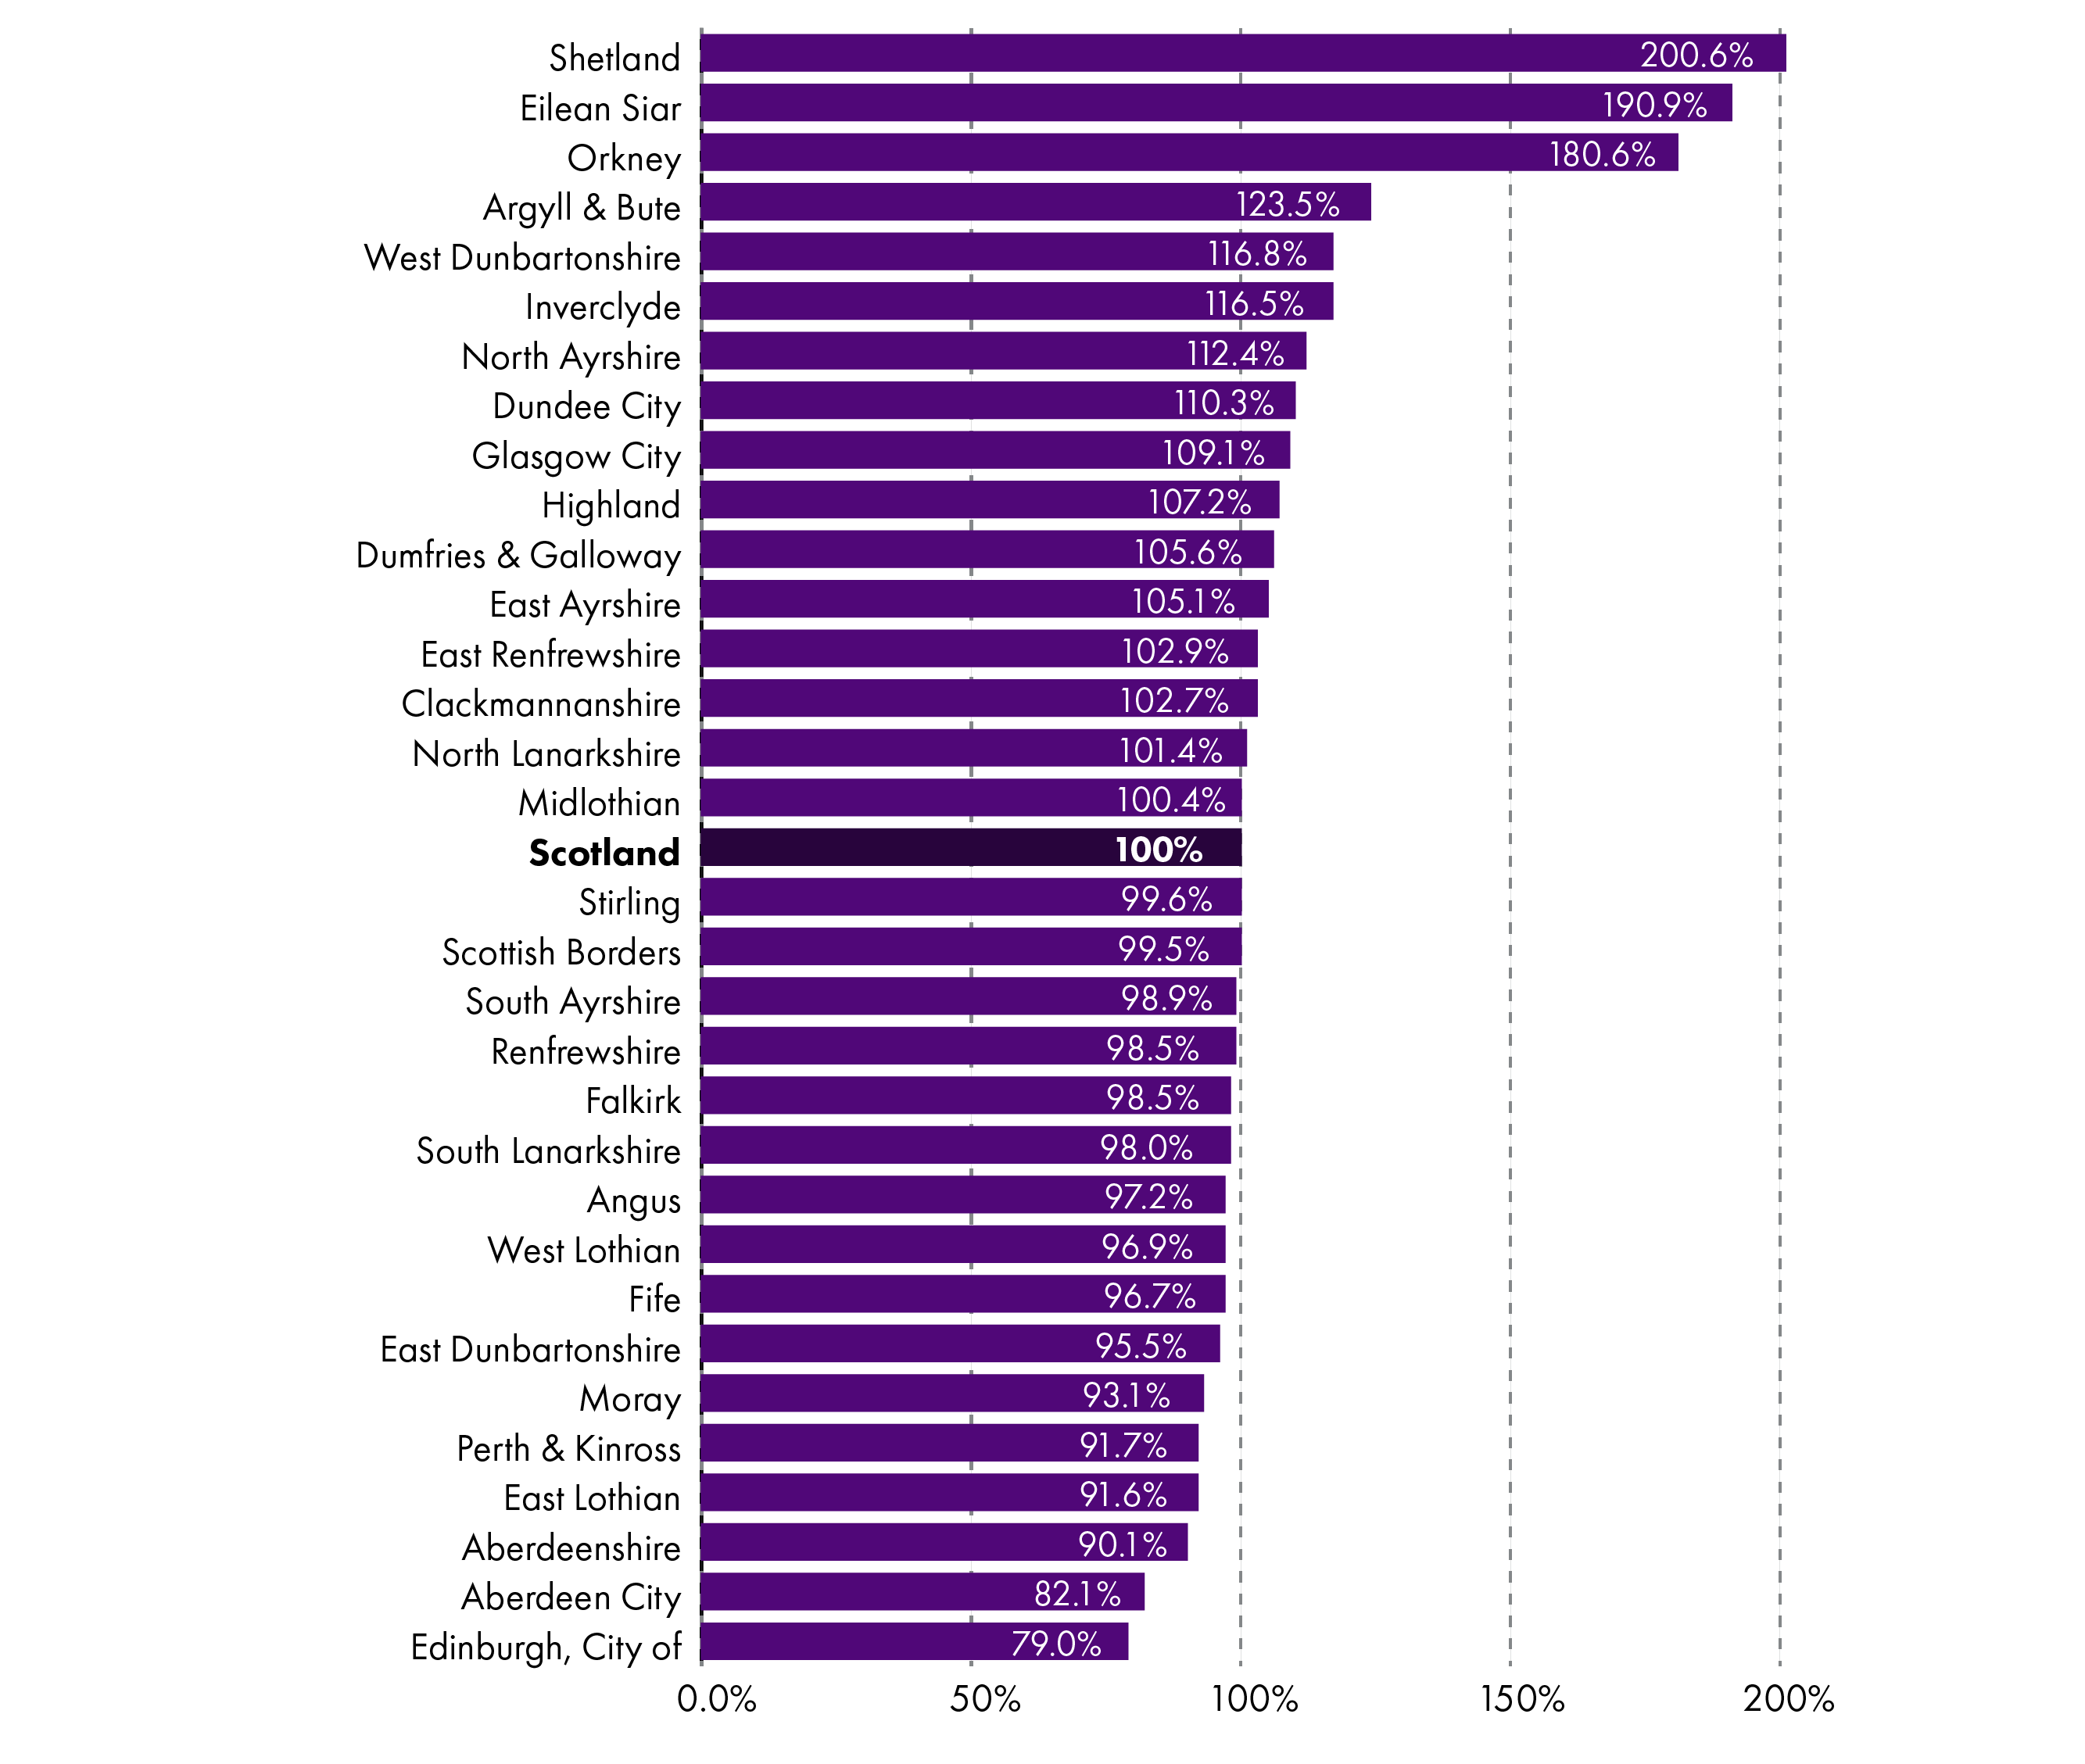
Percentage of the Scottish average
Figure 7 shows the data presented in Figure 6 in percentage terms. This shows that, as in previous years and as would be expected, the island authorities receive the highest amount of funding per head, whilst the City of Edinburgh, followed by Aberdeen City and Aberdeenshire, receive the lowest percentage of the Scottish average funding per head.
Data: Annex Table 4
Provisional Capital allocations
As noted in the 'Local government budget breakdown' section, Total Capital funding is reducing substantially in real terms in 2020-21, and this is reflected in individual local authority allocations. Although the Government states that much of this is due to removal of one-off items that took place in 2019-20, the capital allocation is still substantially lower than in 2018-19, and COSLA states that it is in reality a cash cut of £117 million.
A full breakdown of the figures, and the actual allocations for 2020-21, are in Table 5 of the Annex. These are presented for information only and figures should be treated with caution. As Capital grants can vary widely year to year depending on planned infrastructure investment, looking at Capital funding over time does not show an accurate trend in local government investment, so these figures are purely illustrative.
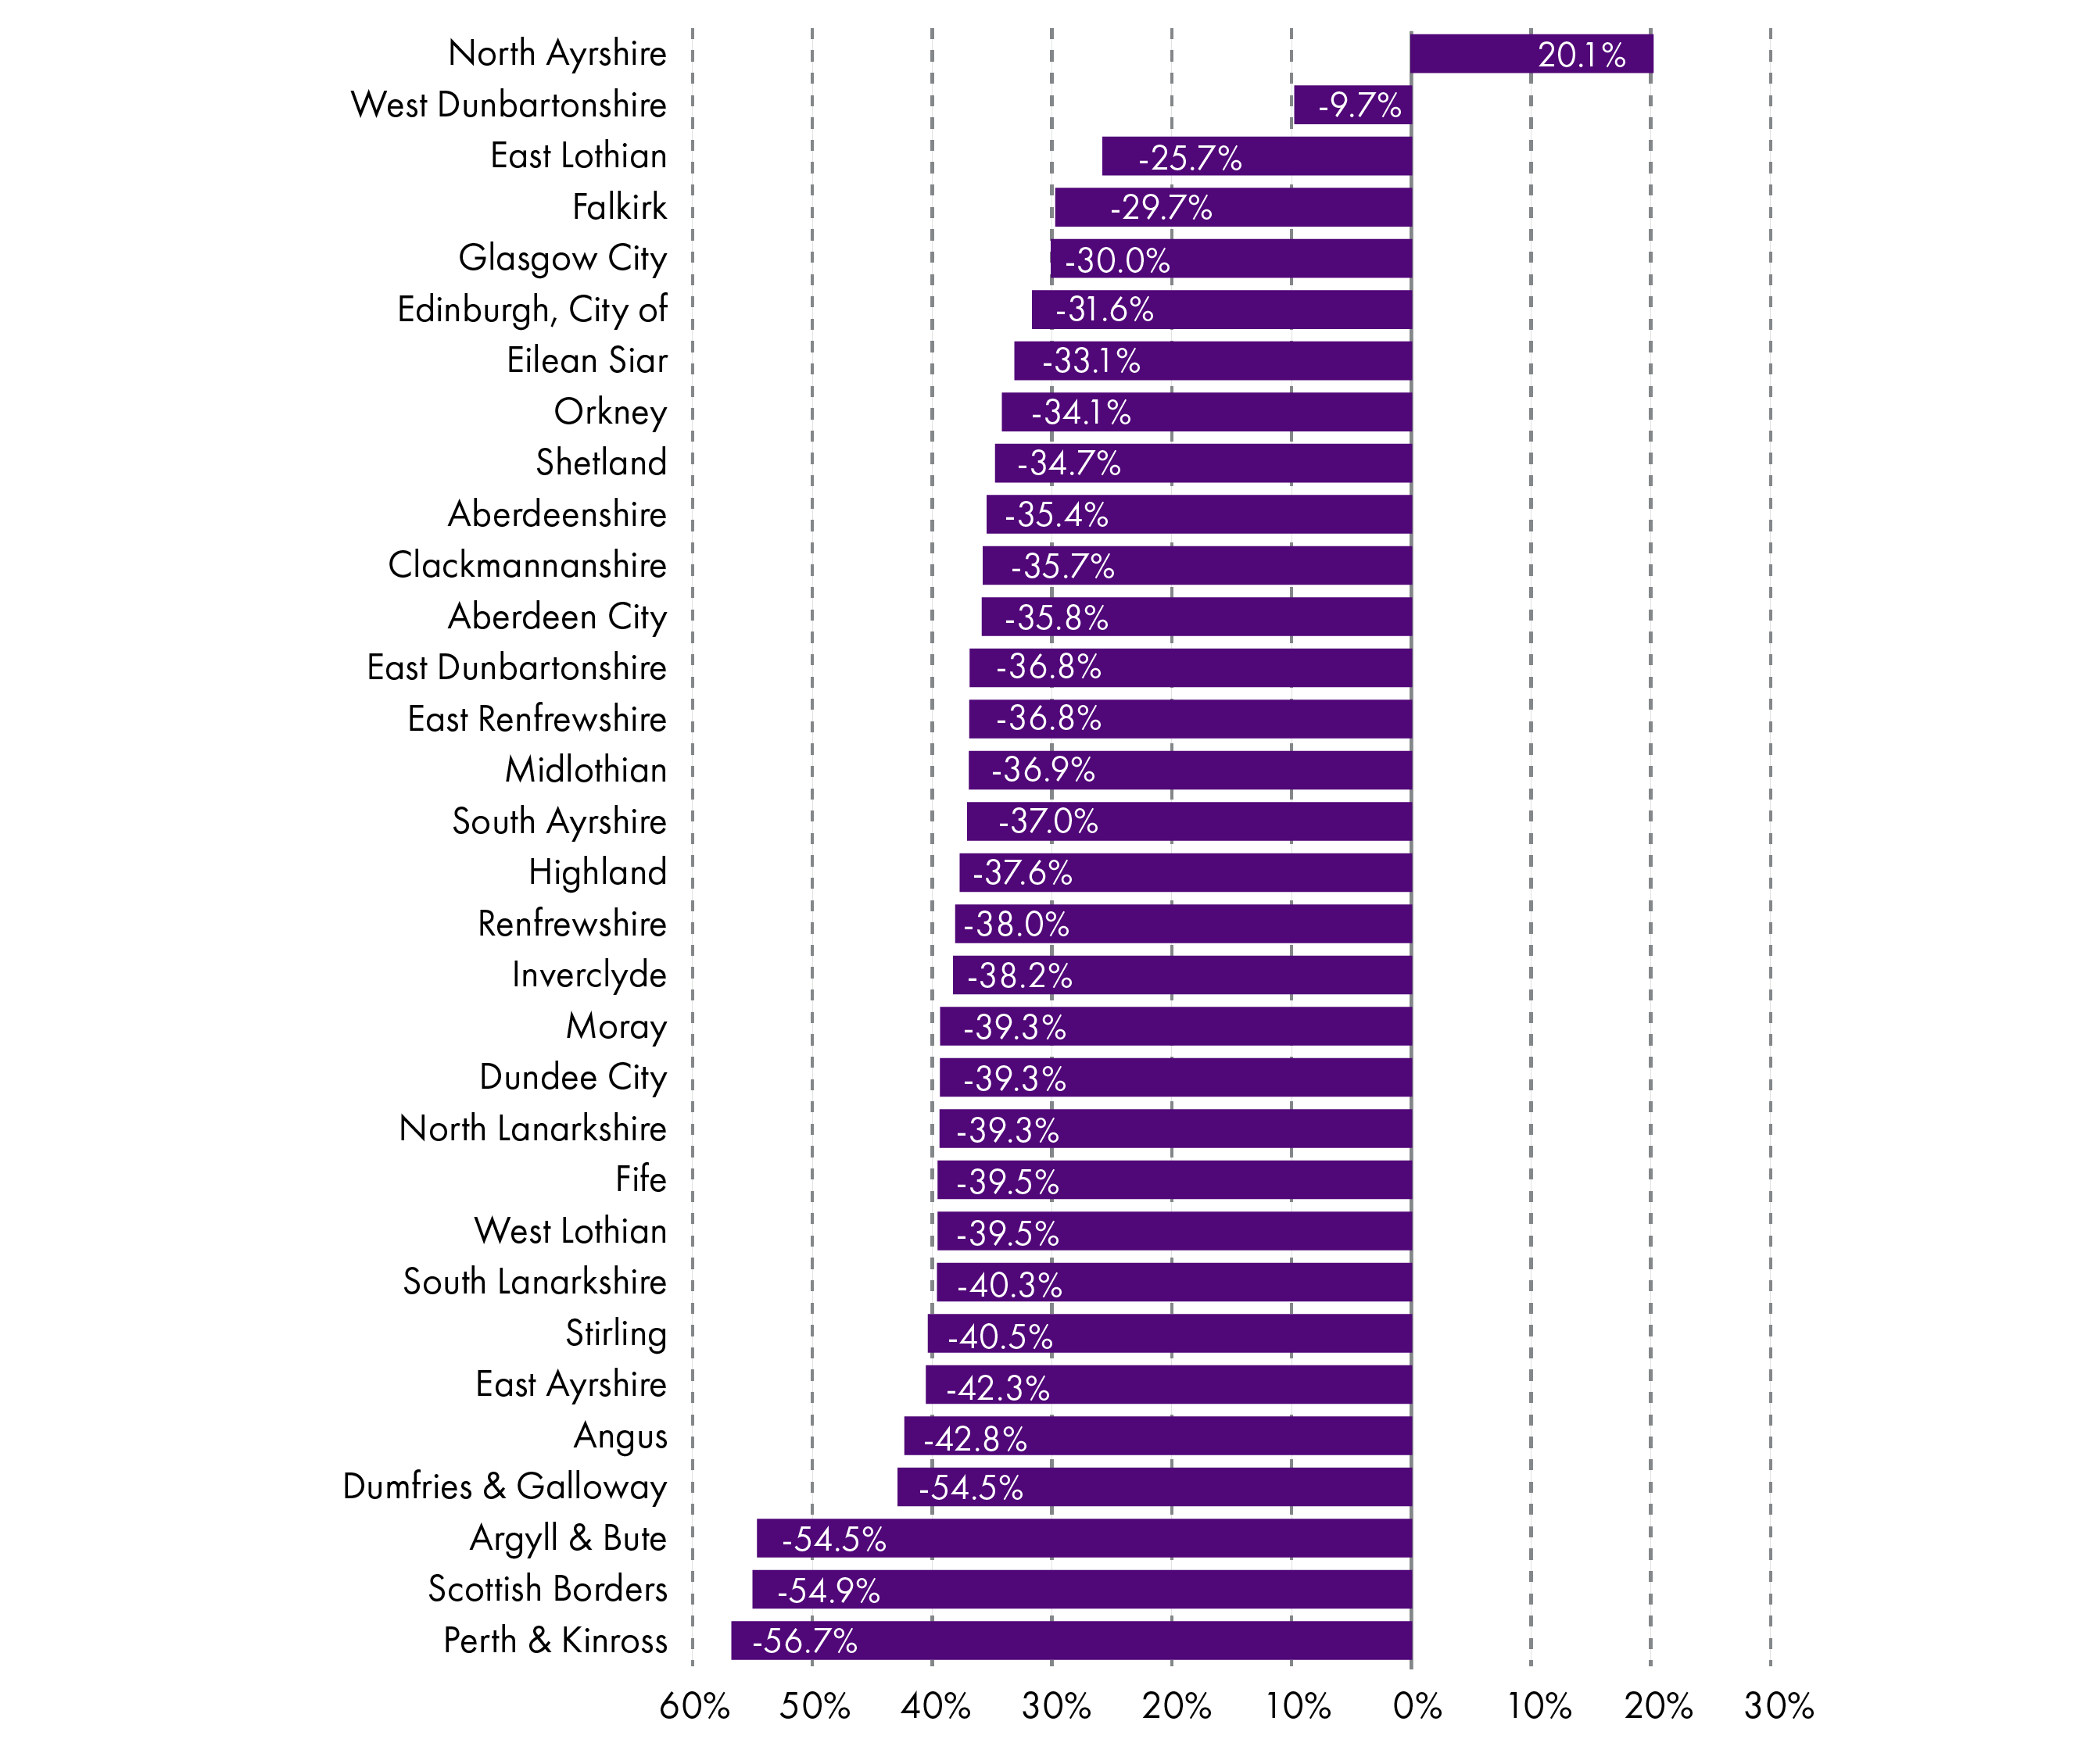
Data: Annex Table 5
Annex
Table 1 - Local Government funding
| Local Government | 2019-20 | 2020-21 (cash) | Cash change | Cash change % | 2020-21 (real) | Real change | Real change % |
|---|---|---|---|---|---|---|---|
| Local Government Spending Plans (Table 6.11) | |||||||
| General Revenue Grant | 6,449.3 | 6,668.4 | 219.1 | 3.4% | 6,547.8 | 98.5 | 1.5% |
| Non-Domestic Rates | 2,853.0 | 2,790.0 | -63.0 | -2.2% | 2,739.5 | -113.5 | -4.0% |
| Support for Capital | 703.8 | 467.9 | -235.9 | -33.5% | 459.4 | -244.4 | -34.7% |
| Specific Resource Grants | 483.6 | 685.6 | 202.0 | 41.8% | 673.2 | 189.6 | 39.2% |
| Specific Capital Grants | 380.2 | 295.1 | -85.1 | -22.4% | 289.8 | -90.4 | -23.8% |
| Local Government Advice and Policy | 3.0 | 3.8 | 0.8 | 26.7% | 3.7 | 0.7 | 24.4% |
| Total Level 2 | 10,872.9 | 10,910.8 | 37.9 | 0.3% | 10,713.4 | -159.5 | -1.5% |
| GRG+NDRI | 9,302.3 | 9,458.4 | 156.1 | 1.7% | 9,287.3 | -15.0 | -0.2% |
| GRG, NDRI and SRG | 9,785.9 | 10,144.0 | 358.1 | 3.7% | 9,960.5 | 174.6 | 1.8% |
| Total Capital | 1,084.0 | 763.0 | -321.0 | -29.6% | 749.2 | -334.8 | -30.9% |
| Revenue funding in other portfolios (Table 6.14) | |||||||
| Local Government Budget Settlement | 10,869.9 | 10,907.0 | 37.1 | 0.3% | 10,709.7 | -160.2 | -1.5% |
| Total revenue within other Portfolios | 293.3 | 428.7 | 135.4 | 46.2% | 420.9 | 127.6 | 43.5% |
| Finance Circular | 11,163.2 | 11,335.7 | 172.5 | 1.5% | 11,130.7 | -32.5 | -0.3% |
| Funding outwith core settlement (Table 6.15) | |||||||
| Revenue | 160.6 | 197.9 | 37.3 | 23.2% | 194.3 | 33.7 | 21.0% |
| Capital | 287.3 | 382.4 | 95.1 | 33.1% | 375.5 | 88.2 | 30.7% |
| Total funding outwith core | 447.9 | 580.3 | 132.4 | 29.6% | 569.8 | 121.9 | 27.2% |
| Overall SG funding for LG | 11,611.1 | 11,916.0 | 304.9 | 2.6% | 11,700.5 | 89.4 | 0.8% |
Table 2 - Local government and Scottish Government revenue comparison, 2013-14 to 2020-21
| Local government and Scottish Government revenue comparison, 2013-14 to 2020-21 | ||
|---|---|---|
| Comparison to SG, £m, Cash terms | ||
| Financial year (Local Government Finance Circular) | LG Total Revenue | SG Revenue Fiscal Resource Budget Limit + NDRI |
| 2013-14 (2/2013) | 9,728.5 | 28,066.0 |
| 2014-15 (1/2014) | 9,848.3 | 28,426.5 |
| 2015-16 (2/2015) | 9,994.1 | 28,779.5 |
| 2016-17 (1/2016) | 9,693.4 | 28,856.5 |
| 2017-18 (1/2017) | 9,639.5 | 29,692.8 |
| 2018-19 (4/2018) | 9,779.9 | 29,836.0 |
| 2019-20 (2/2019) | 10,078.4 | 31,623.0 |
| 2020-21 (1/2020) | 10,572.8 | 32,501.0 |
| £m change 2013-14 to 2020-21 | 844.3 | 4,435.0 |
| % Change 2013-14 to 2020-21 | 8.7% | 15.8% |
| Comparison to SG, £m, Real terms | ||
| LG Total Revenue | SG Revenue Fiscal Resource Budget Limit + NDRI | |
| 2013-14 | 10,786.4 | 31,117.9 |
| 2014-15 | 10,768.9 | 31,083.6 |
| 2015-16 | 10,834.9 | 31,200.9 |
| 2016-17 | 10,265.9 | 30,560.8 |
| 2017-18 | 10,035.4 | 30,912.4 |
| 2018-19 | 9,975.4 | 30,432.5 |
| 2019-20 | 10,078.4 | 31,623.0 |
| 2020-21 | 10,381.6 | 31,913.1 |
| £m change 2013-14 to 2019-20 | -404.8 | 795.2 |
| % Change 2013-14 to 2019-20 | -3.8% | 2.6% |
Table 3 - Provisional Revenue allocations
| Local Authority - Finance circular, Annex B, Col 12 | 2019-20 (from 2/2019) | 2020-21 (from 1/2020) | Cash change | Cash change % | 2020-21 (real, 2019-20) | Real change | Real change % |
|---|---|---|---|---|---|---|---|
| Aberdeen City | 342.3 | 361.2 | 18.9 | 5.5% | 354.7 | 12.4 | 3.6% |
| Aberdeenshire | 429.4 | 455.6 | 26.2 | 6.1% | 447.4 | 18.0 | 4.2% |
| Angus | 208.2 | 218.1 | 9.9 | 4.8% | 214.2 | 6.0 | 2.9% |
| Argyll & Bute | 198.7 | 206.1 | 7.4 | 3.7% | 202.4 | 3.7 | 1.8% |
| Clackmannanshire | 97.5 | 102.1 | 4.6 | 4.7% | 100.3 | 2.7 | 2.8% |
| Dumfries & Galloway | 290.6 | 303.9 | 13.4 | 4.6% | 298.4 | 7.9 | 2.7% |
| Dundee City | 304.4 | 317.4 | 13.0 | 4.3% | 311.7 | 7.3 | 2.4% |
| East Ayrshire | 235.9 | 247.7 | 11.8 | 5.0% | 243.3 | 7.3 | 3.1% |
| East Dunbartonshire | 189.7 | 200.2 | 10.4 | 5.5% | 196.6 | 6.8 | 3.6% |
| East Lothian | 177.8 | 187.4 | 9.6 | 5.4% | 184.0 | 6.3 | 3.5% |
| East Renfrewshire | 180.5 | 189.4 | 8.9 | 4.9% | 186.0 | 5.5 | 3.0% |
| Edinburgh, City of | 747.7 | 792.1 | 44.5 | 5.9% | 777.8 | 30.1 | 4.0% |
| Eilean Siar | 96.4 | 99.1 | 2.7 | 2.8% | 97.3 | 0.9 | 0.9% |
| Falkirk | 288.1 | 305.5 | 17.4 | 6.0% | 300.0 | 11.8 | 4.1% |
| Fife | 661.9 | 695.9 | 34.0 | 5.1% | 683.3 | 21.5 | 3.2% |
| Glasgow City | 1,274.3 | 1,322.5 | 48.3 | 3.8% | 1,298.6 | 24.3 | 1.9% |
| Highland | 458.1 | 488.5 | 30.4 | 6.6% | 479.7 | 21.6 | 4.7% |
| Inverclyde | 168.9 | 176.2 | 7.3 | 4.3% | 173.0 | 4.1 | 2.4% |
| Midlothian | 165.7 | 177.3 | 11.6 | 7.0% | 174.1 | 8.4 | 5.1% |
| Moray | 163.6 | 172.0 | 8.4 | 5.1% | 168.8 | 5.3 | 3.2% |
| North Ayrshire | 281.6 | 294.2 | 12.6 | 4.5% | 288.8 | 7.2 | 2.6% |
| North Lanarkshire | 631.8 | 667.0 | 35.2 | 5.6% | 655.0 | 23.2 | 3.7% |
| Orkney | 75.5 | 77.5 | 2.0 | 2.7% | 76.1 | 0.6 | 0.8% |
| Perth & Kinross | 254.9 | 268.4 | 13.4 | 5.3% | 263.5 | 8.6 | 3.4% |
| Renfrewshire | 321.5 | 338.8 | 17.2 | 5.4% | 332.7 | 11.1 | 3.5% |
| Scottish Borders | 211.5 | 222.0 | 10.5 | 5.0% | 217.9 | 6.5 | 3.1% |
| Shetland | 86.7 | 89.2 | 2.5 | 2.8% | 87.6 | 0.9 | 1.0% |
| South Ayrshire | 205.8 | 215.4 | 9.6 | 4.7% | 211.5 | 5.7 | 2.8% |
| South Lanarkshire | 575.2 | 604.7 | 29.5 | 5.1% | 593.8 | 18.6 | 3.2% |
| Stirling | 172.7 | 181.8 | 9.1 | 5.3% | 178.5 | 5.8 | 3.4% |
| West Dunbartonshire | 192.9 | 201.3 | 8.4 | 4.4% | 197.7 | 4.8 | 2.5% |
| West Lothian | 326.0 | 341.3 | 15.3 | 4.7% | 335.1 | 9.1 | 2.8% |
| Scotland | 10,015.8 | 10,520.0 | 504.1 | 5.0% | 10,329.7 | 313.9 | 3.1% |
Table 4 - Provisional Revenue allocations, per head
| Local authority | 2020-21 provisional allocation | 2018 mid year population | Per head | % of Scottish average |
|---|---|---|---|---|
| Aberdeen City | 361.2 | 227,560 | 1,587 | 82.1% |
| Aberdeenshire | 455.6 | 261,470 | 1,743 | 90.1% |
| Angus | 218.1 | 116,040 | 1,880 | 97.2% |
| Argyll & Bute | 206.1 | 86,260 | 2,390 | 123.5% |
| Clackmannanshire | 102.1 | 51,400 | 1,987 | 102.7% |
| Dumfries & Galloway | 303.9 | 148,790 | 2,043 | 105.6% |
| Dundee City | 317.4 | 148,750 | 2,134 | 110.3% |
| East Ayrshire | 247.7 | 121,840 | 2,033 | 105.1% |
| East Dunbartonshire | 200.2 | 108,330 | 1,848 | 95.5% |
| East Lothian | 187.4 | 105,790 | 1,771 | 91.6% |
| East Renfrewshire | 189.4 | 95,170 | 1,990 | 102.9% |
| Edinburgh, City of | 792.1 | 518,500 | 1,528 | 79.0% |
| Eilean Siar | 99.1 | 26,830 | 3,693 | 190.9% |
| Falkirk | 305.5 | 160,340 | 1,905 | 98.5% |
| Fife | 695.9 | 371,910 | 1,871 | 96.7% |
| Glasgow City | 1,322.5 | 626,410 | 2,111 | 109.1% |
| Highland | 488.5 | 235,540 | 2,074 | 107.2% |
| Inverclyde | 176.2 | 78,150 | 2,254 | 116.5% |
| Midlothian | 177.3 | 91,340 | 1,941 | 100.4% |
| Moray | 172.0 | 95,520 | 1,800 | 93.1% |
| North Ayrshire | 294.2 | 135,280 | 2,174 | 112.4% |
| North Lanarkshire | 667.0 | 340,180 | 1,961 | 101.4% |
| Orkney | 77.5 | 22,190 | 3,493 | 180.6% |
| Perth & Kinross | 268.4 | 151,290 | 1,774 | 91.7% |
| Renfrewshire | 338.8 | 177,790 | 1,906 | 98.5% |
| Scottish Borders | 222.0 | 115,270 | 1,926 | 99.5% |
| Shetland | 89.2 | 22,990 | 3,881 | 200.6% |
| South Ayrshire | 215.4 | 112,550 | 1,914 | 98.9% |
| South Lanarkshire | 604.7 | 319,020 | 1,895 | 98.0% |
| Stirling | 181.8 | 94,330 | 1,927 | 99.6% |
| West Dunbartonshire | 201.3 | 89,130 | 2,259 | 116.8% |
| West Lothian | 341.3 | 182,140 | 1,874 | 96.9% |
| Scotland | 10,520.0 | 5,438,100 | 1,934 | 100.0% |
Table 5 - Provisional Capital allocations
| Total capital funding | 2019-20 total capital (2/2019) | Total general capital grant payable 2020-21 | Specific capital grants - settlement 2020-21 | Total Capital funding (2020-21) (1/2020) | Cash change | Cash change % | 2020-21 (real, 2019-20) | Real change | Real change % |
|---|---|---|---|---|---|---|---|---|---|
| Aberdeen City | 38.3 | 18.7 | 6.4 | 25.0 | -13.2 | -34.6% | 24.6 | -13.7 | -35.8% |
| Aberdeenshire | 51.3 | 26.4 | 7.3 | 33.8 | -17.5 | -34.2% | 33.2 | -18.1 | -35.4% |
| Angus | 24.3 | 11.9 | 2.4 | 14.3 | -10.0 | -41.2% | 14.1 | -10.3 | -42.3% |
| Argyll & Bute | 23.2 | 8.9 | 1.8 | 10.7 | -12.4 | -53.7% | 10.5 | -12.6 | -54.5% |
| Clackmannanshire | 8.8 | 4.4 | 1.4 | 5.7 | -3.0 | -34.5% | 5.6 | -3.1 | -35.7% |
| Dumfries & Galloway | 29.4 | 14.7 | 2.4 | 17.1 | -12.3 | -41.8% | 16.8 | -12.6 | -42.8% |
| Dundee City | 28.1 | 14.4 | 2.9 | 17.4 | -10.7 | -38.2% | 17.1 | -11.0 | -39.3% |
| East Ayrshire | 24.6 | 9.0 | 5.9 | 14.9 | -9.7 | -39.4% | 14.7 | -10.0 | -40.5% |
| East Dunbartonshire | 14.9 | 7.4 | 2.2 | 9.6 | -5.3 | -35.6% | 9.4 | -5.5 | -36.8% |
| East Lothian | 17.1 | 8.9 | 4.1 | 12.9 | -4.2 | -24.4% | 12.7 | -4.4 | -25.7% |
| East Renfrewshire | 14.0 | 5.6 | 3.4 | 9.0 | -5.0 | -35.7% | 8.8 | -5.2 | -36.8% |
| Edinburgh, City of | 110.6 | 38.2 | 38.8 | 77.0 | -33.5 | -30.3% | 75.6 | -34.9 | -31.6% |
| Eilean Siar | 10.6 | 6.4 | 0.8 | 7.2 | -3.4 | -31.8% | 7.1 | -3.5 | -33.1% |
| Falkirk | 24.1 | 13.0 | 4.3 | 17.3 | -6.8 | -28.4% | 17.0 | -7.2 | -29.7% |
| Fife | 55.2 | 25.0 | 9.0 | 34.1 | -21.2 | -38.4% | 33.4 | -21.8 | -39.5% |
| Glasgow City | 182.1 | 51.0 | 78.7 | 129.8 | -52.3 | -28.7% | 127.4 | -54.7 | -30.0% |
| Highland | 53.2 | 25.0 | 8.8 | 33.8 | -19.4 | -36.5% | 33.2 | -20.0 | -37.6% |
| Inverclyde | 12.4 | 6.2 | 1.6 | 7.8 | -4.6 | -37.0% | 7.7 | -4.7 | -38.2% |
| Midlothian | 17.9 | 7.1 | 4.5 | 11.5 | -6.4 | -35.7% | 11.3 | -6.6 | -36.9% |
| Moray | 16.6 | 8.2 | 2.1 | 10.3 | -6.3 | -38.1% | 10.1 | -6.5 | -39.3% |
| North Ayrshire | 26.2 | 27.6 | 4.4 | 32.0 | 5.9 | 22.4% | 31.4 | 5.3 | 20.1% |
| North Lanarkshire | 50.3 | 23.2 | 7.9 | 31.1 | -19.2 | -38.2% | 30.5 | -19.8 | -39.3% |
| Orkney | 8.5 | 5.1 | 0.6 | 5.7 | -2.8 | -32.9% | 5.6 | -2.9 | -34.1% |
| Perth & Kinross | 36.3 | 12.0 | 4.0 | 16.0 | -20.3 | -55.9% | 15.7 | -20.6 | -56.7% |
| Renfrewshire | 25.2 | 12.0 | 3.9 | 15.9 | -9.3 | -36.9% | 15.6 | -9.6 | -38.0% |
| Scottish Borders | 29.7 | 11.6 | 2.0 | 13.6 | -16.0 | -54.1% | 13.4 | -16.3 | -54.9% |
| Shetland | 9.2 | 5.2 | 0.9 | 6.1 | -3.1 | -33.5% | 6.0 | -3.2 | -34.7% |
| South Ayrshire | 19.9 | 8.6 | 4.2 | 12.8 | -7.2 | -35.8% | 12.6 | -7.4 | -37.0% |
| South Lanarkshire | 44.1 | 21.2 | 5.9 | 27.1 | -16.9 | -38.4% | 26.7 | -17.4 | -39.5% |
| Stirling | 16.0 | 7.8 | 2.0 | 9.8 | -6.3 | -39.2% | 9.6 | -6.5 | -40.3% |
| West Dunbartonshire | 14.3 | 11.6 | 1.5 | 13.1 | -1.1 | -8.0% | 12.9 | -1.4 | -9.7% |
| West Lothian | 24.6 | 11.5 | 3.6 | 15.1 | -9.4 | -38.4% | 14.9 | -9.7 | -39.5% |
| Undistributed | 0.0 | 0.0 | 50.0 | 50.0 | 50.0 | 49.1 | 49.1 | ||
| Total excl. SPT | 1,061.1 | 467.9 | 279.9 | 747.8 | -313.3 | -29.5% | 734.3 | -326.8 | -30.8% |
| SPT | 23.1 | 15.3 | 15.3 | -7.8 | -33.7% | 15.0 | -8.1 | -34.9% | |
| Total incl. SPT | 1,084.2 | 467.9 | 295.2 | 763.1 | -321.1 | -29.6% | 749.3 | -334.9 | -30.9% |
Abbreviations
COSLA - Convention of Scottish Local Authorities
GRG - General Revenue Grant
LG - Local Government
NDRI - Non-Domestic Rates Income
SG - Scottish Government
SRG - Specific Resource Grants
Related Briefings
SB 17/82 - Local Government Finance: Fees and Charges 2011-12 to 2015-16
SB 18/60 - Local Government Finance: The Funding Formula and local taxation income
SB 18/82 - Pro-poor or pro-rich? The social impact of local government budgets, 2016 to 2019
SB 18/84 - Budget 2019-20
SB 18/90 - Local Government Finance: Draft Budget 2019-20 and provisional allocations to local authorities
SB 19/45 - Local government finance: facts and figures 2013-14 to 2019-20
SB 20/12 - Scottish Budget 2020-21
Sources
Berthier, A., Burn-Murdoch, A., Aiton, A., & Finnigan, K. (2018, November 9). Local Government Finance: The funding formula and local taxation income. Retrieved from <a href="https://digitalpublications.parliament.scot/ResearchBriefings/Report/2018/11/9/Local-Government-finance--the-Funding-Formula-and-local-taxation-income#" target="_blank">https://digitalpublications.parliament.scot/ResearchBriefings/Report/2018/11/9/Local-Government-finance--the-Funding-Formula-and-local-taxation-income#</a> [accessed 28 November 2018]
Scottish Government. (2020, February 6). Scottish Budget 2020-21. Retrieved from <a href="https://www.gov.scot/publications/scottish-budget-2020-21/" target="_blank">https://www.gov.scot/publications/scottish-budget-2020-21/</a> [accessed 12 February 2020]
Scottish Parliament Information Centre. (2020, February 10). SPICe Briefing 20-12: Scottish Budget 2020-21. Retrieved from <a href="https://digitalpublications.parliament.scot/ResearchBriefings/Report/2020/2/10/Scottish-Budget-2020-21" target="_blank">https://digitalpublications.parliament.scot/ResearchBriefings/Report/2020/2/10/Scottish-Budget-2020-21</a> [accessed 12 February 2020]
COSLA. (2020, January 13). Invest in Essential Services. Retrieved from <a href="https://www.cosla.gov.uk/sites/default/files/private/cosla-investinessentialservices.pdf" target="_blank">https://www.cosla.gov.uk/sites/default/files/private/cosla-investinessentialservices.pdf</a> [accessed 12 February 2020]
Burn-Murdoch, A., & Aiton, A. (2019, July 2). Local Government Finance: Facts and Figures 2013-14 to 2019-20. Retrieved from <a href="https://digitalpublications.parliament.scot/ResearchBriefings/Report/2019/7/2/Local-government-finance--facts-and-figures-2013-14-to-2019-20#" target="_blank">https://digitalpublications.parliament.scot/ResearchBriefings/Report/2019/7/2/Local-government-finance--facts-and-figures-2013-14-to-2019-20#</a> [accessed 12 February 2020]
Scottish Government. (2020, February 6). Local Government Finance Circular No 1/2020. Retrieved from <a href="https://www.gov.scot/binaries/content/documents/govscot/publications/advice-and-guidance/2020/02/local-government-finance-circular-1-2020-settlement-for-2020-21/documents/local-government-finance-circular-1-2020/local-government-finance-circular-1-2020/govscot%3Adocument/Local%2BGovernment%2BFinance%2BCircular%2B1-2020%2B-%2B6%2BFebruary%2B2020.pdf" target="_blank">https://www.gov.scot/binaries/content/documents/govscot/publications/advice-and-guidance/2020/02/local-government-finance-circular-1-2020-settlement-for-2020-21/documents/local-government-finance-circular-1-2020/local-government-finance-circular-1-2020/govscot%3Adocument/Local%2BGovernment%2BFinance%2BCircular%2B1-2020%2B-%2B6%2BFebruary%2B2020.pdf</a> [accessed 12 February 2020]
Scottish Government. (2017, March 9). 'Green Book' for Grant Aided Expenditure. Retrieved from <a href="http://www.gov.scot/Resource/0051/00515060.pdf" target="_blank">http://www.gov.scot/Resource/0051/00515060.pdf</a> [accessed 13 December 2017]