Local government finance: facts and figures 2013-14 to 2019-20
This briefing provides a range of factual information and analysis on local government finance, including the profile of the local government budget over time, as well as Council Tax and Non-Domestic Rates income, from 2013-14 to 2019-20. This briefing does not aim to give a comprehensive overview of Local Government finance. Rather, it focuses on the most common questions asked of SPICe by MSPs.
Executive Summary
During the Scottish Budget process in recent years, local government finance has often taken the spotlight. Comparing changes to this complex area over time can be challenging because of the frequent changes made to the powers and financing of local government, and the need to ensure that like-for-like data is being compared. This briefing, to remove some of these challenges, looks primarily at the local government finance settlement from 2013-14 onwards.
Key messages
This briefing presents a range of factual information around local government finance, including the following:
Local government settlement
Whilst the local government revenue settlement fell quite steeply in 2016-17, and again in 2017-18, this trend now appears to be reversing.
Comparison to Scottish Government
When comparing revenue settlements, real terms change figures show that between 2013-14 and 2018-19, the local government revenue settlement decreased at a much faster rate (-7.5% or -£810 million) than the Scottish Government revenue budget (-2.8% or -£870.4 million). Non-Domestic Rates Income is included in both local government and Scottish Government figures.
However, the trend is reversed when looking at the Local Government Finance Order figures for 2018-19 to 2019-20 - here the revenue settlement for local government increases by 1%, and the Scottish Government's revenue budget increases by 0.9%.
Share of the Scottish Government budget
The local government revenue settlement as a proportion of the Scottish Government revenue budget decreased by 1.7 percentage points between 2013-14 and 2018-19. Local Government Finance Order figures show Local Government revenue as a proportion of Scottish Government revenue staying stable between 2018-19 and 2019-20.
Looking at both revenue and capital figures combined, local government's share of the Scottish Government's budget decreased by 0.9 percentage points between 2013-14 and 2018-19. Local Government Finance Order figures suggest that this will increase very slightly, by 0.1 percentage points, between 2018-19 and 2019-20.
Ring-fenced funds
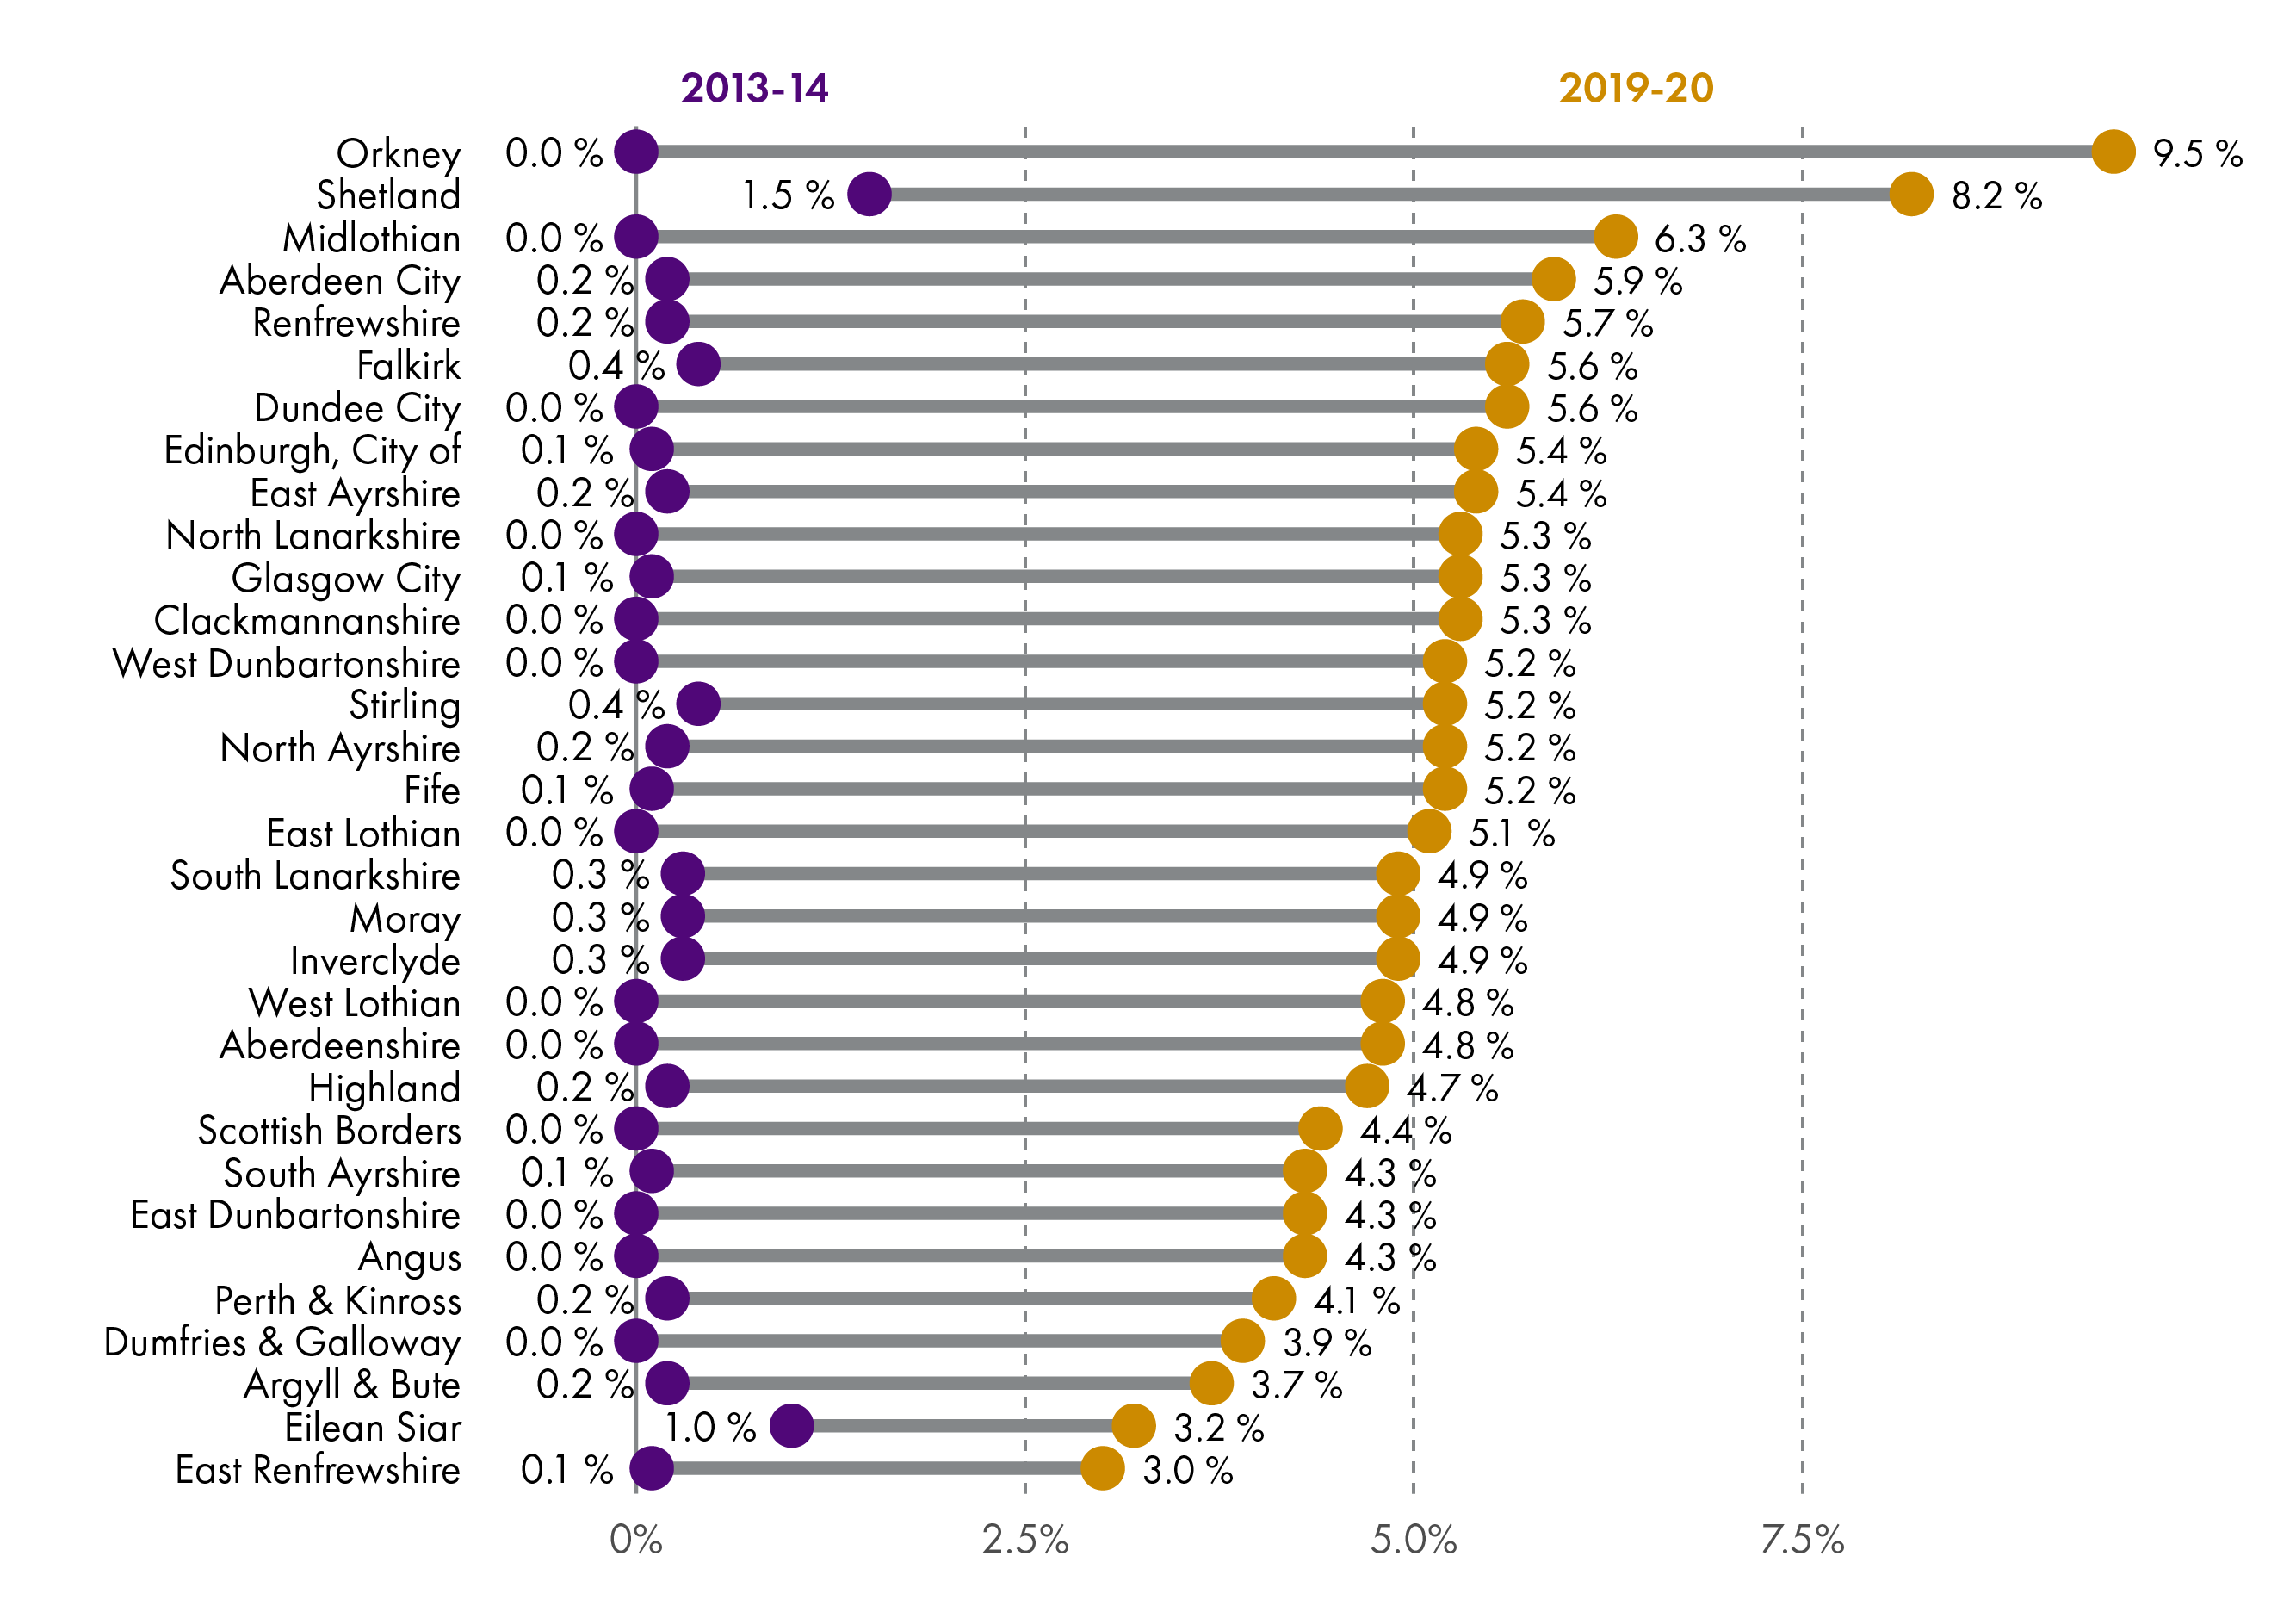
To provide some longer-term context, this briefing sets out ring-fenced funds as a proportion of Total revenue settlement, between 2013-14 and 2019-20. There are increases shown across all local authorities, ranging from 2.9 percentage points to 9.5 percentage points.
Local Government funding per head
The greatest reduction in real terms revenue funding per head between 2013-14 and 2019-20 has been for Eilean Siar, at £572. The greatest reduction in real terms revenue funding per head between 2013-14 and 2019-20 for a wholly mainland authority has been for Glasgow City, which has seen its funding per head reduce by £270.
Of the mainland authorities, North Ayrshire has seen the most minimal change to its real terms revenue funding per head, with a £32 decrease between 2013-14 and 2019-20. In the context of island authorities, Orkney has seen the smallest change to real terms revenue funding per head between 2013-14 and 2019-20, at -£90.
Council Tax
Following Council Tax reform in 2017-18, the Scottish Government capped Council Tax increases at 3% in 2017-18 and 2018-19. In 2019-20 this cap increased to 3% in real terms (4.79%). The implementation of changes has been varied, and as a result those councils with a higher proportion of high-band properties have remained at the higher end of the income range, and those with the lower proportion have remained at the lower end, but there are some exceptions to this as a result of councils making the most of the opportunities to increase income.
Introduction
This briefing presents a range of statistical information on local government finance, to help inform parliamentary debate and answer regular questions that SPICe receives. It is focussed on those areas most commonly covered during parliamentary business, primarily the local government finance settlement as set out in the Scottish Government's local government finance circulars. It is therefore not a comprehensive survey of local government finance, like the Scottish Government's Local Government Finance Statistics, or the Accounts Commission's Overview and Financial Overview reports.
This briefing updates an annual series. Please see the related briefings list for past iterations of this briefing and information on other SPICe work in this area.
Early in this briefing series, data stretched back to 1999, however, in the 2017 briefing1, the decision was taken to look at data from 2010-11 onwards only due to the increasing complexity of comparing local government finance over time. To further improve the time series and remove comparability issues relating to the removal of police and fire services from the local government settlement, the 2018 iteration of this briefing2 focused on local government finance from 2013-14 onwards. This approach has since been adopted by the Accounts Commission. The exception to this is the section on Council Tax and Non-Domestic Rates income (NDRI).
The data are drawn from a number of publicly available Scottish Government and local government publications. In most cases, data goes to 2019-20, but in some cases data (generally outturn data) is only available to 2017-18.
This briefing presents a number of figures in "real terms" to allow more meaningful year on year comparisons taking account of inflation. In most cases, real terms figures are in 2019-20 prices, using the latest HM Treasury deflators, as published in April 2019. Figures relating to Council Tax (and associated NDRI figures) are shown in cash terms.
A number of abbreviations are used in this briefing - a full list is available at the end of the briefing.
The local government settlement
Real terms change
A common way of assessing and analysing the total local government budget is to look at the real terms change over time. Using the methodology outlined in the 2018 iteration of this briefing1, long-term comparisons up to 2018-19 are made using outturn figures (with 2013-14 as the baseline year), and Local Government Finance Order (LGFO) figures are used to explore the trend between 2018-19 and 2019-20. This is because a number of additional allocations are typically made in -year, so outturn and provisional figures are not comparable to one another.
Figures in this section are presented in percentage terms, allowing for easy comparability between different years. Full figures can be found in the annex tables to this briefing.
As revenue figures represent the funding available for the delivery of services, and capital figures can vary widely year-on-year, there is a focus on revenue figures in these sections.
Figure 1 shows the annual real terms change in the local government revenue settlement, and demonstrates the difference between LGFO and outturn figures. Figures can be found in Annex Table 1.
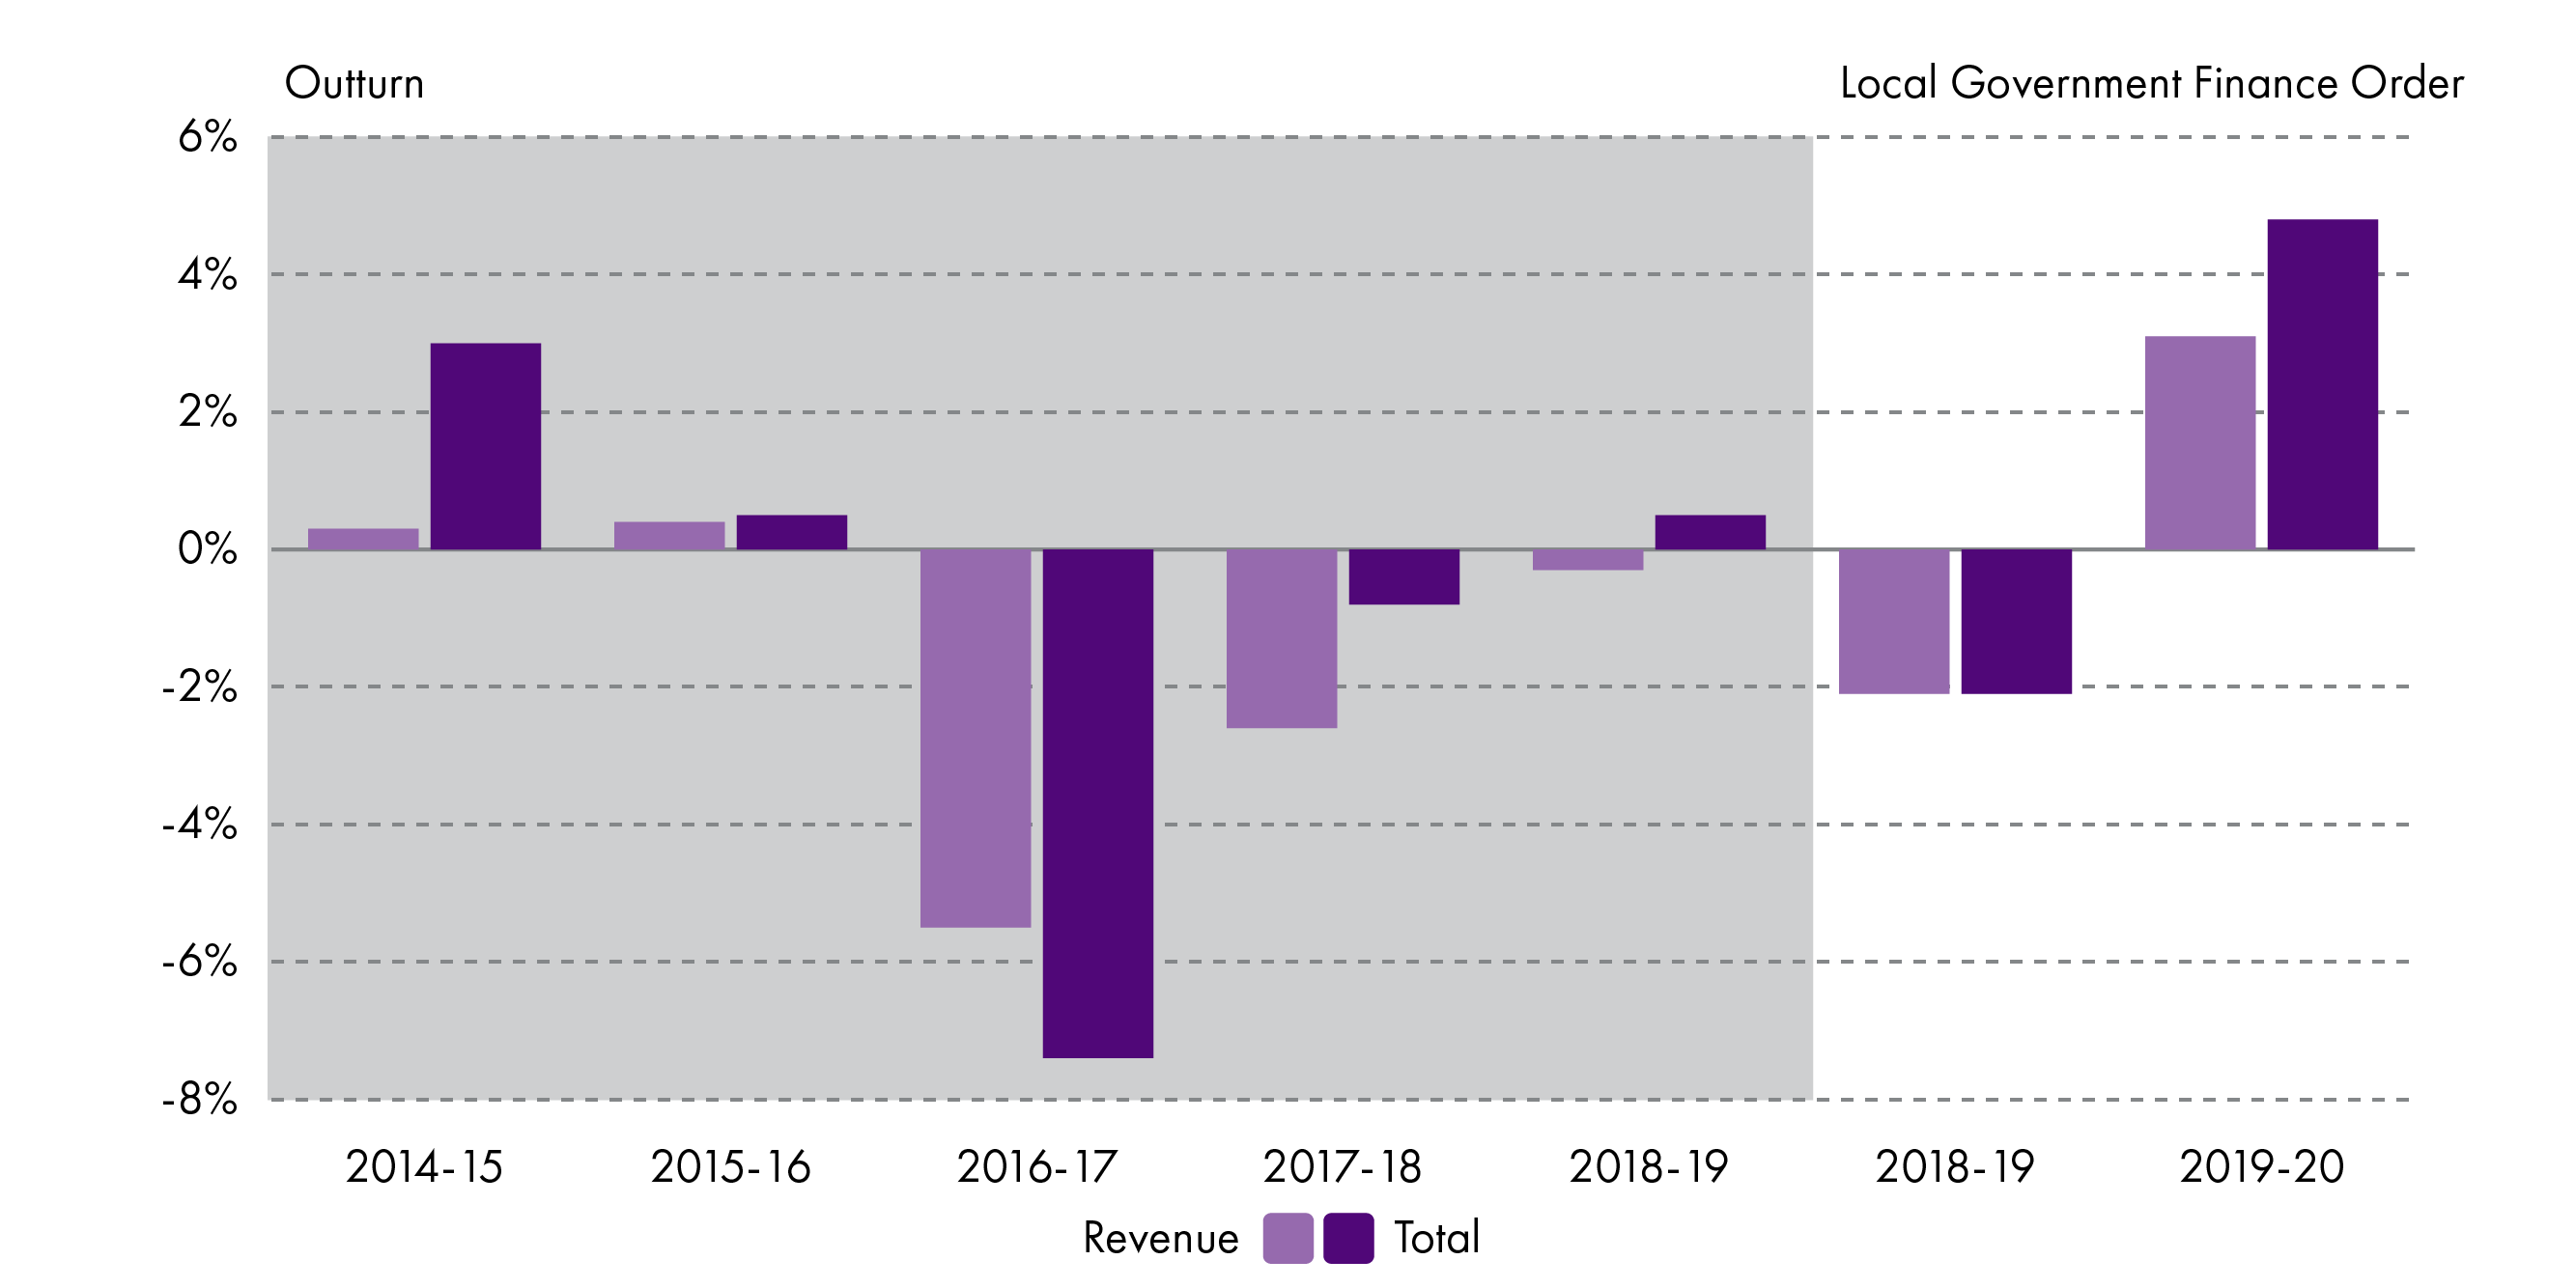
Figure 1 shows that, whilst the local government revenue settlement fell quite steeply in 2016-17, and again in 2017-18, this trend is reversing to an extent. Outturn figures from 2018-19 are higher than allocations published at the Local Government Finance Order stage, which suggests that figures for 2019-20 will also be higher.
Local government and Scottish Government comparison
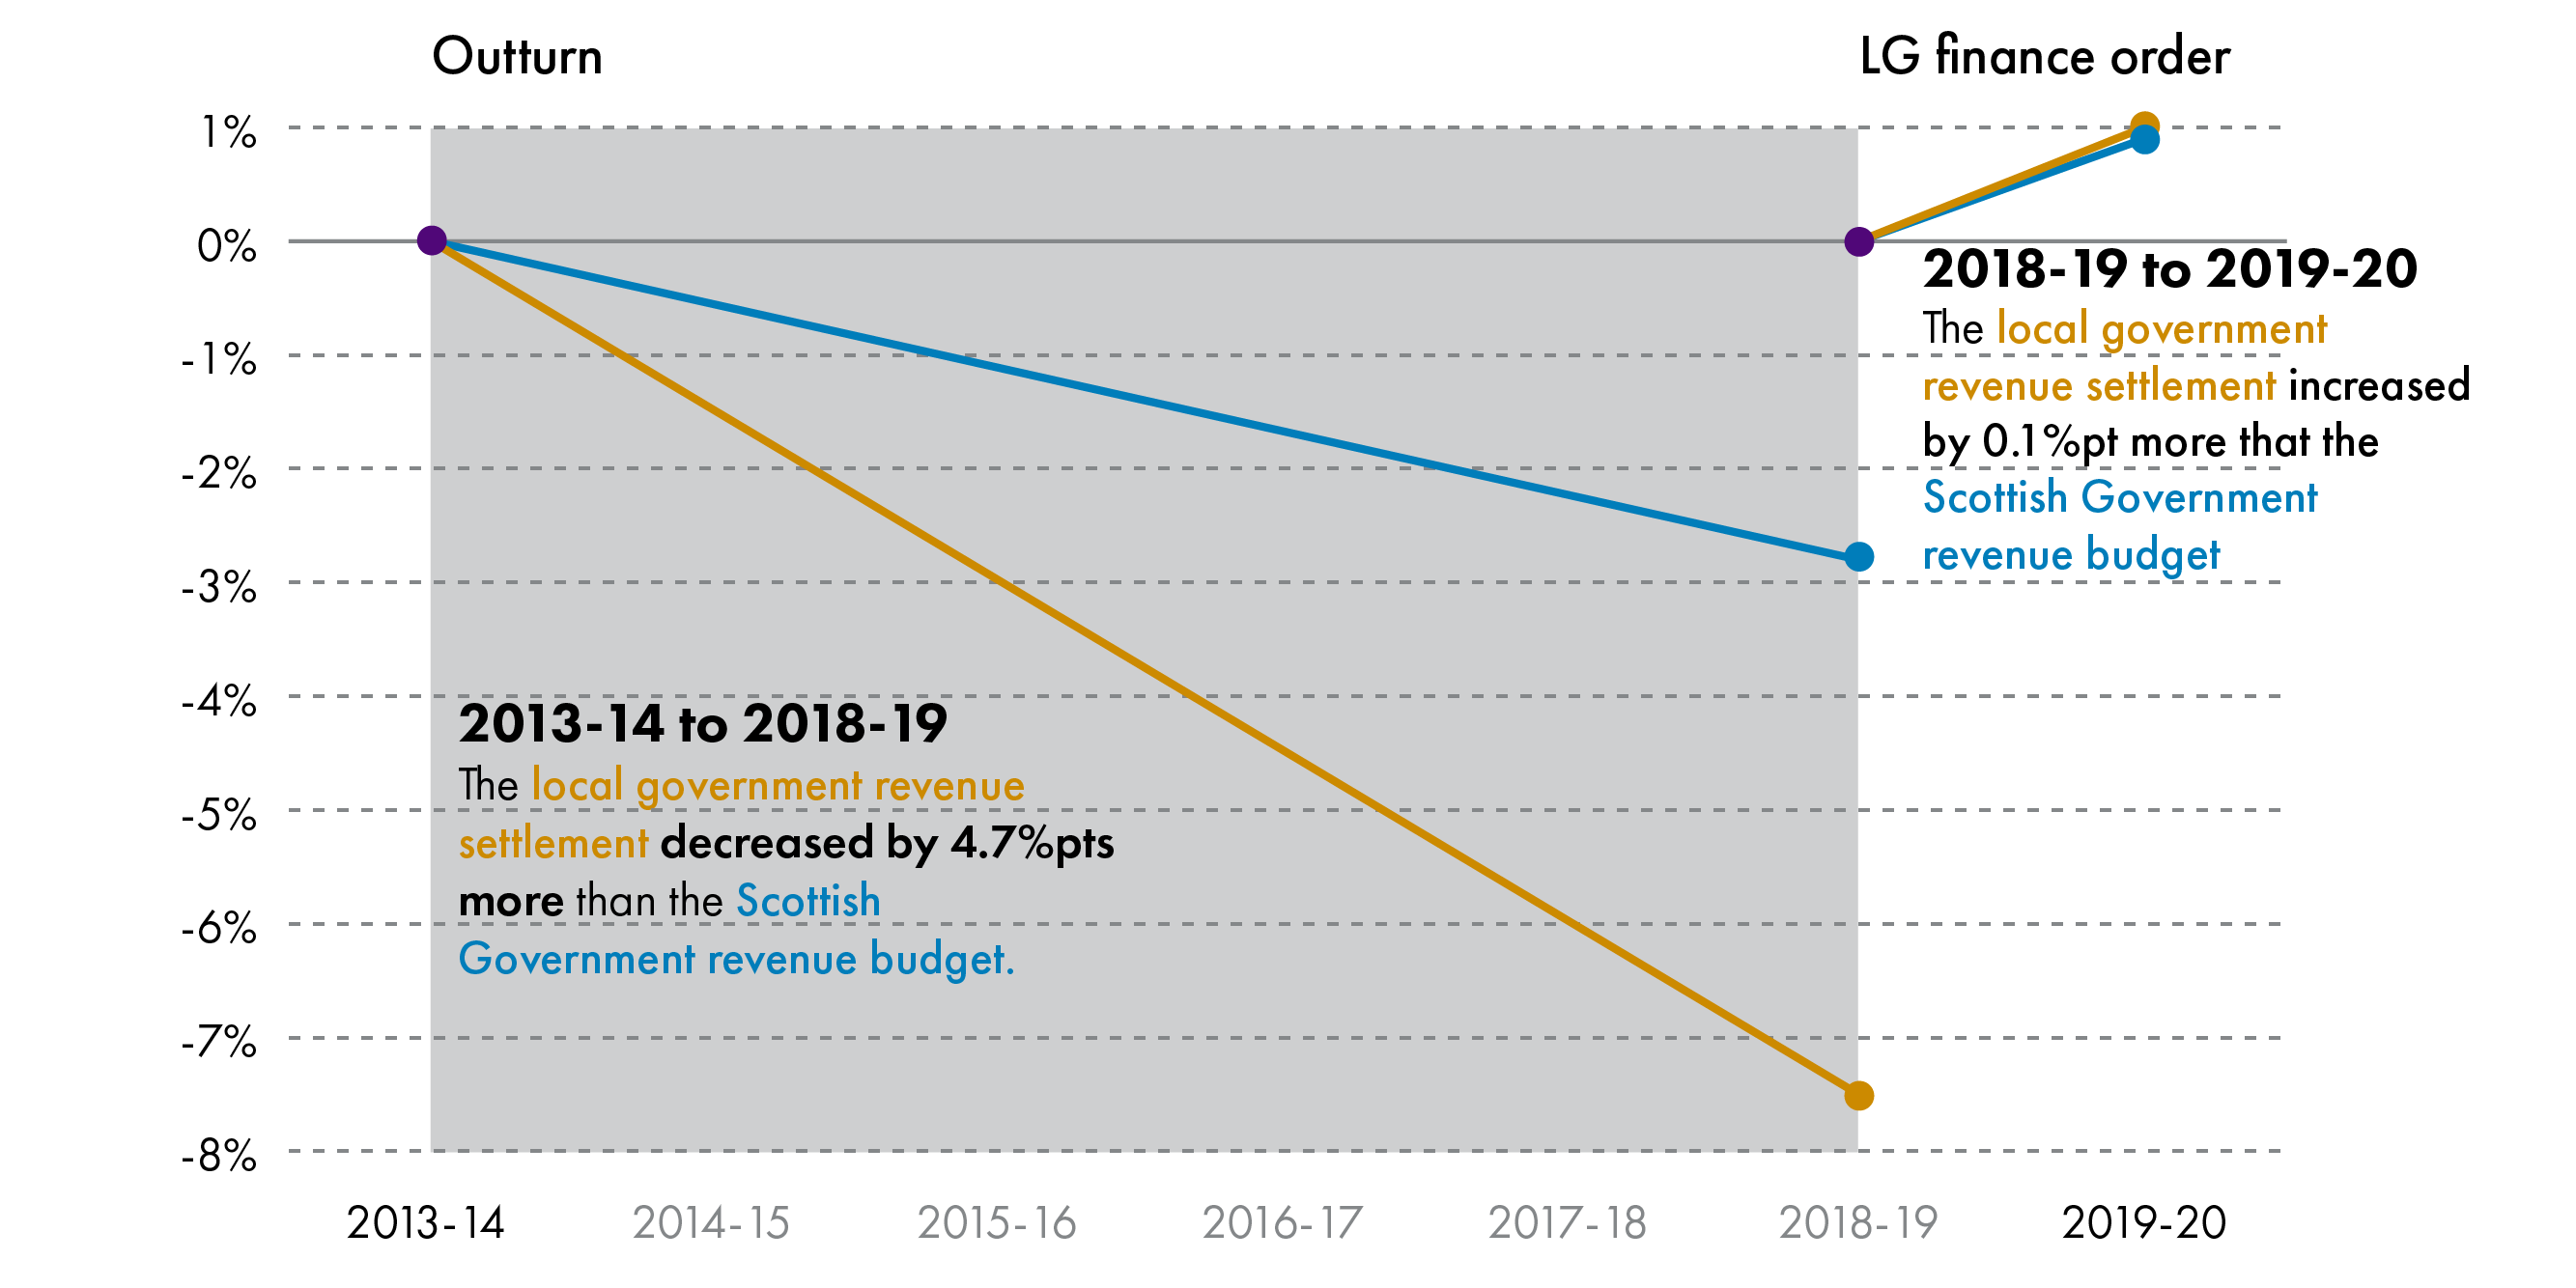
Figure 2 compares long-term changes to the local government revenue settlement to those in the Scottish Government revenue budget.
The real terms change figures show that between 2013-14 and 2018-19, the local government revenue settlement decreased at a much faster rate (-7.5% or -£810 million) than the Scottish Government revenue budget (-2.8% or -£870.4 million). Non-Domestic Rates Income is included in both local government and Scottish Government figures.
However, the trend is reversed when looking at the LGFO figures for 2018-19 to 2019-20 - here the revenue settlement for local government increases by 1%, andthe Scottish Government's revenue budget increases by 0.9%. This suggests that the gap between funding changes for local government and the Scottish Government may begin to narrow again.
Share of the Scottish Government Budget
In this section, local government's percentage share of the Scottish Government's budget since 2013-14 is presented.
In these calculations, the revenue and capital figures are presented separately, along with the total for the local government settlement. Therefore, to make the figures comparable, the Scottish Government figures include all fiscal revenue DEL (more recently titled Fiscal Resource Budget Limit in Budget documents) and NDRI.
Figure 3 looks at the local government revenue, capital and total settlement as a proportion respectively of the Scottish Government's revenue, capital and total budget.
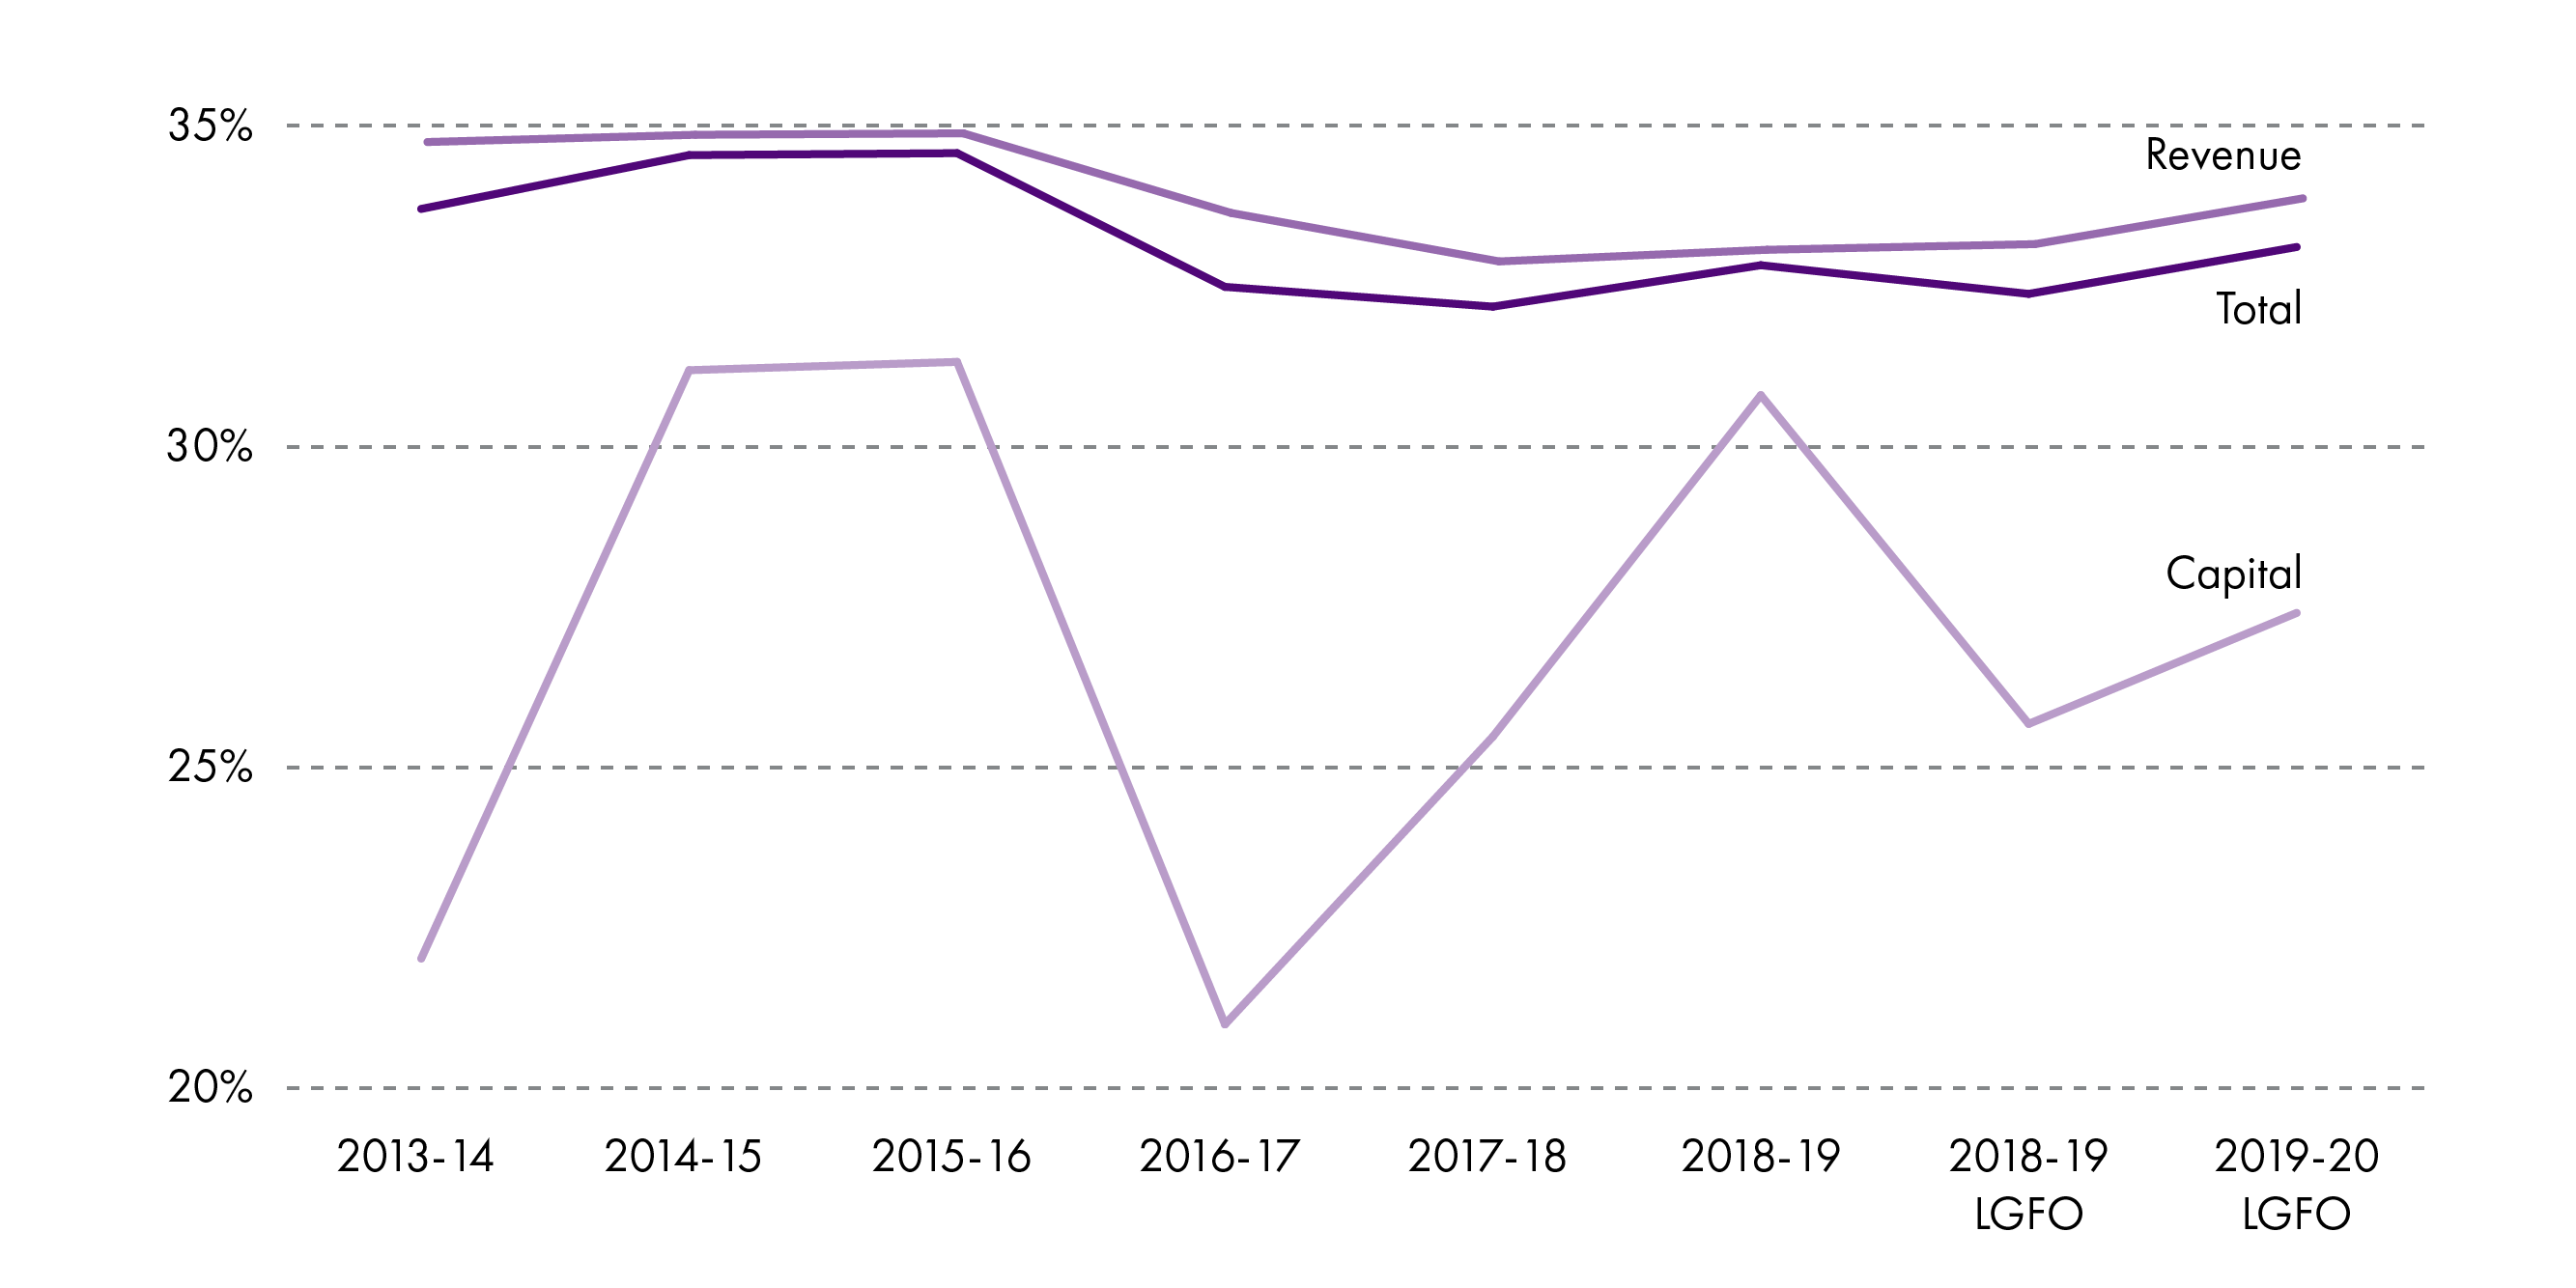
As noted, it is important to look at revenue and capital figures separately, as revenue funding alone represents the funding available for local authorities to deliver services. It should also be noted that capital figures can vary widely year-on-year.
Revenue figures:
The local government revenue settlement as a proportion of the Scottish Government revenue budget decreased by 1.7 percentage points between 2013-14 and 2018-19.
LGFO figures show Local Government revenue as a proportion of Scottish Government revenue staying stable between 2018-19 and 2019-20.
Capital figures:
As noted, capital figures, by comparison, vary much more widely than revenue figures, which can be seen from the chart. This is mainly because the capital grant was re-profiled over a number of years. The re-profiling was as follows:
-£100 million in 2013-14
+£120 million in 2014-15
+£94.2 million in 2015-16
-£150 million in 2016-17
+£150 million in 2019-20.
This is important particularly for the reduction in total funding in 2016-17 as 2015-16 was artificially high by £94.2 million, and 2016-17 artificially low by £150 million.
Total settlement:
Looking at both revenue and capital figures combined, local government's share of the Scottish Government's budget decreased by 0.9 percentage points between 2013-14 and 2018-19.
LGFO figures suggest that this will increase very slightly, by 0.1 percentage points, between 2018-19 and 2019-20.
Ring-fenced funds
There has been much debate over ring-fencing and what constitutes a "protected" area of the budget during recent Budget rounds. As part of its 2019-20 Budget scrutiny, the Local Government and Communities Committee wrote to the Cabinet Secretary for Communities and Local Government, and said:
Looking forward, the Committee encourages the Scottish Government to consult with COSLA to agree a common language for core budget terms, including agreement on what constitutes specific “ring-fenced” funding and “non-discretionary” or “protected/unprotected” funding.
Local Government and Communities Committee. (2019, January 23). Correspondence from the Convener to the Cabinet Secretary for Finance, Economy and Fair Work and the Cabinet Secretary for Communities and Local Government of 23 January 2019. Retrieved from https://www.parliament.scot/S5_Local_Gov/Inquiries/20190123_Budget_ConvenerToCabSecs.pdf
The Cabinet Secretary responded:
To compare annual local government finance settlements by excluding the ring-fenced funding (as SPICe did this year at the request of individual MSPs) does not paint a complete picture as this is real money to spend on real core services, as COSLA themselves agreed, such as the Early Learning and Childcare Expansion and the Pupil Equity Funding. Unfortunately, I do not see there is anything the Scottish Government can do to stop such analysis other than to continue to point out the fundamental flaws in such an approach. We will however continue to review the presentation of the local government funding position for future Budget documents in an effort to further improve both the transparency and the ease of understanding for the Committee and other external commentators.
Scottish Government. (2019, February 8). Correspondence from the Cabinet Secretary for Finance, Economy and Fair Work and the Cabinet Secretary for Communities and Local Government to the Convener of 8 February 2019. Retrieved from https://www.parliament.scot/S5_Local_Gov/Inquiries/20190208_Budget_CabSecFEFW_CabSecLGCToConvener.pdf
COSLA argued in its publication, Fair Funding for Essential Services 2019/203, that "Scottish Government policies continue to protect 58% of the available budget".
The Accounts Commission, in its 2019 Challenges and performance report state that:
Alongside the specific revenue funding set out in the settlement, several of the Scottish Government’s policy initiatives have funding attached to them. Although these are not explicitly ring-fenced, if the council does not meet the objectives it may lose out on the funding. These have grown from 3.8 per cent of total revenue funding in 2018/19 to 7.1 per cent in 2019/20 and are predominantly for education and social care services.
Accounts Commission. (2019, March 21). Local government in Scotland: Challenges and performance 2019. Retrieved from http://www.cosla.gov.uk/system/files/private/fairfundingforessentialservices2019-20.pdf [accessed 21 June 2019]
Having explored the impact that ring-fenced grants have on the overall local government settlement, and received requests for this specific information from MSPs, SPICe explored this data further as part of its 2019-20 Budget analysis5. It is likely that the Committee, and other stakeholders will return to this discussion, and work to progress to reach a shared understanding of what constitutes core funding. Therefore, it's likely that this area will be revisited in future SPICe publications.
To provide some longer-term context, figure 4 explores, based on Local Government Finance Order figures, ring-fenced funds (that is, "specific revenue grants") as a proportion of Total Revenue settlement, between 2013-14 and 2019-20.
Local Government Finance Circular 2/2013Scottish Government. (2013, March 15). Local government finance circular 2/2013. Retrieved from https://www.gov.scot/publications/local-government-finance-circular-22013-settlement-2013-2014-changes-2012-2013-amendment/ [accessed 26 June 2019], Annex B, Columns 7 and 13, and Local Government Finance Circular 2/2019Scottish Government. (2019, March 7). Local government finance circular 2/2019. Retrieved from https://www.gov.scot/publications/local-government-finance-circular-2-2019-settlement-for-2019-2020/ [accessed 26 June 2019], Annex B, Columns 7 and 12.
Local Government settlement per head
One way of looking at changes in the local government settlement over time is to explore the impact on funding for local authorities per head. The SPICe Briefing Local Government Finance: Draft Budget 2019-20 and provisional allocations to local authorities1 explores the 2019-20 Draft Budget figures, but not the longer term trends.
In order to provide a comparable trend over time, up to the current year, all figures in this section have been taken from the Local Government Finance Order stage of the budget process as opposed to using final outturn figures. Real terms figures are detailed in Annex Table 5, and full tables are available from SPICe on request. Population figures for 2019-20 are taken from the most recent available data, from mid-2018, and previous years are taken from an equivalent point (i.e. 2017 figures for 2018-19 and so forth).
Because of adjustments made to the settlement package for island authorities, the narrative differentiates between island and mainland authorities.
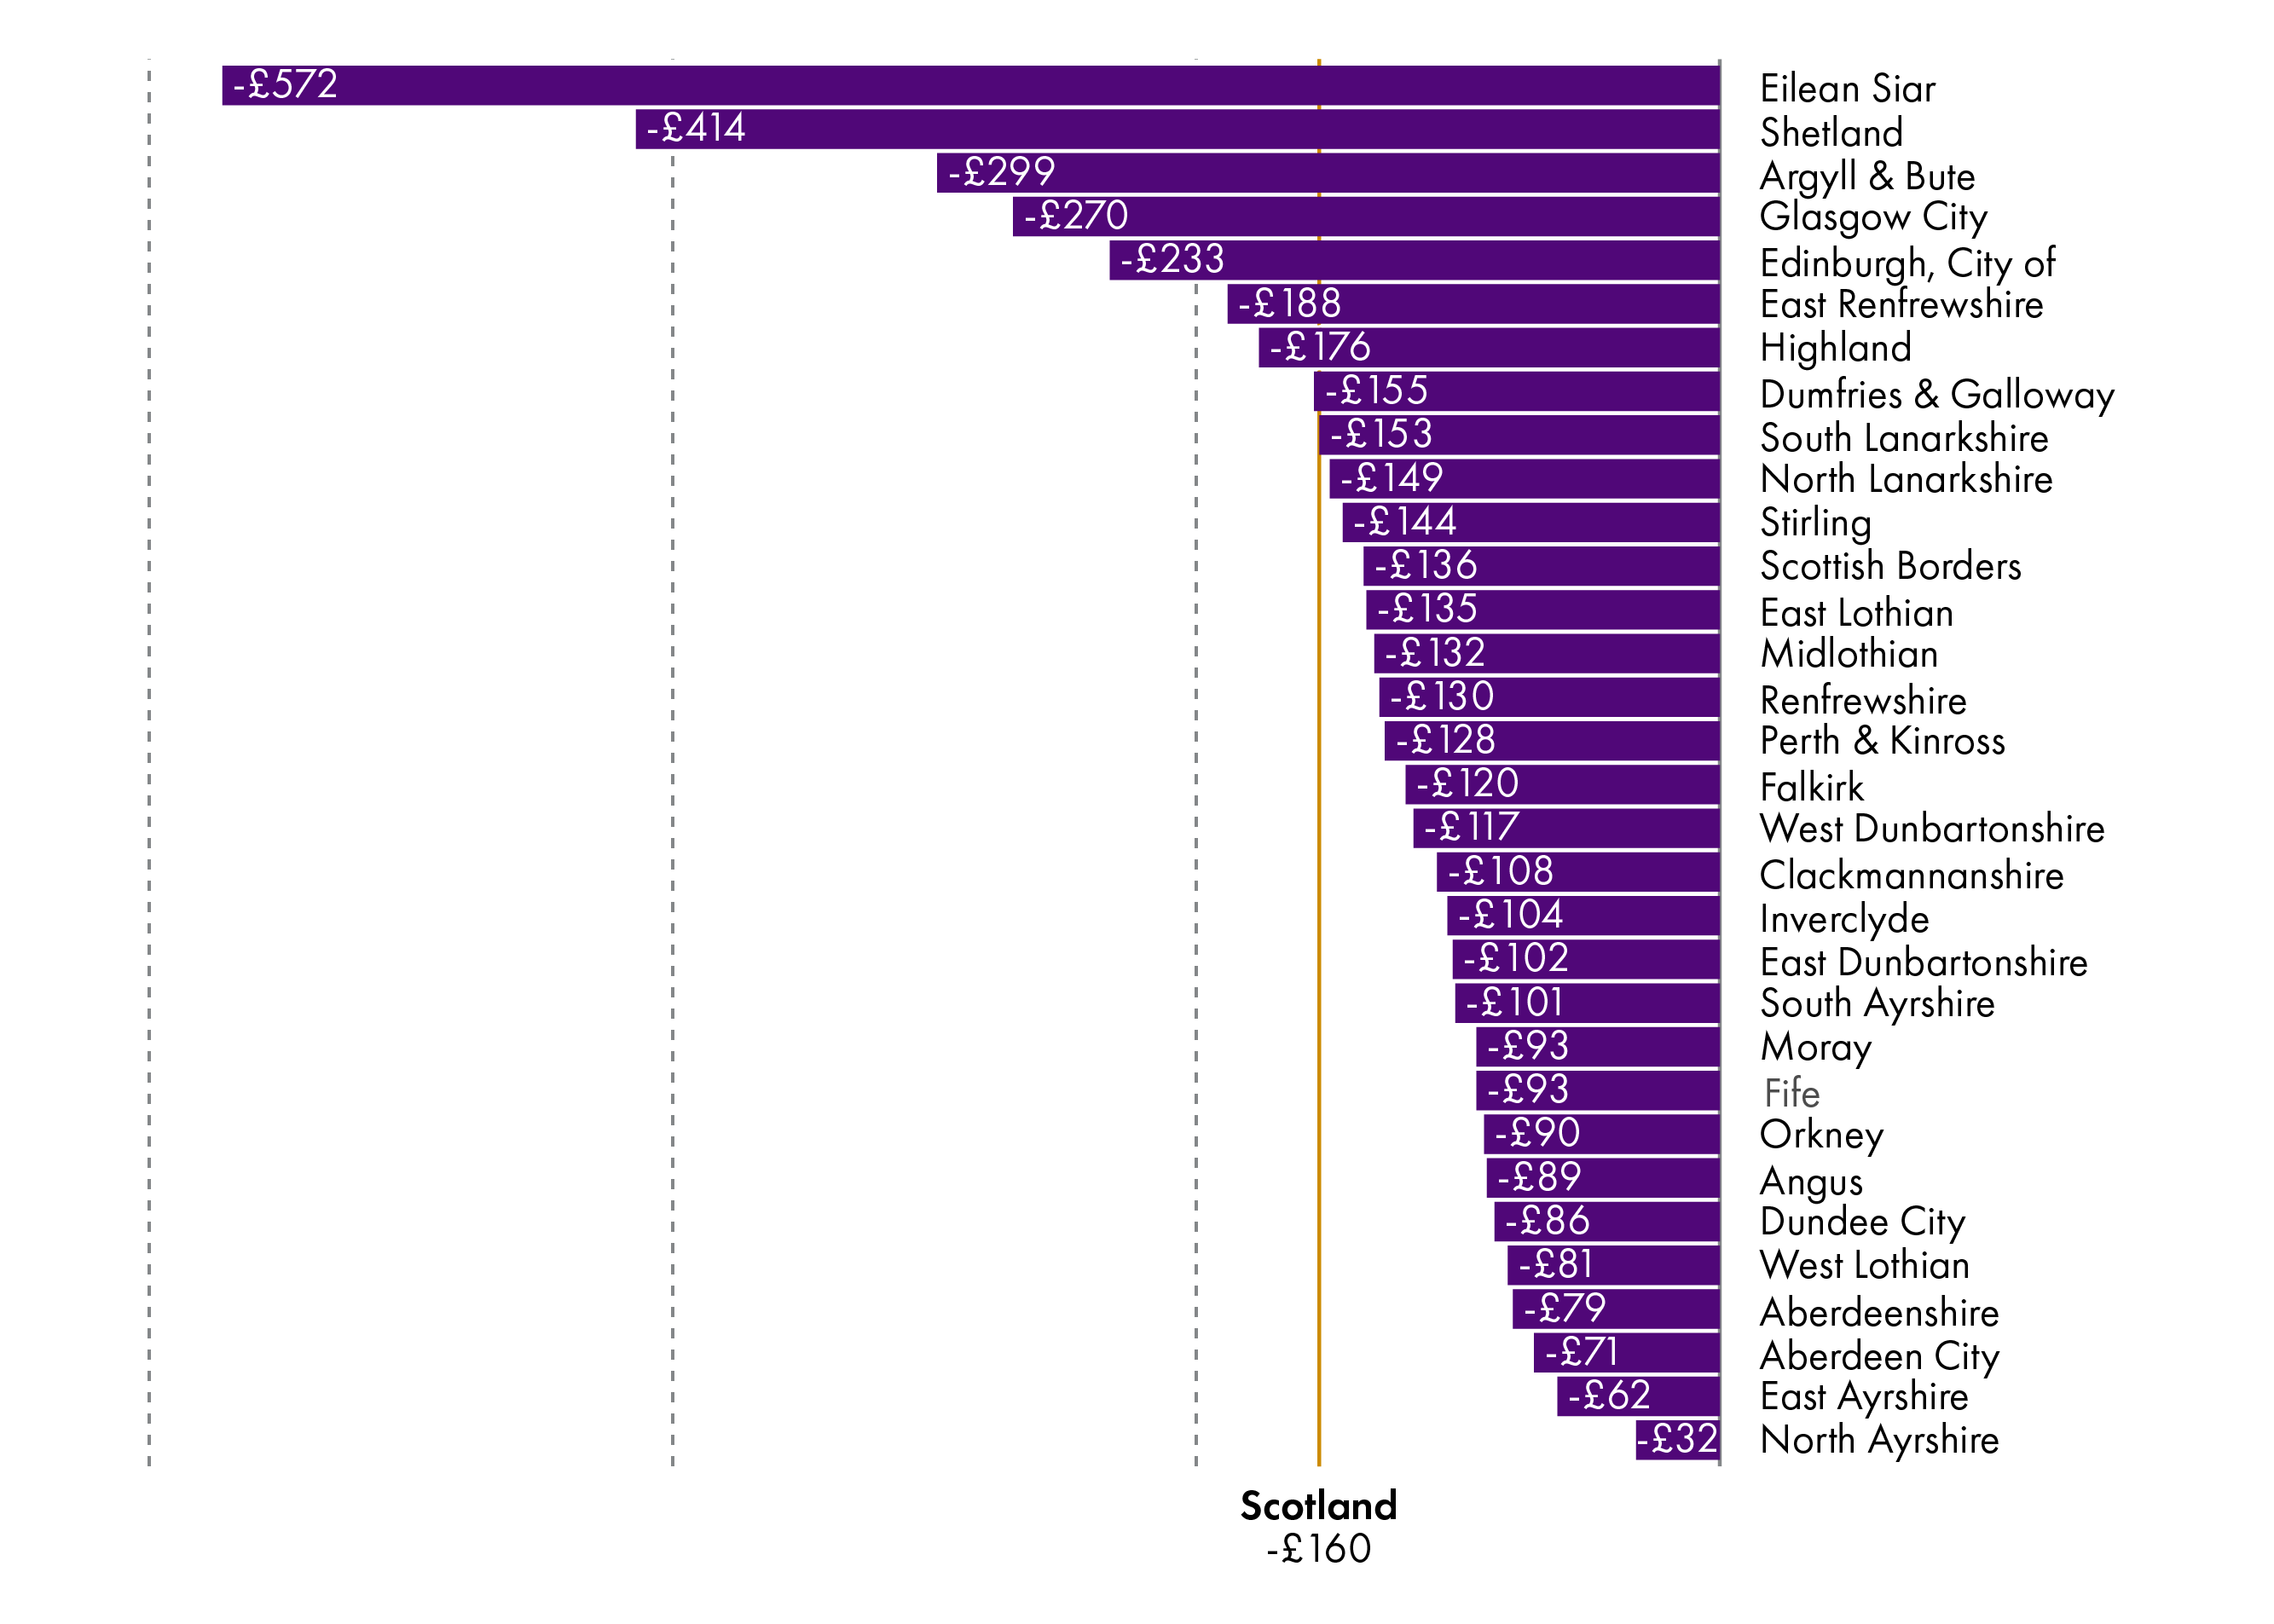
Figure 4 shows the change in £ funding per head across all local authorities.
The greatest reduction in real terms revenue funding per head between 2013-14 and 2019-20 has been for Eilean Siar, at £572. The greatest reduction in real terms revenue funding per head between 2013-14 and 2019-20 for a wholly mainland authority has been for Glasgow City, which has seen its real terms revenue funding per head reduce by £270.
Of the mainland authorities, North Ayrshire has seen the most minimal change to its real terms revenue funding per head, with a £32 decrease between 2013-14 and 2019-20. In the context of island authorities, Orkney has seen the smallest change to real terms revenue funding per head between 2013-14 and 2019-20, at -£90.
Funding change vs population change
It's important to note that changes to per head funding do not simply represent changes to the revenue settlement - they also reflect population changes, so the figures below should be attributed to a combination of funding changes and population changes as opposed to solely funding changes. This was explored in more detail in a June 2018 SPICe blog1, and the visualisation methodology has been updated to include the most recent figures.
The figure below sets out the detail on real terms funding per head changes as a visual. Here we can see more clearly the changes in population and funding by local authority.
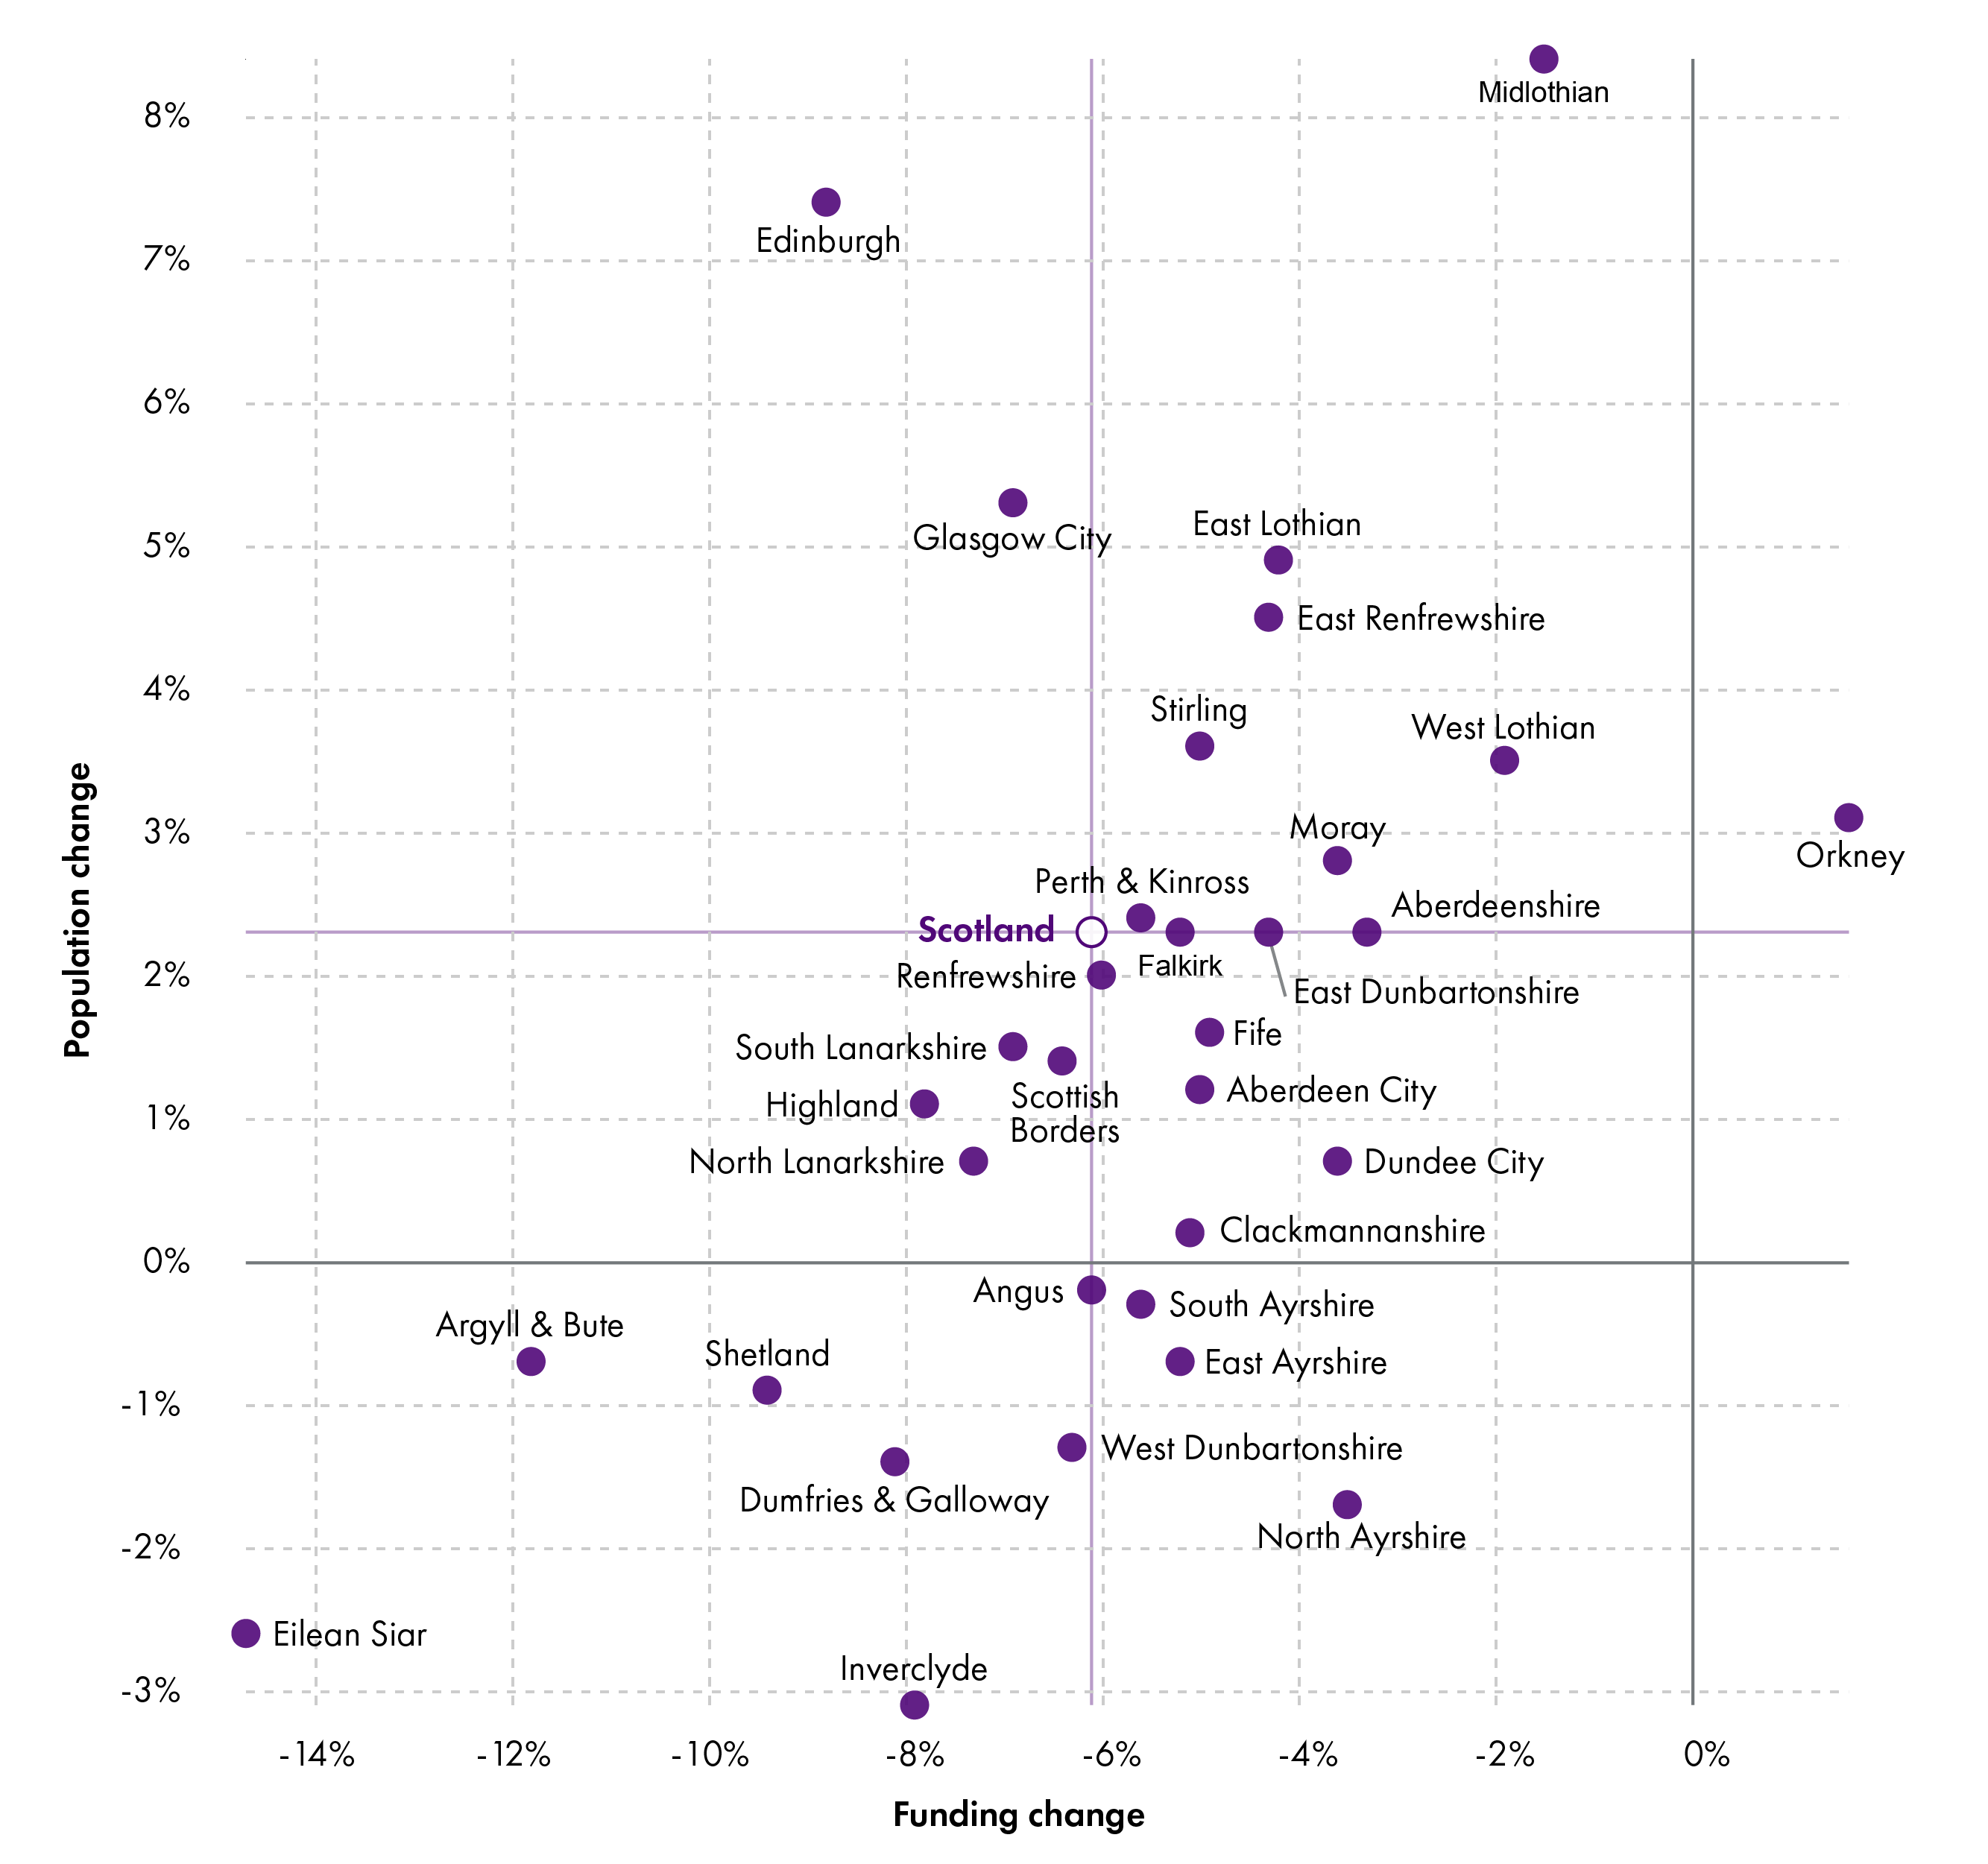
We can see here, for example, that Eilean Siar and Argyll and Bute have experienced not just a reduction in population, but a reduction in funding. Edinburgh’s population has grown significantly, as has that of Midlothian, but Edinburgh has seen a much higher reduction in funding per head. 22 of Scotland's 32 local authorities have increased population growth between 2013-14 and 2019-20, ranging from 0.2% in Clackmannanshire to 8.4% in Midlothian, but all but one of these local authorities (Orkney) has seen a reduction in real terms per head revenue funding.
Per head funding as a % of the Scottish average
Figure 6 shows changes to the percentage of the Scottish average per head funding by local authority. It's worth noting that the high populations of Edinburgh and Glasgow, and falling per head figures in those local authorities, have skewed the Scottish per head average.
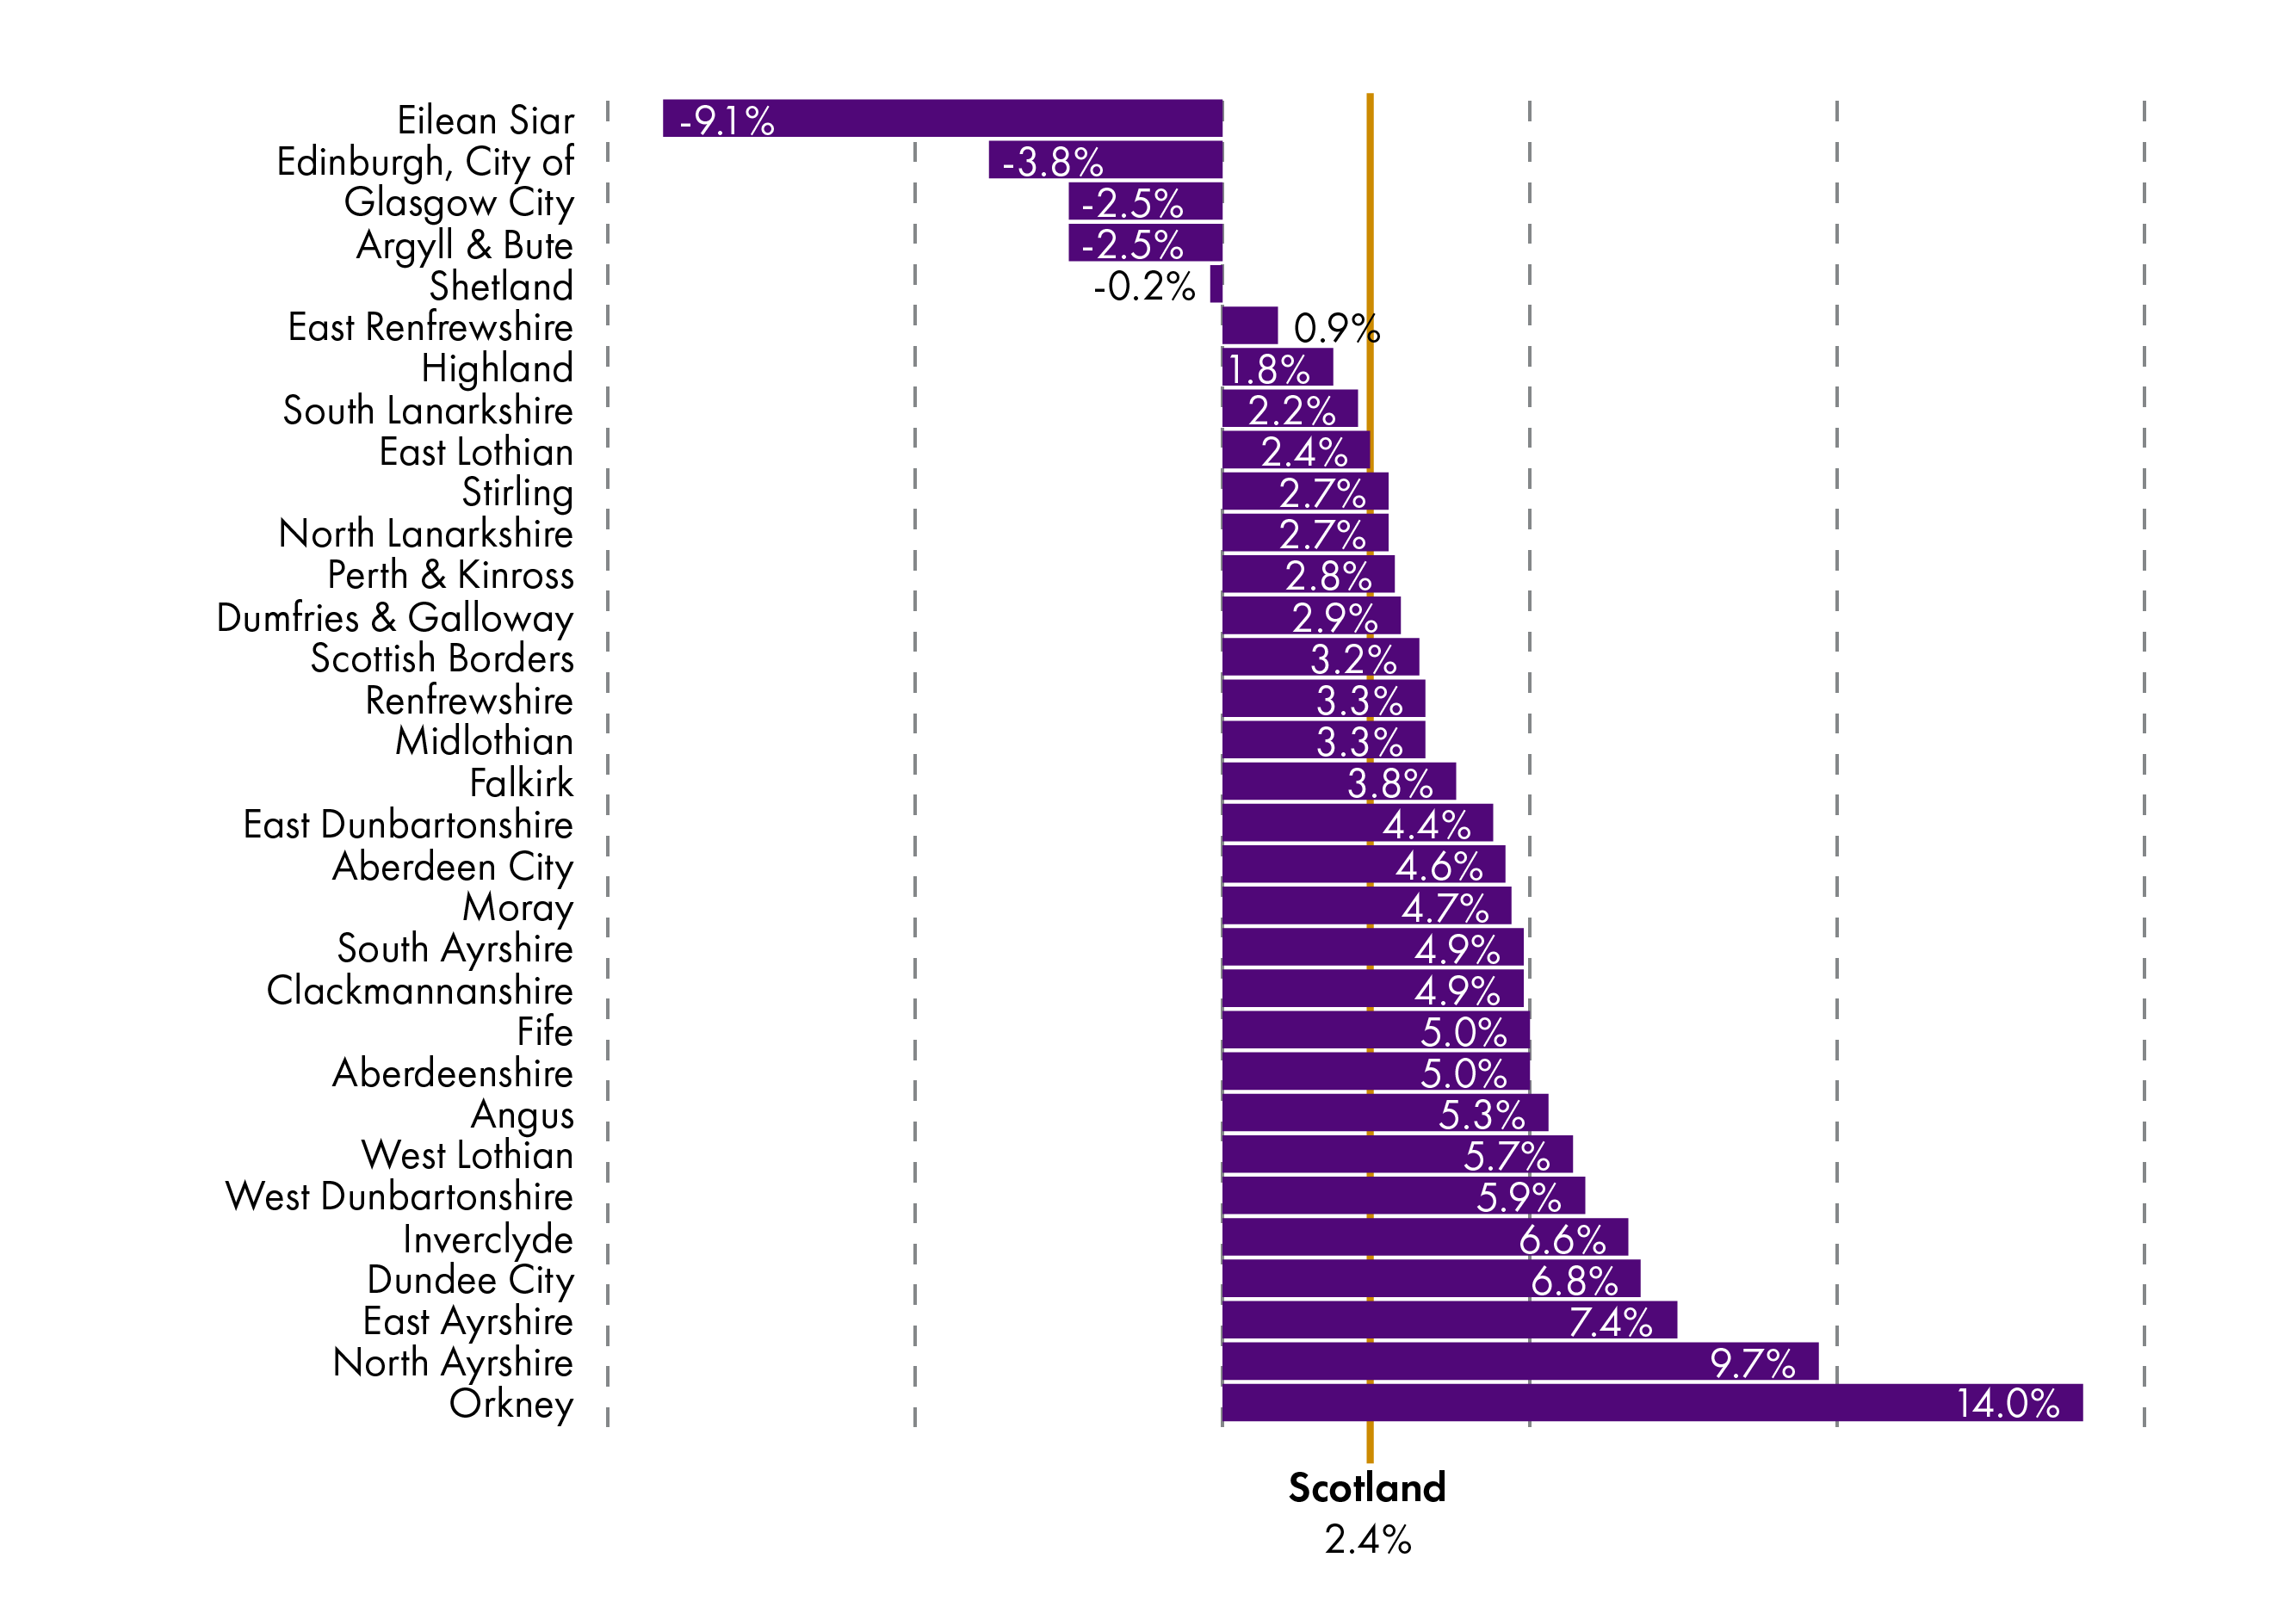
Amongst the mainland authorities, City of Edinburgh has seen its funding per head, as a percentage of the Scottish average, fall by 3.7 percentage points between 2013-14 and 2019-20.
North Ayrshire, by comparison, has seen the greatest increase of the mainland authorities to its funding per head as a percentage of the Scottish Average, with a 9.7 percentage point uplift.
The island authority with the greatest percentage point change is Eilean Siar, with a 9.1 percentage point decrease between 2013-14 and 2018-19. Orkney has seen, by comparison, a 14.0 percentage point increase.
Council Tax and Non Domestic Rates
Non-domestic Rates (NDR) are collected by individual councils and pooled by the Scottish Government, who then redistribute it to councils as part of the overall annual local government revenue funding settlement. This is an accounting exercise and local authorities do not actually transfer all their NDR income (NDRI) to Government. Rather, an adjustment is made at the end of the year dependent on what each local authority has collected and what its share of the distributable amount is. Council Tax is, by comparison, collected directly by local authorities and retained. The Scottish Government set the ratios between Council Tax bands, and apply a cap on annual increases, but local authorities have discretion on increases within this cap. Council Tax reform was implemented in 2017-18 - detail on these reforms and the impact can be found in the 2018 iteration1 of this briefing.
The Scottish Government guarantees the combined General Resource Grant and distributable NDRI figure, approved by Parliament, to each local authority. If NDRI is lower than forecast, this is compensated for by an increase in GRG and vice versa. Therefore, to calculate Local Government's revenue settlement, the combined GRG + NDRI figure is used.
Figure 7 looks at the relative proportion of total funding that revenue grants provided by the Scottish Government, NDRI and Council Tax income represent - in this case NDRI and GRG have been separated out to give an indication of expected proportions. Figures can be found in the Annex. It's important to note that this does not represent the total amount of funding available for local authorities - it does not include, for instance, income collected directly by councils through fees and charges for services, any funding delivered to councils which is not set out in the Local Government Finance Circulars (for instance funding for Health and Social Care Integration), or capital funding.
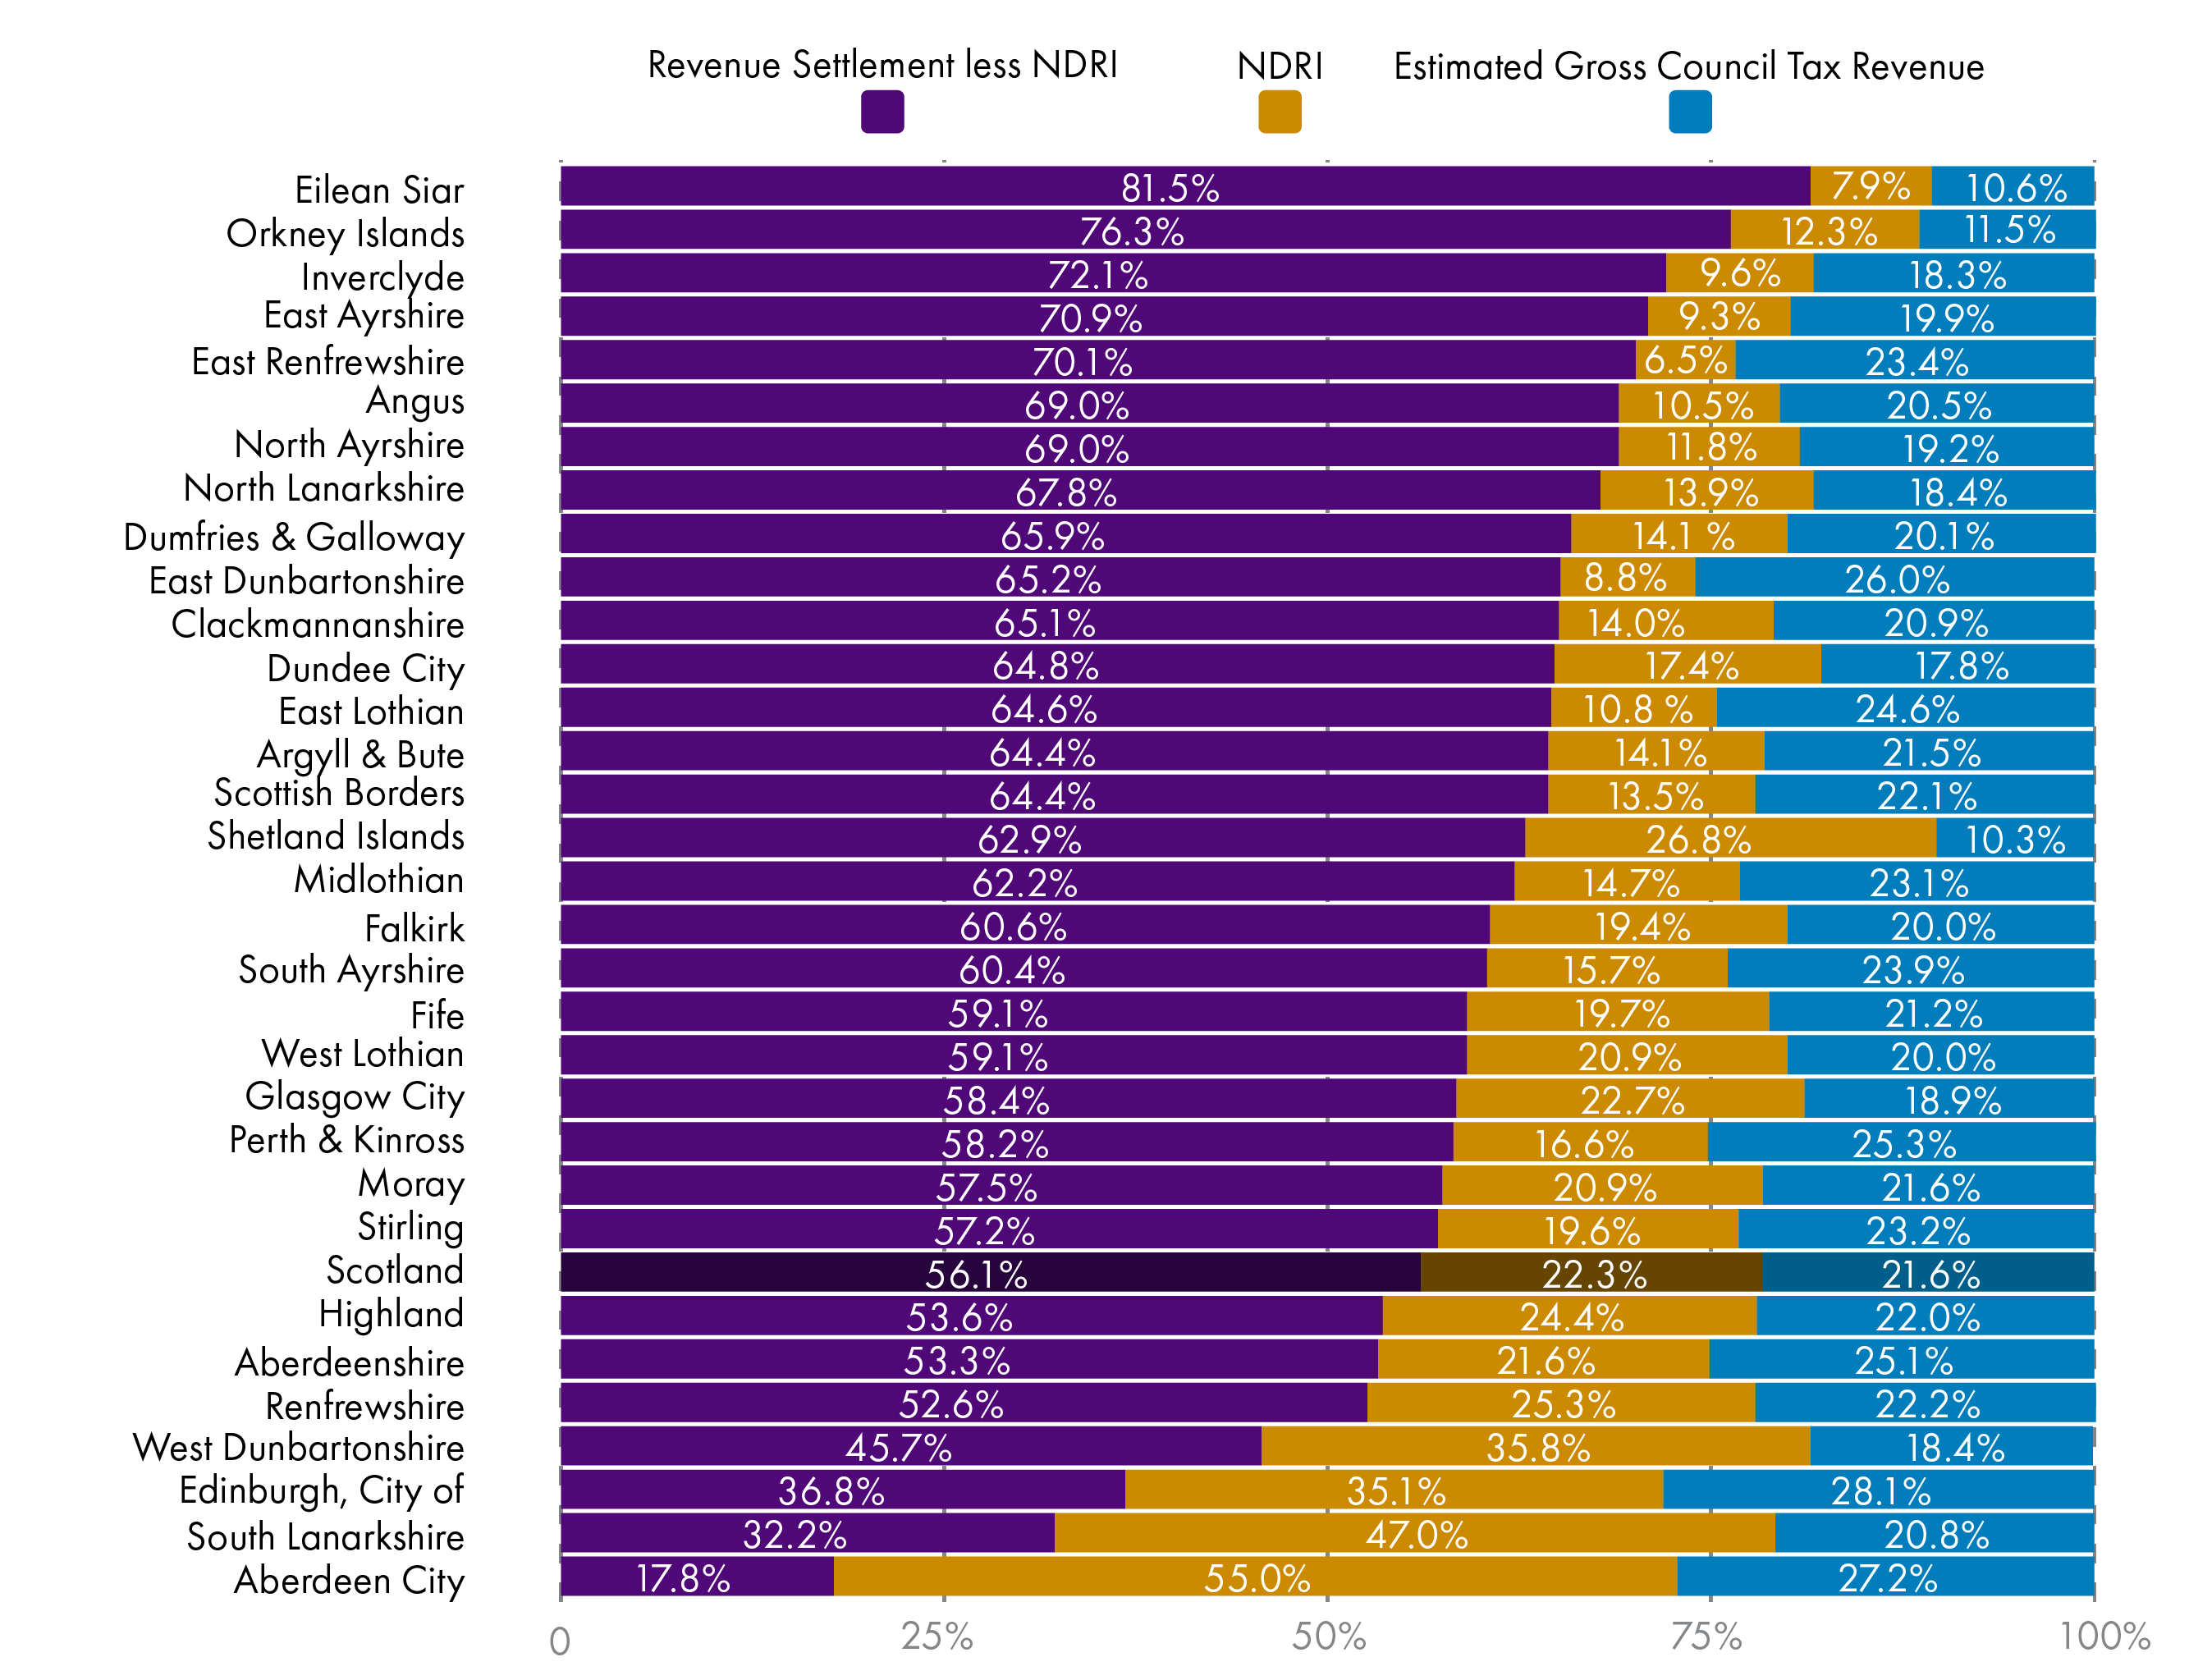
These figures serve to highlight the varying structure of local government revenue funding across local authorities. Some local authorities rely far more heavily on the revenue grant provided by the Scottish Government and have relatively limited ability to raise funding through taxation, and others see the majority of their funding coming from Council Tax and NDR Income.
Council Tax and NDR income levels
Figure 8 below shows the trend in income from Council Tax and Non-Domestic Rates since 2010.
With NDR, the Scottish Government sets an annual "distributable amount" (DA), based on forecast collected revenue and on policy choice. The distributable amount of NDR is distributed to councils on the basis of their share of the previous year's mid-year estimated income. The NDR Account may be in surplus or in deficit as a result.
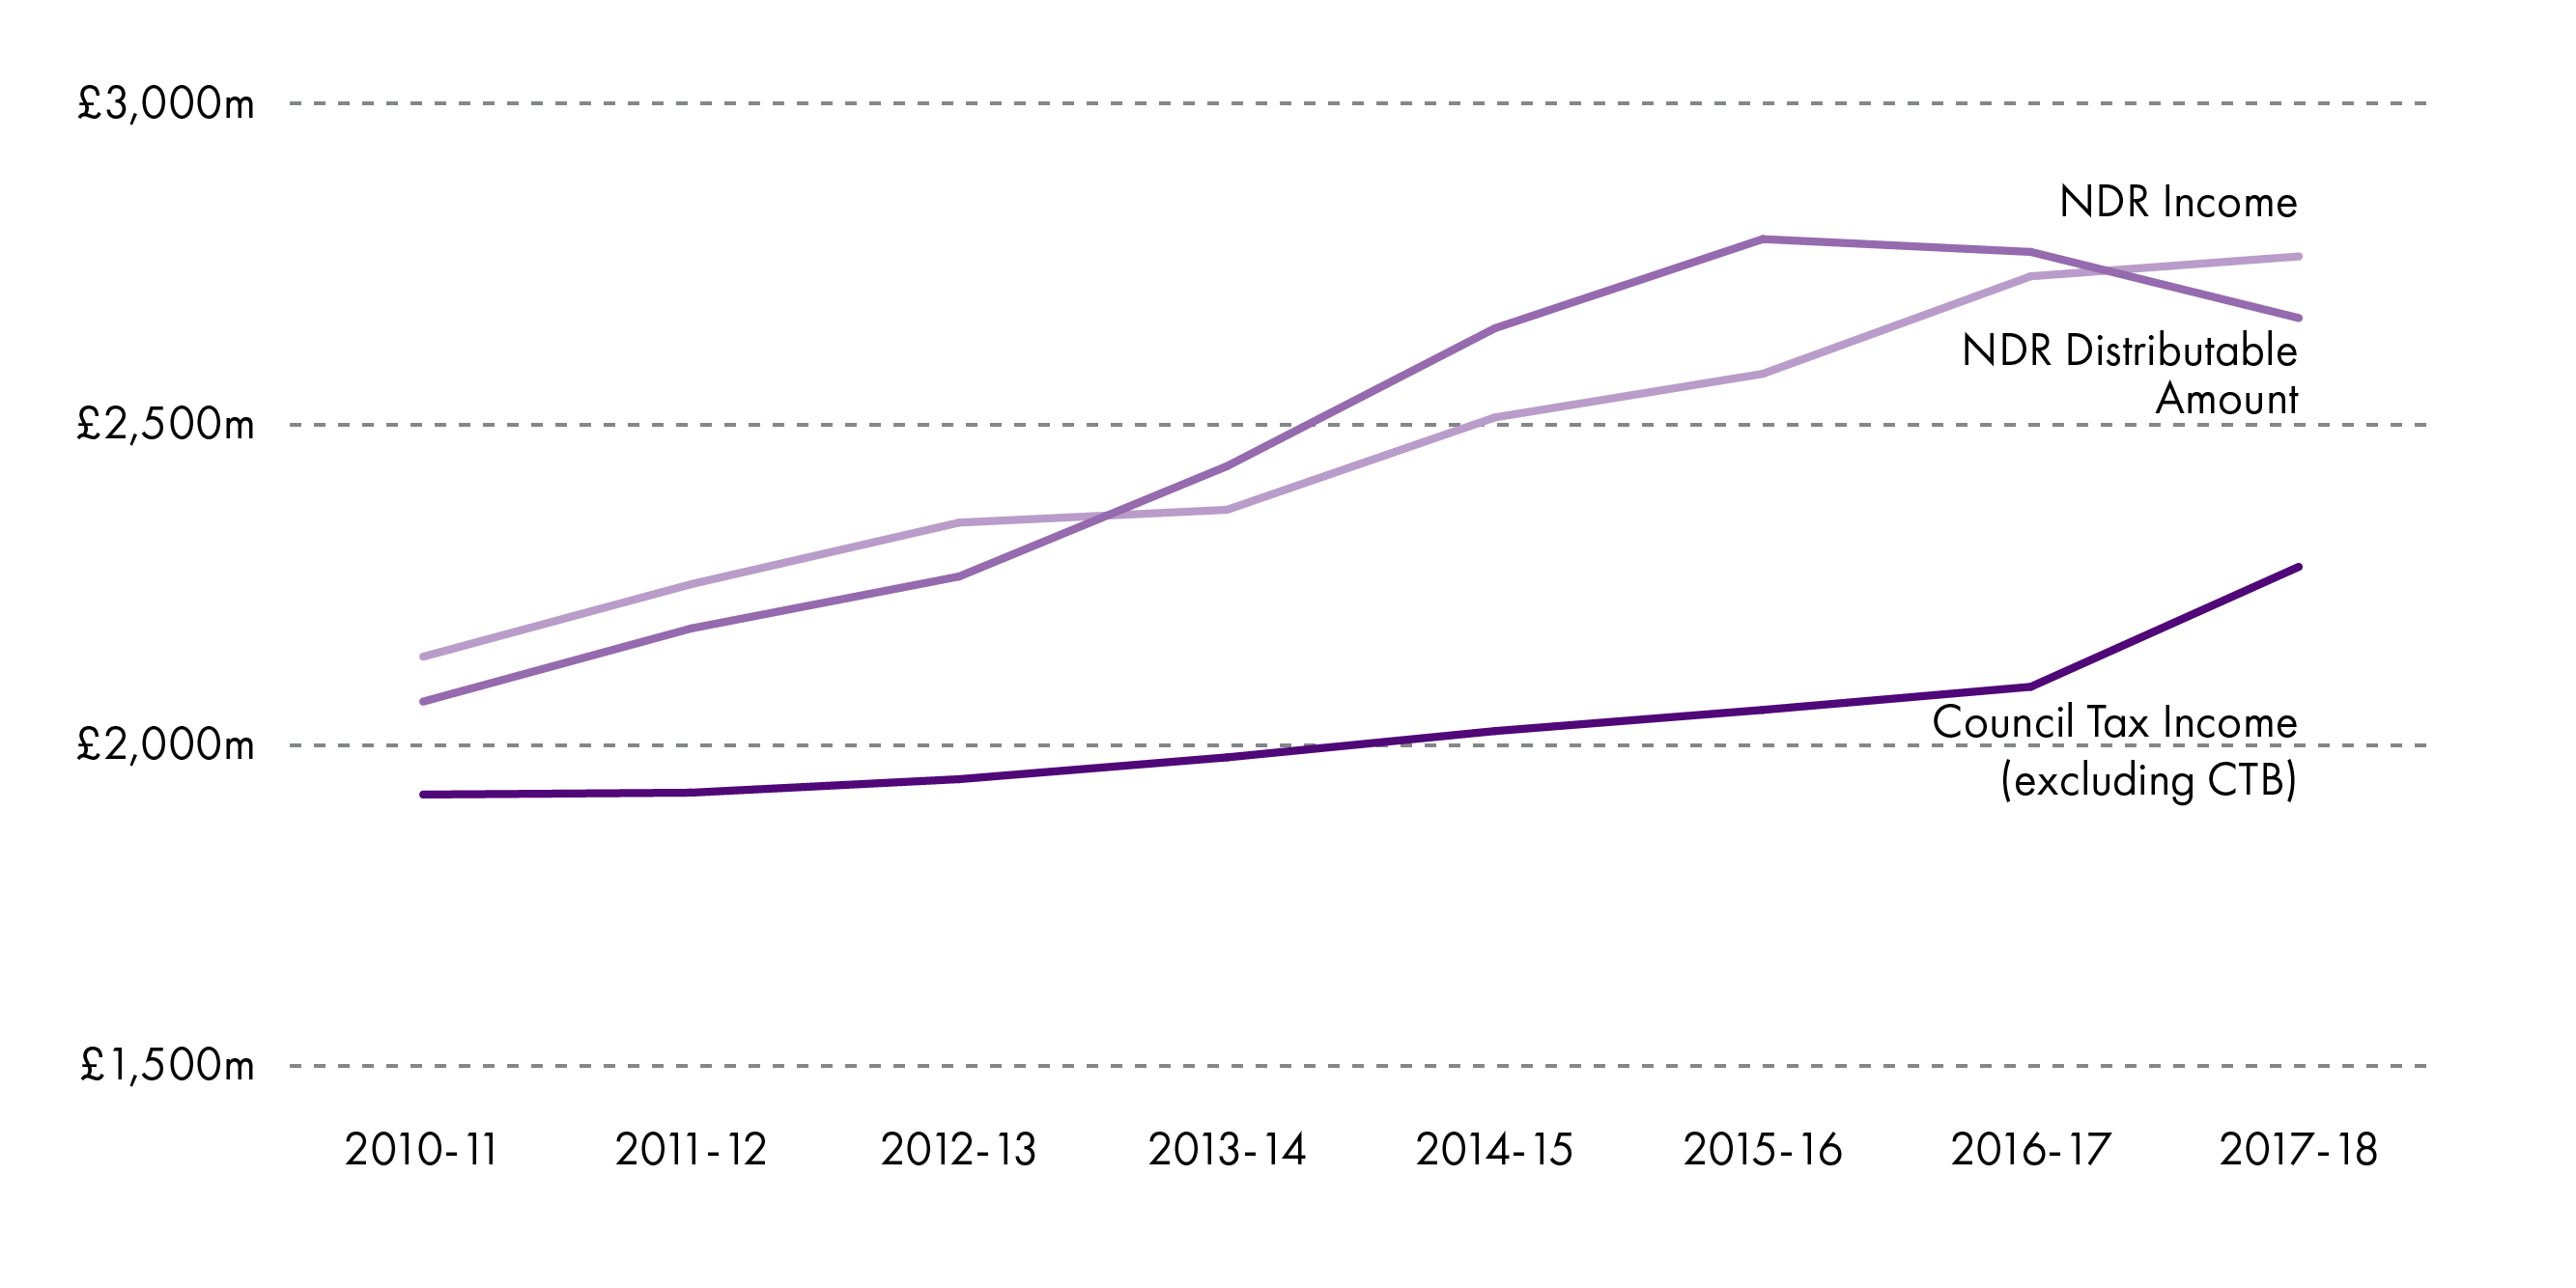
Figure 8 shows the impact of recent changes to NDR and Council Tax policy. NDR Income, i.e. the amount collected by local authorities and paid to the Scottish Government, has increased. The Distributable Amount has reduced in recent years, despite the income increasing, illustrating the discrepancy between what is collected and what is distributed, giving some idea of what the NDR Account might look like.
Future years data will likely show a varying picture. In 2018-19 the Scottish Government set a DA that would have brought the NDR Account back into balance had the collected amount equalled the forecast1. In 2019-20, the amount of NDR distributed to local authorities sees a dramatic increase, of 8.2% (£217 million) in cash terms, or 6.3% (£166.8 million) in real terms. £100 million of this increase comes from a decision to include forecast funds from future years to the 2019-20 Budget2.
As can be expected, Council Tax income has increased as a result of recent policy changes.
Council Tax income post-reform
Figure 9 shows the impact of Council Tax reform in recent years on each local authority. These figures represent gross Council Tax revenue. They are calculated taking account of all discounts and exemptions, and the collection rate, but do not take account of Council Tax Reduction (CTR). They are therefore on the basis used in the assumed Council Tax income element of the Local Government Finance settlement (rather than being the figures that are used in the calculation of the Local Government Finance settlement).
Note that:
Local authorities are funded separately for the Council Tax income they forego due to CTR.
As noted, and unlike other sections of this briefing, figures here are given in cash terms and do not take into account inflation.
These figures are gross figures which fall in line with the figures in the Local Government Finance settlement, as opposed to net figures which show the actual revenue from Council Tax received by local authorities, with the actual increases local authorities made in 2019-20 added taken in to account.
Figures explored to not take in to account any changes related to aspects such as population change and changes to housing infrastructure.
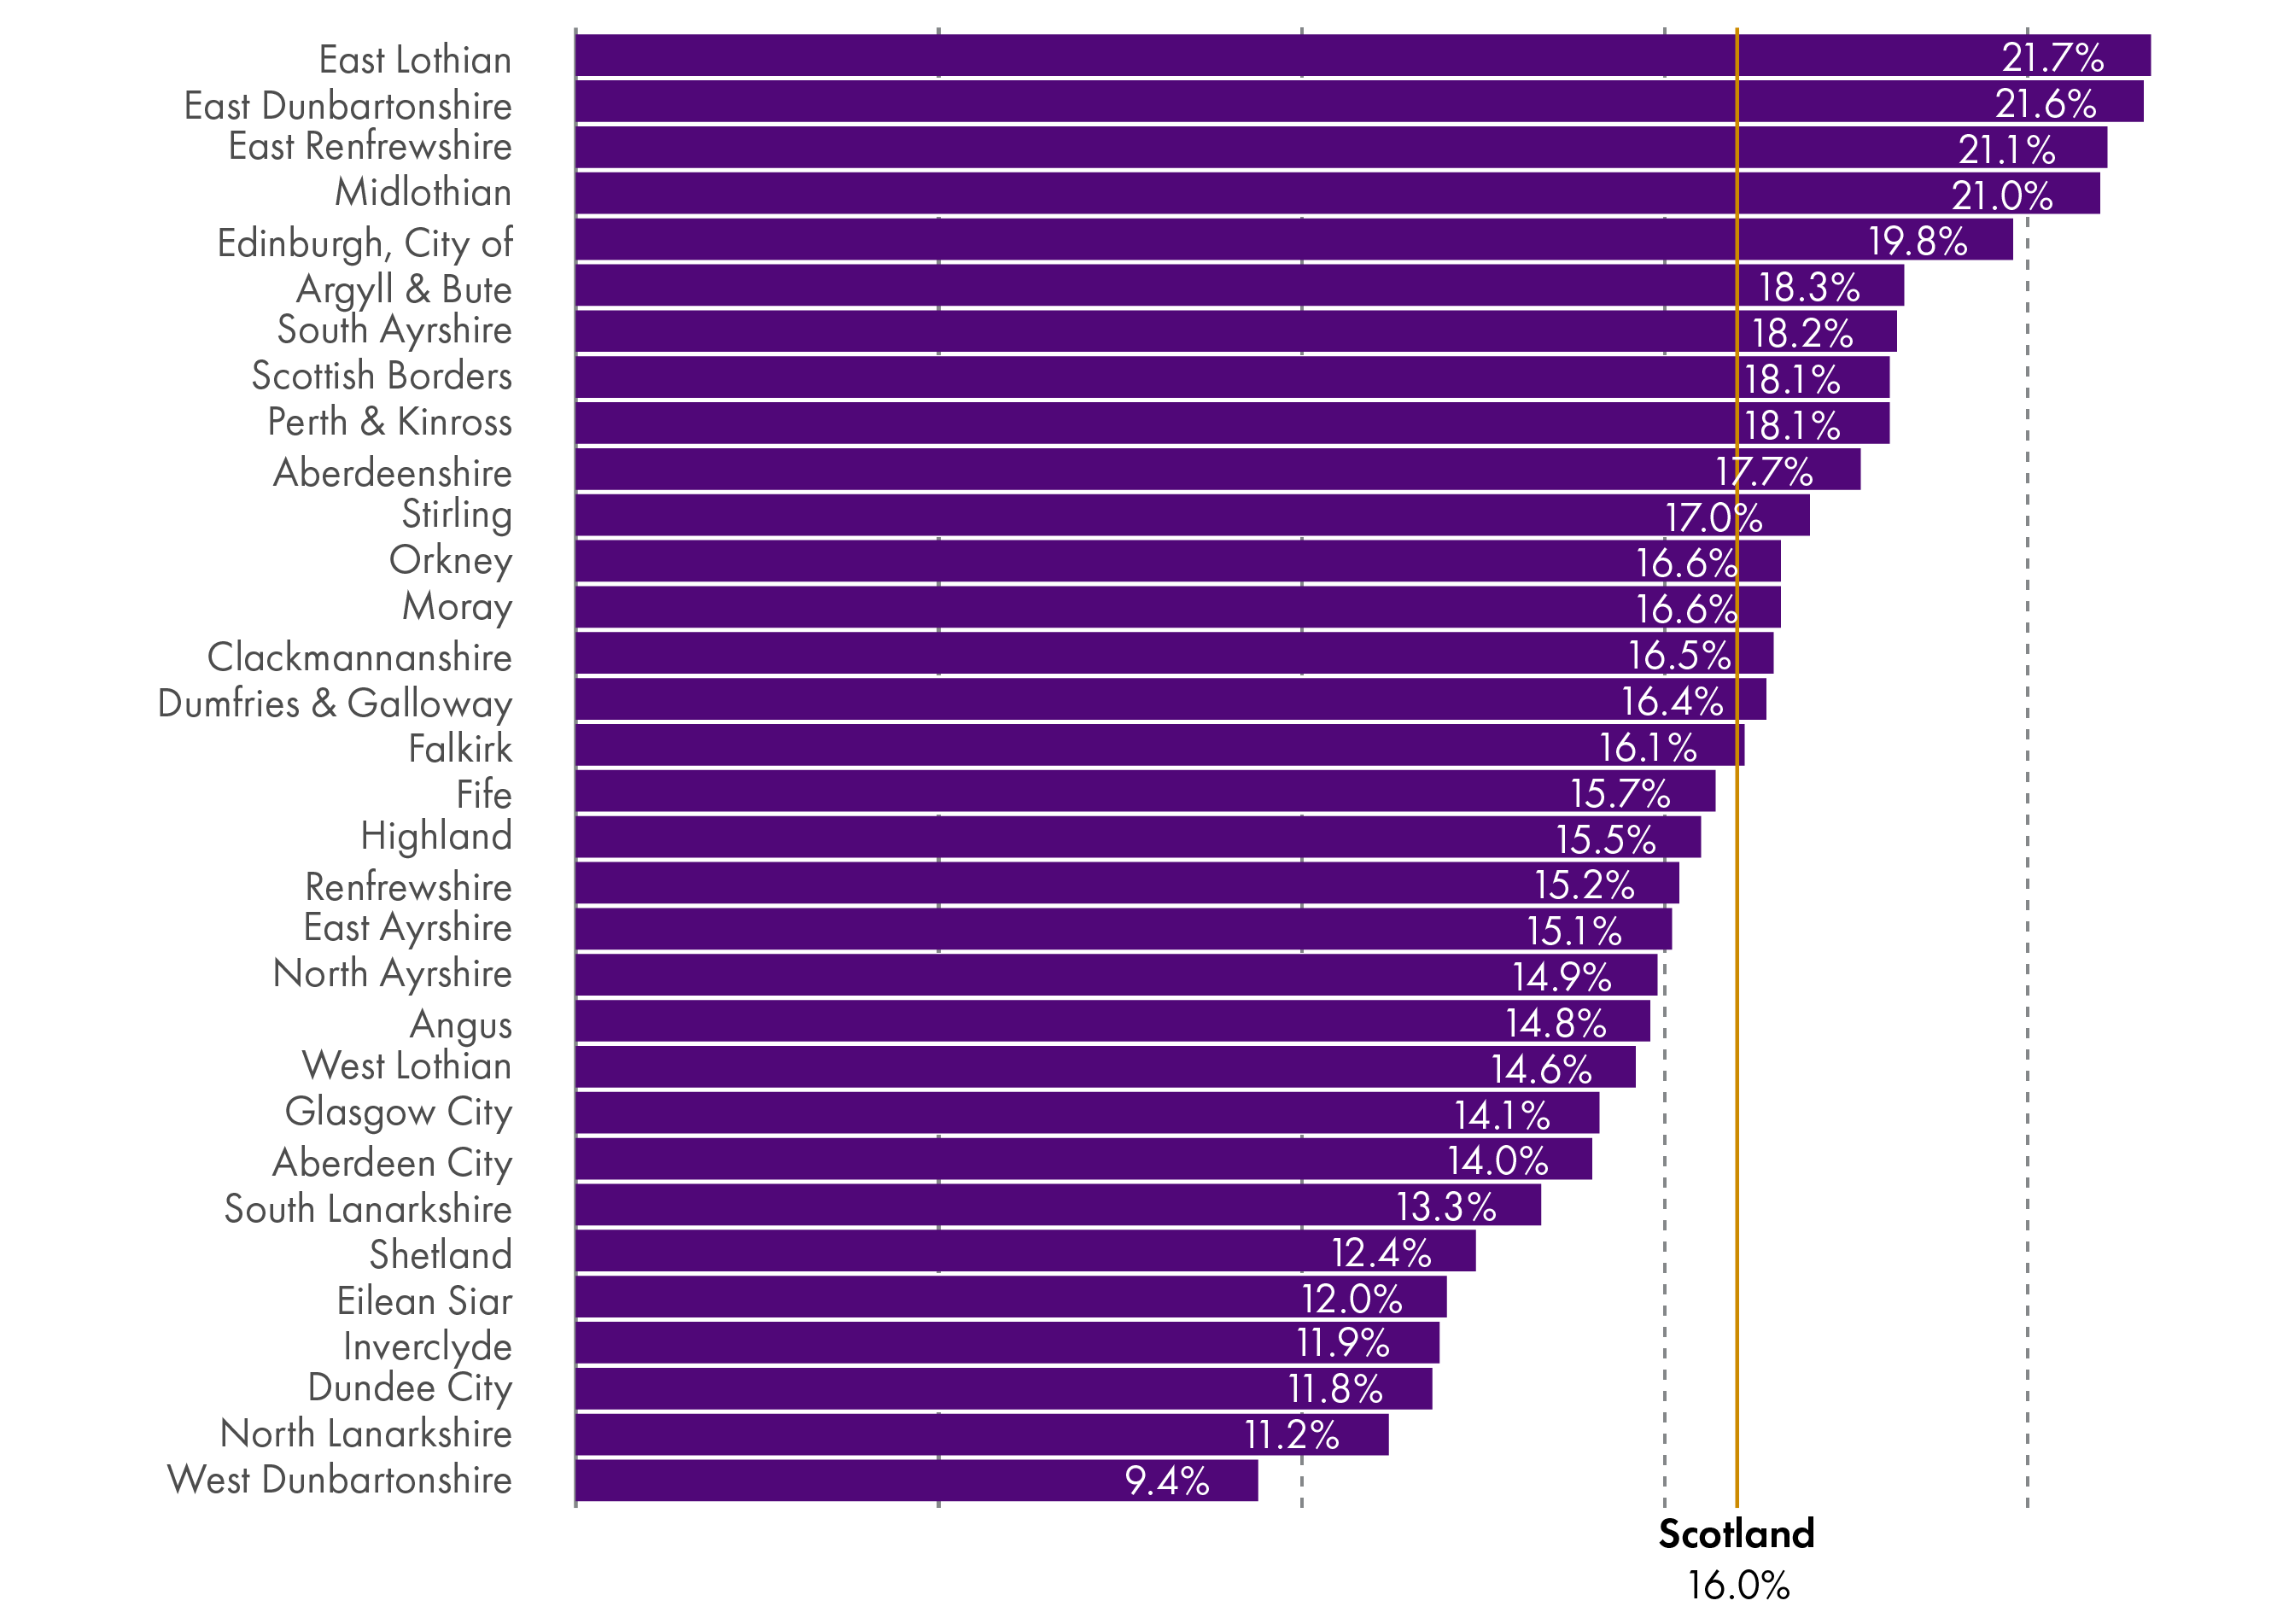
The variations illustrate the relative Council Tax 'story' of each authority - some local authorities have higher proportions of low-band properties, whilst others tend to have higher levels of Band E-H properties. The Scottish Government capped Council Tax increases at 3% in 2017-18 and 2018-19. In 2019-20 this cap increased to 3% in real terms (4.79%). The implementation of changes has been varied:
In 2017-18, the 21 councils opted to increase the Band D rate of Council Tax (against which all other Bands are set) by the full 3%. Three councils chose increases of 2% or 2.5%, and eight councils opted to apply no increase.
In 2018-19 all 32 local authorities chose to apply the maximum increase of 3%.
In 2019-20, 13 councils applied a 3% increase, one council chose a 3.95% increase, five councils opted for a 4% increase, one council went with 4.5%, and 12 councils chose to apply the maximum 4.79% increase.
The varying practice in applying Council Tax increases means that there has been a compounding effect to the increases in certain local authorities, and, as a result, some change in the landscape of Council Tax revenue since 2016-17 compared to what was shown in Figure 8 of the 2017 Facts and Figures briefing1.
Those councils with a higher proportion of high-band properties have remained at the higher end of the income range, and those with the lower proportion have remained at the lower end.
Unlike East Lothian, East Renfrewshire, East Dunbartonshire and Edinburgh, Midlothian was not one of the councils impacted the most by multiplier changes in 2017-18, but because of its decisions around Council Tax increases it has seen one of the highest increases to Council Tax revenue since 2016-17.
Some other councils with a lower impact from multiplier increases have also climbed up the income scale, suggesting they have made the most of the opportunities to increase income. These include Orkney, Clackmannanshire, and Moray.
Annex: Data
Table 1 - Local Government funding from Scottish Government (real terms, 2019-20 prices) - annual change
| £m | Total Revenue | Total Capital | Total revenue + capital | Total revenue annual % change | Total % annual change |
|---|---|---|---|---|---|
| 2013-14 | 10,800.4 | 610.7 | 11,411.1 | - | - |
| 2014-15 | 10,831.7 | 916.1 | 11,747.8 | 0.3% | 3.0% |
| 2015-16 | 10,874.5 | 927.5 | 11,802.0 | 0.4% | 0.5% |
| 2016-17 | 10,281.2 | 642.7 | 10,924.0 | -5.5% | -7.4% |
| 2017-18 | 10,018.6 | 816.5 | 10,835.1 | -2.6% | -0.8% |
| 2018-19 | 9,990.3 | 1,105.9 | 11,096.2 | -0.3% | 0.5% |
| 2018-19 LGFO | 9,975.4 | 893.9 | 10,869.3 | -2.1% | -2.1% |
| 2019-20 LGFO | 10,078.4 | 1,084.2 | 11,162.6 | 3.1% | 5.8% |
Draft Budget 2017-18 (Table 1.01), Draft Budget 2018-19 (Table 1.02), Budget 2019-20 (Table 1.02), Local Government Finance Circulars
Table 2 - Local Government funding from Scottish Government (cash terms) and percentage share
| Revenue | Capital | Total | |||||
|---|---|---|---|---|---|---|---|
| £m | LG Total Revenue | SG Fiscal Resource Budget Limit | SG Revenue Fiscal Resource Budget Limit + NDRI | LG Total Capital** | SG Capital Budget Limit | LG Total | SG total |
| 2013-14 | 9,766.4 | 25,671.0 | 28,106.0 | 552.2 | 2,508.0 | 10,318.6 | 30,614.0 |
| 2014-15 | 9,920.6 | 25,808.0 | 28,457.5 | 839.0 | 2,690.0 | 10,759.7 | 31,147.5 |
| 2015-16 | 10,039.4 | 25,991.0 | 28,779.5 | 856.3 | 2,734.0 | 10,895.7 | 31,513.5 |
| 2016-17 | 9,707.9 | 26,088.0 | 28,856.5 | 606.9 | 2,891.0 | 10,314.8 | 31,747.5 |
| 2017-18 | 9,650.7 | 27,027.0 | 29,692.8 | 786.5 | 3,087.0 | 10,437.2 | 32,779.8 |
| 2018-19 | 9,794.5 | 26,983.0 | 29,619.0 | 1,084.2 | 3,520.0 | 10,878.7 | 33,139.0 |
| 2018-19 LGFO | 9,779.9 | 26,983.0 | 29,619.0 | 876.4 | 3,413.0 | 10,656.3 | 33,032.0 |
| 2019-20 LGFO | 10,078.4 | 27,633.0 | 30,486.0 | 1,084.2 | 3,956.0 | 11,162.6 | 34,442.0 |
| % Change 2013-14 to 2018-19 | 0.3% | 5.1% | 5.4% | 96.3% | 40.4% | 5.4% | 8.2% |
| % Change 2018-19 to 2019-20 | 3.1% | 2.4% | 2.9% | 23.7% | 15.9% | 4.8% | 4.3% |
Draft Budget 2017-18 (Table 1.01), Draft Budget 2018-19 (Table 1.02), Budget 2019-20 (Table 1.02), Local Government Finance Circulars
Note that as figures are displayed to one decimal point, rounding may mean that figures, when summed, do not match the percentage calculations displayed.
Table 3 - Local Government funding from Scottish Government (real terms, 2019-20 prices) and percentage share
| Revenue | Capital | Total | |||||
|---|---|---|---|---|---|---|---|
| £m | LG Total Revenue | SG Fiscal Resource Budget Limit | SG Revenue Fiscal Resource Budget Limit + NDRI | LG Total Capital | SG Capital Budget Limit | LG Total | SG total |
| 2013-14 | 10,800.4 | 28,388.8 | 31,081.6 | 610.7 | 2,773.5 | 11,411.1 | 33,855.1 |
| 2014-15 | 10,831.7 | 28,178.3 | 31,071.1 | 916.1 | 2,937.1 | 11,747.8 | 34,008.1 |
| 2015-16 | 10,874.5 | 28,153.0 | 31,173.5 | 927.5 | 2,961.4 | 11,802.0 | 34,134.9 |
| 2016-17 | 10,281.2 | 27,628.7 | 30,560.7 | 642.7 | 3,061.7 | 10,924.0 | 33,622.4 |
| 2017-18 | 10,018.6 | 28,057.3 | 30,824.7 | 816.5 | 3,204.7 | 10,835.1 | 34,029.4 |
| 2018-19 | 9,990.3 | 27,522.5 | 30,211.2 | 1,105.9 | 3,590.4 | 11,096.2 | 33,801.5 |
| 2018-19 LGFO | 9,975.4 | 27,522.5 | 30,211.2 | 893.9 | 3,481.2 | 10,869.3 | 33,692.4 |
| 2019-20 LGFO | 10,078.4 | 27,633.0 | 30,486.0 | 1,084.2 | 3,956.0 | 11,162.6 | 34,442.0 |
| % Change 2013-14 to 2018-19 | -7.5% | -3.1% | -2.8% | 81.1% | 29.5% | -2.8% | -0.2% |
| % Change 2018-19 to 2019-20 | 1.0% | 0.4% | 0.9% | 21.3% | 13.6% | 2.7% | 2.2% |
Draft Budget 2017-18 (Table 1.01), Draft Budget 2018-19 (Table 1.02), Budget 2019-20 (Table 1.02), Local Government Finance Circulars, HM Treasury deflators April 2019.
Table 4 - Local government, % of funds ringfenced, 2013-14 and 2019-20
| 2013-14 | 2019-20 | |||||
|---|---|---|---|---|---|---|
| £m | Total revenue | Ringfenced funds | % of funding ringfenced | Total revenue | Ringfenced funds | % of funding ringfenced |
| Aberdeen City | 325.0 | 0.6 | 0.2% | 342.3 | 20.3 | 5.9% |
| Aberdeenshire | 403.0 | 0.1 | 0.0% | 429.4 | 20.7 | 4.8% |
| Angus | 199.5 | 0.0 | 0.0% | 208.2 | 8.9 | 4.3% |
| Argyll & Bute | 204.3 | 0.4 | 0.2% | 198.7 | 7.4 | 3.7% |
| Clackmannanshire | 94.4 | 0.0 | 0.0% | 97.5 | 5.2 | 5.3% |
| Dumfries & Galloway | 290.0 | 0.1 | 0.0% | 290.6 | 11.3 | 3.9% |
| Dundee City | 287.6 | 0.1 | 0.0% | 304.4 | 17.2 | 5.6% |
| East Ayrshire | 223.7 | 0.5 | 0.2% | 235.9 | 12.7 | 5.4% |
| East Dunbartonshire | 179.0 | 0.1 | 0.0% | 189.7 | 8.1 | 4.3% |
| East Lothian | 167.8 | 0.0 | 0.0% | 177.8 | 9.0 | 5.1% |
| East Renfrewshire | 172.8 | 0.2 | 0.1% | 180.5 | 5.4 | 3.0% |
| Edinburgh, City of | 739.8 | 0.5 | 0.1% | 747.7 | 40.2 | 5.4% |
| Eilean Siar | 103.2 | 1.0 | 1.0% | 96.4 | 3.1 | 3.2% |
| Falkirk | 274.6 | 1.1 | 0.4% | 288.1 | 16.0 | 5.6% |
| Fife | 628.0 | 0.5 | 0.1% | 661.9 | 34.4 | 5.2% |
| Glasgow City | 1248.2 | 1.0 | 0.1% | 1274.3 | 67.3 | 5.3% |
| Highland | 450.8 | 1.0 | 0.2% | 458.1 | 21.3 | 4.7% |
| Inverclyde | 165.3 | 0.5 | 0.3% | 168.9 | 8.3 | 4.9% |
| Midlothian | 149.8 | 0.0 | 0.0% | 165.7 | 10.4 | 6.3% |
| Moray | 153.3 | 0.5 | 0.3% | 163.6 | 8.1 | 4.9% |
| North Ayrshire | 264.6 | 0.5 | 0.2% | 281.6 | 14.7 | 5.2% |
| North Lanarkshire | 616.1 | 0.3 | 0.0% | 631.8 | 33.5 | 5.3% |
| Orkney Islands | 68.4 | 0.0 | 0.0% | 75.5 | 7.2 | 9.5% |
| Perth & Kinross | 245.8 | 0.4 | 0.2% | 254.9 | 10.5 | 4.1% |
| Renfrewshire | 306.8 | 0.5 | 0.2% | 321.5 | 18.4 | 5.7% |
| Scottish Borders | 204.3 | 0.0 | 0.0% | 211.5 | 9.3 | 4.4% |
| Shetland Islands | 86.1 | 1.3 | 1.5% | 86.7 | 7.1 | 8.2% |
| South Ayrshire | 199.2 | 0.2 | 0.1% | 205.8 | 8.9 | 4.3% |
| South Lanarkshire | 562.6 | 1.5 | 0.3% | 575.2 | 28.1 | 4.9% |
| Stirling | 163.3 | 0.6 | 0.4% | 172.7 | 9.0 | 5.2% |
| West Dunbartonshire | 186.2 | 0.0 | 0.0% | 192.9 | 10.0 | 5.2% |
| West Lothian | 302.5 | 0.0 | 0.0% | 326.0 | 15.6 | 4.8% |
Local Government Finance Circular 2/2013, Annex B, Columns 7 and 13, and Local Government Finance Circular 2/2019, Annex B, Columns 7 and 12.
Table 5 - Local government funding per head; changes 2013-14 to 2019-20, real terms (2019-20 prices)
| Total revenue per head | Funding change, £m | Funding change, % | Population change | Population change, % | Per head change, £ | Scottish average, percentage points change |
|---|---|---|---|---|---|---|
| Aberdeen City | -12.0 | -3.4% | 2,650 | 1.2% | -71 | 4.6% |
| Aberdeenshire | -10.6 | -2.4% | 5,910 | 2.3% | -79 | 5.0% |
| Angus | -10.6 | -4.9% | - 180 | -0.2% | -89 | 5.3% |
| Argyll & Bute | -27.5 | -12.2% | - 650 | -0.7% | -299 | -2.5% |
| Clackmannanshire | -5.3 | -5.2% | 120 | 0.2% | -108 | 4.9% |
| Dumfries & Galloway | -27.4 | -8.6% | - 2,050 | -1.4% | -155 | 2.9% |
| Dundee City | -10.8 | -3.4% | 970 | 0.7% | -86 | 6.8% |
| East Ayrshire | -9.4 | -3.8% | - 890 | -0.7% | -62 | 7.4% |
| East Dunbartonshire | -6.5 | -3.3% | 2,450 | 2.3% | -102 | 4.4% |
| East Lothian | -5.3 | -2.9% | 4,930 | 4.9% | -135 | 2.4% |
| East Renfrewshire | -9.2 | -4.9% | 4,130 | 4.5% | -188 | 0.9% |
| Edinburgh, City of | -61.0 | -7.5% | 35,870 | 7.4% | -233 | -3.8% |
| Eilean Siar | -18.4 | -16.0% | - 730 | -2.6% | -572 | -9.1% |
| Falkirk | -12.5 | -4.2% | 3,540 | 2.3% | -120 | 3.8% |
| Fife | -23.8 | -3.5% | 5,700 | 1.6% | -93 | 5.0% |
| Glasgow City | -97.0 | -7.1% | 31,340 | 5.3% | -270 | -2.5% |
| Highland | -35.7 | -7.2% | 2,650 | 1.1% | -176 | 1.8% |
| Inverclyde | -13.9 | -7.6% | - 2,540 | -3.1% | -104 | 6.6% |
| Midlothian | 1.8 | 1.1% | 7,100 | 8.4% | -132 | 3.3% |
| Moray | -4.2 | -2.5% | 2,590 | 2.8% | -93 | 4.7% |
| North Ayrshire | -9.2 | -3.2% | - 2,290 | -1.7% | -32 | 9.7% |
| North Lanarkshire | -46.0 | -6.8% | 2,290 | 0.7% | -149 | 2.7% |
| Orkney | 0.3 | 0.4% | 660 | 3.1% | -90 | 14.0% |
| Perth & Kinross | -12.9 | -4.8% | 3,550 | 2.4% | -128 | 2.8% |
| Renfrewshire | -16.3 | -4.8% | 3,490 | 2.0% | -130 | 3.3% |
| Scottish Borders | -12.7 | -5.7% | 1,550 | 1.4% | -136 | 3.2% |
| Shetland | -10.4 | -10.7% | - 220 | -0.9% | -414 | -0.2% |
| South Ayrshire | -12.1 | -5.6% | - 370 | -0.3% | -101 | 4.9% |
| South Lanarkshire | -39.5 | -6.4% | 4,690 | 1.5% | -153 | 2.2% |
| Stirling | -7.1 | -3.9% | 3,320 | 3.6% | -144 | 2.7% |
| West Dunbartonshire | -13.2 | -6.4% | - 1,210 | -1.3% | -117 | 5.9% |
| West Lothian | -3.2 | -1.0% | 6,130 | 3.5% | -81 | 5.7% |
| Scotland | -581.9 | -5.5% | 124,500 | 2.3% | -153 | 2.4% |
Local Government Finance Circulars, NRS Mid-Year Population Estimates, HM Treasury defleators April 2019
Table 6 - Council Tax income and Non-Domestic Rates income
| Year | Council tax income (excluding CTB) (£m) | Council tax benefit subsidy (£m) | Council tax income (including CTB) (£m) | NDR Distributable amount (£m) | NDR Income |
|---|---|---|---|---|---|
| 2010-11 | 1,923 | 375 | 2,298 | 2,068 | 2,138 |
| 2011-12 | 1,926 | 376 | 2,302 | 2,182 | 2,251 |
| 2012-13 | 1,947 | 371 | 2,318 | 2,263 | 2,347 |
| 2013-14 | 1,978 | - | 1,981 | 2,435 | 2,367 |
| 2014-15 | 2,022 | - | 2,022 | 2,650 | 2,511 |
| 2015-16 | 2,055 | - | 2,055 | 2,789 | 2,579 |
| 2016-17 | 2,091 | - | 2,091 | 2,769 | 2,731 |
| 2017-18 | 2,278 | - | 2,278 | 2,666 | 2,762 |
Source: Local Government Finance Statistics
Table 7 - Council Tax, NDRI and Scottish Government Grant funding for local government, 2019-20, cash
| £m, Cash | 2019-20 Revenue Funding less NDRI | 2019-20 NDRI* | 2019-20 Est Gross CT Revenue ** | Total |
|---|---|---|---|---|
| Aberdeen City | 83.74 | 258.56 | 127.79 | 470.09 |
| Aberdeenshire | 305.57 | 123.81 | 144.08 | 573.47 |
| Angus | 180.73 | 27.47 | 53.78 | 261.98 |
| Argyll & Bute | 163.10 | 35.63 | 54.47 | 253.20 |
| Clackmannanshire | 80.22 | 17.32 | 25.73 | 123.27 |
| Dumfries & Galloway | 239.41 | 51.15 | 72.93 | 363.49 |
| Dundee City | 240.11 | 64.31 | 65.95 | 370.37 |
| East Ayrshire | 208.57 | 27.36 | 58.45 | 294.38 |
| East Dunbartonshire | 167.06 | 22.67 | 66.55 | 256.28 |
| East Lothian | 152.21 | 25.55 | 57.97 | 235.73 |
| East Renfrewshire | 165.16 | 15.38 | 55.20 | 235.73 |
| Edinburgh, City of | 382.44 | 365.25 | 291.98 | 1039.67 |
| Eilean Siar | 87.92 | 8.48 | 11.41 | 107.82 |
| Falkirk | 218.41 | 69.74 | 72.23 | 360.38 |
| Fife | 496.15 | 165.72 | 178.05 | 839.91 |
| Glasgow City | 918.03 | 356.23 | 297.16 | 1571.42 |
| Highland | 314.87 | 143.24 | 129.44 | 587.55 |
| Inverclyde | 149.08 | 19.83 | 37.81 | 206.72 |
| Midlothian | 134.09 | 31.62 | 49.86 | 215.57 |
| Moray | 119.99 | 43.56 | 44.97 | 208.53 |
| North Ayrshire | 240.49 | 41.12 | 67.06 | 348.67 |
| North Lanarkshire | 524.58 | 107.25 | 142.11 | 773.94 |
| Orkney Islands | 65.04 | 10.46 | 9.77 | 85.27 |
| Perth & Kinross | 198.35 | 56.59 | 86.16 | 341.10 |
| Renfrewshire | 217.12 | 104.42 | 91.53 | 413.07 |
| Scottish Borders | 174.83 | 36.62 | 60.00 | 271.45 |
| Shetland Islands | 60.82 | 25.93 | 9.93 | 96.67 |
| South Ayrshire | 163.33 | 42.46 | 64.57 | 270.35 |
| South Lanarkshire | 234.03 | 341.17 | 150.79 | 725.99 |
| Stirling | 128.61 | 44.04 | 52.11 | 224.76 |
| West Dunbartonshire | 108.15 | 84.74 | 43.52 | 236.41 |
| West Lothian | 240.63 | 85.33 | 81.49 | 407.45 |
| Scotland | 7,162.82 | 2,853.00 | 2,755.43 | 12,771.25 |
*Distribution figures as set out in Local Government Finance Circular
** Based on Est. 2018-19 Gross revenue (provided by Scottish Government from CTAXBASE) with individual % increased made by local authorities in 2019-20 applied
Table 8 - Changes to Council Tax revenue, 2016-17 to 2019-20
| £m | Gross CT revenue 2016-17 (Sep 16 est) | Est Gross CT revenue 2019-20 | Difference 2016-17 to 2019-20 | % Difference 2016-2017 to 2019-20 |
|---|---|---|---|---|
| Aberdeen City | 112.1 | 127.8 | 15.7 | 14.0% |
| Aberdeenshire | 122.4 | 144.1 | 21.7 | 17.7% |
| Angus | 46.9 | 53.8 | 6.9 | 14.8% |
| Argyll & Bute | 46.1 | 54.5 | 8.4 | 18.3% |
| Clackmannanshire | 22.1 | 25.7 | 3.6 | 16.5% |
| Dumfries & Galloway | 62.7 | 72.9 | 10.3 | 16.4% |
| Dundee City | 59.0 | 66.0 | 7.0 | 11.8% |
| East Ayrshire | 50.8 | 58.5 | 7.7 | 15.1% |
| East Dunbartonshire | 54.7 | 66.6 | 11.8 | 21.6% |
| East Lothian | 47.6 | 58.0 | 10.4 | 21.7% |
| East Renfrewshire | 45.6 | 55.2 | 9.6 | 21.1% |
| Edinburgh, City of | 243.7 | 292.0 | 48.3 | 19.8% |
| Eilean Siar | 10.2 | 11.4 | 1.2 | 12.0% |
| Falkirk | 62.2 | 72.2 | 10.0 | 16.1% |
| Fife | 153.9 | 178.0 | 24.2 | 15.7% |
| Glasgow City | 260.4 | 297.2 | 36.7 | 14.1% |
| Highland | 112.0 | 129.4 | 17.4 | 15.5% |
| Inverclyde | 33.8 | 37.8 | 4.0 | 11.9% |
| Midlothian | 41.2 | 49.9 | 8.7 | 21.0% |
| Moray | 38.6 | 45.0 | 6.4 | 16.6% |
| North Ayrshire | 58.4 | 67.1 | 8.7 | 14.9% |
| North Lanarkshire | 127.8 | 142.1 | 14.3 | 11.2% |
| Orkney Islands | 8.4 | 9.8 | 1.4 | 16.6% |
| Perth & Kinross | 73.0 | 86.2 | 13.2 | 18.1% |
| Renfrewshire | 79.5 | 91.5 | 12.1 | 15.2% |
| Scottish Borders | 50.8 | 60.0 | 9.2 | 18.1% |
| Shetland Islands | 8.8 | 9.9 | 1.1 | 12.4% |
| South Ayrshire | 54.6 | 64.6 | 9.9 | 18.2% |
| South Lanarkshire | 133.1 | 150.8 | 17.7 | 13.3% |
| Stirling | 44.5 | 52.1 | 7.6 | 17.0% |
| West Dunbartonshire | 39.8 | 43.5 | 3.7 | 9.4% |
| West Lothian | 71.1 | 81.5 | 10.4 | 14.6% |
| Scotland | 2,375.6 | 2,755.4 | 379.8 | 16.0% |
CTAXBASE September 2016, September 2018
Abbreviations and Glossary
Various abbreviations are used throughout this briefing. A key is set out below.
CT - Council Tax
CTB - Council Tax Benefits
CTR - Council Tax Reduction
DEL - Departmental Expenditure Limit
LG - Local Government
LGFO - Local Government Finance Order
NDR - Non-Domestic Rates
NDRI - Non-Domestic Rates Income
OT - Outturn
SG - Scottish Government
Local Government Glossary
CAPITAL EXPENDITURE
Spending which creates longer-term assets, whose benefits will last over a period of years such as spending on the purchase, construction or improvement of land or buildings. Local authorities‘ receive a capital grant from the Scottish Government whilst local authorities wider capital expenditure is governed by the prudential borrowing code.
COUNCIL TAX
System of local taxation introduced in April 1993. It is a property tax levied on homes by local authorities. The amount levied is determined by placement of residences within 8 valuation bands (A-H). There are exemptions for specific types of property and discounts for people in certain circumstances. Council Tax exemptions are applied according to a property's circumstances rather than its type e.g. empty, under repair, occupied by students, occupier is detained. Council tax status discounts are applied to household liability depending on the status and number of adult residents.
NON-DOMESTIC RATES (NDR) AND NON-DOMESTIC RATES INCOME (NDRI)
Non-Domestic Rates are collected by all 32 authorities on the basis of a national poundage rate set by the Scottish Government, paid into a central pool and with effect from 1 April 2012, redistributed to councils based on how much each local authority is expected to collect. The amounts estimated to be available for distribution from the pool each year depends on forecasts of gross rate yield losses from appeals and adjustments from previous years. Adjustments are made, either up or down, to the level of General Revenue Grant to reflect variations between the estimated Non Domestic Rates Income and the actual amount collected, so the amount collected by an individual authority has no direct impact on its revenue funding allocations.
REVENUE EXPENDITURE
Recurring expenditure that is financed from current income (i.e. not through borrowing). It consists of the day to day running costs of a local authority including staff wages and salaries. Loan charges, repaying money borrowed for capital expenditure, are also part of revenue expenditure.
GENERAL REVENUE GRANT (GRG)
The largest element of Scottish Government support for local authority revenue expenditure. The level of GRG is determined by Scottish Ministers following consultation with local authorities through COSLA, and after taking advice from the Settlement and Distribution Group (which consists of Scottish Government and COSLA officials). The Local Government Finance (Scotland) Order, specifying levels of GRG, is laid before the Parliament annually for approval.
SPECIFIC GRANTS
Part of the Scottish Government‘s support to local authorities. These grants provide the funding for specific services including the police, some mental health services and the education excellence fund. Specific grants‘ are monies that are allocated to local authorities for specific policy purposes. Since the introduction of the Concordat in November 2007, and the consequent more away from ring-fencing, the amount of monies paid out as specific grants has reduced considerably. At present, over 97% of these specific grants support local authority expenditure on police.
TOTAL REVENUE SUPPORT
Total Revenue Support, previously termed ‗Aggregate External Finance, is the Scottish Government grant distributed to local authorities. Government. It comprises General Revenue Grant, previously termed Revenue Support Grant (RSG), distribution of non-domestic rate income (NDRI) and specific grants which fund part of the current expenditure on a specific service or activity.
Related Briefings
SB 16/28 - Scottish Government proposals for Council Tax reform
SB 17/44 - Local Government Finance: Facts and Figures 2010-11 to 2017-18
SB 17/82 - Local Government Finance: Fees and Charges 2011-12 to 2015-16
SB 17/83 - The social impact of the 2017-18 local government budget
SB 18/34 - Local Government Finance: Facts and Figures 2013-14 to 2018-19
SB 18/60 - Local Government Finance: The Funding Formula and local taxation income
SB 18/82 - Pro-poor or pro-rich? The social impact of local government budgets, 2016 to 2019
SB 18/84 - Budget 2019-20
SB 18/90 - Local Government Finance: Draft Budget 2019-20 and provisional allocations to local authorities
Sources
Burn-Murdoch, A. (2017, June 21). Local Government finance: facts and figures 2011-12 to 2017-18. Retrieved from <a href="https://digitalpublications.parliament.scot/ResearchBriefings/Report/2017/6/21/Local-Government-Finance--facts-and-figures-2010-11-to-2017-18#" target="_blank">https://digitalpublications.parliament.scot/ResearchBriefings/Report/2017/6/21/Local-Government-Finance--facts-and-figures-2010-11-to-2017-18#</a> [accessed 23 November 2017]
Burn-Murdoch, A. (2018, May 21). Local government finance: facts and figures 2013-14 to 2018-19. Retrieved from <a href="https://digitalpublications.parliament.scot/ResearchBriefings/Report/2018/5/21/Local-Government-Finance--facts-and-figures-2013-14-to-2018-19#" target="_blank">https://digitalpublications.parliament.scot/ResearchBriefings/Report/2018/5/21/Local-Government-Finance--facts-and-figures-2013-14-to-2018-19#</a> [accessed 11 June 2018]
Local Government and Communities Committee. (2019, January 23). Correspondence from the Convener to the Cabinet Secretary for Finance, Economy and Fair Work and the Cabinet Secretary for Communities and Local Government of 23 January 2019. Retrieved from <a href="https://www.parliament.scot/S5_Local_Gov/Inquiries/20190123_Budget_ConvenerToCabSecs.pdf" target="_blank">https://www.parliament.scot/S5_Local_Gov/Inquiries/20190123_Budget_ConvenerToCabSecs.pdf</a>
Scottish Government. (2019, February 8). Correspondence from the Cabinet Secretary for Finance, Economy and Fair Work and the Cabinet Secretary for Communities and Local Government to the Convener of 8 February 2019. Retrieved from <a href="https://www.parliament.scot/S5_Local_Gov/Inquiries/20190208_Budget_CabSecFEFW_CabSecLGCToConvener.pdf" target="_blank">https://www.parliament.scot/S5_Local_Gov/Inquiries/20190208_Budget_CabSecFEFW_CabSecLGCToConvener.pdf</a>
COSLA. (2018, November). Fair Funding for Essential Services 2019/20. Retrieved from <a href="http://www.cosla.gov.uk/system/files/private/fairfundingforessentialservices2019-20.pdf" target="_blank">http://www.cosla.gov.uk/system/files/private/fairfundingforessentialservices2019-20.pdf</a> [accessed 26 June 2019]
Accounts Commission. (2019, March 21). Local government in Scotland: Challenges and performance 2019. Retrieved from <a href="http://www.cosla.gov.uk/system/files/private/fairfundingforessentialservices2019-20.pdf" target="_blank">http://www.cosla.gov.uk/system/files/private/fairfundingforessentialservices2019-20.pdf</a> [accessed 21 June 2019]
Burn-Murdoch, A., Campbell, A., Aiton, A., & Finnigan, K. (2018, December 19). Local Government Finance: Budget 2019-20 and provisional allocations to local authorities. Retrieved from <a href="https://digitalpublications.parliament.scot/ResearchBriefings/Report/2018/12/19/Local-Government-Finance--Budget-2019-20-and-provisional-allocations-to-local-authorities#Real-terms-change--2018-19-to-2019-20--excluding-ring-fenced-grants" target="_blank">https://digitalpublications.parliament.scot/ResearchBriefings/Report/2018/12/19/Local-Government-Finance--Budget-2019-20-and-provisional-allocations-to-local-authorities#Real-terms-change--2018-19-to-2019-20--excluding-ring-fenced-grants</a> [accessed 26 June 2019]
Scottish Government. (2013, March 15). Local government finance circular 2/2013. Retrieved from <a href="https://www.gov.scot/publications/local-government-finance-circular-22013-settlement-2013-2014-changes-2012-2013-amendment/" target="_blank">https://www.gov.scot/publications/local-government-finance-circular-22013-settlement-2013-2014-changes-2012-2013-amendment/</a> [accessed 26 June 2019]
Scottish Government. (2019, March 7). Local government finance circular 2/2019. Retrieved from <a href="https://www.gov.scot/publications/local-government-finance-circular-2-2019-settlement-for-2019-2020/" target="_blank">https://www.gov.scot/publications/local-government-finance-circular-2-2019-settlement-for-2019-2020/</a> [accessed 26 June 2019]
Scottish Parliament Information Centre. (2017, December 18). Local Government Finance: Draft Budget 2018-19 and provisional allocations to local authorities. Retrieved from <a href="https://digitalpublications.parliament.scot/ResearchBriefings/Report/2017/12/18/Local-Government-Finance--Draft-Budget-2018-19-and-provisional-allocations-to-local-authorities" target="_blank">https://digitalpublications.parliament.scot/ResearchBriefings/Report/2017/12/18/Local-Government-Finance--Draft-Budget-2018-19-and-provisional-allocations-to-local-authorities</a> [accessed 22 December 2017]
Burn-Murdoch, A. (2018, June 8). Local Government funding – the story behind the figures. Retrieved from <a href="https://spice-spotlight.scot/2018/06/08/local-government-funding-the-story-behind-the-figures/" target="_blank">https://spice-spotlight.scot/2018/06/08/local-government-funding-the-story-behind-the-figures/</a> [accessed 26 June 2019]
Berthier, A., Burn-Murdoch, A., Aiton, A., & Finnigan, K. (2018, November 9). Local Government Finance: The funding formula and local taxation income. Retrieved from <a href="https://digitalpublications.parliament.scot/ResearchBriefings/Report/2018/11/9/Local-Government-finance--the-Funding-Formula-and-local-taxation-income#" target="_blank">https://digitalpublications.parliament.scot/ResearchBriefings/Report/2018/11/9/Local-Government-finance--the-Funding-Formula-and-local-taxation-income#</a> [accessed 28 November 2018]