Labour market update: July 2019
This briefing provides an overview of the Scottish labour market from the latest regional labour market statistics from the Office for National Statistics (ONS).
Executive Summary
This briefing provides an overview of the Scottish labour market from the latest regional labour market statistics1 and UK labour market statistics2 published by the Office for National Statistics (ONS). The majority of the data are for Mar-May 2019, unless otherwise stated.
Unemployment in Scotland (3.3%) is the third lowest since comparable records began in 1992, despite the number of unemployed women increasing over the quarter.
Employment increased over the quarter to 75.8%, despite the employment rate for men decreasing.
The inactivity rate in Scotland fell by 0.1 percentage point to 21.6%. However, over the year Scotland saw the second largest increase in inactivity rates of all the nations and regions of the UK.
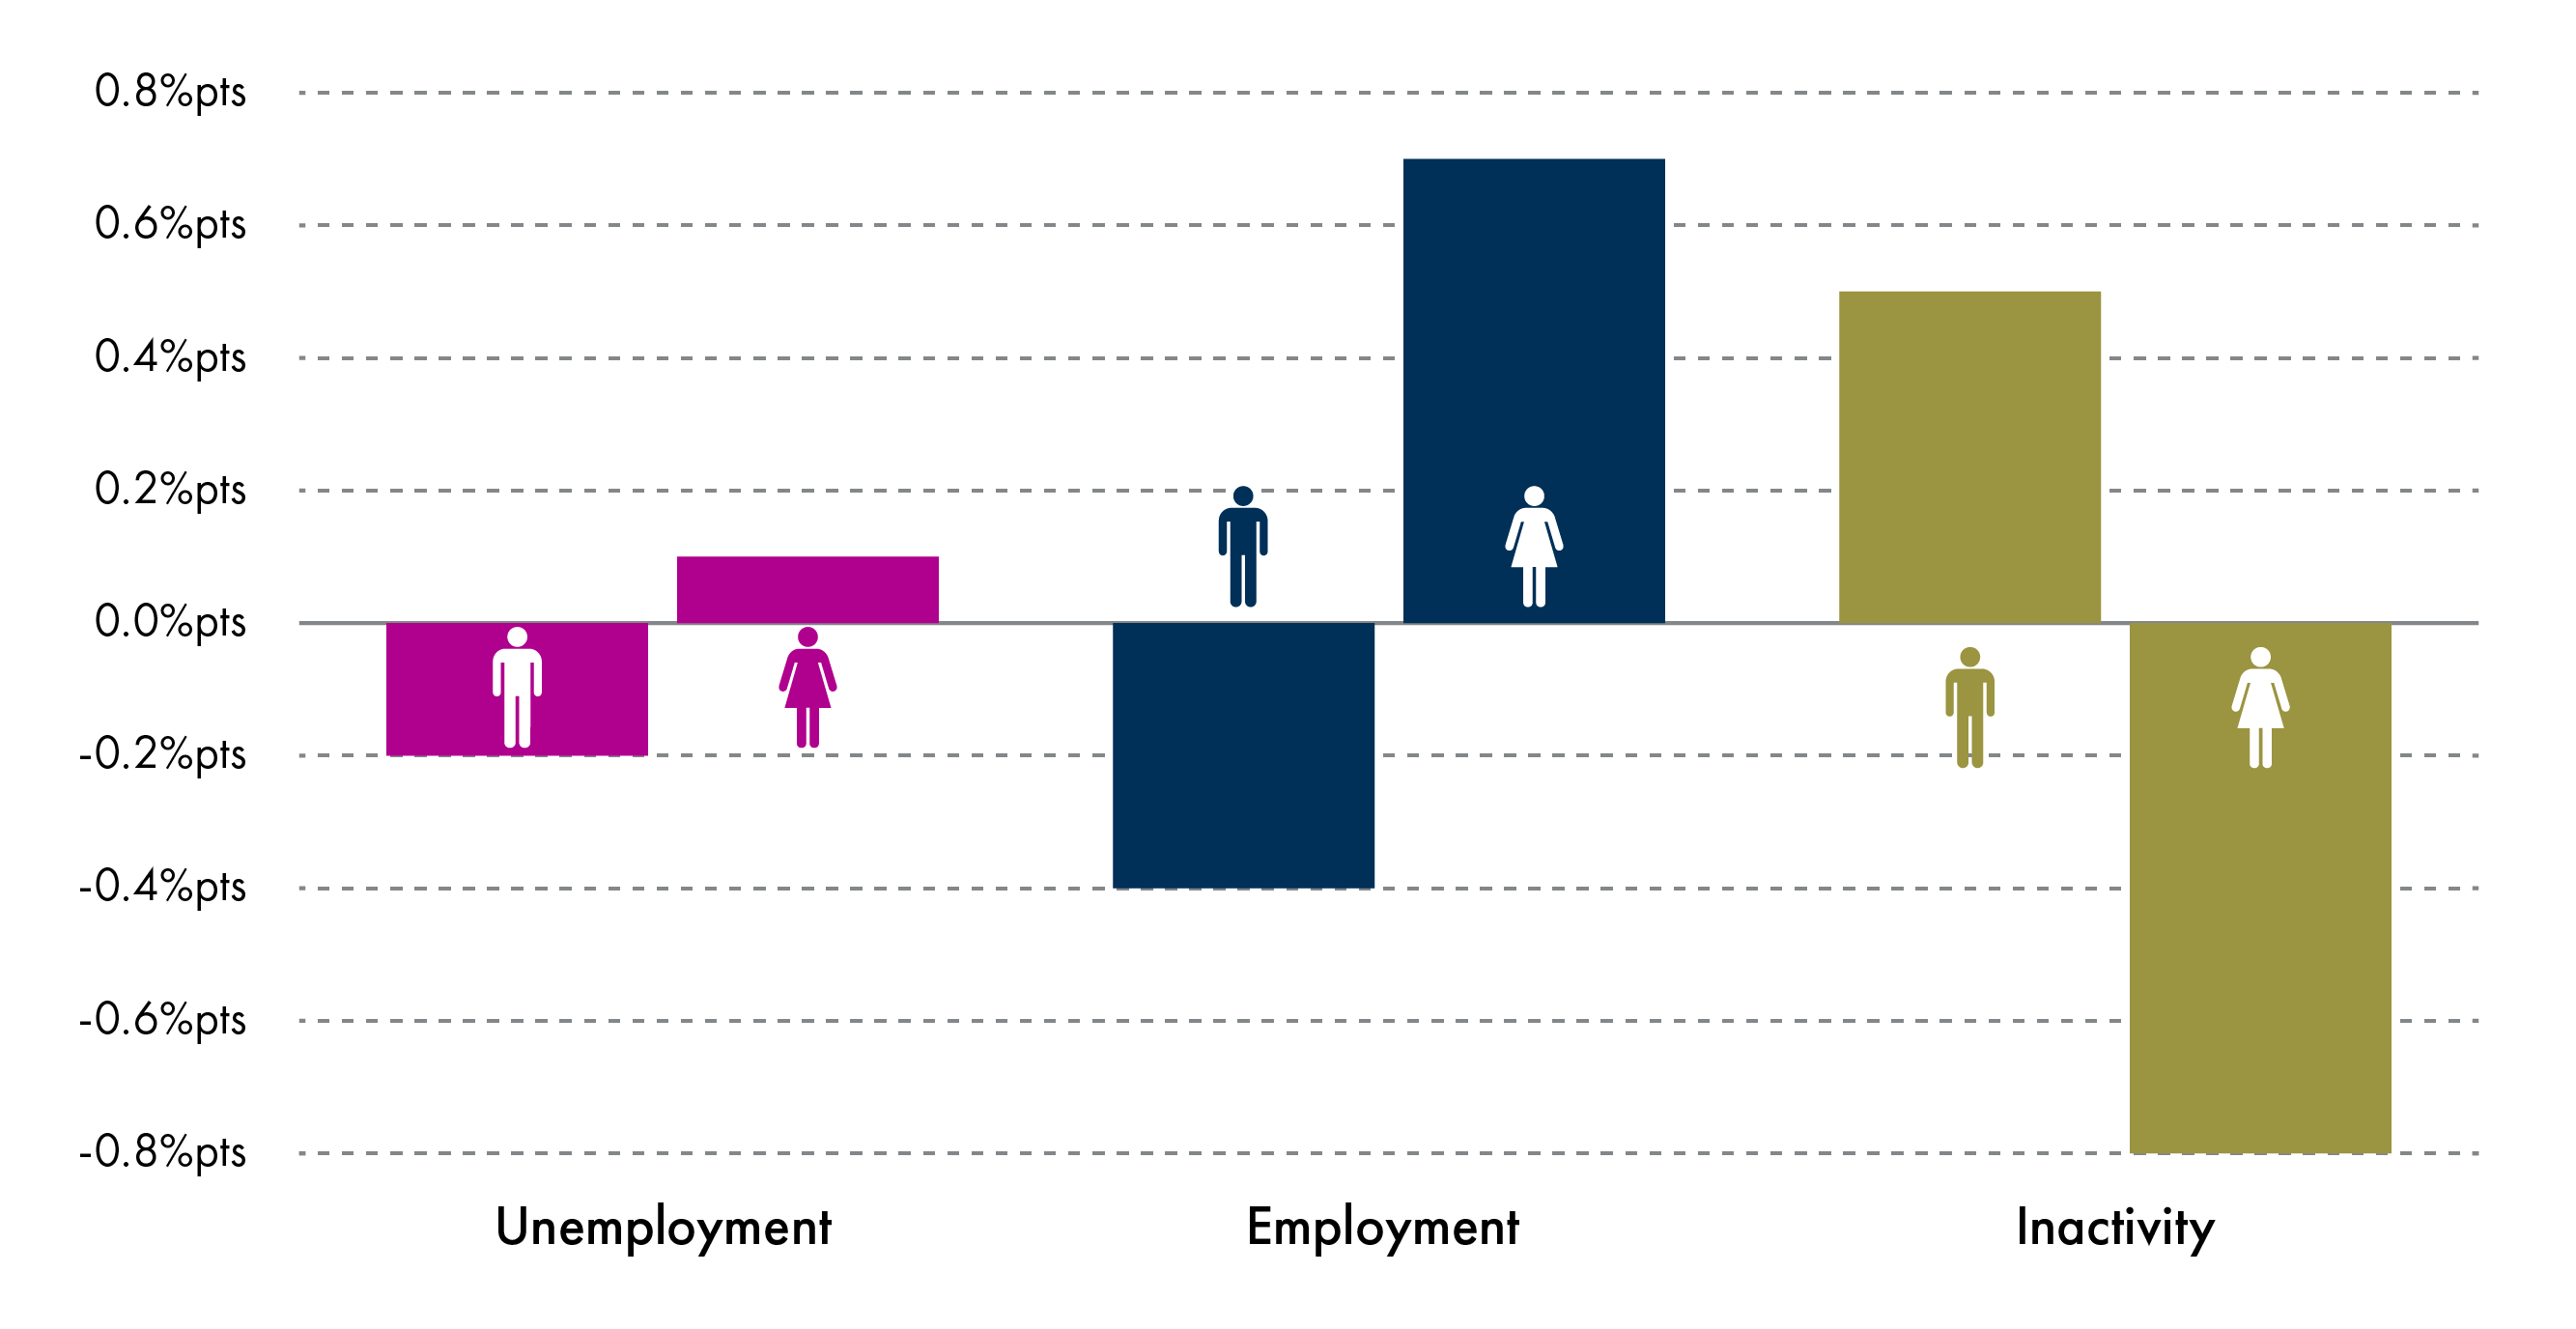
Figure 1 shows the change in unemployment, employment and inactivity rates over the quarter by gender.
The following table shows the unemployment, employment and inactivity rates and the change on the previous quarter.
| Overall | Men | Women | ||||
|---|---|---|---|---|---|---|
| Rate (%) | Change over the qtr (% pts) | Rate (%) | Change over the qtr (% pts) | Rate (%) | Change over the qtr (% pts) | |
| Unemployment | 3.3% | 0.0 | 3.6% | -0.2 | 2.9% | +0.1 |
| Employment | 75.8% | +0.5 | 79.1% | -0.4 | 72.5% | +0.7 |
| Economic Inactivity | 21.6% | -0.1 | 17.8% | +0.5 | 25.2% | -0.8 |
What are the labour market measurements?
The International Labour Organisation provides the official definition of labour market statistics.
What is unemployment?
Level: Any individual aged 16 and over without a job who has been actively seeking work within the last four weeks and is available to start work within the next two weeks.
Rate: Number of unemployed individuals as a proportion of the total number of economically active people, which includes both the unemployed and those in work.
What is employment?
Level: Any individual aged 16 and over who is undertaking one hour or more a week of paid work.
Rate: Number of people in employment expressed as a percentage of all people aged 16-64.
What is economic inactivity?
Level: Any individual aged 16 to 64 who is not in employment, has not looked for work in the last four weeks, and/or is unable to start work within the next two weeks.
Rate: Number of people economically inactive expressed as a percentage of all people aged 16-64.
The main reasons for economic inactivity are:
being a student and not having or looking for a job
looking after the family and/or home
being sick (temporary and long-term)
being retired
being discouraged.
You can find out more in formation on labour market statistics in the SPICe Labour market statistics briefing.
Unemployment
The number of unemployed people in Scotland decreased by 1,000 over the quarter and by 26,000 over the year.
The unemployment rate for Scotland is 3.3%, whilst for the UK as a whole it is 3.8%. The UK level has not been lower since October to December 19741, the Scottish rate is the third lowest since comparable record began in 1992 (3.2% in Jan-Mar 2019).
The unemployment rate in Scotland fell over the year at a faster rate than the UK.
| Level ('000) | Quarter change ('000) | Year change ('000) | Rate (%) | Quarter change (% pts) | Year change (% pts) | |
|---|---|---|---|---|---|---|
| Scotland | 92 | -1 | -26 | 3.3% | 0.0 | -0.9 |
| UK | 1,292 | -51 | -116 | 3.8% | -0.1 | -0.4 |
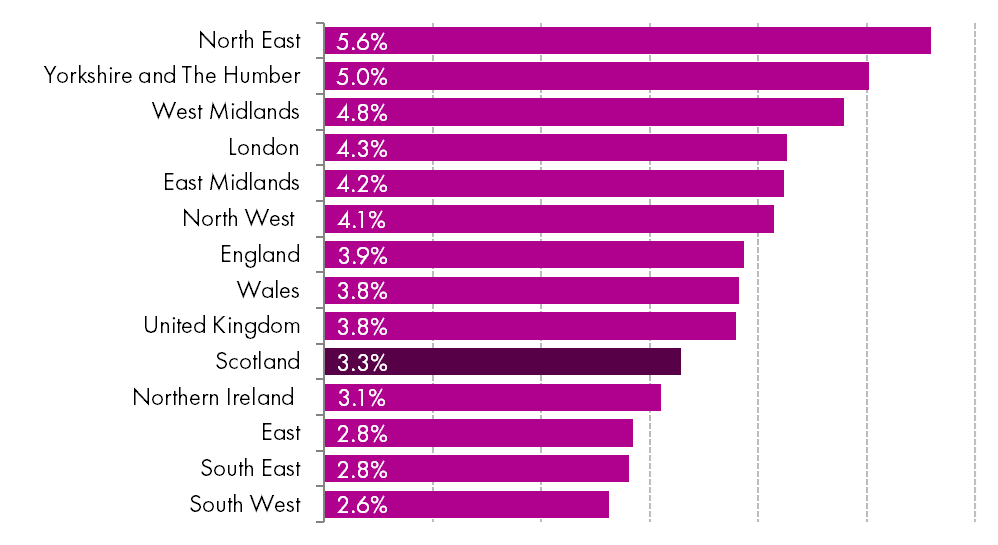
Looking at unemployment across the UK, the South West of England has the lowest rate at 2.6%, whilst the North East of England has the highest at 5.6%. The rate in Scotland is fifth lowest across the UK.
The data shows that Scotland saw the largest decrease in the unemployment rate over the year of all the nations and regions of the UK
Unemployment by gender
Over the quarter, the unemployment level decreased by 1,000 in Scotland. The number of unemployed men fell by 3,000 while the number of unemployed women increased by 2,000.
Over the year, the unemployment level fell by 26,000 in Scotland (17,000 men and 9,000 women).
The unemployment rate for both men and women in Scotland fell over the year. The unemployment rate for both men and women is lower in Scotland than the UK.
The unemployment rate for women in the UK fell to 3.8% in the three months to May 2019 and the lowest since comparable records began in 1971. 1
| Level ('000) | Quarter change ('000) | Year Change ('000) | Rate (%) | Quarter change (% pts) | Year change (% pts) | ||
|---|---|---|---|---|---|---|---|
| Scotland | Men | 52 | -3 | -17 | 3.6% | -0.2 | -1.2 |
| Women | 39 | +2 | -9 | 2.9% | +0.1 | -0.7 | |
| UK | Men | 712 | -19 | -42 | 4.0% | -0.1 | -0.3 |
| Women | 580 | -31 | -74 | 3.6% | -0.2 | -0.5 |
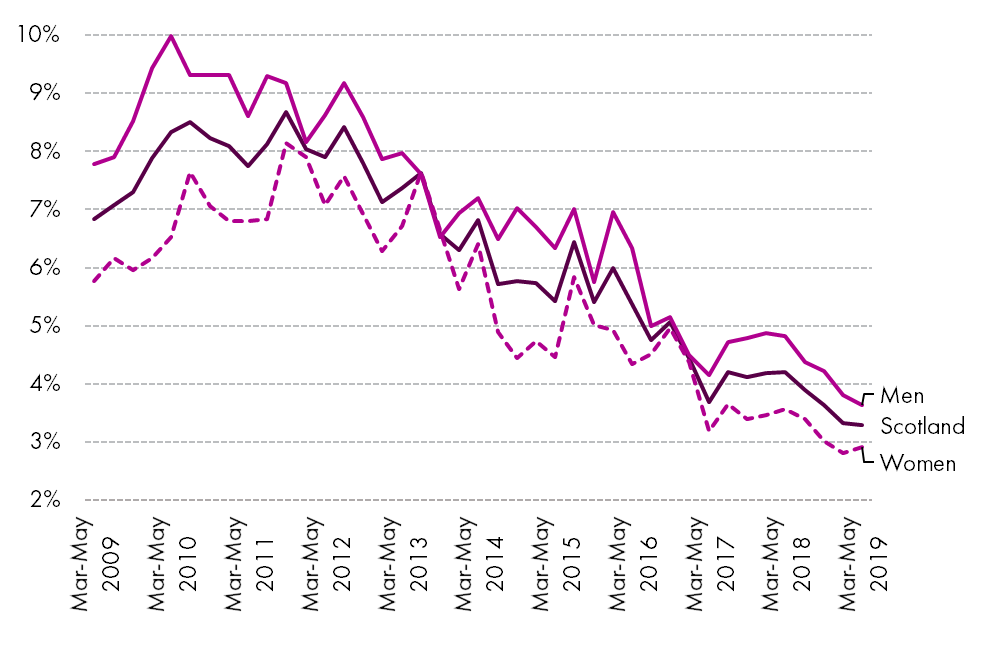
Figure 3 shows how unemployment rates by gender in Scotland have changed over the past 10 years.
The unemployment rate for men peaked at 10.0% in the Mar-May 2010. Since then it has fallen by 6.3 percentage points, and now sits at 3.6%.
The unemployment rate for women peaked at 8.1% in Sep-Nov 2011. Since then it has fallen by 5.2 percentage points to the current rate of 2.9%, slightly above the previous quarter.
Unemployment by age
Unemployment by age data is not seasonally adjusted, so is compared with the same quarter in previous years.
The unemployment rates for 16 to 24 year olds (6.8%) is the third lowest since comparable records began in 2002.
The only age group in Scotland that deviates significantly from the UK is 16-24 year olds, at 3.6 percentage points lower that the UK.
| Age group | Scotland | UK | |
|---|---|---|---|
| 16-24 | Rate | 6.8% | 10.4% |
| Year change (% pts) | -4.0 | -0.4 | |
| 25-34 | Rate | 3.5% | 3.1% |
| Year change (% pts) | +0.6 | -0.6 | |
| 35-49 | Rate | 2.1% | 2.5% |
| Year change (% pts) | -0.6 | -0.2 | |
| 50-64 | Rate | 2.6% | 2.8% |
| Year change (% pts) | -1.1 | -0.3 |
Employment
The number of people aged 16 and over in employment in Scotland increased by 7,000 over the quarter and by 18,000 over the year.
The rate in Scotland increased over both the quarter and the year.
The number of people in employment and the rate are currently the second highest since comparable records began in 1992.
| Level ('000) | Quarter change ('000) | Year change ('000) | Rate (%) | Quarter change (% pts) | Year change (% pts) | |
|---|---|---|---|---|---|---|
| Scotland | 2,695 | +7 | +18 | 75.8% | +0.5 | +0.2 |
| UK | 32,749 | +28 | +354 | 76.0% | -0.1 | +0.4 |
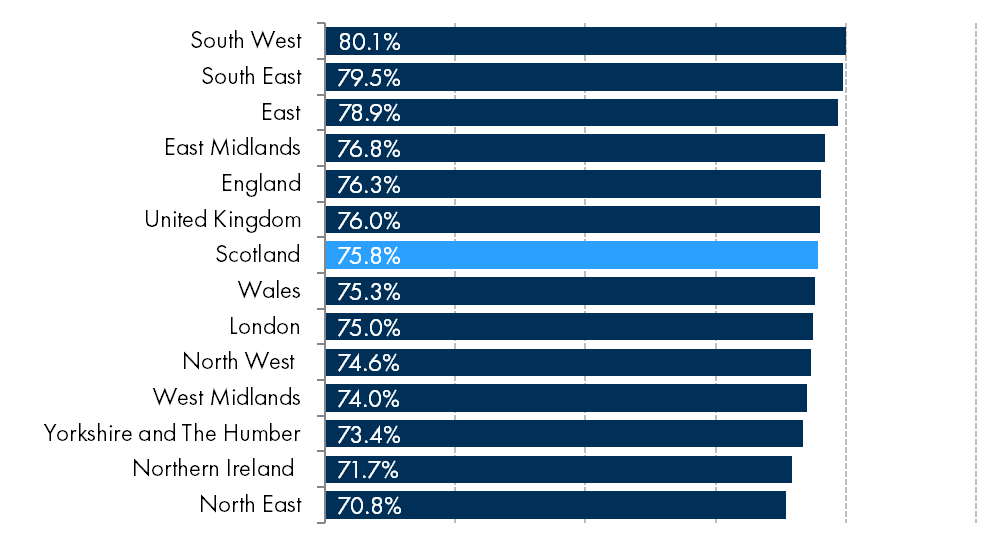
Looking at employment across all the regions of the UK, the Scottish rate is just below the UK average. The South West has the highest rate at 80.1%, whilst the North East has the lowest at 70.8%.
Employment by gender
Employment levels and rates are higher for men than for women at both the Scottish and UK levels.
Over the last quarter the employment level increased by 7,000 in Scotland (4,000 fewer men and 11,000 more women).
In Scotland, the number of women in employment and the rate for women are currently the second highest since comparable records began in 1992. While across the UK, the employment rate was the joint highest since comparable records began in 19711.
The rate for men fell over the quarter but increased over the year, while it increased over both the quarter and the year for women.
The employment rate for women in Scotland is higher than the UK, whilst it is lower for men.
| Level ('000) | Quarter change ('000) | Year change ('000) | Rate (%) | Quarter change (% pts) | Year change (% pts) | ||
|---|---|---|---|---|---|---|---|
| Scotland | Men | 1,386 | -4 | +17 | 79.1% | -0.4 | +0.2 |
| Women | 1,309 | +11 | +2 | 72.5% | +0.7 | +0.2 | |
| UK | Men | 17,280 | -31 | +142 | 80.2% | -0.3 | +0.1 |
| Women | 15,469 | +59 | +212 | 72.0% | +0.1 | +0.7 |
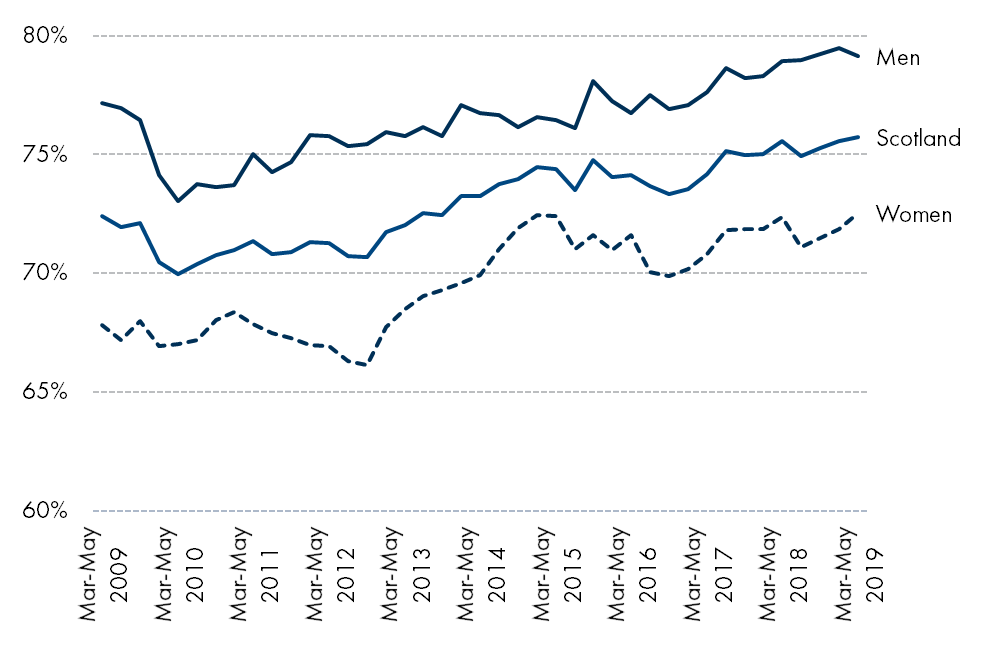
Figure 5 shows how employment rates by gender in Scotland have changed over the past 10 years.
The employment rate for women has increased by 6.4 percentage points since Sep-Nov 2012, when it was its lowest in the last 10 years, at 66.1%. It is now the second highest rate since comparable records began on 1992.
Men's employment rate has increased by 6.5 percentage points since Mar-May 2010.
While the employment rate for men has generally grown from 2010 onward the rate for women has stalled since around the beginning of 2015.
Employment by age
Employment by age data is not seasonally adjusted, so is compared with the same quarter in previous years.
Despite a slight decrease over the year, the employment rate for 50-64 year olds has increased by 12.6 percentage points since 2002.
The youth employment rate (16-24) is the only age group which deviates significantly from the UK, at 5.4 percentage points higher.
| Age group | Scotland | UK | |
|---|---|---|---|
| 16-24 | Rate (%) | 58.7% | 53.3% |
| Year change (% pts) | +2.5 | -0.3 | |
| 25-34 | Rate (%) | 84.2% | 84.7% |
| Year change (% pts) | +0.8 | +1.0 | |
| 35-49 | Rate (%) | 85.1% | 85.5% |
| Year change (% pts) | -0.1 | +0.2 | |
| 50-64 | Rate (%) | 70.2% | 72.4% |
| Year change (% pts) | -0.9 | +0.6 |
Economic inactivity
The number of economically inactive people in Scotland fell over the quarter by 5,000, but was increased by 19,000 over the year.
| Level ('000) | Quarter change ('000) | Year change ('000) | Rate (%) | Quarter change (% pts) | Year change (% pts) | |
|---|---|---|---|---|---|---|
| Scotland | 745 | -5 | +19 | 21.6% | -0.1 | +0.5 |
| UK | 8,619 | +83 | -43 | 20.9% | +0.2 | -0.1 |
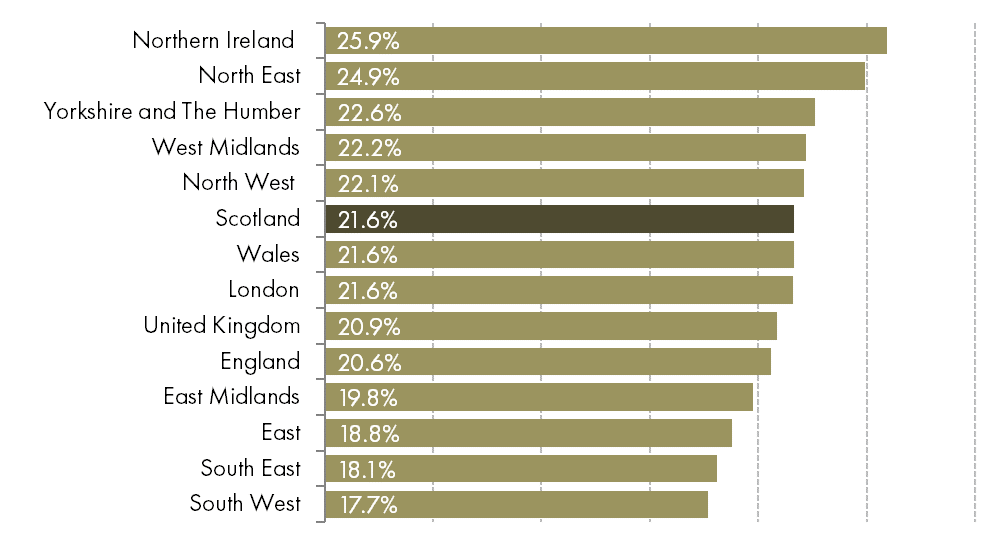
Looking at economic inactivity across the UK, the Scottish rate is above the UK average. Northern Ireland has the highest rate at 25.9%, whilst the South West has the lowest at 17.7%.
The data shows that Scotland saw the second largest increase in the inactivity rate over the year of the nations and regions of the UK
Economic inactivity by gender
Economic inactivity rates are higher for women than for men.
Over the quarter, the number of inactive men increased by 9,000, whilst the number of inactive women fell by 14,000.
Over the the year, the number of inactive men increased by 13,000, while the number of inactive women increased by 5,000.
The inactivity rate for men is higher in Scotland than in the UK overall while it is about the same for women.
| Level ('000) | Quarter change ('000) | Year change ('000) | Rate (%) | Quarter change (% pts) | Year change (% pts) | ||
|---|---|---|---|---|---|---|---|
| Scotland | Men | 300 | +9 | +13 | 17.8% | +0.5 | +0.8 |
| Women | 445 | -14 | +5 | 25.2% | -0.8 | +0.3 | |
| UK | Men | 3,368 | +78 | +25 | 16.4% | +0.4 | +0.1 |
| Women | 5,251 | +5 | -68 | 25.3% | 0.0 | -0.4 |
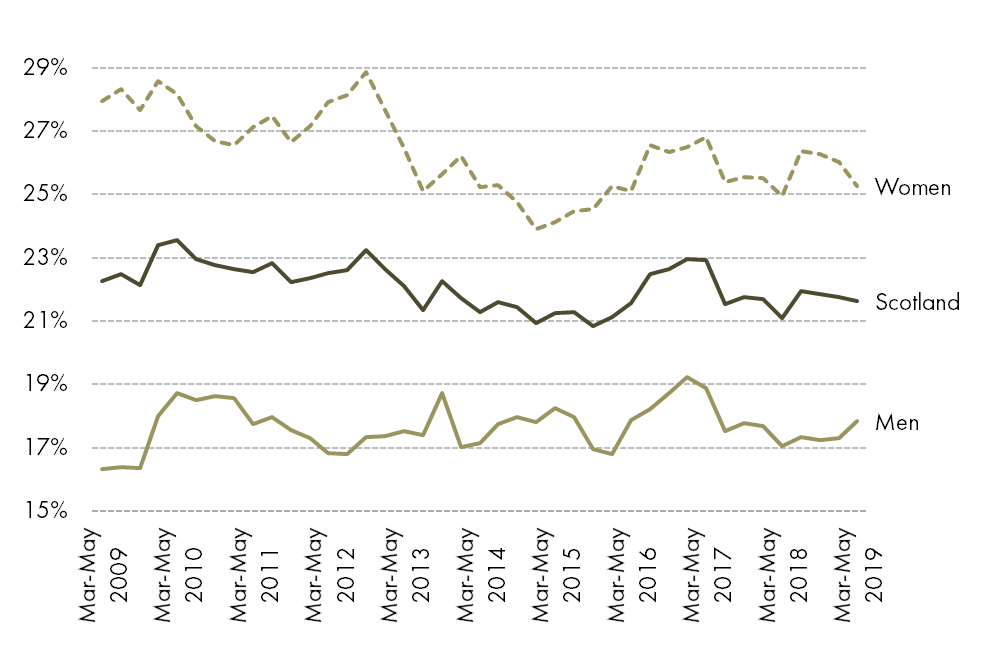
Figure 7 shows how inactivity rates by gender in Scotland have changed over the past 10 years.
The inactivity rate for men peaked in Dec-Feb 2017, at 19.2%. Since then it has fallen by 1.4 percentage points. The lowest rate for men in the last 10 years was in Mar-May 2009, at 16.3%.
The inactivity rate for women peaked at 28.9% in Sep-Nov 2012. It then fell to 23.9% by Sep-Nov 2012, and now sits at 25.2%.
Economic inactivity by age
This data is not seasonally adjusted so is compared with the same quarter in previous years.
Despite an increase of 0.6 percentage points over the year, the inactivity rate for 50-64 year olds has fallen by 11.6 percentage points since 2002.
| Age Group | Scotland | UK | |
|---|---|---|---|
| 16-24 | Rate (%) | 37.0% | 40.5% |
| Year change (% pts) | 0.0 | +0.5 | |
| 25-34 | Rate (%) | 12.8% | 12.6% |
| Year change (% pts) | -1.3 | -0.5 | |
| 35-49 | Rate (%) | 13.1% | 12.4% |
| Year change (% pts) | +0.6 | 0.0 | |
| 50-64 | Rate (%) | 27.9% | 25.5% |
| Year change (% pts) | +0.6 | -0.4 |
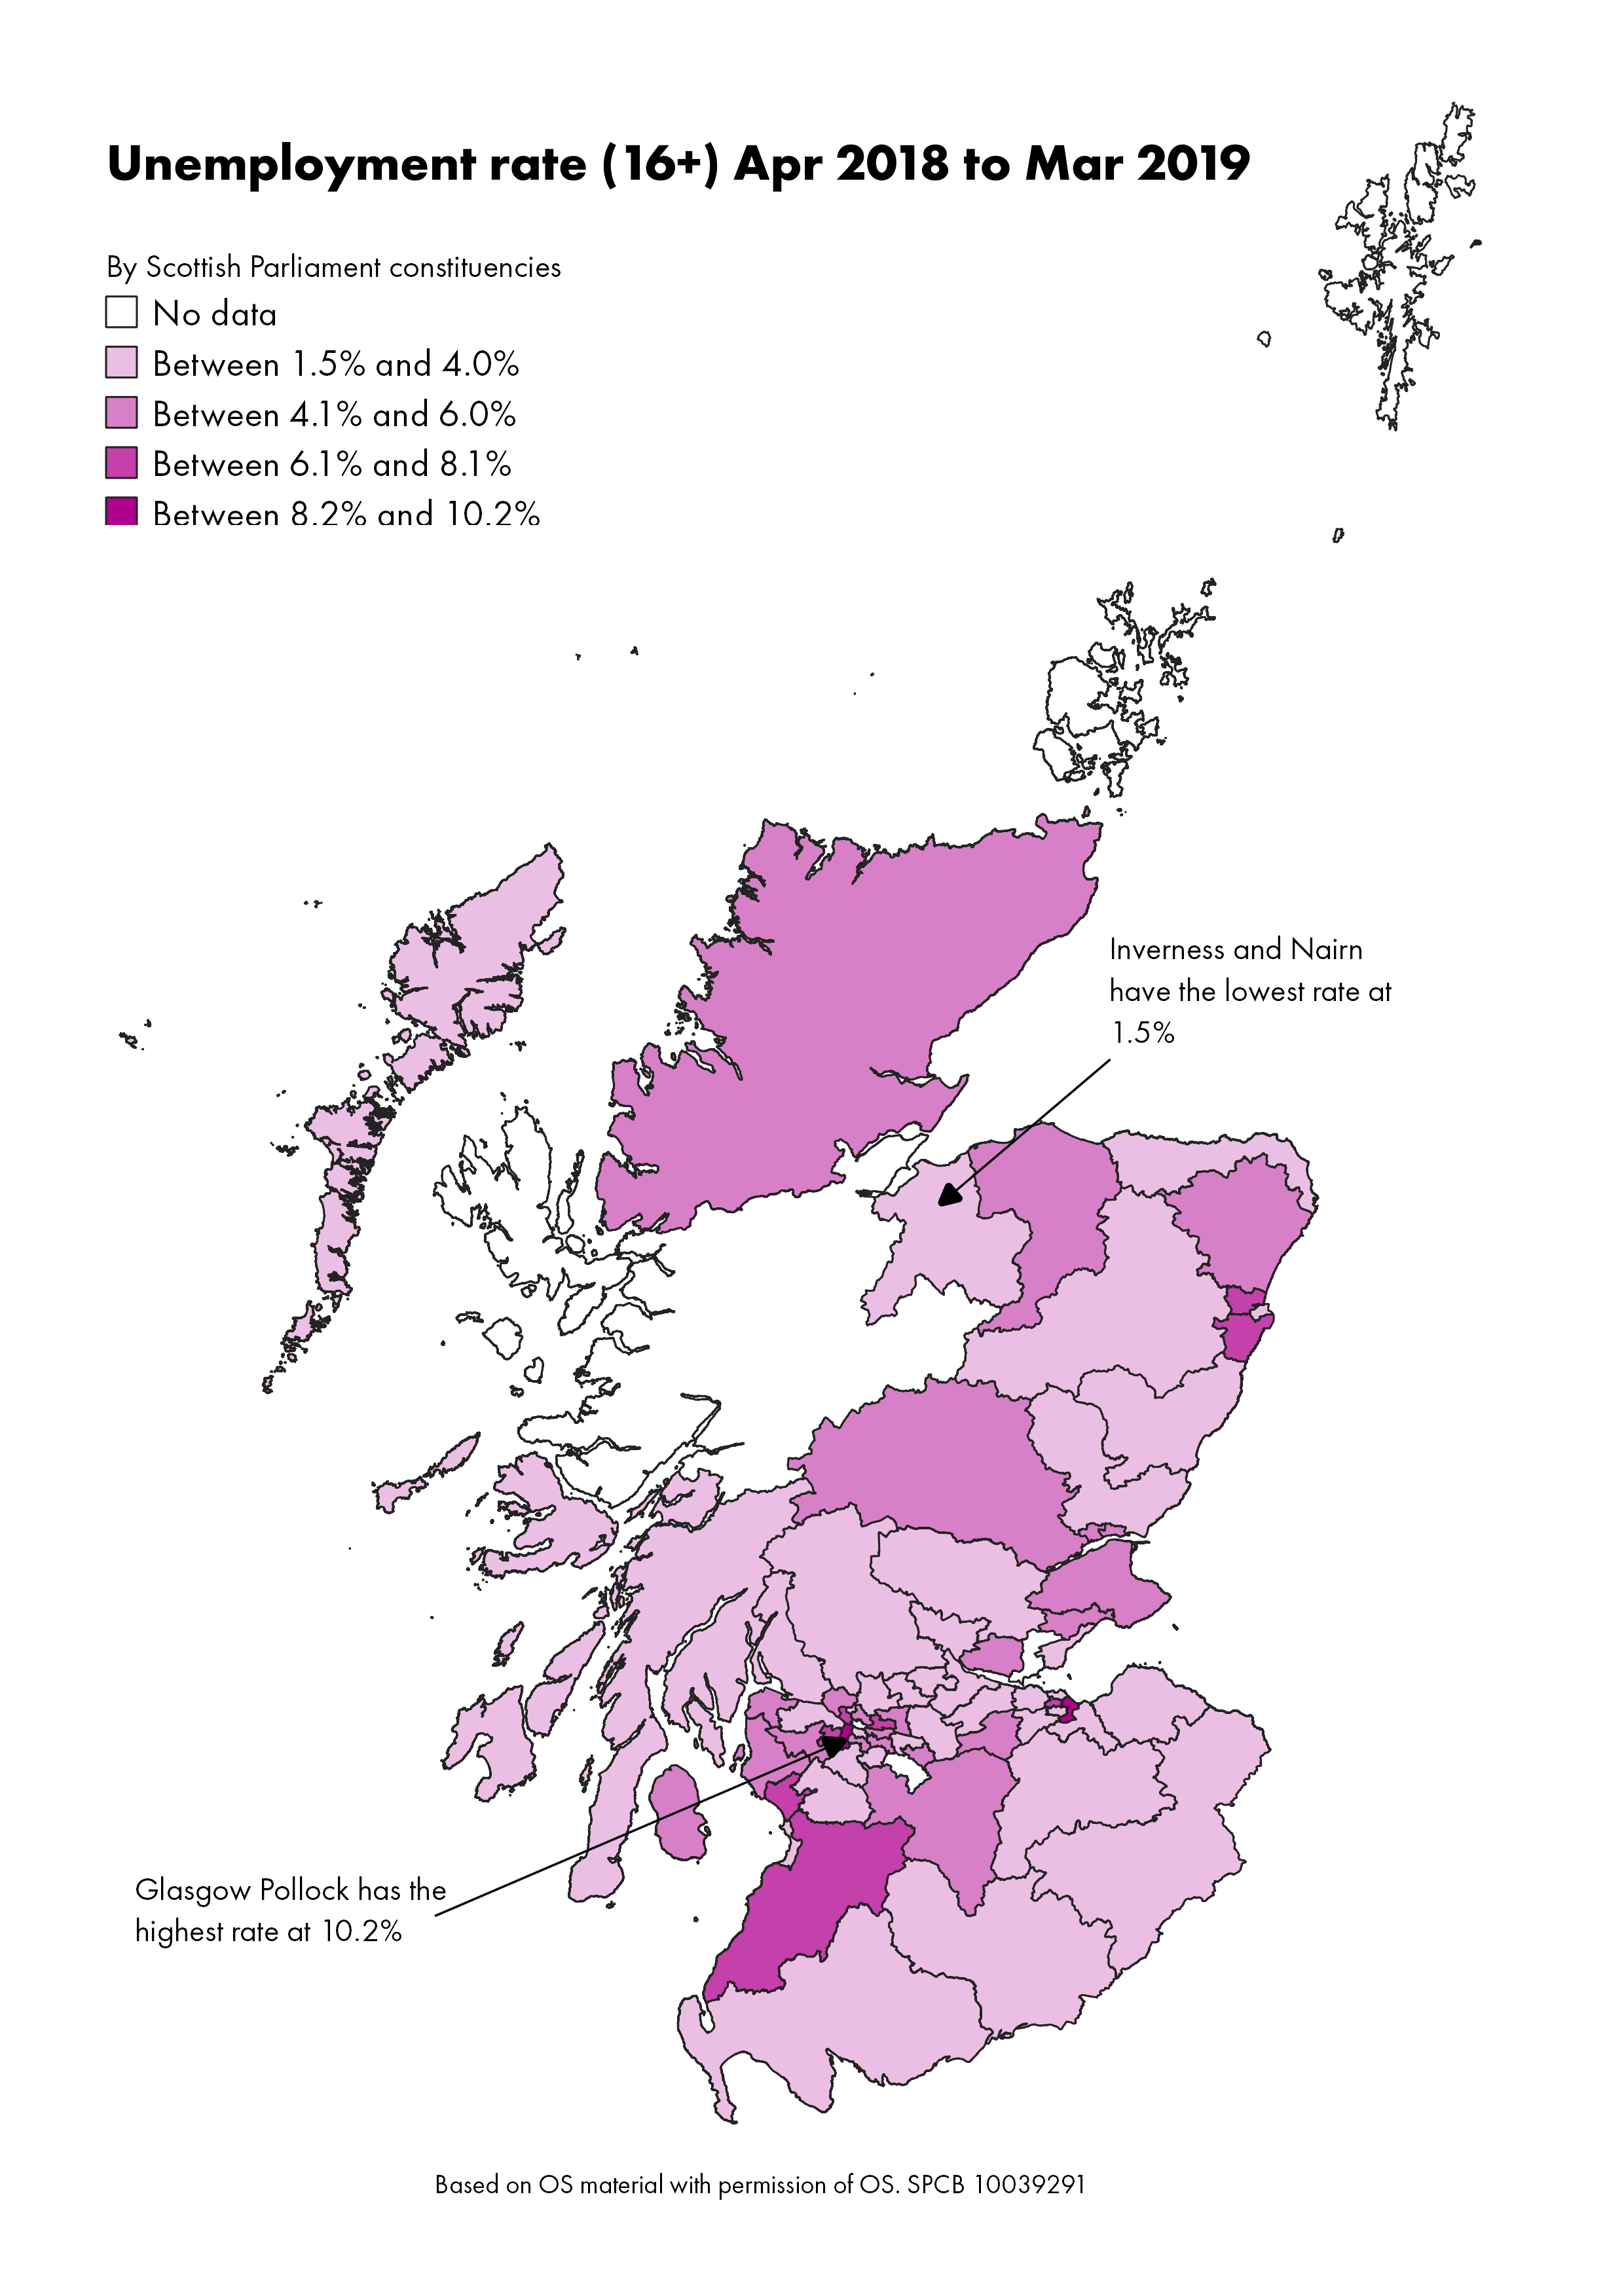
Constituency data: unemployment
Constituency data for Scotland comes from the Annual Population Survey (APS). The APS datasets are produced quarterly, with each dataset containing 12 months of data. This data is based on residence analysis of the APS.
The latest APS data is for Apr 2018-Mar 2019.
Inverness and Nairn has the lowest unemployment rate at 1.5%, whilst Glasgow Pollock has the highest at 10.2%. Na h-Eileanan an Iar saw the biggest decrease over the year, whilst Glasgow Anniesland saw the largest increase.
This data is from the resident analysis of the APS, meaning the rate is for those who live in each constituency.
Find out the latest labour market data for your constituency.
Sources
Office for National Statistics. (2019, July 16). Regional labour market statistics in the UK: July 2019. Retrieved from <a href="regionallabourmarketstatisticsintheukjuly2019" target="_blank">regionallabourmarketstatisticsintheukjuly2019</a> [accessed 16 July 2019]
Office for National Statistics. (2019, July 16). Labour market overview, UK: July 2019. Retrieved from <a href="https://www.ons.gov.uk/employmentandlabourmarket/peopleinwork/employmentandemployeetypes/bulletins/uklabourmarket/july2019" target="_blank">https://www.ons.gov.uk/employmentandlabourmarket/peopleinwork/employmentandemployeetypes/bulletins/uklabourmarket/july2019</a> [accessed 16 July 2019]