Child poverty in Scotland: forecasting the impact of policy options
This briefing looks at a range of illustrative tax and benefit policy options to see how effective different policy interventions might be in tackling child poverty. It is based on analysis undertaken by Dr Paola De Agostini of the Institute for Social and Economic Research (ISER) at the University of Essex.
Executive Summary
In Scotland, depending on the measure used, up to a quarter of children are living in poverty. According to the Scottish Government, if no action is taken, then this figure could increase to one in three children living in poverty by 2030.
The Child Poverty (Scotland) Act 2017 includes four targets aimed at reducing child poverty in Scotland by 2030. These targets state that, by 2023-24, of children living in Scottish households:
less than 18% should be living in relative poverty
less than 14% should be living in absolute poverty
less than 8% should be living with combined low income and material deprivation
less than 8% should be living in persistent poverty.
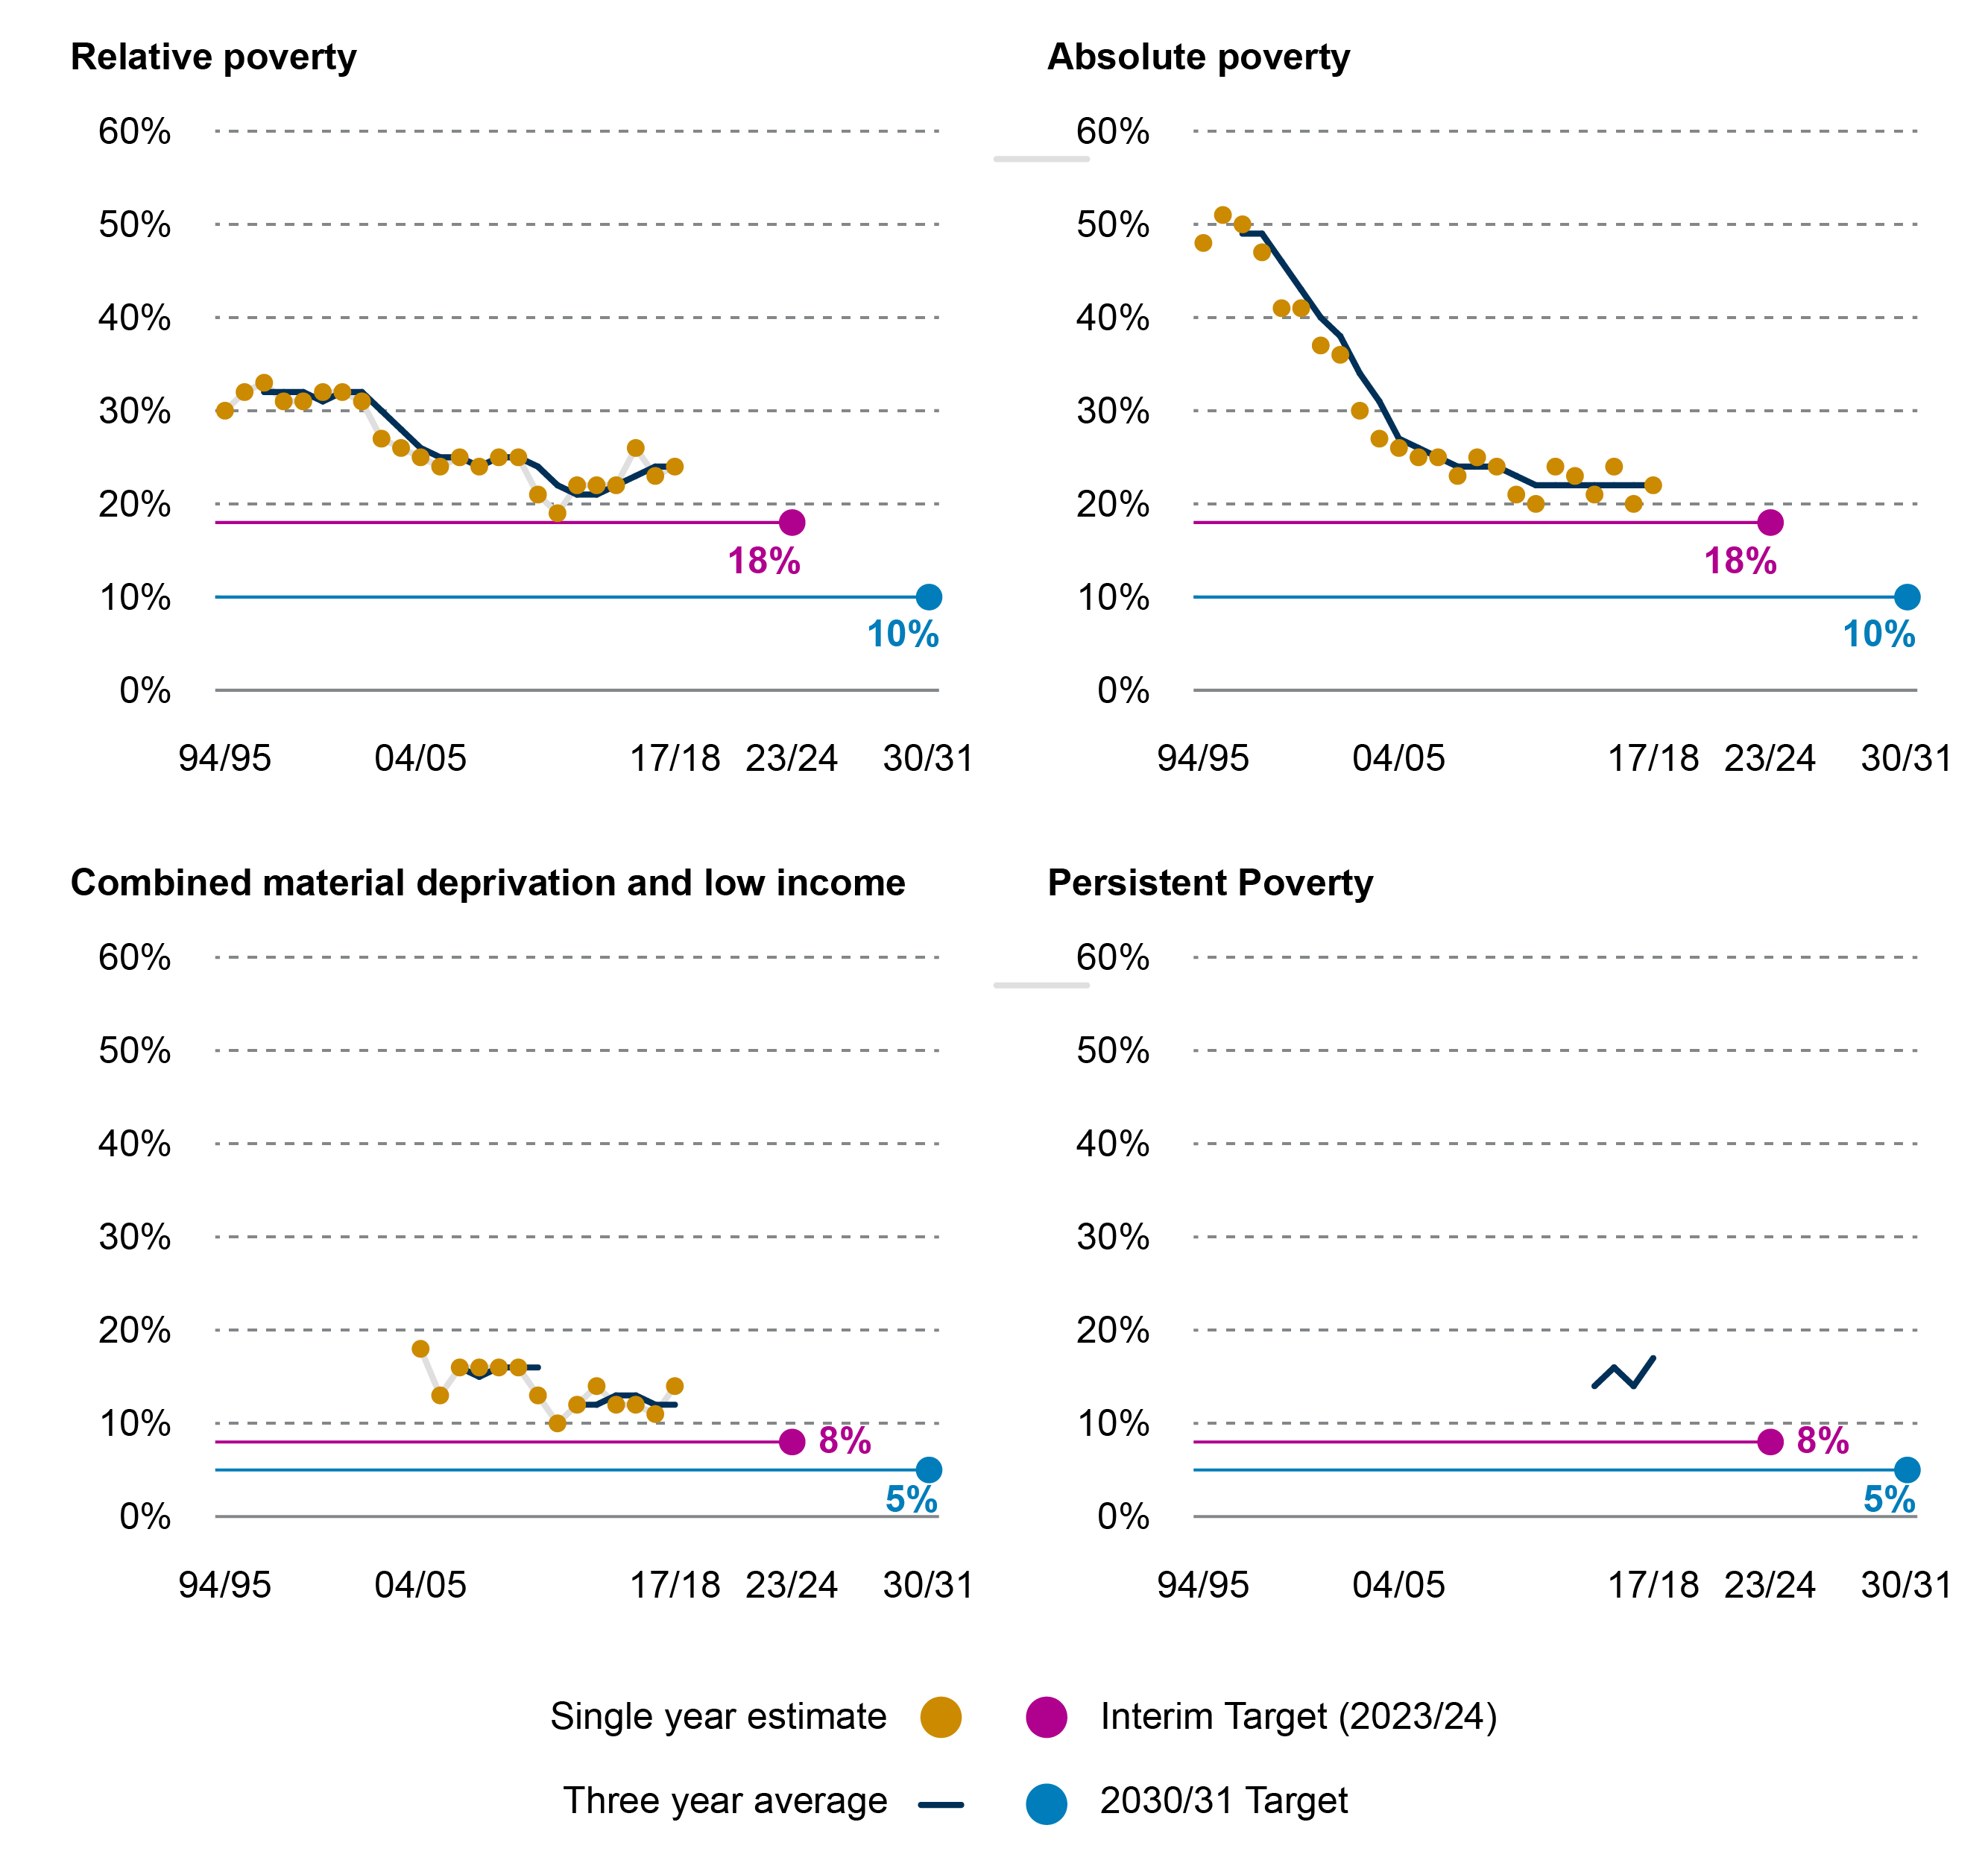
Further targets are also set for 2030-31. At March 2018, child poverty on all measures was at least double the 2030 targets.
In common with other research in this area, the analysis presented here shows that, if no further policy action is taken, child poverty is likely to continue to rise through to 2023-24. The analysis shows that, on the basis of current policy plans and economic forecasts for the period, child poverty would be expected to rise from 23% in 2016-17 to 27% in 2023-24 (on a relative poverty measure). This compares with the interim target of 18%.
A range of illustrative policy options are considered to see how effective they would be in tackling child poverty. These policy scenarios were selected to illustrate the range of impacts that might be achieved through alternative policy actions and are purely illustrative in nature. They are intended to provide evidence to support the debate surrounding policy interventions in this area and should not be interpreted as recommended policy actions.
Three options - all with an annual cost of around £0.8 billion - are compared:
Reducing the starter rate of income tax from 19% to 0%.
Increasing child benefit by £18.45 per week per child.
Changing the child-related elements of Universal Credit:
removing the two child limit
increasing the child element by 80% to £417 per month
re-introducing a family element of £545 per year.
The analysis shows that, if a sum of £0.8 billion was to be spent on tackling child poverty, the third option considered - changing the child-related elements of Universal Credit - would be the most effective. This policy would be expected to reduce relative child poverty to 22% by 2023-24. Although this is still higher than the interim target of 18%, it is more effective than the other policy options analysed.
By comparison, reducing the starter rate of income tax to 0% would be expected to have a small negative effect on child poverty (relative child poverty would be expected to be 28% in 2023-24, compared to 27% if no action is taken). A substantial increase in child benefit of £18.45 per week per child would be expected to reduce relative child poverty to 24% in 2023-24.
The choice of policy will also impact on family types differently:
Reducing the starter rate of income tax only benefits families where at least one adult is working; poorer families benefit less as they are less likely to be paying income tax and any gains are offset by the impact of reductions in means-tested benefits.
All households with children gain from an increase in child benefit, but as child benefit is not means-tested, the impact of this policy is not directed at poorer families; for lone parent families, the gains are not enough to offset other reductions over the period to 2023-24.
The changes to Universal Credit that were considered are specifically targeted at poorer households with children, so have a larger impact for those households at the bottom of the income distribution and the biggest impact on child poverty.
The analysis highlights how different policy choices - even within the same cost envelope - could have very different implications for child poverty. It also highlights that even quite significant changes to individual benefits within the social security system are unlikely (in isolation) to reduce child benefit to the target levels for 2023-24. This is intended to provide some illustrative scenarios to inform the debate around child poverty as the Scottish Government implements its Child Poverty Delivery Plan, and considers the introduction of a new "income supplement".
All analysis presented in this paper was undertaken by Paola De Agostini ([email protected]) using EUROMOD, a microsimulation model developed and maintained by the Institute for Social and Economic Research (ISER) at the University of Essex.
Context: child poverty in Scotland
In Scotland, depending on the measure used, up to a quarter of children are living in poverty.1 According to the Scottish Government, if no action is taken, then this figure could increase to one in three children living in poverty by 2030.2
The Child Poverty (Scotland) Act 2017 includes four targets aimed at reducing child poverty in Scotland by 2030. 3
The targets state that, by 2030-31, of children living in Scottish households:
less than 10% should be living in relative poverty
less than 5% should be living in absolute poverty
less than 5% should be living with combined low income and material deprivation
less than 5% should be living in persistent poverty.
The Act also includes a set of interim targets to be met by 2023-24:
less than 18% should be living in relative poverty
less than 14% should be living in absolute poverty
less than 8% should be living with combined low income and material deprivation
less than 8% should be living in persistent poverty.
The measures of poverty that the Scottish Government uses in its targets are defined in the Child Poverty (Scotland) Act and set out in Table 1.
| Measure | Definition |
|---|---|
| Relative poverty | Children in families with incomes1 less than 60% of the contemporary UK median income |
| Absolute poverty | Children in families with incomes1 less than 60% of inflation adjusted 2010-11 median income |
| Combined low income and material deprivation | Children in families with incomes less than 70% of the contemporary median and who cannot afford a number of essential goods and services |
| Persistent poverty | Children in families who have been in relative poverty for three out of the past four years |
1 Incomes are adjusted to reflect family size ("equivalised") to reflect the fact that a larger family will require a higher income in order to achieve the same standard of living as a smaller family.
All four targets are based on the income available to a household after they have paid their rent or mortgage ("income after housing costs"). "Relative" measures are primarily measures of inequality. They reflect the distance between a disadvantaged family and the median family in that year. "Absolute" measures capture what is happening to the incomes of those at the bottom of the income distribution, independent of the incomes of the rest of society. In a policy context they help to answer the following questions:
is the gap between the poorest and the "average" family narrowing? (relative measures)
are the incomes of the poor rising? (absolute measures).
Figure 1 shows performance against each of these measures and includes both the interim (2023-24) and final (2030-31) targets.
At March 2018, child poverty on all measures was at least double the 2030 targets.
Scottish GovernmentScottish Government. (2019, March 28). Poverty and income inequality in Scotland: 2015-2018. Retrieved from https://www.gov.scot/publications/poverty-income-inequality-scotland-2015-18/ [accessed 09 April 2019]
The Child Poverty Act requires Scottish Ministers to publish regular child poverty delivery plans and to publish annual reports setting out progress against the targets. Local authorities and health boards are also required to publish annual reports setting out what they are doing to tackle child poverty in the local area.
The Act also establishes a statutory Poverty and Inequality Commission from 1 July 2019. There is currently a Poverty and Inequality Commission operating on a non-statutory basis, which was set up in July 2017. In February 2018, the Commission published its first report to the Scottish Government, providing advice and recommendations to the Scottish Government prior to publication of the first Delivery Plan.5 In January 2019, the Commission published an update on progress against the recommendations it had made to the Scottish Government.6
Scottish Government child poverty strategy
On 29 March 2018, the Scottish Government published Every Child, Every Chance: the Tackling Child Poverty Delivery Plan 2018-22. This plan sets out the actions that the Scottish Government plans to take in the next five years in order to reduce child poverty in Scotland.
The plan states:
Poverty is fundamentally about lack of income. That’s why the targets in the Act focus primarily on income measures and why the majority of the actions set out in this Plan are aimed specifically at increasing family incomes or reducing costs. 1
Actions highlighted in the plan include:
£12 million investment in employment support for parents
increased funding for the Workplace Equality Fund
a new minimum payment for the School Clothing Grant
£1 million on support for children experiencing food insecurity during school holidays
new support for childcare after school and in the holidays
a new focus on families in the Warmer Homes Scotland programme
£3 million investment in a new Financial Health Check service
£1 million for the Carnegie UK Trust’s Affordable Credit Loan Fund
a new income supplement for parents on low incomes
a new Best Start Grant for children in lower income families during the early years, to replace the Sure Start Maternity Grant
£2 million investment for the Children’s Neighbourhoods Scotland programme
£1.35 million for the further education sector to develop initiatives with colleges and for the Student Awards Agency for Scotland’s outreach programme
£500,000 for a community education programme for Gypsy/Traveller families
£7.5 million Innovation Fund with The Hunter Foundation
£500,000 for the Healthier, Wealthier Children approach.
Comparing alternative policy scenarios
The purpose of this project, undertaken jointly by SPICe and the Institute for Social and Economic Research (ISER) at the University of Essex, was to look at a range of alternative policy scenarios and consider the impact that they might have on child poverty in Scotland by 2023-24. The analysis was undertaken using EUROMOD, a microsimulation model developed and maintained by ISER. 1 2Further details on EUROMOD and how it was used for this analysis can be found in Annex A.
A range of policy scenarios have been considered. The selected scenarios focus on tax and benefit measures, as EUROMOD models direct taxes and benefits and so is only able to evaluate policies that involve changes to direct taxes and/or benefits. However, it is recognised that other non-tax/benefit measures are likely to be adopted in the bid to tackle child poverty. For example, the Scottish Government's Delivery Plan includes measures such as extended childcare and greater access to affordable credit. Measures such as these cannot be evaluated using a tax-benefit model.
It should be stressed that these policy scenarios were selected to illustrate the range of impacts that might be achieved through alternative policy actions and are purely illustrative in nature. They are intended to provide evidence to support the debate surrounding policy interventions in this area and should not be interpreted as recommended policy actions.
To illustrate the impact of different policy actions, the analysis includes both interventions that are directly within the Scottish Government's powers as well as interventions that would require UK Government action, or where the mechanisms that the Scottish Government might use to achieve the outcome are untested as yet. For example, powers to change the rules around Universal Credit (for example, removing the two child limit) are reserved to the UK Government, but the Scottish Government might be able to mitigate decisions made by the UK Government through the introduction of new benefits or through use of top up powers.
As noted by the Scottish Government in its Child Poverty Delivery Plan3:
There are...key policy levers that the Scottish Government has little control over. We will only be responsible for 15% of social security spend and crucially this doesn’t include the main aspects that affect children. We don’t have employment powers either and we can’t, for example, raise the National Minimum Wage.
The plan goes on to note that, where the Scottish Government does not have control over relevant policy levers, it will "continue to try and influence the agenda, making the case for why having very low levels of child poverty makes economic sense and is good for people and society too".
The Poverty and Inequality Commission has recommended that the Scottish Government should make effective use of its new social security powers. In its first progress report, the Commission said:
... the [Scottish] Government should also consider how they can make more use of their new powers around creating new benefits and supplementing current ones. While the commitment to pay an income supplement to low income families is welcome, it is not likely to be paid until 2022. The Government should look at what they can do to speed this up or if there are other mechanisms that can be used to get money into the pockets of those who need it.4
It should also be noted that this analysis looks at policy measures in isolation but, in reality, a number of interventions are likely to be introduced and run concurrently. In addition, in the real world, other external factors will also be changing, such as changes in the level of economic activity, changes in demographic composition or changes in the distribution of income. It is complex to model all of these factors and influences simultaneously. As such, this analysis uses published forecasts for factors such as inflation and wages, but assumes other factors will remain constant, such as population characteristics. It also provides a static analysis - that is, it does not take into account any behavioural responses that might result from the policy changes such as decisions to work, or to change working hours.
On the other hand, the advantage of performing this type of analysis is that it allows the effect of a policy on household income to be isolated from other effects such as demographic or labour supply changes. This means that all the forces playing a role in shaping future trends of child poverty can be considered to see which factors are making a positive contribution and which are making a negative contribution.
This analysis is intended to support and inform the debate regarding the most appropriate tax and benefit policy interventions to reduce child poverty. As reflected by the comments above, it is not seeking to identify any one solution or policy recommendation, but is seeking to highlight some of the issues that need to be addressed in considering the impact of policy decisions on child poverty in Scotland.
The analysis presented in this briefing focuses on two of the measures of child poverty: relative and absolute poverty in Scotland. In both cases, this is based on income after housing costs.
The baseline position: no action
Before looking at the impact of alternative policy interventions, it is important to first consider what would be expected to happen to child poverty if no action was taken. That is, if no changes were made to the current tax and benefit policies, but economic growth, wages and inflation moved in line with current forecasts, what would happen to child poverty? The forecasts incorporated into the analysis are those published by the Office for Budget Responsibility (OBR) in October 2018.1
Table 2 shows the proportion of people in relative and absolute poverty after housing costs (AHC) in Scotland.
Figures for 2016-17 are Households Below Average Income (HBAI) data, for which 2016-17 were the latest data available when the analysis was undertaken
Figures for 2018-19 show what would be expected in the current year (2018-19) based on what we know has happened and the policy changes that have taken place between 2016-17 and 2018-19
Figures for 2023-24 show what would be expected by 2023-24 on the basis of the forecasts available, the changes to tax and benefit policies announced by December 2018 and the changes due to take place over the period to 2023-24, such as the further roll out of Universal Credit.
This table sets out what would be expected to happen to child poverty by 2023-24 on the basis of current and announced policy and October 2018 OBR forecasts
| 2016-17 | 2018-19 | 2023-24 | |
|---|---|---|---|
| All | |||
| Relative poverty (%) | 19 | 20 | 20 |
| Absolute poverty (%) | 17 | 18 | 18 |
| Children | |||
| Relative poverty (%) | 23 | 26 | 27 |
| Absolute poverty (%) | 20 | 23 | 24 |
| Note: all poverty measures are after housing costs (AHC) | |||
Source: HBAI and Euromod analysis
As shown in Table 2, estimates suggest that child poverty has continued to rise between 2016-17 and 2018-19, reaching 26% on the relative poverty measure and 23% on the absolute poverty measure. If no further action is taken, the current projections suggest that child poverty will continue to rise through to 2023-24, reaching 27% on the relative poverty measure and 24% on the absolute poverty measure.
In projecting forwards to 2023-24, it is assumed that:
wages, inflation and GDP move in line with October 2018 OBR forecasts
tax thresholds and benefit payment levels rise in line with current indexation policy
policy changes that have been announced by the UK and Scottish Governments up to January 2019 but have yet to be implemented are assumed to be fully in place by 2023-24
Universal Credit (UC) is assumed to be fully rolled out by 2023-24.
For further details about the modelling assumptions used in the analysis, see Annex B.
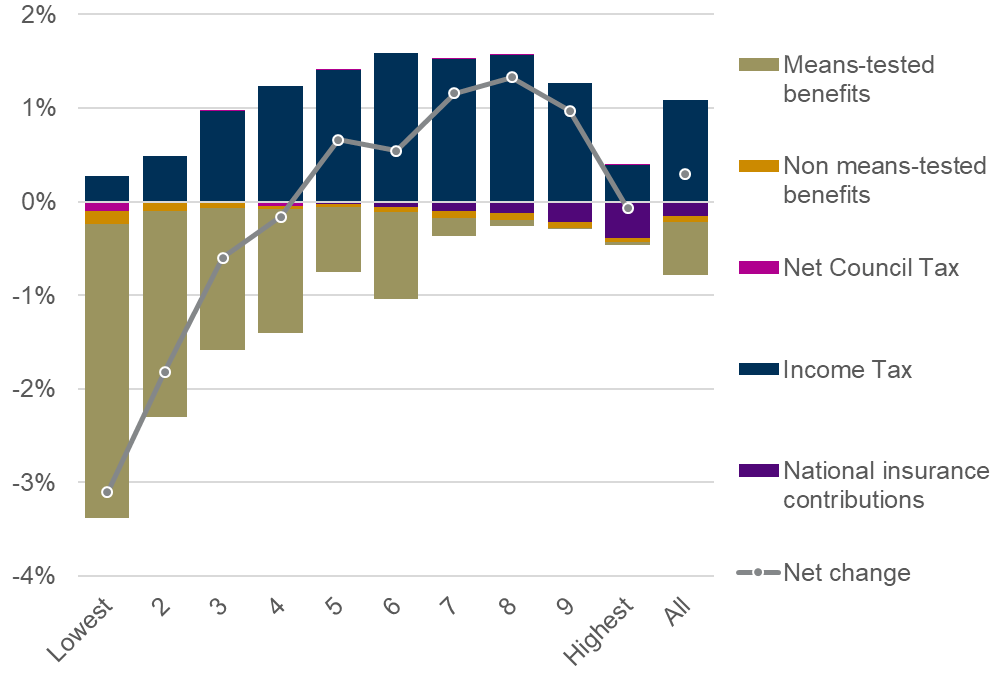
Figure 2 shows how the announced changes to taxes and benefits and indexation decisions will affect different income groups by 2023-24, as compared with the 2018-19 tax and benefit system.
% change in real terms in equivalised disposable income between 2018-19 and 2023-24 for Scottish families by income decile

Source: EUROMOD analysis
The results show average gains or losses from five broad parts of the direct tax and benefit system, and the net effect of all of them together combining the various negative and positive effects (as shown by the solid line) . Negative effects are due to increases in tax and contribution liabilities, or to reductions in benefit and pension entitlements (for those receiving them). Positive effects are due to tax and contribution cuts or benefit increases. This is shown for each tenth (‘decile’) of individuals based on household income in 2018-19. The analysis is based on 'equivalised household income' which adjusts household income to reflect the fact that larger households will require a higher income in order to achieve the same standard of living as a single person household. (The equivalisation is based on the OECD modified equivalisation scale.)
The components included are:
Income tax
National Insurance contributions (employee and self-employed)
State pensions, including the Basic State Pension, War Pension and Widow’s Pension
Council Tax, net of Council Tax benefit or Council Tax support (referred to in graphs as Net Council Tax)
Non means-tested benefits (including Child Benefit, Winter Fuel Payments, Attendance allowance, Disability Living Allowance, Personal Independent Payment, contributory Jobseeker’s Allowance, contributory Employment and Support Allowance, Industrial Injuries pension, Carer’s Allowance and Scottish Supplementary Carer’s Allowance, Severe Disablement Allowance, Statutory Sick Pay, Statutory Maternity Pay, Maternity Allowance, training allowances, Student payments, Student Loan)
Means-tested benefits (including Working Tax Credit, Child Tax Credit, Income Support, income based Employment and Support Allowance, income based Jobseeker’s Allowance, Universal Credit, Pension Credit, Housing Benefit and the effect of the benefit cap). Universal Credit is included in means-tested benefits (replacing other means-tested benefits for working age benefit units where relevant).
Looking at the results in Figure 2, the net effect of the existing/announced policies for the period is negative overall for the average household. Means-tested benefits will be lower (in real terms), and this has the largest negative effect, particularly for lower income groups. Different income groups will be affected differently, depending on the extent to which they rely on earned income and benefits. Overall the largest net negative impact is for the lowest two income deciles, whose equivalised disposable income falls by 2-3% over the period.
For the top two income deciles, the effect of income tax is negative i.e. income tax will act to reduce income. This is because, for these higher income groups, the announced income tax plans, combined with indexation of thresholds and wage growth means that income tax will have a negative impact on their disposable income by 2023-24. For lower income deciles, changes to income tax over the period have a small positive impact on disposable income as a result of increases to the personal allowance and the Scottish Government's changes to income tax (with indexation of thresholds for future years).
Selected "what if" scenarios
Three scenarios for 2023-24 were selected for analysis. As highlighted previously, these were selected to provide a range of evidence to support the policy debate and should not be seen as policy recommendations. The analysis is focused on how the selected policy interventions would help in achieving the interim targets for child poverty. As noted earlier, the interim targets for child poverty state that by 2023-24, less than 18% of children in Scottish households should be living in relative poverty and less than 14% should be living in absolute poverty.
The selected scenarios are:
Reducing income tax in Scotland
Increasing child benefit
Changing the child-related elements of Universal Credit (UC)
For each scenario, the following questions were considered:
What would be the impact on child poverty of spending a specific amount on a given policy? e.g. if the Scottish Government spent £800 million on increasing child benefit, what would this achieve in terms of child poverty?
What would be the distributional effect of the policy? i.e. how would richer and poorer income groups be affected?
How would different family types be affected?
Scenario A: Reducing income tax in Scotland
In April 2018, the Scottish Government introduced a five-band income tax policy. In its budget for 2019-20, the Scottish Government announced plans to retain the five-band structure but adjusted some of the thresholds at which the rates would apply, as set out in Table 3.
| Bands | Band name | Rate |
|---|---|---|
| Over £12,500* - £14,549 | Starter | 19 |
| Over £14,549 - £24,944 | Basic | 20 |
| Over £24,944 - £43,430 | Intermediate | 21 |
| Over £43,430 - £150,000** | Higher | 41 |
| Above £150,000** | Top | 46 |
* Assumes individuals are in receipt of the standard UK personal allowance (£12,500 in 2019-20)
** Those earning more than £100,000 will see their personal allowance reduced by £1 for every £2 earned over £100,000
Scenario A considers the effect of reducing the starter rate of income tax from 19% to 0%. Note that this is not quite the same as extending the personal allowance to £14,549, as the Scottish Government does not have the power to vary the personal allowance. The personal allowance would remain at £12,500 and would still be tapered for those earning more than £100,000. The estimated annual cost of this policy is £0.8 billion. To provide a basis for comparison, this cost of £0.8 billion was used as the basis for the other modelled scenarios i.e. in the other scenarios considered, the policies were designed so as to give a comparable expenditure of £0.8 billion.
This table shows the impact of reducing the starter rate of income tax on child poverty
| % of children living in poverty, after housing costs | 2016-17 | 2018-19 | 2023-24: no action | 2023-24: with policy action (Scenario A) |
|---|---|---|---|---|
| Relative poverty (%) | 23 | 26 | 27 | 28 |
| Absolute poverty (%) | 20 | 23 | 24 | 24 |
| Note: under 'no action', it is assumed that the tax threshold rises in line with inflation | ||||
Source: HBAI (2016); Euromod (estimates for 2018 and 2023)
Table 4 shows that these changes to income tax in Scotland would not have an impact on child poverty. When comparing the outcomes in 2023-24 with no additional policy action with the outcomes under scenario A:
The relative measure of poverty suggests that the proportion of children living in poverty would increase slightly from 27% to 28%.
The absolute poverty measure shows no change, remaining at 24%.
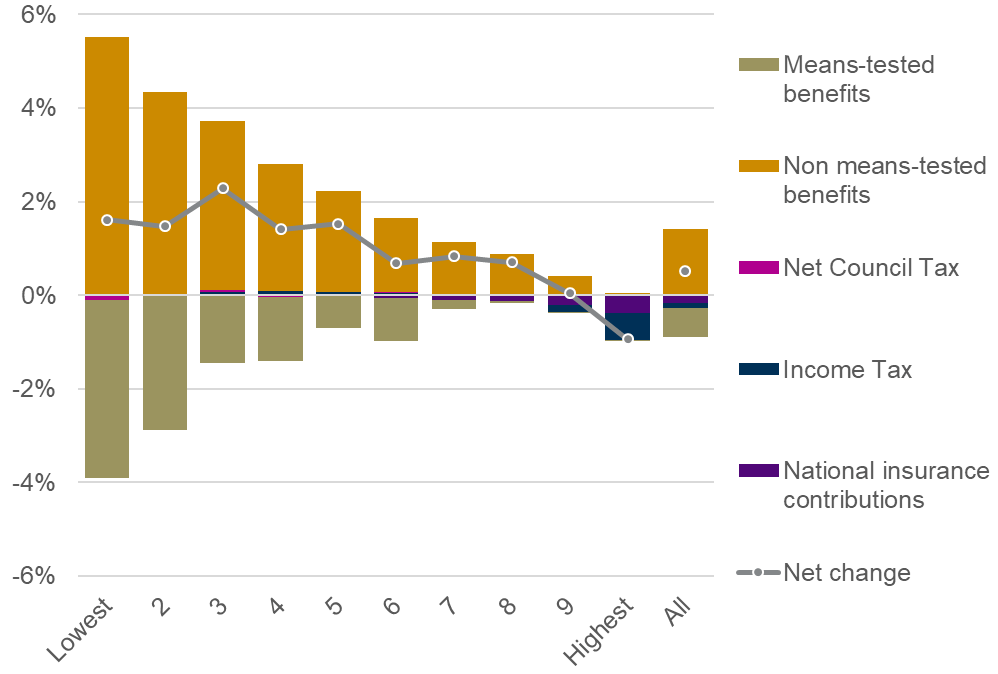
% change in real terms in equivalised disposable income between 2018-19 and 2023-24 for Scottish families by income decile
Source: EUROMOD analysis
Figure 3 analyses changes in family net income ranking Scottish families by net income decile groups in 2018. This shows that the policy would do little for the poorest families, but would benefit those on middle or higher incomes. Families on higher incomes are more likely to benefit from tax changes when compared with those at the lower end of the income distribution, who are more likely to be dependent on benefits rather than earned income.
Figure 3 shows that Scottish families would gain on average 0.3% of their household disposable income from reduced income taxes if the starter tax rate was reduced to 0%. The families gaining from this policy would be those working and with earnings above the personal tax allowance. For families at the bottom of the income distribution, any increased household income would be overshadowed by a lower entitlement to means-tested benefit. Such trade-offs would mean an average reduction of more than 3% in household disposable income for the lowest income group. As explained above, the results assume that families do not alter their employment (or other) decisions in response to policy changes, so the effect shown in Figure 3 is purely a policy effect.
Scenario B: Increasing child benefit
Child benefit is paid to families with children and currently stands at £20.70 per week for the eldest (or only) child and £13.70 per week for additional children. It is not means-tested, although some of the benefit is reclaimed through the tax system if the claimant (or claimant's partner) earns more than £50,000. Child benefit rates and eligibility are set by the UK Government. Child benefit rates have been frozen since 2015 along with a number of other benefits. They are due to resume rising in line with inflation from 2020. Although the rate is set by the UK Government, the Scottish Government can top up existing benefits and could use these powers to achieve the same result as an increase in child benefit.
Scenario B considers the effect of increasing child benefit for both first children and additional children by £18.45 per week. This would make current child benefit rates £39.15 per week for eldest (or only) children and £32.15 per week for all other children. The estimated annual cost of this policy is £0.8 billion. As noted previously, the level of increase for this scenario was chosen so as to give a cost comparable to the cost of Scenario A.
This table shows the impact that increasing child benefit rates by £18.45 per week would have on child poverty
| % of children in poverty, after housing costs | 2016-17 | 2018-19 | 2023-24: no action | 2023-24: with policy action (Scenario B) |
|---|---|---|---|---|
| Relative poverty (%) | 23 | 26 | 27 | 24 |
| Absolute poverty (%) | 20 | 23 | 24 | 21 |
| Note: under 'no action', it is assumed that child benefit payment rates rise in line with inflation | ||||
Source: HBAI (2016); Euromod (estimates for 2018 and 2023)
Table 5 shows that increasing child benefit by £18.45 per week for each child would reduce relative child poverty by 3 percentage points to 24%, compared with what would be expected in 2023 without this policy intervention. Absolute child poverty would be expected to reduce from 24% to 21%. This means that increasing child benefit by this amount would reduce the average distance between the average disadvantaged child in Scotland and the median Scottish child in 2023-24. Absolute child poverty is also reducing under this scenario, suggesting that many poor families in Scotland have children and, by targeting children through child benefit, this policy also increases the incomes of their families.
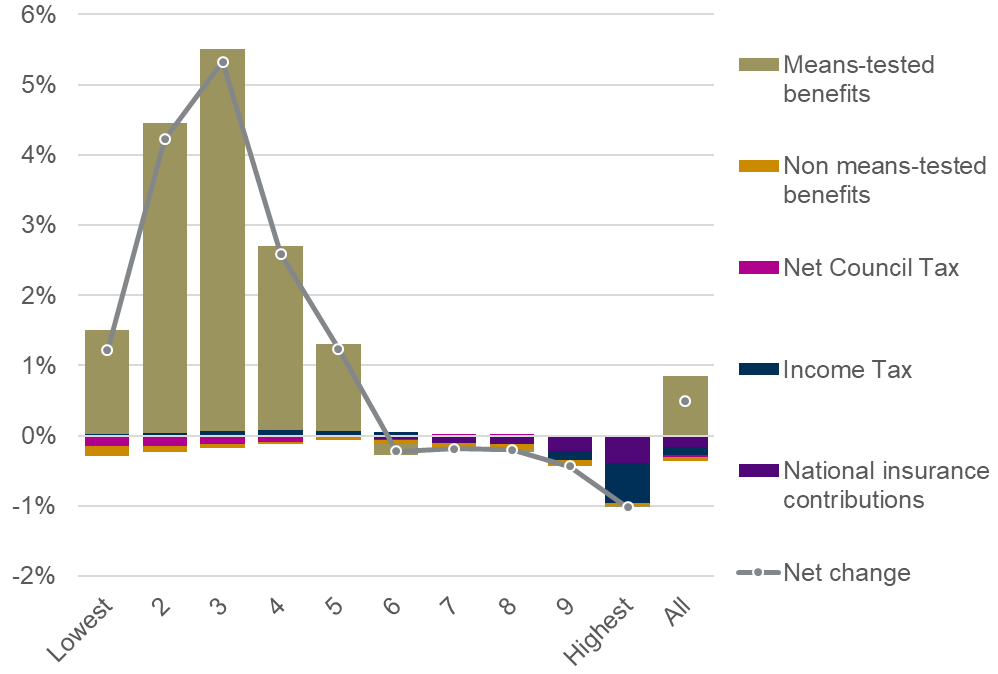
% change in real terms in equivalised disposable income between 2018-19 and 2023-24 for Scottish families by income decile
Source: EUROMOD analysis
Figure 4 shows the distributional effect of the policies due to take place in this period plus the hypothetical increase in child benefit. If child benefit was increased by £18.45 per week per child, in addition to the policy measures already announced, then between 2018-19 and 2023-24, overall, the average household in Scotland would gain about 0.5%. All income groups apart from the top 10% would be net gainers from an increased child benefit of this scale. The top decile do not gain from the increased child benefit because their child benefit is limited by the "High Income Child Benefit Tax Charge". Families in the bottom half of the income continue to be affected by other changes to the benefit system, such as the benefit freeze, the benefit cap and the two child limit.
Scenario C: Changing child-related elements of Universal Credit
Universal Credit (UC) is a single payment replacing six previous benefits. Families with children get an extra £2,780 per year per child included in the calculation (for all children born after April 2017; higher amounts are included for first children born before April 2017). For families with children born after April 2017, this extra amount is only available for a maximum of two children. This is known as the "two child limit". Under the tax credit system that is being replaced by UC, a further "family element" was paid to every family. This is a set amount regardless of the number of children and currently stands at £545 per year for children born before April 2017.
Universal credit has not yet been fully rolled out but under current plans, it will be fully rolled out by 2024. So, for the purposes of this analysis, it is assumed that all working age families eligible for support in 2023-24 are in receipt of UC, rather than the benefits it replaces.
Scenario C considers the effect of:
removing the two child limit for all families
increasing the child element of universal credit by 80% to £417 per month
reintroducing a family element of £545 per year.
This would have an estimated annual cost of £0.8 billion and, as with previous scenarios, the benefit amounts have been chosen so as to give a cost that is comparable across all three scenarios.
This table shows the impact that changing the child elements of universal credit would have on child poverty in 2023-24
| % of children in poverty, after housing costs | 2016-17 | 2018-19 | 2023-24: no action | 2023-24: with policy action (Scenario C) |
|---|---|---|---|---|
| Relative poverty (%) | 23 | 26 | 27 | 22 |
| Absolute poverty (%) | 20 | 23 | 24 | 18 |
| Note: under 'no action', it is assumed that payment rates would rise in line with inflation | ||||
Source: HBAI (2016); Euromod (estimates for 2018 and 2023)
Table 6 shows that Scenario C (for the same costs as Scenarios A and B), would be more effective in reducing both relative and absolute child poverty in Scotland by 2023. That is, expenditure of £0.8 billion would be more effective in targeting child poverty if used to increase child elements of UC, when compared with the alternatives of reducing the starter rate of income tax or increasing child benefit.
% change in real terms in equivalised disposable income between 2018-19 and 2023-24 for Scottish families by income decile
Source: EUROMOD
Figure 5 shows that, although the average household gains a similar amount as from scenario B (0.5%), the distributional effects of Scenario C are much more focused toward families at the bottom of the income distribution. These families gain from increases in means-tested benefits. Such a policy would reduce the distance between disadvantaged families and the "average" family, resulting in a 5 percentage point reduction in relative poverty in 2023-24, when compared with the "no action" alternative, which reflects existing policy intentions. As Figure 5 shows, it would also significantly increase the income of those at the lower end of the income spectrum. This is reflected in the decrease of 6 percentage points in absolute poverty compared with the "no action" scenario. Those in the top half of the income distribution would see a reduction in their equivalised disposable income as a result of planned changes to income tax. [Note that the increases in means-tested benefits may have negative effects on incentives to work which are not considered in this analysis, but could form part of future analysis.]
Comparing policy interventions
Overall impact on child poverty
The target for Scotland is to reduce relative child poverty to 18% and absolute child poverty to 14% by 2023-24. This analysis has first looked at how the policies announced to take place between April 2018 and April 2023 are predicted to affect the risk of poverty for children in Scotland. Then, three alternative scenarios for 2023-24 have been considered to see whether and how the risk of child poverty is affected. The scenarios (A, B and C) were designed so that the cost of each policy is broadly comparable. The additional cost of each scenario (over and above the estimated cost of all changes due to take place by 2023-24) is estimated to be around £0.8 billion. This choice was only illustrative and driven by the cost of setting the starter tax rate to zero (scenario A). This ensures that the effectiveness of the various policies on child poverty can be directly compared, assuming that the cost for each scenario is the same.
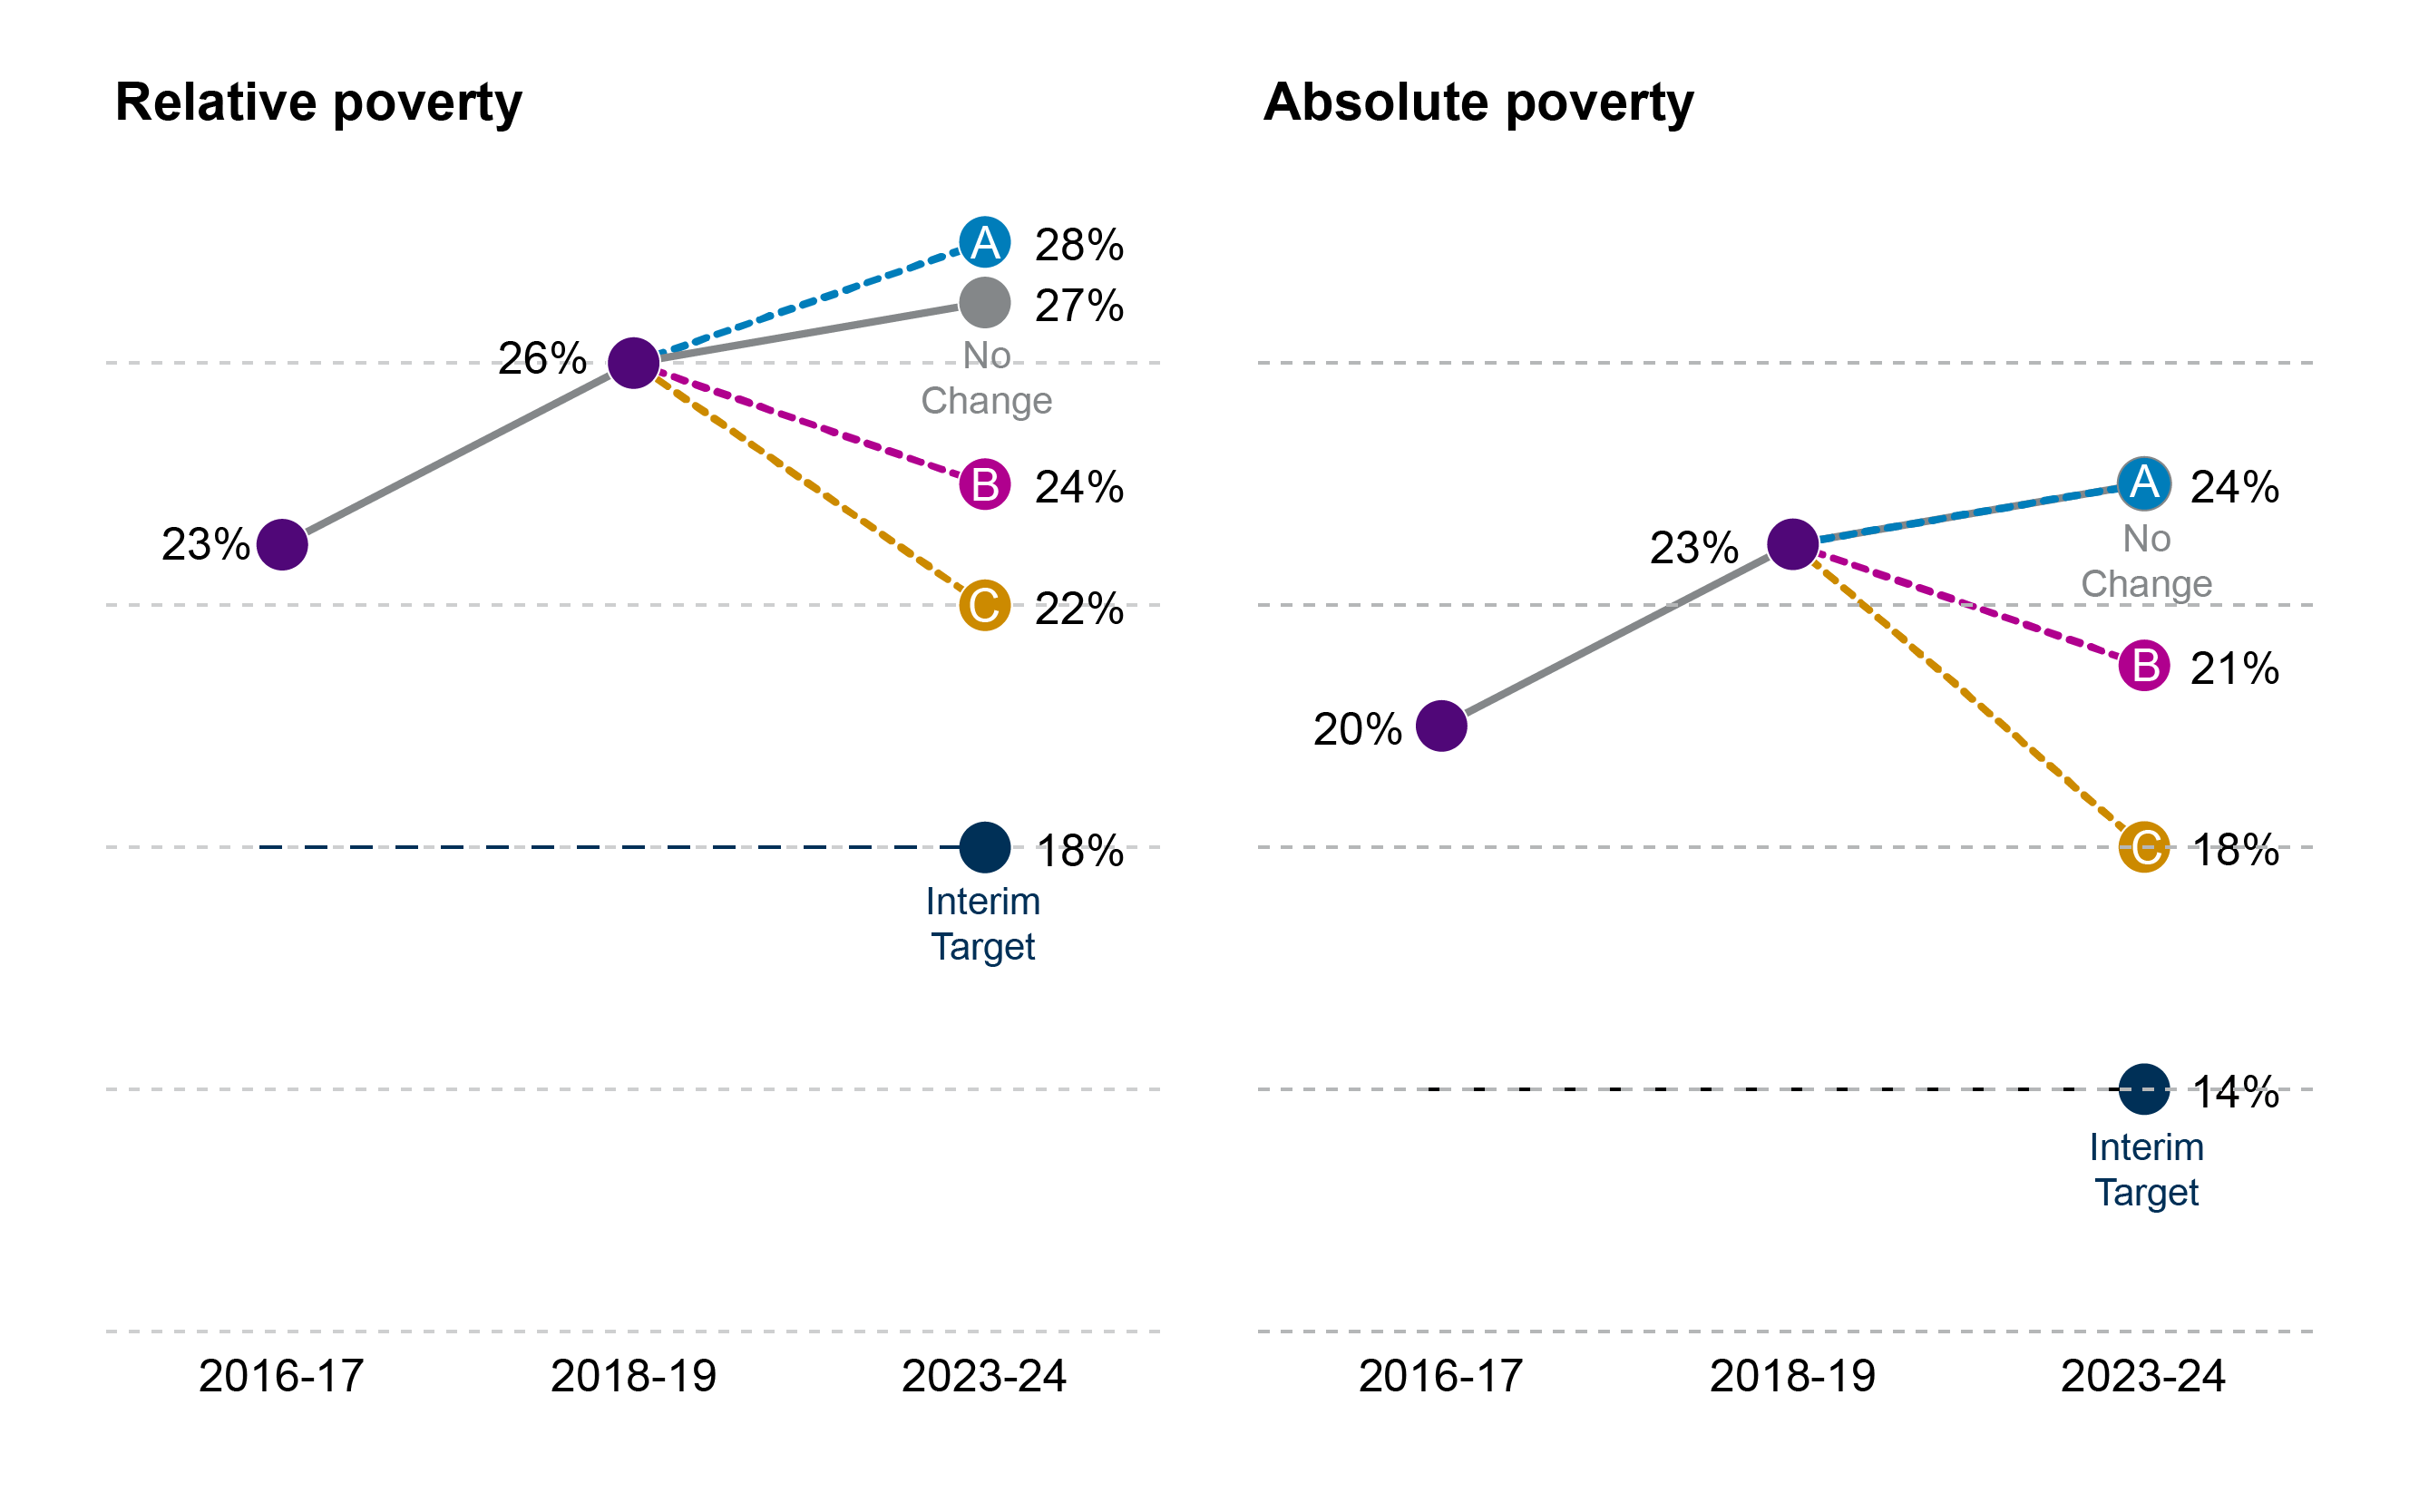
Figure 6 provides a direct comparison of the impact on relative and absolute child poverty of spending a sum of around £0.8 billion on each of the policies described above.
This figure compares the impact of the alternative scenarios against the "no change" baseline and the interim targets for both relative and absolute poverty
Source: HBAI (2016-17) and EUROMOD analysis (2018-19 and 2023-24)
This comparison highlights that, if a sum of £0.8 billion was spent on one of the selected policy measures, Scenario C (changing child related elements of UC) would be the most effective in tackling child poverty. Scenario A (reducing the starter rate of income tax) results in an increase in relative child poverty and has no impact on absolute child poverty, while Scenario B (increasing child benefit by £18.45 per week) has a positive impact on child poverty, but is less effective than the changes to UC that were modelled.
Although the UC changes modelled in Scenario C would take child poverty much closer to the set interim targets than any of the other scenarios considered, the risk of child poverty in 2023-24 would still be four percentage points higher than the interim targets for both relative and absolute poverty. So, even with quite significant changes to social security benefits targeted at children in lower income households, the interim targets are not achieved through this policy intervention alone.
However, as noted before, this exercise is looking at individual policy measures in isolation and independently from demographic and behavioural changes. In the real world, a number of different measures will be operating concurrently and could act to support or counteract the effect of the chosen policy. In addition external factors, such as the general economic climate, will also provide either a positive or negative influence.
It should also be noted that the policy effects are not necessarily linear. That is, if double this amount was spent on each measure, it would not necessarily be the case that child poverty would decrease by the same additional amount. Likewise, if half the amount was spent, the impact would not necessarily be halved. Certain policies could be more or less responsive to the additional expenditure depending on the interaction with the wider tax and benefit system.
Which types of families benefit from the policy options?
The analysis above has shown how different policies impact on families depending on their position in the income distribution. This section considers how different family types are affected, looking at characteristics other than income.
Figure 7 shows effects for different kinds of households for each of the scenarios discussed above. The analysis below focuses on families with children, so not all family types are considered.
% change in real terms in equivalised disposable income between 2018-19 and 2023-24 for Scottish families

Source: EUROMOD analysis
Figure 7 shows that, if no action is taken beyond what has already been announced, the average family would lose just under 1% of their disposable income between 2018 and 2023 [dark blue squares]. Families that are more reliant on benefits will be losing out from means-tested benefit cuts. Among these families, those losing the most would be lone parents and large families (those with three or more children) mainly because of the transfers to Universal Credit combined with the rolling out of two-child limit.
The light blue squares show how the picture would change if the Scottish Government set the starter rate of income tax to zero. All taxpayer families would benefit from reduced tax, but this policy would not be particularly helpful to those families with children where a significant part of their income is coming from benefits. Lone parents and large families stand to lose between 4% and 6% of their disposable income, on average. These families are more likely to be out of work or not earning enough to benefit from such a policy reform (i.e. they do not pay tax). By contrast, two earner families benefit the most from this policy, with disposable income increasing by an average of 1% for these families (this includes two earner households without children).
The pink circles show the impact of a significant increase in child benefit. In this scenario, lone parent families are the only group facing an average reduction in disposable income (0.5%), although this reduction is significantly lower than in the baseline scenario for this family type (6%). The reduction occurs because these families are still affected by other changes to the benefit system, such as the benefit freeze, the benefit cap and the two child limit.
Finally, the yellow diamonds show how different family types would be affected under Scenario C (changes in child-related elements of UC). This policy would target support towards those families at the bottom of the income distribution. As a result, families with children would significantly benefit from the increased child element and reintroduced family element within UC. Removing the two-child limit would help particularly families with more than two children. Lone parents and large families would, on average, see their disposable income increase by more than 2 per cent in 2023-24 compared to 2018-19.
Other analysis
This analysis is not the first study of its type. A number of other studies undertake similar analysis to present projections of child poverty in Scotland under alternative policy scenarios in order to assess whether and how changes to the tax and benefit system are likely to impact on child poverty. Each uses a different microsimulation model and different scenarios are considered.
The Institute for Public Policy Research (IPPR) Scotland undertook analysis on behalf of the Poverty and Inequality Commission in February 2018.1 They considered similar questions to this analysis, but also looked at how much it would cost to reduce child poverty in Scotland. Policy reforms that were considered included increasing child benefit, removing the two-child limit and lifting the benefit cap in Scotland. Their methodology was broadly similar to that used in this analysis and it was also a static analysis, taking no account of economic effects or behavioural effects. The study highlighted the challenging nature of the child poverty targets and concluded that they could only be delivered through a comprehensive set of policy reforms, with changes to the tax and benefit system supported by other policy measures.
In April 2018, Reed and Stark undertook analysis on behalf of the Scottish Government to forecast child poverty to 2030-31.2They used the IPPR microsimulation model, a tax-benefit microsimulation model similar to EUROMOD. As with this study and the IPPR Scotland analysis, Reed and Stark used pooled Family Resources Survey (FRS) data. As with this study, they correct for take-up and account for full roll out of UC. Reed and Stark compare the effect of maintaining the 2017-18 tax-benefit system (with uprating) with the effect of policy changes announced by the UK government and the effect of policy changes announced by the Scottish Government. Reed and Stark show that both relative and absolute poverty are forecasted to rise in the next five years as well as up to 2030-31 if nothing changes beyond the policies already announced. A key driver of the sharp increase in all measures of child poverty is the reduction in the real-terms value of the social security system since 2016-17 as a result of reforms (existing and planned) by the UK Government.
The Resolution Foundation has also published analysis of the policy measures that might be used to tackle poverty. In their Living Standards Outlook 2019 report, they found that measures such as cancelling the two child limit and the abolition of the family element, alongside increasing UC work allowances for single parents and second earners with children could prove effective in reducing child poverty. They do also note the significant costs associated with such policy measures.3 Although the main report relates to the UK, some analysis specific to Scotland was also published.4 In common with this and other studies, the analysis showed that - in the absence of further policy interventions - child poverty will continue to rise. The Resolution Foundation highlighted the potentially important role that the Scottish Government's Income Supplement could play, if targeted appropriately. Their reports also highlight some issues with the measurement of child poverty that might need to be addressed.
Annex A: EUROMOD and project technical details
EUROMOD is a tax-benefit microsimulation model for the European Union that enables researchers and policy analysts to calculate, in a comparable manner, the effects of taxes and benefits on household incomes and work incentives for the population of each country and for the EU as a whole.
EUROMOD is maintained, developed and managed by the Institute for Social and Economic Research (ISER) at the University of Essex, in collaboration with national teams from the EU member states. We are indebted to the many people who have contributed to the development of EUROMOD. The process of extending and updating EUROMOD is financially supported by the European Union Programme for Employment and Social Innovation ‘Easi’ (2014-2020). The results and their interpretation are the authors’ responsibility.
The project uses the pooled Scottish sample of Family Resources Survey from 2014/15, 2015/16 and 2016/17 and the UK component of EUROMOD. The latest published guide to the UK component is De Agostini (2018).1 The newer version has been updated to include all UK and Scottish policy changes announced in the 2018 UK Budget, and any revisions to the OBR’s economic forecasts (which have been published alongside it) and Scottish macro-economic forecasts announced by December 2018. The report discusses three Scottish specific reform scenarios to the tax and benefit rules and considers their effectiveness toward the 2023-24 interim child poverty targets. Specifically, it discusses the potential effects of:
Reducing the starter income tax rate in Scotland from 19% to 0%
Increasing child benefit by £18.45 per week
Changing the child related elements of Universal Credit
The project uses EUROMOD for simulating the tax and benefit rules to produce an estimate of the net income of each household, and of various measures of poverty in 2016/17 (the latest period for which outturn statistics on poverty are available), 2018/19, 2023-24 (the date set in legislation for the interim targets). These are used to assess the impact of policy changes on two measures of child poverty in Scotland: relative child poverty after housing costs (AHC) and absolute child poverty (AHC).
Annex B: Modelling assumptions
Updating to 2018/19 and 2023/24
The simulations are based on FRS data collected between April 2014 and March 2017. Income variables are updated to 2018/19 and 2023/24 levels using source-specific indexes as described in Table B.1. Relevant expenditures, such as housing costs, childcare costs and maintenance payments are also updated as shown.
| Income source | Updating factor | Factor Source |
|---|---|---|
| Employment income, self-employment income | Average weekly earnings index | ONS financial year (March-April) annual average K54U; extrapolated beyond available statistics using OBR earnings forecast Table 3.5 |
| Non-simulated benefits (disability, carer’s and maternity benefits) and Basic State Retirement pension | Change in main rate of benefit | |
| Earnings-related pension income (state, occupational and personal) | "Triple lock" and CPI | |
| Mortgage interest payment | Change in the mortgage interest rate (annual average) | Bank of England IUMTLMV; extrapolated assuming moves with trend (2 years) |
| Rent paid or received | Rent element of CPI | ONS; extrapolated to 2018 using same method as for earnings |
| Childcare expenditure | As employment income | |
| Maintenance paid or received | As employment income | |
| Other private transfers | As employment income | |
| Council tax | Change in average band D Council Tax by country |
Policy changes
Policy changes modelled into EUROMOD are listed in Table B2.
| Reforms | When first implemented | |
|---|---|---|
| Reforms introduced in 2016/17 and 2017/18 | ||
| Income tax | Introduce savings allowance | 2016/17 |
| Income tax | Scottish Government decision to freeze higher rate threshold | 2017/18 |
| Working age | Introduce NLW for NMW workers age 25+ | 2016/17 |
| Working age | UC to replace WTC, CTC, IS, income-related JSA, income-related ESA and HB | Phased in |
| Working age | Change childcare support within UC from 70% to 85% of eligible costs | 2016/17 |
| Working age | Freeze most working-age benefits and Child Benefit from April 2016 for four years | 2016/17 |
| Benefit cap | Exemption from benefit cap for receivers of Carer's Allowance and carer’s element of UC (from Autumn 2016) - Announced Budget 2016(a) | Autumn 2016 |
| Working age | UC work allowance frozen at the 2016/17 level for 2017/18 | 2017/18 |
| Working age | Limit family and child element of CTC and child element of UC to 2 children for new claimants | 2017/18 |
| Working age | Cut personal allowance for ESA WRAG new claimants | 2017/18 |
| Working age | UC taper rate to decrease from 65% to 63% | 2017/18 |
| Working age | Introduction of tax-free childcare for 2-earner families paying formal childcare costs(b) | [2015/16 (Oct 15)]2017/18 |
| Reforms announced 2018/19-2020/21 | ||
| Working age | Abolition of Class 2 NICs | 2018/19 |
| Housing | Downrating of social sector rents | 2018/19 |
| Housing | Capping HB in the social rent sector | 2018/19 |
| Income tax | Increase personal allowance to reach £12,500p.a. | 2019/20 |
| Income tax | Scottish Government introduction of 5-band income tax policy | 2018/19 |
| Working age | NLW to rise to 60% of average earnings | 2020/21 |
| Working age | UC to replace WTC, CTC, IS, income-related JSA, income-related ESA and HB | Phased in continue |
Notes: (a) In Euromod this is taken into account from 2017. (b) Not included in our analysis.
CPI – Consumer Prices Index; CTB – Council Tax Benefit; CTC – Child Tax Credit; DLA – Disabled Living Allowance; ESA – Employment and Support Allowance (WRAG - Work Related Activities Group; SG – Support Group); HB – Housing Benefit; IS – Income Support; JSA – Job Seeker’s Allowance; LHA – Local Housing Allowance; NIC – National Insurance contribution; PC – Pension Credit; PIP – Personal Independence Payment; UC – Universal Credit; VAT – Value Added Tax; WTC – Working Tax Credit.
The following policy changes are not included in our analysis because the information in the FRS data is not sufficient: (i) abolition of the 50+ element of WTC for those returning to work; (ii) changes in welfare-to-work and lone parent obligation regimes, or benefit sanctions regimes; (iii) changed treatment of within-year changes in circumstances in WTC; (iv) restricting Sure-Start Maternity Grant to first babies; (v) introduction of UC extra conditionality; (vi) restrictions on pension contributions eligible for tax relief (reduced from £50,000 to £40,000 per year in 2014/15 and from £1.5 million to £1.25 million on a lifetime basis).
A further set of changes can only be modelled approximately. These include:
In 2013/14 Council Tax Benefit (CTB) was abolished and responsibility for supporting low income households with their Council Tax was devolved to local authorities. In this analysis we assume that local authorities in Scotland chose to keep Council Tax Support (CTS) unchanged.
From 2017/18 the family element of CTC/UC is only paid to new claims that include a child born before 6 April 2017. Similarly, the child element of CTC/UC is not payable for third and subsequent children born on or after 6 April 2017. Since these changes only affect families with new births and then (towards the end of 2018) new claims, we assume that no one will see their benefit income fall in the short period. But these are substantial changes to the long run generosity of the system. Hence, this analysis assumes no immediate effect in 2018/19 fiscal year, while in 2023/24 the family element is awarded only if there is a child aged 6 or more. Similarly for the child element of CTC/UC in 2023/24, eligibility is restricted based on the number of children aged 6 or more.
From 2017/18 new ESA claimants in the Work Relate Activities Group (WRAG) received per week the same amount as jobseekers allowance claimants (£73.1 per week), in practice abolishing the WRAG component of ESA (which was reduce from £29.05 per week to zero) and the equivalent element of UC. This change does not create immediate losses of benefit income in the base year (2018/19), because only new recipients are affected. Ultimately though, all claims will be assessed under the new, less generous, rules, which is what it is assumed to happen by 2023/24.
Universal credit roll out
In modelling the introduction of Universal Credit (UC) some further assumptions have been made, including:
The treatment of limits on the amount of housing cost support for owner occupiers with mortgages who are not in paid work and the treatment of waiting time for this support are assumed to mirror what is done in the corresponding element of Income Support (IS). (In each case the limits and waiting times are not modelled.) This avoids spurious gains or losses due only to different treatments, even if the treatments themselves are both too generous, which will to some extent affect where the household is situated in the income distribution.
The definition of non-dependants in Housing Benefit for pensioners and in Council Tax Support (which is assumed to follow the same structure as Council Tax benefit) assumes that assessed income includes income from UC (as was the case for CTC and WTC but not IS).
Council Tax Support is assumed to be automatically passported to those on UC who would have been eligible for IS (or income-related JSA or ESA) under the pre-reform system.
Universal Credit rolling-out process: In 2018/19, the baseline year for this analysis, Universal Credit (UC) is on its rolling-out phase, which will continue until 2022. In order to take into account the transferring process between the legacy benefit system and the Universal Credit system this analysis followed OBR and when modelling 2018/19 we assumed that 1 in 10 eligible claimants receive UC and 9 in 10 receive legacy benefits; when modelling 2023/24, we assumed full introduction of UC for all eligible claimants (see OBR (2016). The analysis does not account for the fact that roll-out might be different for different family types.
Equivalisation methodology
In order to take into account the fact that larger households require a higher net income to achieve the same economic well-being and standard of living as a household of a smaller size, the analysis adjusts household’s net income using the OECD’s modify equivalence scale using a single person household as reference household. The household equivalised net disposable income is then used to calculate income decile groups.
Non take-up of means-tested payments
In simulating entitlement to means-tested tax credits and benefits EUROMOD makes some adjustment for non take-up of these payments based on statistics provided by DWP (2016) for Income Support, Pension Credit and Housing Benefit and HMRC (2016) for the tax credits. Making such adjustments involves selecting randomly within client groups and benefits such that a proportion of those entitled, based on the official statistics, do not receive their entitlement. Clearly this is a rather approximate process and such adjustments are not always made in UK microsimulation analysis of policy changes. However, it is important to represent those not taking-up their entitlements in the income distribution and in the analysis of policy changes. In adjusting for non take-up of Universal Credit, which cannot yet be measured, it is important to minimise the effect on the results of any spurious changes in take-up assumptions, while recognising that there will be some positive effect on the amounts taken up due to a single application procedure. If any of the pre-reform elements (CTC, WTC, Income Support, Housing Benefit etc.) to which a particular benefit unit might be entitled are assumed to be taken up then it is assumed that UC would be taken up under the new regime. This is similar to the assumption used in Treasury modelling (HMT, 2013) although they additionally make the more optimistic assumption that some of those not taking up any of their entitlements to the old benefits and tax credits will nevertheless claim UC (20% of the employed in this group and 10% of the self-employed). In this analysis, if a family becomes newly-entitled to means-tested support through UC then probabilities are applied as for IS under the old system. The resulting average take-up rate of UC (calculated as the number of benefit units modelled to be receiving divided by the number simulated to be entitled) is approximately 80 per cent.
Default indexation assumptions
| Tax-benefit element | Default indexation for the fiscal year starting April 2020 | Changes up to April 2023 | Rounding conventions |
|---|---|---|---|
| Income tax personal allowance[1] | CPI | By April 2019 to reach £12,500p.a. | Rounded up to nearest £10 pa |
| Income tax thresholds (except additional/top rate) | CPI | Rounded up to nearest £100 pa | |
| Income tax starting rate limit for savings income | CPI | Rounded up to nearest £10 pa | |
| Income tax threshold for additional (top) rate | Fixed in cash terms | ||
| Income tax income limit for tapered withdrawal of personal allowances | Fixed in cash terms | ||
| Income tax threshold for Child Benefit clawback | Fixed in cash terms | ||
| NICs lower earnings limit | CPI | Rounded down to the nearest £1 pw | |
| NICs Primary Threshold/Lower Profits Limit | CPI | Rounded down to the nearest £1pw/£5pa | |
| NICs Upper Earnings Limit/Upper profits Limit | Aligned with the income tax Higher Rate Threshold[2] | ||
| NICs small Earnings Exception | CPI | Rounded up to the nearest £10 pa | |
| NICs Class 2 rate | CPI | Rounded to the nearest 5p pw | |
| Disability, Carer’s and Maternity benefits | CPI | ||
| Income-tested benefits | CPI | ||
| Basic State Pension | Highest of earnings, CPI or 2.5% | ||
| Pension Credit Guarantee Credit | Earnings | ||
| Pension Credit Maximum Savings Credit | CPI | ||
| Child Benefit | CPI | Rounded to the nearest 5p pw | |
| Child Tax Credit and Working Tax Credit most elements | CPI | Rounded to the nearest £5 pa | |
| Child Tax Credit family element | Fixed in cash terms | ||
| Working Tax Credit maximum eligible childcare costs | Fixed in cash terms | ||
| Most earnings and other disregards in benefit assessments; capital limits in income related benefits; minimum payments of benefits and tax credits | Fixed in cash terms | ||
| Non-dependent deductions from Housing Benefit | CPI | ||
| Winter Fuel Allowance | Fixed in cash terms | ||
| Local Housing Allowance local reference rent caps by size of accommodation | Fixed in cash terms | ||
| Benefit cap | |||
| Tax-free childcare support | Fixed in cash terms | ||
| Council Tax | OBR assumptions |
Notes: CPI – Consumer Prices Index calculated as the annual change up to the previous September;
For projections to 2023/24 and beyond, OBR assumptions about the evolution of CPI, earnings and Council Tax (by country) are used. Sources: https://www.gov.uk/government/uploads/system/uploads/attachment_data/file/597335/PU2055_Spring_Budget_2017_web_2.pdf Budget 2017 policy costings Annex A
http://webarchive.nationalarchives.gov.uk/20130129110402/http://www.hm-treasury.gov.uk/d/junebudget_costings.pdf
Budget 2010 (June) policy costings Annex A (first time this was published)
http://www.hm-treasury.gov.uk/d/budget2010_annexa.pdf Budget 2010 (April) Annex A2
http://budgetresponsibility.org.uk/efo/economic-fiscal-outlook-march-2017/
[1] From 2015/16, when it is introduced, the transferable marriage tax allowance will be uprated in proportion to the personal allowance.
[2] This is equal to the Personal Allowance + Basic rate Limit.
Sources
Scottish Government. (2018, March 22). Poverty & Income Inequality in Scotland: 2014-17. Retrieved from <a href="https://www.gov.scot/Publications/2018/03/3017/downloads" target="_blank">https://www.gov.scot/Publications/2018/03/3017/downloads</a> [accessed 28 August 2018]
Scottish Government. (2018). Every Child, Every Chance: The Tackling Child Poverty Delivery Plan 2018-22. Retrieved from <a href="https://beta.gov.scot/binaries/content/documents/govscot/publications/publication/2018/03/child-chance-tackling-child-poverty-delivery-plan-2018-22/documents/00533606-pdf/00533606-pdf/govscot:document/" target="_blank">https://beta.gov.scot/binaries/content/documents/govscot/publications/publication/2018/03/child-chance-tackling-child-poverty-delivery-plan-2018-22/documents/00533606-pdf/00533606-pdf/govscot:document/</a> [accessed 29 August 2018]
Scottish Parliament. (2017, December 18). Child Poverty (Scotland) Act 2017. Retrieved from <a href="http://www.legislation.gov.uk/asp/2017/6/pdfs/asp_20170006_en.pdf" target="_blank">http://www.legislation.gov.uk/asp/2017/6/pdfs/asp_20170006_en.pdf</a> [accessed 25 March 2019]
Scottish Government. (2019, March 28). Poverty and income inequality in Scotland: 2015-2018. Retrieved from <a href="https://www.gov.scot/publications/poverty-income-inequality-scotland-2015-18/" target="_blank">https://www.gov.scot/publications/poverty-income-inequality-scotland-2015-18/</a> [accessed 09 April 2019]
Poverty and Inequality Commission. (2018, February). Advice on the Scottish Government’s Child Poverty Delivery Plan 2018. Retrieved from <a href="https://povertyinequality.scot/wp-content/uploads/2018/02/Child-Poverty-Delivery-Plan-advice-Final-Version-23-February-2018.pdf" target="_blank">https://povertyinequality.scot/wp-content/uploads/2018/02/Child-Poverty-Delivery-Plan-advice-Final-Version-23-February-2018.pdf</a> [accessed 28 March 2019]
Poverty and Inequality Commission. (2019, January). What has happened since ‘Shifting the Curve’? Scrutiny of progress towards meeting the recommendations of the Independent Poverty and Inequality Advisor. Retrieved from <a href="https://povertyinequality.scot/wp-content/uploads/2019/01/Shifting-the-curve-monitoring-progress-report.pdf" target="_blank">https://povertyinequality.scot/wp-content/uploads/2019/01/Shifting-the-curve-monitoring-progress-report.pdf</a> [accessed 25 March 2019]
Scottish Government. (2018, March 29). Every child, every chance: tackling child poverty delivery plan 2018-2022. Retrieved from <a href="https://www.gov.scot/publications/child-chance-tackling-child-poverty-delivery-plan-2018-22/" target="_blank">https://www.gov.scot/publications/child-chance-tackling-child-poverty-delivery-plan-2018-22/</a> [accessed 25 March 2019]
de Agostini, P. (2018, December). EUROMOD Country Report: United Kingdom 2015-2018. Retrieved from <a href="https://www.euromod.ac.uk/sites/default/files/country-reports/year9/Y9_CR_UK_Final.pdf" target="_blank">https://www.euromod.ac.uk/sites/default/files/country-reports/year9/Y9_CR_UK_Final.pdf</a> [accessed 28 March 2019]
Sutherland, H., & Figari, F. (2013). EUROMOD: the European Union tax-benefit microsimulation model. International Journal of Microsimulation 6(1) 4-26.
Office for Budget Responsibility. (2018, October 29). Economic and fiscal outlook – October 2018. Retrieved from <a href="https://obr.uk/efo/economic-fiscal-outlook-october-2018/" target="_blank">https://obr.uk/efo/economic-fiscal-outlook-october-2018/</a> [accessed 25 March 2019]
IPPR Scotland. (2018, March 5). How much would it cost to reduce child poverty in Scotland? The financial scale of child poverty in Scotland. Retrieved from <a href="https://www.ippr.org/research/publications/child-poverty-in-scotland" target="_blank">https://www.ippr.org/research/publications/child-poverty-in-scotland</a> [accessed 25 March 2019]
Reed, H., & Stark, G. (2018, April). Forecasting Child Poverty in Scotland. Retrieved from <a href="https://dera.ioe.ac.uk/31454/1/00533637.pdf" target="_blank">https://dera.ioe.ac.uk/31454/1/00533637.pdf</a> [accessed 25 March 2019]
Resolution Foundation. (2019, February). The Living Standards Outlook 2019. Retrieved from <a href="https://www.resolutionfoundation.org/app/uploads/2019/02/Living-Standards-Outlook-2019.pdf" target="_blank">https://www.resolutionfoundation.org/app/uploads/2019/02/Living-Standards-Outlook-2019.pdf</a> [accessed 25 March 2019]
Resolution Foundation. (2019, March 22). Wrong direction: can Scotland hit its child poverty targets?. Retrieved from <a href="https://www.resolutionfoundation.org/publications/wrong-direction-can-scotland-hit-its-child-poverty-targets/" target="_blank">https://www.resolutionfoundation.org/publications/wrong-direction-can-scotland-hit-its-child-poverty-targets/</a> [accessed 25 March 2019]