The gender pay gap: facts and figures - 2018
This briefing looks at the latest figures from the Annual Survey of Hours and Earnings (ASHE) from the Office for National Statistics. It provides a range of data looking at the gender pay gap.
Executive Summary
This briefing looks at the latest figures from the Annual Survey of Hours and Earnings (ASHE) 1from the Office for National Statistics. It provides a range of data looking at the gender pay gap.
In June 2017 the Economy, Jobs and Fair Work committee published No Small Change: The Economic Potential of Closing the Gender Pay Gap. One of the main areas of discussion was around the use of statistics. This briefing takes into consideration some of the report's points, specifically the Committee's proposal to use overall, full-time and part-time pay as more representative of the gender pay gap then full-time pay.
Comparing pay by gender
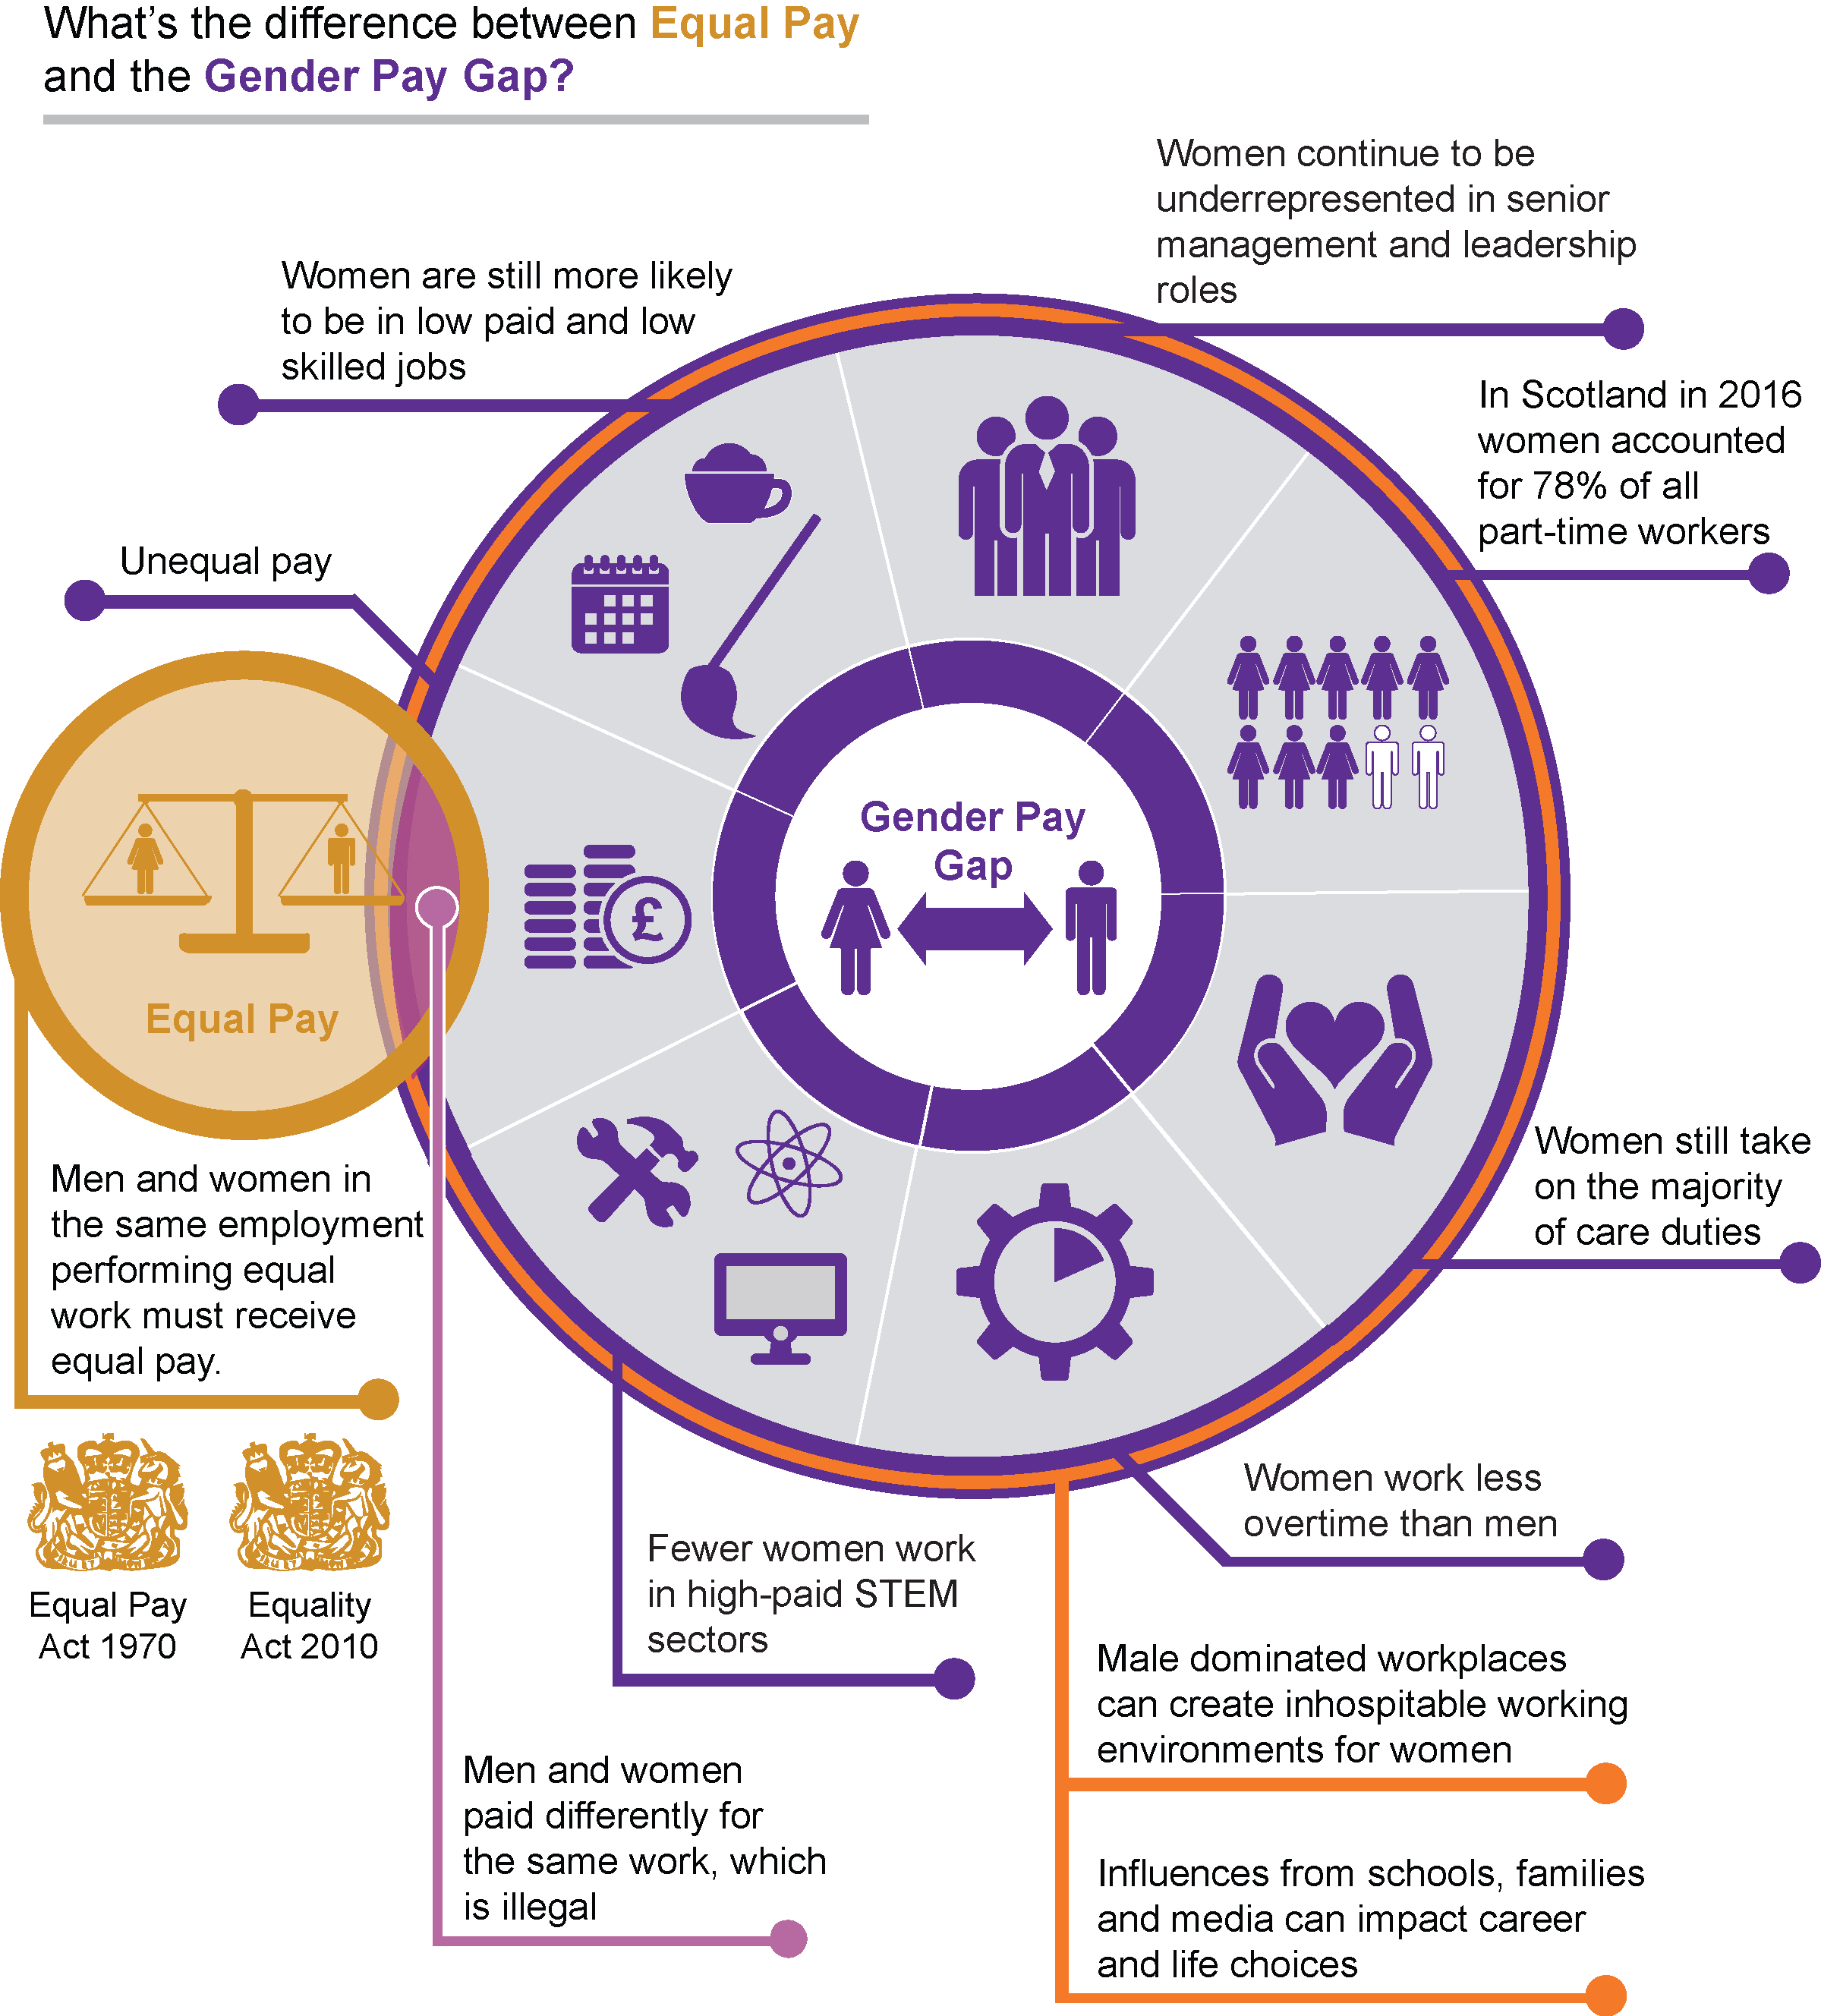
Overall, women can expect to earn significantly less than men over their entire careers1 . This section looks at the key issues when comparing women's pay with men's. The gender pay gap is made up of a complex set of factors.
The main issues to consider when comparing pay by gender are set out below in figure 1.
How is the gender pay gap calculated?
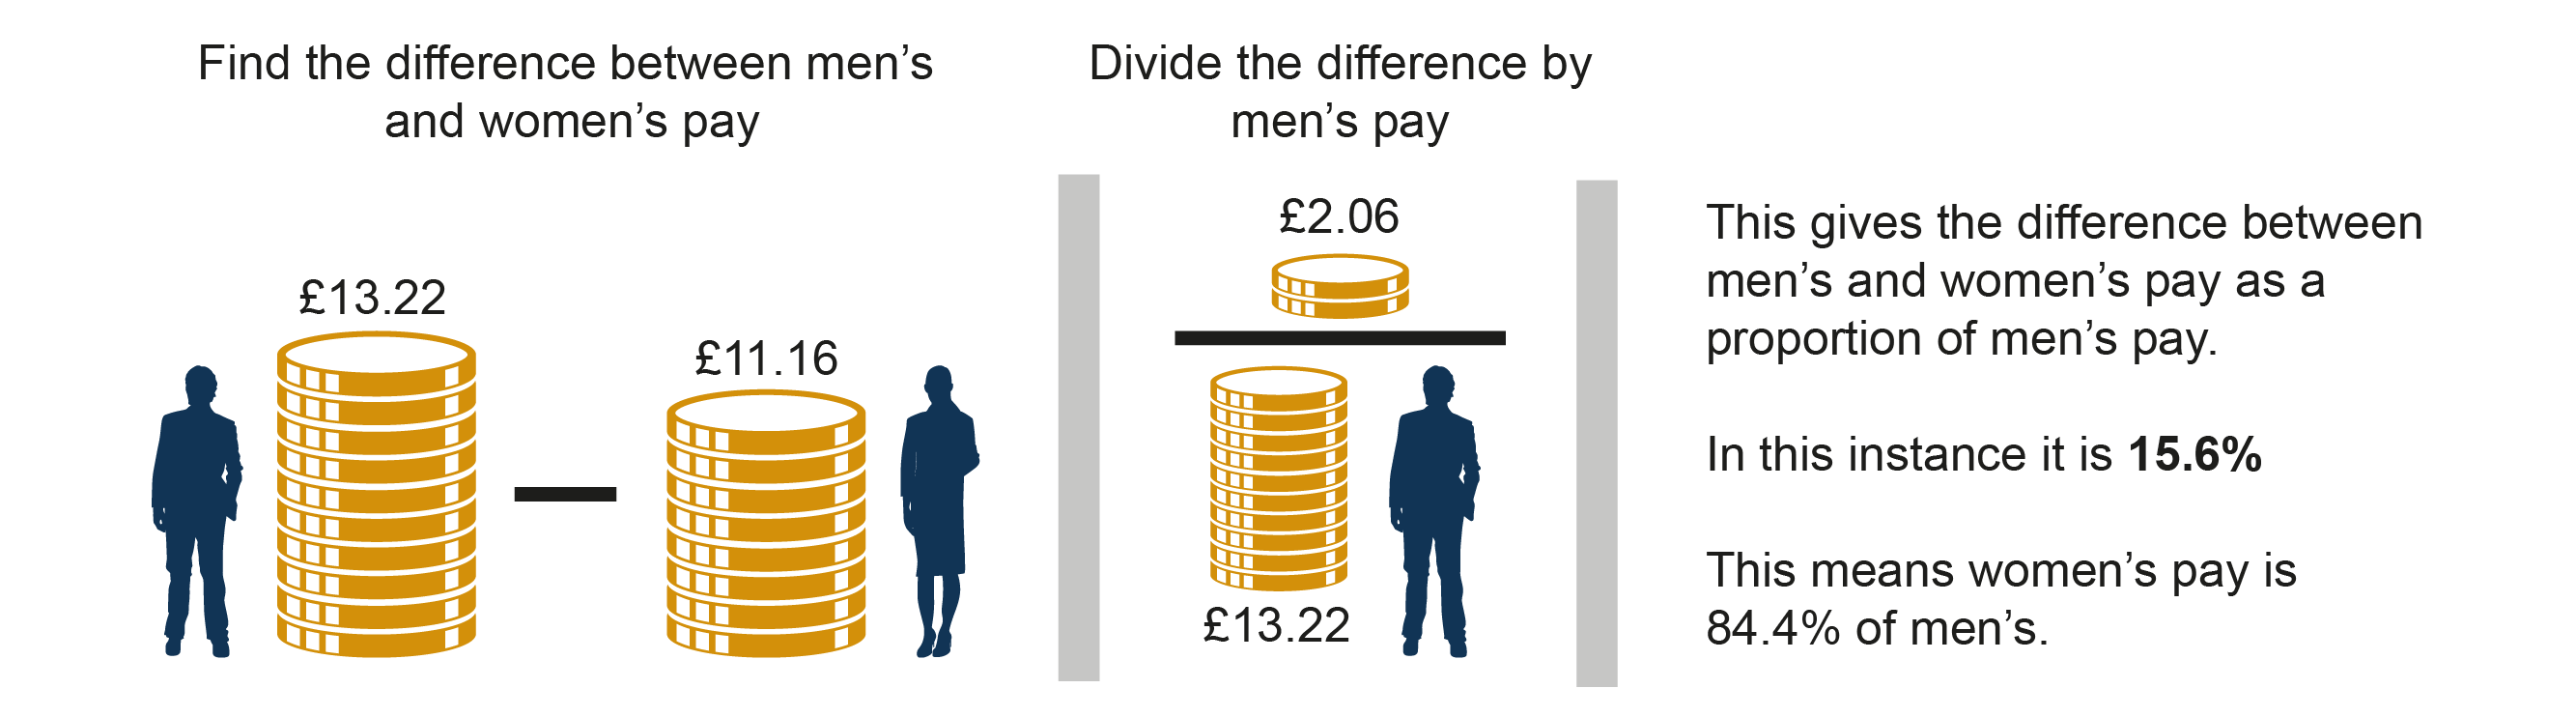
Men's and women's earnings are compared by looking at the difference between their earnings as a percentage of men's earnings, as set out in figure 2. This is known as the gender pay gap. To calculate the pay gap, the ONS uses median hourly pay excluding overtime, as it controls for men being more likely to work overtime. Using hourly pay also means it does not matter whether the individual is working full-time or part-time.
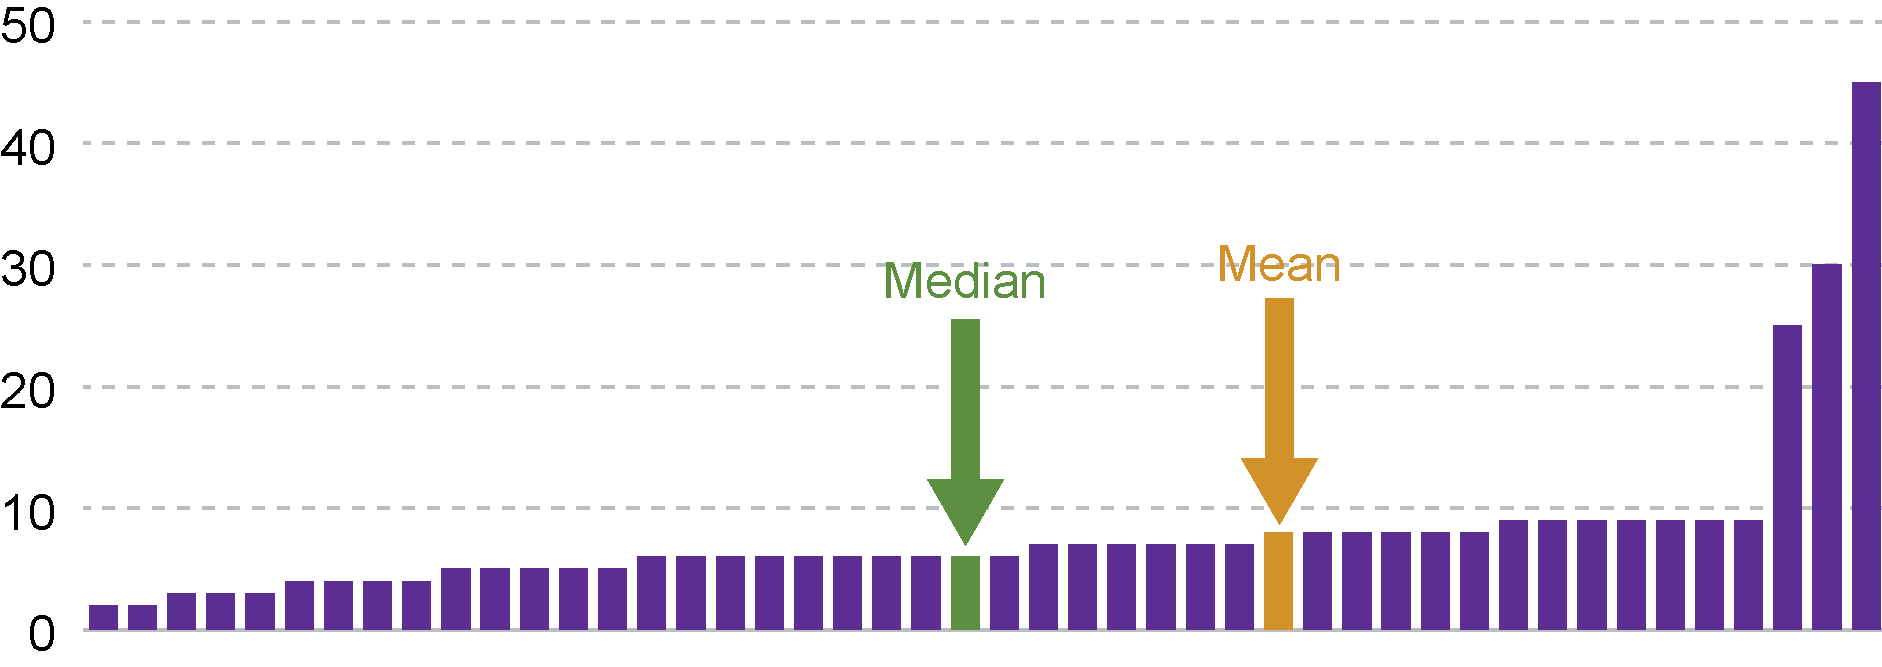
ASHE provides both the mean and median values for earnings. The median is generally used to calculate the gender pay gap. The mean, or average, is calculated by adding together all the values within a data set and dividing the total by the number of values. The mean result is therfore susceptible to influence from outliers.
The median is the middle value of a set of data and is therefore more representative of the typical value within a data set. Figure 3 compares the median and mean for a data set with a small number of outliers.
Unless otherwise stated the median estimates have been used rather than mean.
How does women's pay compare to men's pay?
Comparing pay for men and women is complex as there is no single measure which adequately represents the complex issues underlying differences between men's and women's pay.
This section looks at the pay gap for:
Full-time employees.
All employees.
Part-time employees.
Women working part-time and men working full-time.
The mean gender pay gap.
What is the pay gap for full-time pay?
The main indicator for the gender pay gap, used by the Scottish Government, is to compare hourly pay excluding overtime for full-time workers. Using full-time pay controls for the fact women are more likely to work part-time.
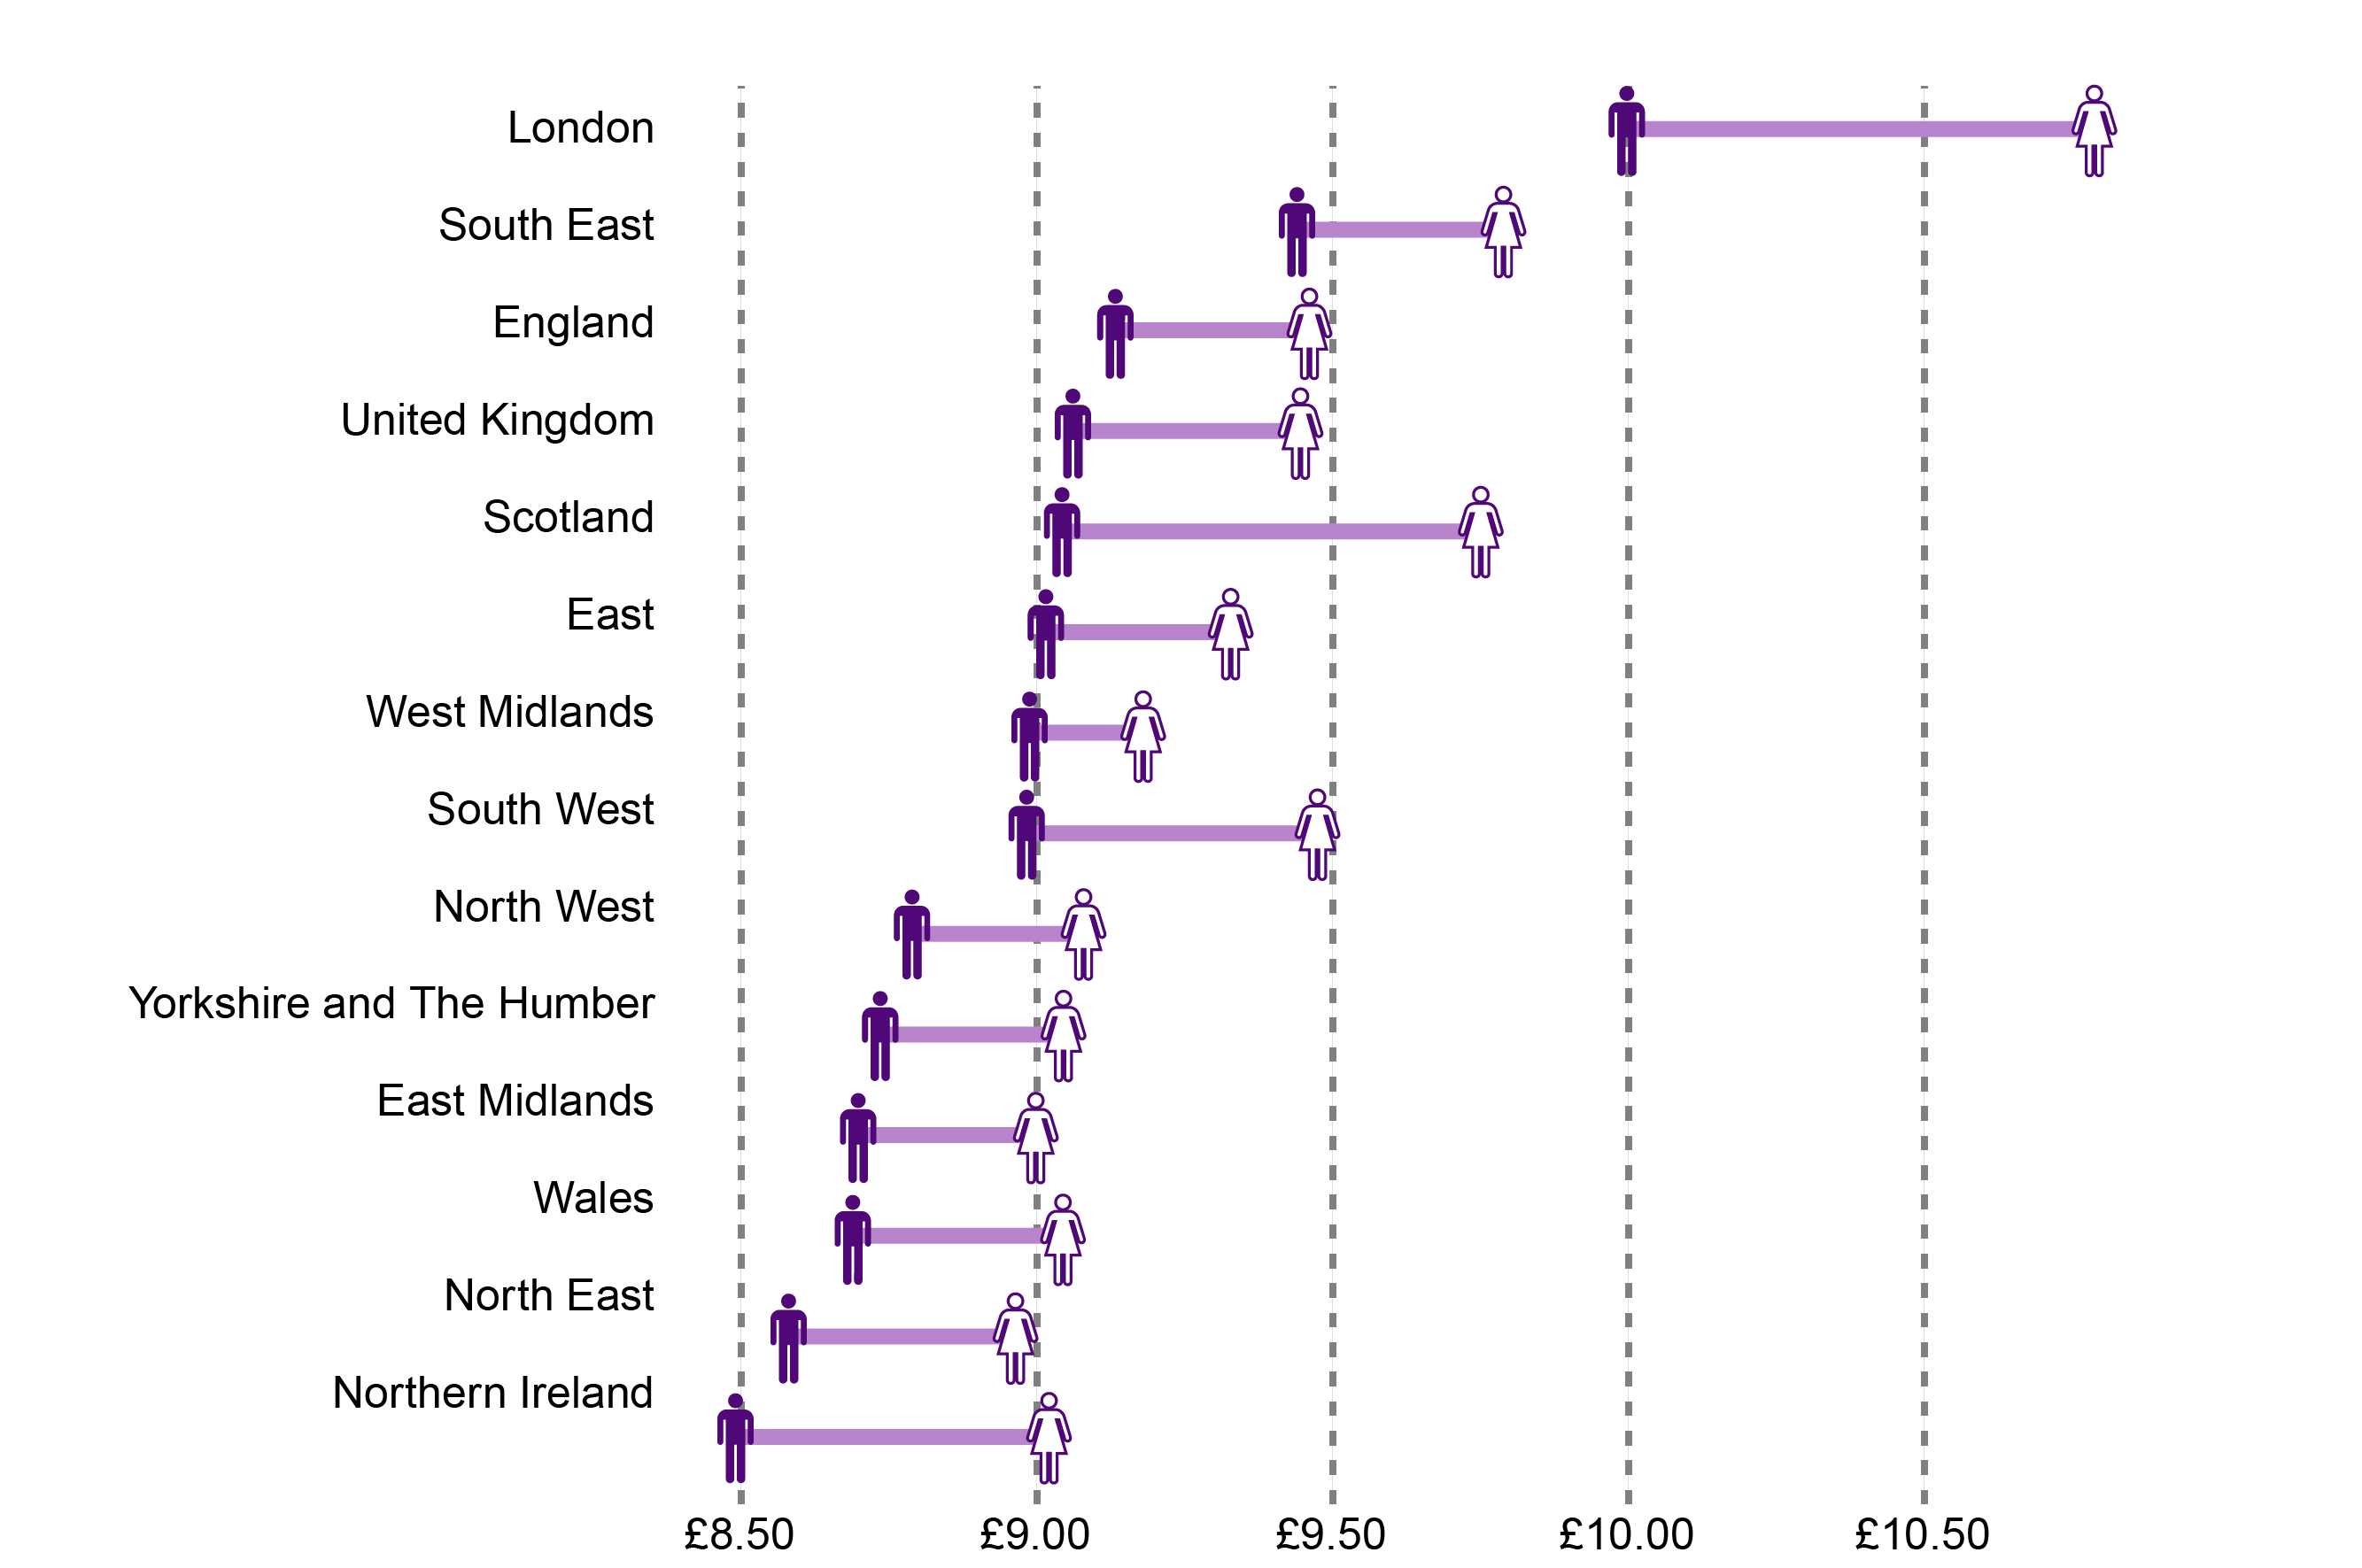
Figure 4: Full-time pay by gender for each nation and region of the UK - 2018
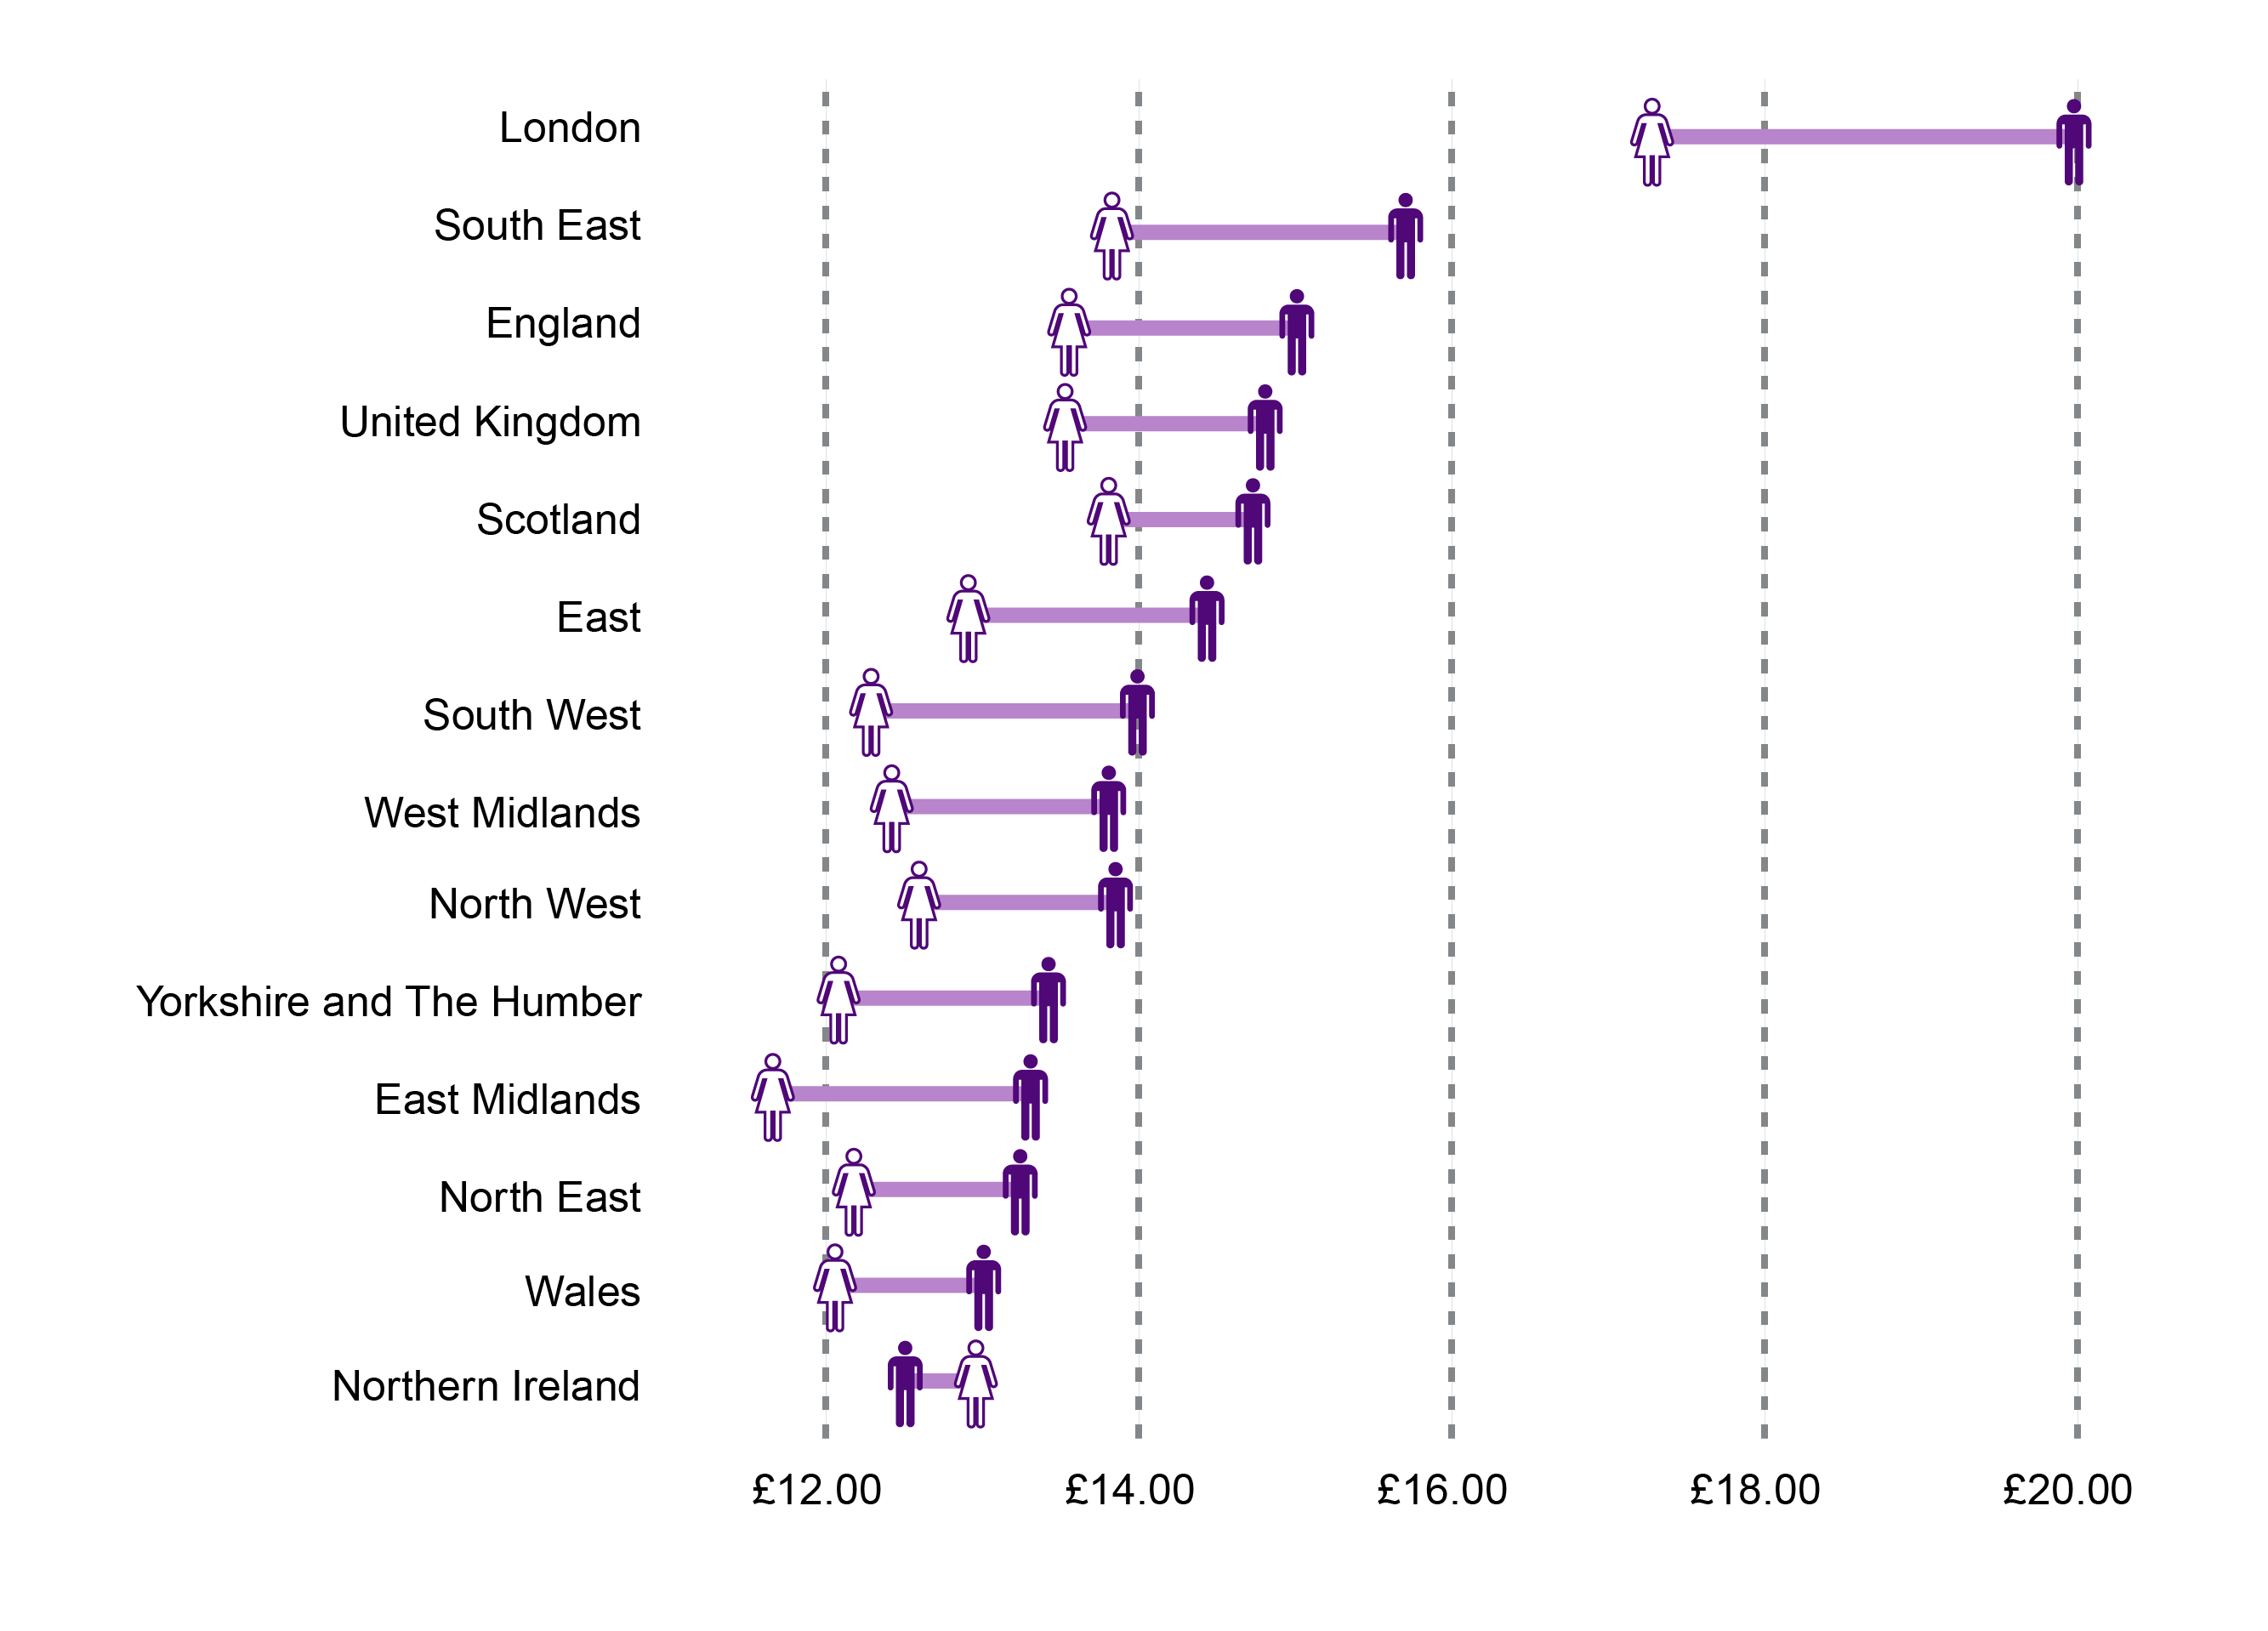
Median full-time pay for women in Scotland is higher than in the UK as a whole and is second highest of the nations and regions of the UK. By contrast, men's full-time pay is below the UK figure but is the highest outside London and the South East. Northern Ireland is the only area where women have a higher median pay than men, for full-time work.
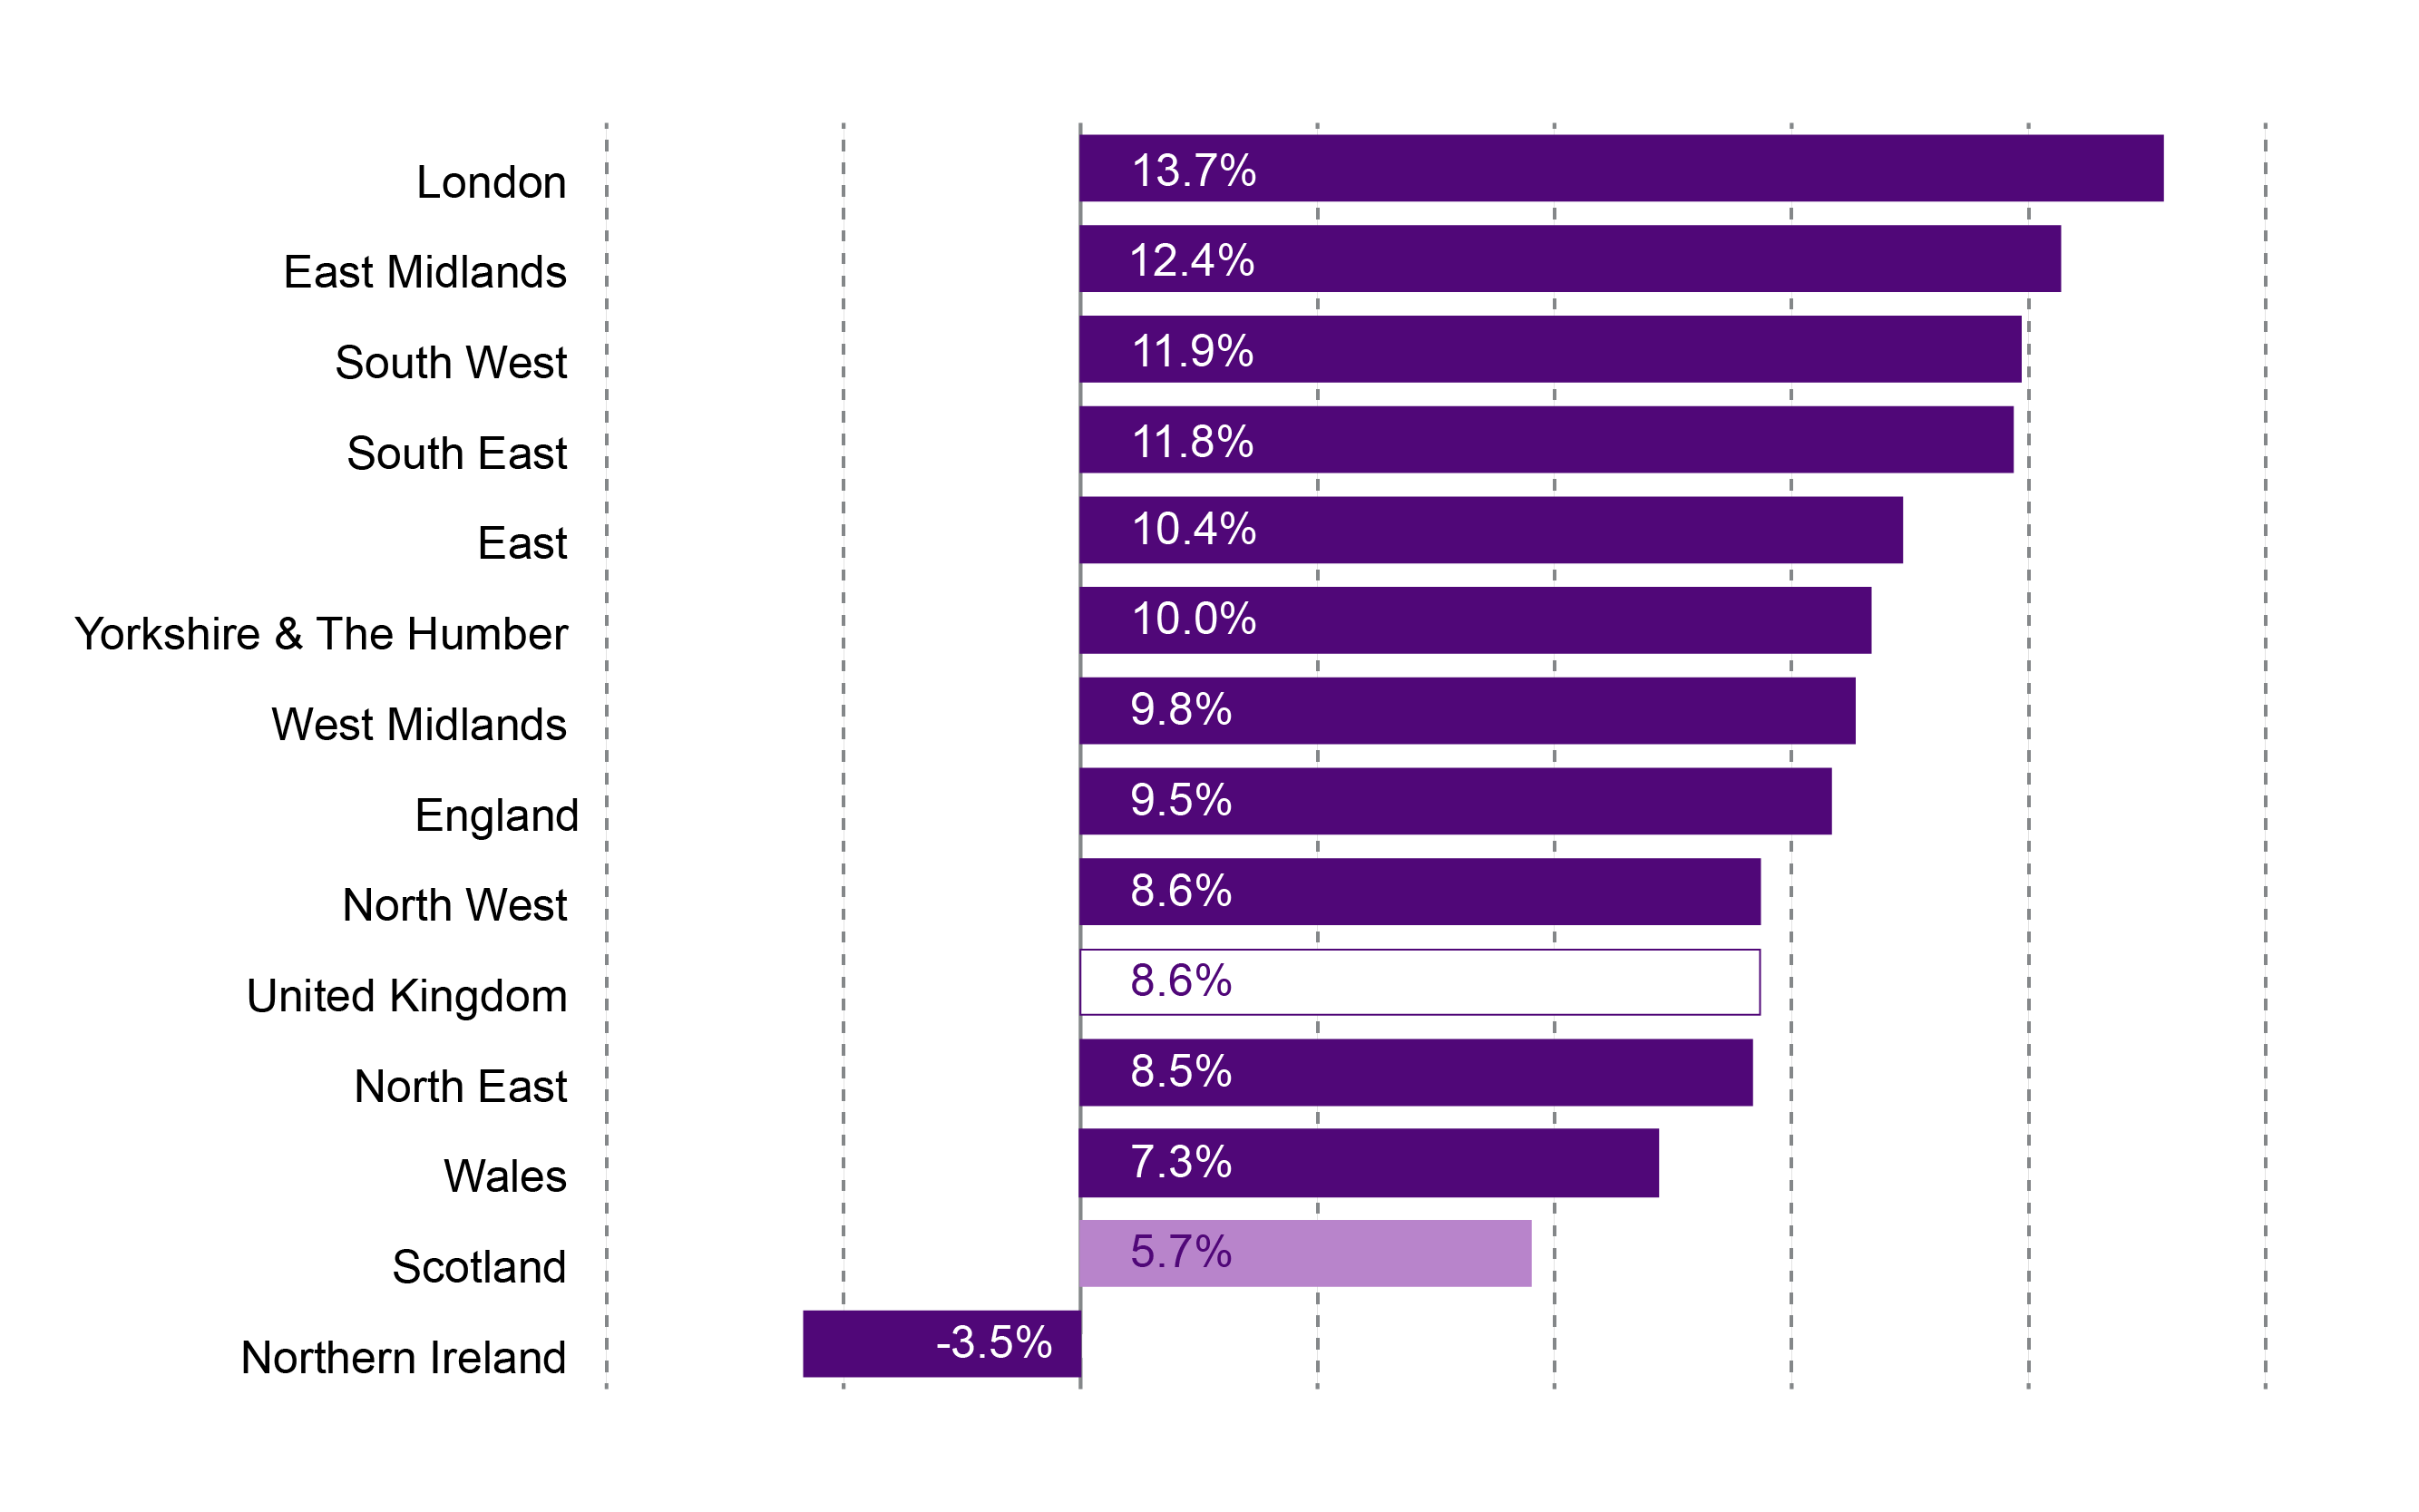
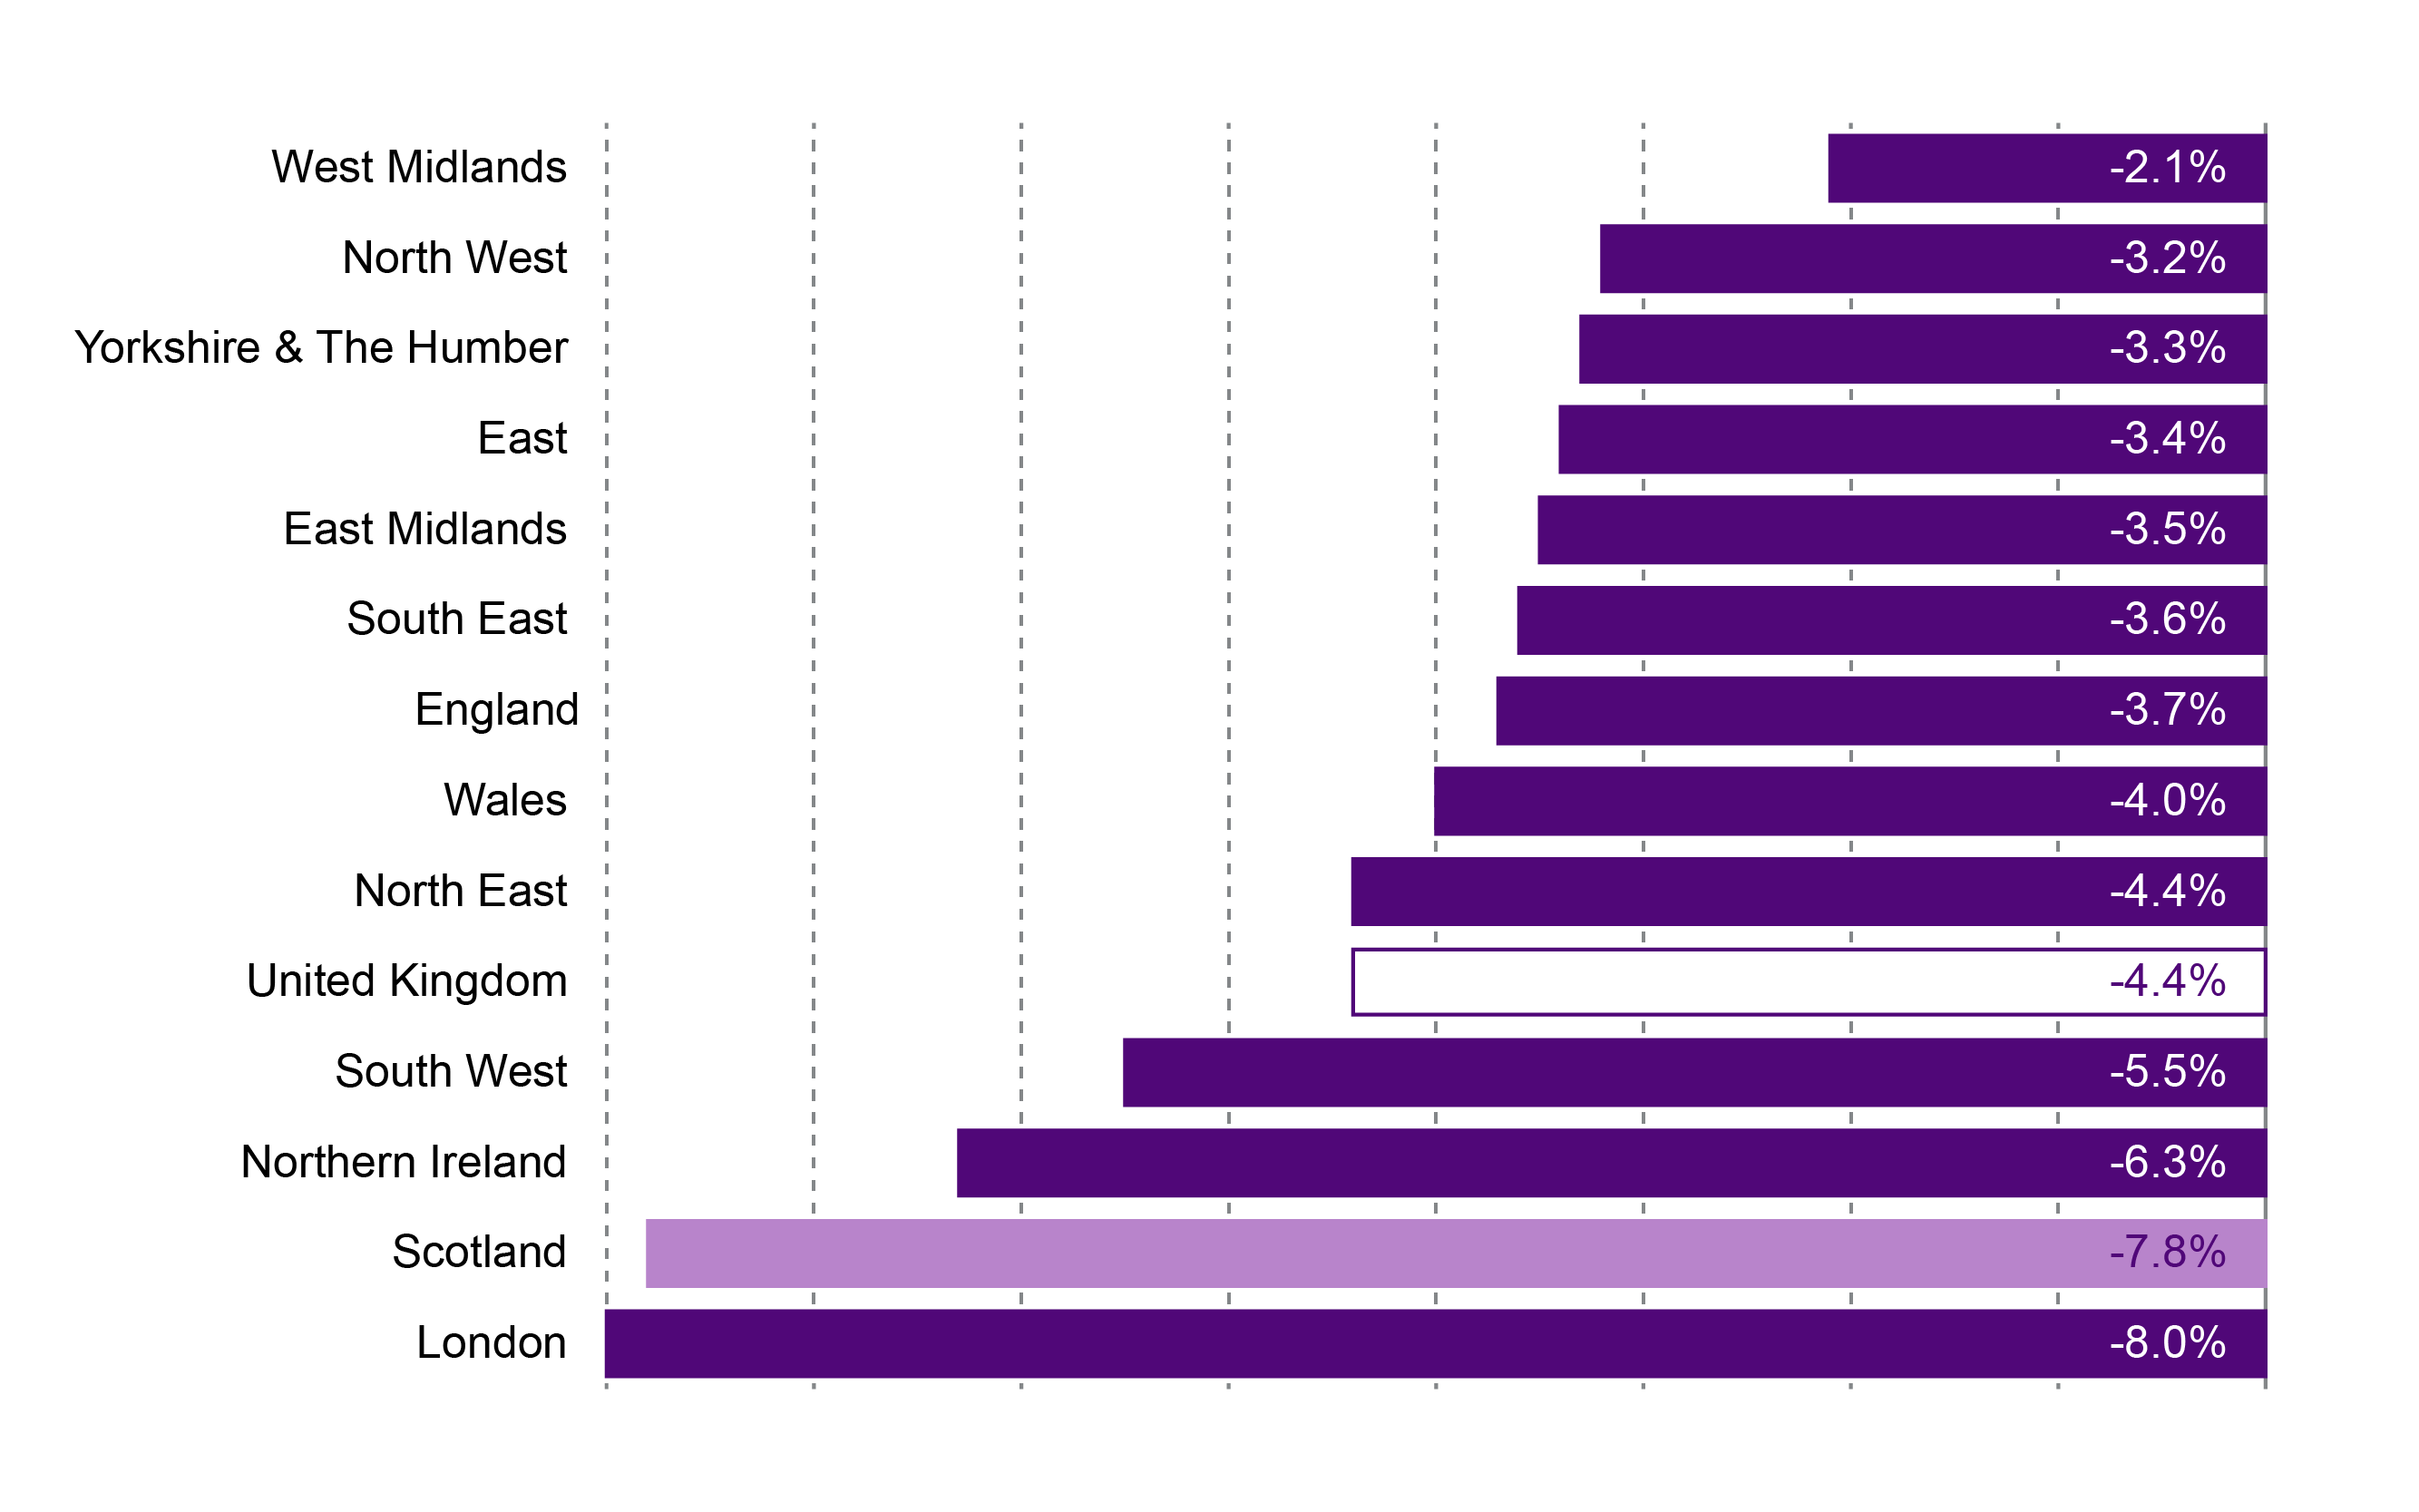
Figure 5: Median full-time gender pay gap by nation and region of the UK - 2018
Earnings and hours worked in the UK: 2018
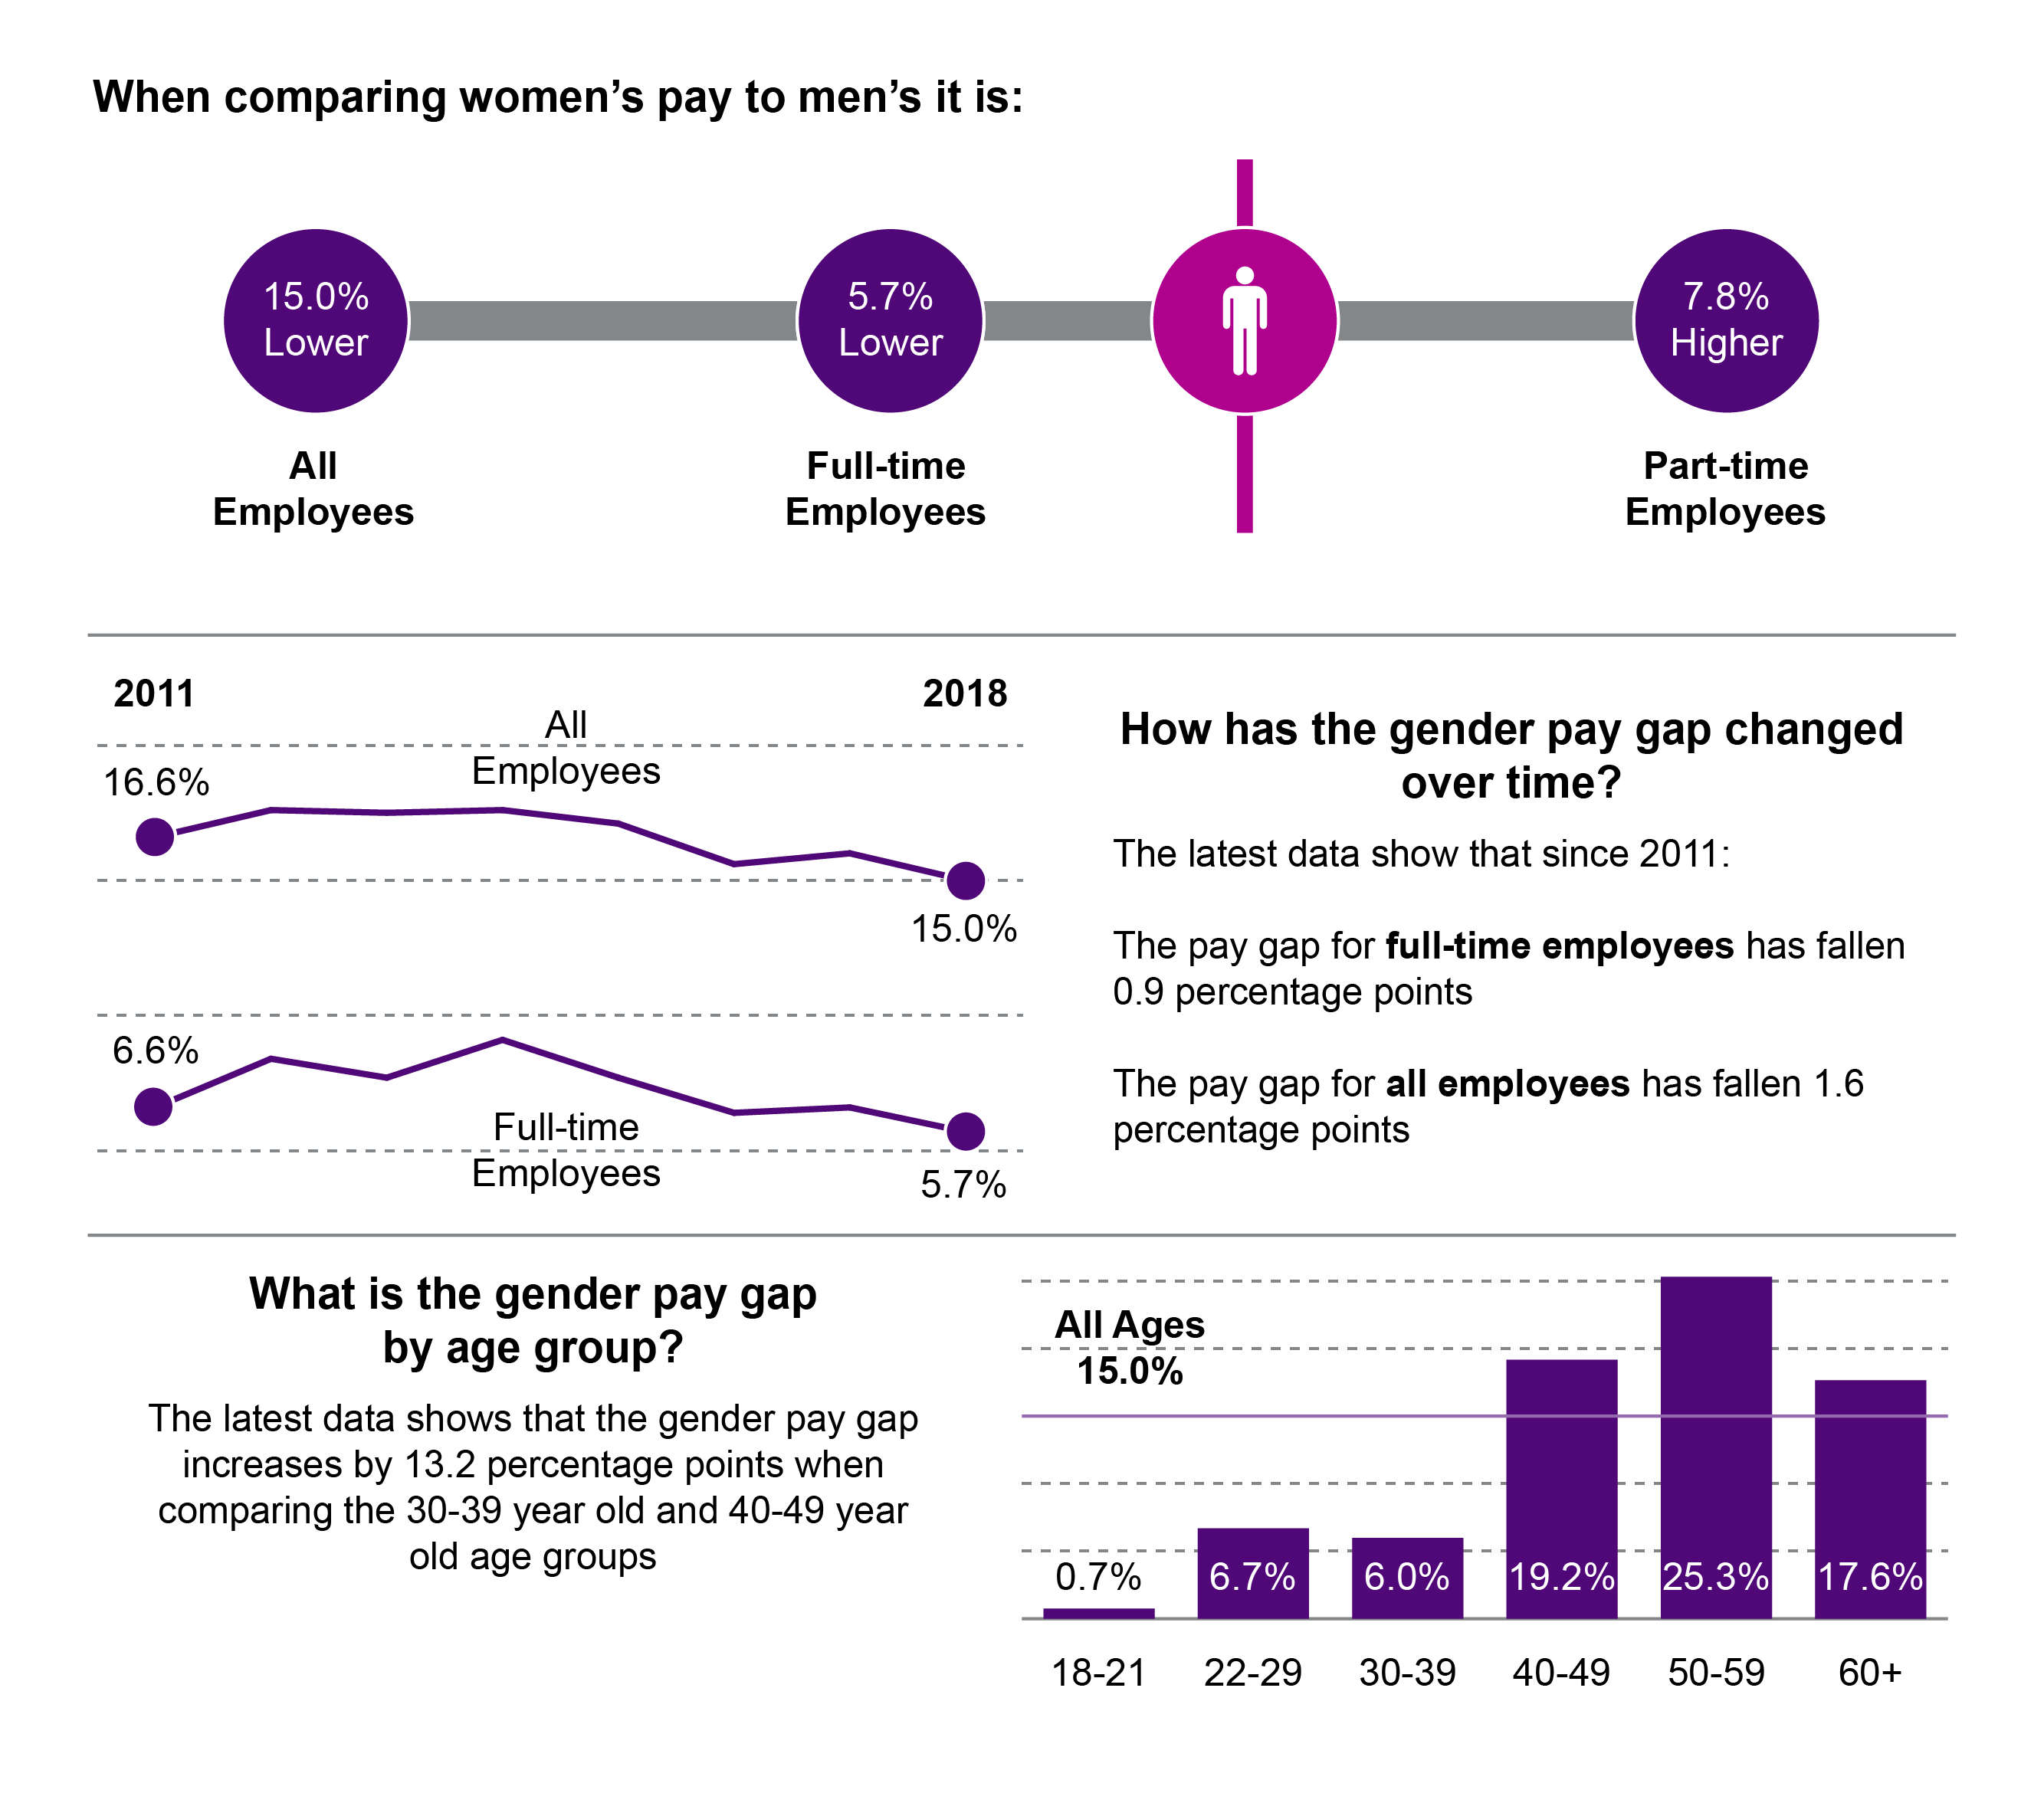
The full-time pay gap in Scotland is 5.7%, which is lower than the UK figure of 8.6%. Scotland has the second lowest gender pay gap for full-time employees of the Nations and Regions of the UK.
What is the pay gap for all employees?
The overall pay gap includes full and part-time workers. The larger pay gap for all employees shows the effect of the higher proportion of women who work part-time.
Figure 6: Median pay for all employees, gender pay gap by nation and region of the UK - 2018
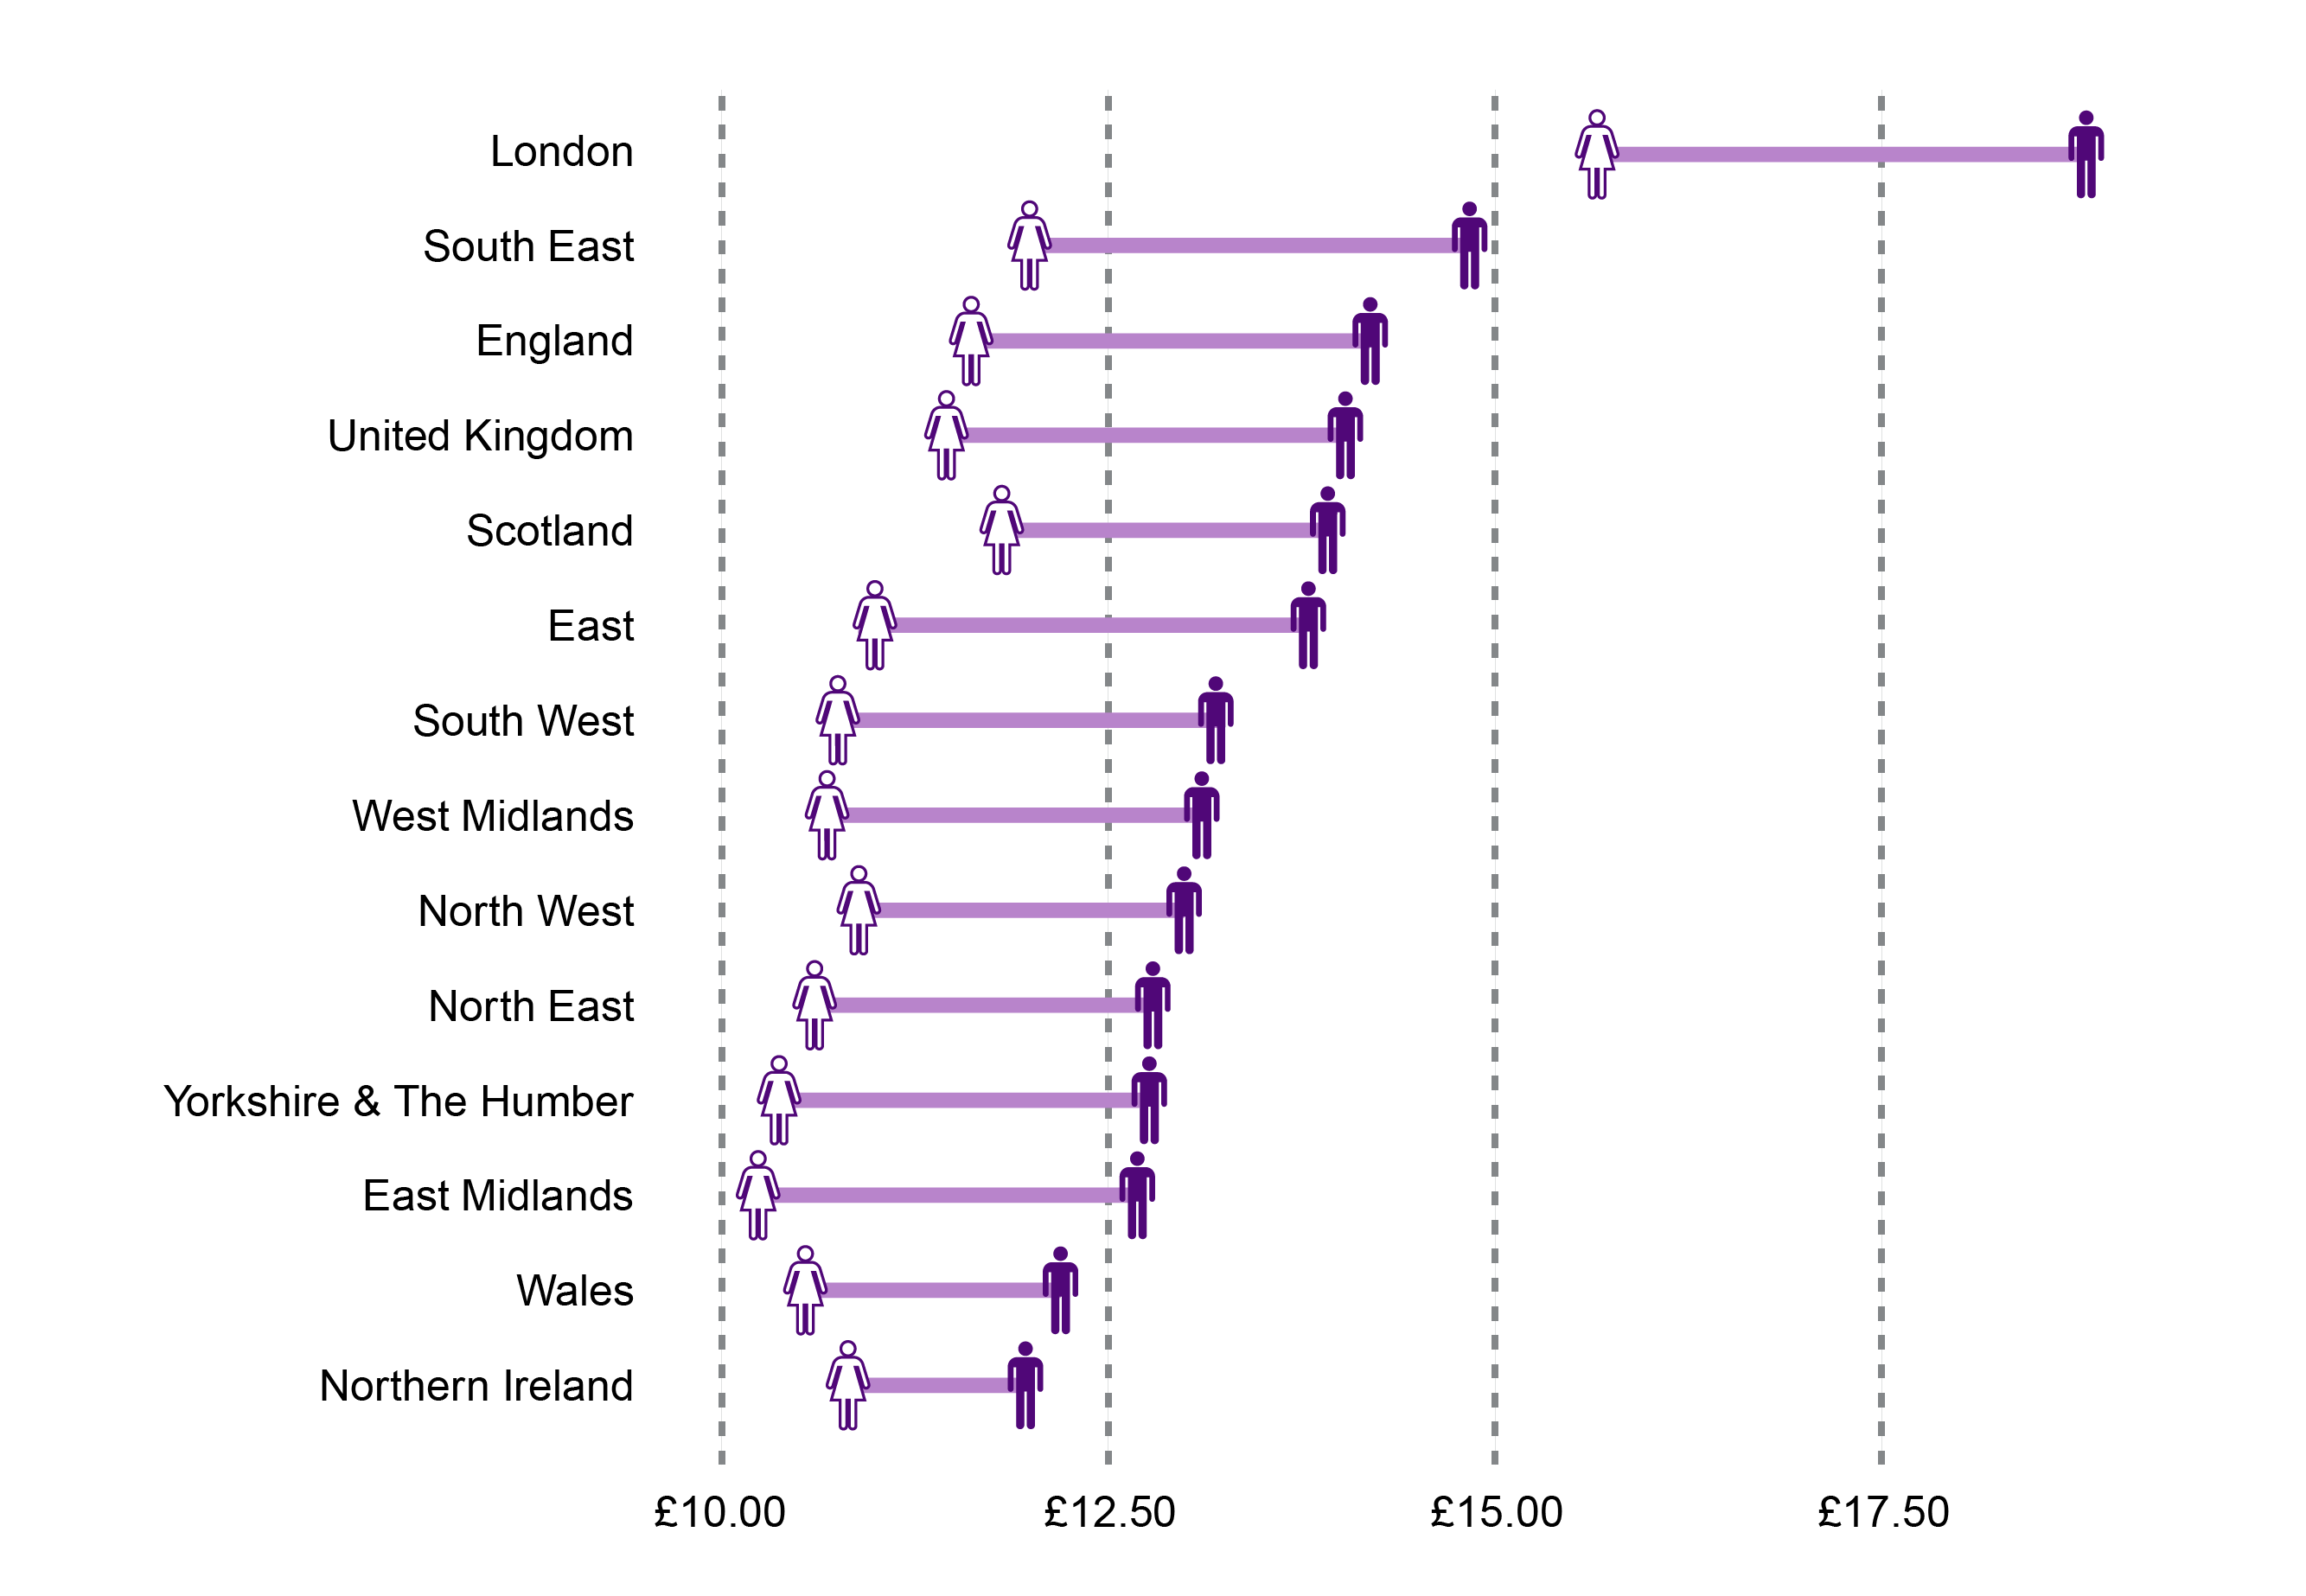
Median pay for women in Scotland is higher than in the UK as a whole and is third highest of the nations and regions of the UK. By contrast men's pay is below the UK figure but is the highest outside London and the South East.
Figure 7: Median gender pay gap for all employees by nation and region of the UK - 2018
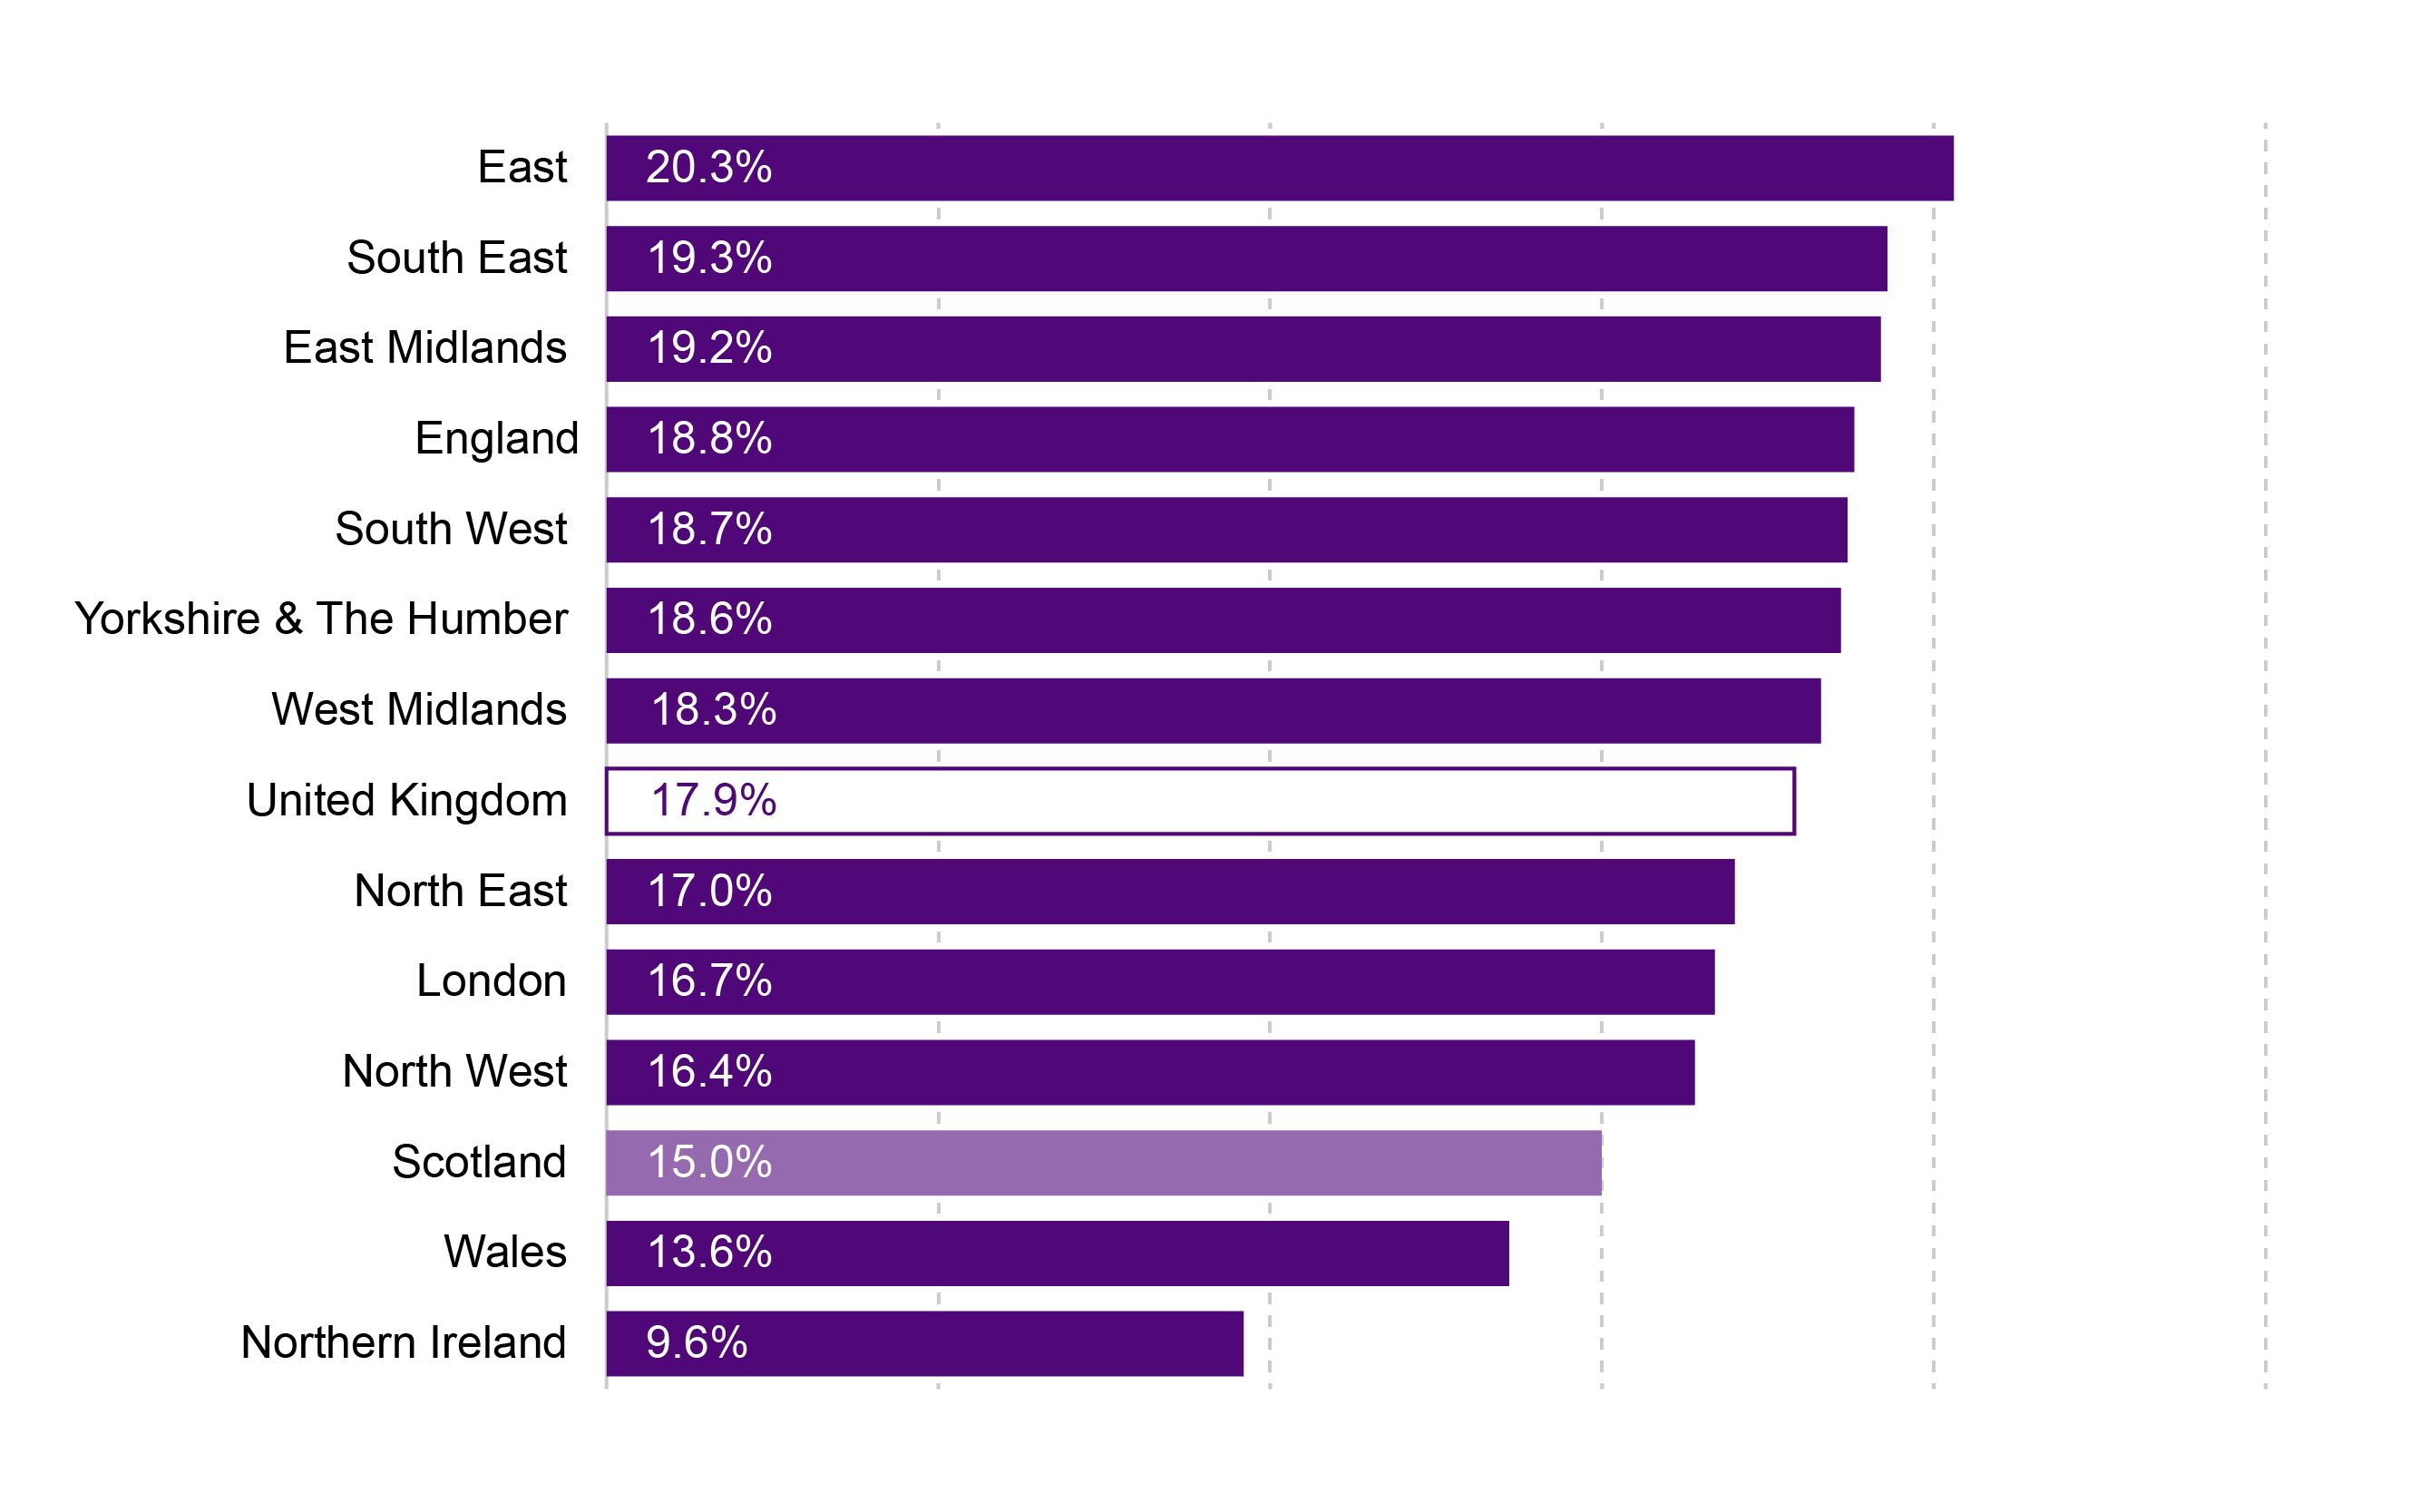
The gender pay gap in Scotland in 2018 for all employees was 15.0%, which is lower than the UK figure of 17.9%. Scotland has the third lowest gender pay gap for all employees of the Nations and Regions of the UK.
What is the pay gap for part-time pay?
Women are more likely to be in part time employment than men, with 41% of women working part-time compared with 11% of men. Women account for 78% of Scottish part-time employment
Figure 8: Median part-time gender pay gap by nation and region of the UK - 2018
Median part-time pay for women in Scotland is above the UK average and is the third highest of the nations and regions of the UK. Men's part-time pay is slightly lower than the UK wide figure and is the fourth highest of the nations and regions of the UK.
Figure 9: Median part-time gender pay gap by nation and region of the UK - 2018
The part-time gender pay gap in Scotland is -7.8%, meaning women have a higher median pay than men for part-time work, and only London has a wider pay gap. The UK is at -4.4%.
How does women's part-time pay compare to men's full-time pay?
As women are more likely to work part-time and make up the majority of people in part-time employment, Close the gap suggests that it is relevant to compare women's part-time earnings to men's full-time earnings.
The pay gap for women working part-time and men who work full-time is higher in the UK than in Scotland, 36.1% in the UK compared with 33.6% in Scotland.
| Men's full-time hourly pay (£) | Women's part-time hourly pay (£) | pay gap | |
|---|---|---|---|
| Scotland | 14.70 | 9.76 | 33.6% |
| UK | 14.81 | 9.47 | 36.1% |
What does the mean pay gap look like?
The pay gap based on median pay represents the pay difference for the typical workers' income. Those at the higher end of the pay distribution tend to be men. So using mean pay for the pay gap shows the effect of this on the difference between men's and women's pay.
| All Employees | Full-time | Part-time | Men's full-time and women's part-time | |
|---|---|---|---|---|
| Scotland | 13.9% | 10.2% | -2.1% | 29.7% |
| UK | 17.1% | 13.7% | 7.2% | 32.6% |
Figure 10: Comparison of the Median and Mean gender pay gaps in Scotland - 2018
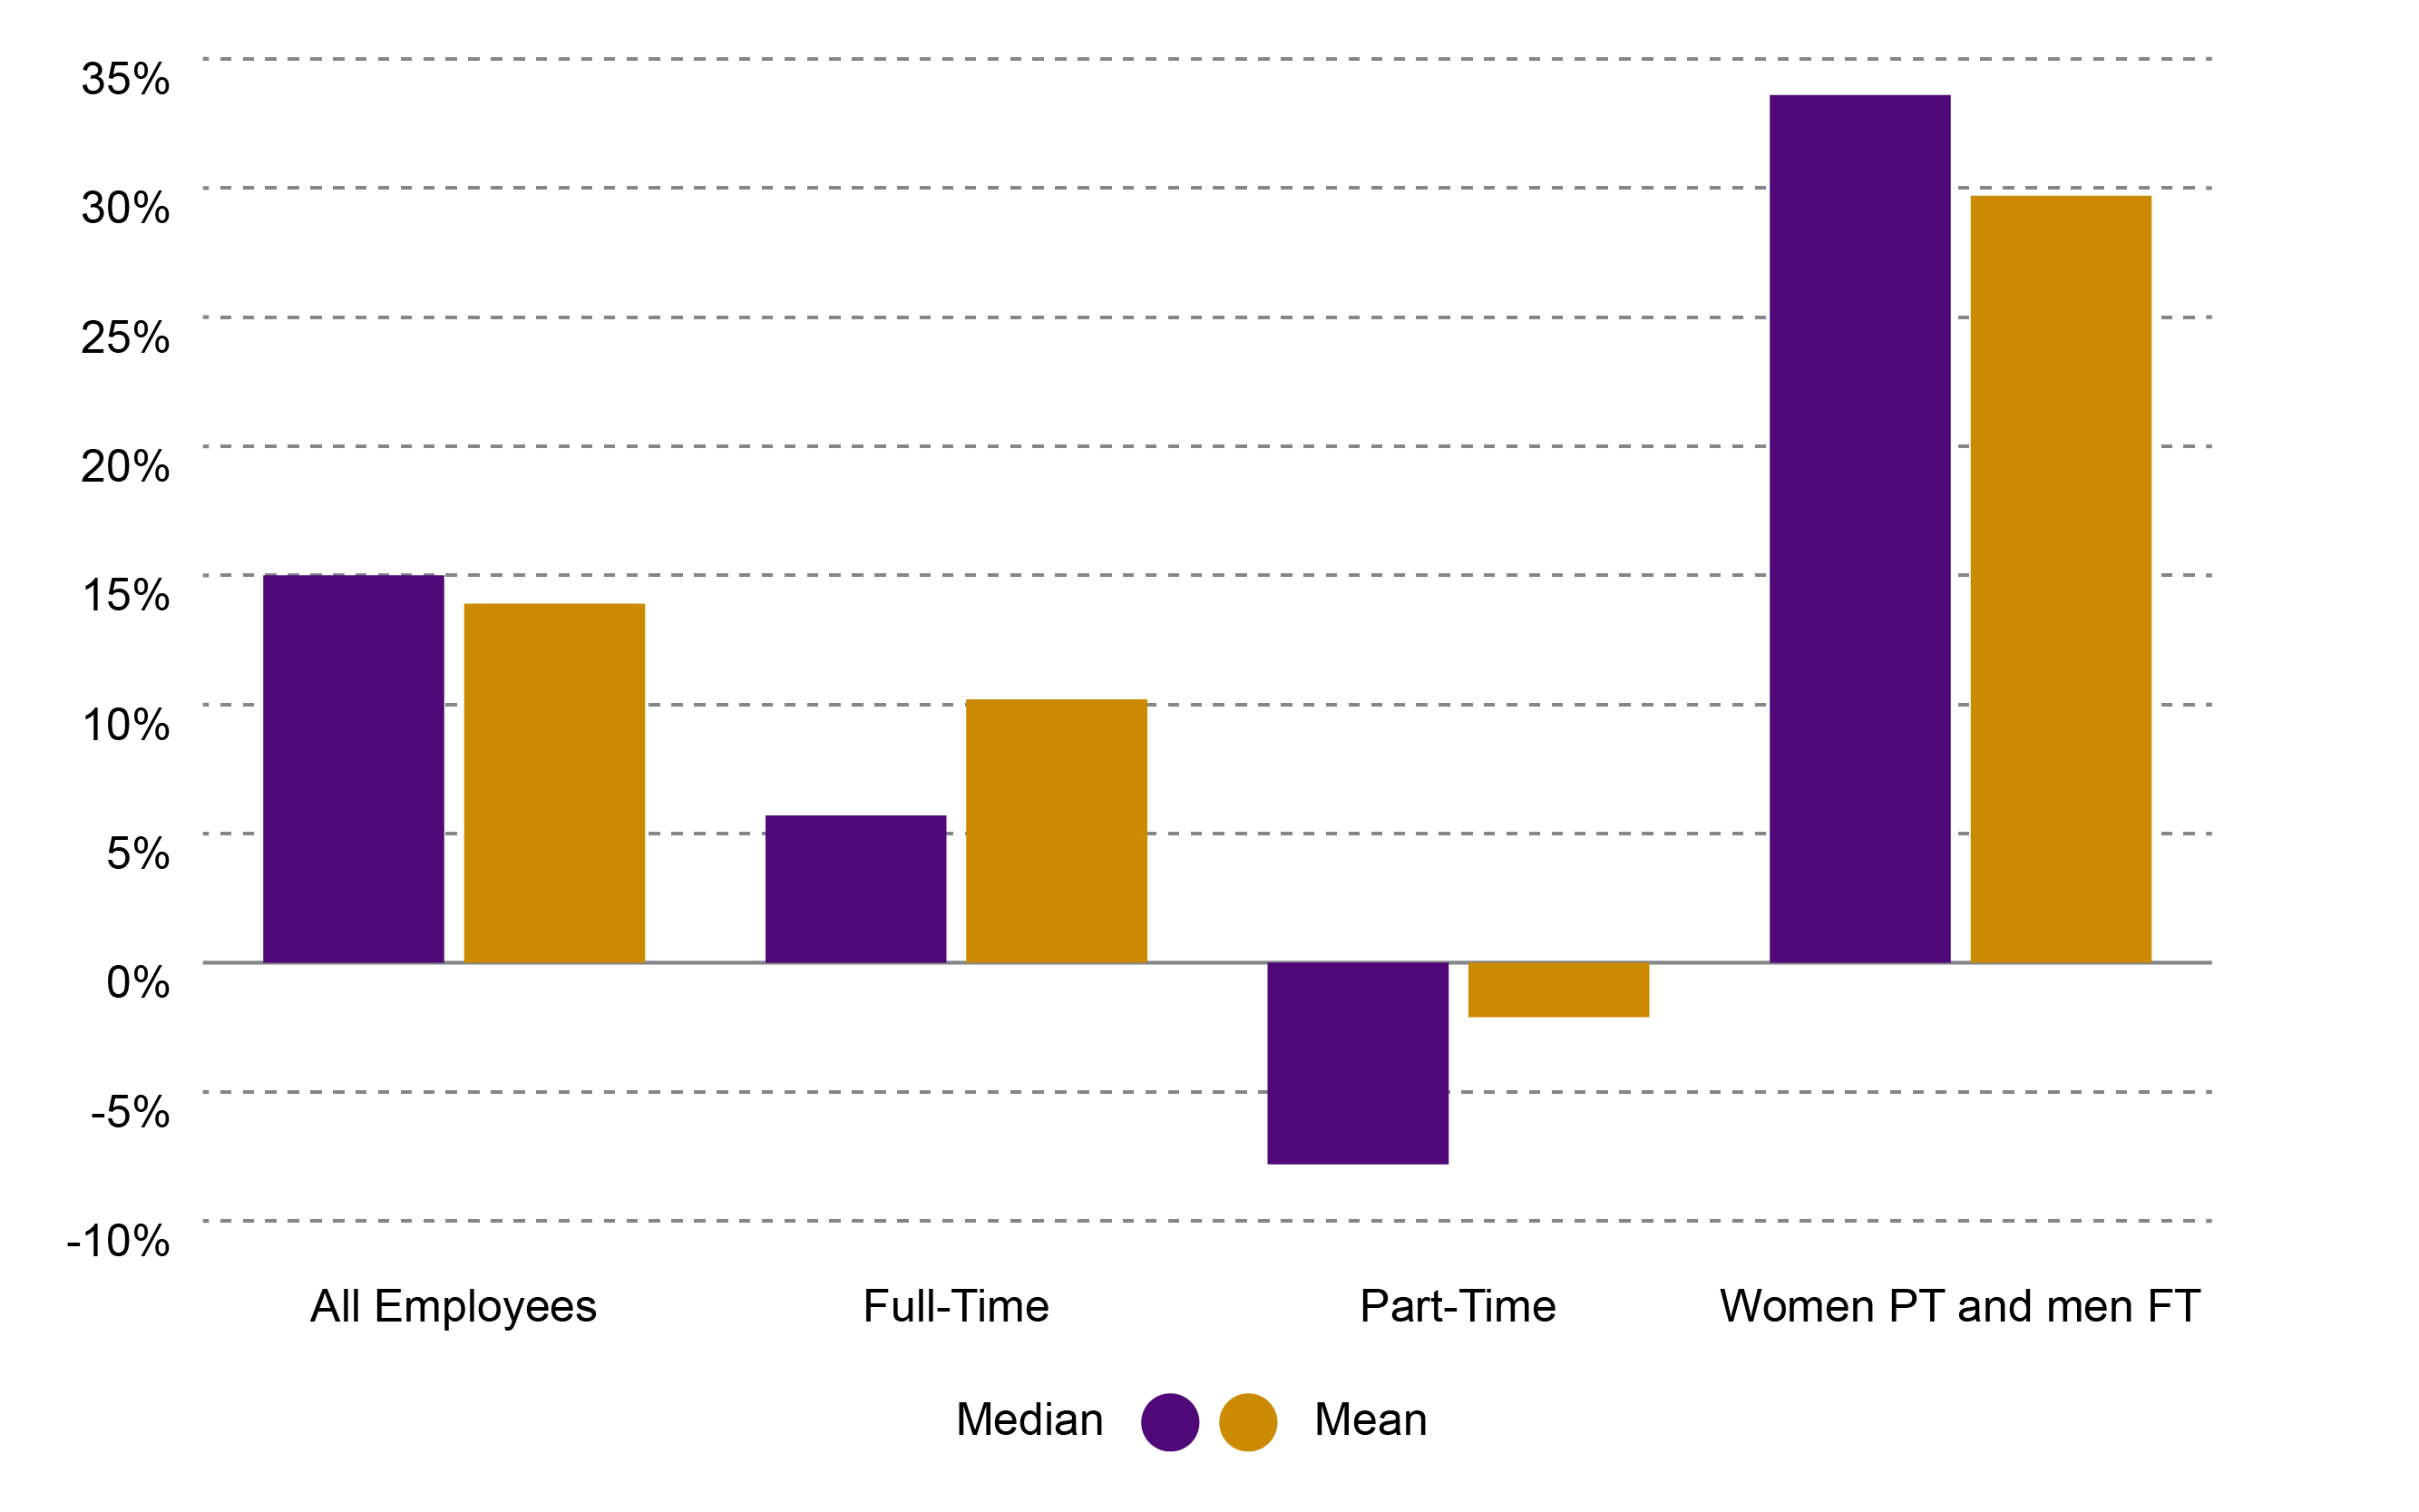
Figure 10 shows that when comparing the mean and median pay gaps there is little difference between the figures for all employees and the comparison of full-time men to part-time women. Differences can be seen in the comparison of the full-time and part-time mean and median pay gaps:
The larger gap for mean full-time pay can be explained by the larger number of men who work full-time and in higher paid roles.
The mean pay gap for part-time pay is -2.1% while the median pay gap is -7.8%. One potential reason for this is that although women make up the majority of part-time workers, men are more likely to work in more senior, higher paid roles. Therefore a small number of high earning men who work part-time can have a large impact on the mean pay gap.
How has the gender pay gap changed over time?
The Scottish Government advises that it is best to look at the change in the gender pay gap over time because of uncertainties with the statistical significance of annual changes.1
Figure 11: gender pay gap for all and full-time employees in Scotland - 1997 to 2018
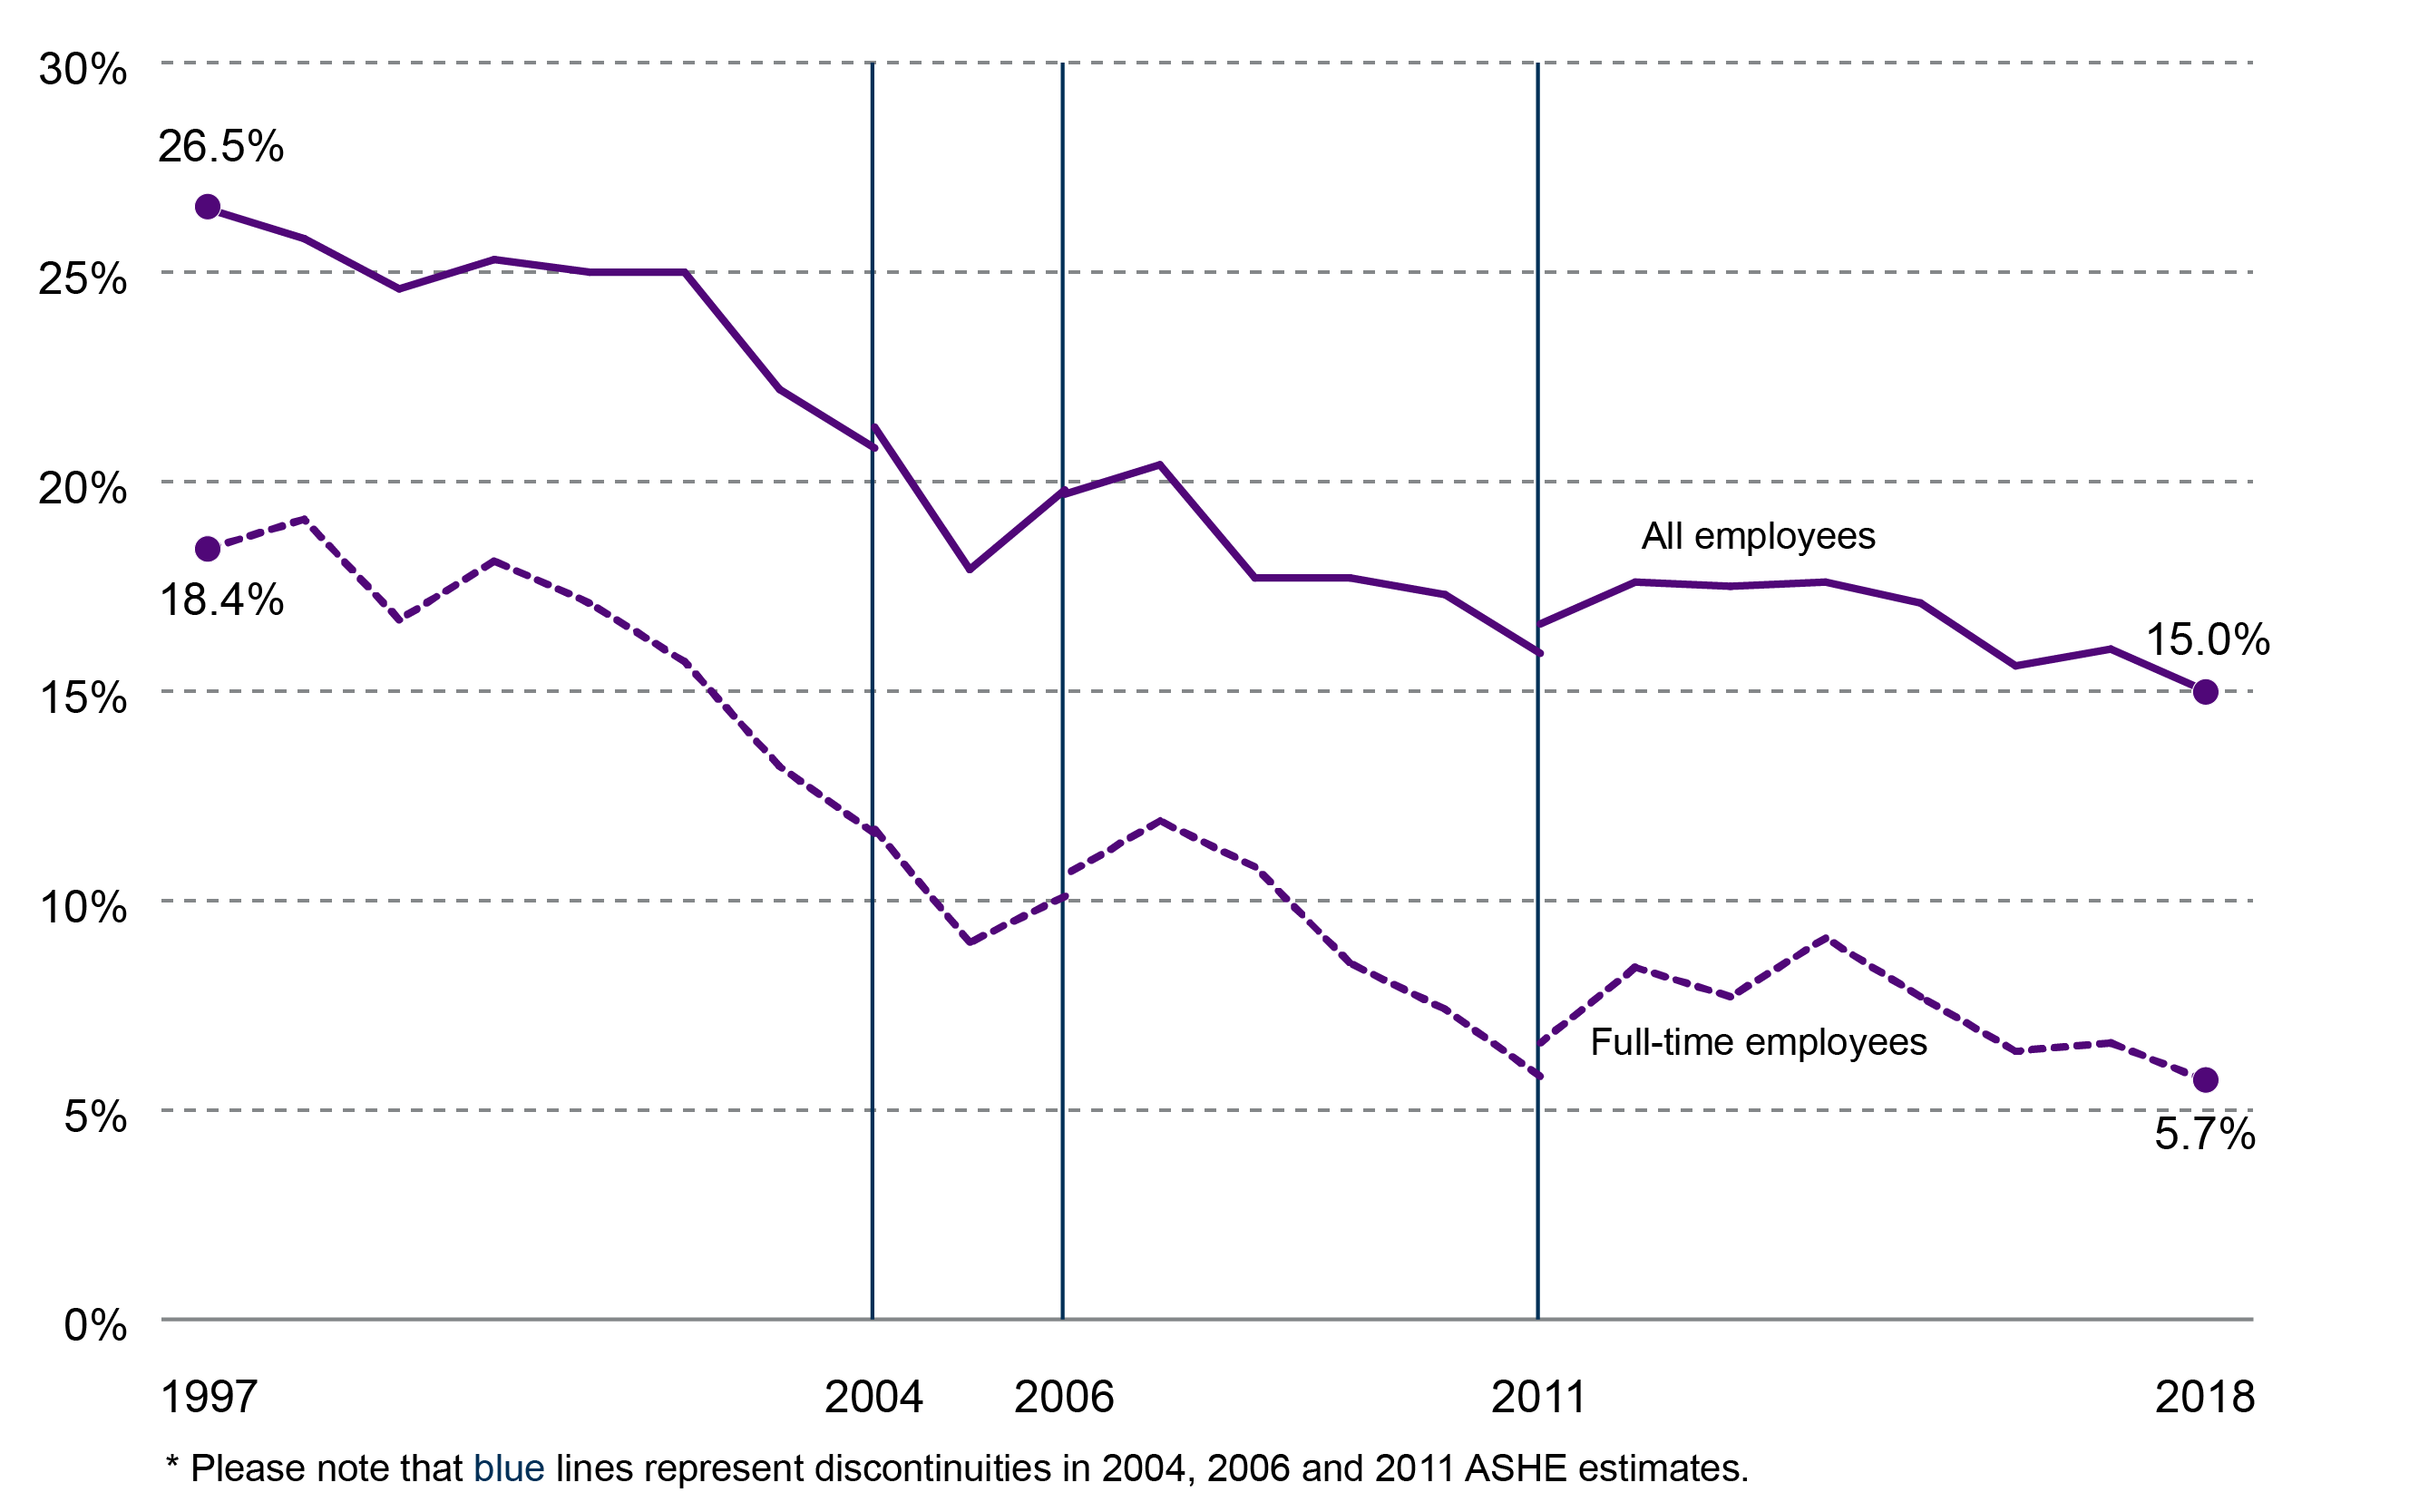
Since 1997 the gender pay gap for all employees has fallen by 11.5 percentage points, and by 12.7 percentage points for full-time employees. However since 2011 there has been little or no change in the gender pay gap for both full-time and all employees falling by 1.6 and 0.9 percentage points.
It should be noted that blue lines represent discontinuities in 2004, 2006 and 2011 ASHE estimates due to changes in the way the data was captured.
What is the pay gap by occupation?
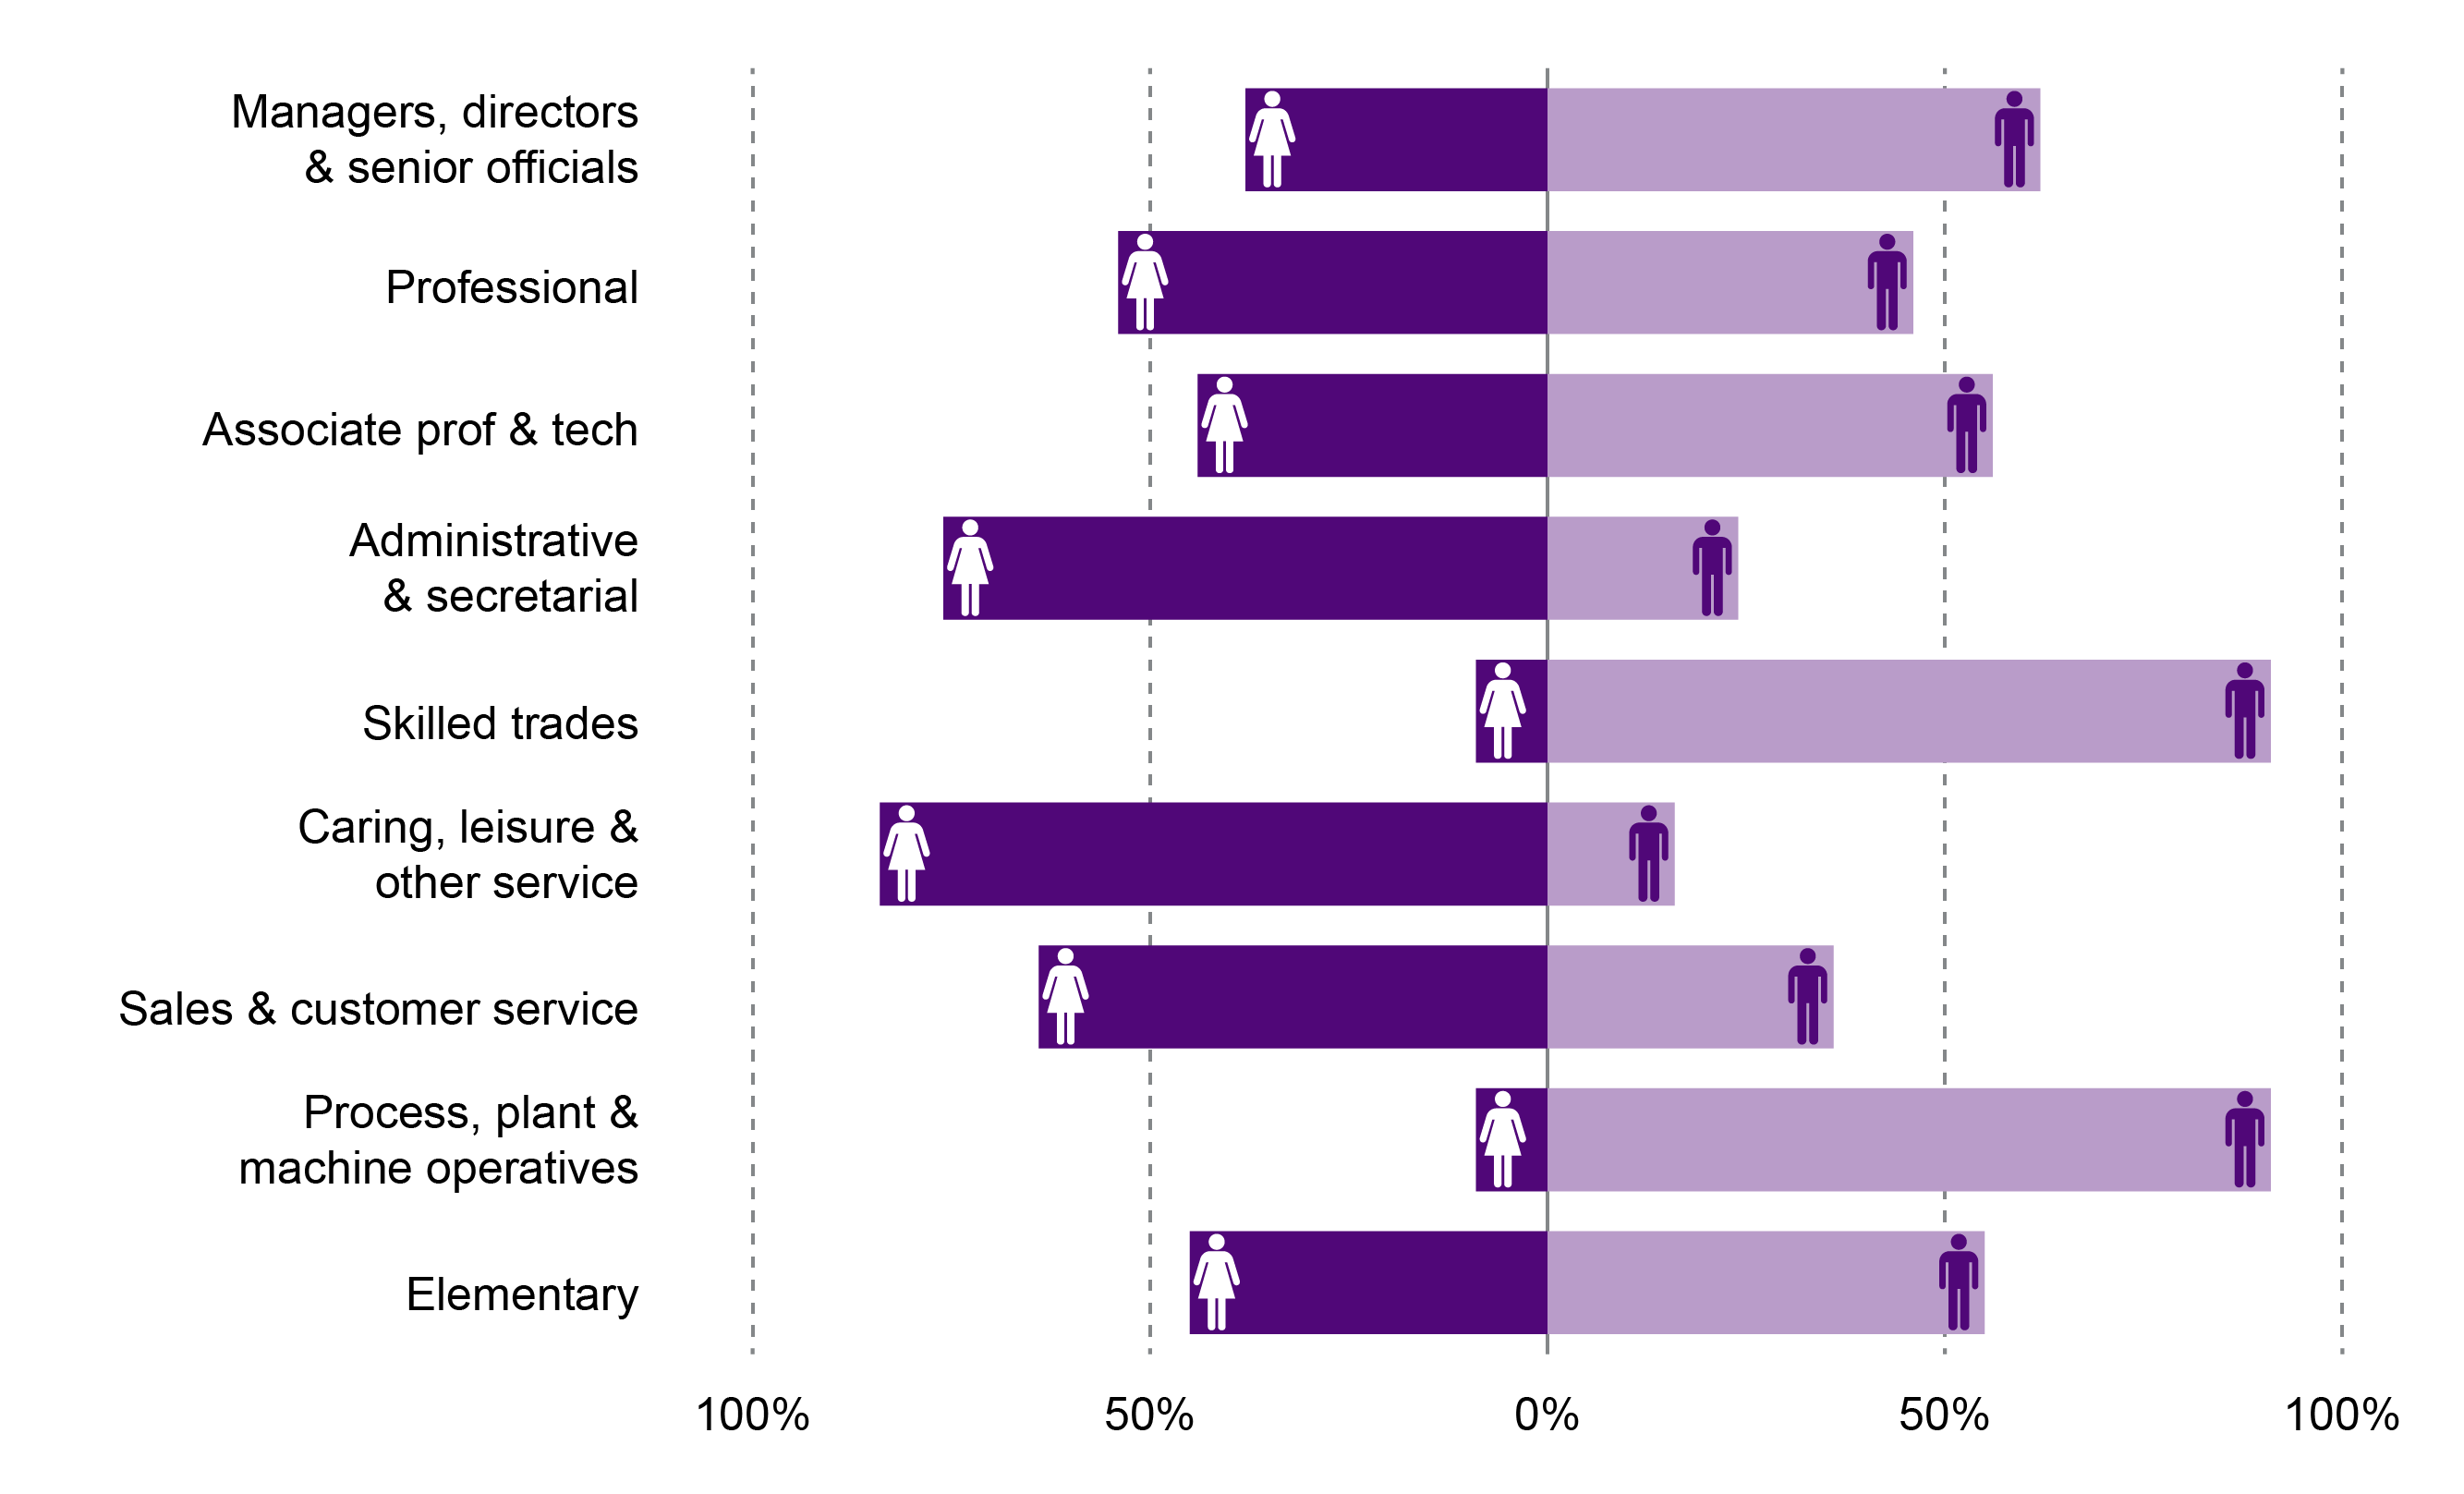
When looking at the gender pay gap by occupation it is important to understand the gender breakdown of different occupation groups. The latest data from the Annual Population Survey (Jul 2017-Jun 2018) from the ONS shows that women dominate the "Administration & secretarial", "Caring, leisure & other service" and "Sales & customers services" occupations, which tend to be lower skilled and lower paid.
However, it is worth pointing out that there is a slightly higher proportion of women working in the professional occupations in Scotland.
Figure 12: gender breakdown of major occupation groups in Scotland - Jul 2017-Jun 2018
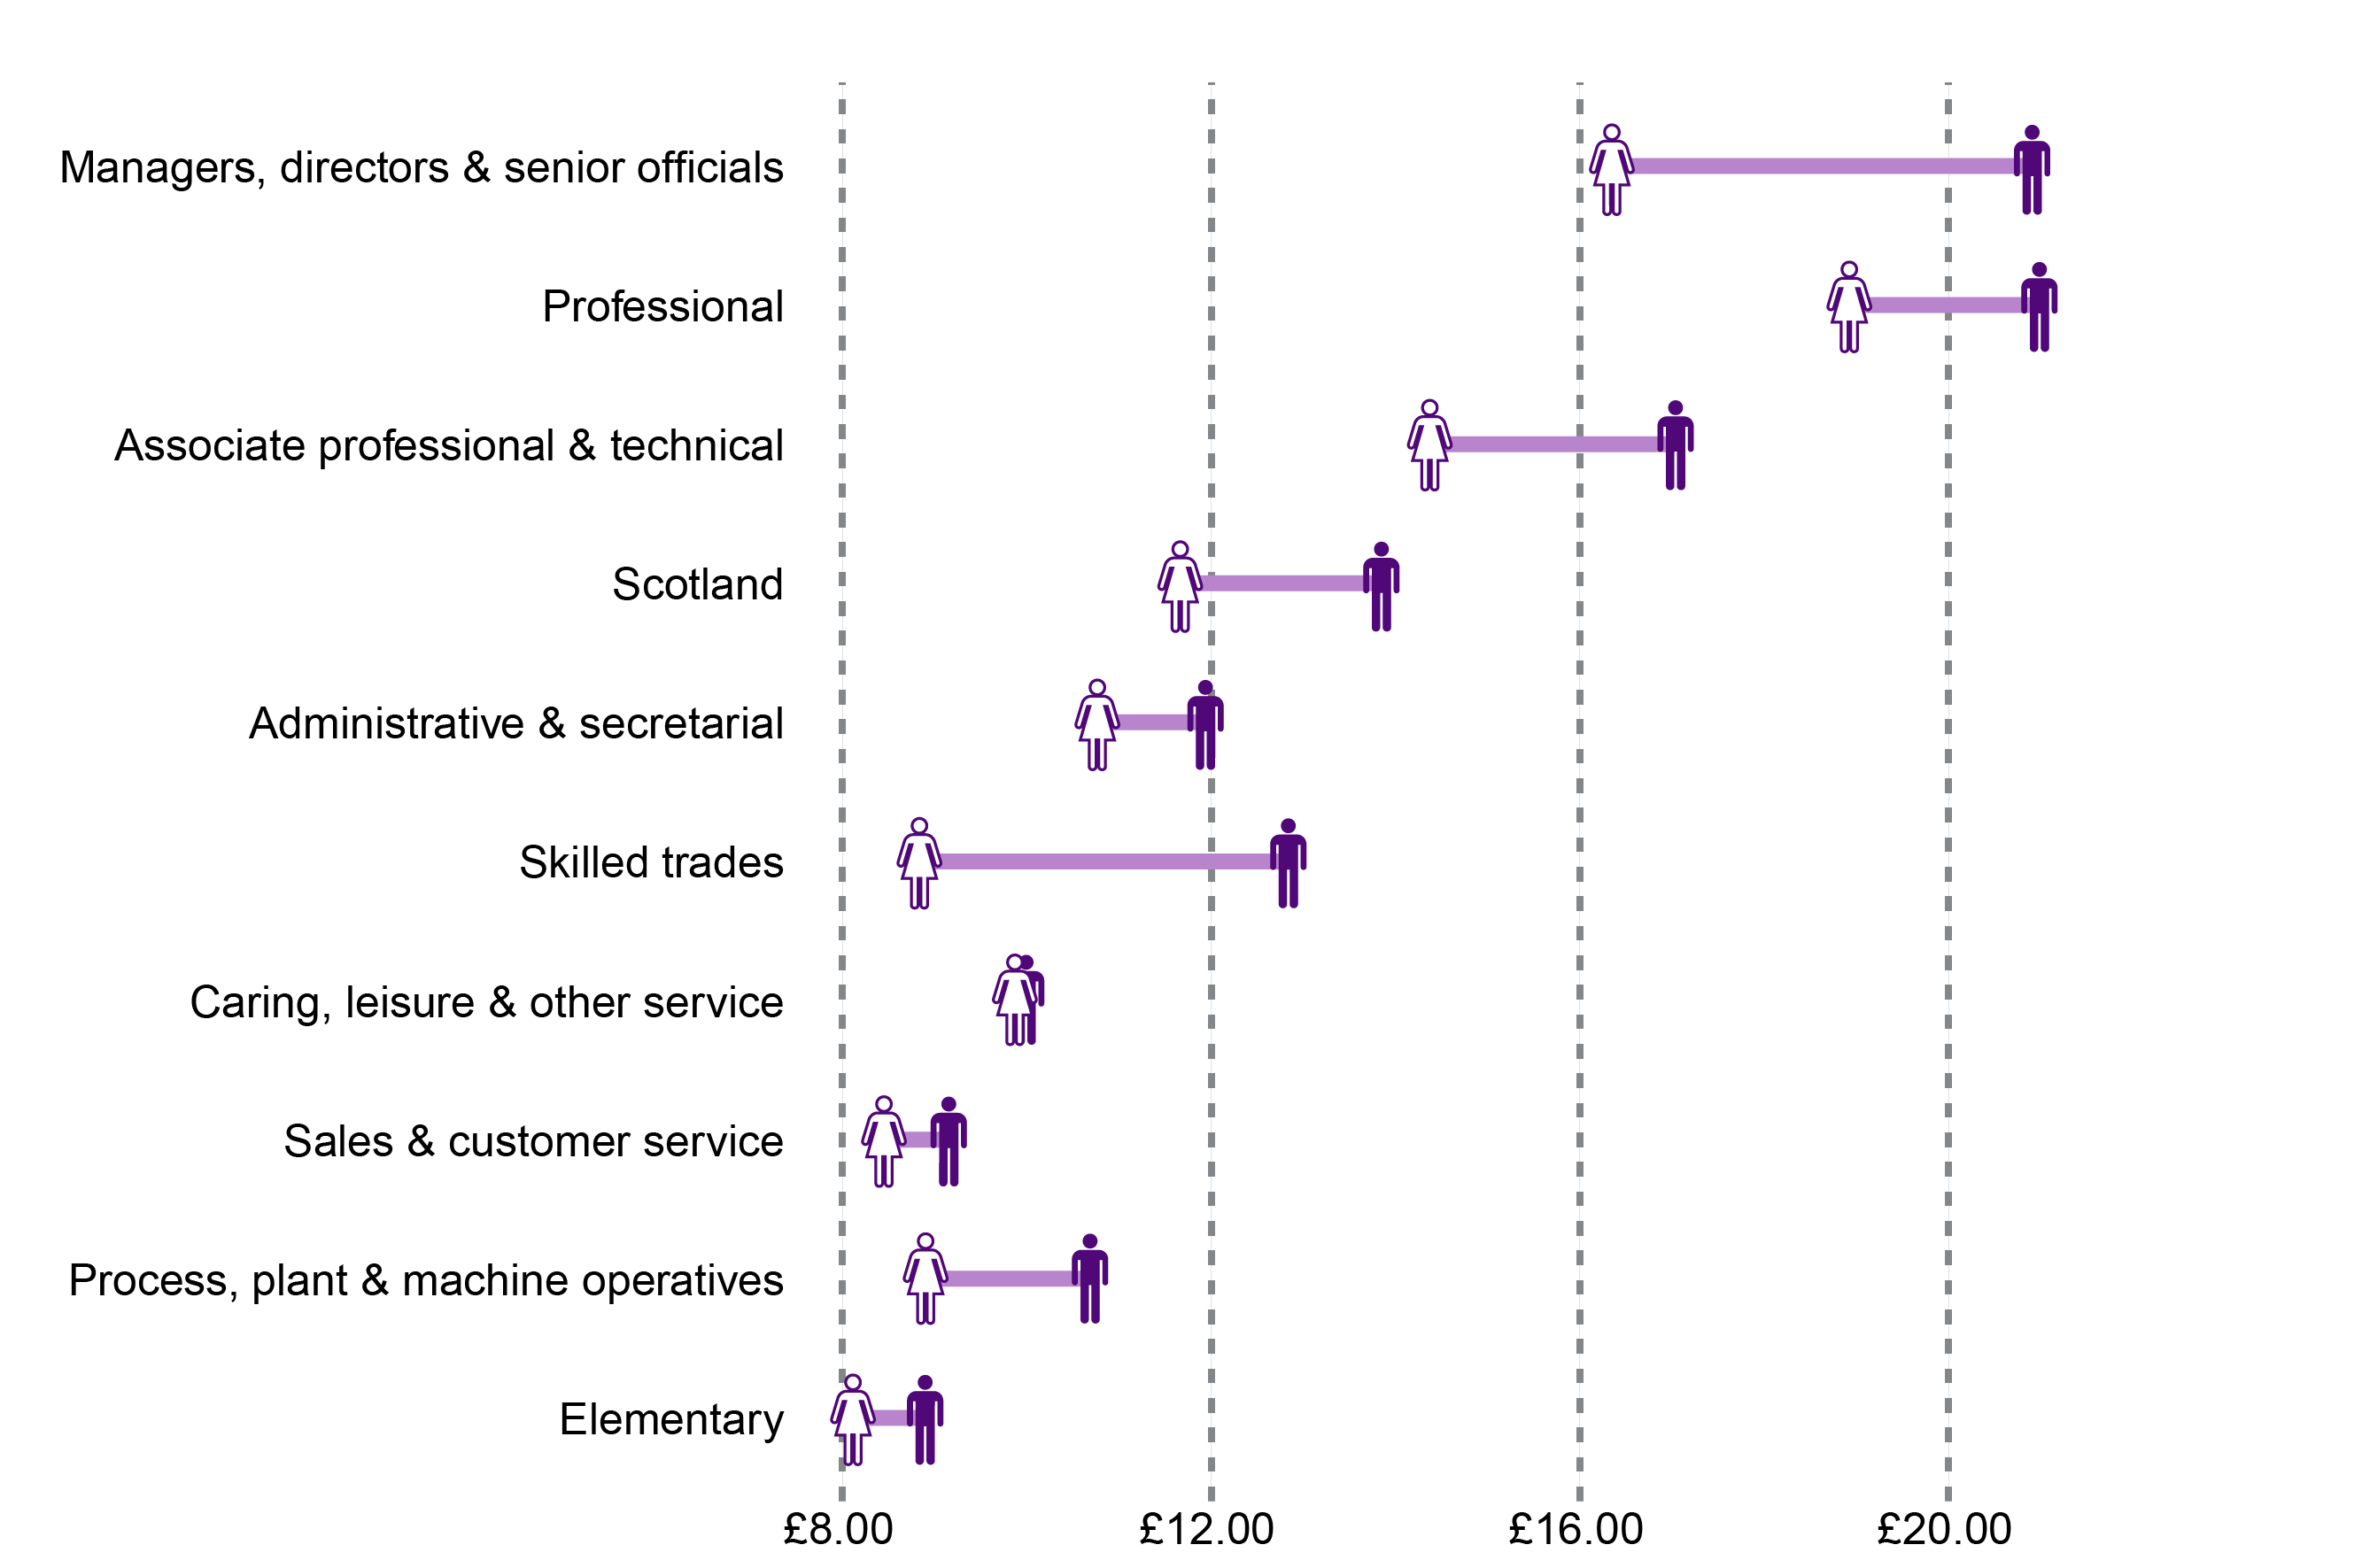
When looking at pay for all employees by occupation, it shows that median pay for men is higher than for women in all occupations. Professional occupations are the highest paid for both men and women.
Figure 13: pay by occupation and gender in Scotland - 2018
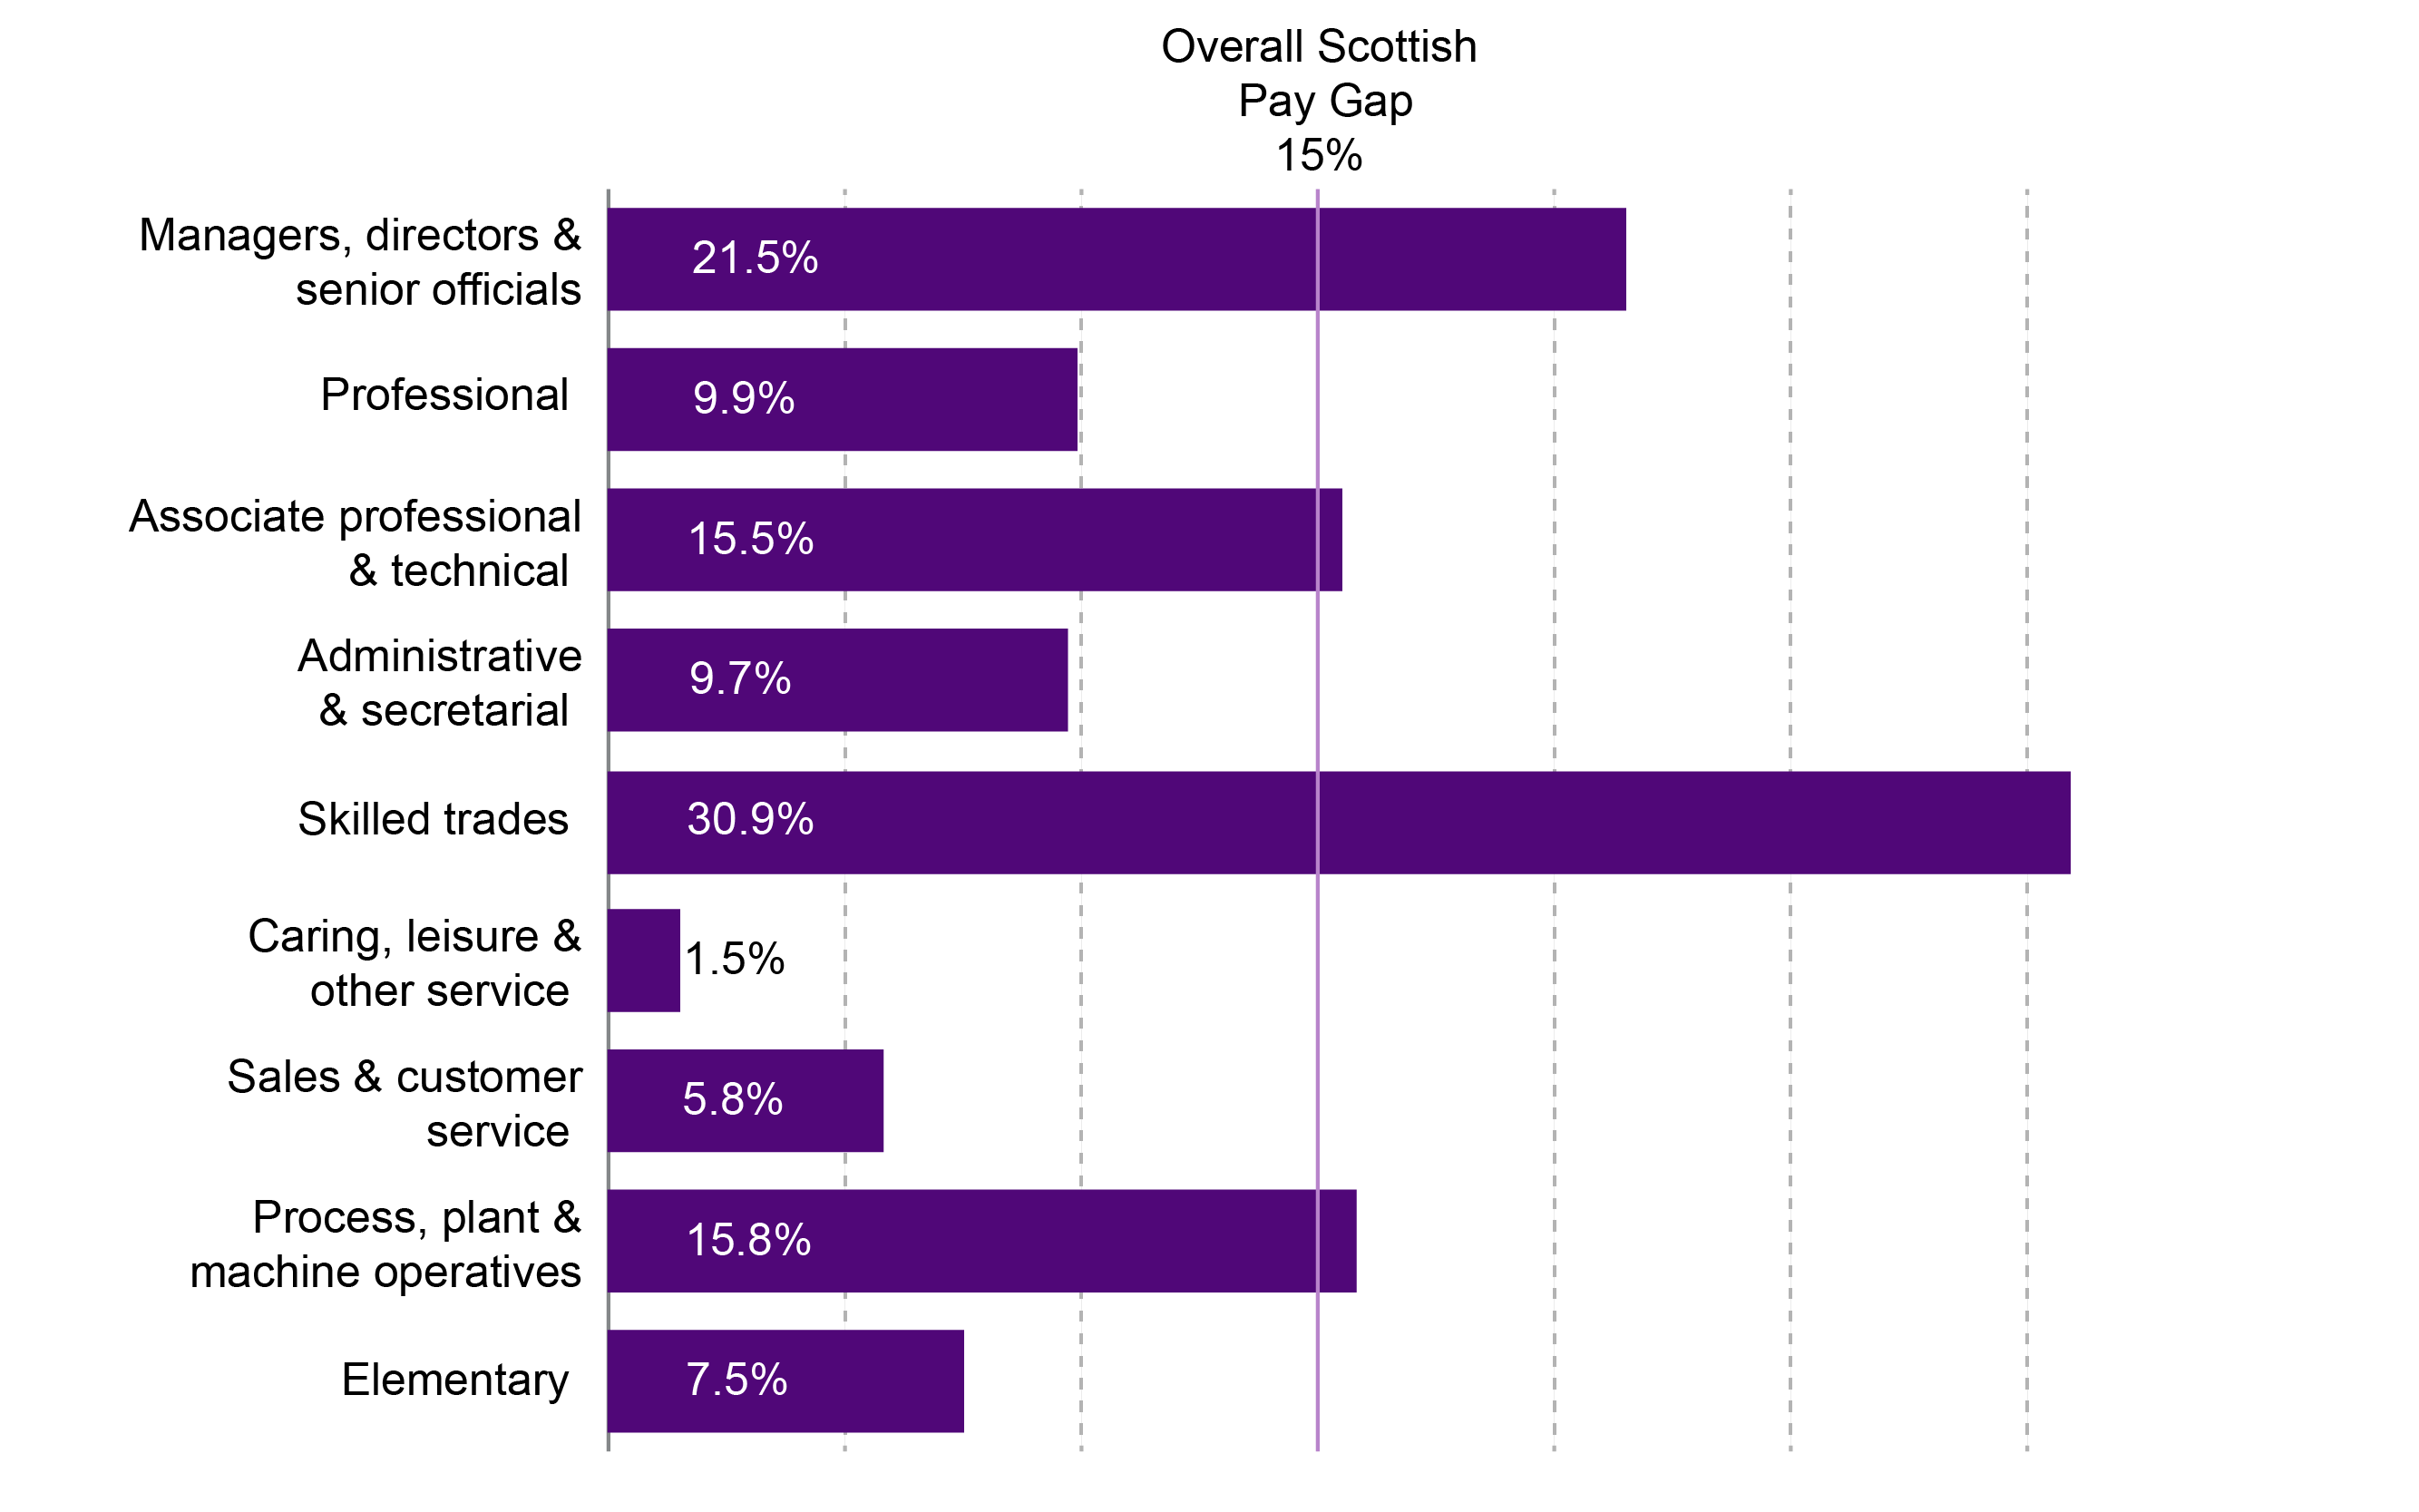
In Scotland in 2018 "Skilled trades" had the largest gender pay gap for all employees at 30.9%. "Caring, leisure & other service" had the smallest gender pay gap at 1.5%.
Figure 14: Median gender pay gap by occupation - 2018
What is the pay gap by industry?
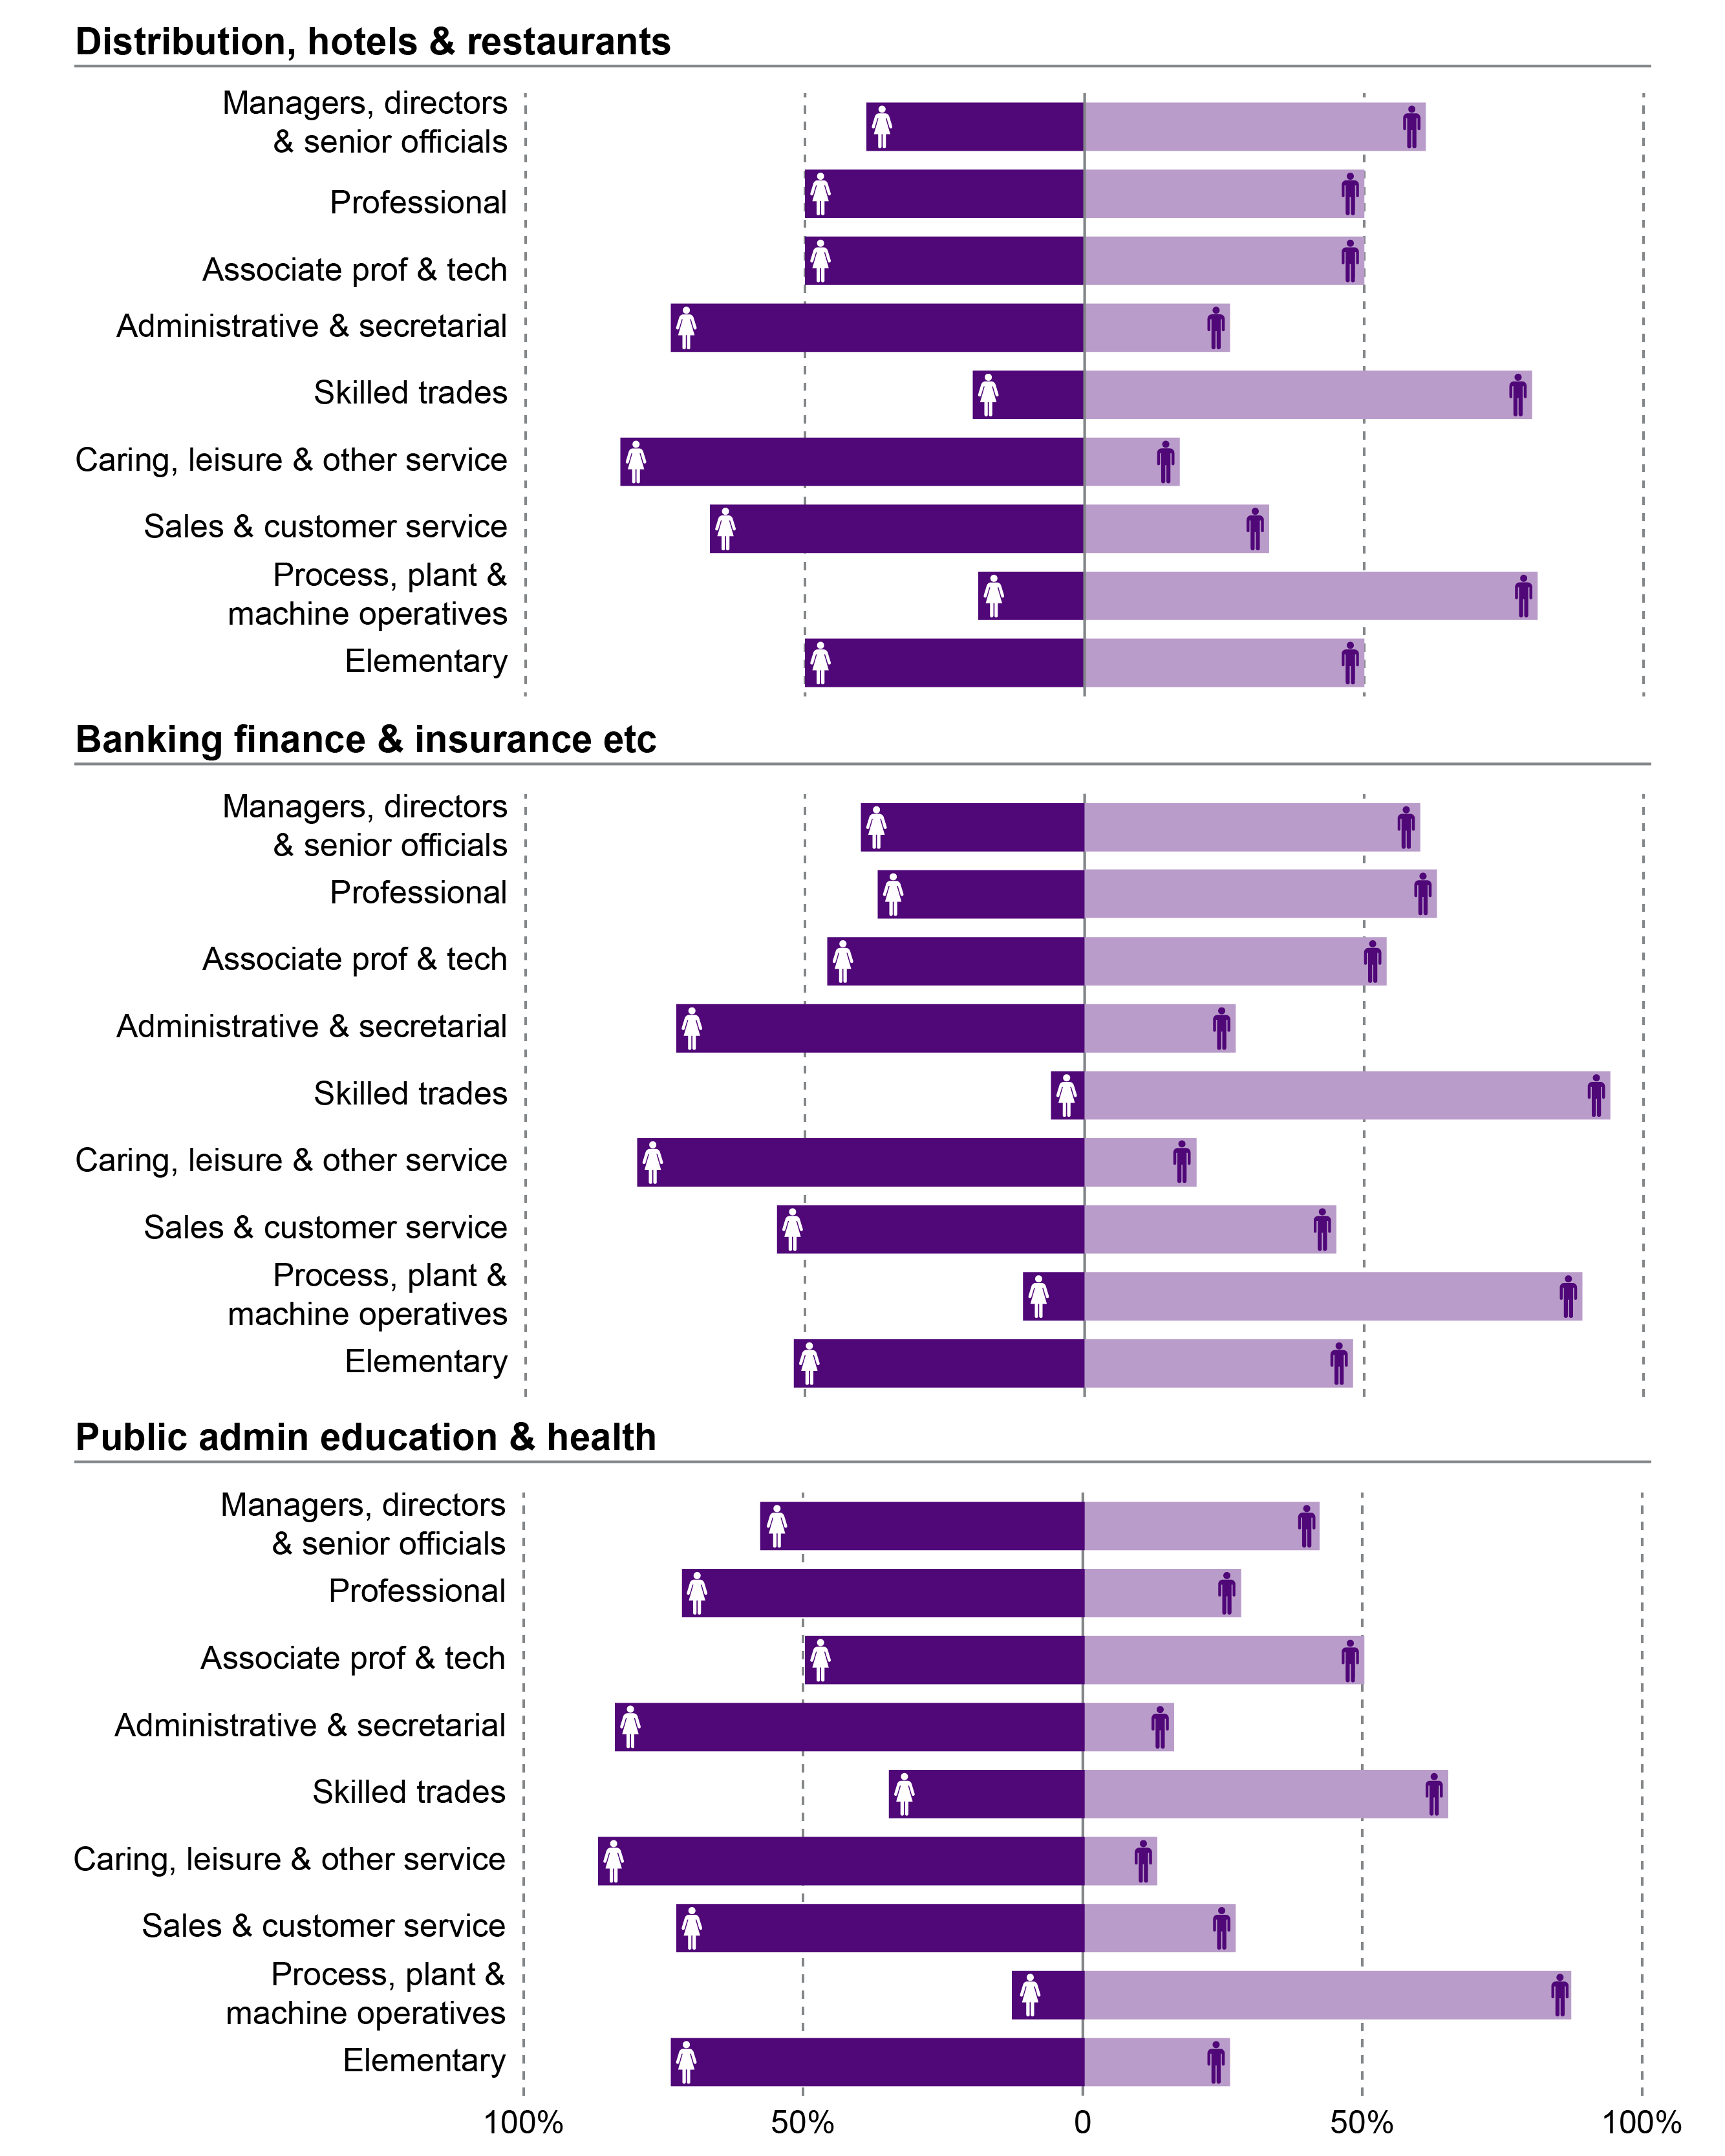
When looking at the gender pay gap by industry it is important to understand the gender breakdown of the occupations within the industries. Figure 15 shows the gender breakdown of the occupations within the broad industries: "Distribution, hotels & restaurants", "Banking, finance & insurance" and "Public admin education & health".
When comparing these industries to the overall Scotland figure it shows that are are some significant deviations, for example:
In "Public admin, education & health" there is a higher proportion of women who are in the "Managers, directors & senior officials" occupation group than men. There is also a significantly higher proportion of women working in "skilled trades" and "elementary" occupations than the Scottish average.
In the "Banking finance & insurance" industry, there is a higher proportion of men in "professional" occupations than women, which is the opposite to the Scottish average.
In the "Banking finance & insurance" industry also has a higher than average proportion of men working in "Sales & customer service" occupations.
Figure 15: gender breakdown of major occupation groups by selected industries in Scotland - Jul 2017-Jun 2018
When looking at pay for all employees by industry in figure 16, it shows that median pay for men is higher than for women in all industries. "Finance and Insurance" has the highest pay for men while "Utilities" has the highest pay for women. "Accommodation and food services" have the lowest pay for both men and women with median pay below the real living wage. Wages for women in the "Wholesale and retail" industry also is below the real living wage.
Figure 16: pay by industry and gender in Scotland - 2018
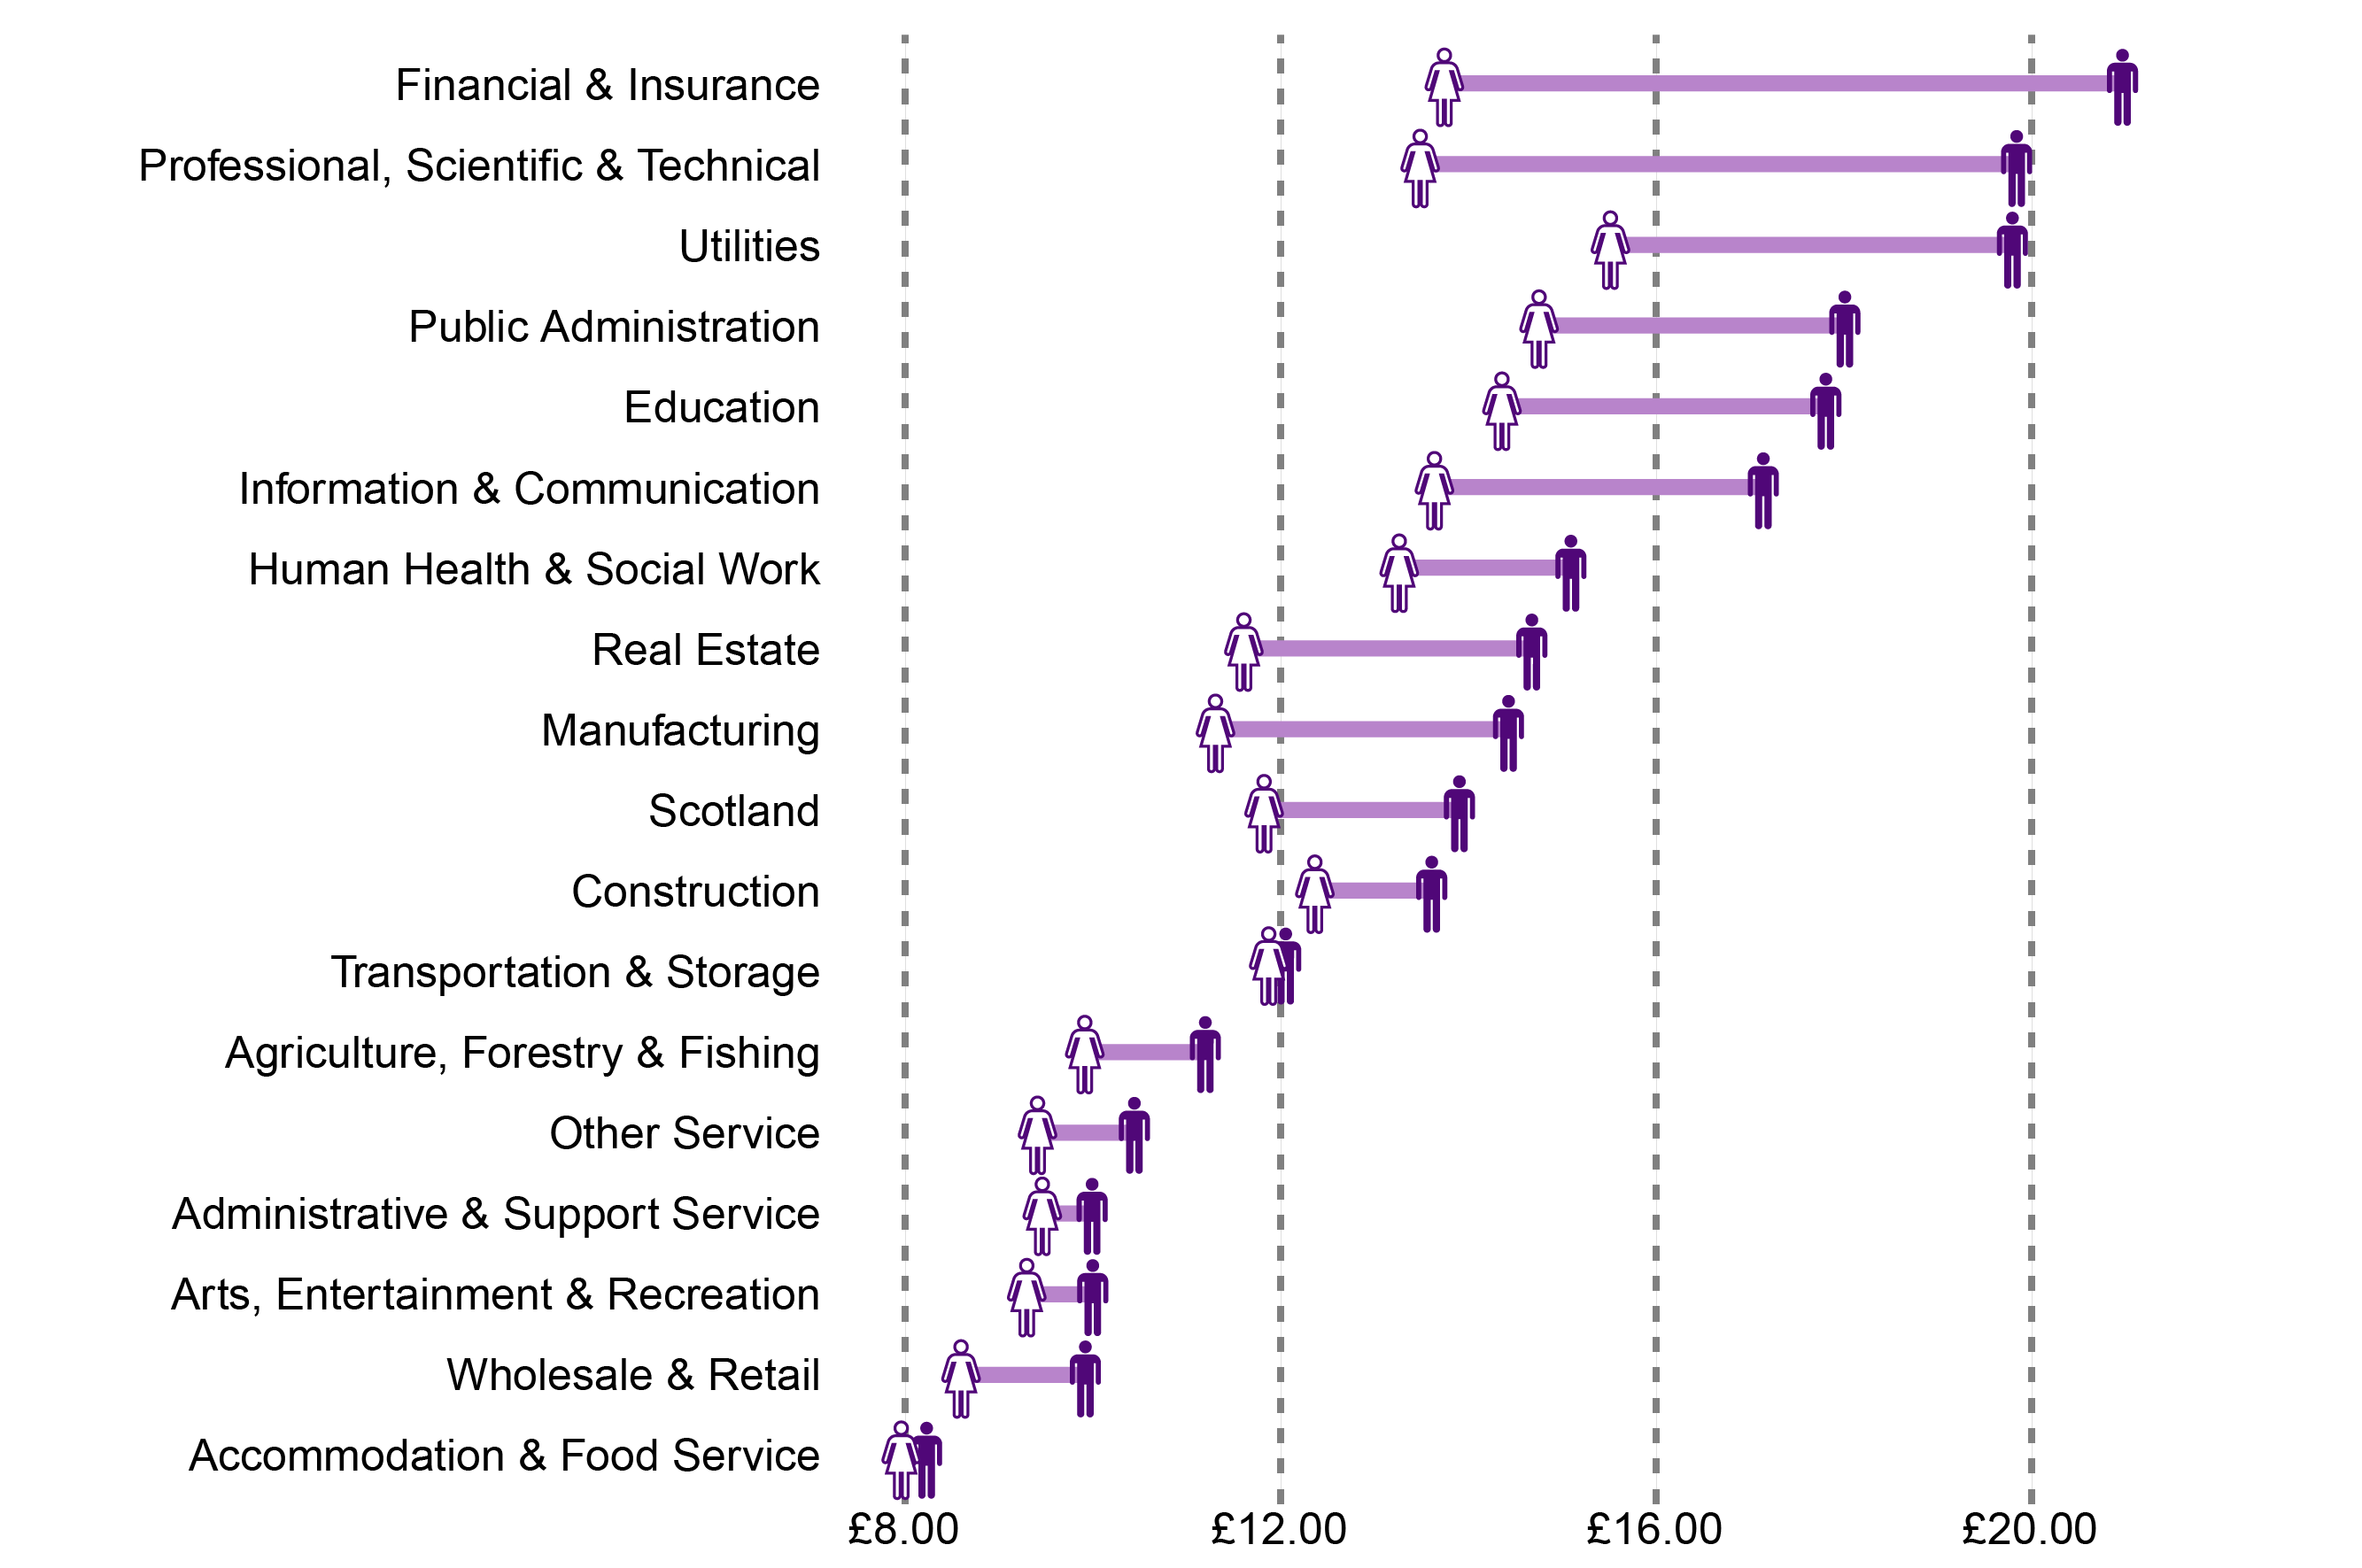
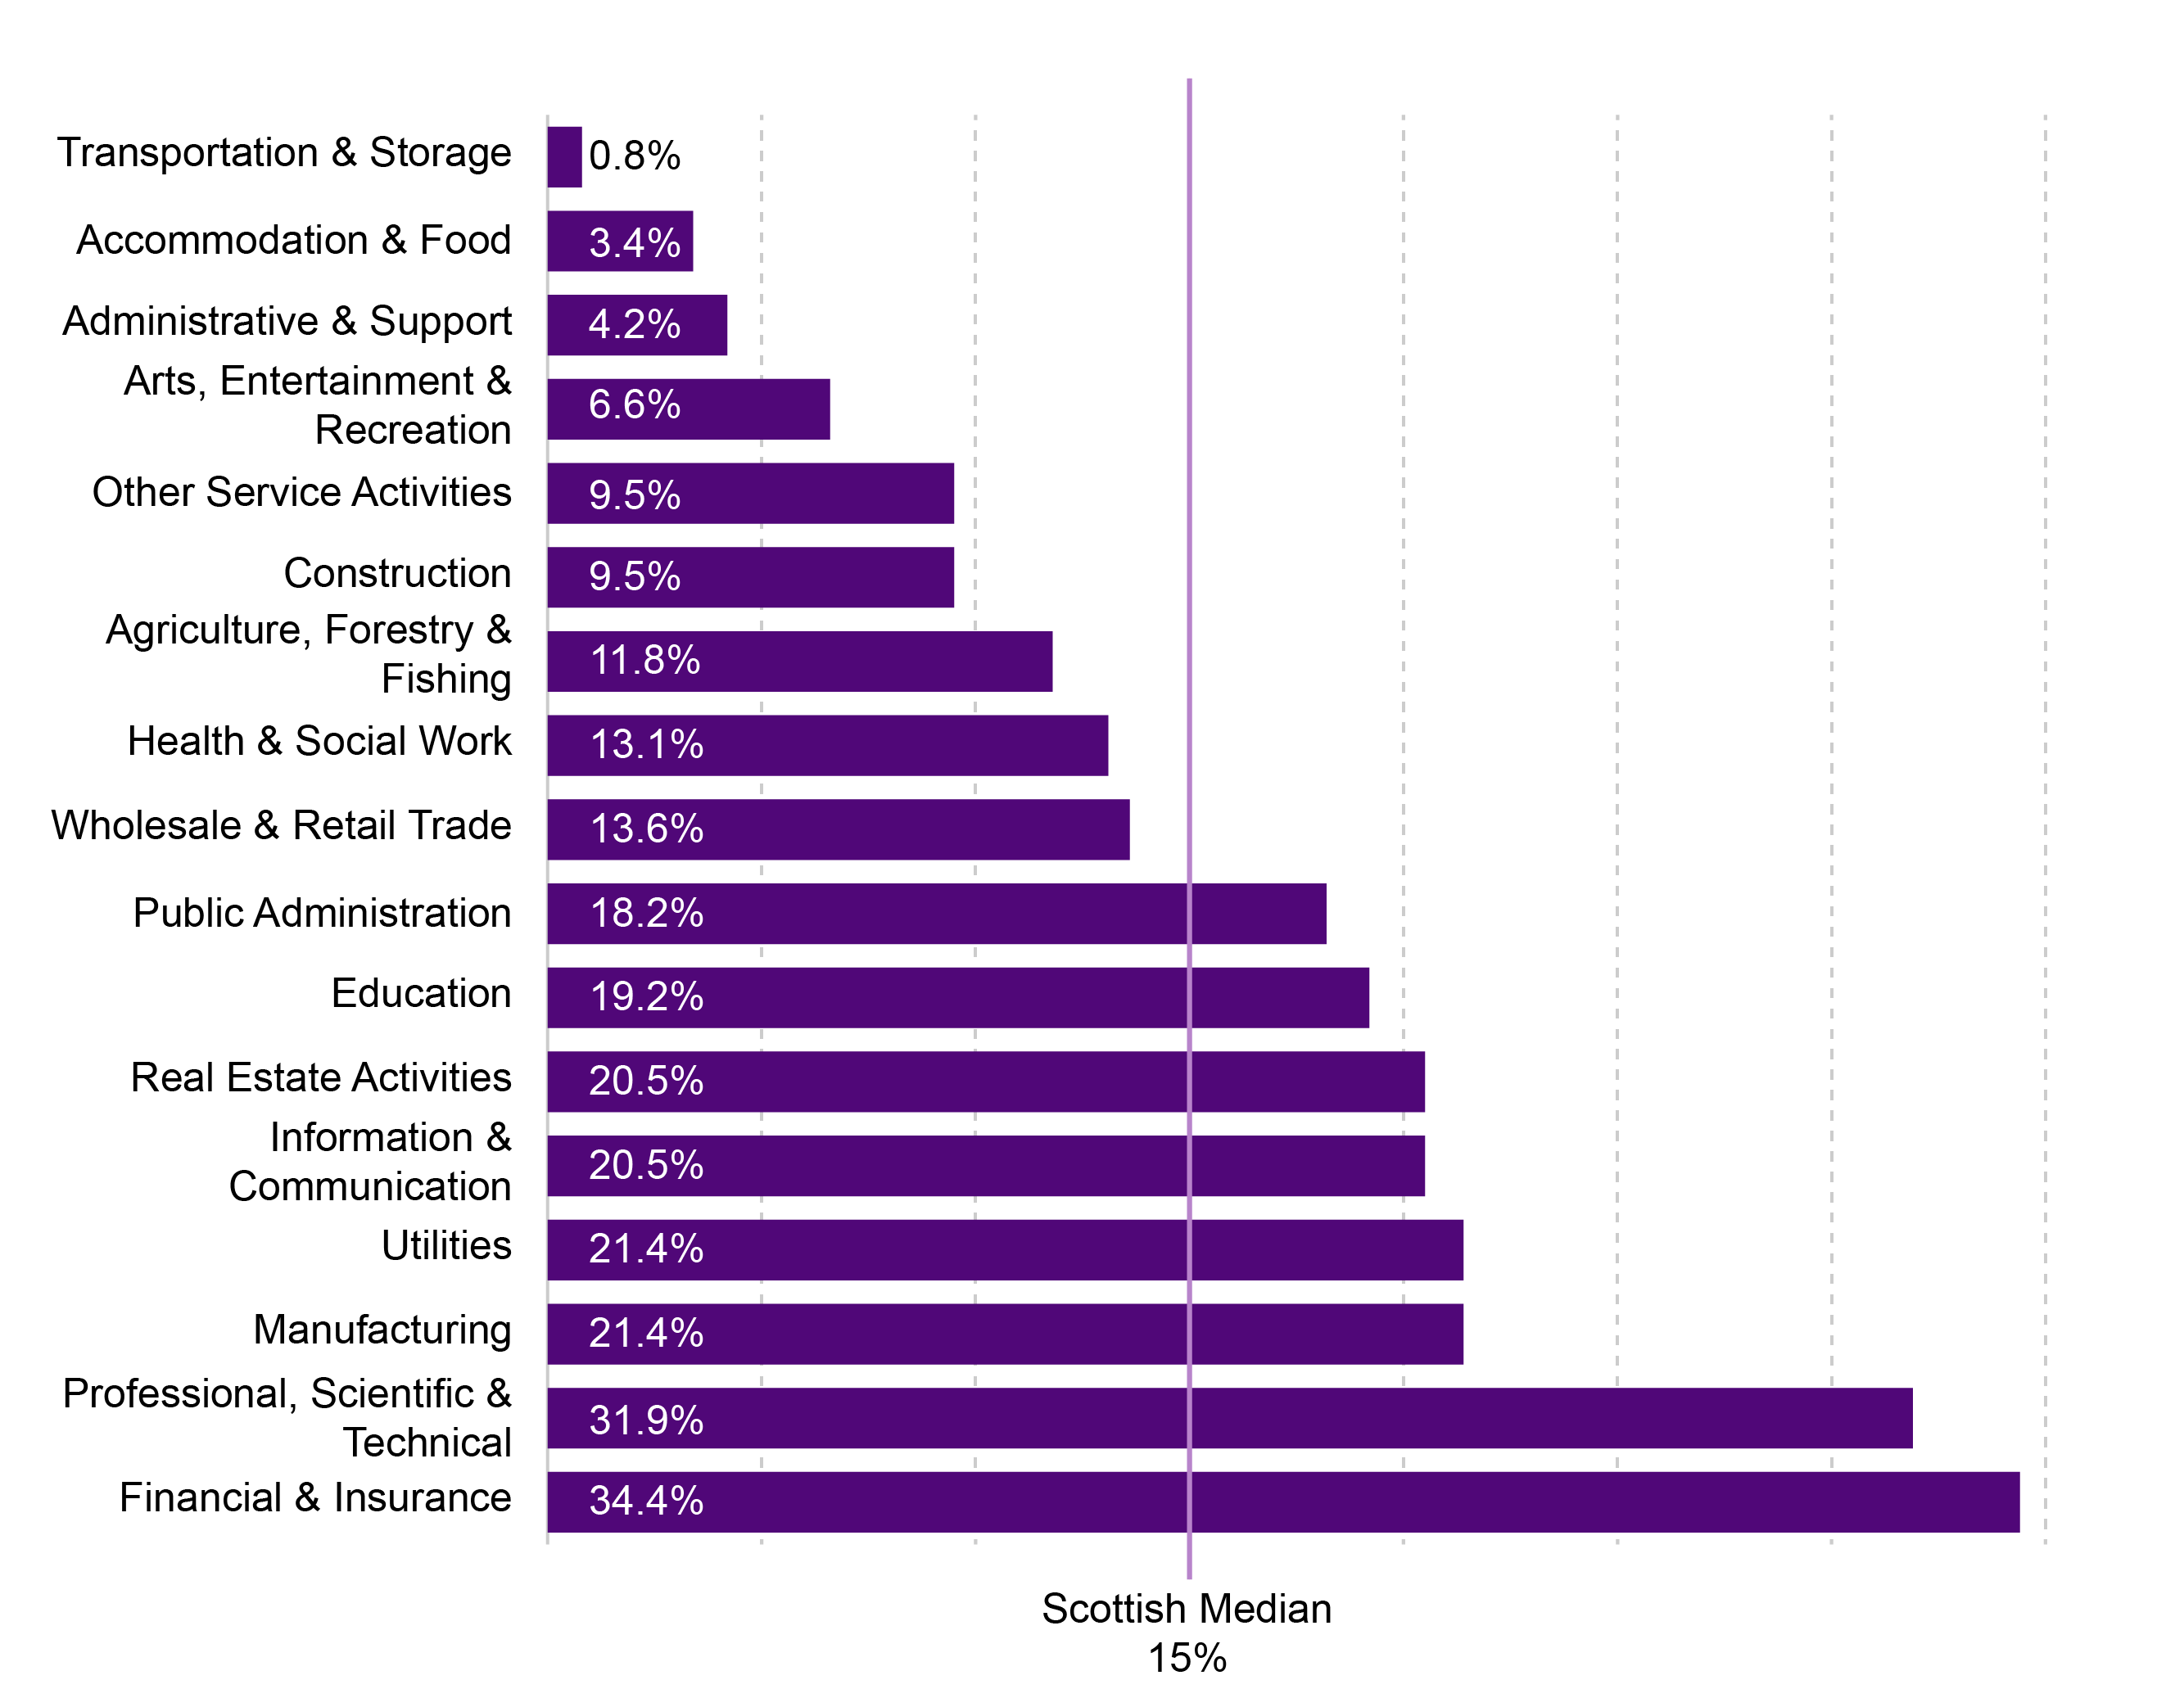
The industry in Scotland with the highest gender pay gap for all employees in 2018 was "Finance and insurance activities". "Transportation & Storage " had the lowest gap. "Accommodation and food" services had the second lowest gender pay gap, but is the lowest paid industry for both genders, with each having median pay below the real living wage at the time of the survey as shown in figure 17.
Figure 17: Median gender pay gap by industry - 2018
What is the pay gap for the public and private sectors?
Comparing public and private sector pay is a complex issue, due to the different jobs and characteristics of the people within each sector1. One of the key points to consider when comparing pay by gender between the public and private sectors is occupational differences. The public sector has a higher proportion of high skilled jobs than the private sector2. Another issue to consider is that the public sector has a higher proportion of people working in large organisations (those with at least 500 employees) which tend to pay higher wages.
Workers in the public sector have a higher median income than the private sector. While men are more likely to be working in the higher paid professional jobs in the private sector, for example Science, Technology, Engineering and Maths (STEM) occupations, women are more likely to be found in low paid jobs, such as cleaning and catering. However, there is a higher proportion of women working in professional jobs in the public sector, such as nursing and teaching.
Figure 18: comparison of the median gender pay gap by sector between Scotland and the UK - 2018
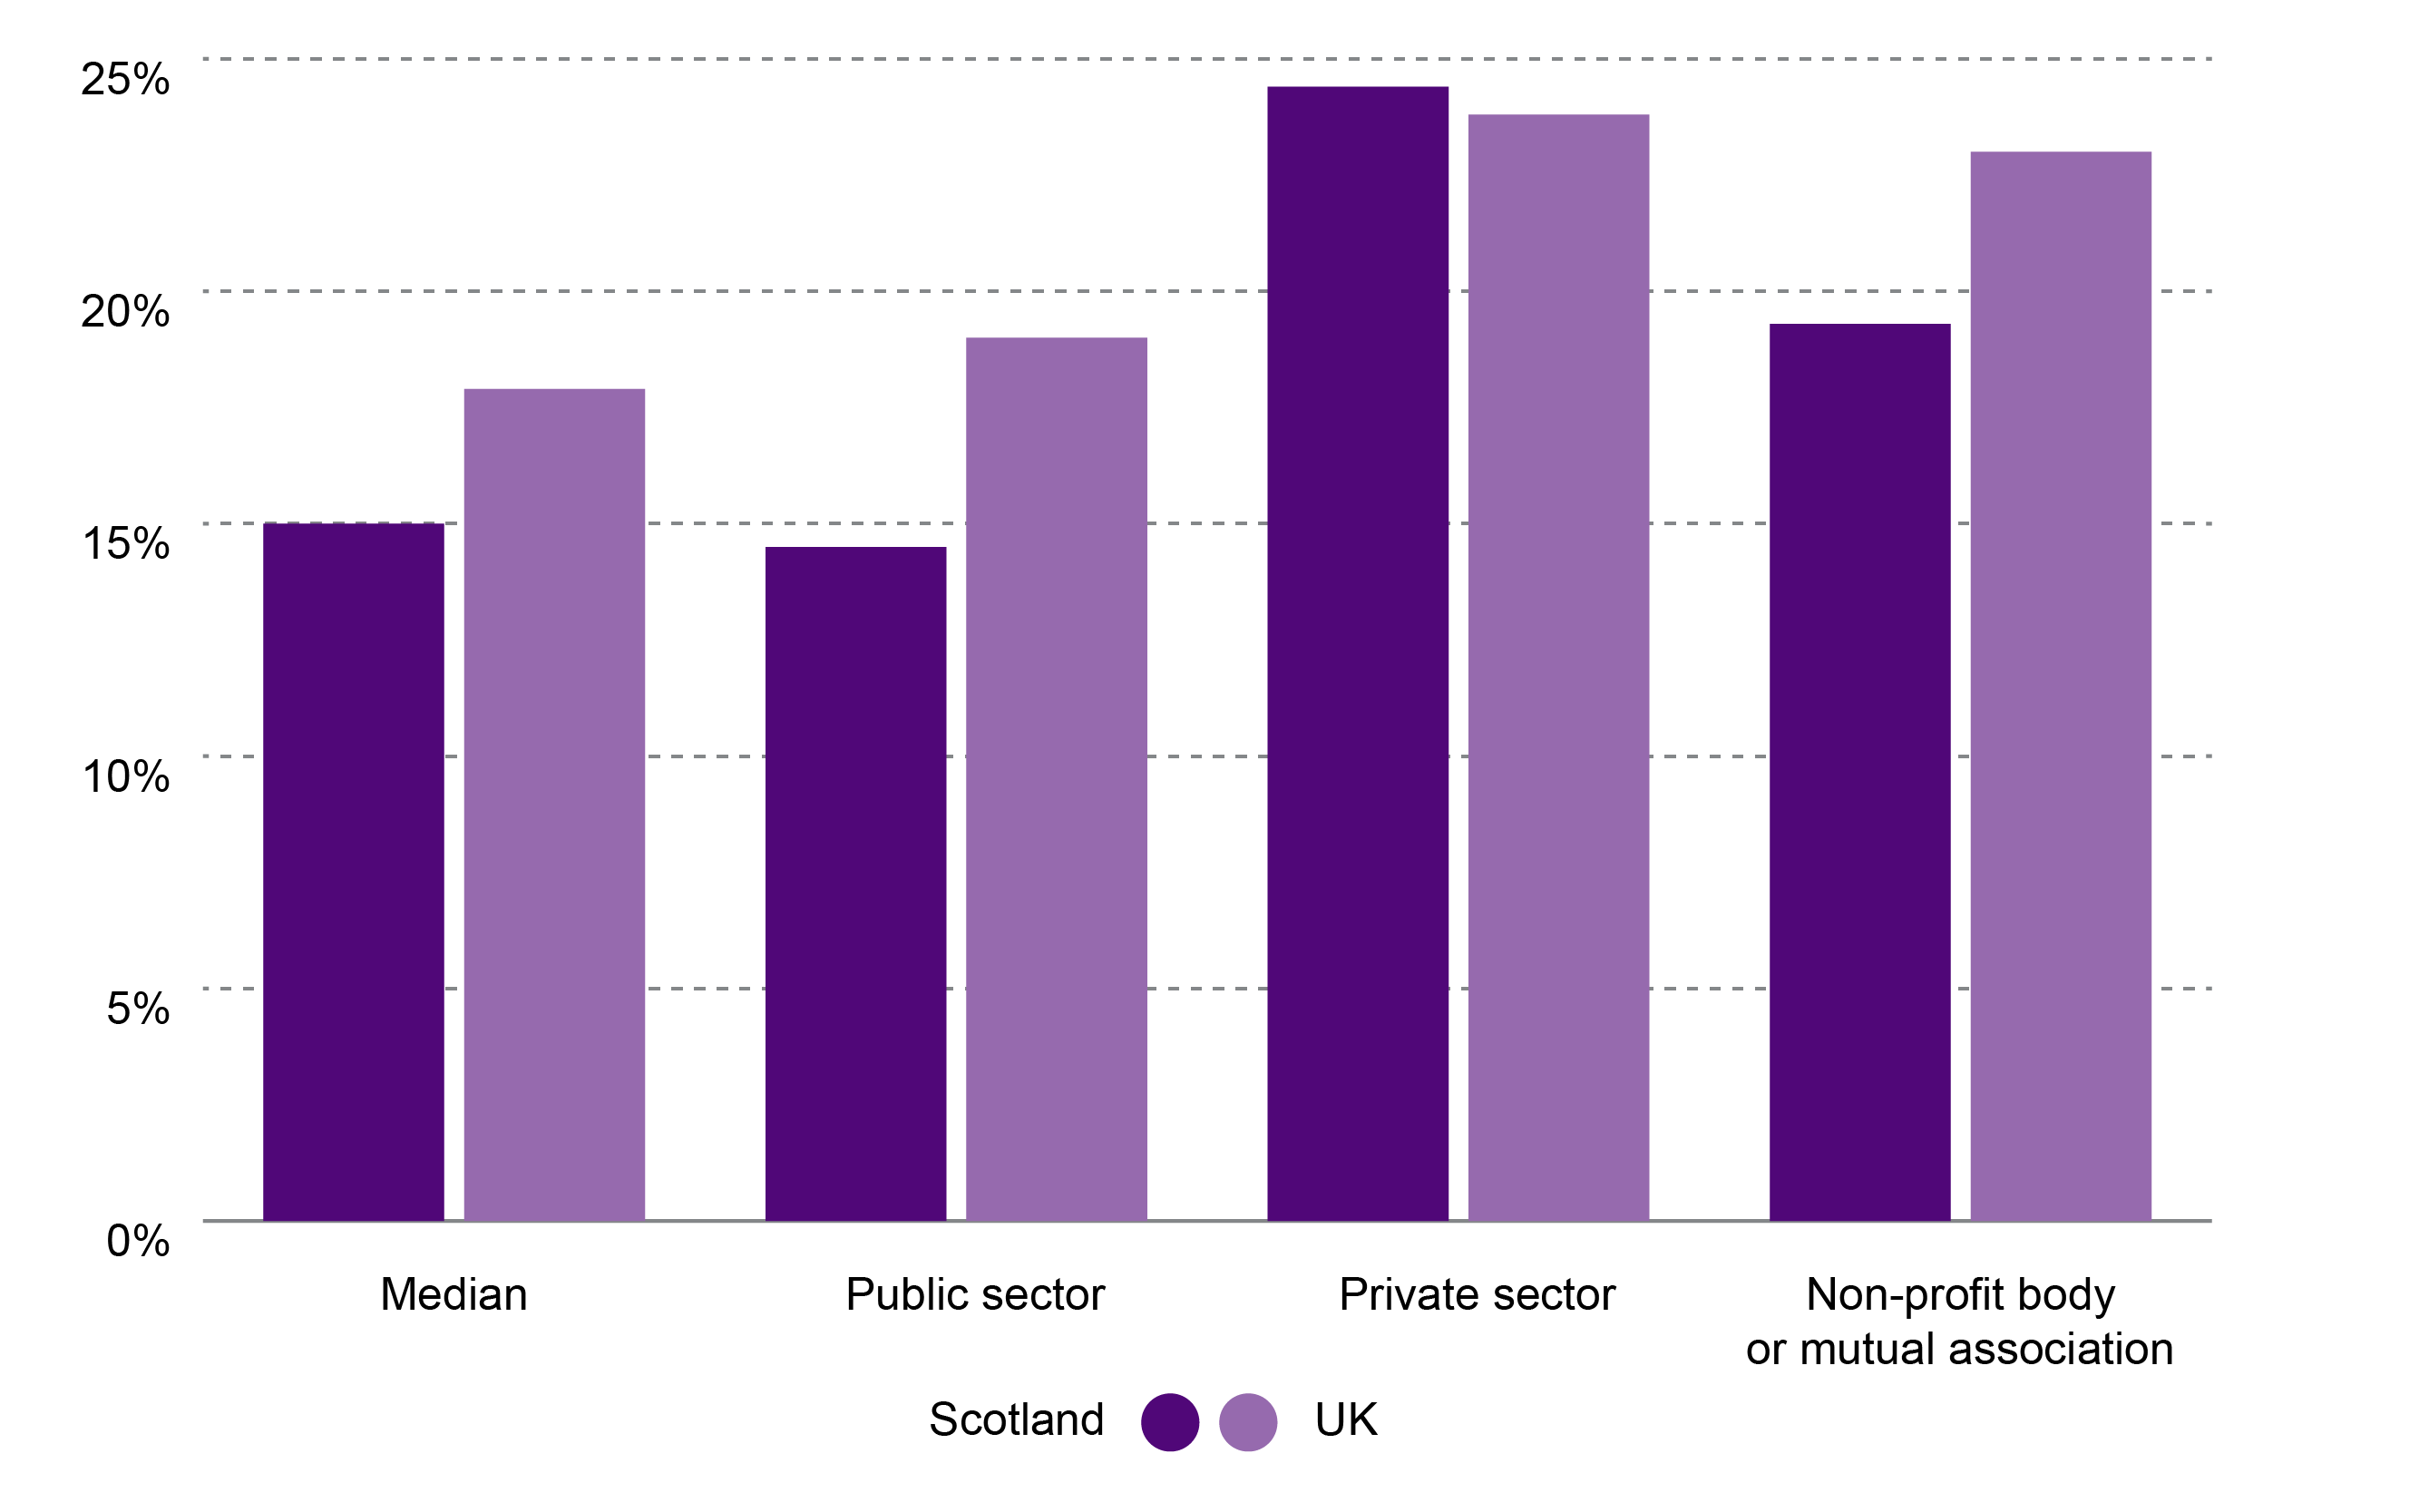
Table 3 show the pay for men and women by sector and the resultant gender pay gap.
| Men | Women | pay gap | |
|---|---|---|---|
| Scotland | 13.90 | 11.81 | 15.0% |
| Public sector | 17.36 | 14.85 | 14.5% |
| Private sector | 12.81 | 9.69 | 24.4% |
| Non-profit body or mutual association | 14.53 | 11.72 | 19.3% |
What is the pay gap by age?
When looking at the gender pay gap by age the main point to consider is the ‘motherhood pay penalty’1. This refers to the period where women tend to either take time out of work or switch to part-time employment due to care commitments, for children and/or elderly relatives. This results in a fall in women's full-time earnings.
A report from the ONS suggests that full-time earnings for women stops growing by age 45 while men's stops at age 48. By the time women's wages have stopped growing they have increased by 50% from age 16, while men's will have grown by 66% by the time their wages stop growing2.
This section compares hourly pay excluding overtime for all employees as women are more likely to work part-time. This is especially true when breaking down pay by ages. Figure 18 shows the breakdown of those working part-time and full-time by age and gender.
The 22 to 29 age group has the highest proportion of women working full-time.
Between the 22 to 29 and 30 to 39 age groups there is a large increase in the proportion of woman working part-time.
The 18-21 age group has the highest proportion of men working part-time, this is likely because they will be in higher or further education.
For women, the 60+ age group has the highest proportion of individuals working part-time.
Figure 19: Proportion of people in full-time and part-time employment by gender and age in Scotland 2017
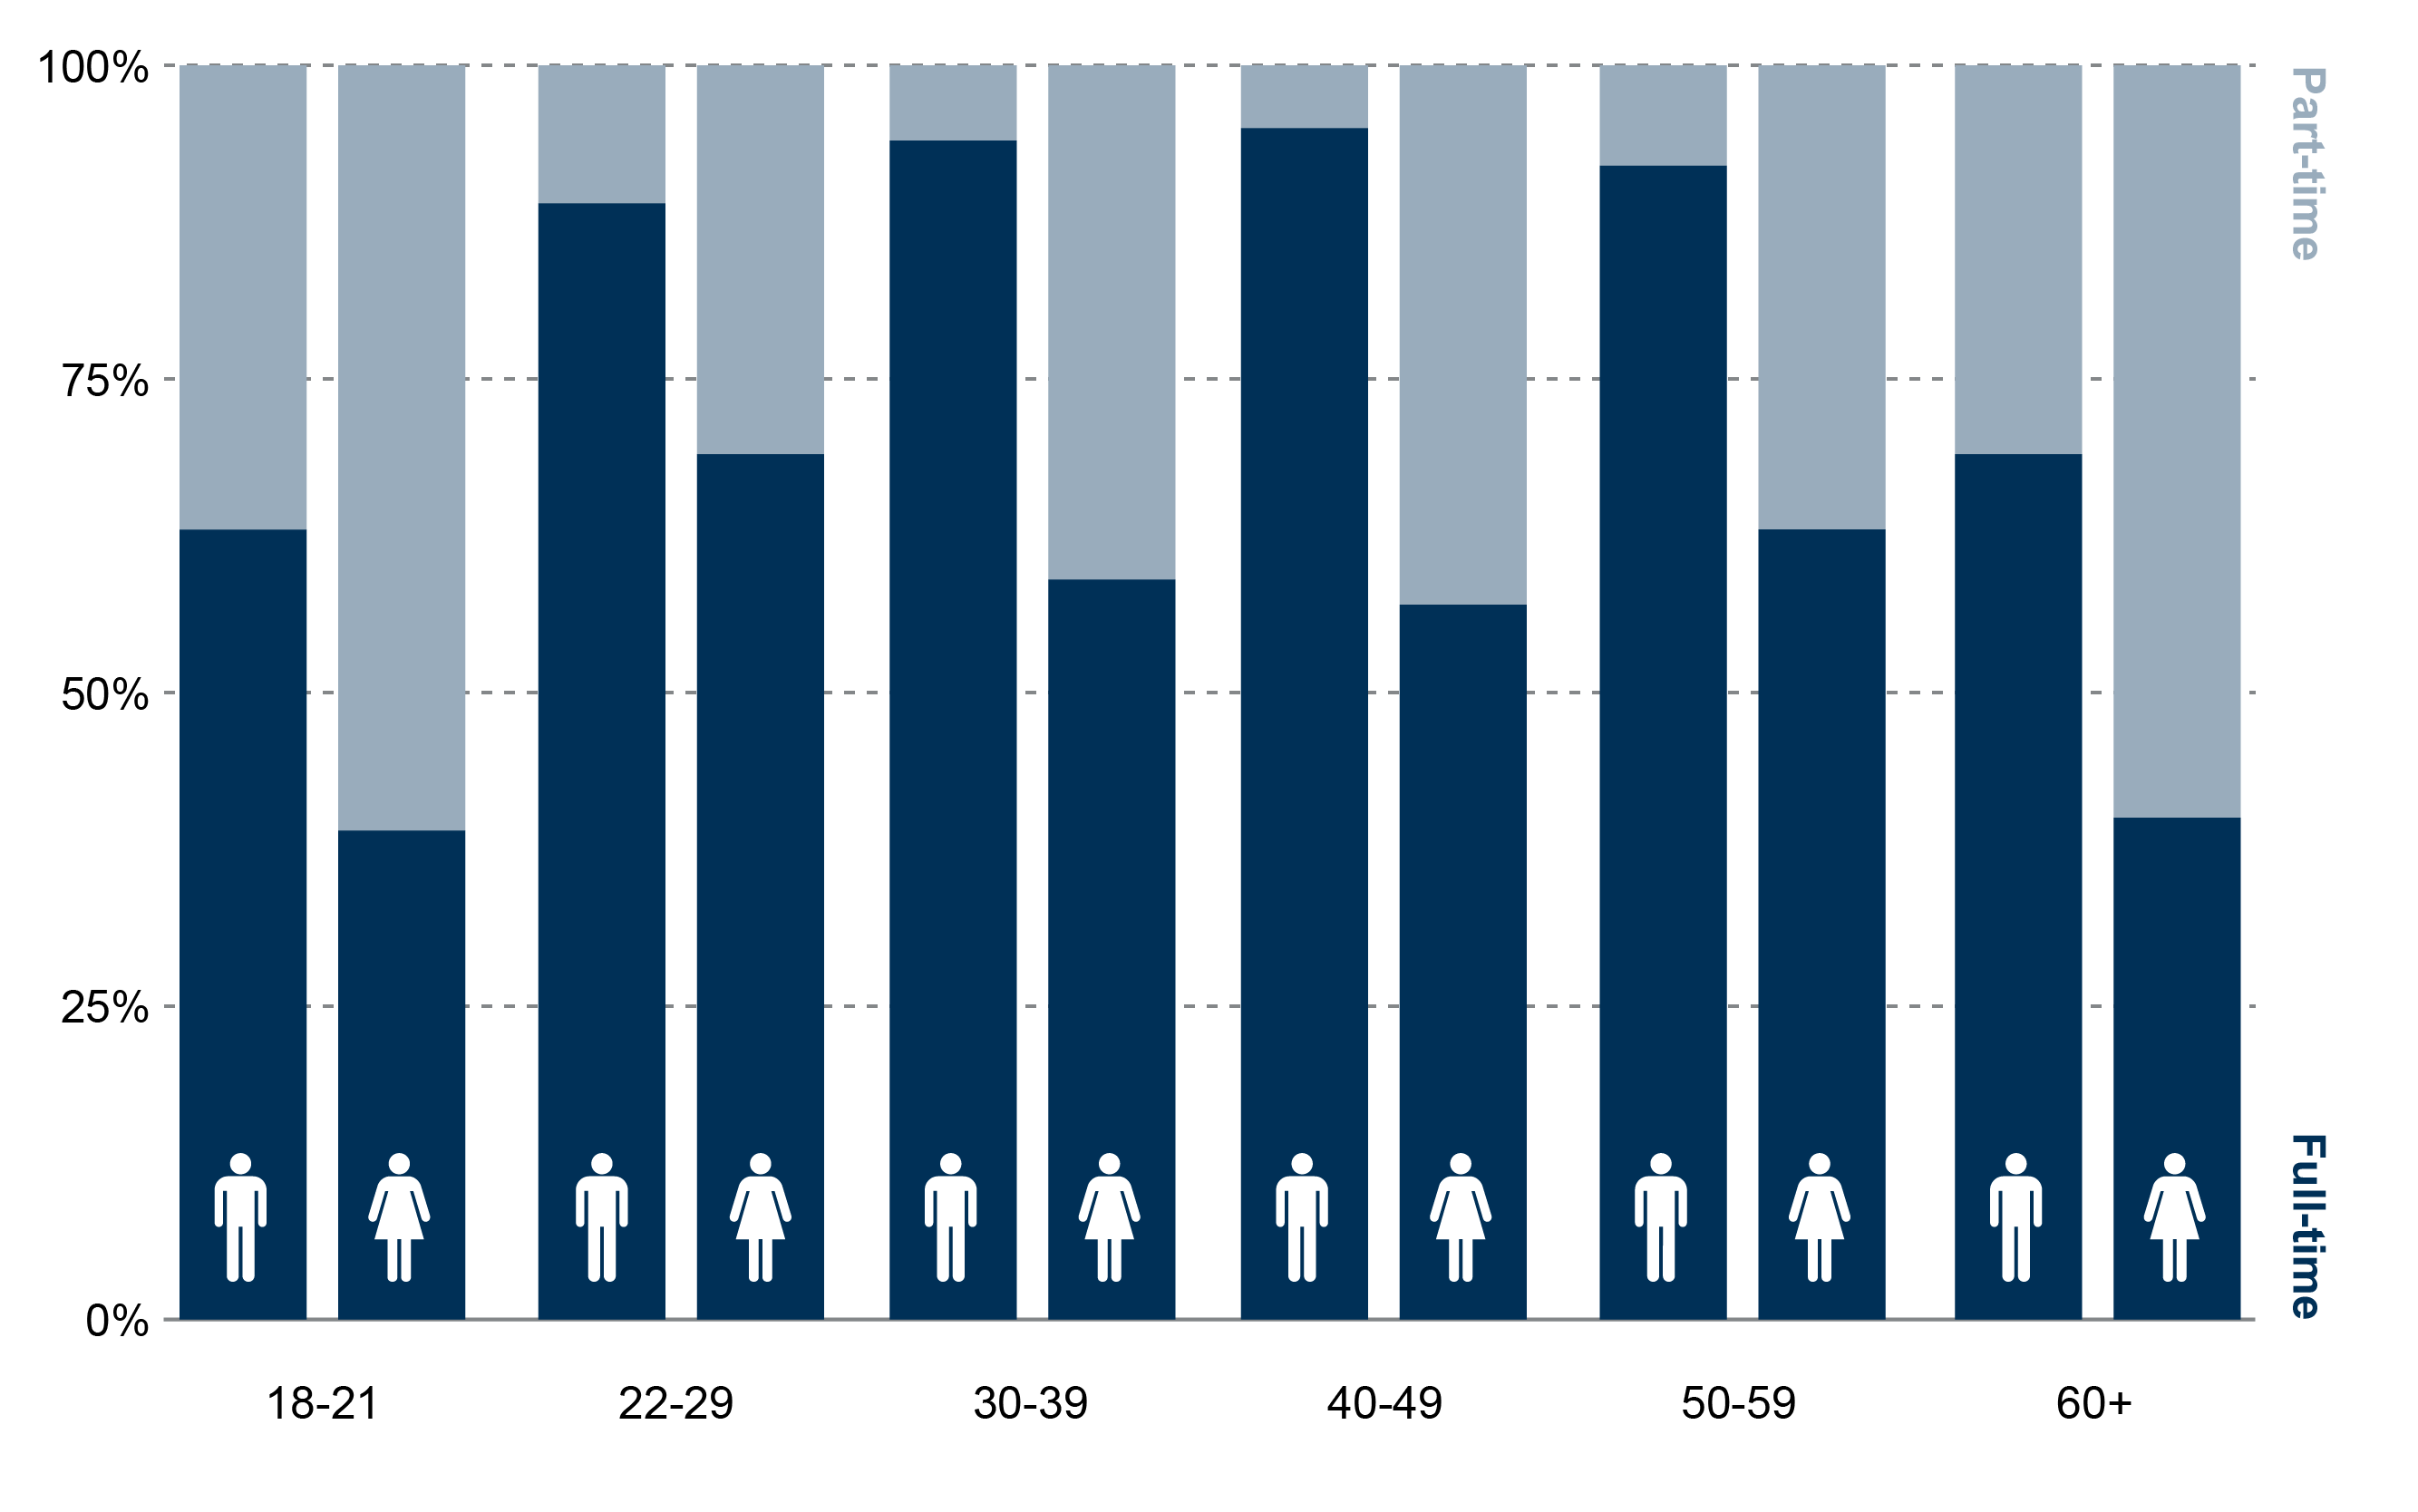
SPICe analysis of the Annual Population Survey
When looking at the pay for all employees by age, the age groups below 30 earn lower than the Scottish median. At no age group do women earn more than men.
Figure 20: pay by age and gender in Scotland - 2018
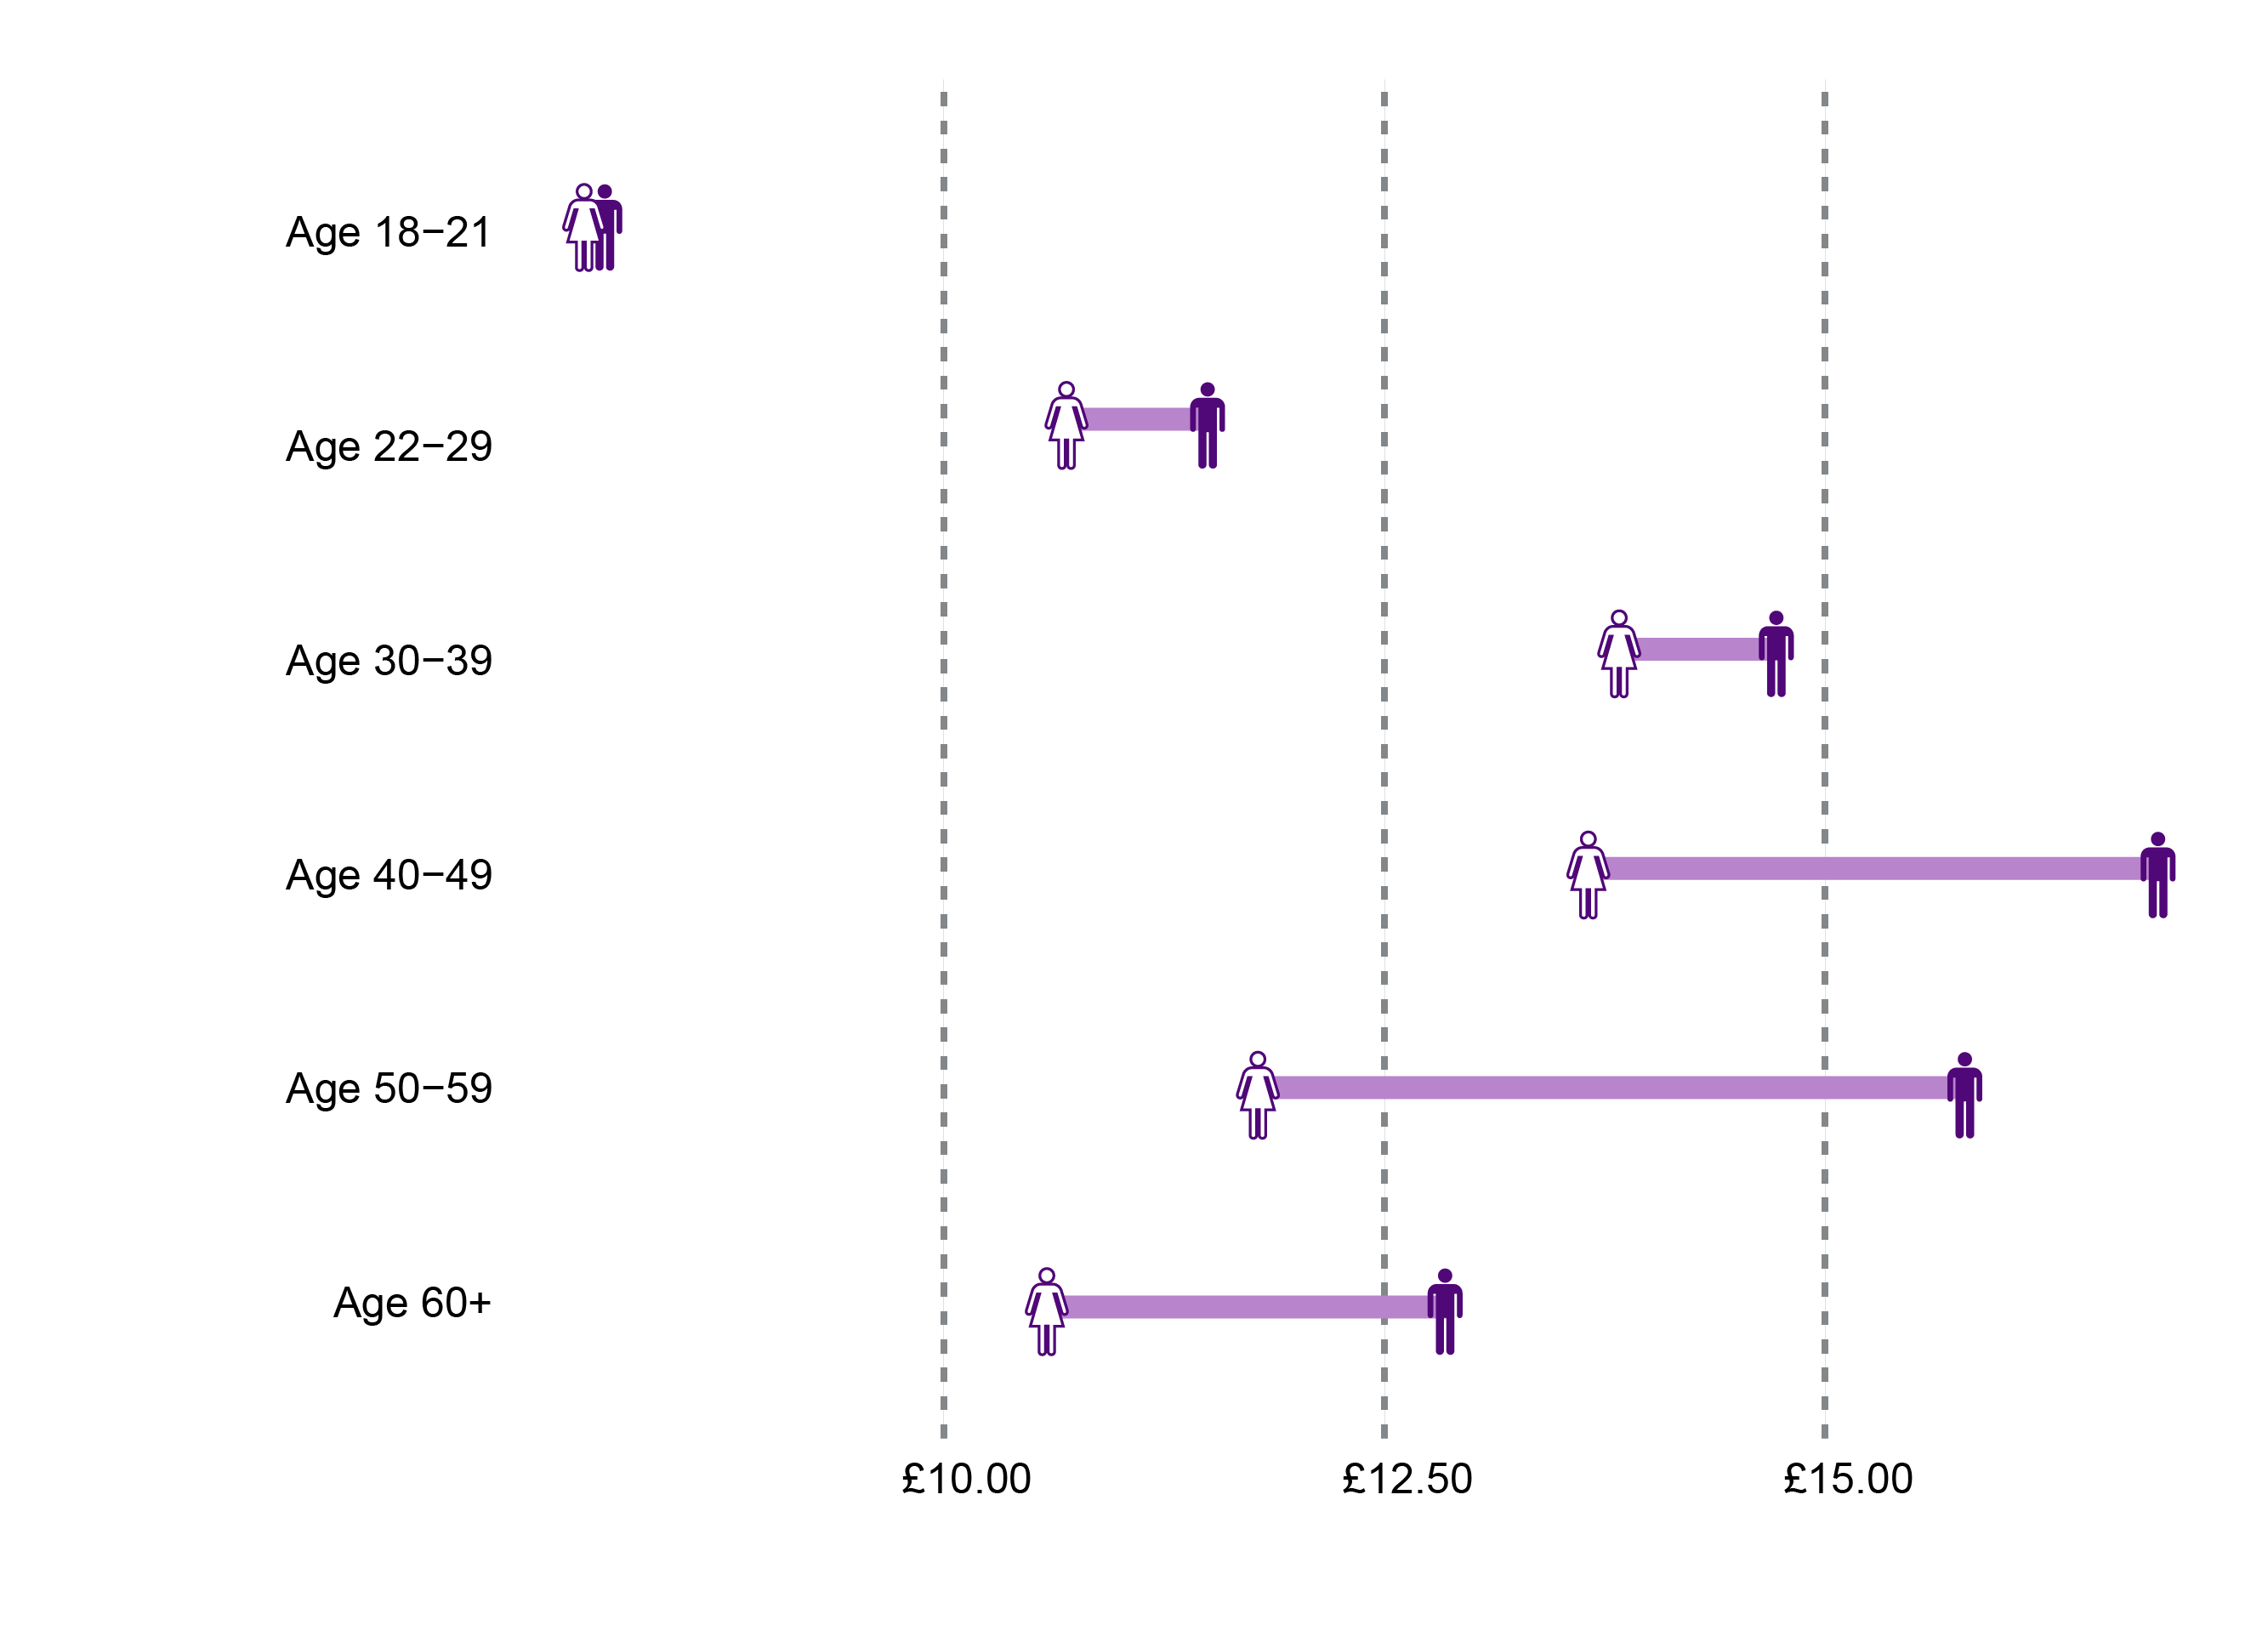
| Women | Men | |
|---|---|---|
| Scotland | 11.81 | 13.90 |
| Age 18-21 | 7.96 | 8.02 |
| Age 22-29 | 10.73 | 11.50 |
| Age 30-39 | 13.85 | 14.73 |
| Age 40-49 | 13.67 | 16.91 |
| Age 50-59 | 11.81 | 15.81 |
| Age 60+ | 10.60 | 12.87 |
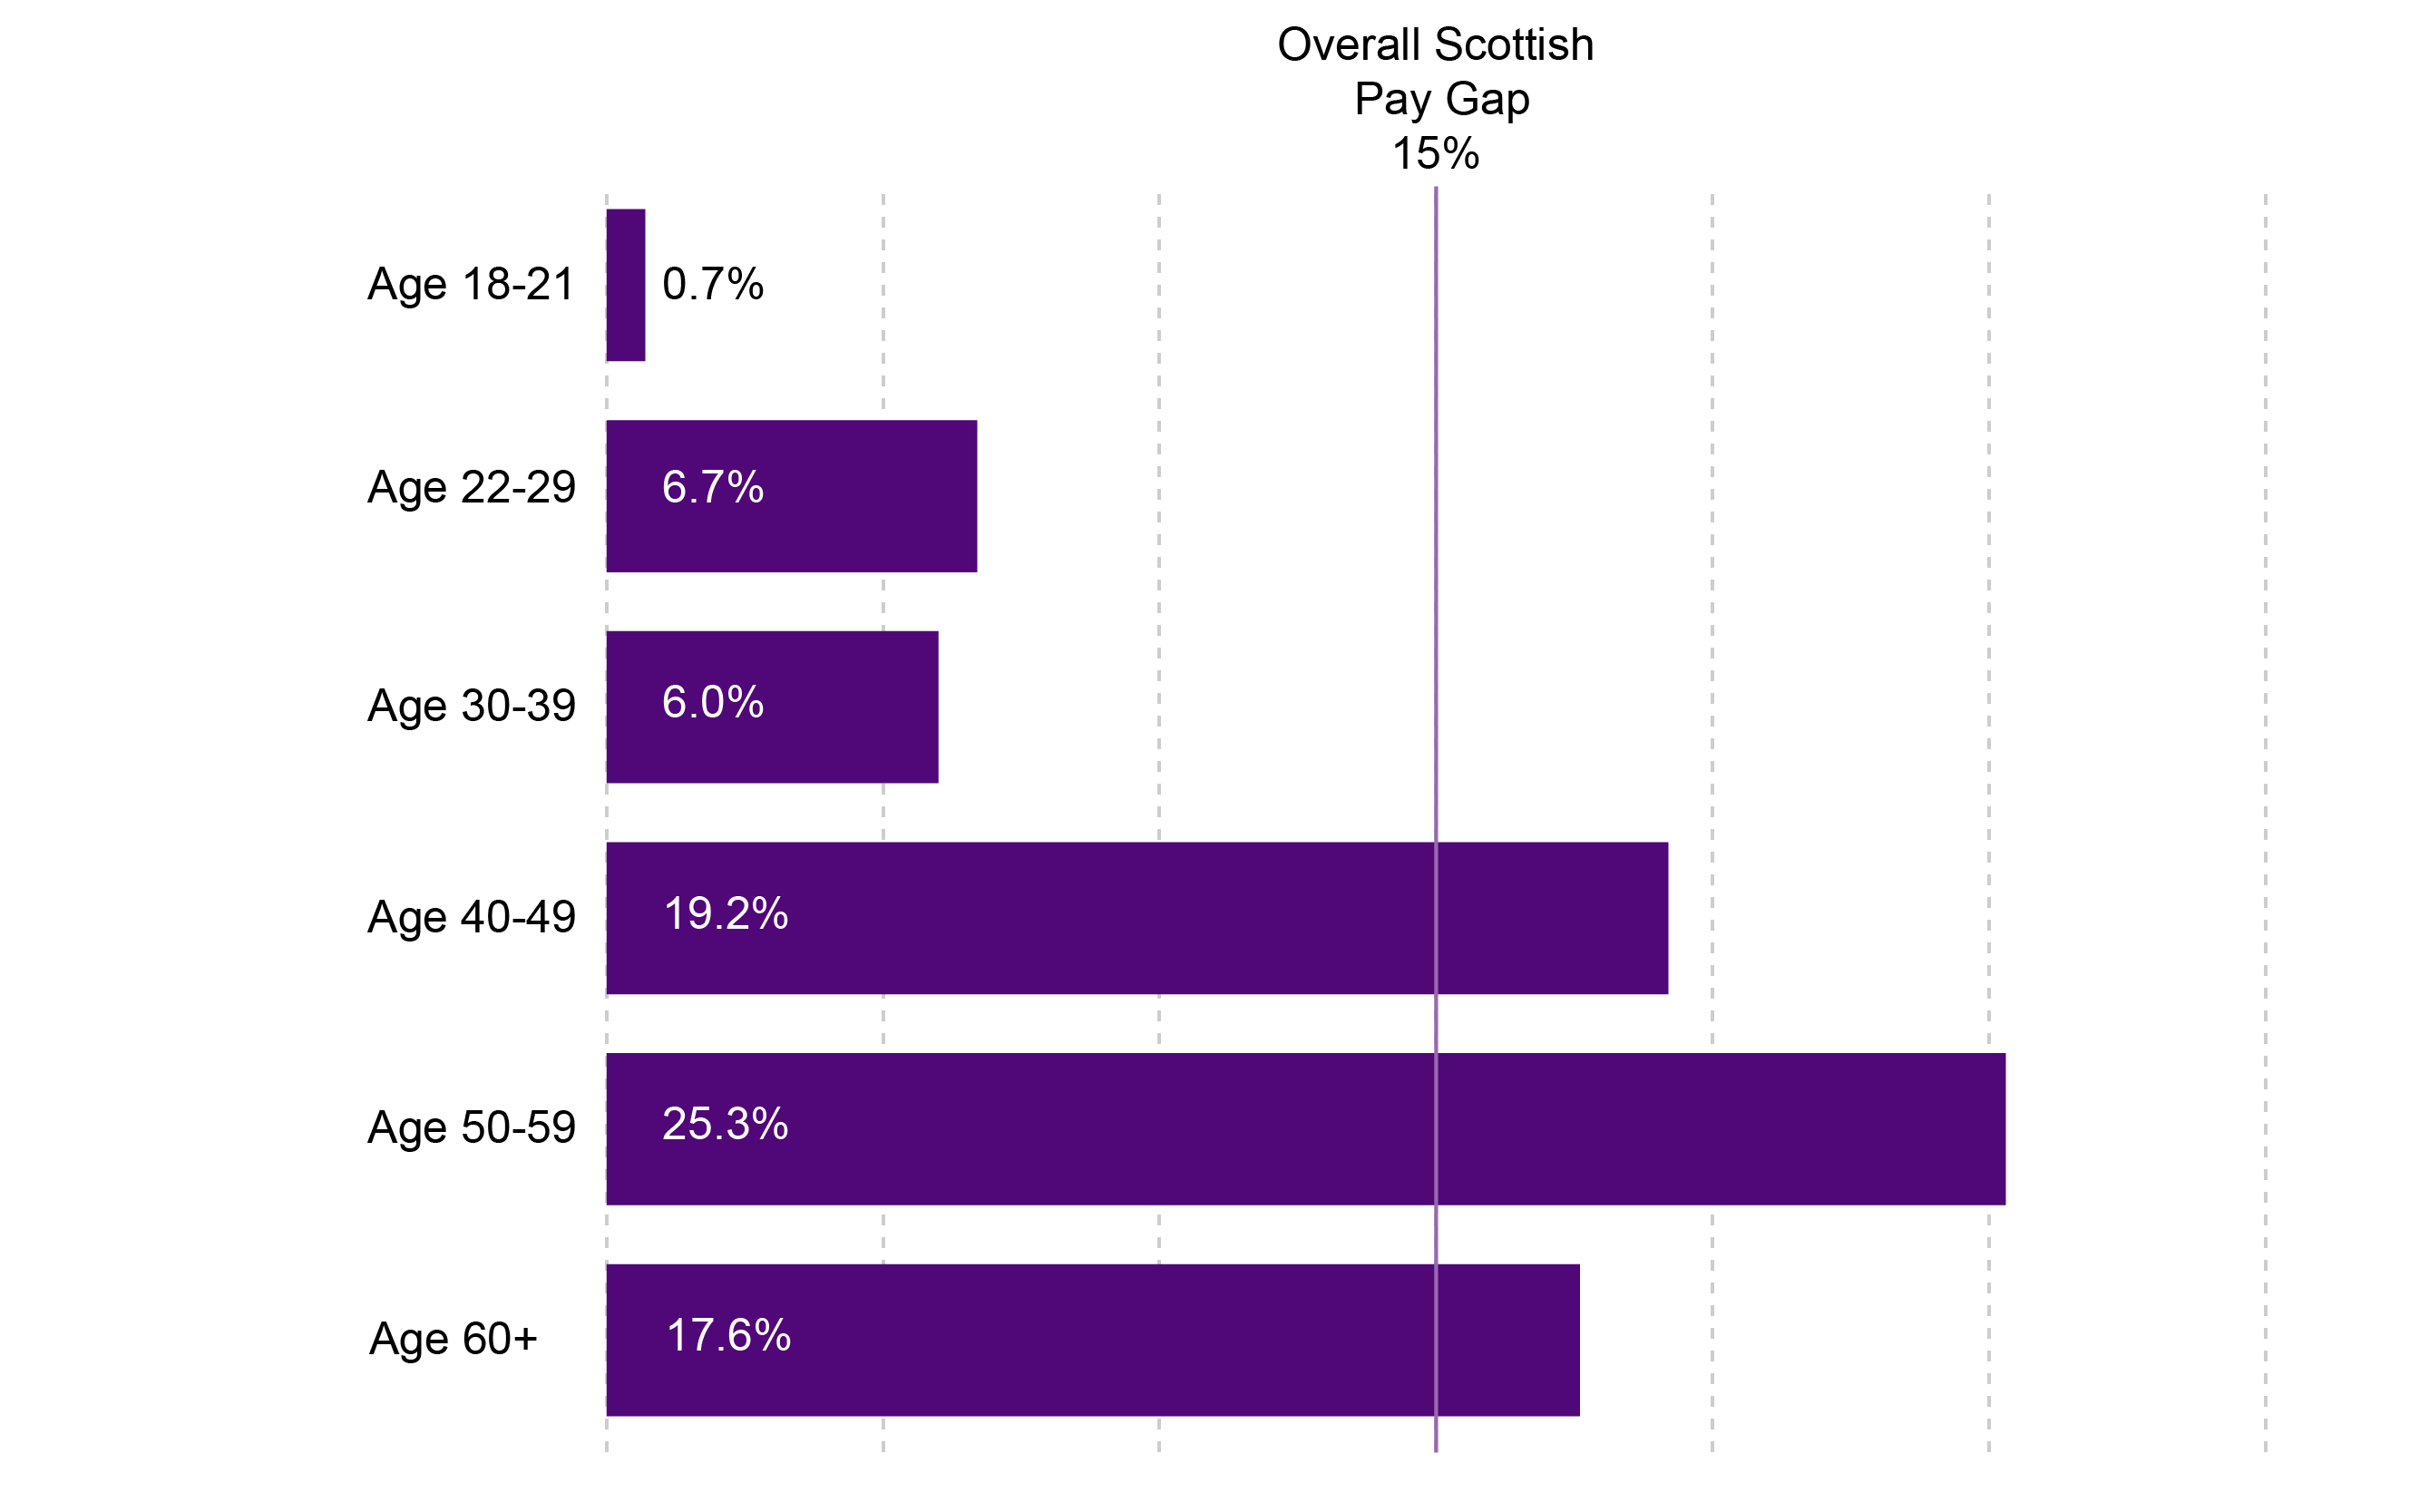
Apart from the 18-21 year old age group, the 30-39 age group has the lowest gender pay gap at 6.0%. The pay gap then increases to 19.2% for 40-49 year olds then increases to 25.3% for 50-59 year olds. This is most likely because women are more likely to take on caring responsibilities, for children or elderly relatives.
Figure 21: Median gender pay gap by age in Scotland - 2018
How do the latest figures affect the National Indicator on the gender pay gap?
The National Performance Framework is the Scottish Government's tool for reporting on how the country is performing. It does this by measuring performance against a number of National Indicators. One of the Indicators in Scotland Performs is:
The Government specifies that
a decrease of 1.5 percentage points or more suggests that the position is improving
an increase of 1.5 percentage points or more suggests the position is worsening.
As there was a decrease of 0.9 percentage points between 2017 and 2018 this indicator is maintaining performance.
This indicator focuses on full-time pay. However, in the their report on the gender pay gap No Small Change: The Economic Potential of Closing the Gender Pay Gap the Economy, Fair Work and Jobs committee recommended:
That the Scottish Government changes the way it measures and reports the gender pay gap in its National Performance Framework (NPF), to take into account part-time workers in Scotland.
The Government responded to the recommendation as follows
The measure chosen matches the headline measure used by the Scottish Government, and the measure used by the Office for National Statistics for the UK and so allows comparison and provides consistency. However, additional information will be provided on Scotland Performs to show the position for part-time workers
The Scottish Government now publishes data on the pay gap for all employees alongside the data on the full-time pay gap.
Sources
Office for National Statistics. (2018, October 25). Earnings and hours worked in the UK: 2018. Retrieved from <a href="https://www.ons.gov.uk/releases/analysesbasedonannualsurveyofhoursandearningsprovisional2018andrevised2017" target="_blank">https://www.ons.gov.uk/releases/analysesbasedonannualsurveyofhoursandearningsprovisional2018andrevised2017</a> [accessed 25 January 2019]
Fawcett Society. (n.d.) What is the Gender Pay Gap?. Retrieved from <a href="https://www.fawcettsociety.org.uk/close-gender-pay-gap" target="_blank">https://www.fawcettsociety.org.uk/close-gender-pay-gap</a> [accessed 15 February 2018]
Scottish Government. (2016, June). New Perspectives on the Gender Pay Gap: Trends and Drivers. Retrieved from <a href="http://www.gov.scot/Resource/0050/00502056.pdf" target="_blank">http://www.gov.scot/Resource/0050/00502056.pdf</a> [accessed 20 January 2018]
Office for National Statistics. (2014, November 19). Public and Private Sector Earnings - November 2014. Retrieved from <a href="http://webarchive.nationalarchives.gov.uk/20160107090910/http://www.ons.gov.uk/ons/dcp171776_383355.pdf" target="_blank">http://webarchive.nationalarchives.gov.uk/20160107090910/http://www.ons.gov.uk/ons/dcp171776_383355.pdf</a> [accessed 8 February 2018]
Office for National Statistics. (2014, November 19). Public and Private Sector Earnings - November 2014. Retrieved from <a href="http://webarchive.nationalarchives.gov.uk/20160107090910/http://www.ons.gov.uk/ons/dcp171776_383355.pdf" target="_blank">http://webarchive.nationalarchives.gov.uk/20160107090910/http://www.ons.gov.uk/ons/dcp171776_383355.pdf</a> [accessed 01 November 2017]
Trades Union Congress. (2016, March). The Motherhood Pay Penalty. Retrieved from <a href="https://www.tuc.org.uk/sites/default/files/MotherhoodPayPenalty.pdf" target="_blank">https://www.tuc.org.uk/sites/default/files/MotherhoodPayPenalty.pdf</a> [accessed 15 February 2018]
Office for National Statistics. (17, January 2018). Understanding the gender pay gap in the UK. Retrieved from <a href="https://www.ons.gov.uk/employmentandlabourmarket/peopleinwork/earningsandworkinghours/articles/understandingthegenderpaygapintheuk/2018-01-17#modelling-the-factors-that-affect-pay" target="_blank">https://www.ons.gov.uk/employmentandlabourmarket/peopleinwork/earningsandworkinghours/articles/understandingthegenderpaygapintheuk/2018-01-17#modelling-the-factors-that-affect-pay</a> [accessed 15 February 2018]