Earnings in Scotland 2019
The Office for National Statistics released the Annual Survey of Hours and Earnings (ASHE) 2019 provisional results on 29 October 2019. This briefing provides an overview of earnings in Scotland.
Executive Summary
About the Annual Survey of Hours and Earnings (ASHE) data
The data in this briefing are ASHE 2019 provisional results1, published by the Office of National Statistics (ONS). The survey provides a range of earnings statistics for employees across the UK. ASHE provides data for hourly, weekly and annual income for all part-time and full-time employees. It does not cover the self-employed. ASHE uses Pay As You Earn (PAYE) data to identify representative sub groups of employers and employees who they then survey to get information on employee hours and earnings. 1
Key points about the data:
Where figures are adjusted for inflation, the Consumer Prices Index including owner occupiers’ housing costs (CPIH) figure has been used (2.0% in the year to April 2019). CPIH is used as it is the most comprehensive measure of UK consumer price inflation, as it includes owner occupiers’ housing costs (OOH) and Council Tax.
Because of the potential for sampling errors for smaller groups, including local areas and small industries, there is a wider margin of error with some of the data than for Scotland as a whole.
Unless otherwise stated, the median estimate has been used rather than the mean, as it provides a better indication of ‘typical’ pay. Median values split the top 50 per cent from the bottom 50 per cent, meaning it is less likely to be skewed by the relatively small number of very high earners.
"Full-time" is defined as employees working 30 paid hours per week or more (or 25 or more for the teaching professions).
Methodological changes in 2004, 2006 and 2011 resulted in discontinuities in the ASHE time series, therefore care should be taken when making comparisons with earlier years.
Unless otherwise stated this briefing looks at the workplace analysis of the ASHE.
What does the typical salary look like in Scotland?
This section looks at annual salaries for all employees in Scotland, both full-time and part-time, compared to the other regions and nations of the UK. The ASHE analysis for annual earnings relates to employees who have been in the same job for more than one year. 1
Figure 1: Gross annual pay for all employees across the nations and regions of the UK - 2019
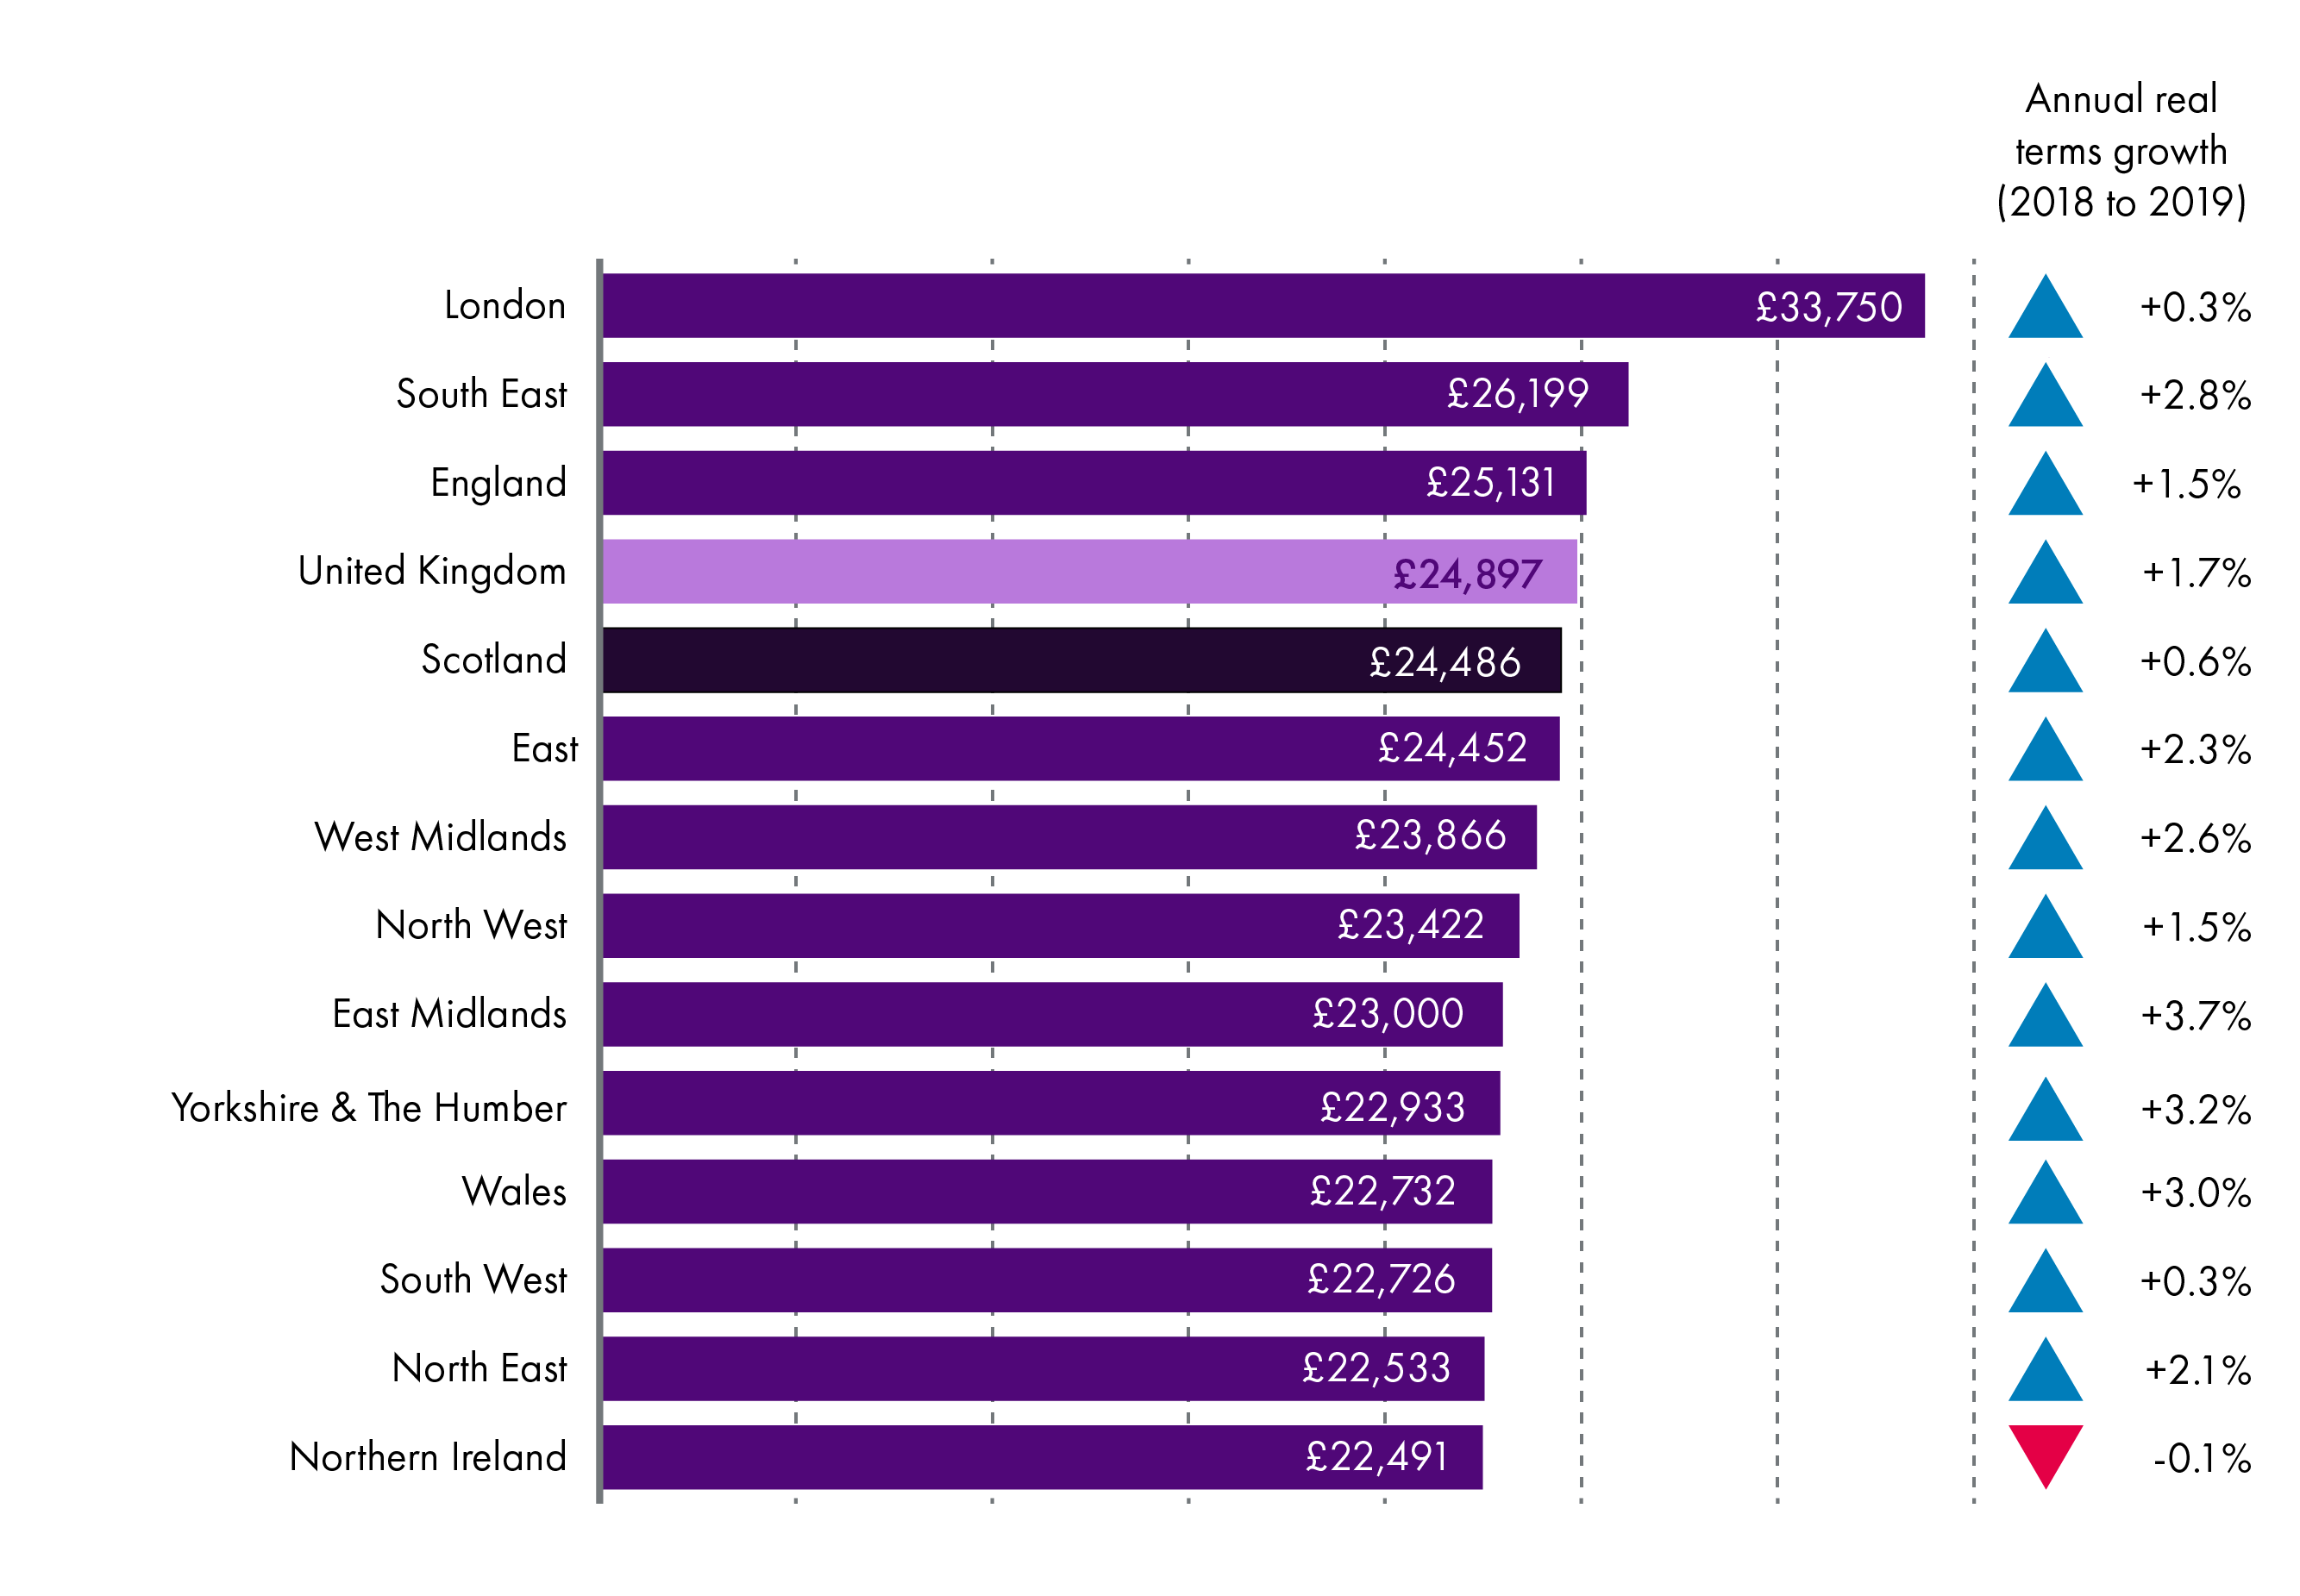
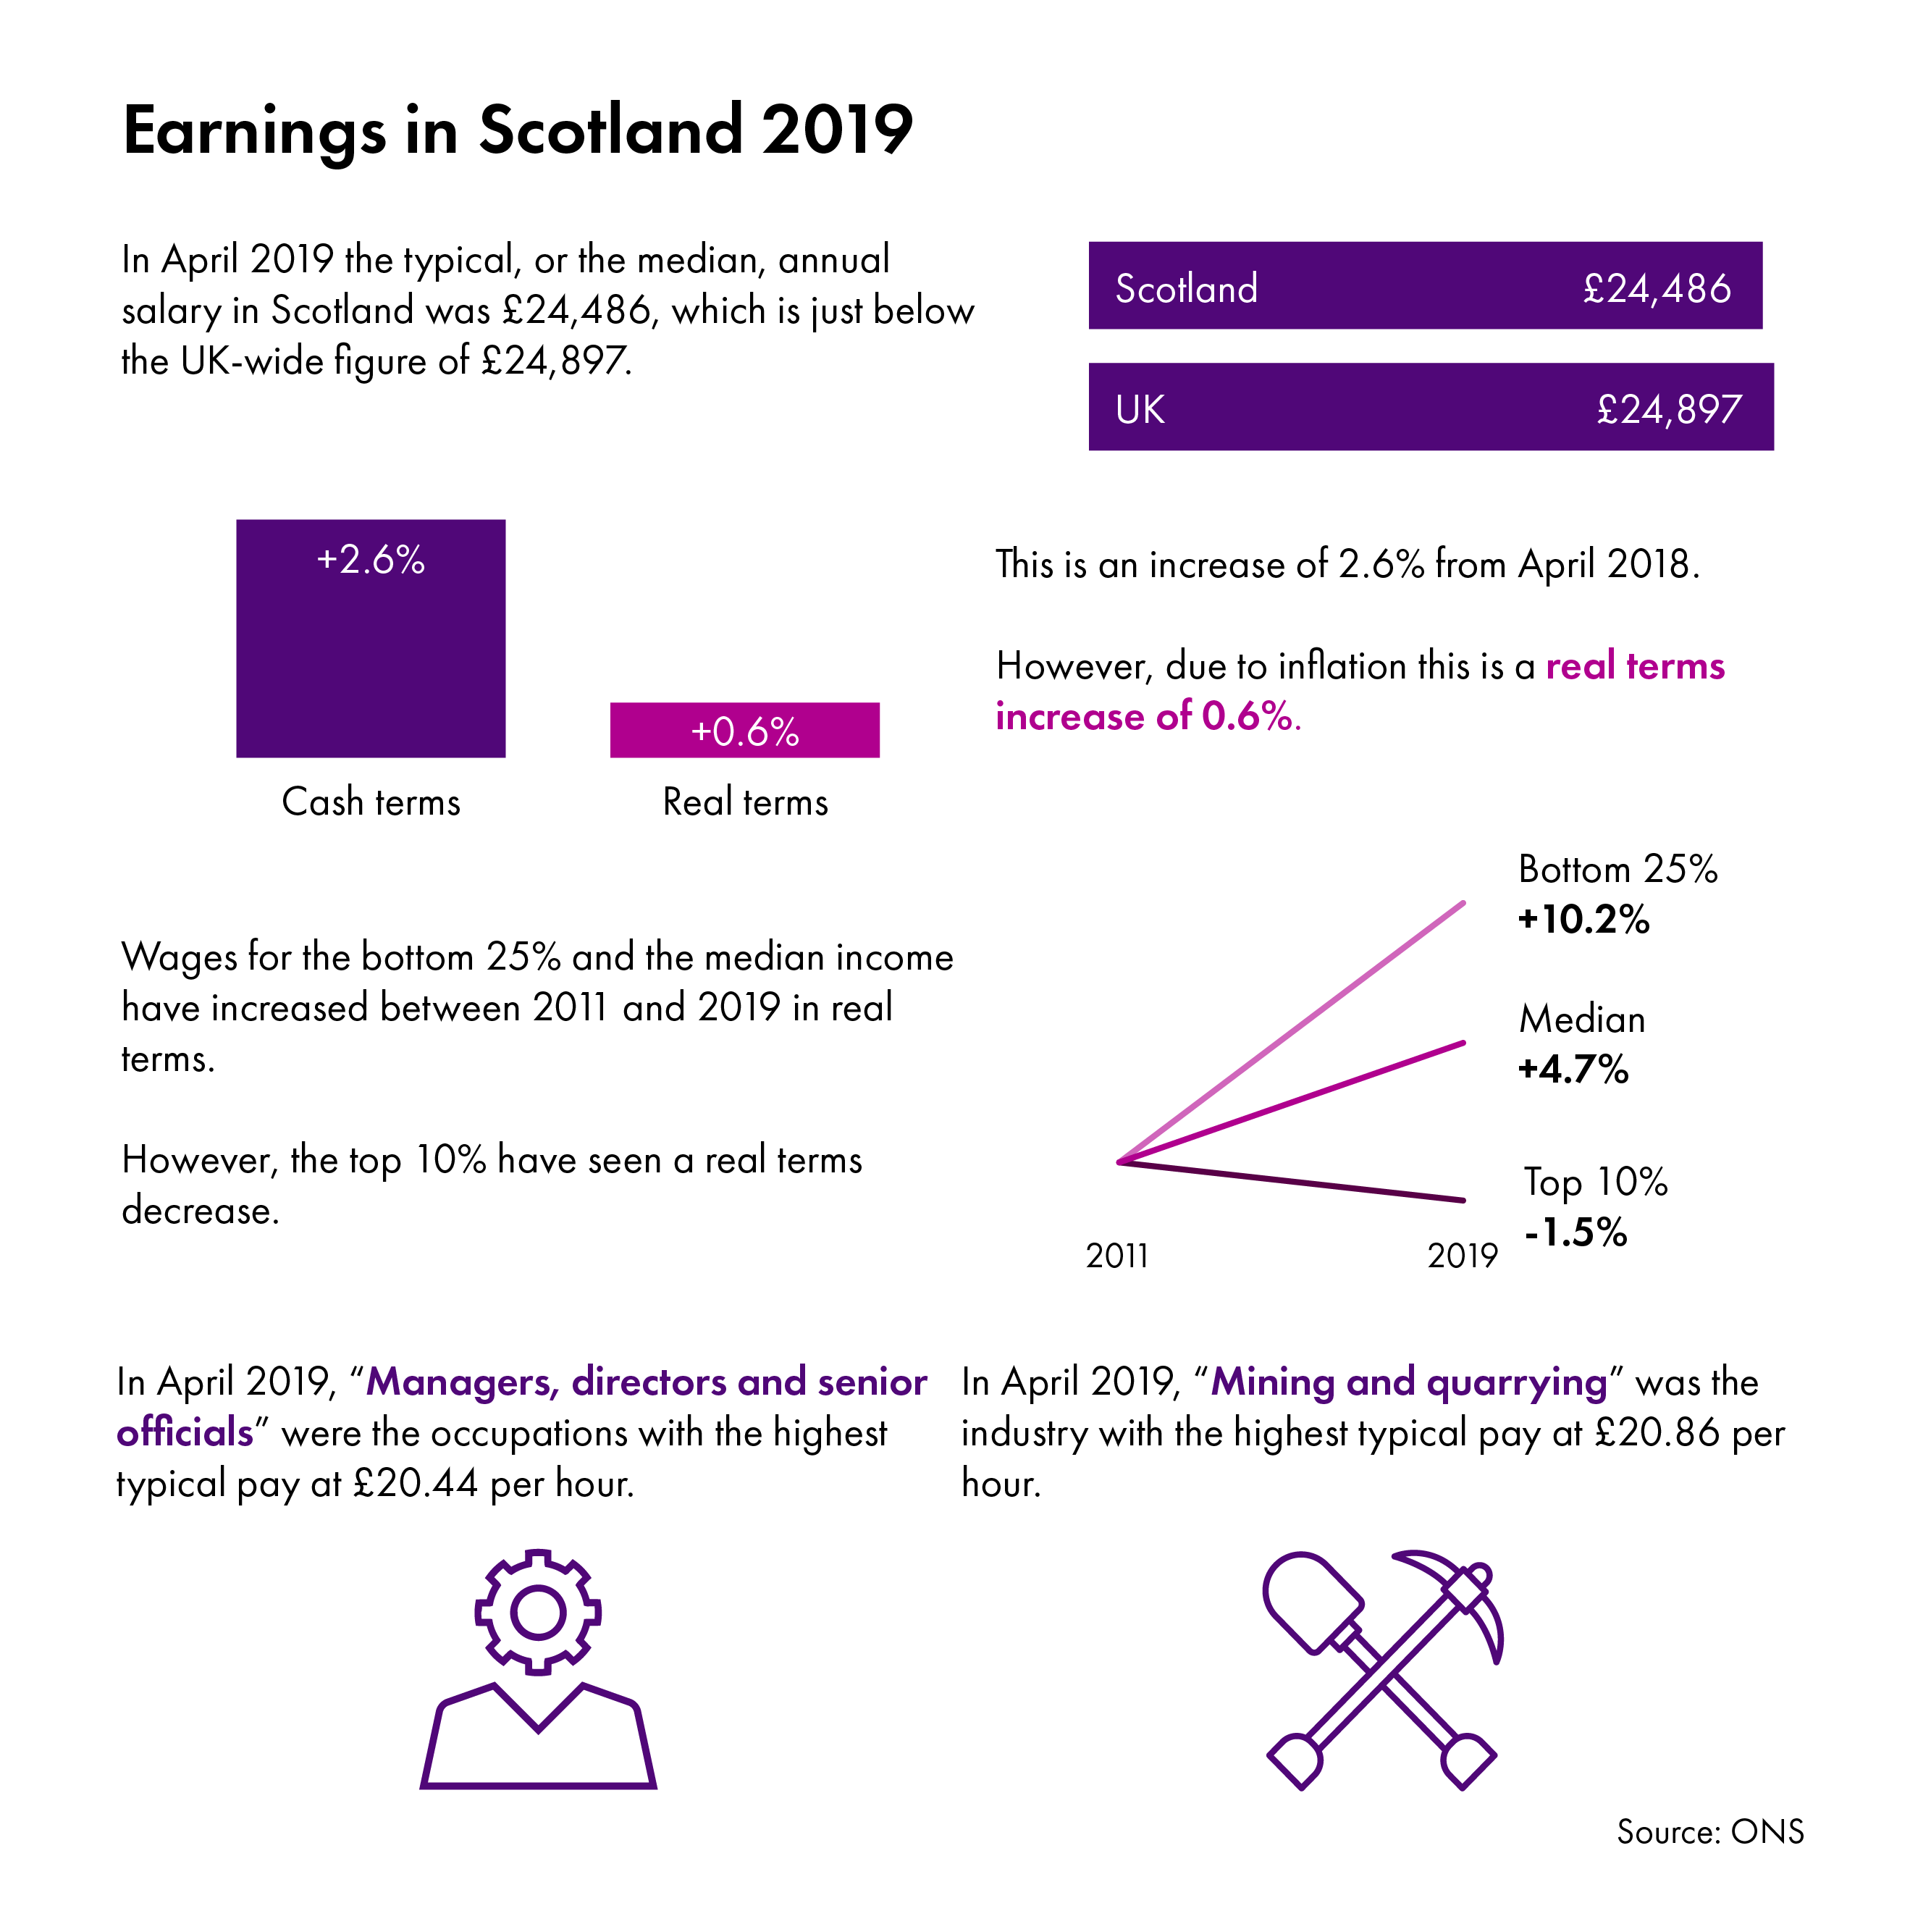
In April 2019 the median, or typical, gross salary in Scotland for all employees was £24,486. This is just below the UK wide figure (£24,897) and is the highest outside London and the South East, but lower than the overall England figure. This pattern is also seen in earnings for employees working full-time.
Over the year salaries for all employees in Scotland grew by 2.6%, which was 0.6% in real terms. The East Midlands saw the largest increase at 3.7% in real terms while Northern Ireland was the only area to see a decrease in real terms, falling by 0.1%
What does the typical full-time salary look like in Scotland?
Figure 2: Gross annual pay for full-time employees across the nations and regions of the UK - 2019
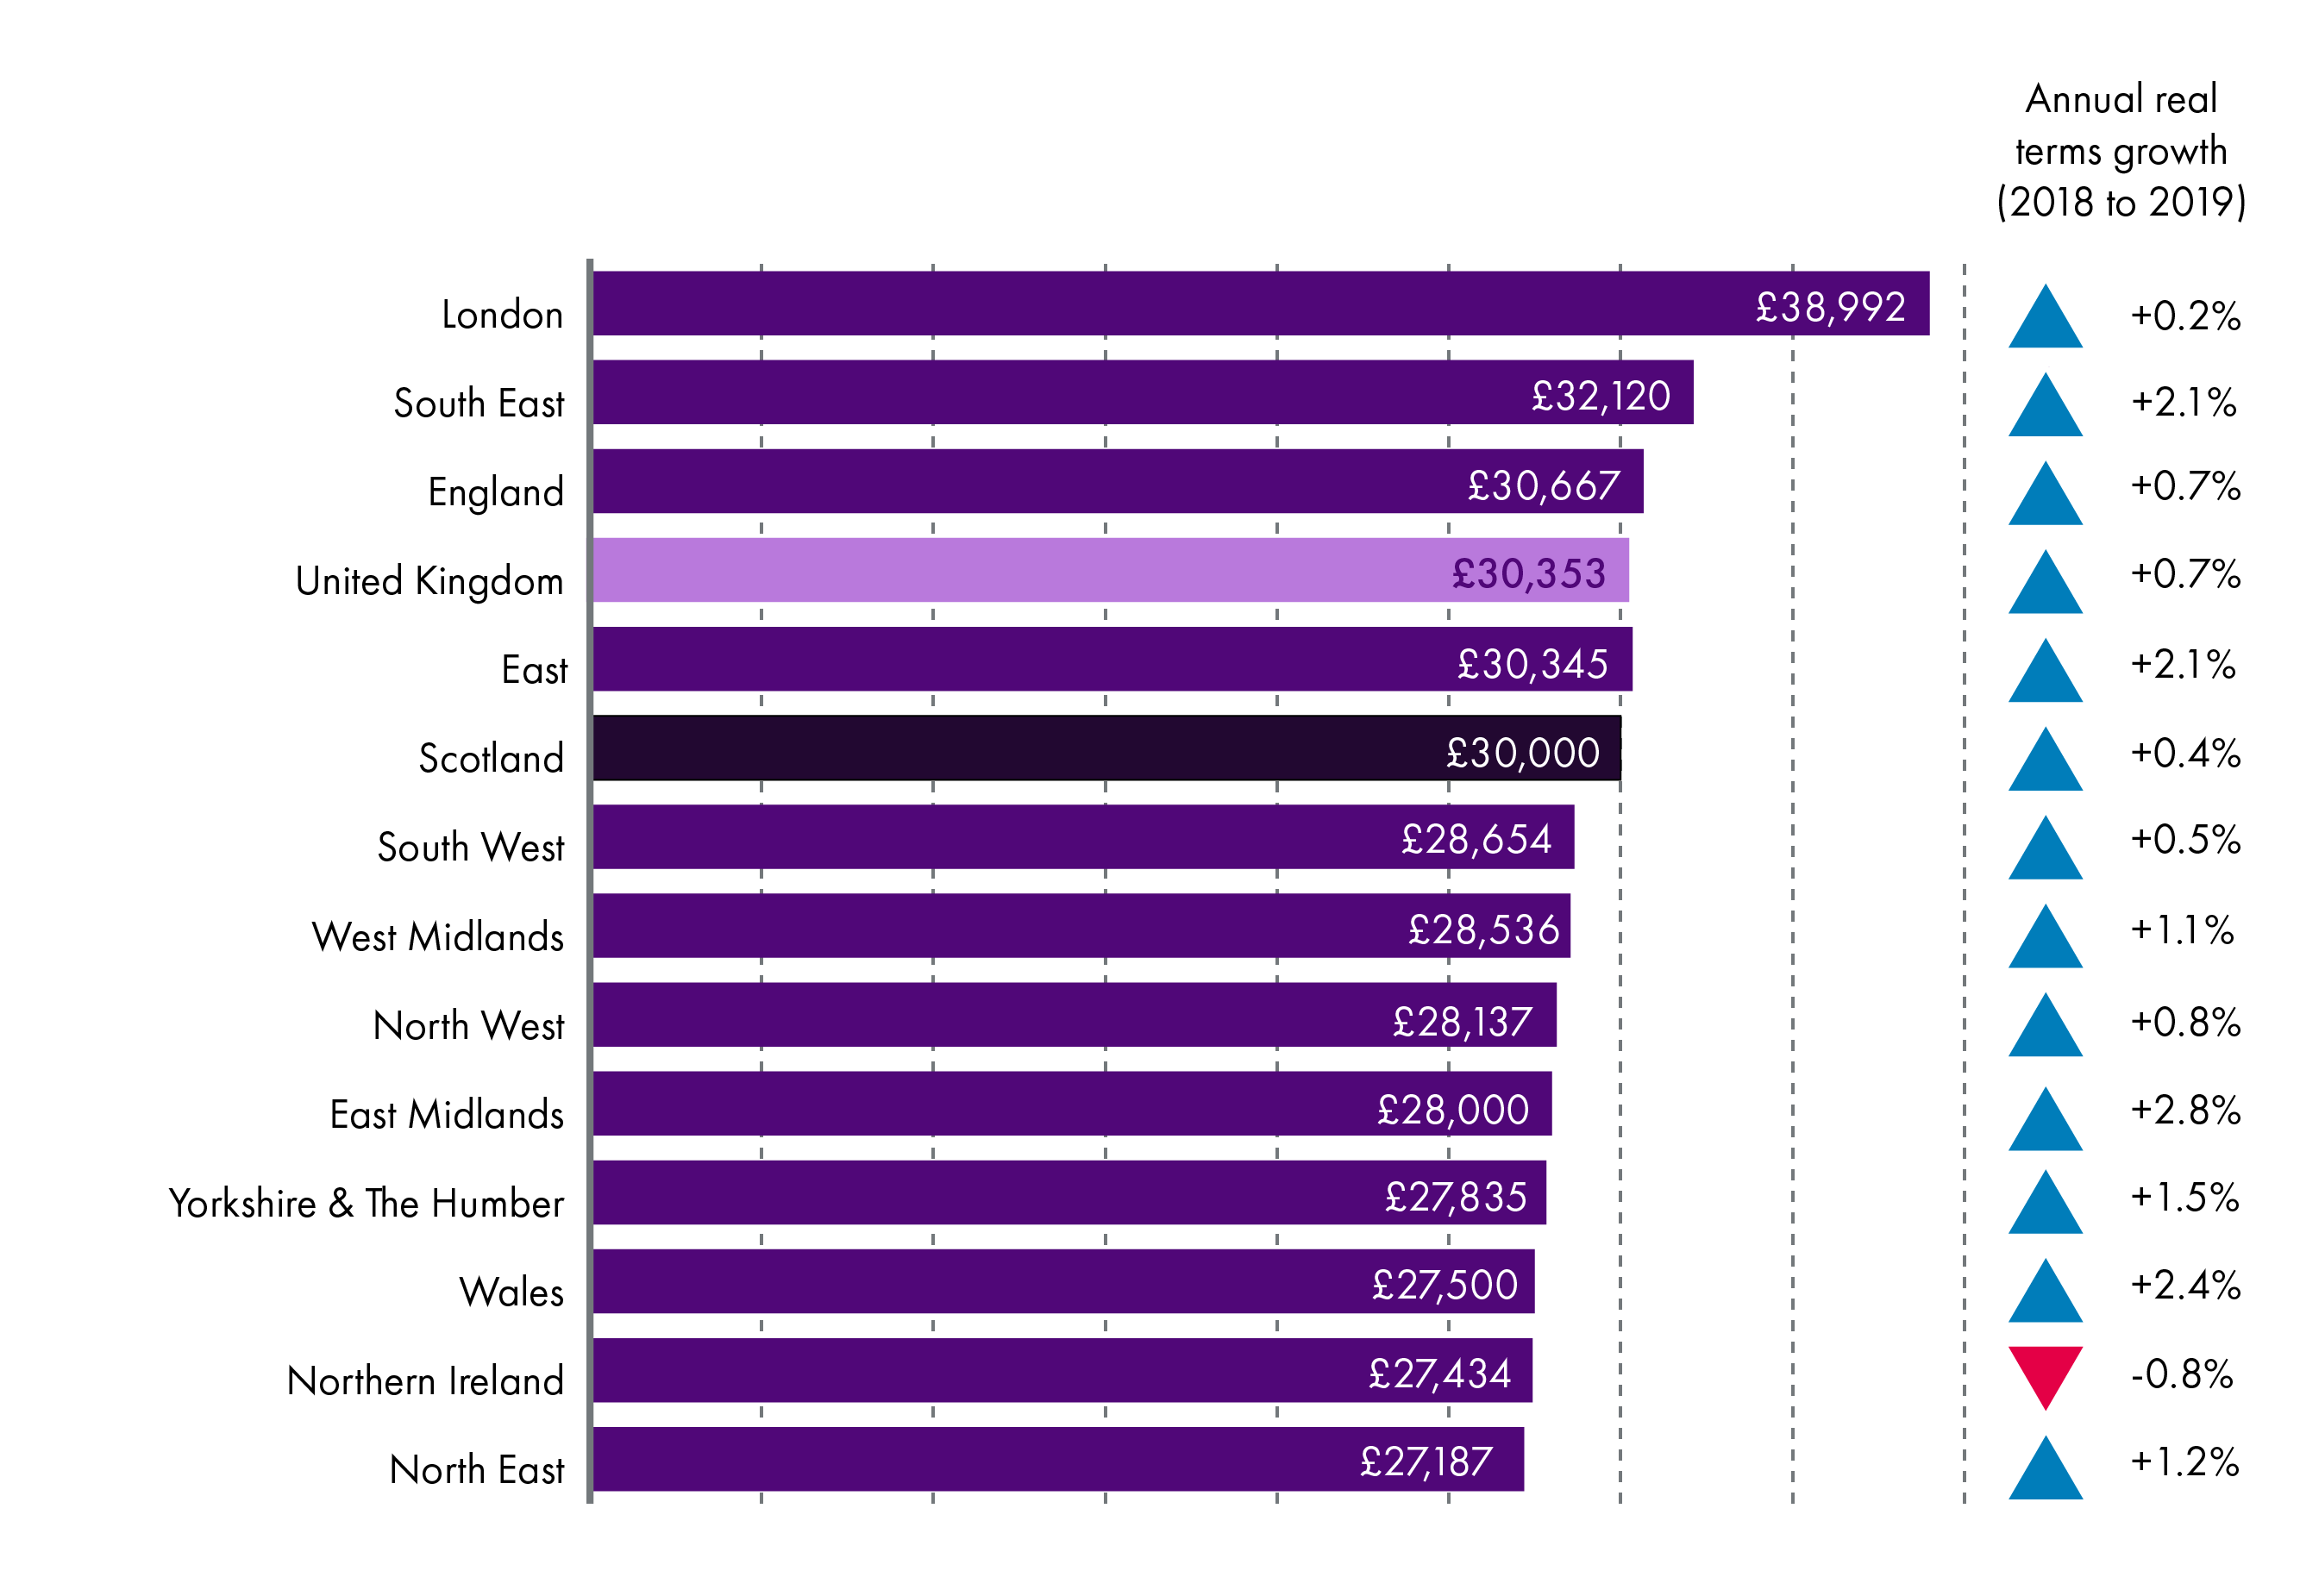
In Scotland 73% of people work full-time. Men make up the majority (61%) of those working full-time. In April 2019 the median, or typical, gross full-time salary in Scotland was £30,000. This is just below the UK wide figure (£30,353) and is the highest outside London, the South East and the East of England, but lower than the overall England figure. This is the same pattern as for the data for all salaries.
Over the year salaries for full-time employees in Scotland grew by 2.4%, which means wages grew by 0.4% in real terms. The UK overall saw a real terms increase of 0.7%.
What does the typical part-time salary look like in Scotland?
Figure 3: Gross annual pay for part-time employees across the nations and regions of the UK - 2019
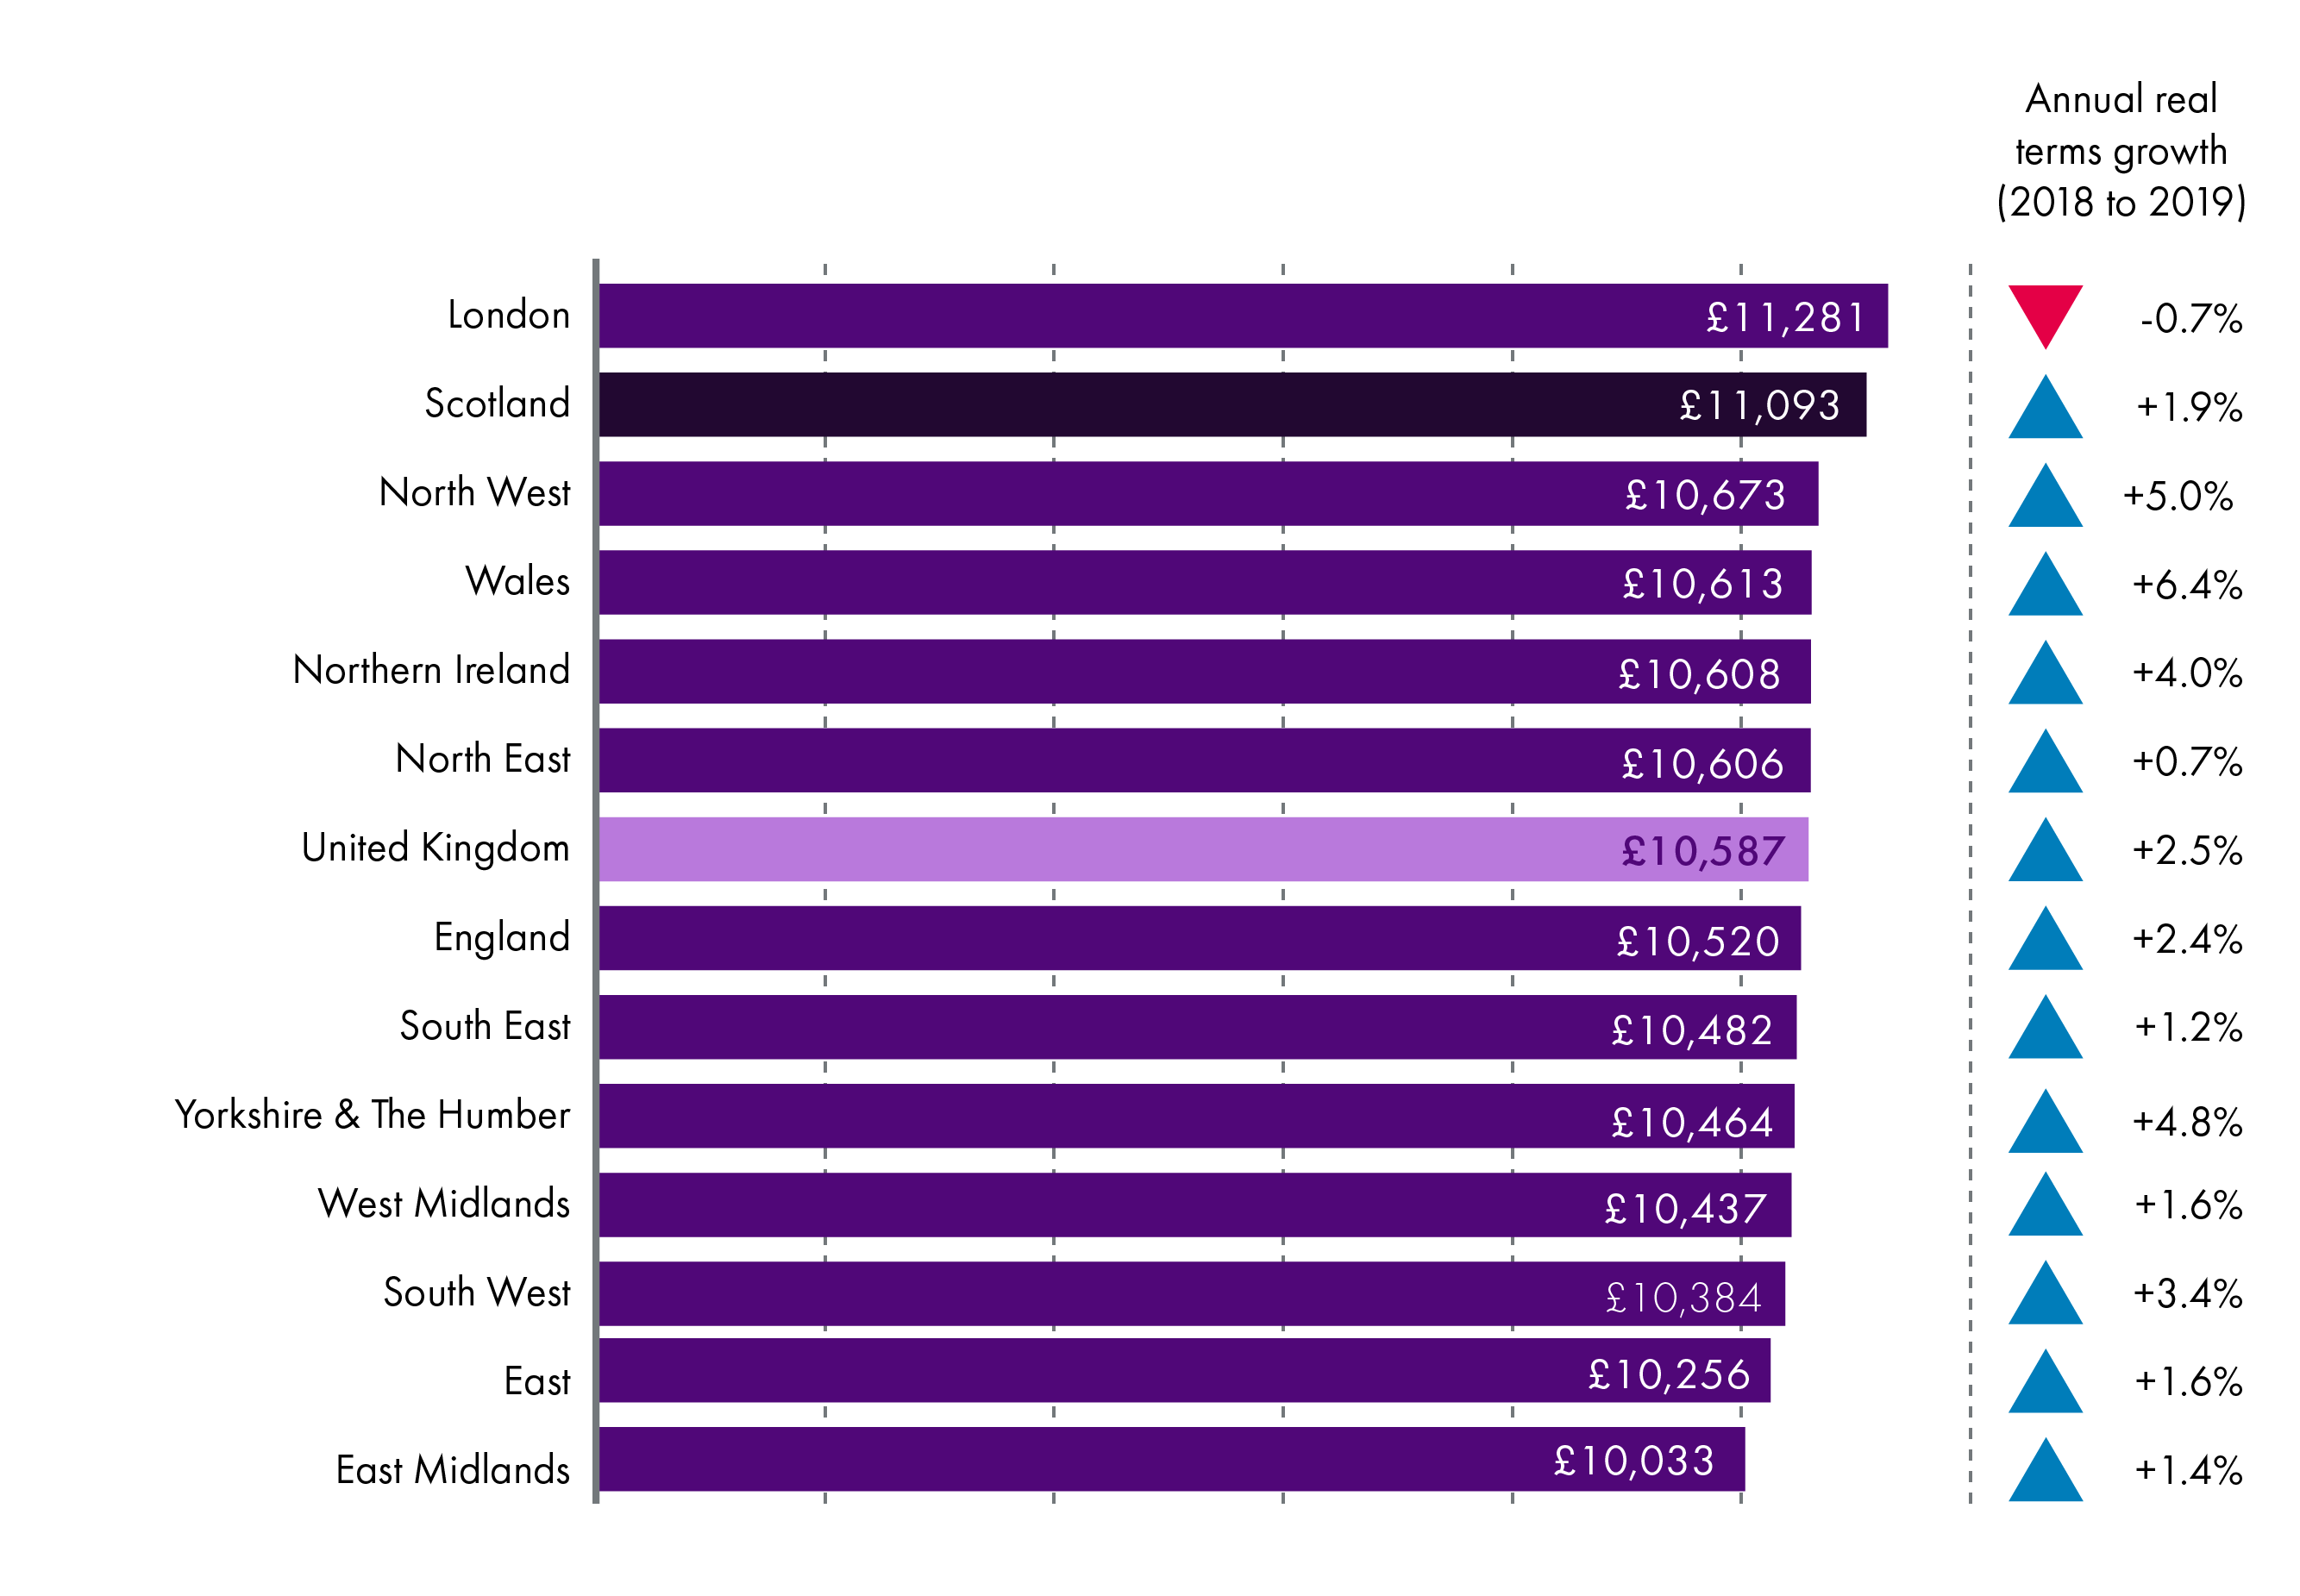
In Scotland 27% of people work part-time. Women make up the majority (76%) of those working part-time. In April 2019 the median, or typical, gross part-time salary in Scotland was £11,093. This is the highest outside London. This is a different pattern than that seen for both full-time and all employees.
Over the year salaries for part-time employees in Scotland grew by 3.9%, which was a 1.9% increase in real terms. Yorkshire and the Humber saw the largest increase while London was the only area to see a decrease in real terms.
What does typical weekly pay look like in Scotland?
Unlike salaries, the analysis of weekly pay doesn't require a person to have been in the same job for a year. It relates to employees whose earnings for the survey pay period were not affected by absence.
This section looks at what weekly pay for all employees, both full-time and part-time, looks like in Scotland compared to the other regions and nations of the UK.
Figure 4: Gross weekly pay for all employees across the nations and regions of the UK - 2019
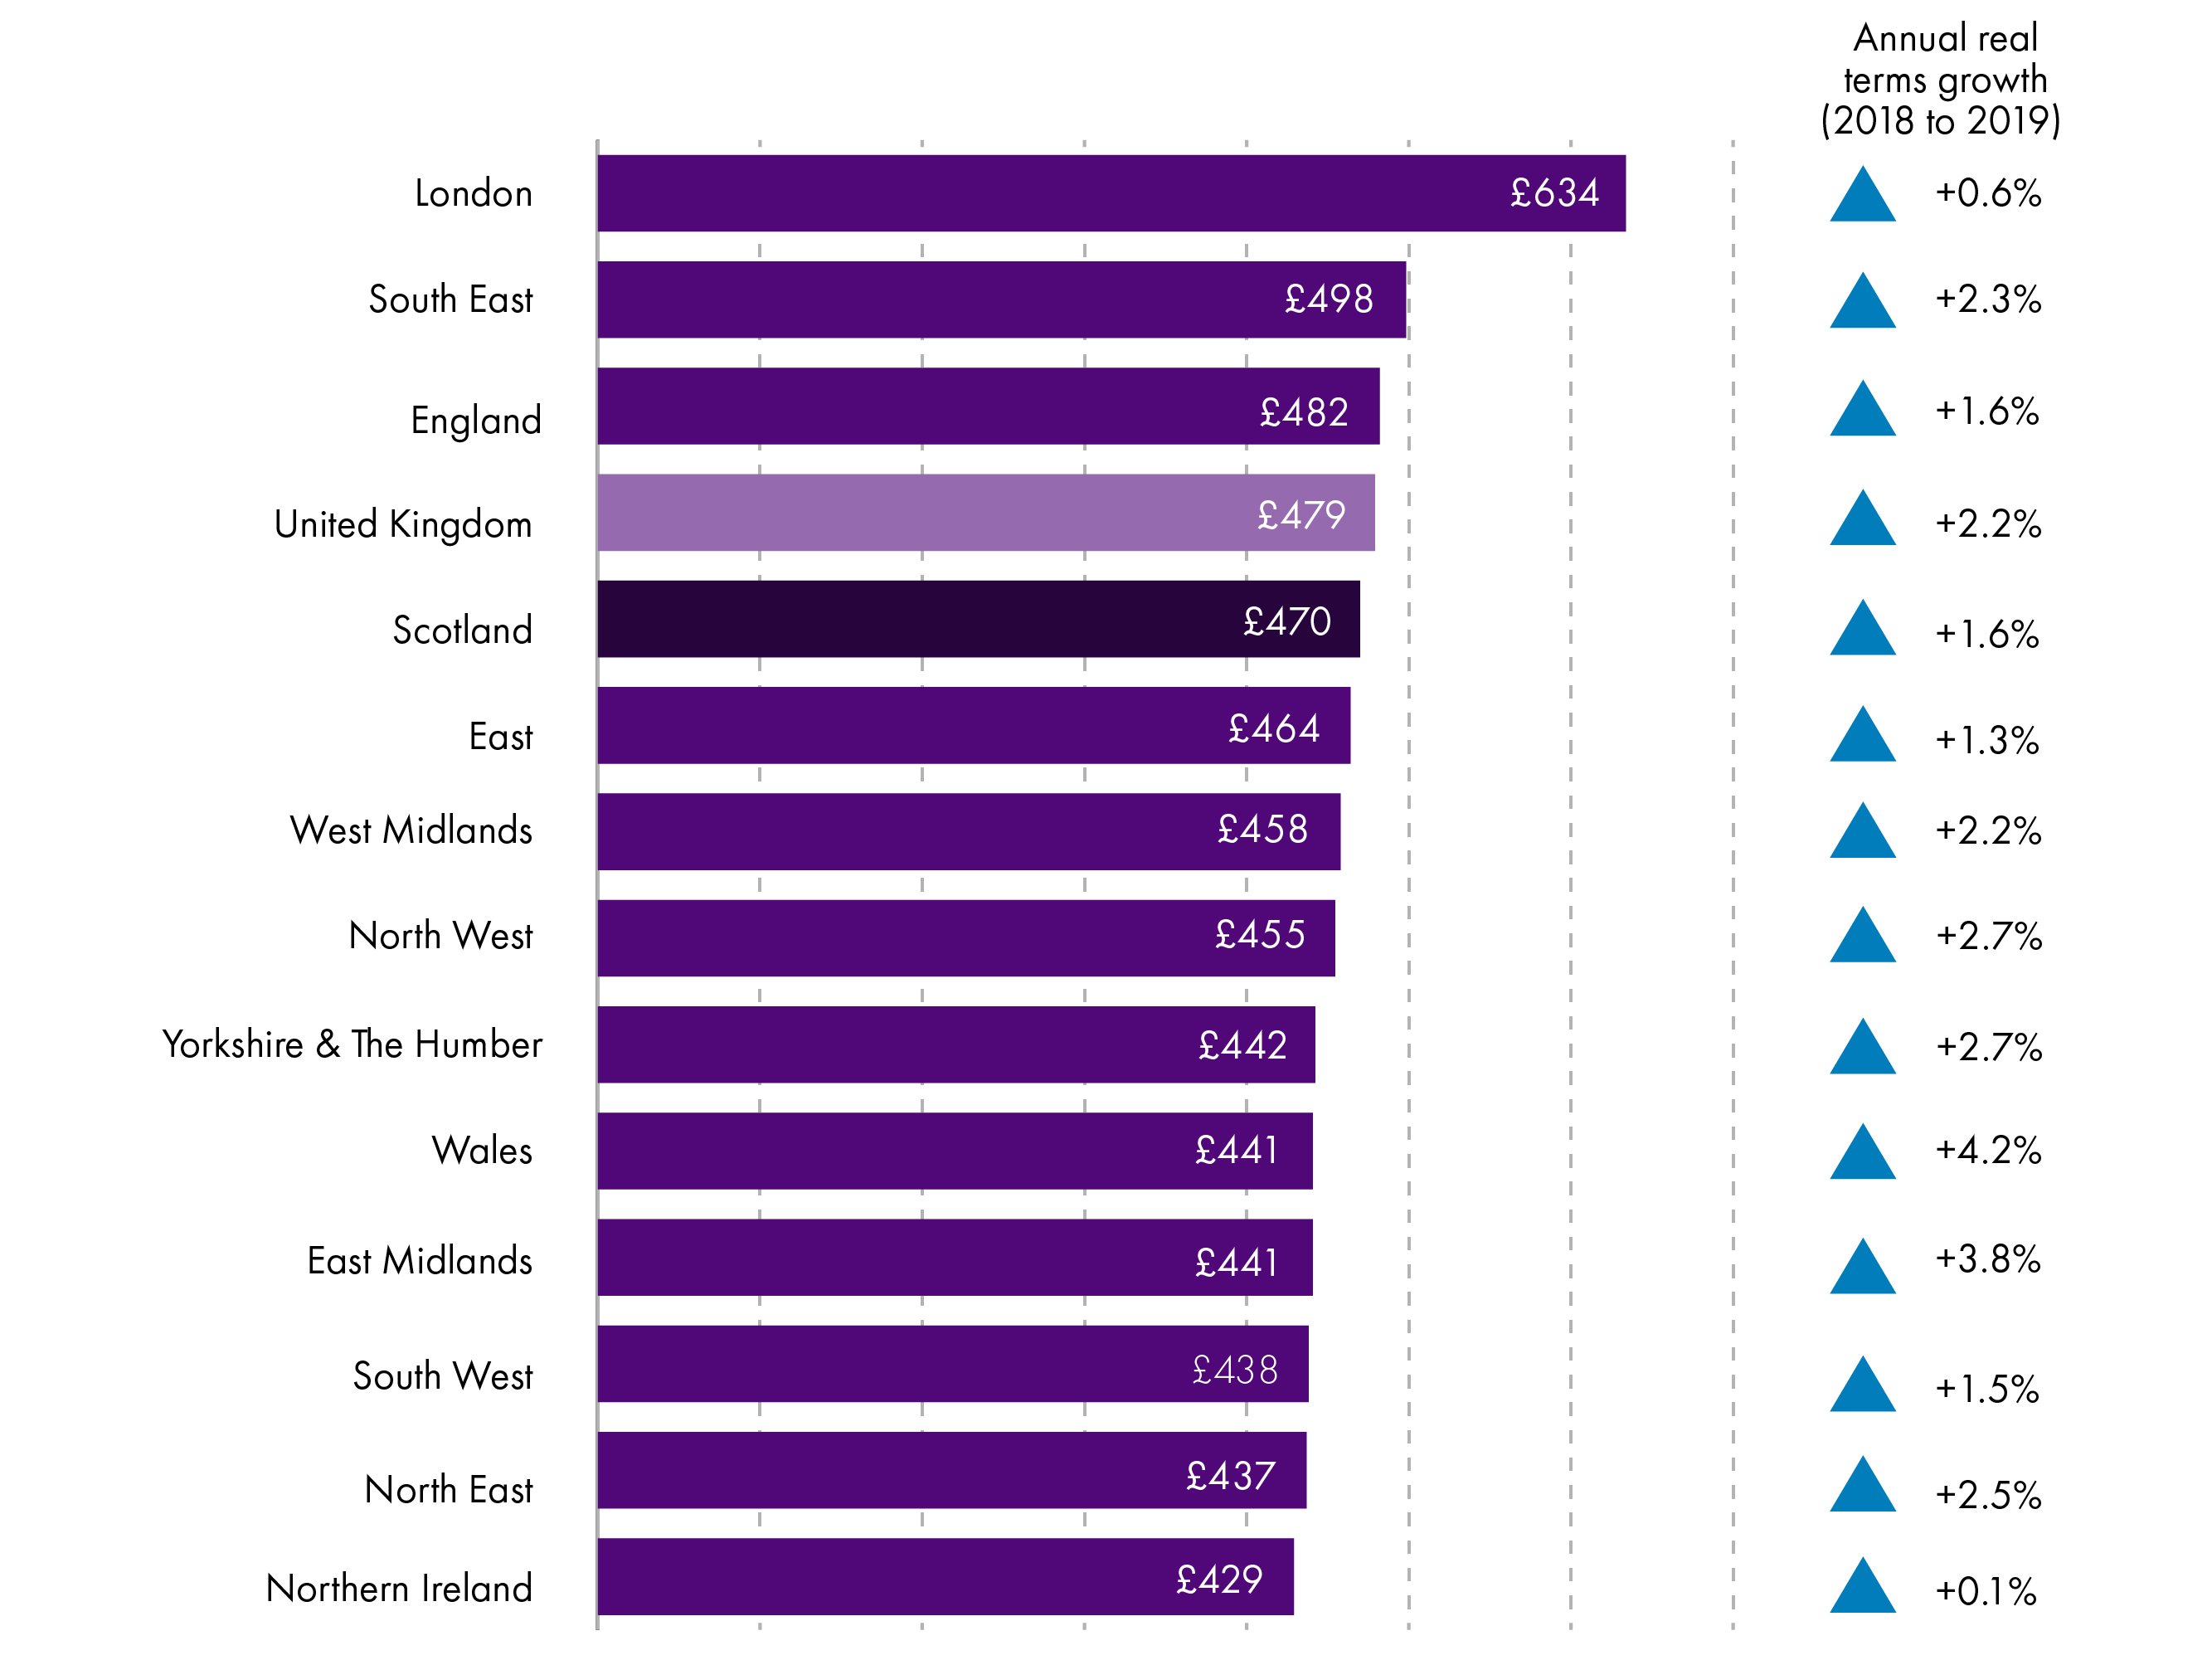
In April 2019 the median, or typical, gross weekly pay in Scotland for all employees was £470. This is just below the UK wide figure (£479) and is the highest outside London and the South East, but lower than the overall England figure. Again, this shows the same pattern as for full-time weekly earnings.
Over the year gross weekly pay for all employees in Scotland grew by 3.6%, which was a 1.6% increase in real terms. Wales saw the largest increase over the year while Northern Ireland saw the smallest increase at 0.1% in real terms.
Growth in weekly pay for all employees by decile
ASHE provides data on earnings by deciles. The data provides the nine points which split the data into 10 equal numbers of employees. For example in Scotland the gross pay for the 1st decile is £155 per week, therefore 10% of employees earn between £0 and £155 per week. The ninth decile point is at gross pay of £947 per week and 10% of employees earn this and above.
Figure 5: Real terms growth in gross weekly pay for all employees by decile thresholds - Scotland and the UK - April 2018 to April 2019
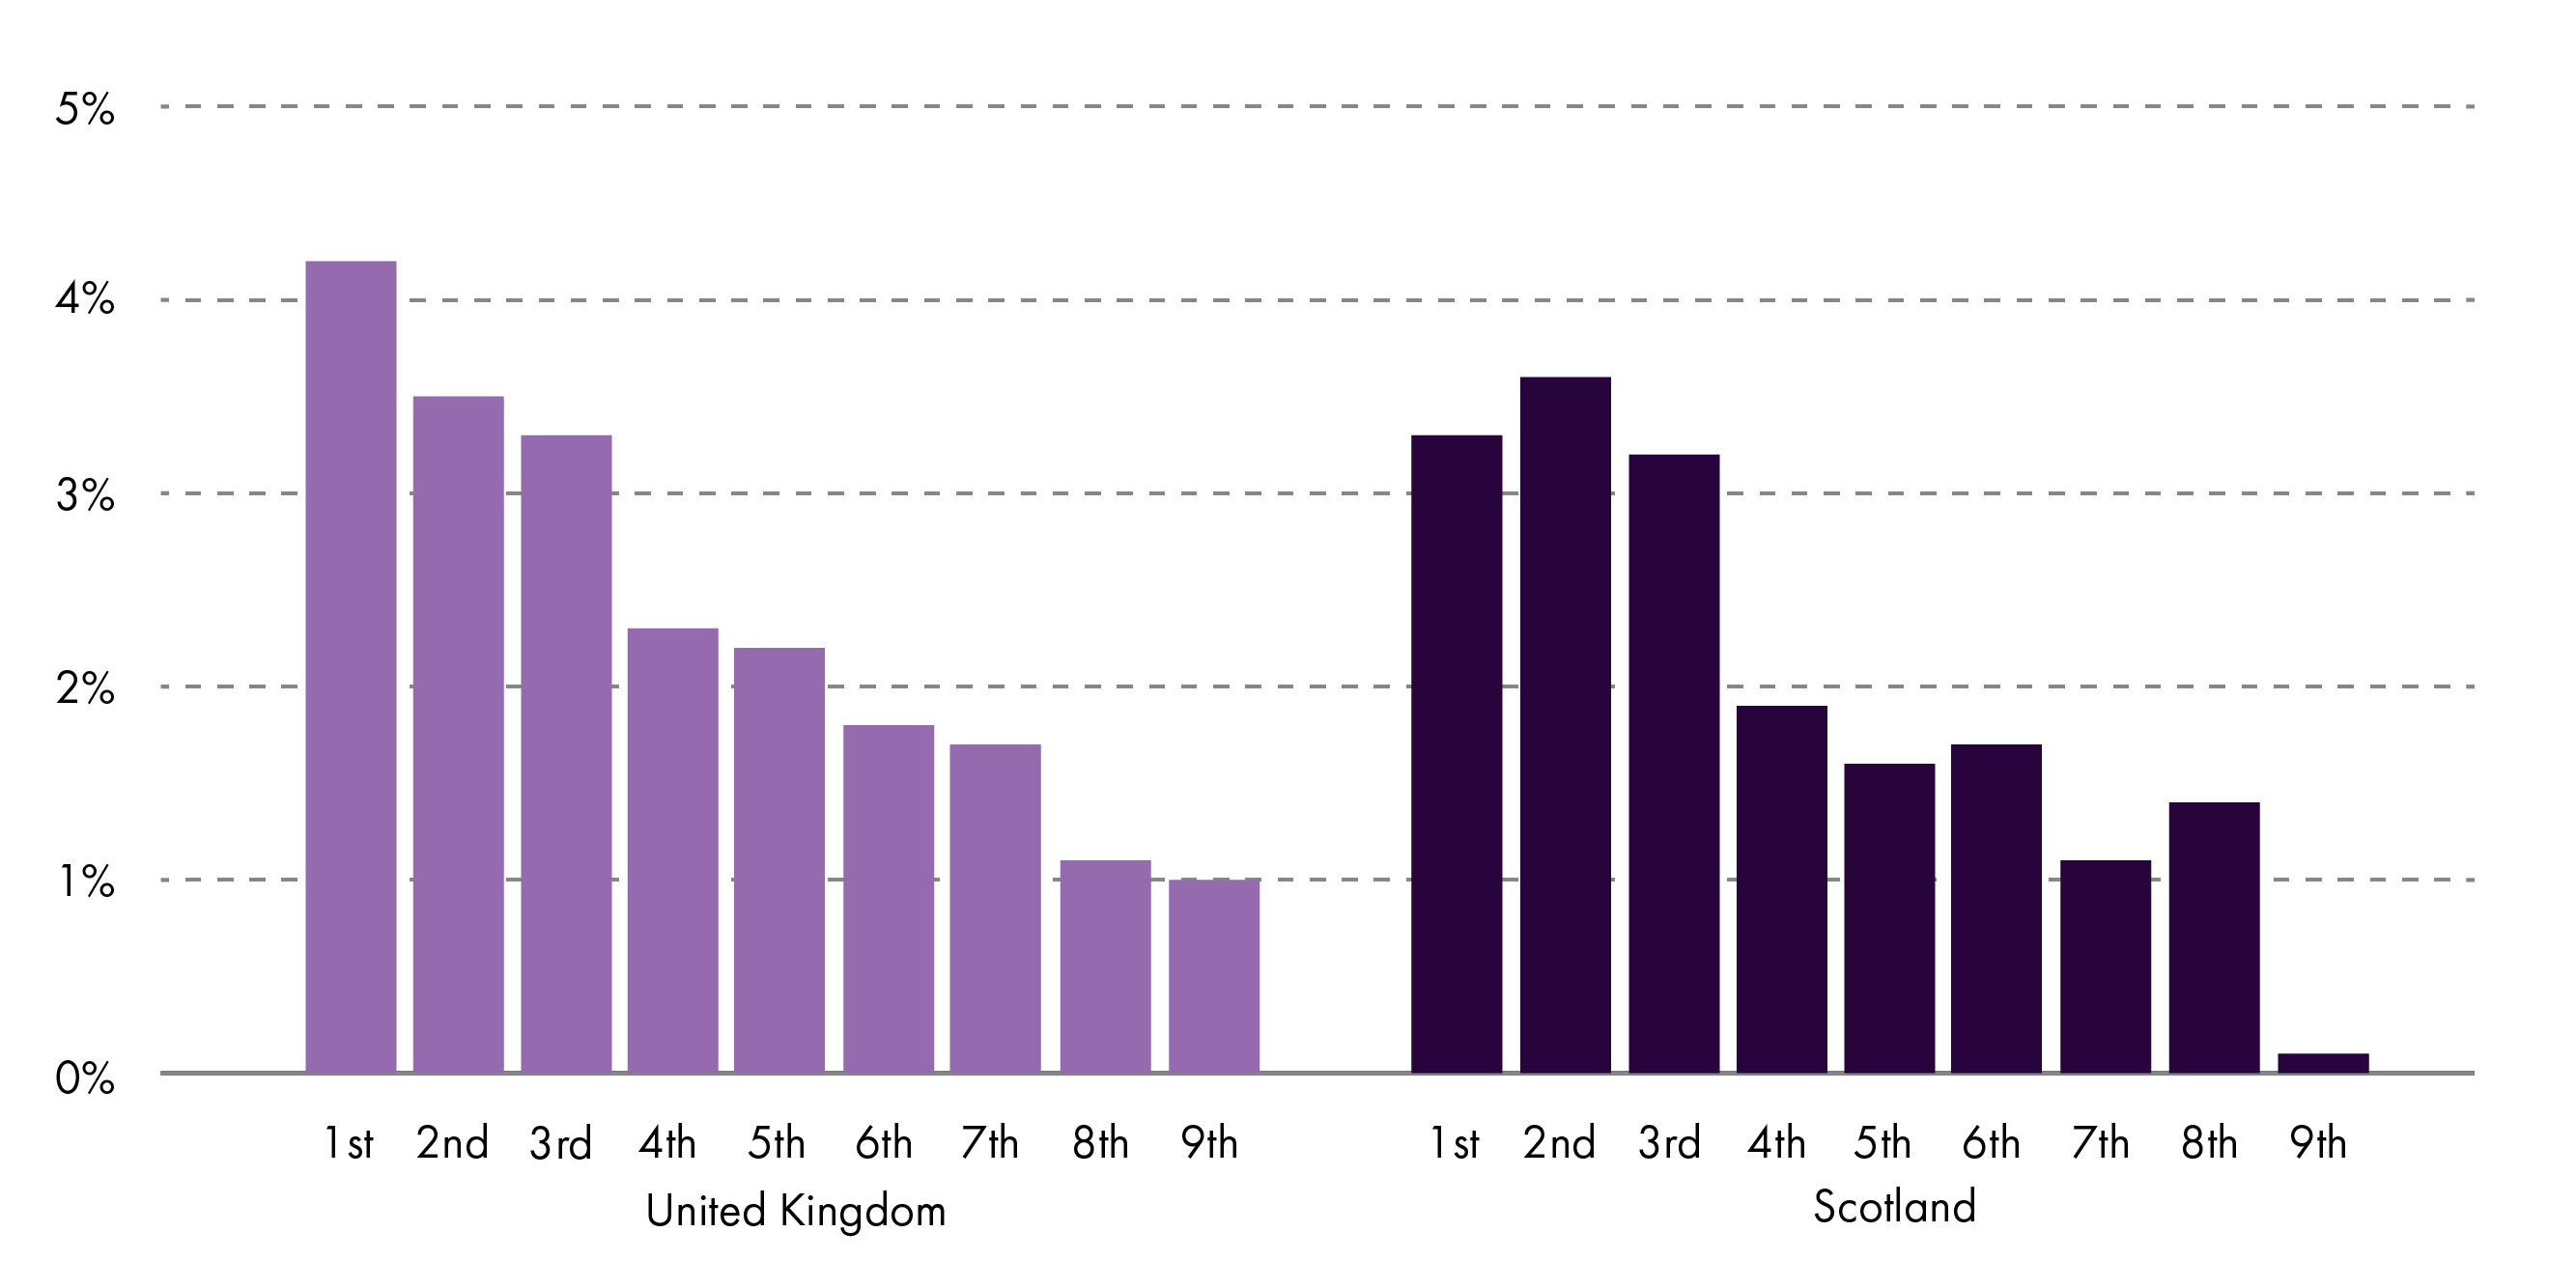
When looking at the data for both Scotland and the UK it shows that all decile points have increased in value, in real terms. The bottom three, the 1st through to the 3rd, have seen the highest increase, in both Scotland and the UK.
We can look at the ratio of the 9th point, or 90th percentile, and the 1st point, or the 10th percentile, to give us an idea of the difference between high and low earners. When looking at this measure the UK has a higher ratio than Scotland but both have fallen over the year as shown in table 1.
| 2018 | 2019 | Change | |
|---|---|---|---|
| UK | 6.88 | 6.67 | -0.21 |
| Scotland | 6.24 | 6.04 | -0.19 |
SPICe calculations based on Employee earnings in the UK: 2019
Since 2011, the ratio of the 90th percentile to 10th percentile of employee earnings has fallen from 6.94 to 6.04 in Scotland and from 7.64 to 6.67 in the UK overall.
What does typical full-time weekly pay look like in Scotland?
Figure 6: Gross weekly pay for full-time employees across the nations and regions of the UK - 2019
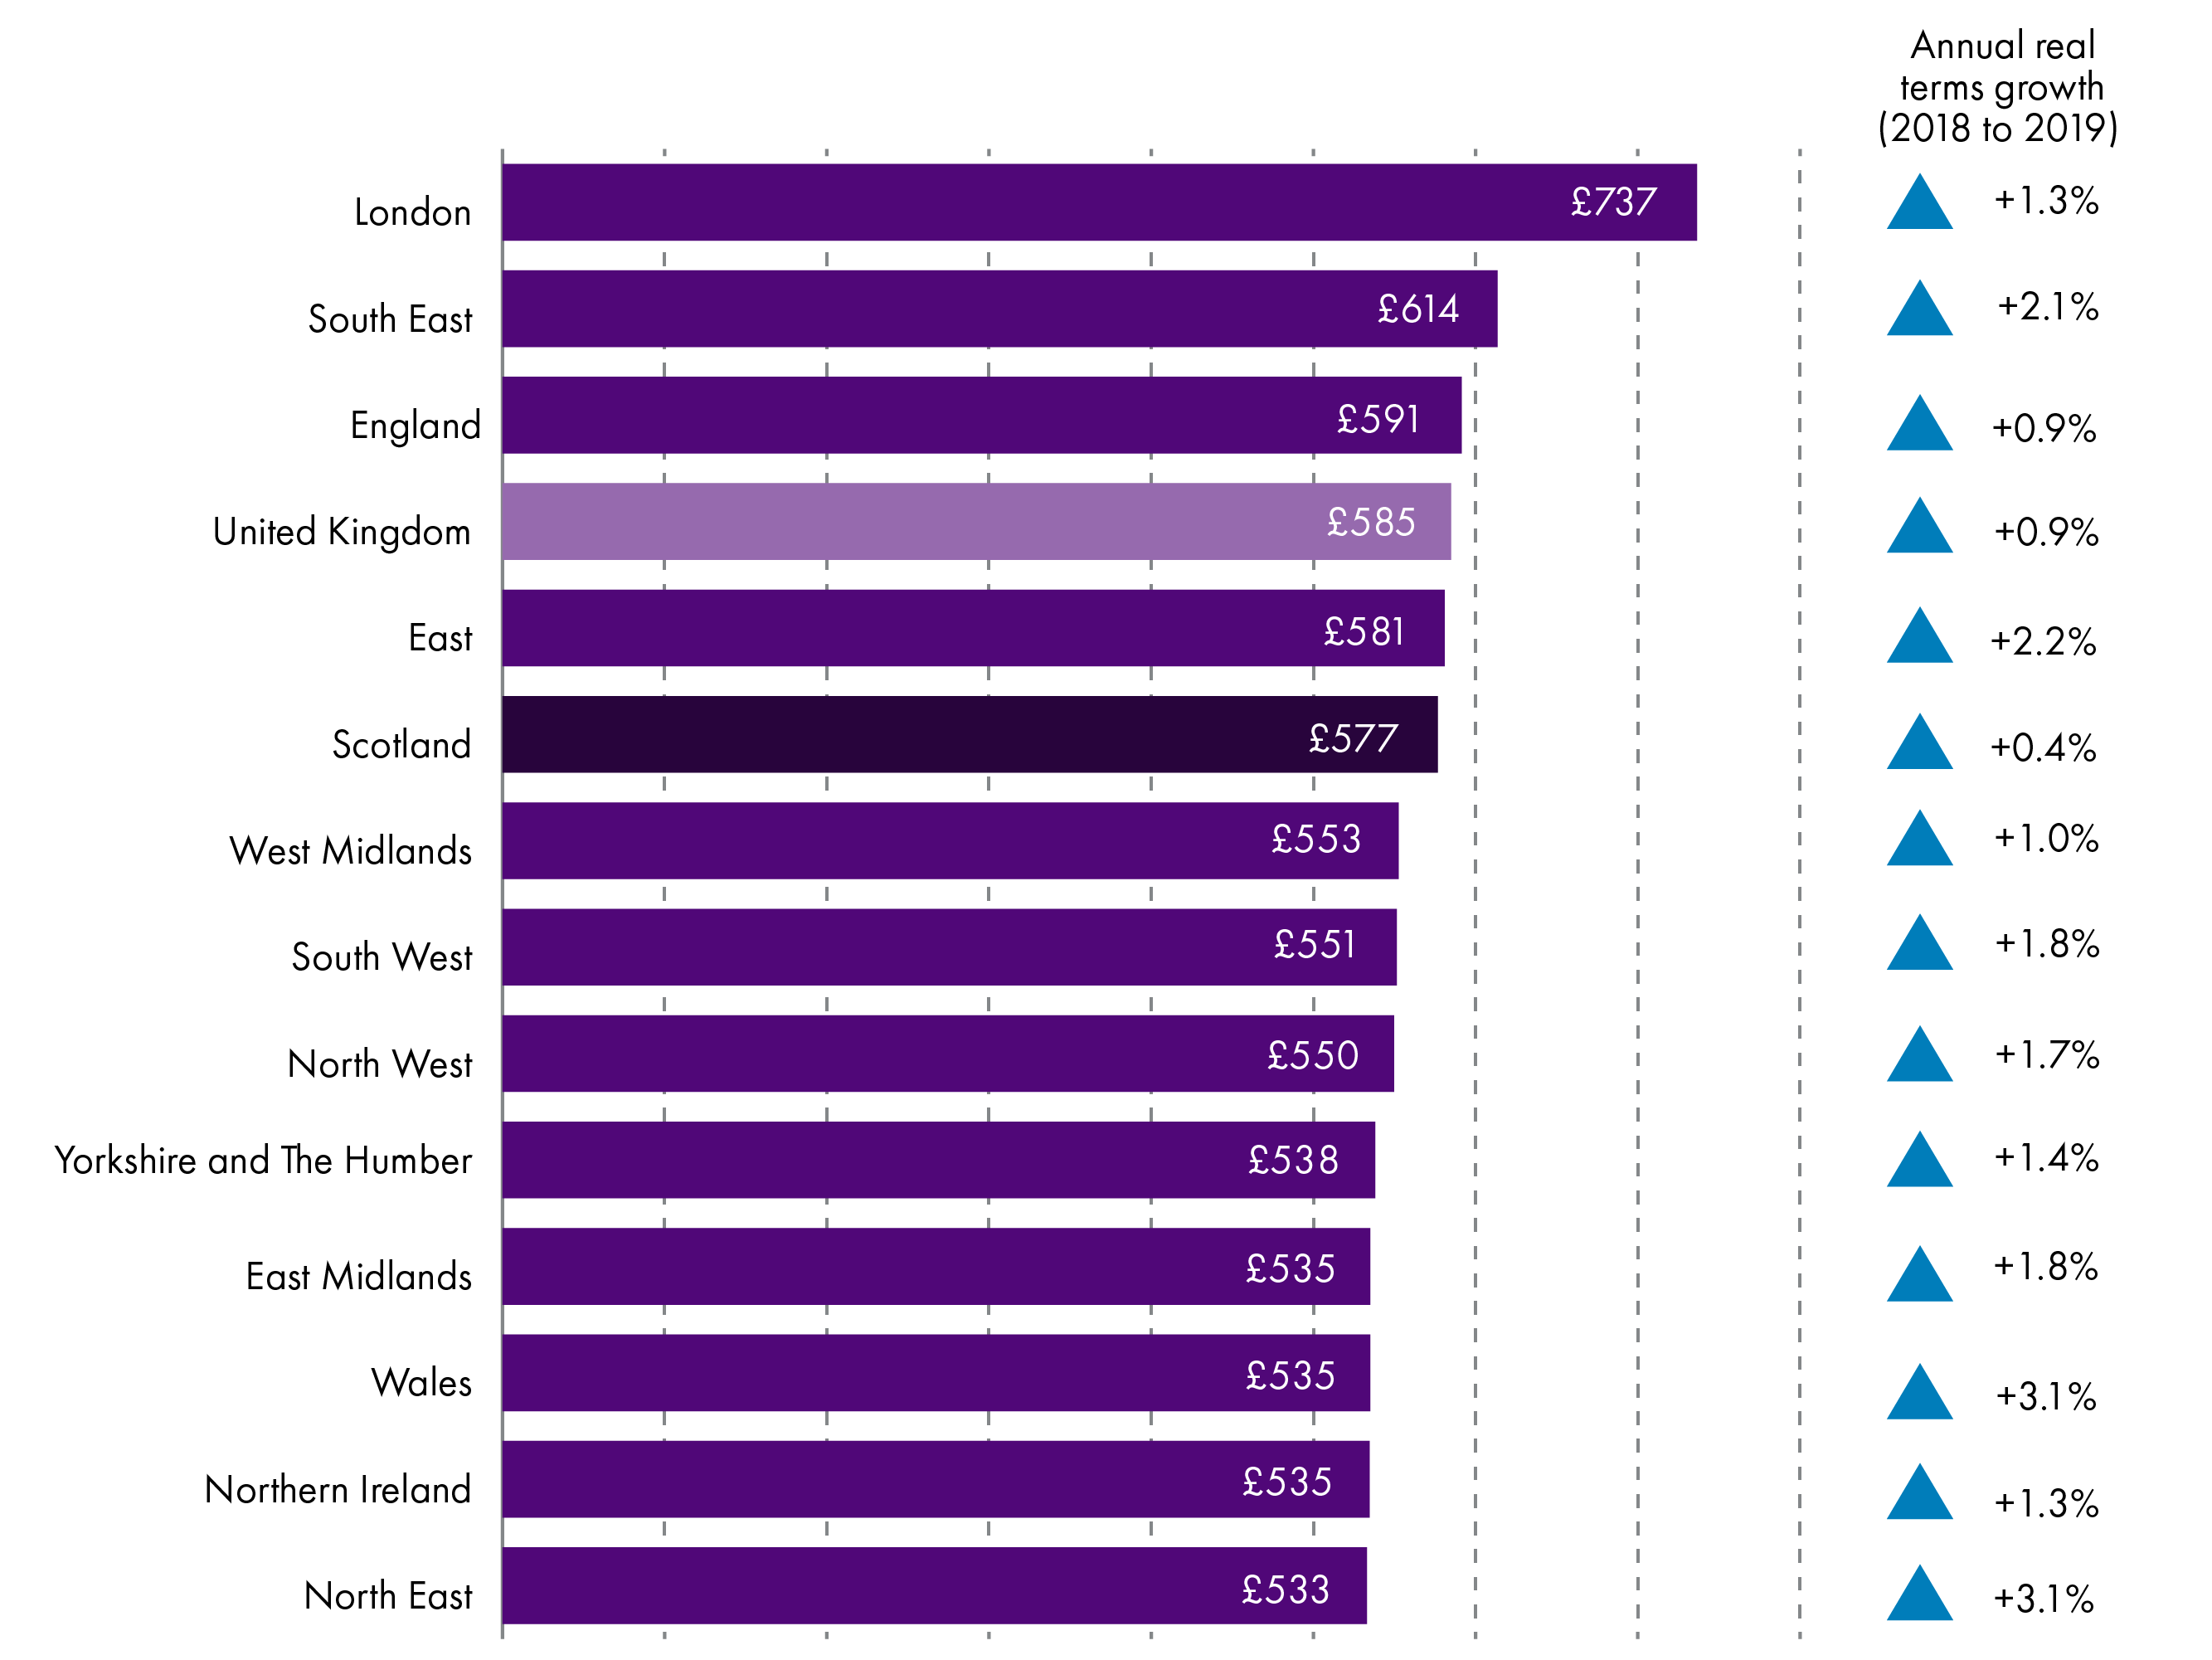
In Scotland 73% of people work full-time. Men make up the majority (61%) of those working full-time. In April 2019 the median, or typical, gross full-time weekly pay in Scotland was £577. This is just below the UK wide figure (£585) and is the highest outside London, the South East and the East of England, but lower than the overall England figure. This is the same pattern as for full-time salaries.
Over the year, gross weekly pay for full-time employees in Scotland grew by 2.4%, which was a 0.4% increase in real terms. The North East and Wales saw the largest increase. Scotland saw the lowest increase of the nations and regions of the UK.
What does typical part-time weekly pay look like in Scotland?
Figure 7: Gross weekly pay for part-time employees in across the nations and regions of the UK - 2019
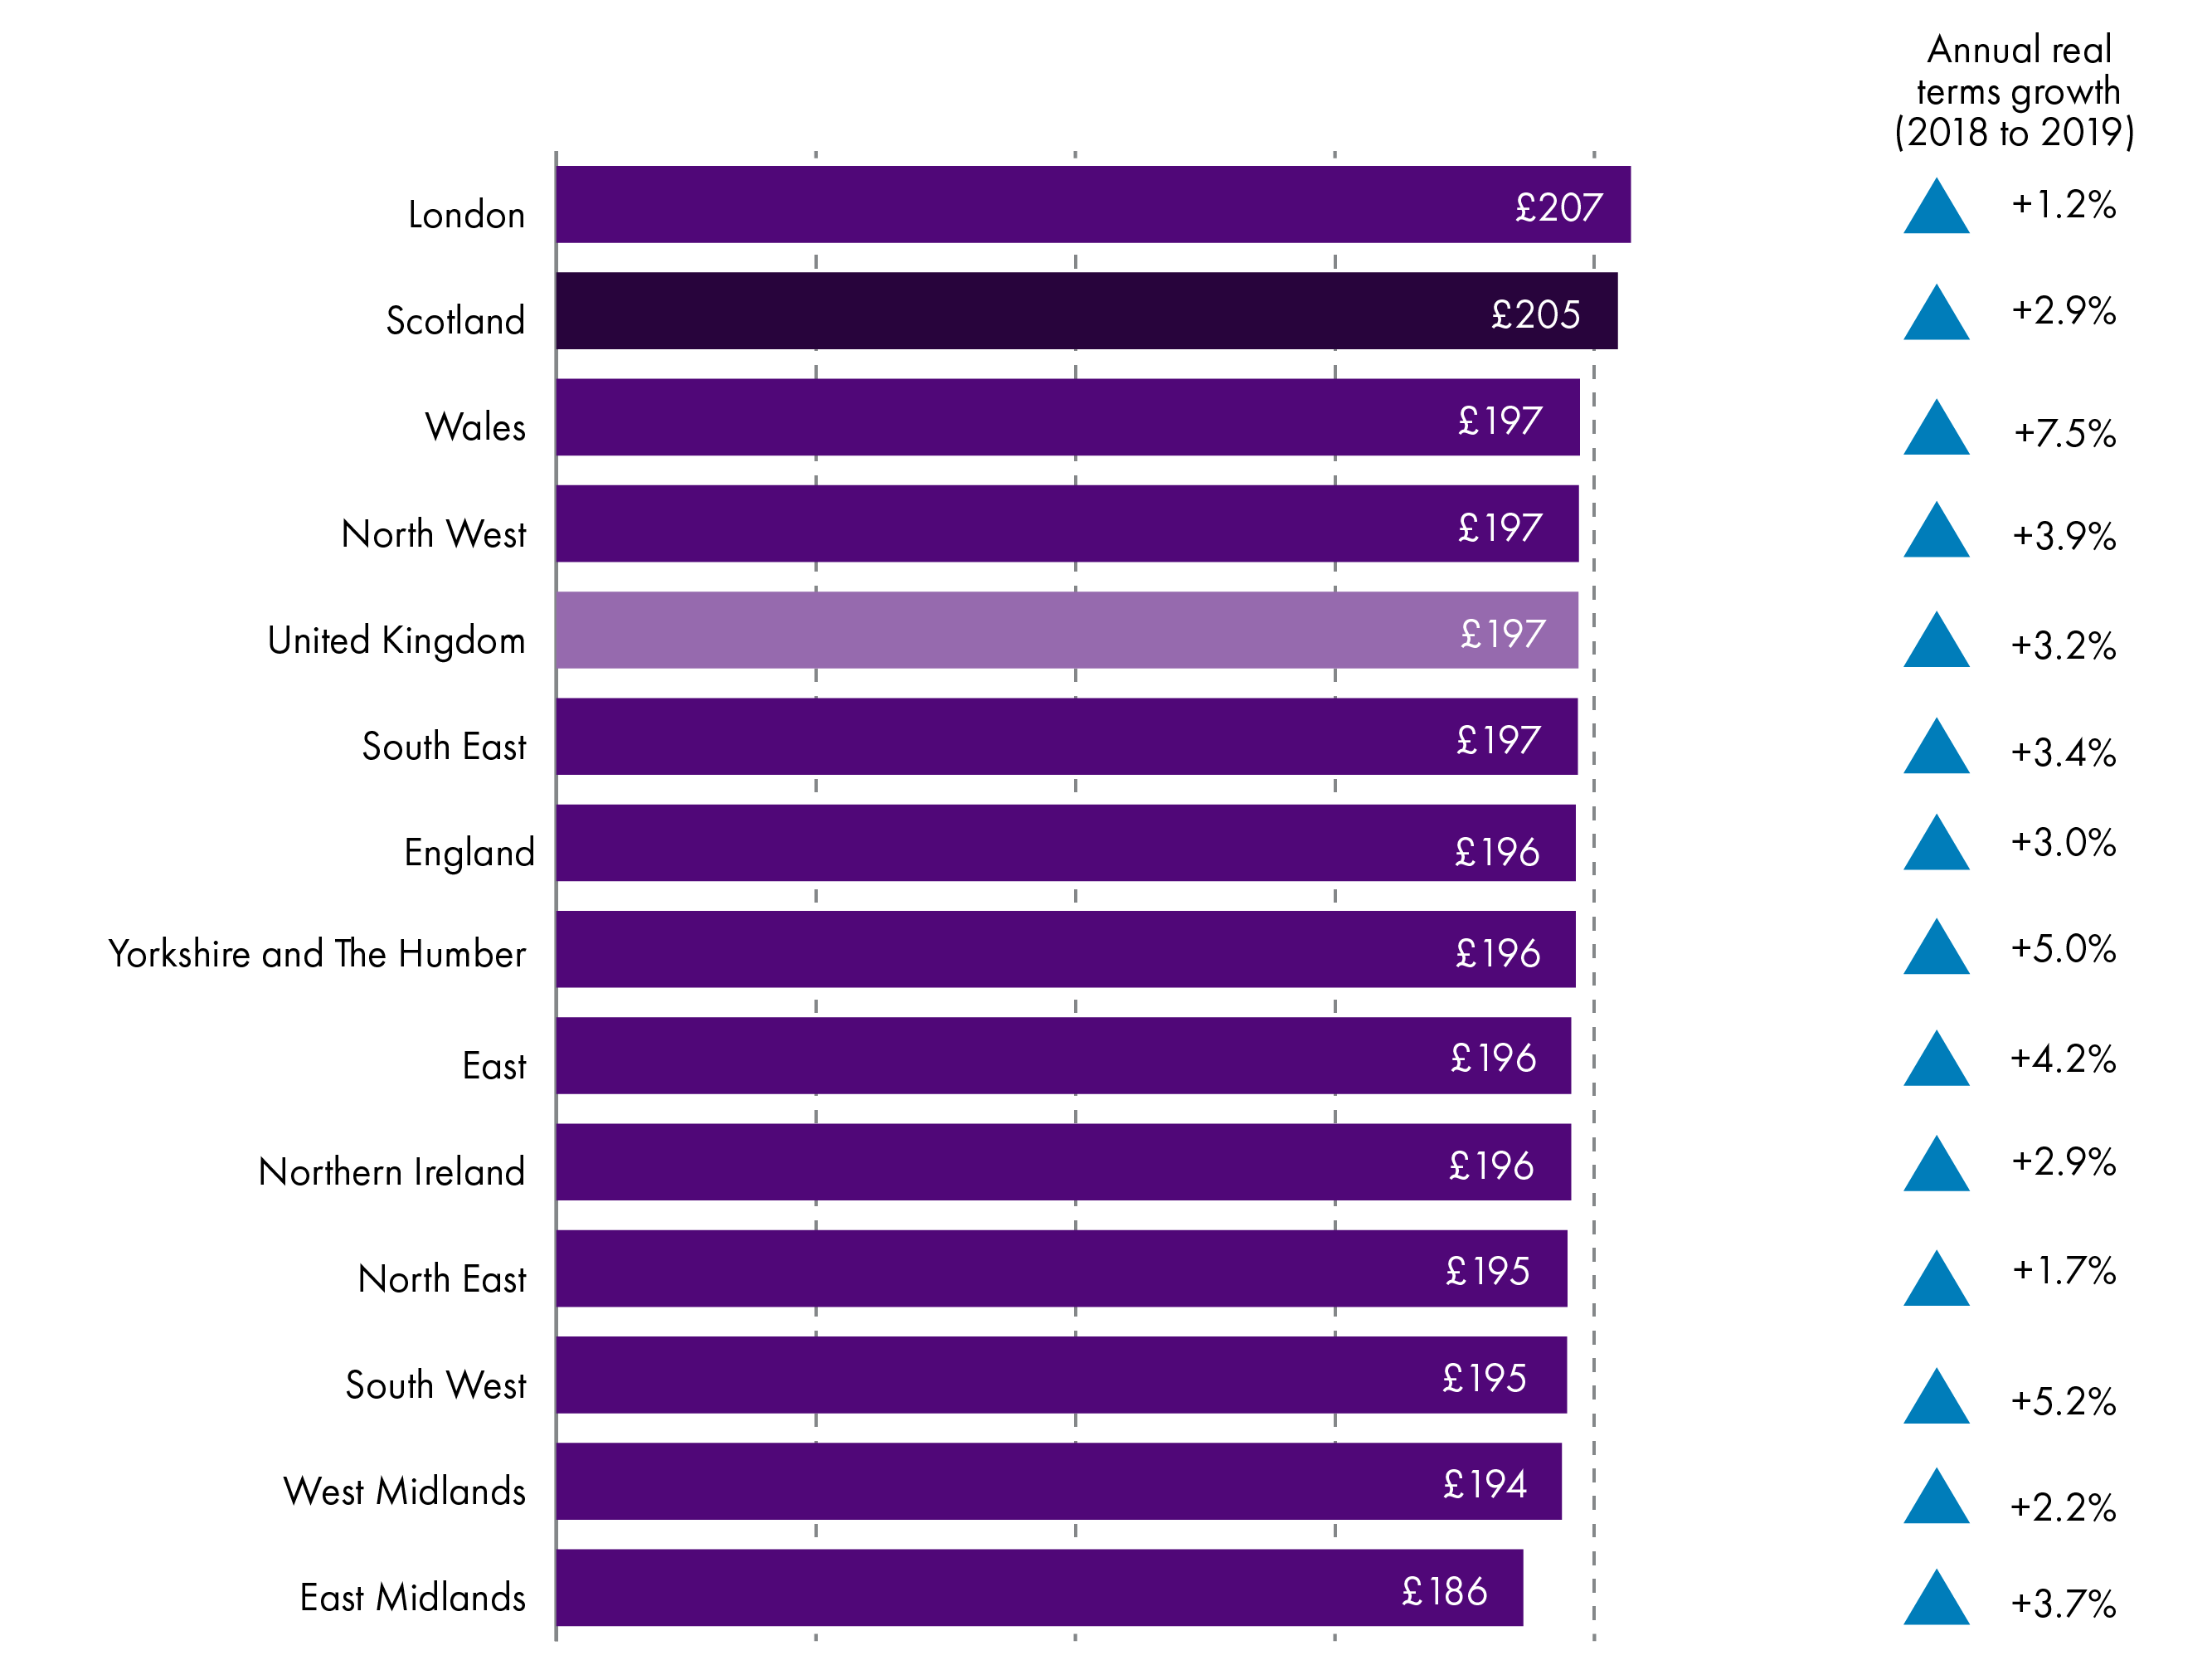
In Scotland 27% of people work part-time. Women make up the majority (76%) of those working part-time. In April 2019 the median, or typical, gross weekly part-time salary in Scotland was £205. This is the highest outside London and shows a similar pattern to part-time salaries.
Over the year gross weekly pay for part-time employees in Scotland grew by 4.9%, which means wages grew by 2.9% in real terms. Wales saw the largest increase in real terms while London saw the lowest.
What does typical hourly pay look like in Scotland?
Unlike salaries, the analysis of hourly pay doesn't require a person to have been in the same job for a year. It relates to employees whose earnings for the survey pay period were not affected by absence.
Figure 8: Hourly pay excluding overtime for all employees by region and nation of the UK - 2019
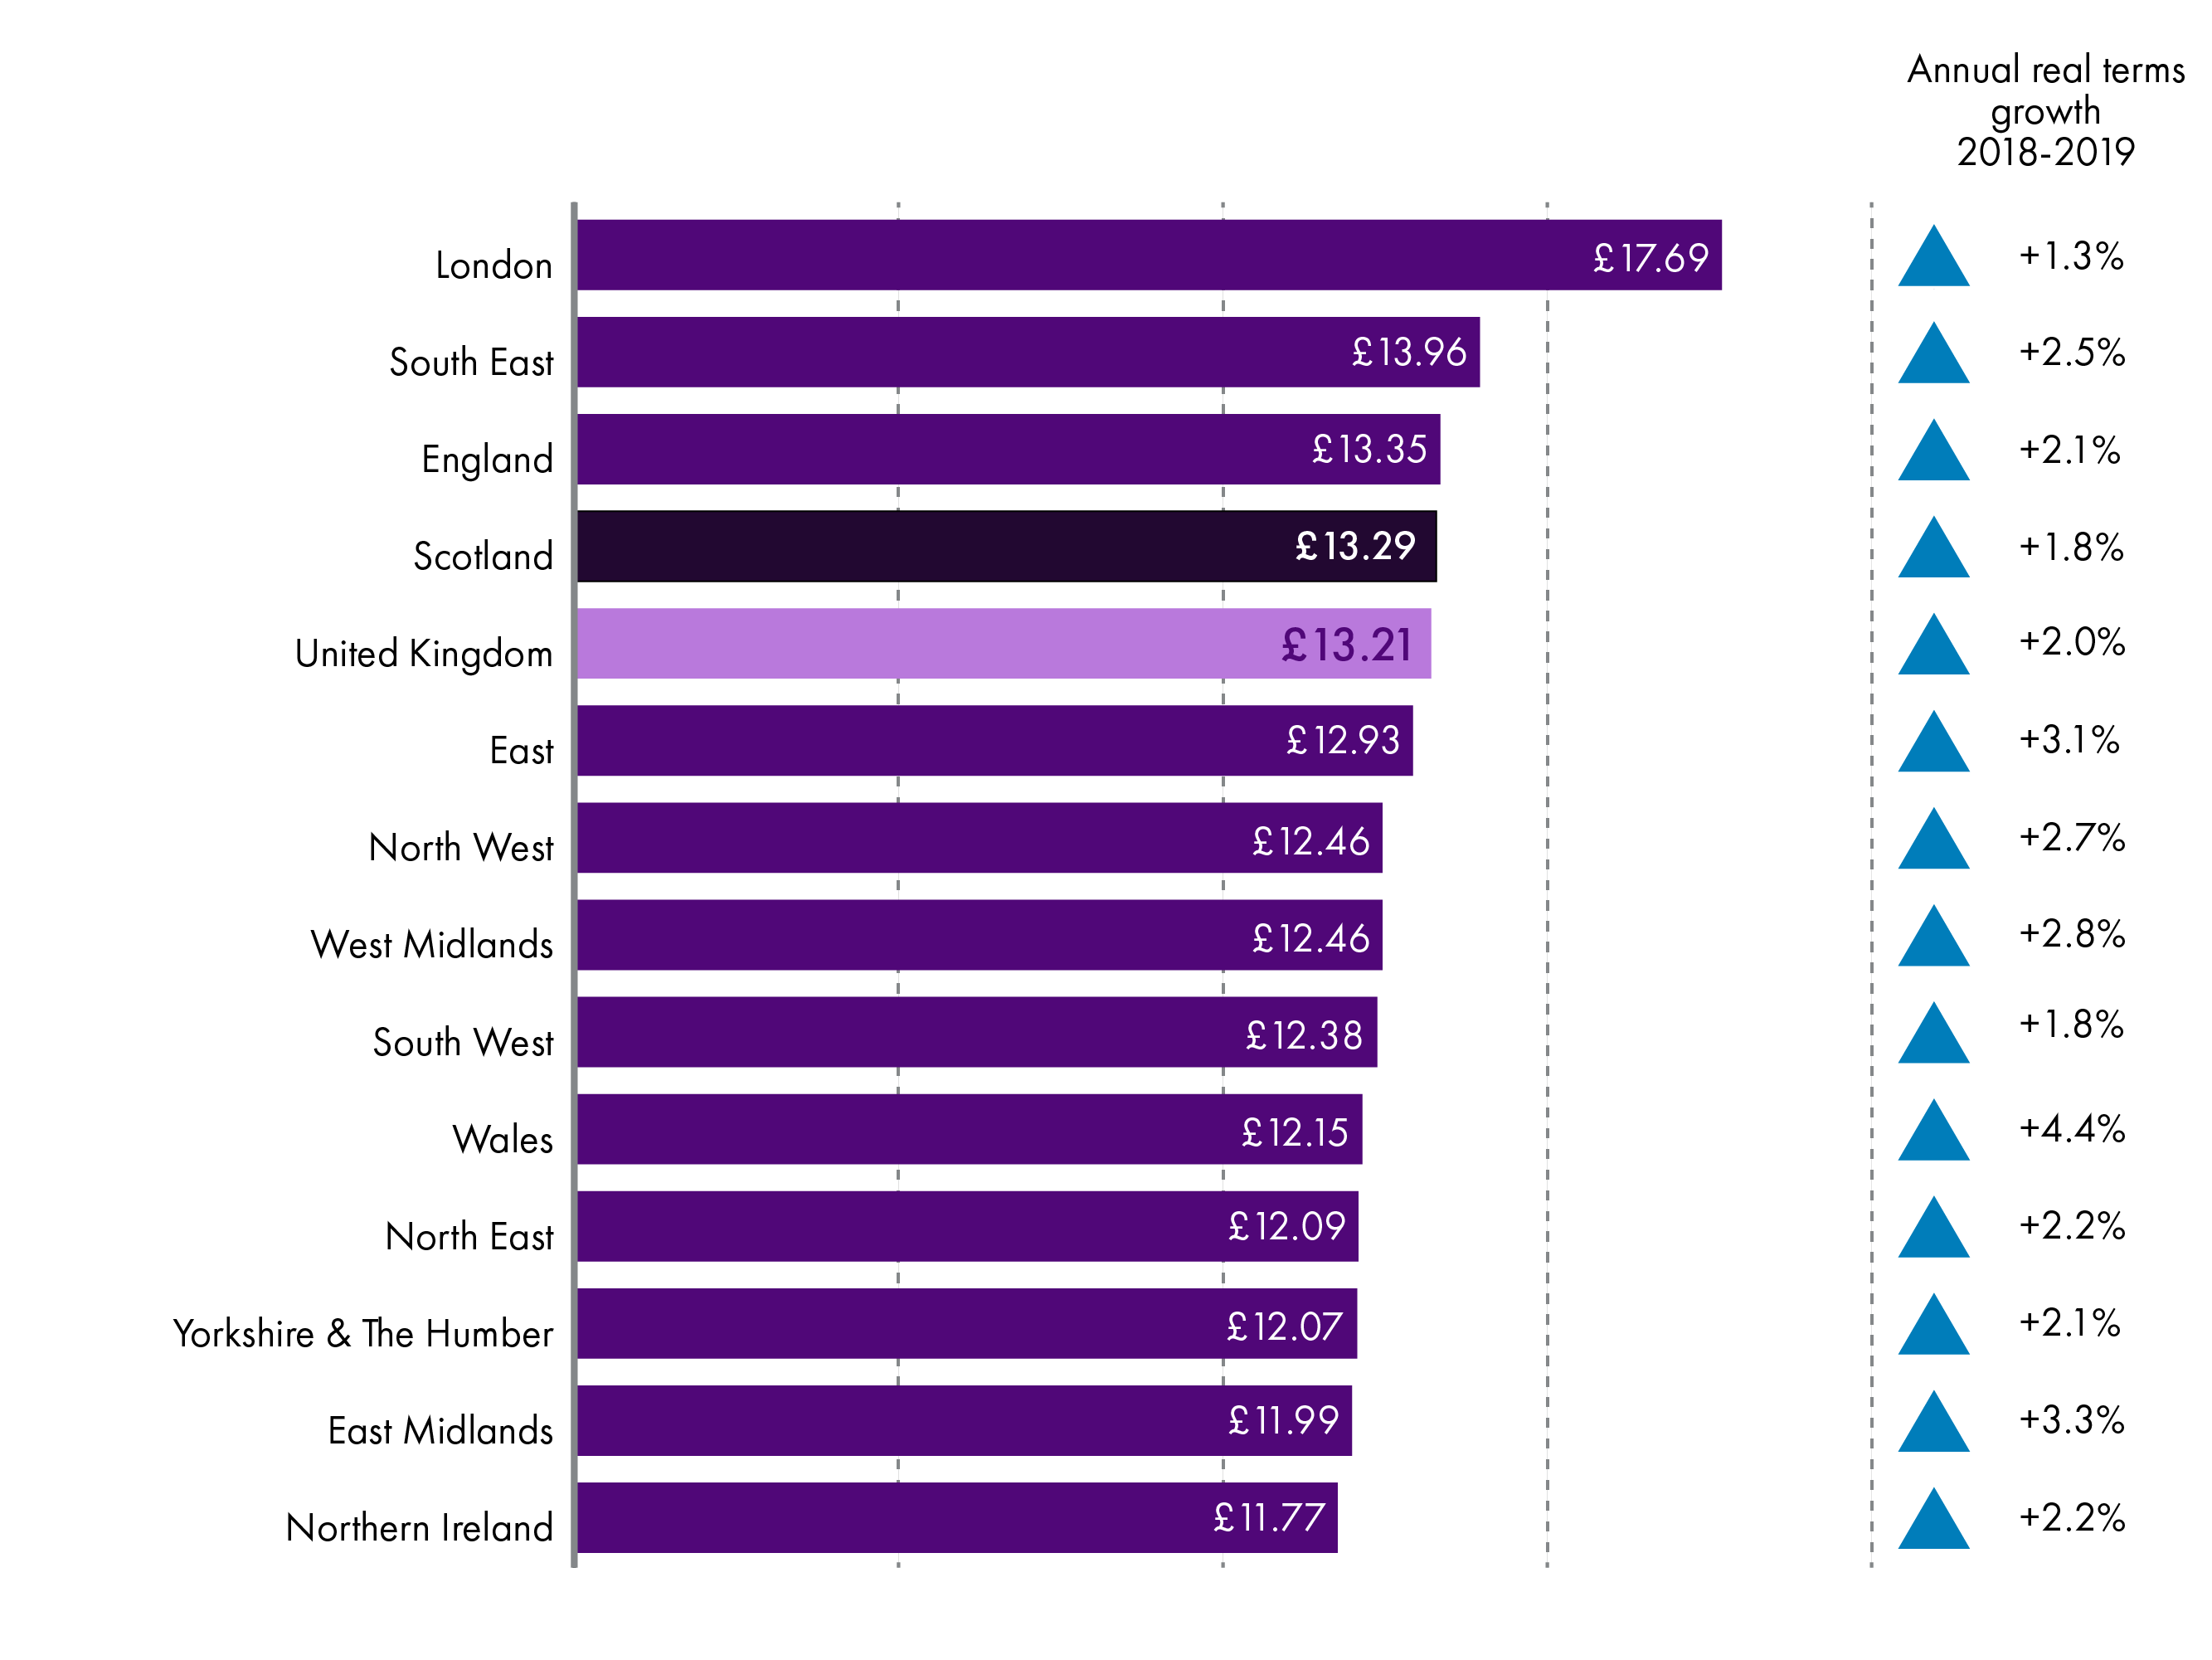
The hourly rate excluding overtime in Scotland was £13.29. This is just above the UK wide figure (£13.21) and is the highest outside London and the South East, but lower than the overall England figure.
Every region and nation of the UK saw real terms growth in wages. Wales saw the highest growth, 4.4% in real terms, over the year while London saw to lowest, 1.3%.
What does typical full-time hourly pay look like in Scotland?
Figure 9: Hourly pay excluding overtime for full-time employees by region and nation of the UK - 2019
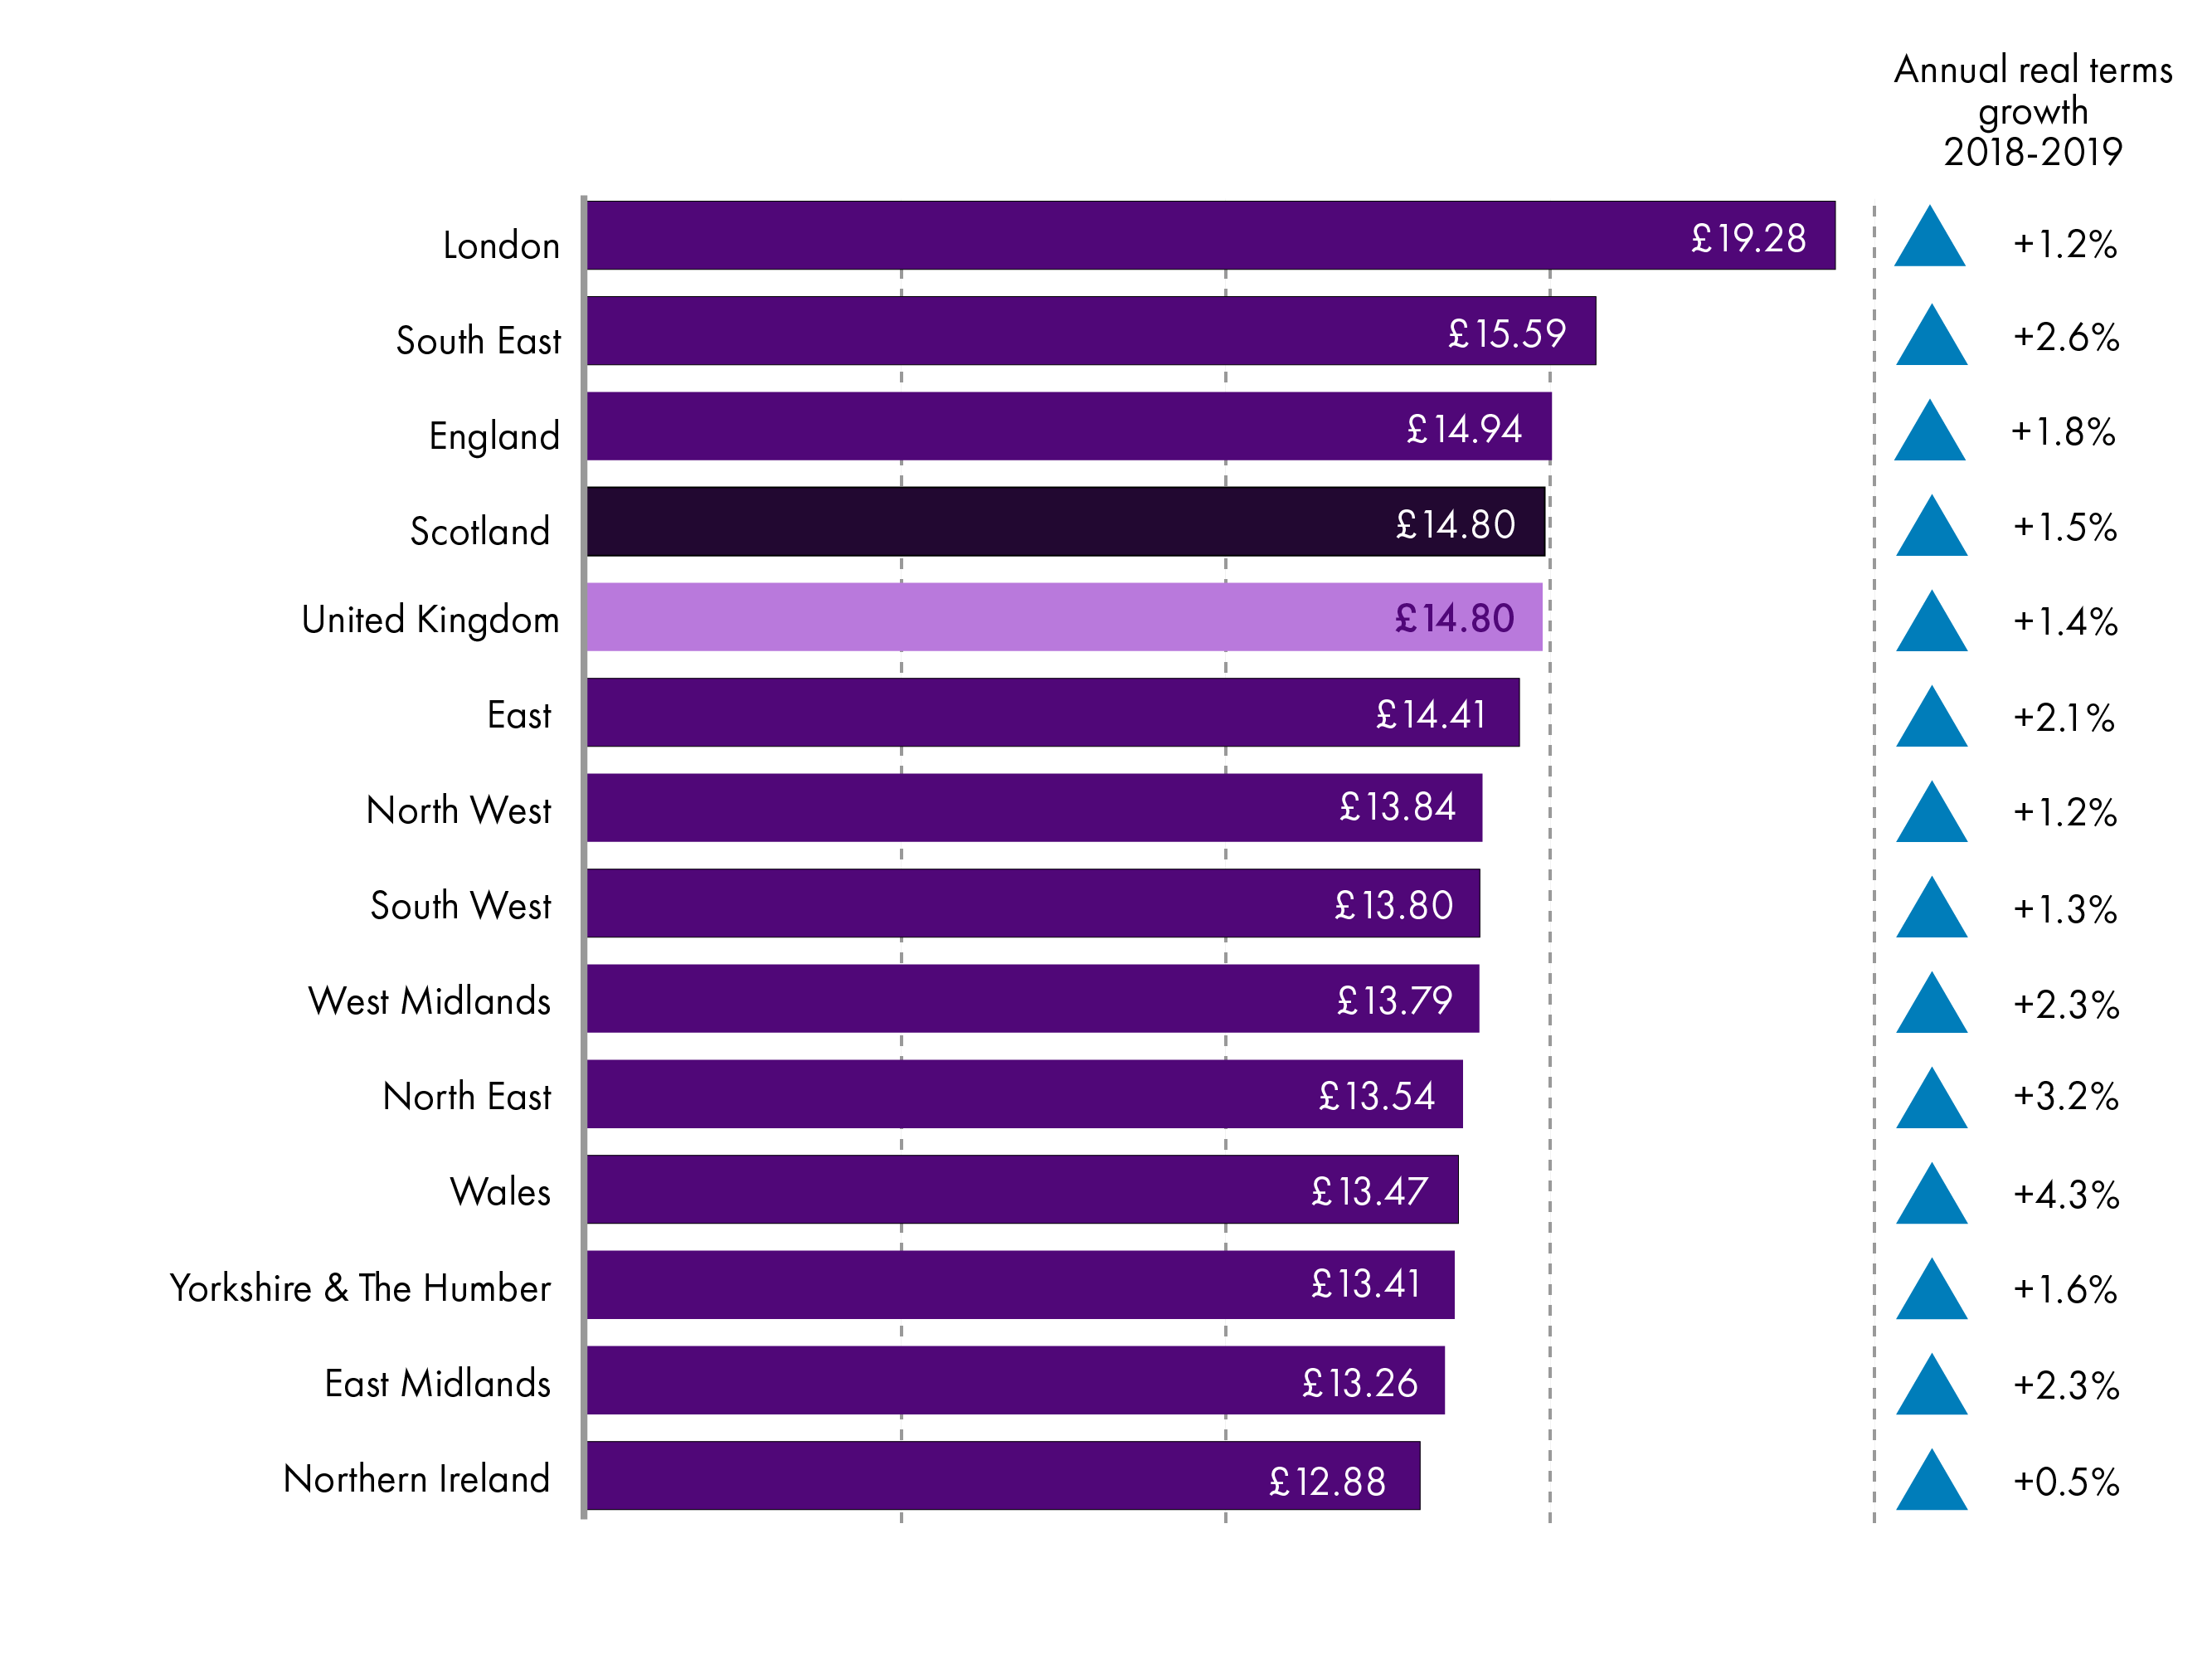
In Scotland 73% of people work full-time. Men make up the majority (61%) of those working full-time.
The hourly rate excluding overtime for full-time employees in Scotland was £14.80. This is the same as the UK wide figure and is the highest outside London and the South East, but lower than the overall England figure. This is the same pattern as for hourly pay for all employees. .
Every region and nation of the UK saw real terms growth in wages. Wales saw the highest growth, 4.3% in real terms, over the year while Northern Ireland saw to lowest, 0.5%.
What does typical part-time hourly pay look like in Scotland?
Figure 10: Hourly pay excluding overtime for part-time employees by region and nation of the UK - 2019
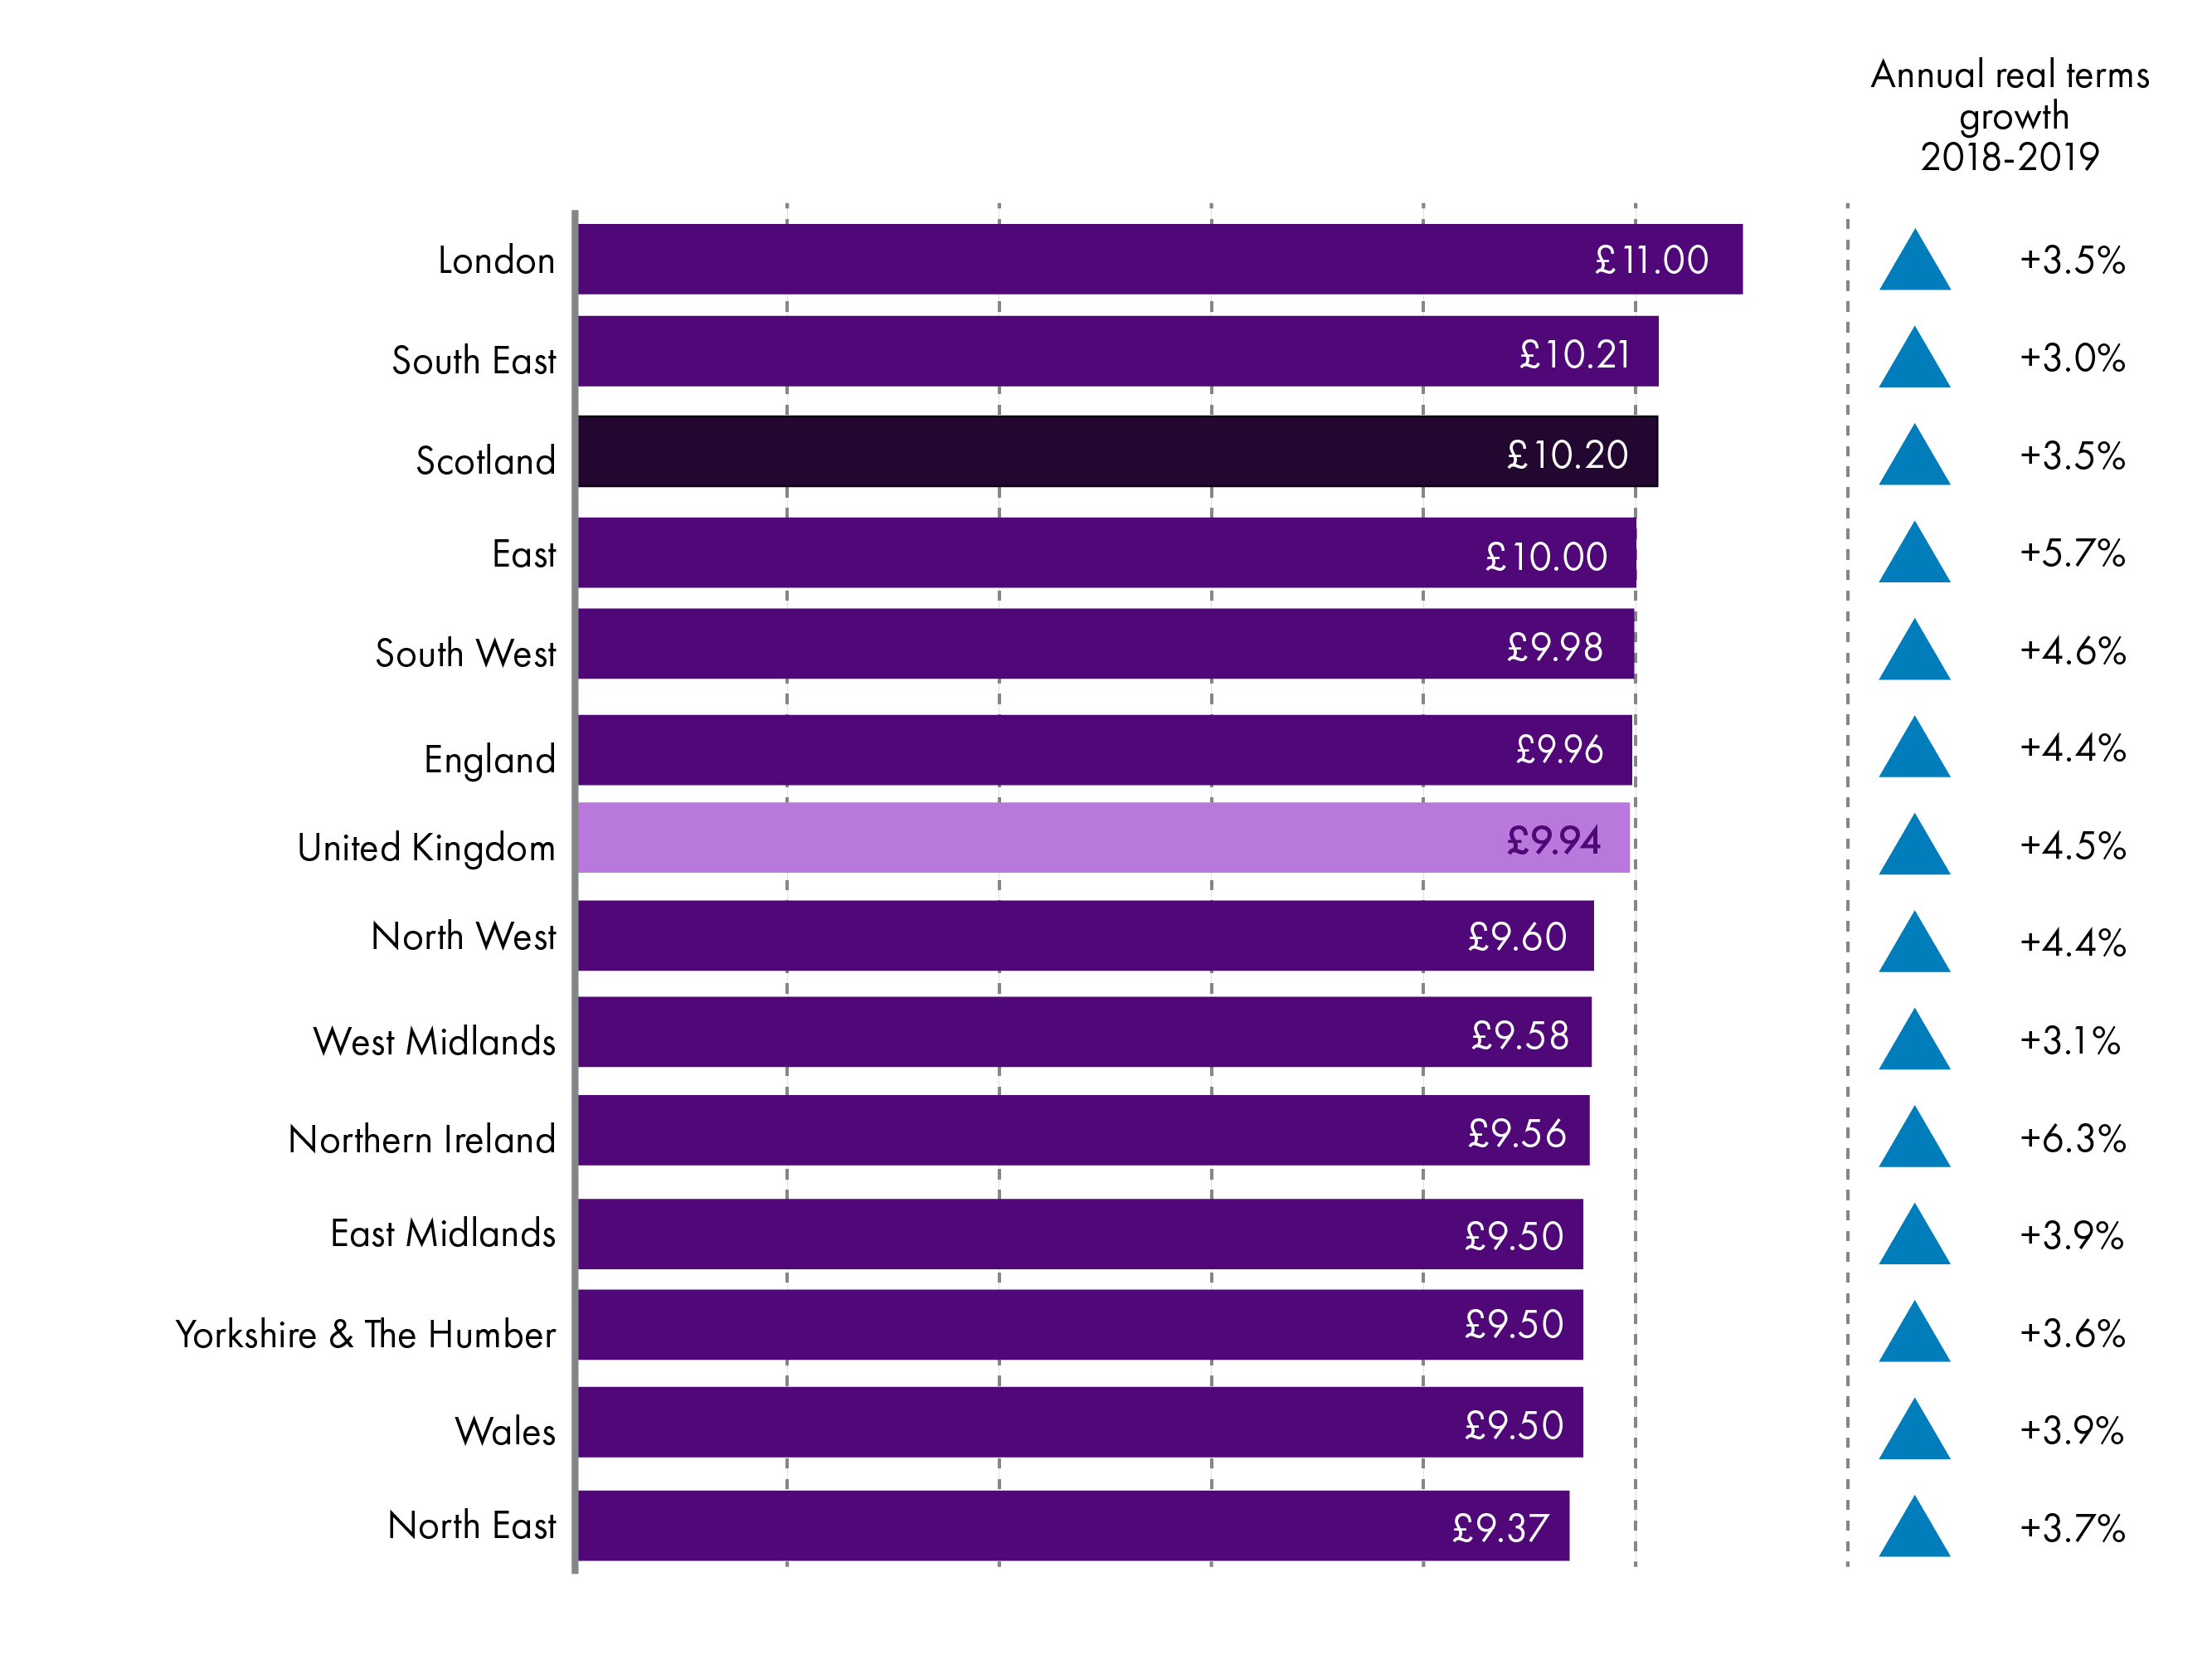
In Scotland 27% of people work part-time. Women make up the majority (76%) of those working part-time.
The hourly rate excluding overtime for part-time employees in Scotland was £10.20. This is higher than the UK wide figure (£9.94) and is the highest outside London and the South East.
Every region and nation of the UK saw real terms growth in wages. Northern Ireland saw the highest growth, 6.3% in real terms, over the year while the South East saw to lowest, 3.0%.
Pay by place of residence and implications for the Scottish budget
ASHE also provides information on pay by place of residence. This allows us to look at what pay looks like for those who live in Scotland as distinct from those who work in Scotland. This is important as Scottish income tax comes from those who live in Scotland rather than work here.
While the data is estimated and doesn't include information on earnings for the self-employed, it allows us to get an idea of the earnings distribution and the potential implication for income tax revenues.
This section looks at gross annual pay for all employees by place of residence. We have compared Scotland with the UK and with England and Wales. This allows for comparison with the area which represents the majority of the rest of the UK (rUK), excluding Northern Ireland, and the UK overall.
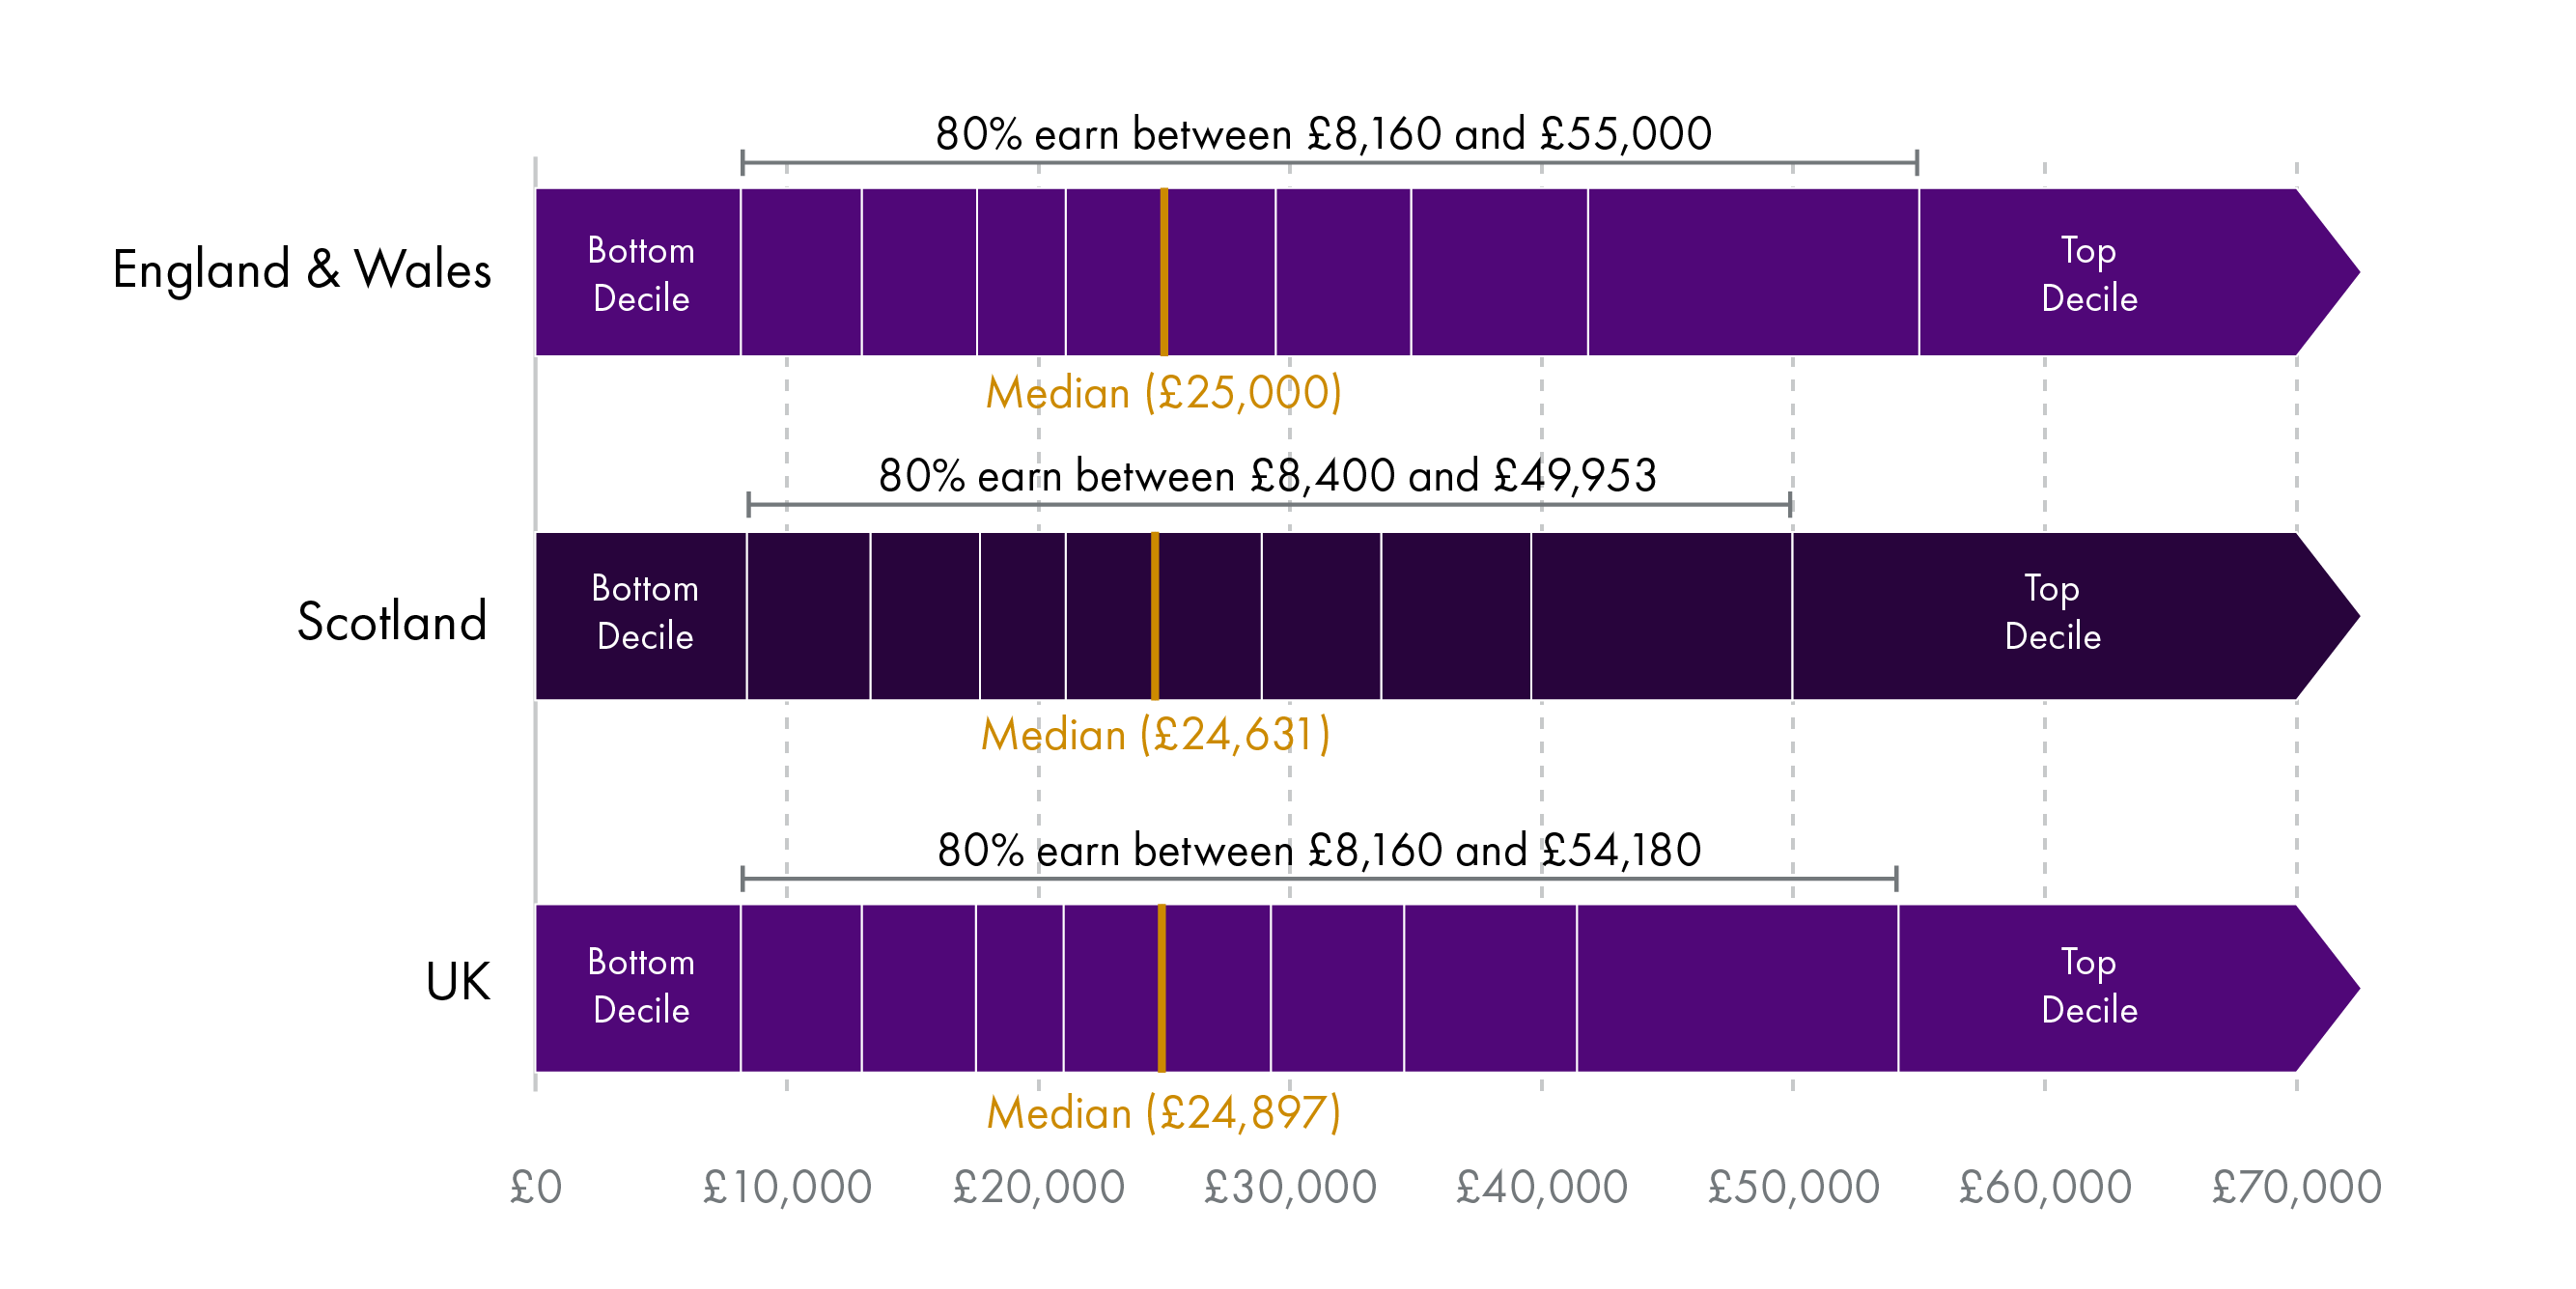
The median pay for those who live in Scotland is similar to the pay for those who live in England and Wales and the UK overall. As Scotland has a higher threshold for the bottom decile and a lower threshold for the top 10% of earners, it has a narrower distribution of earners than England and Wales and the UK overall.
Growth in pay by place of residence in Scotland, the UK and England and Wales
Figure 12: Growth in gross annual pay for selected decile thresholds between 2016 and 2019
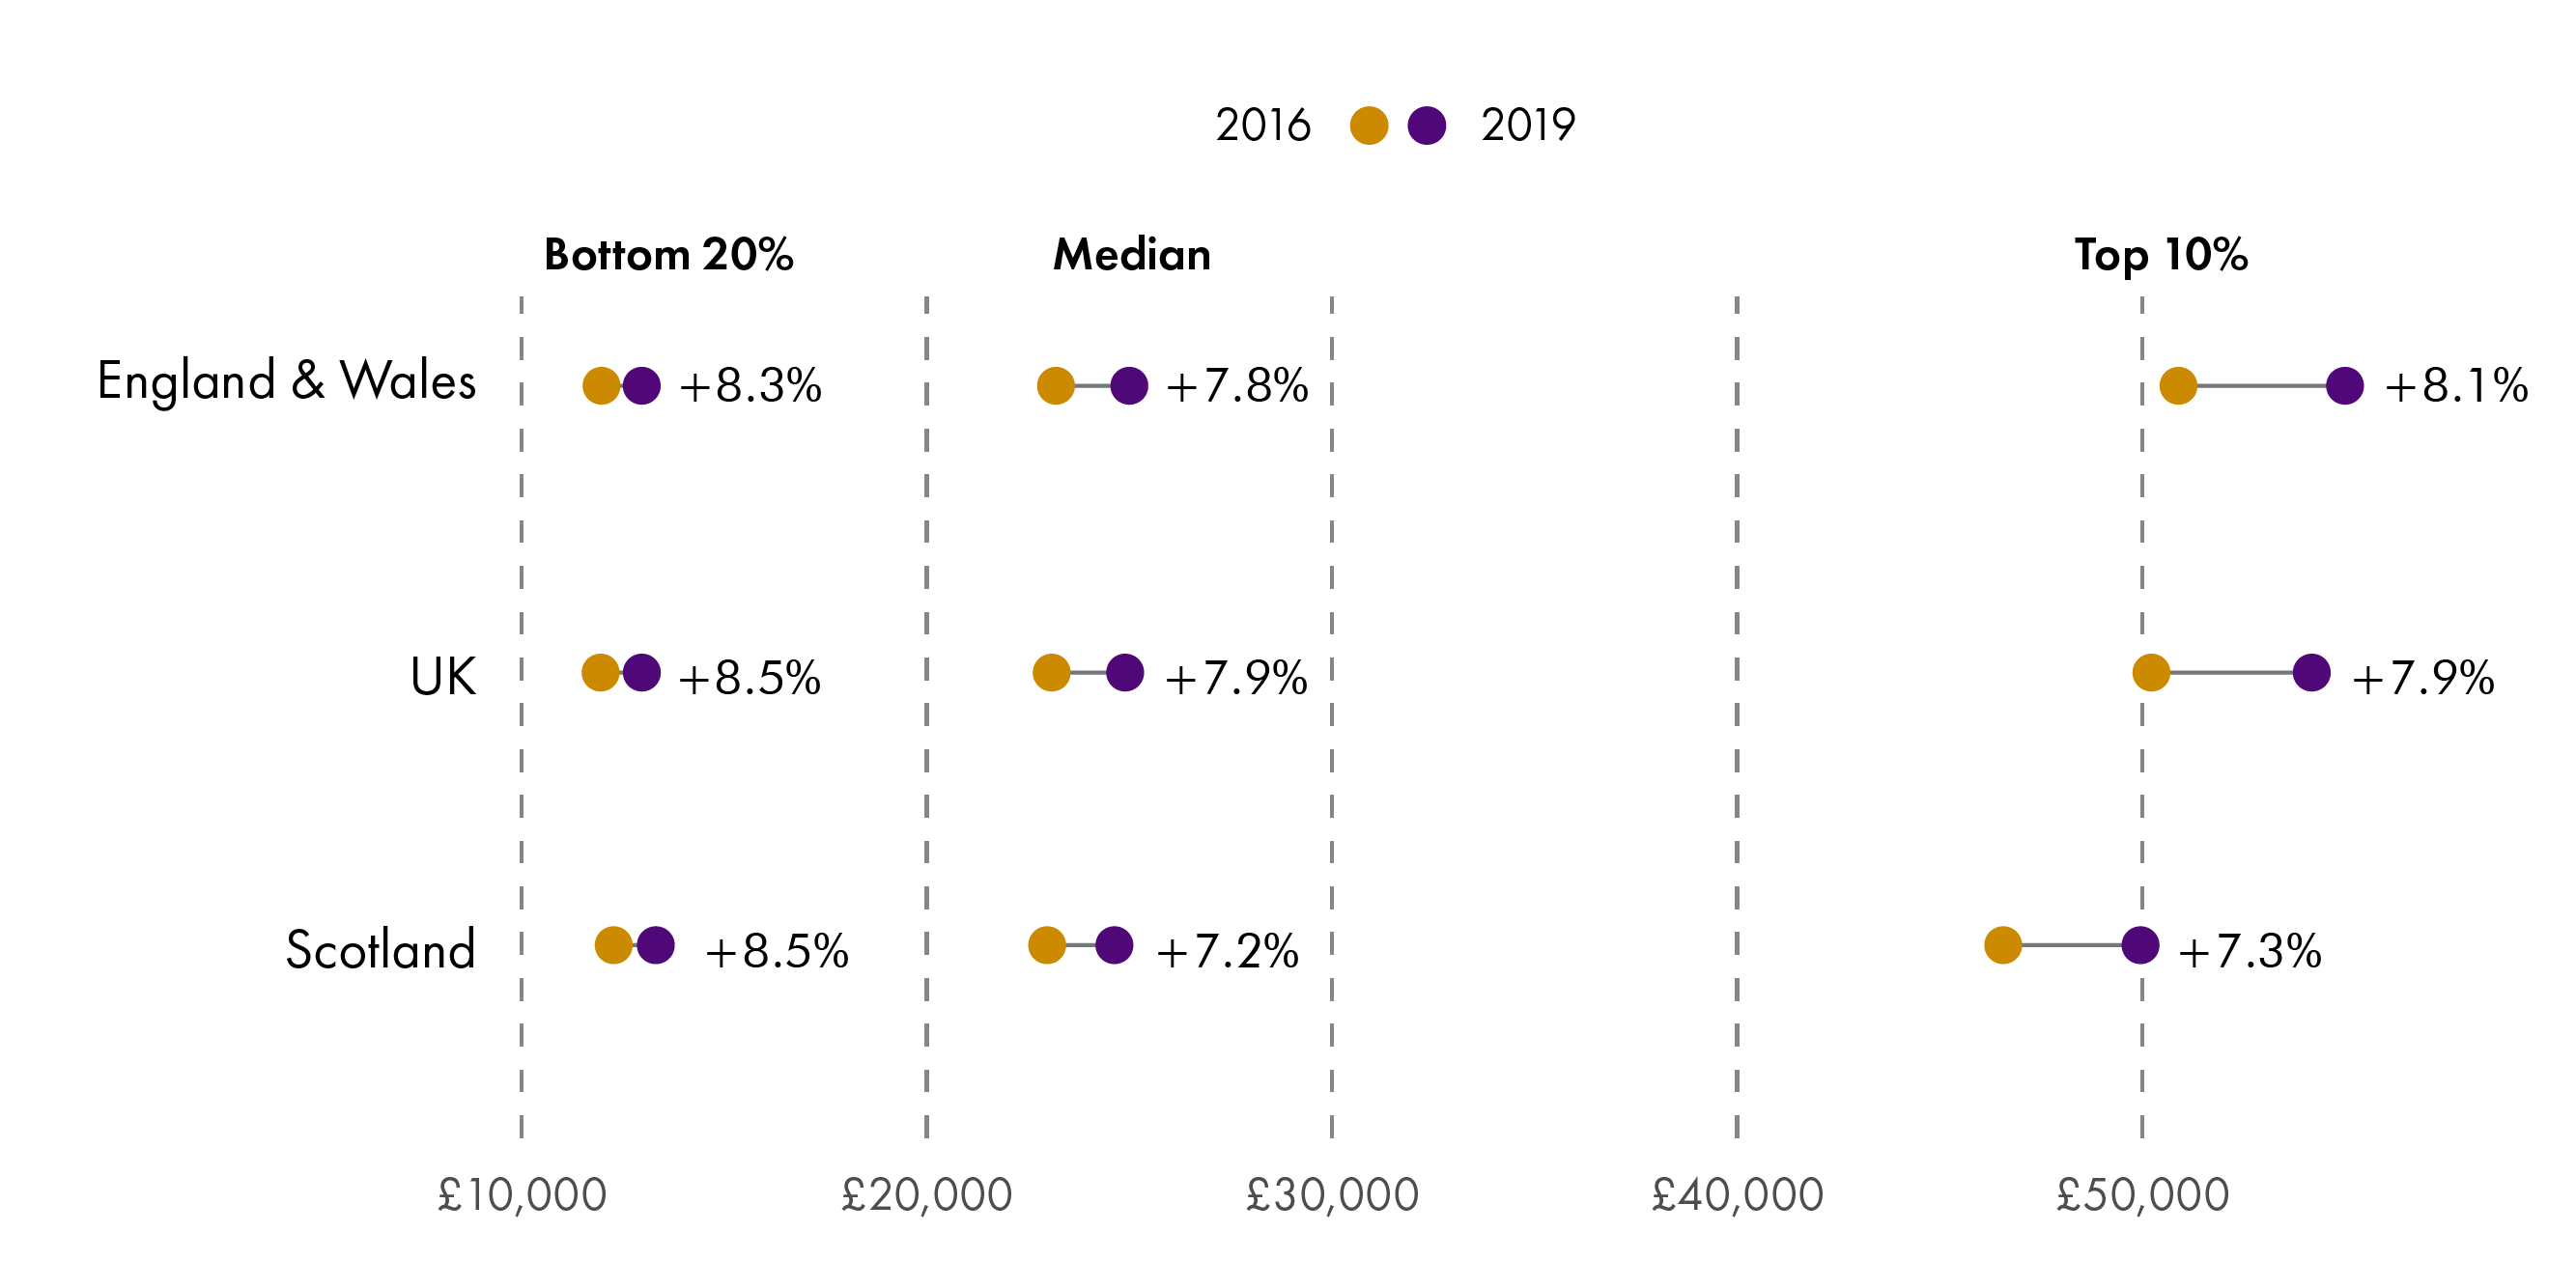
The threshold for the bottom 20% in Scotland has increased 8.5% between 2016 and 2019, which is the same as the UK overall, while England and Wales increased by 8.3%. The bottom 20% threshold in Scotland is also slightly higher than both the UK and England and Wales.
The threshold for the top 10% of earners in Scotland is lower than the UK and England and Wales, £49,953 compared to £54,180 and £55,000 respectively. The Scottish threshold has also grown at a slower rate than the UK and England and Wales, 7.3% compared to 7.9% and 8.1% respectively.
Growth in pay by place of residence in Scotland, the UK and England and Wales for the top 10% of earners
Figure 13: Threshold for the top 10 % of gross annual pay for all employees in 2016 and 2019 by area of residence
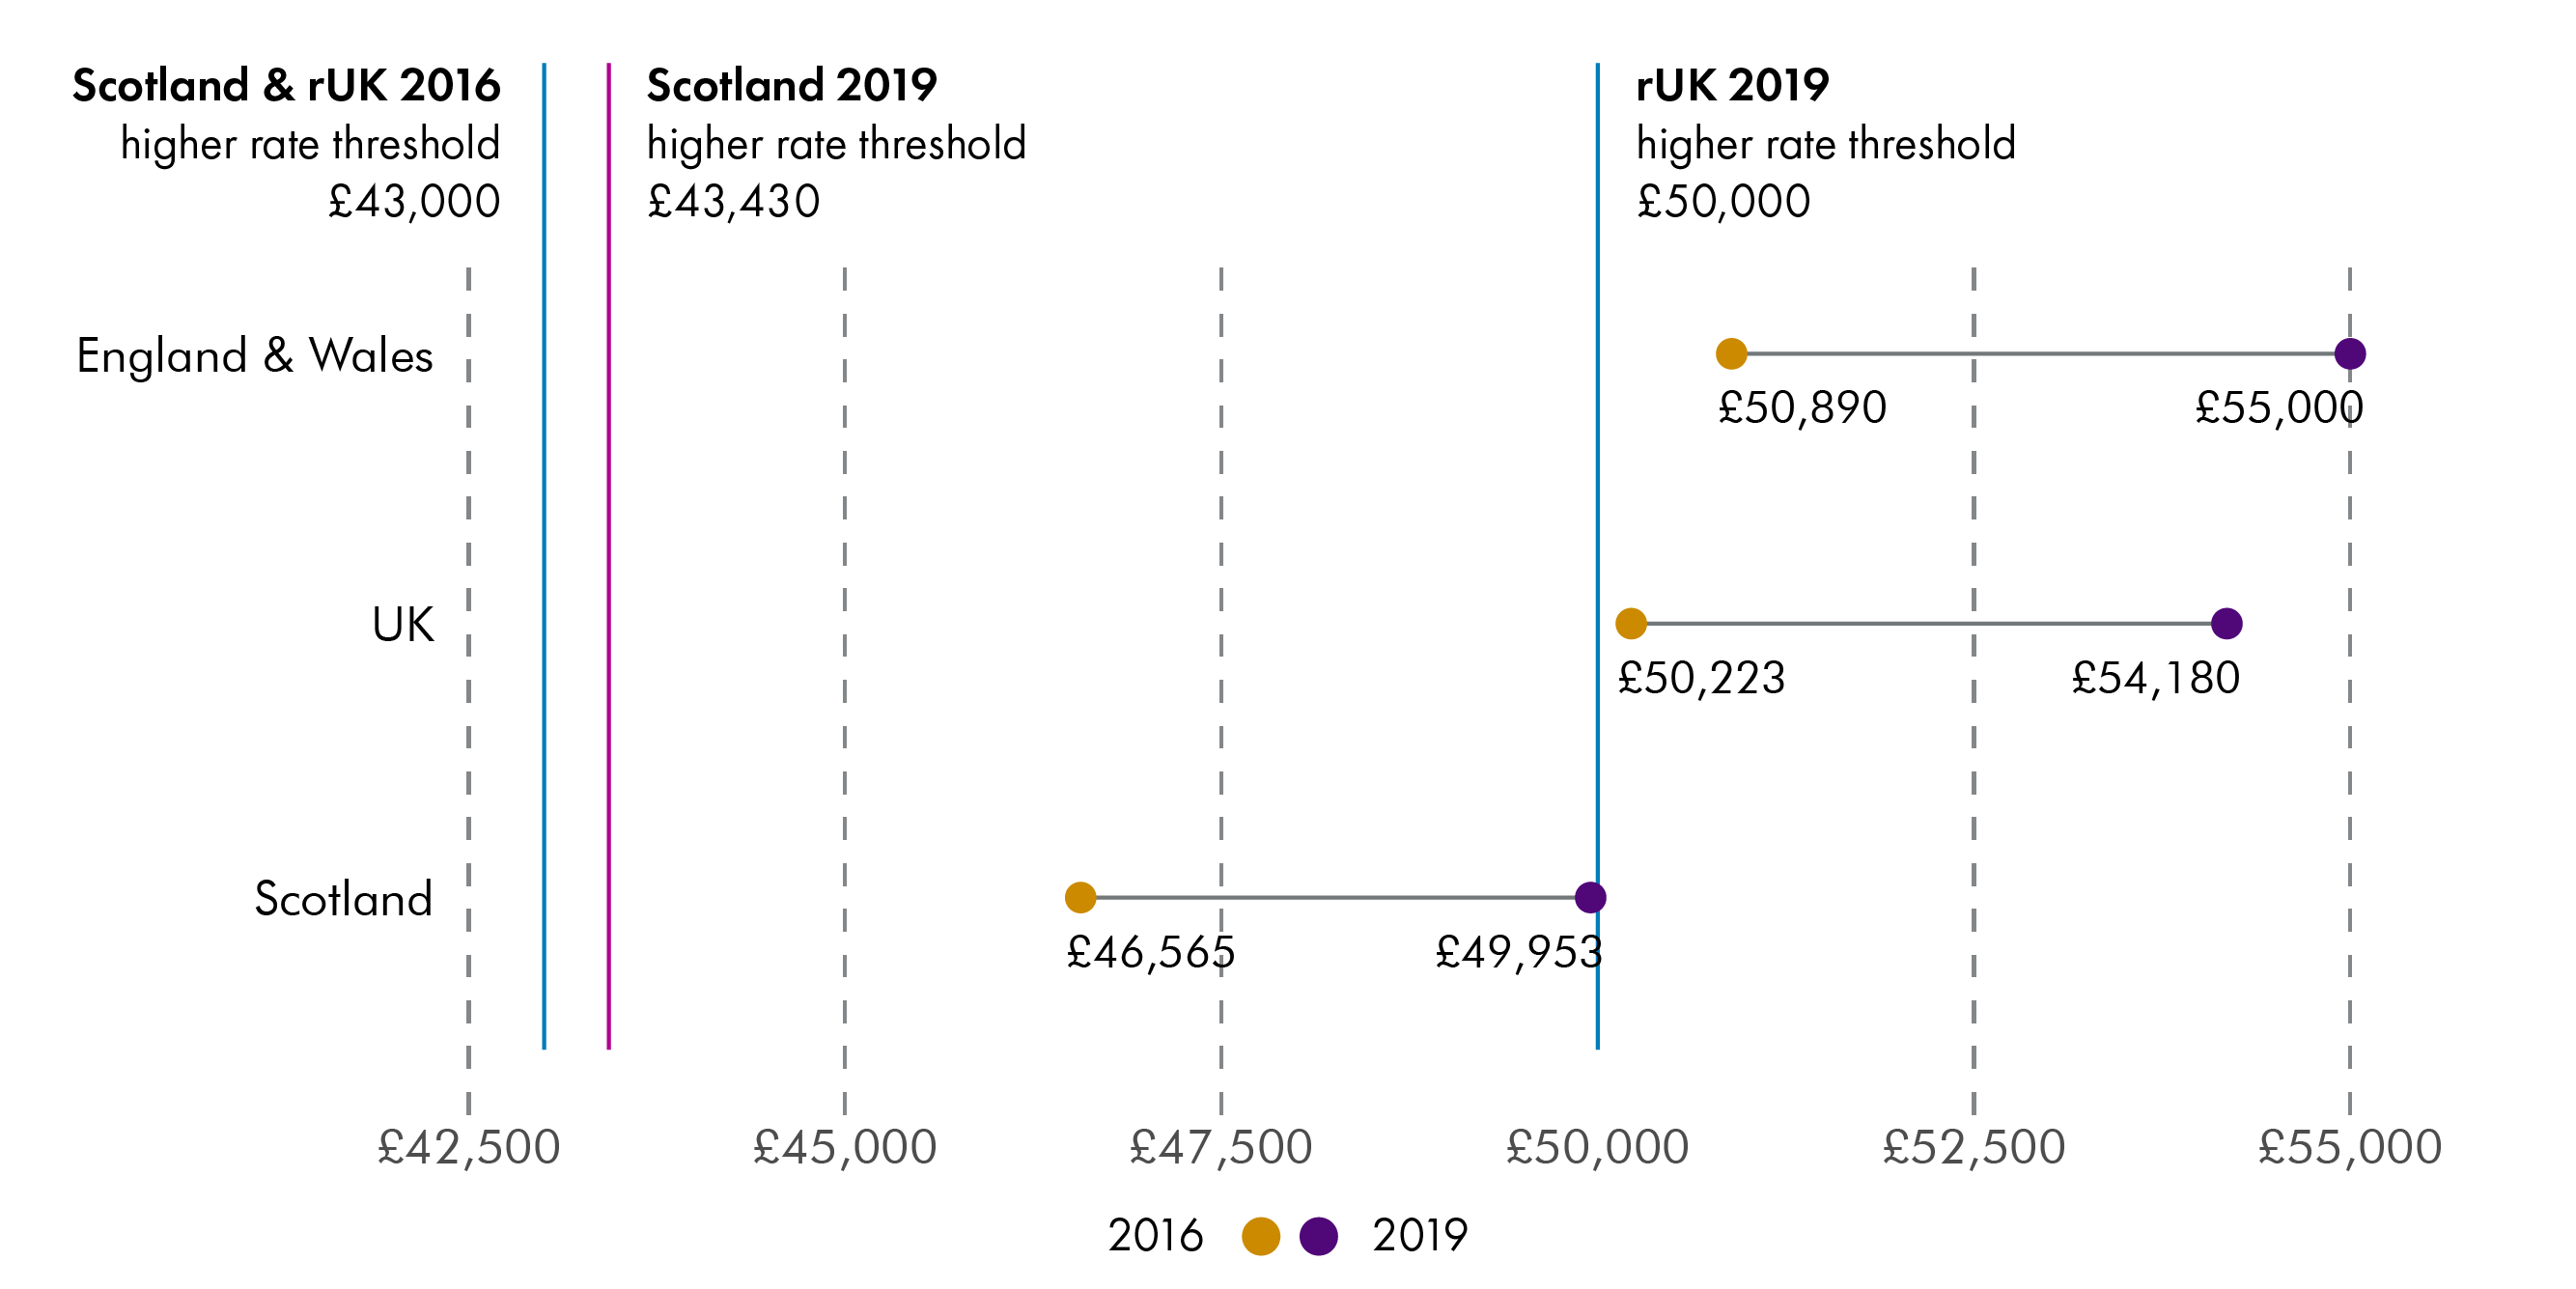
Figure 13 shows how growth in the threshold of the top 10% of earners has changed in Scotland and England and Wales and the UK and the change in the rUK and Scottish higher rate tax threshold.
While the rUK threshold for higher rate tax has increased from £43,000 to £50,000 between 2016 and 2019 the Scottish threshold has increased from £43,000 to £43,430. Despite Scotland having seen slower growth in the threshold for the top 10% of earners, this growth has outstripped the growth in the tax threshold in Scotland for higher rate tax. This would suggest that Scotland has a higher proportion of employees covered by the higher rate of tax than the rest of the UK.
This is reflected in the latest UK Income Tax Liabilities Statistics from HMRC. They estimate that in 2019-20 15% of taxpayers in Scotland will be paying the Higher rate of tax compared to 12% for the rest of the UK, this increases to 16% and 13% when including Additional rate Tax payers.
With non-savings, non dividend income tax receipts now underpinning the Scottish budget, the Scottish Government when setting rates and bands will need to carefully consider how earnings growth at different points of the income distribution might impact on growth in overall Scottish income tax revenues.
How has pay changed over time?
This section looks at how wages in Scotland and the UK have changed from 2011 to 2018. It looks at the gross weekly wages for those who live in Scotland. The real terms figures are calculated using the CPIH figure for April each year.
Figure 14: Median gross weekly pay in real terms for Scotland and the UK between 2011 and 2019
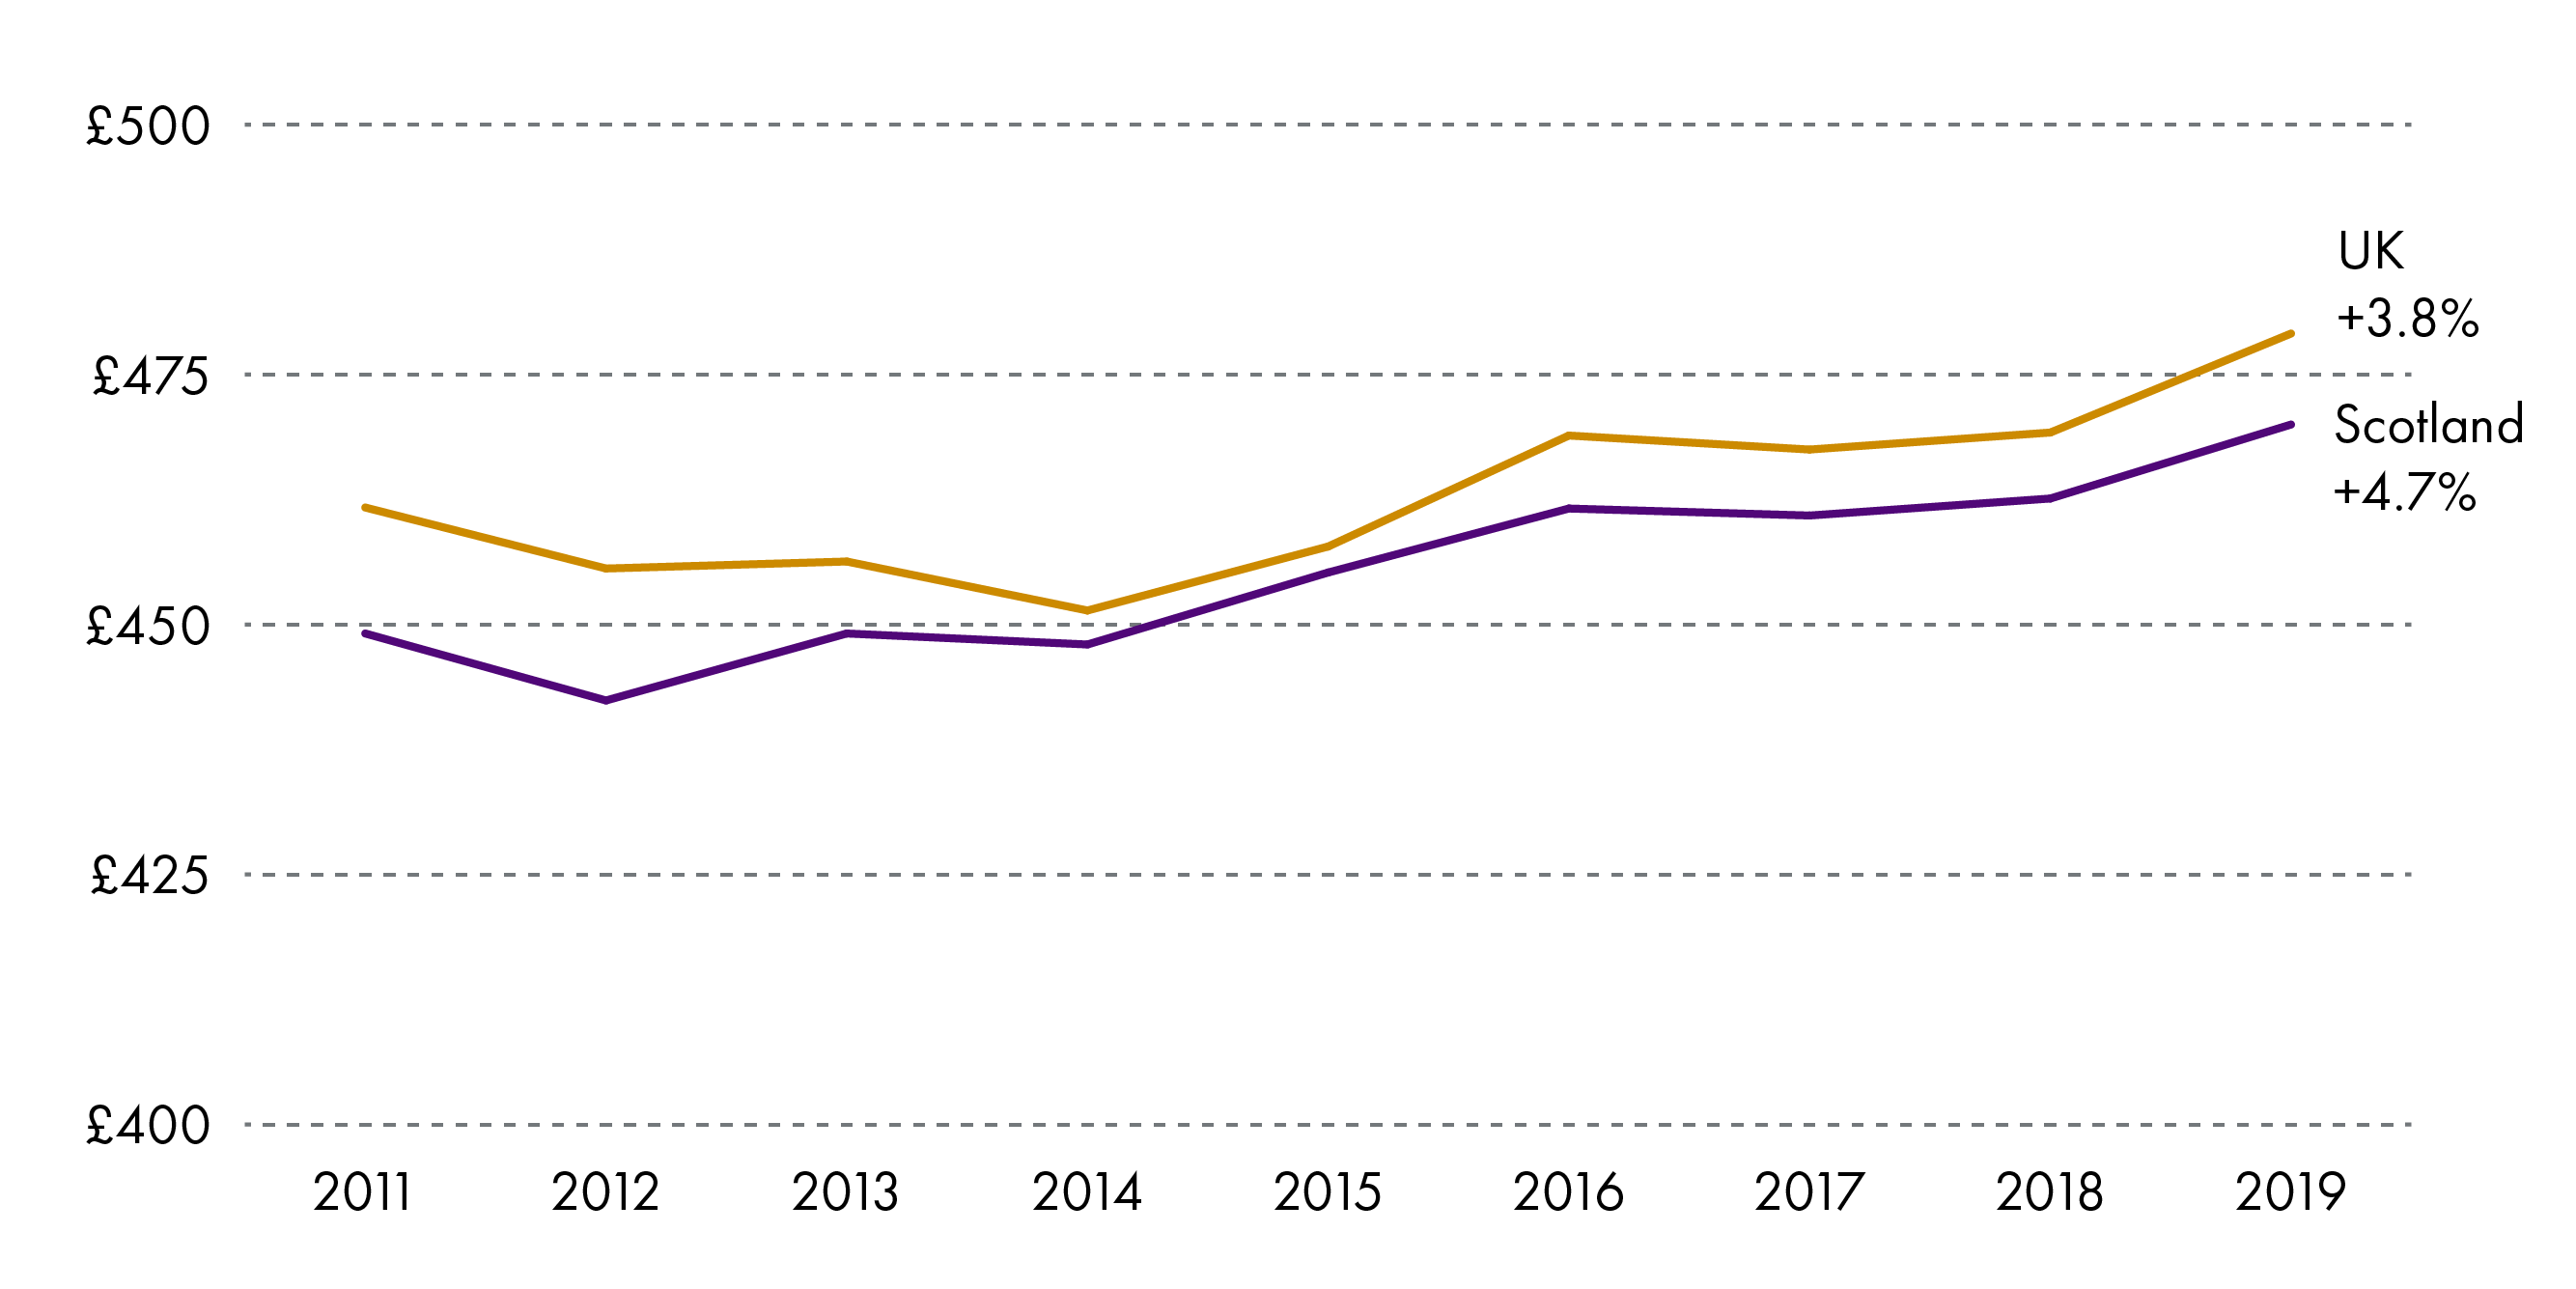
Scotland has seen slightly higher growth in real terms income than the UK , increasing by 4.7% compared to 3.8% between 2011 and 2018.
Figure 15: Growth in real terms income indexed to 2011 between 2011 and 2019 - Scotland
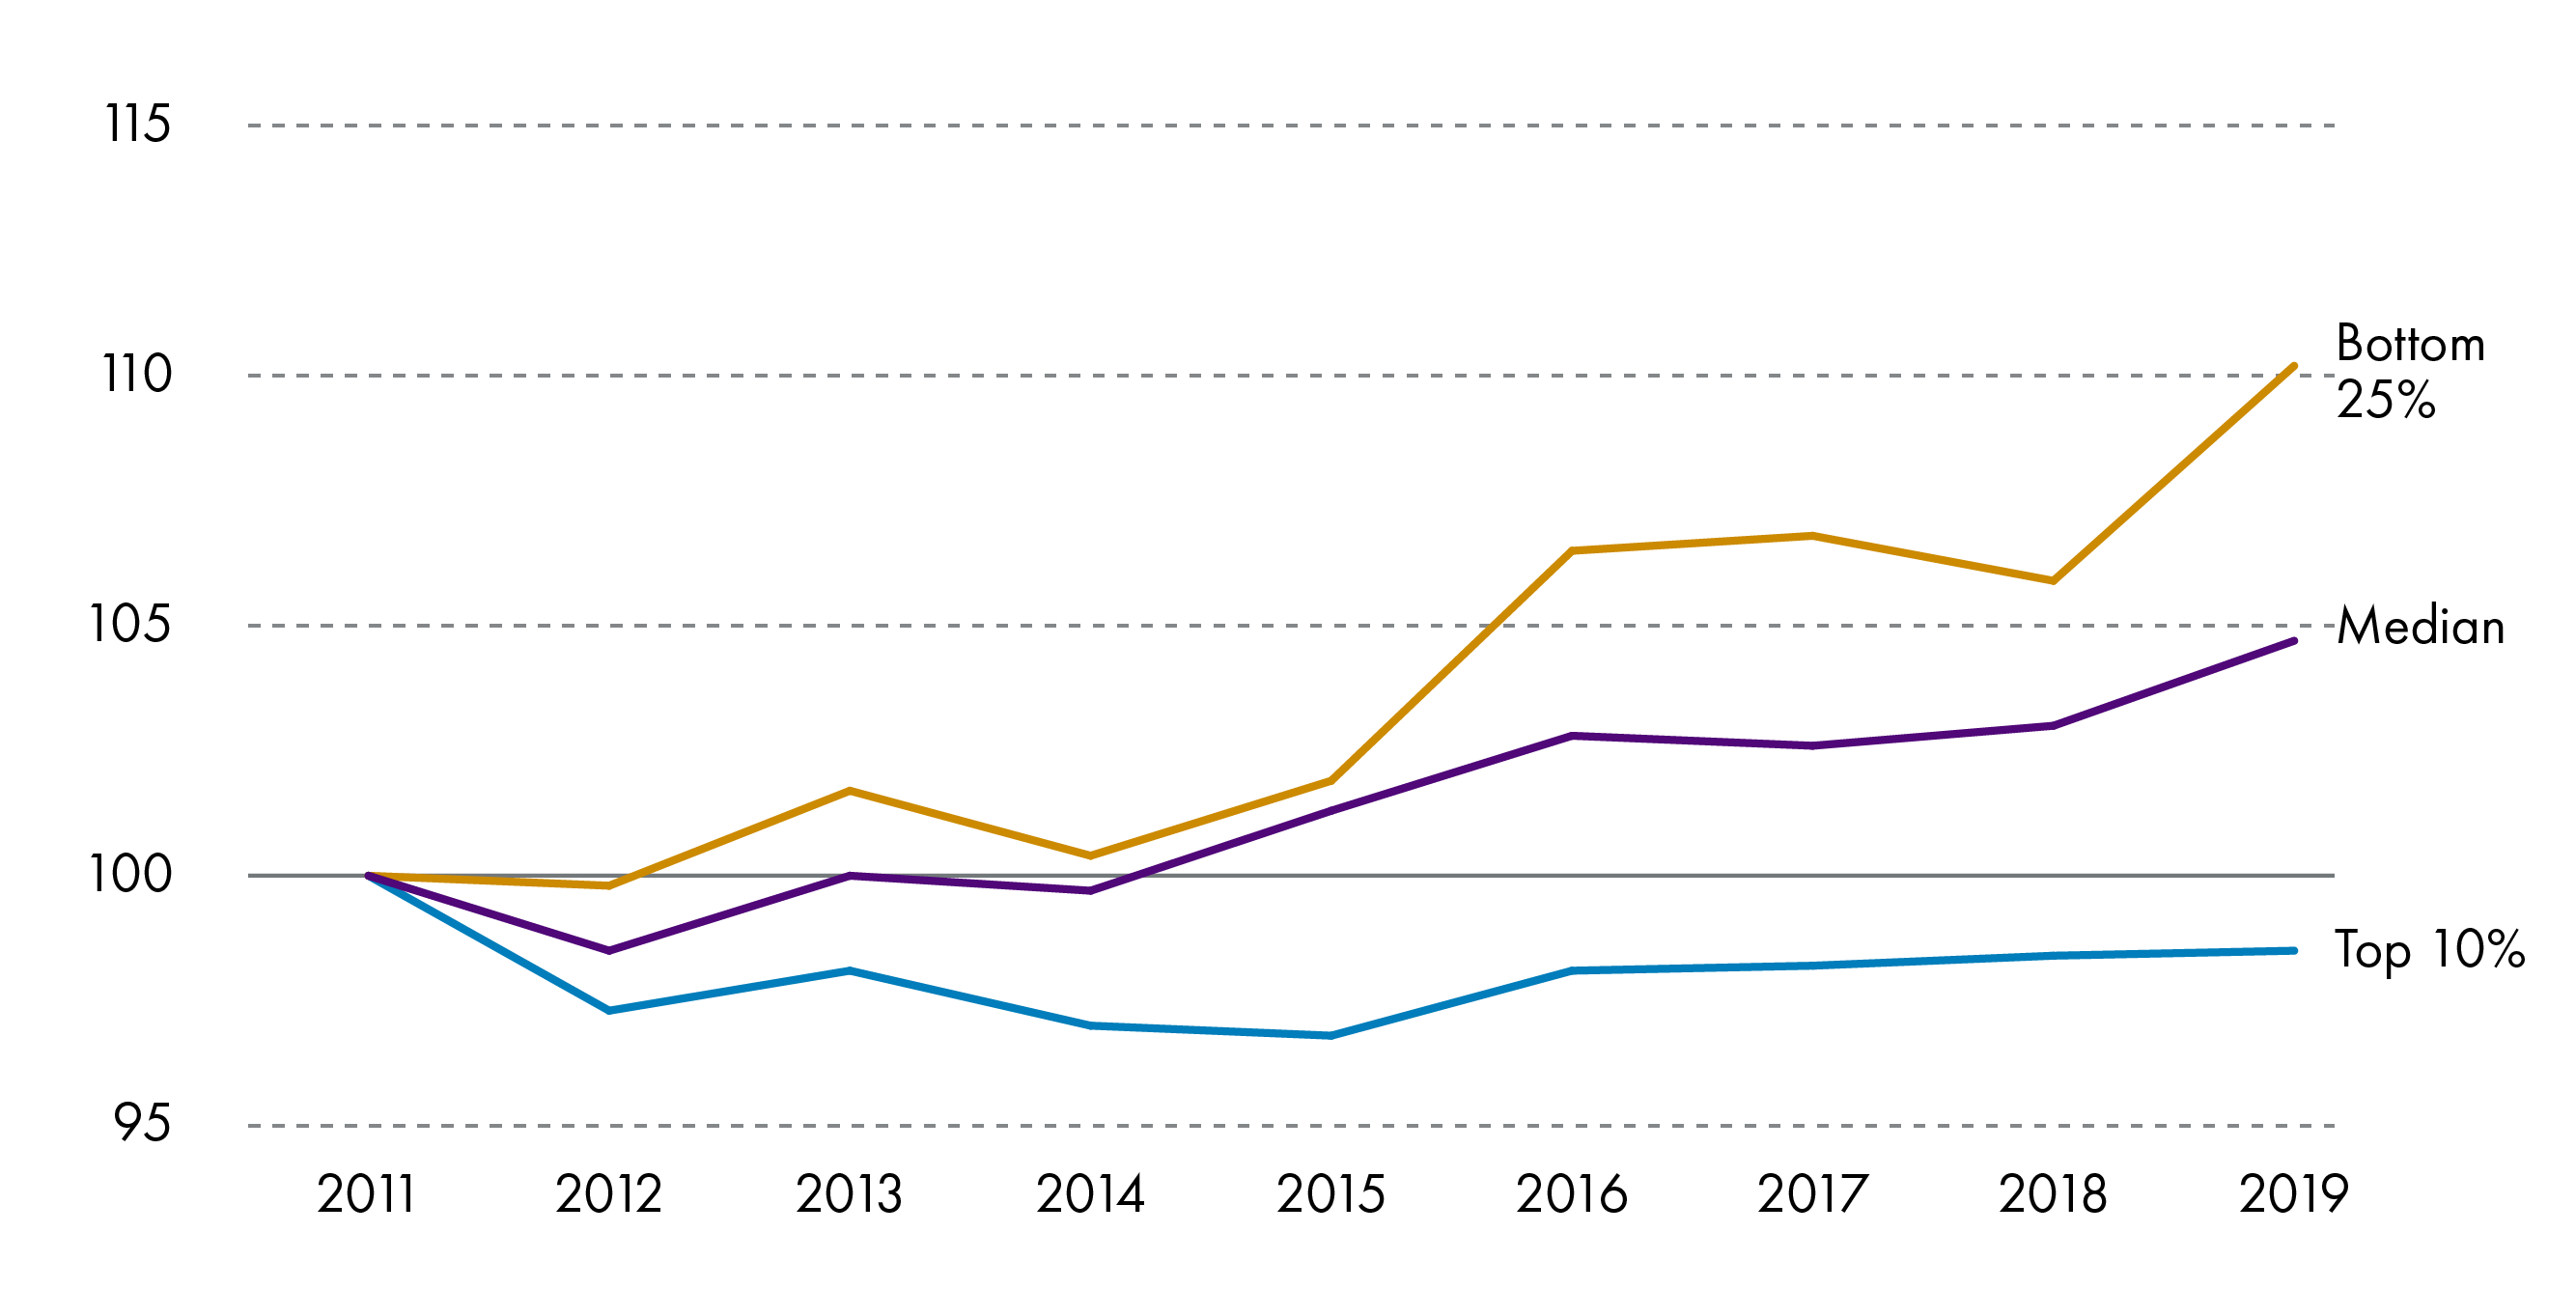
ASHE data via nomis
While the wages for both the bottom 25% and those at the median income level have increased between 2011 and 2019, the top 10% of earners have seen a decrease. Real terms wage growth for the top 10% has been stagnant since 2016.
Public and private sector pay
The reasons for the differences in private and public sector pay levels are complex "because of the different jobs and characteristics of the people within each sector" according to the ONS.1 To address some of these issues, hourly pay excluding overtime is used for comparing the public and private sectors. This helps to control for the difference in the length of the working week.
Figure 16: Hourly pay excluding overtime by sector in Scotland and the UK - 2019
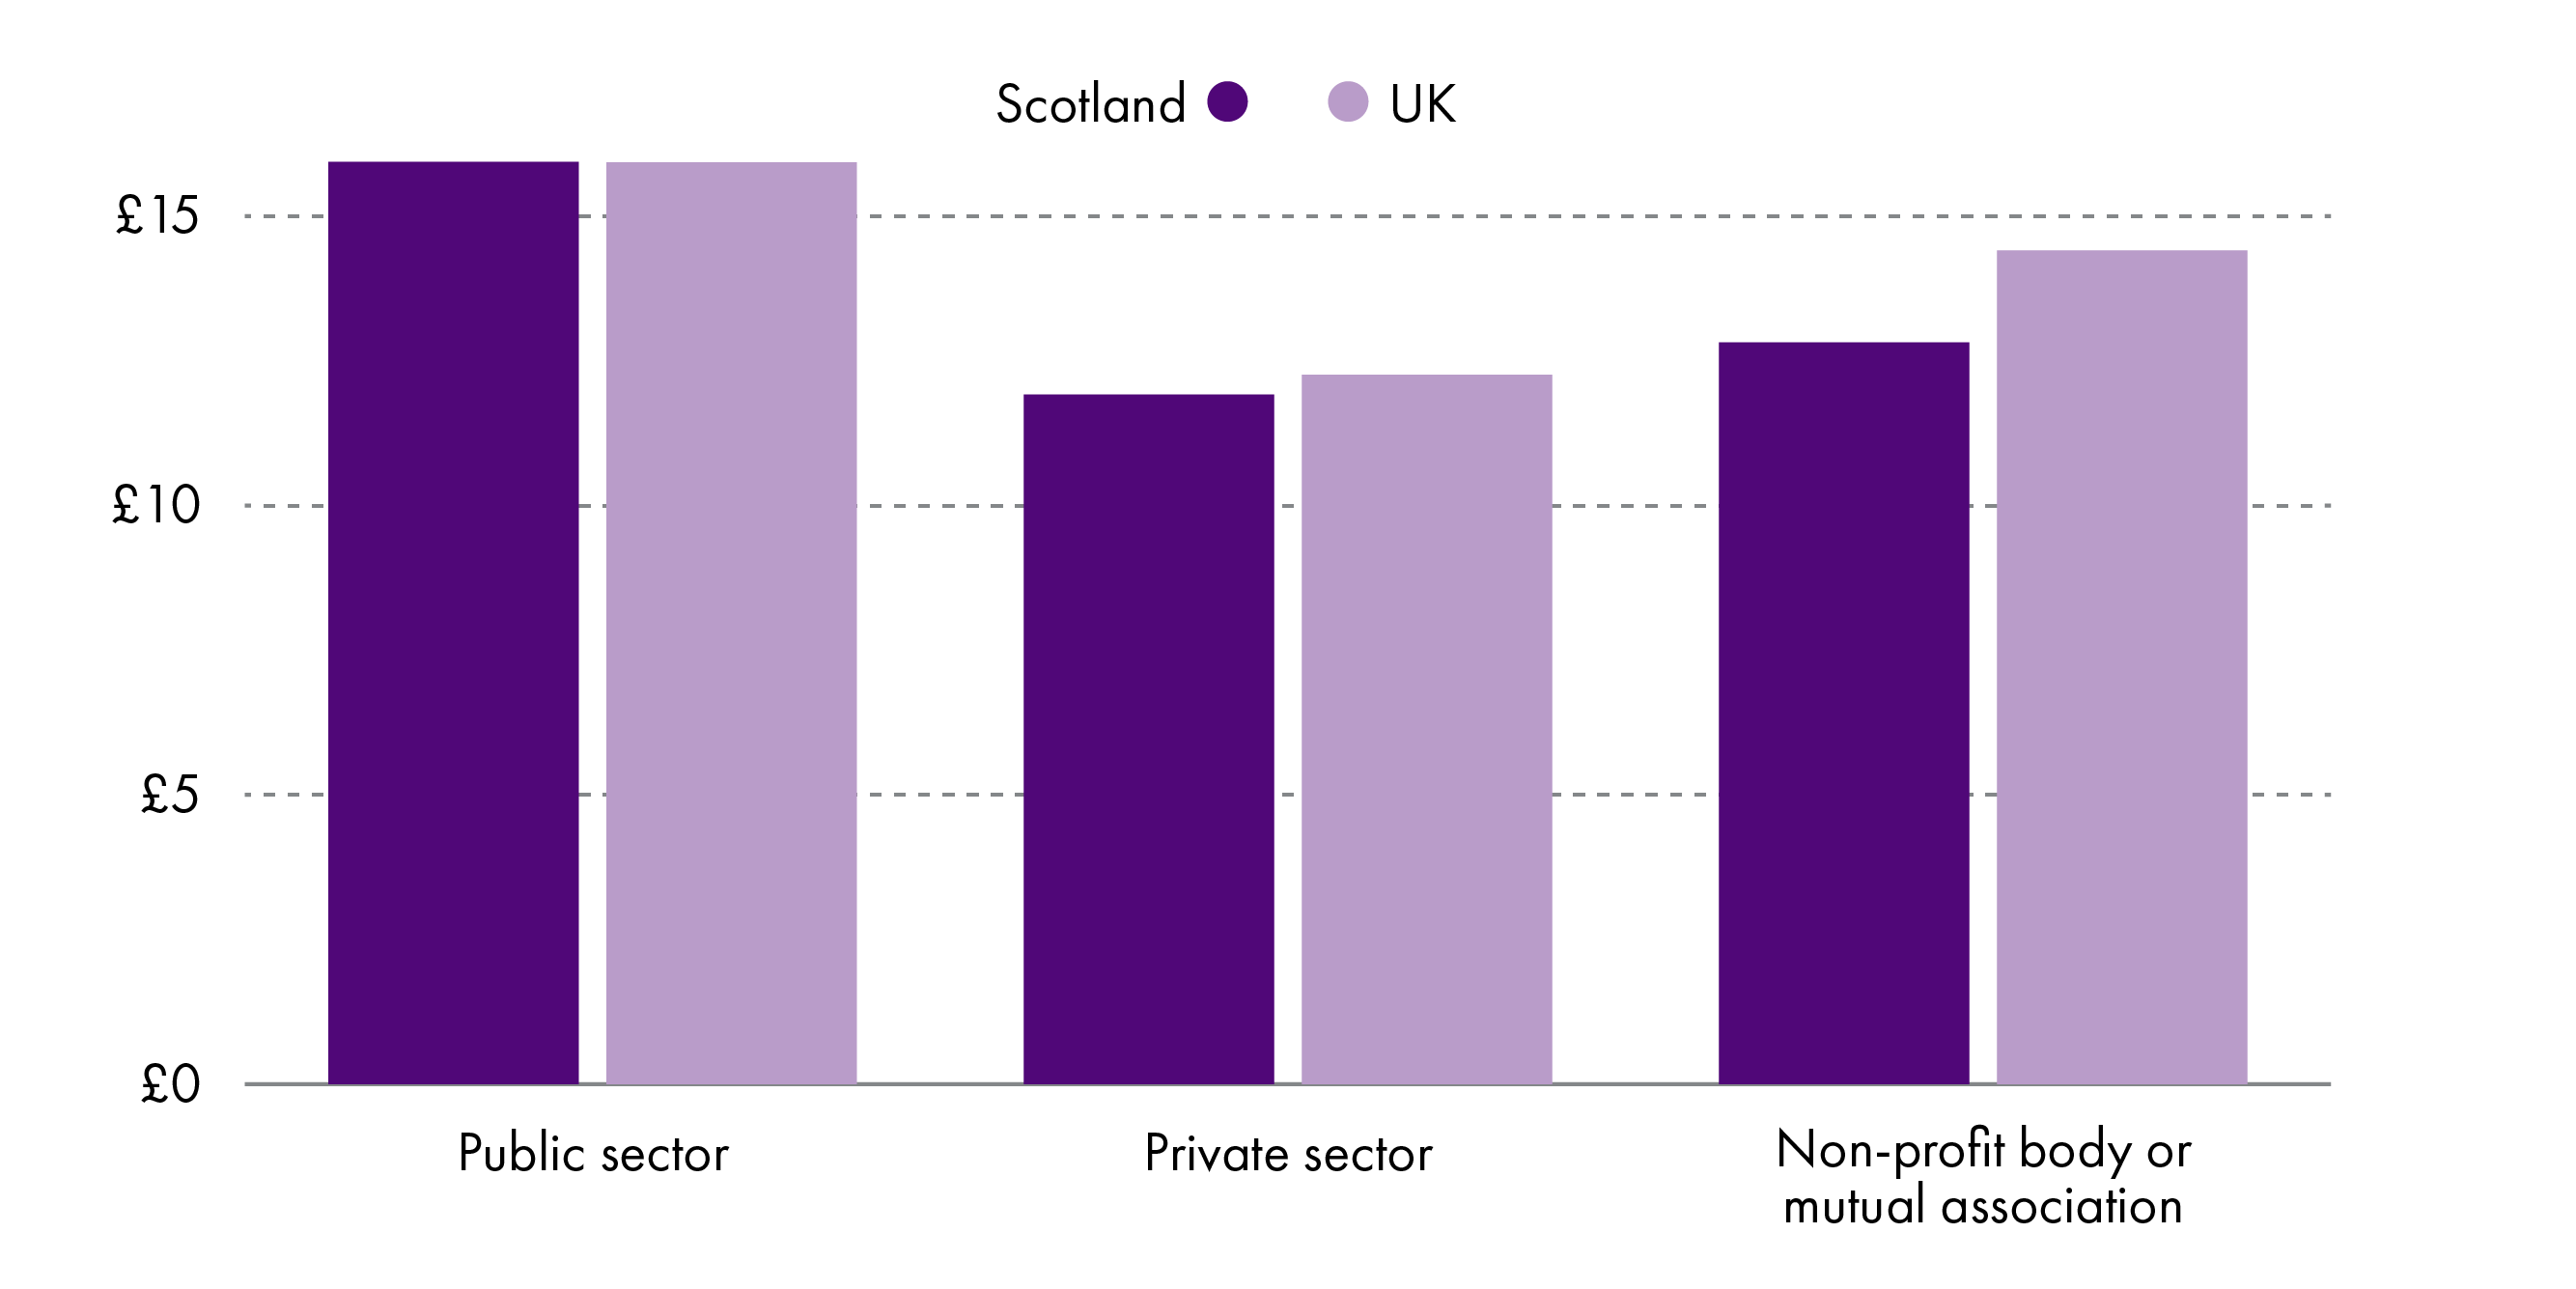
Public sector pay in Scotland is practically the same as the UK, at £15.94 per hour compared to £15.93 per hour. Private sector pay is lower than the UK, at £12.26 per hour in the UK and £11.92 per hour in Scotland.
Public sector pay increased in real terms across the UK by 2.2% and by 0.8% in Scotland. Private sector pay increased by 3.0% in Scotland and by 2.3% across the UK.
Public and private sector pay growth by deciles
Figure 17: Real terms growth in hourly pay excluding overtime in the public and private sector, Scotland by decile threshold, 2018-19
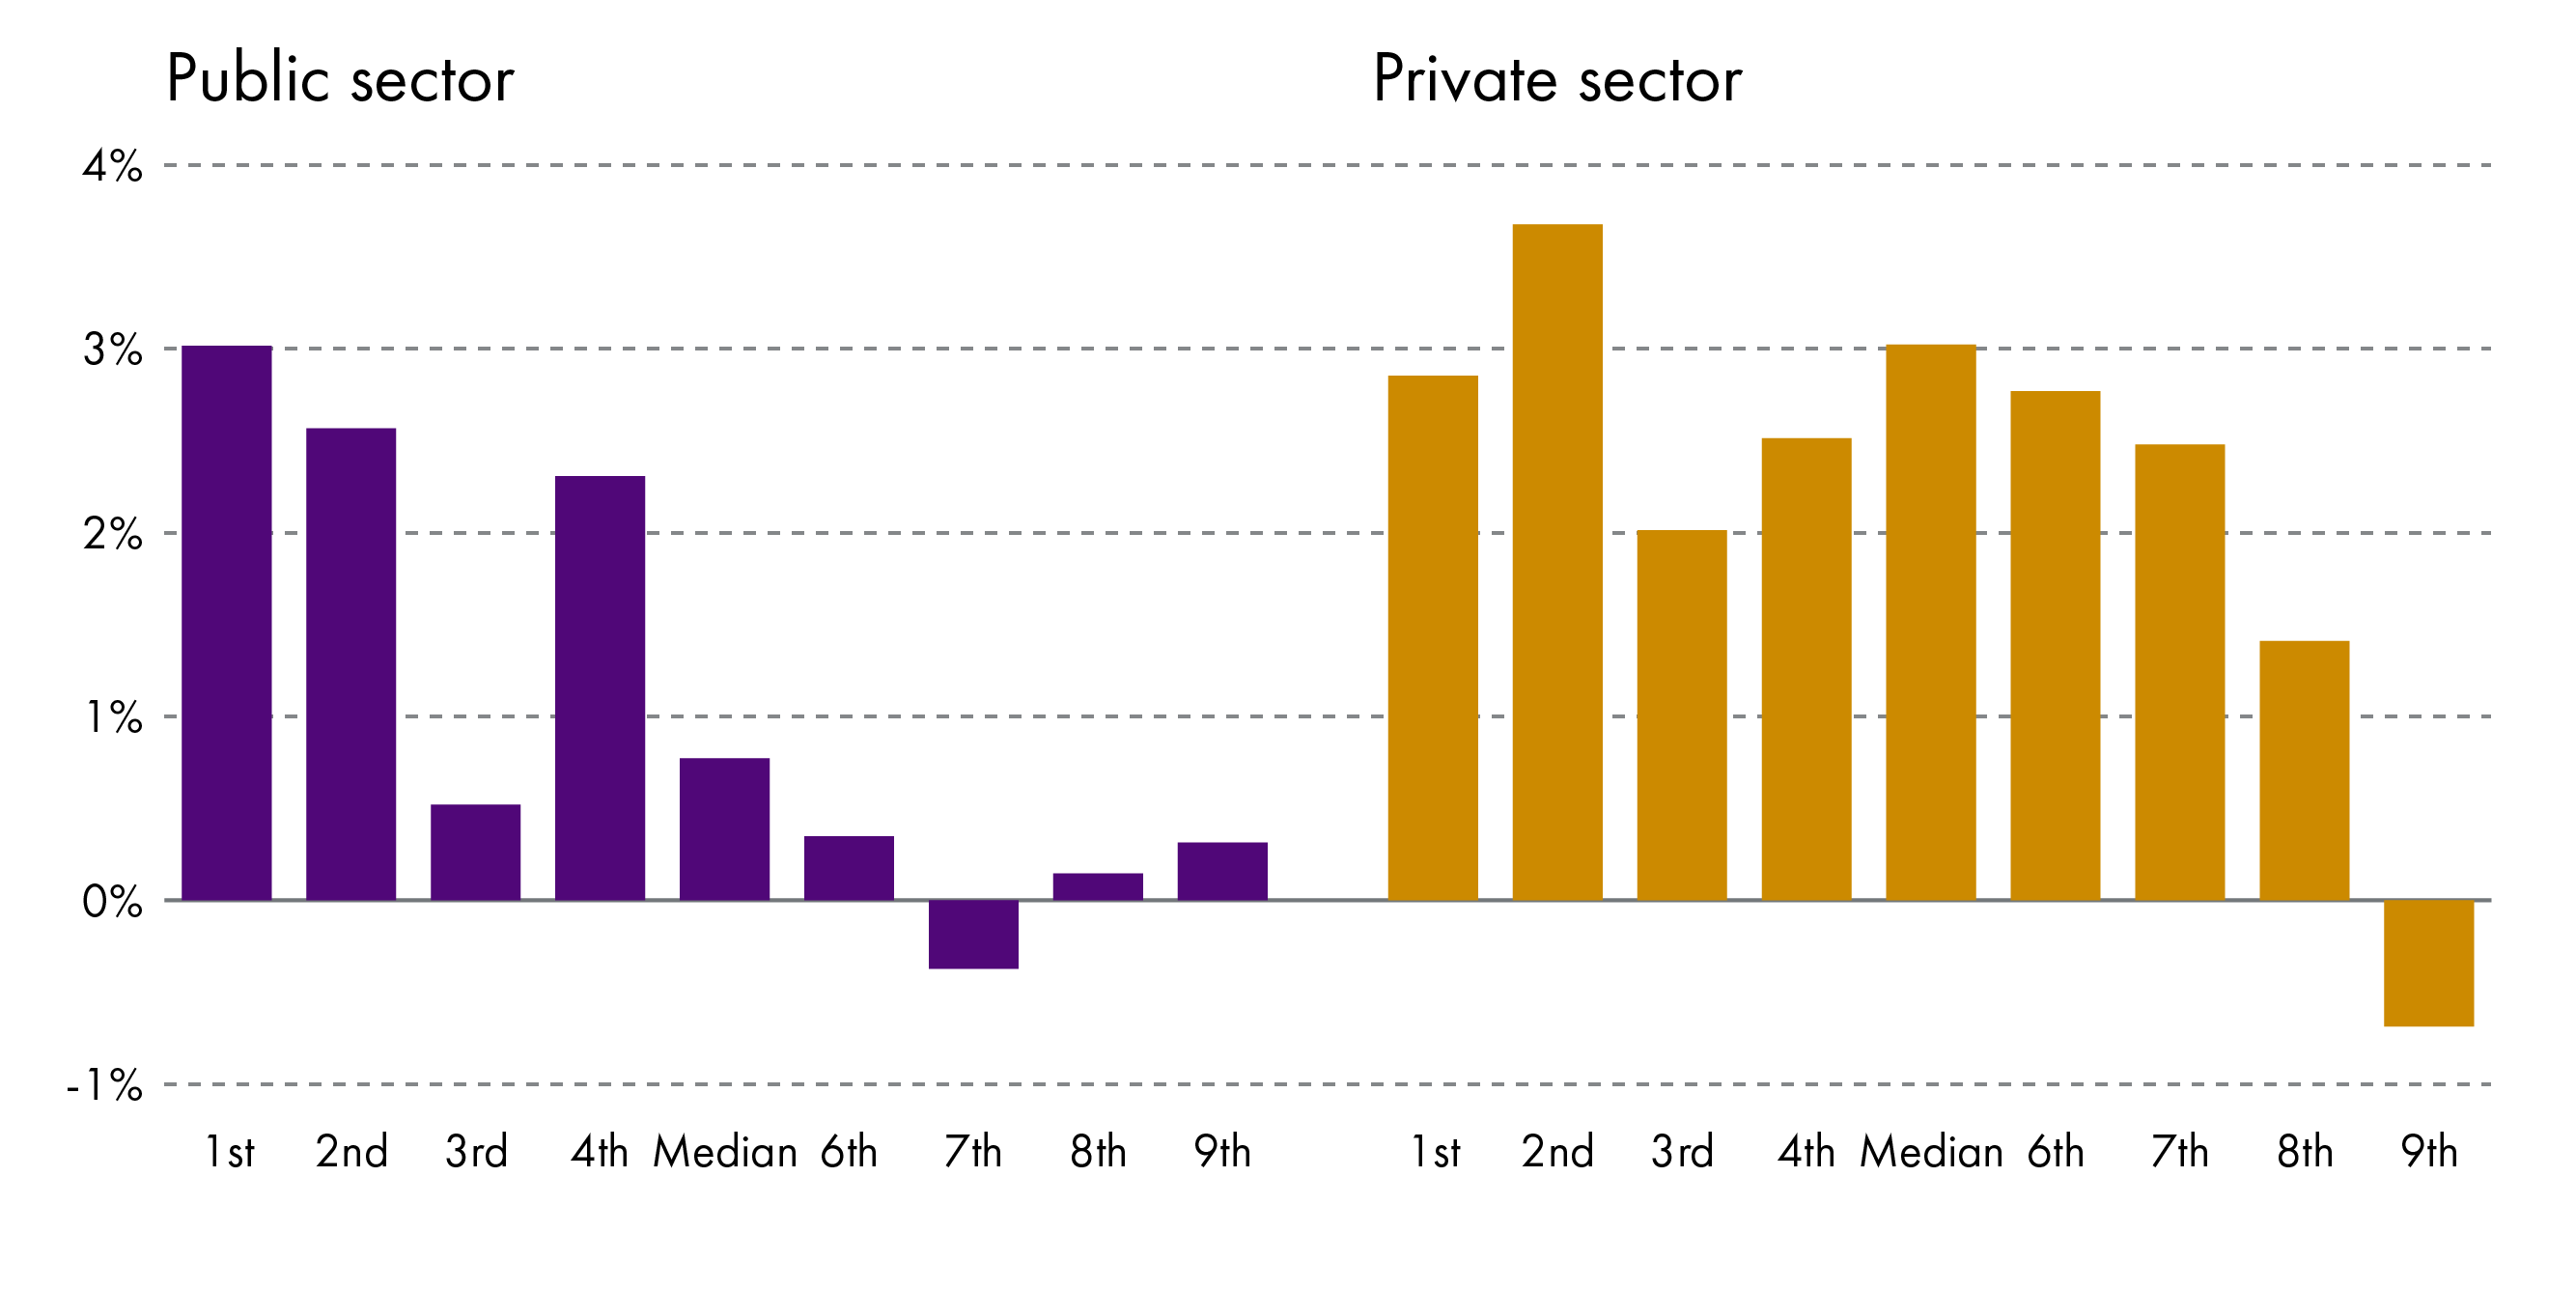
ASHE provides data on earnings by deciles. The data provides the nine points which split the data into 10 equal numbers of employees. For example the 1st decile for public sector pay is £11.22 per hour, therefore 10% of employees earn between £0 and £11.22 per hour. The ninth decile point is £25.64 per hour and 10% of employees earn this and above.
Growth in wages in the private sector has been stronger than in the public sector, with all but the the highest decile seeing real terms growth between 1.4 and 3.7 percent. Growth in wages in the public sector was weaker especially between the sixth and top decile with most seeing little or no growth.
Public and private sector pay across Great Britain
Figure 18: Hourly pay excluding overtime by nation and region of GB - 2019
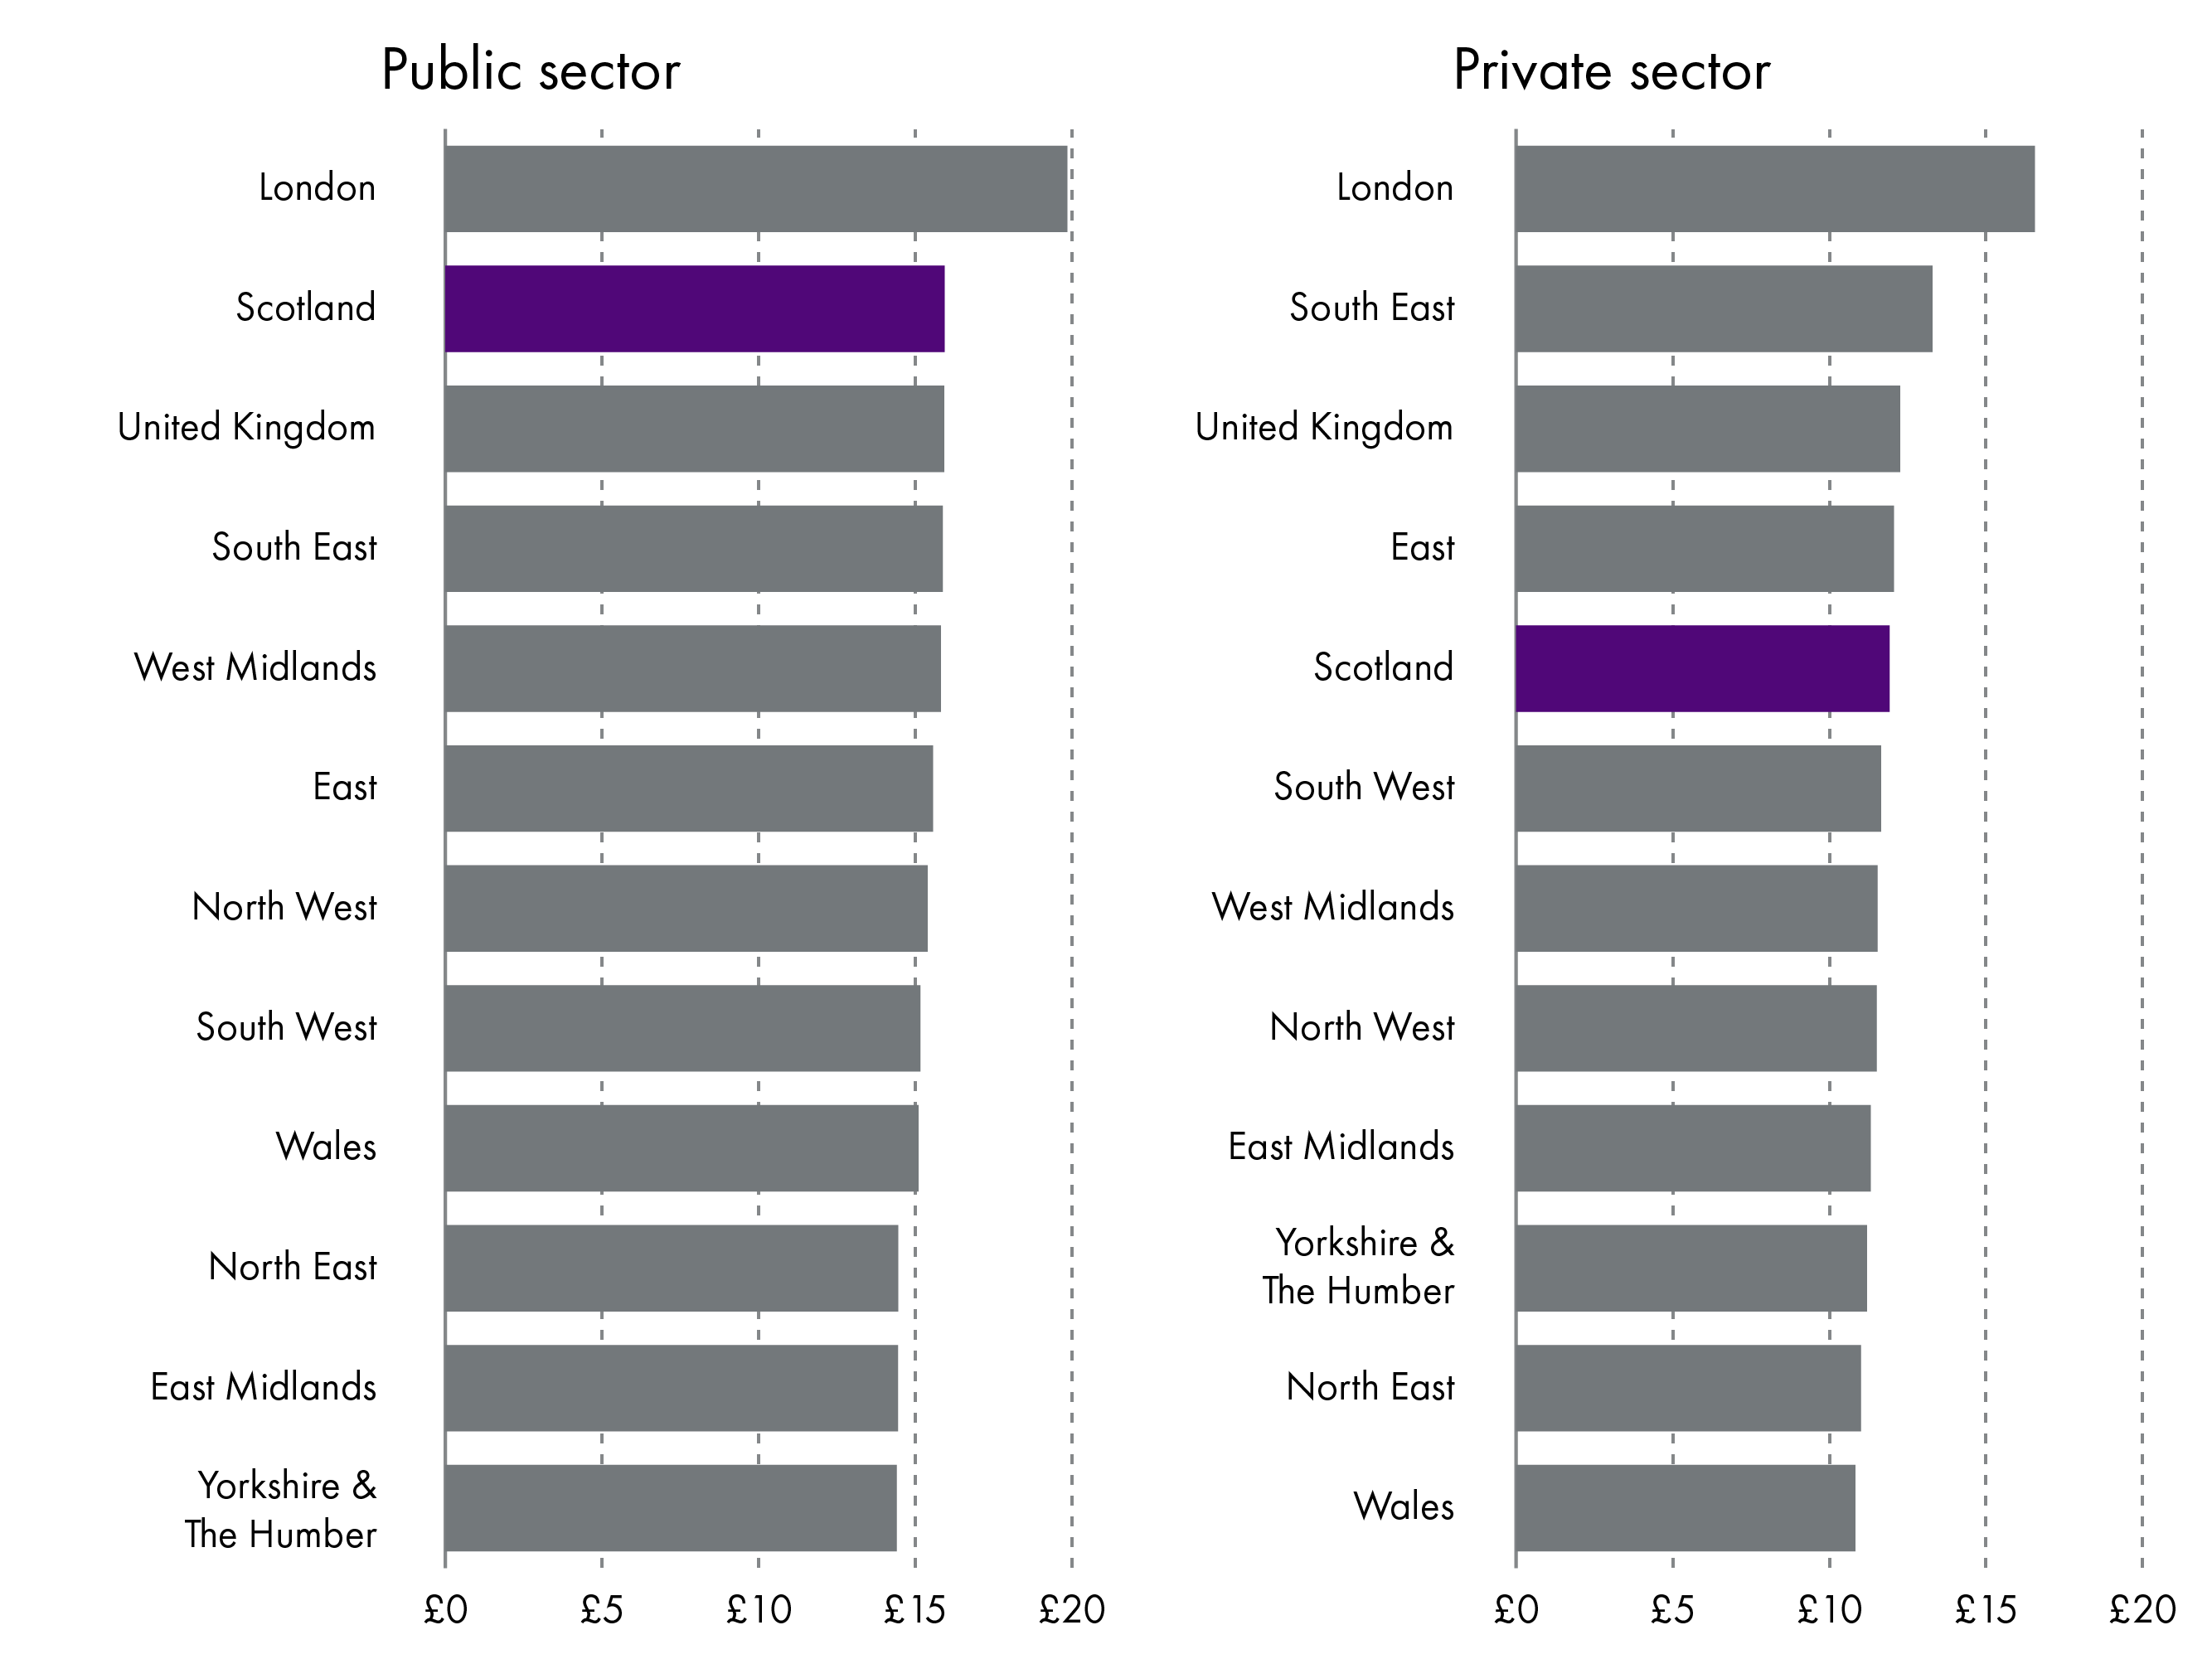
When looking at public and private sector pay across the UK, Scotland has the second highest public sector pay, with only London higher. The picture is different for private sector pay with Scotland having the fourth highest pay behind, London, the South East and the East of England
Which industries in Scotland pay the most?
This section looks at pay by industry in Scotland, using median hourly pay excluding overtime for all employees, in order to control for different working patterns and working weeks across industries.
Figure 19: Hourly pay excluding overtime by industry in Scotland - 2019
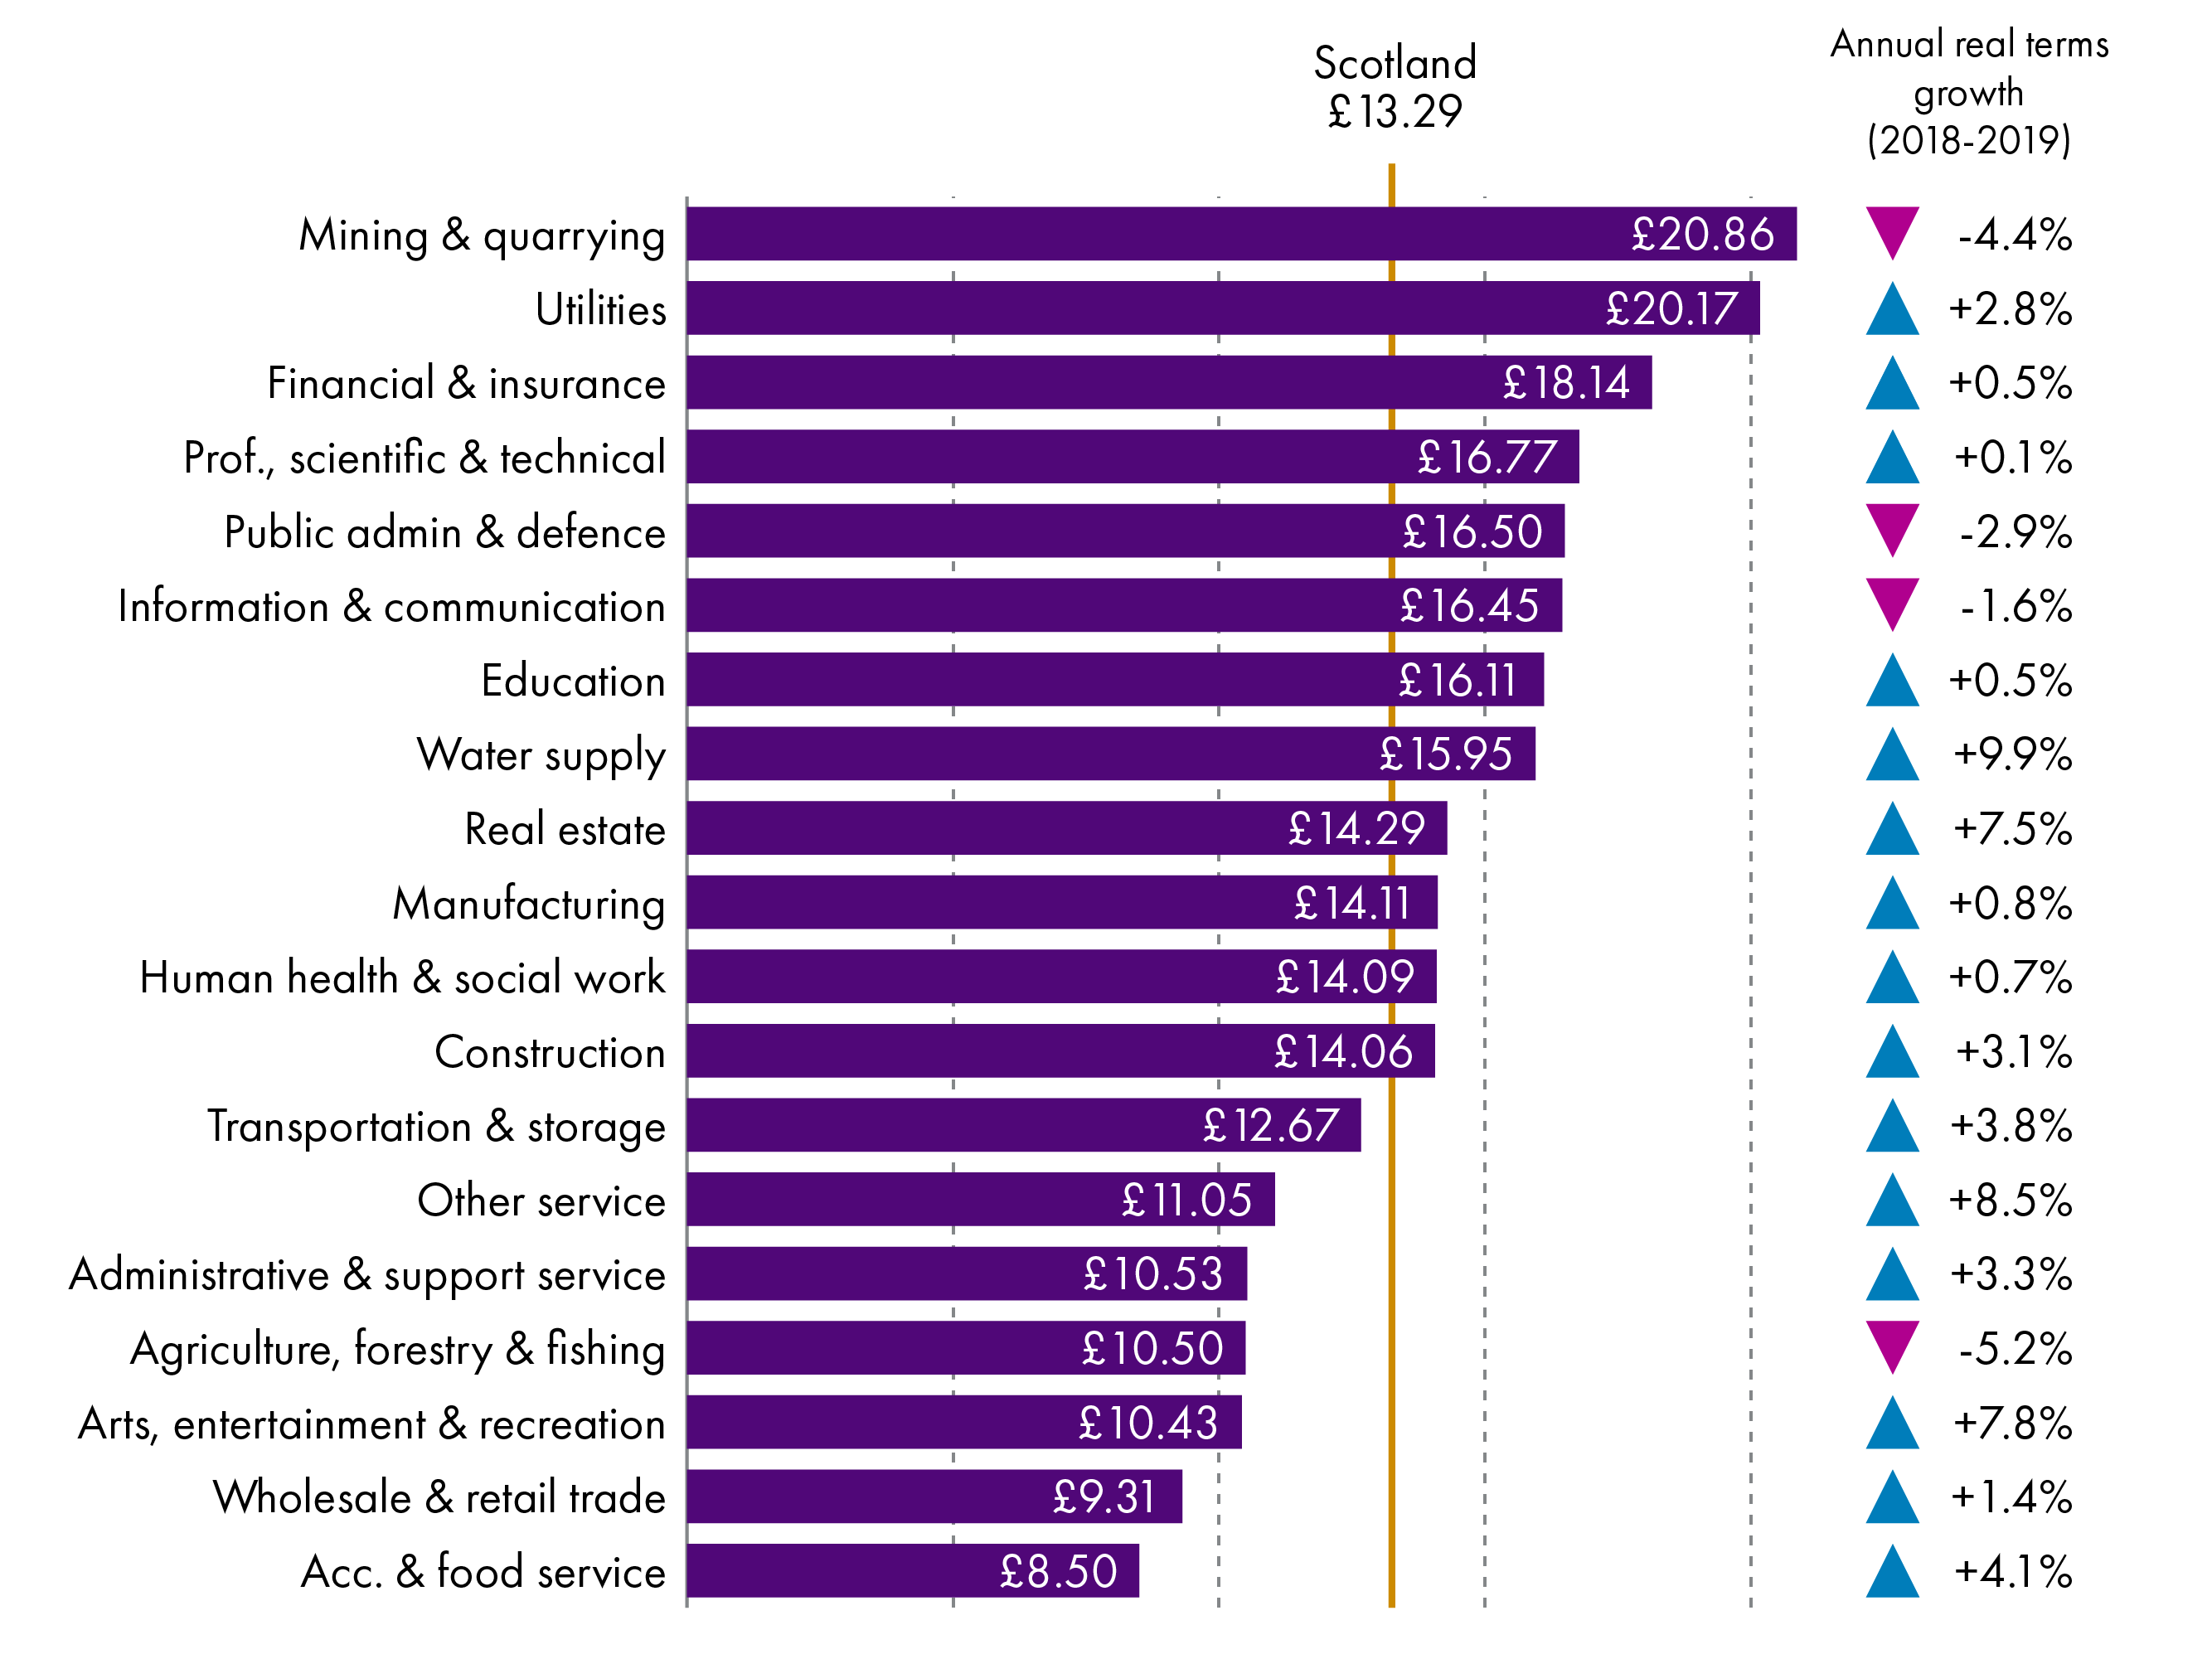
The “mining and quarrying” industry (which includes the offshore oil and gas sector) has the highest median hourly rate excluding overtime at £20.86, despite seeing a decrease of 4.4% in real terms. The water supply industry category saw the largest increase at 9.9% in real terms.
The “accommodation and food services” industry has the lowest rate despite seeing an above inflation increase in earnings over the year of, 4.1%. It is also the only industry to have a median wage below the living wage rate at the time of the survey, of £9.00 an hour.
Which occupations in Scotland pay the most?
This section looks at pay by occupation in Scotland, using median hourly pay excluding overtime, for all employees in order to control for different working patterns and working weeks across the occupations.
Figure 20: Hourly pay excluding overtime by occupation in Scotland - 2018
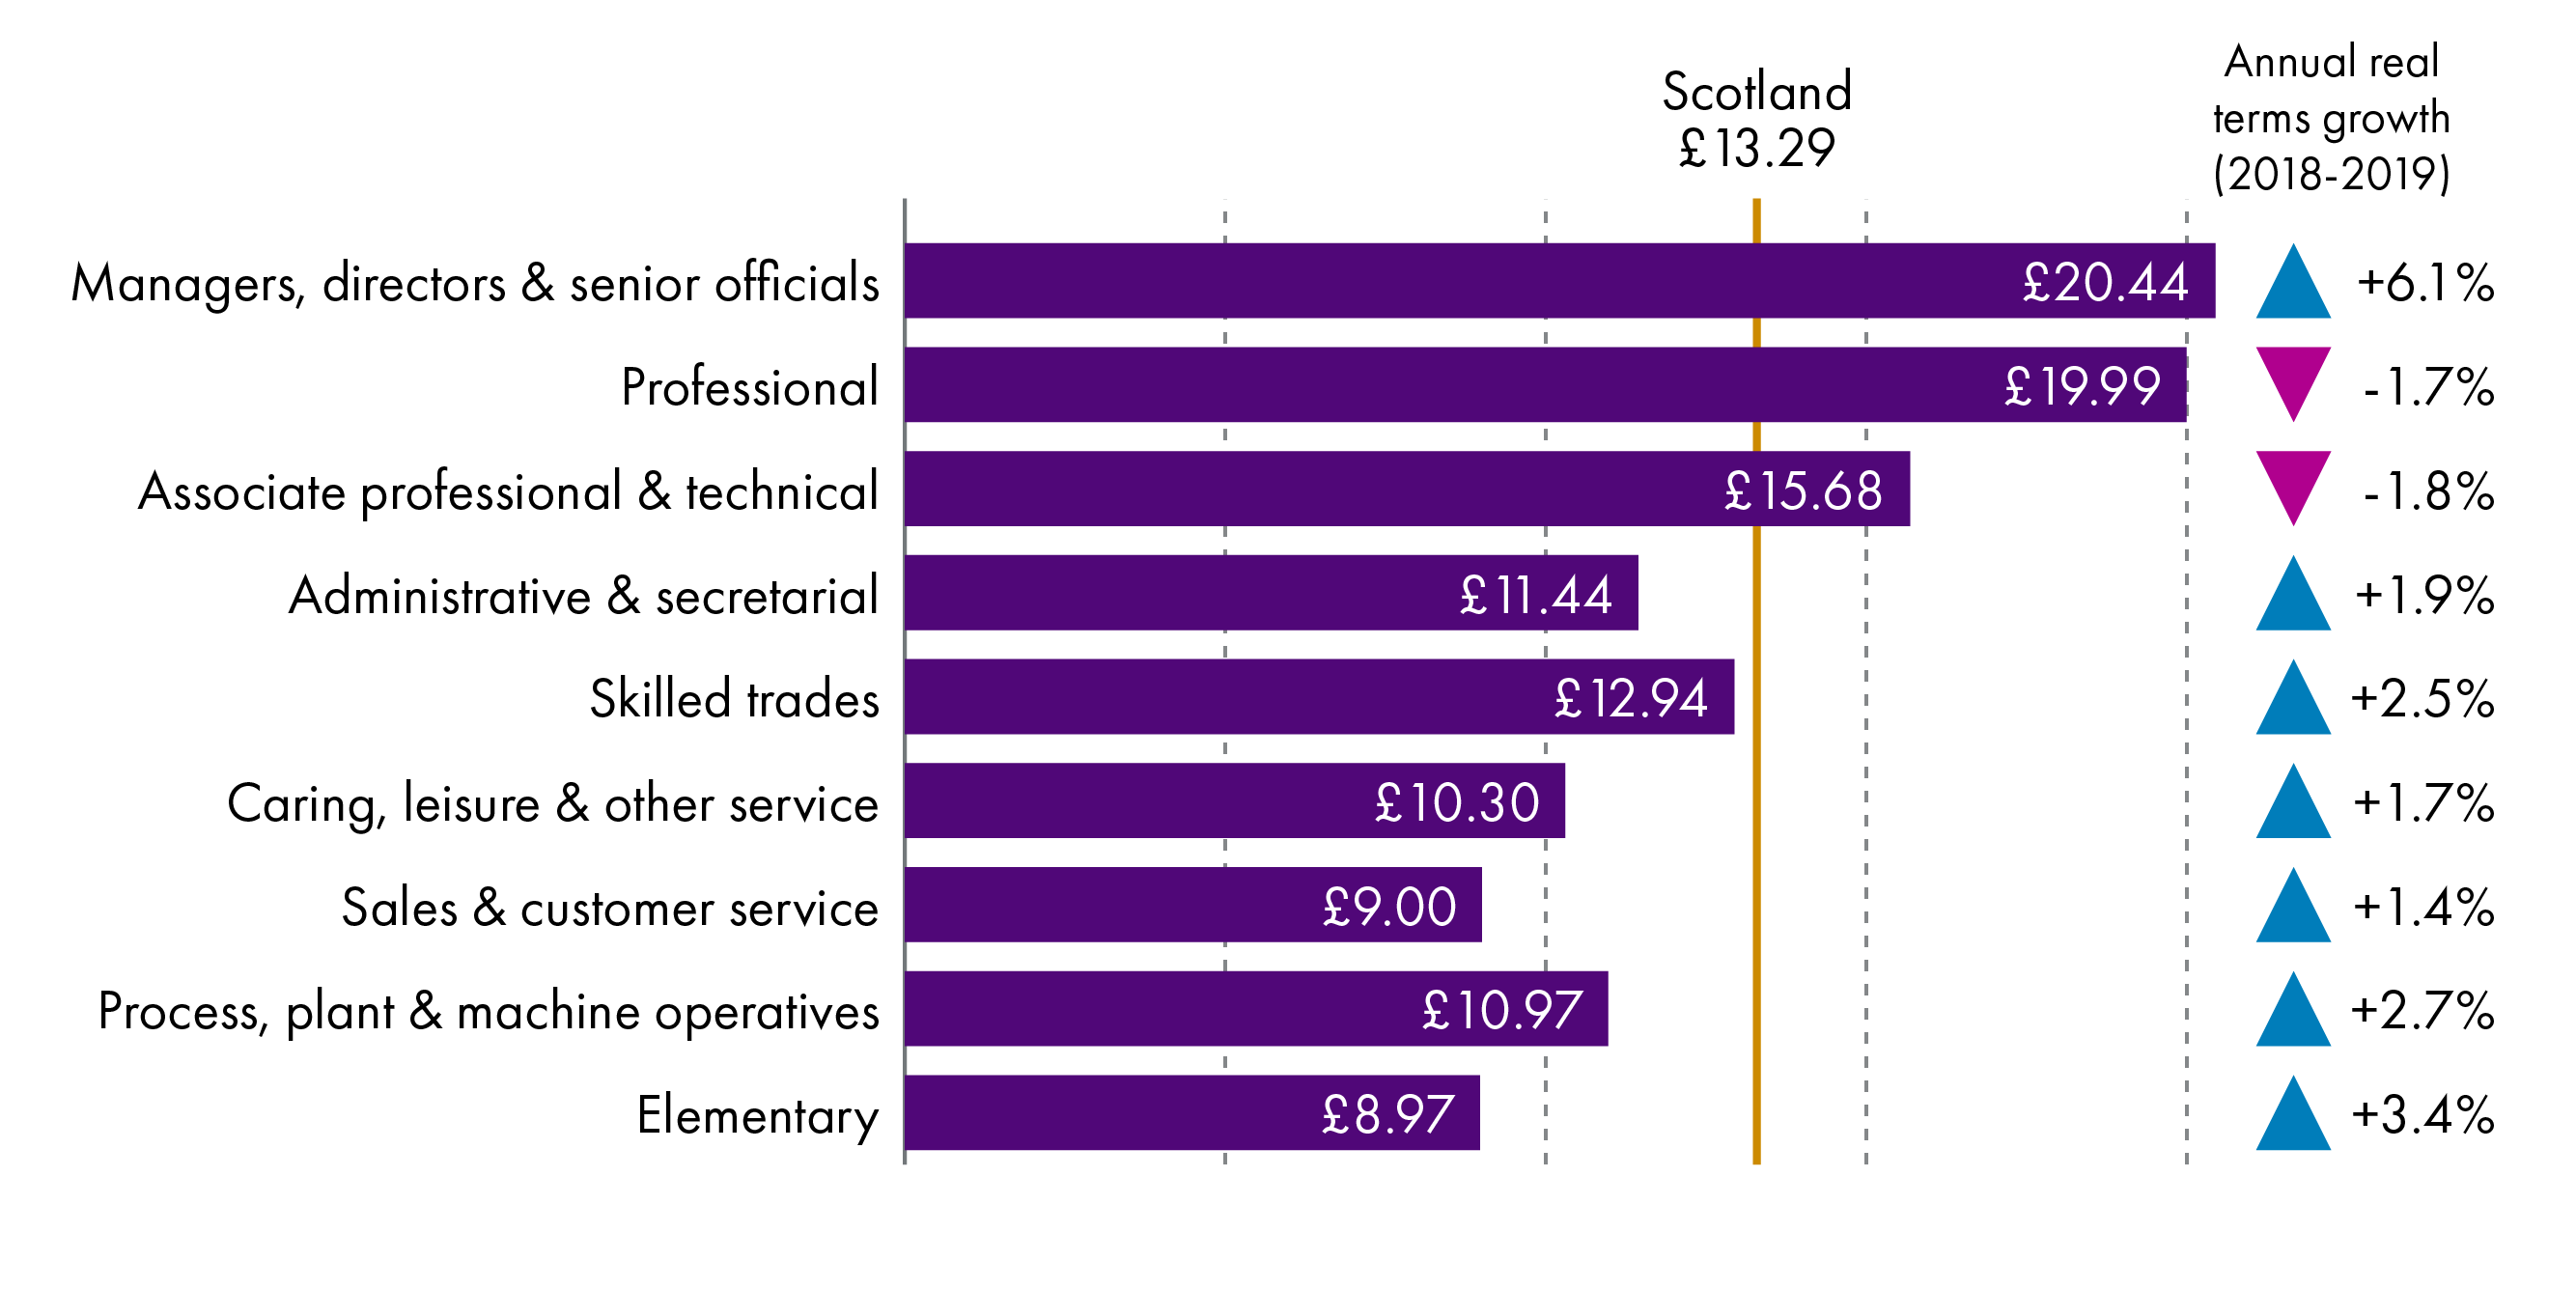
“Managers, directors & senior officials” in Scotland have the highest hourly rates of pay, at £20.44 an hour excluding overtime. “Sales and customer services” and “elementary occupations” (for example bar staff, cleaners and farm workers), both have median hourly rates at or below the living wage rate at the time of the survey, of £9.00 an hour.
Professional occupations and "associate professional & technical" were the only groups to see real terms decreases. Managers, directors & senior officials saw the largest real terms increase at 6.1%
Which local authority area in Scotland has the highest pay?
ASHE provides figures on pay by local authority for those who live in the area, and those who work in the area. This section uses median hourly pay excluding overtime for all employees, in order to control for different structural differences in local authority economies.
Figure 21: Hourly pay excluding overtime by place of work by local authority - 2019
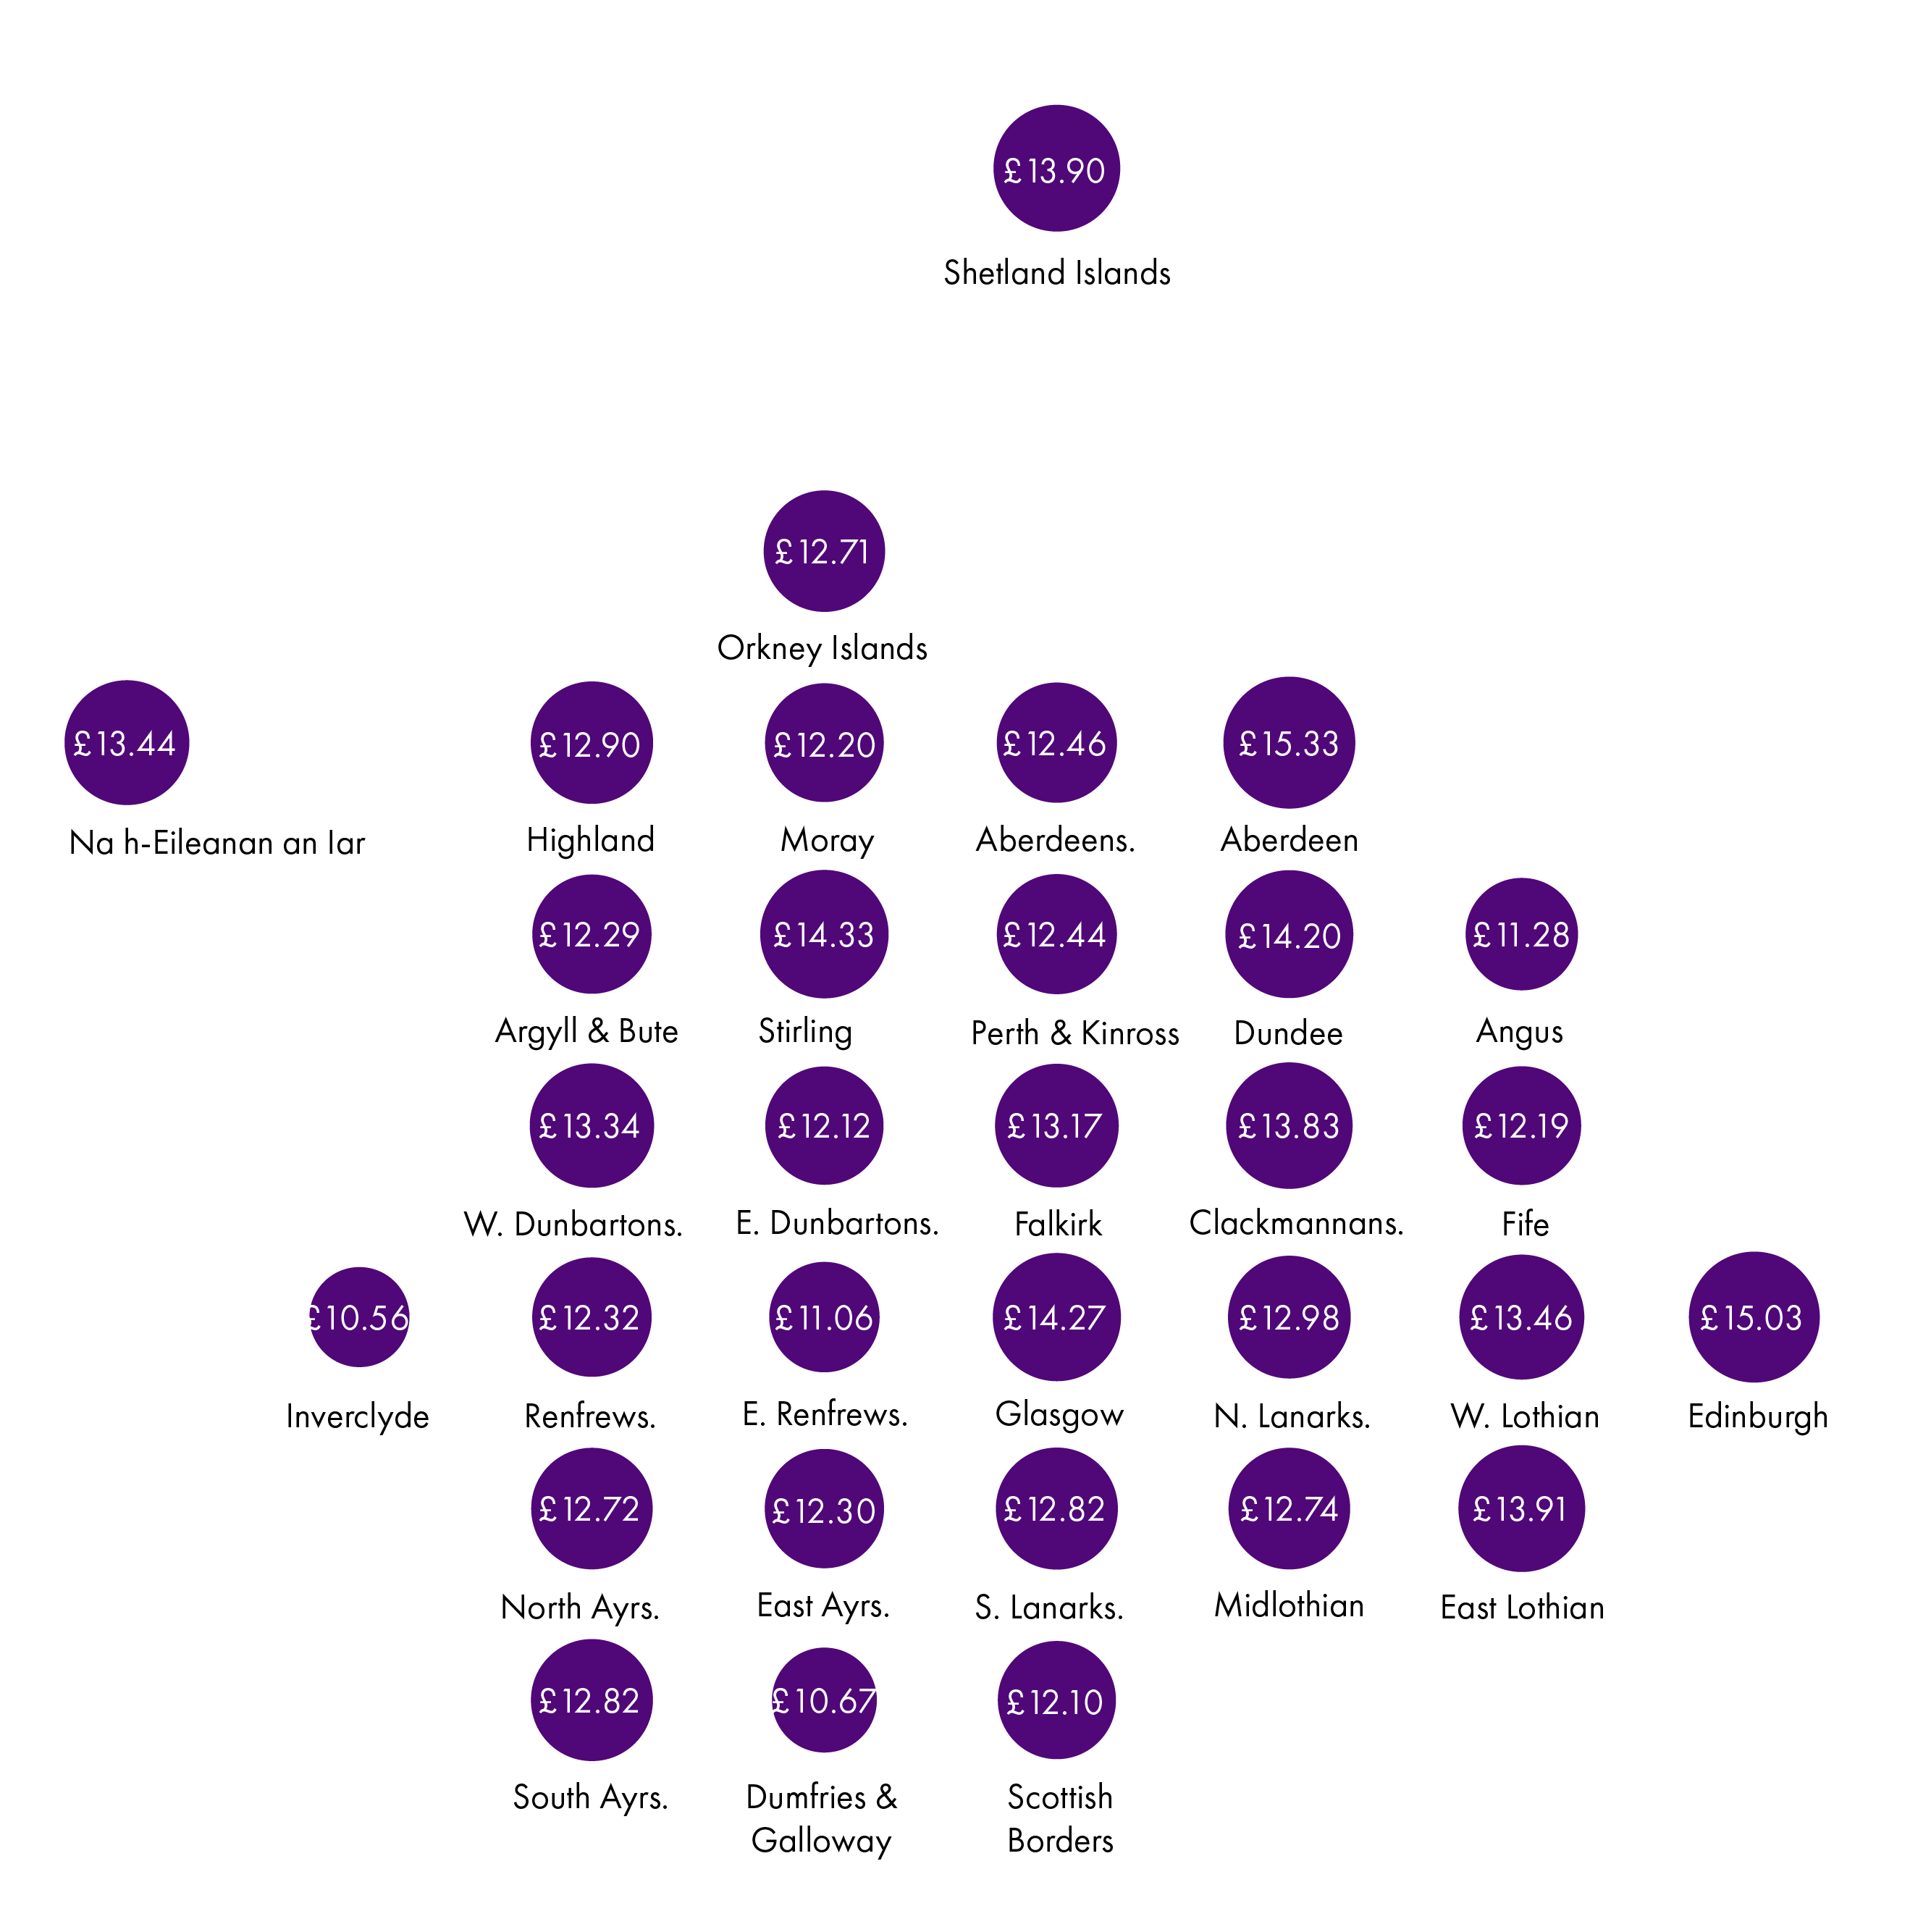
Aberdeen has the highest workplace income in Scotland at £15.33 while Inverclyde has the lowest at £10.56. The data for the map can be found in the annex.
Figure 22: Hourly pay excluding overtime by place of residence by local authority - 2019
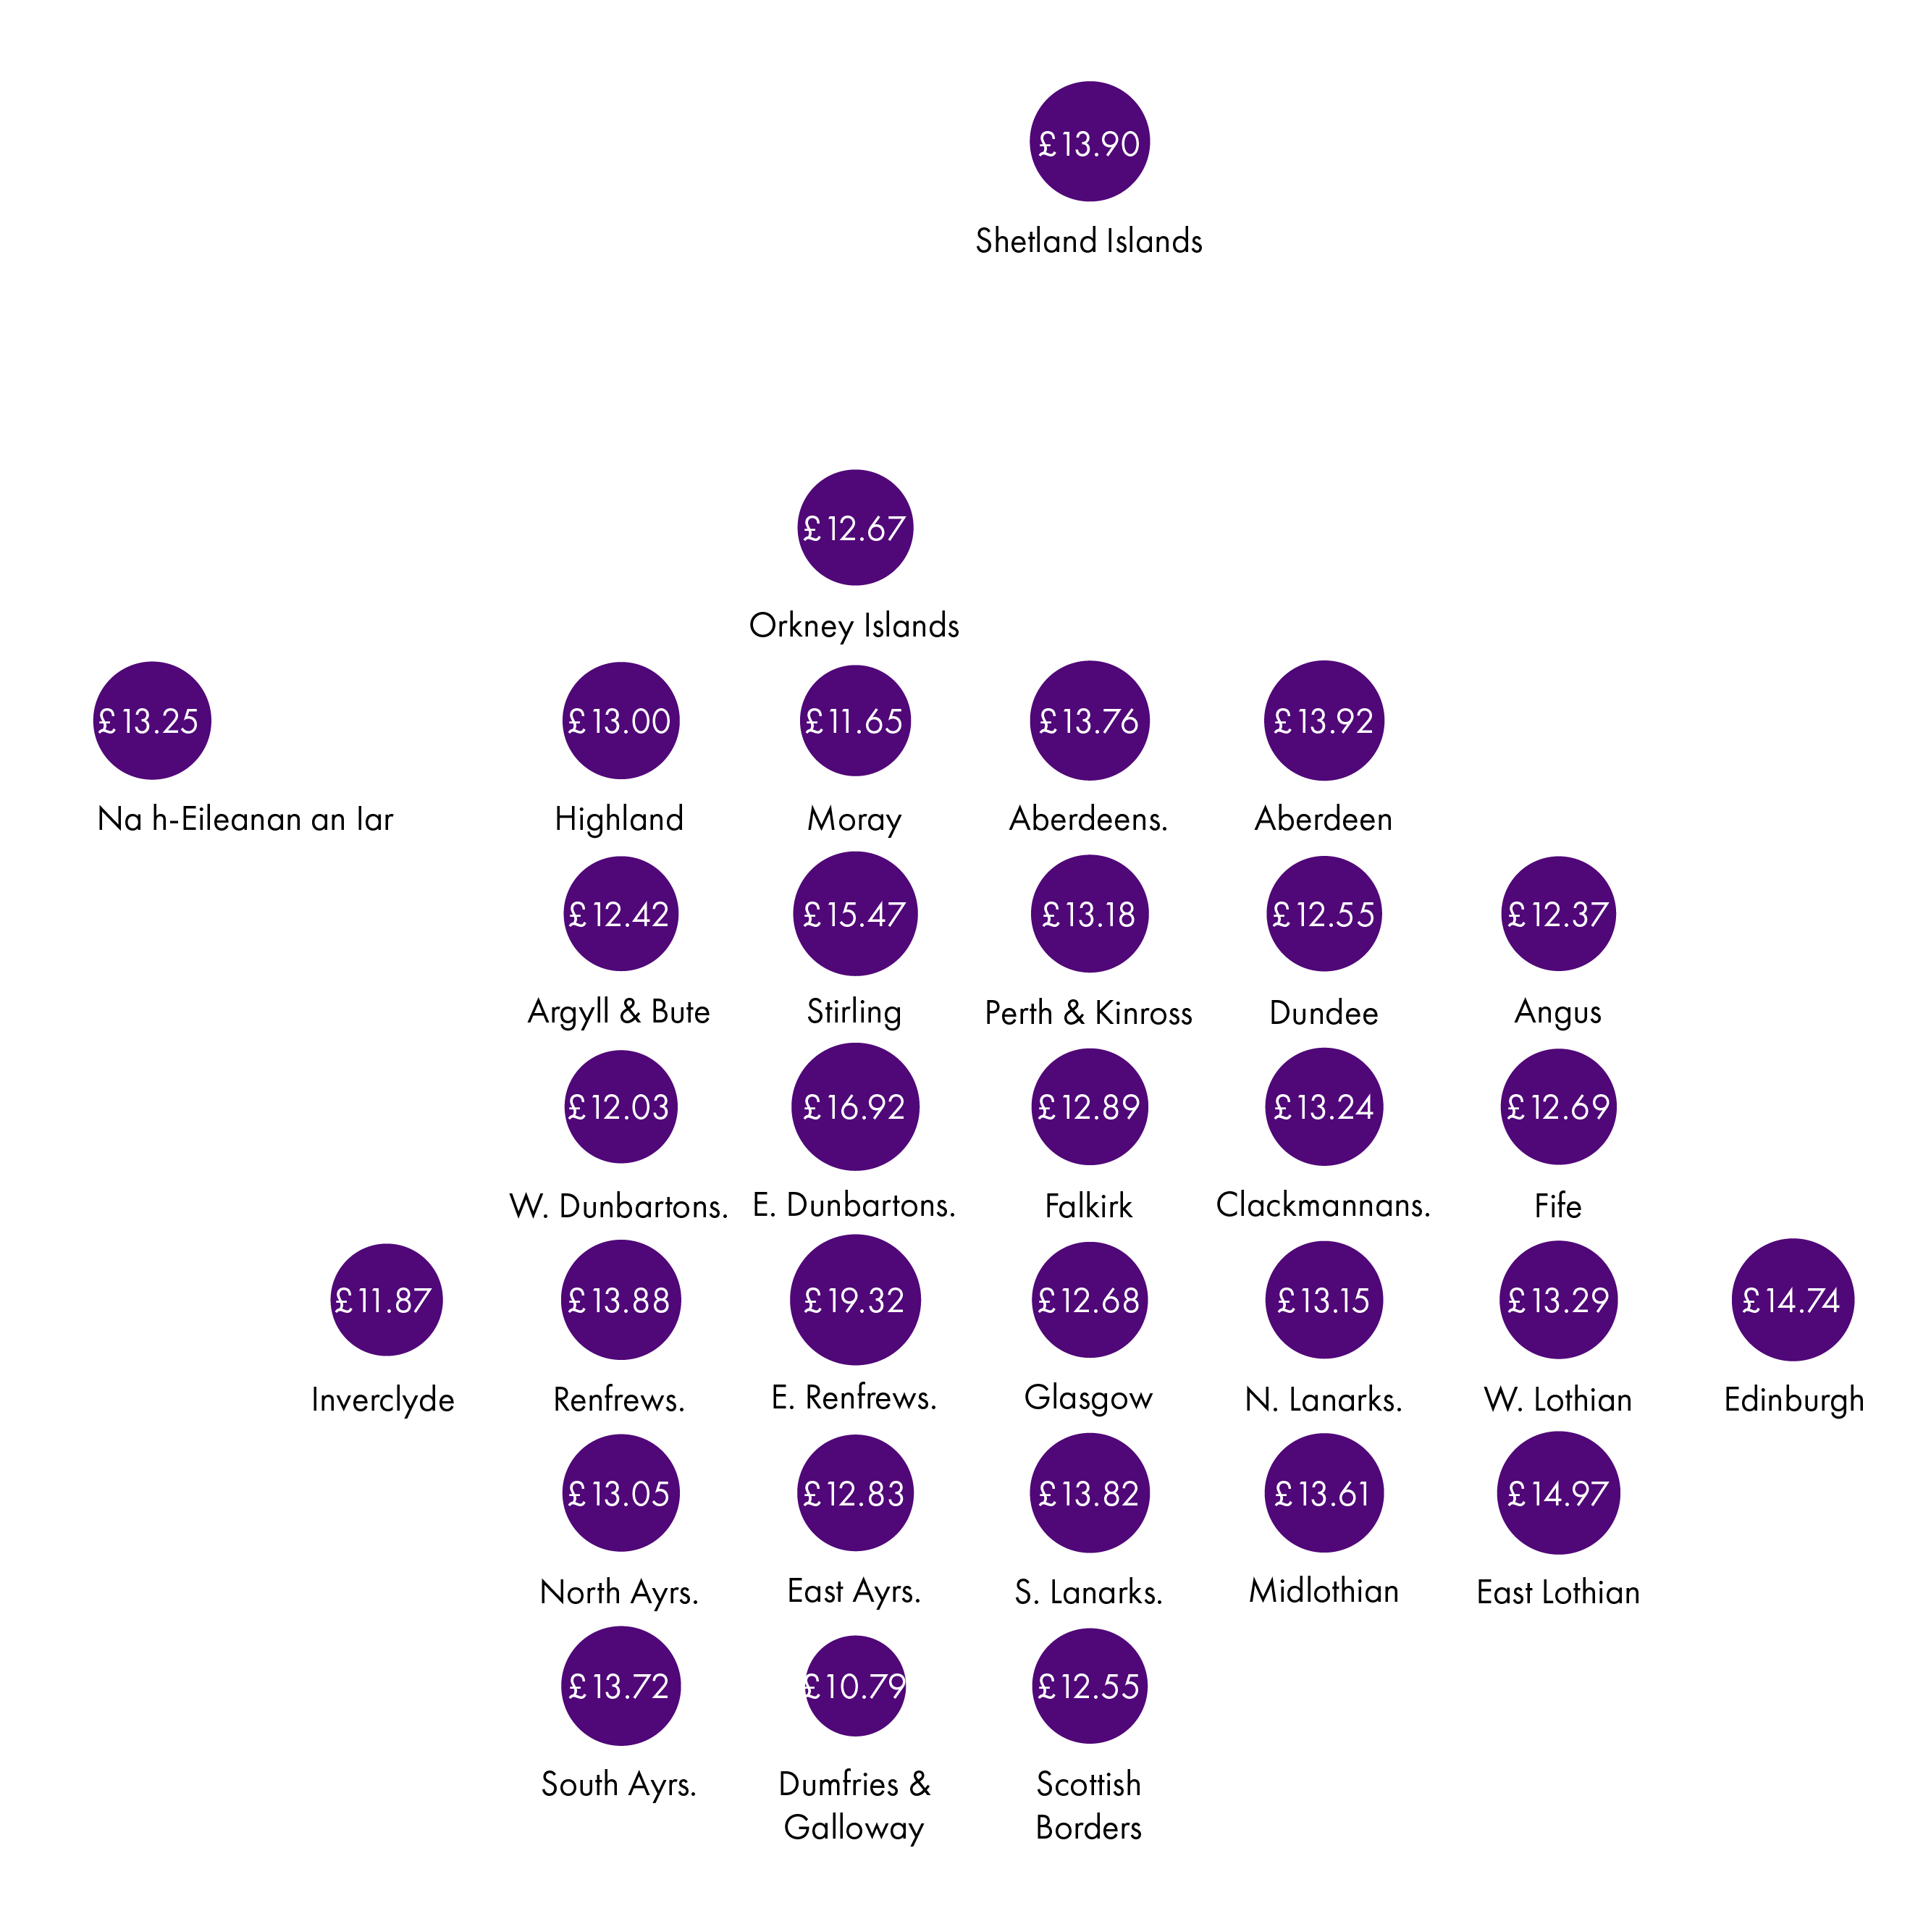
East Renfrewshire has the highest rate of pay for residents at £19.31 while Dumfries and Galloway has the lowest at £10.79. Of the four largest cities, only Edinburgh and Aberdeen are in the top quartile, with Dundee in the bottom. The data for the map can be found in the annex.
Figure 23: Ratio of residence pay to place of work pay by local authority - 2019
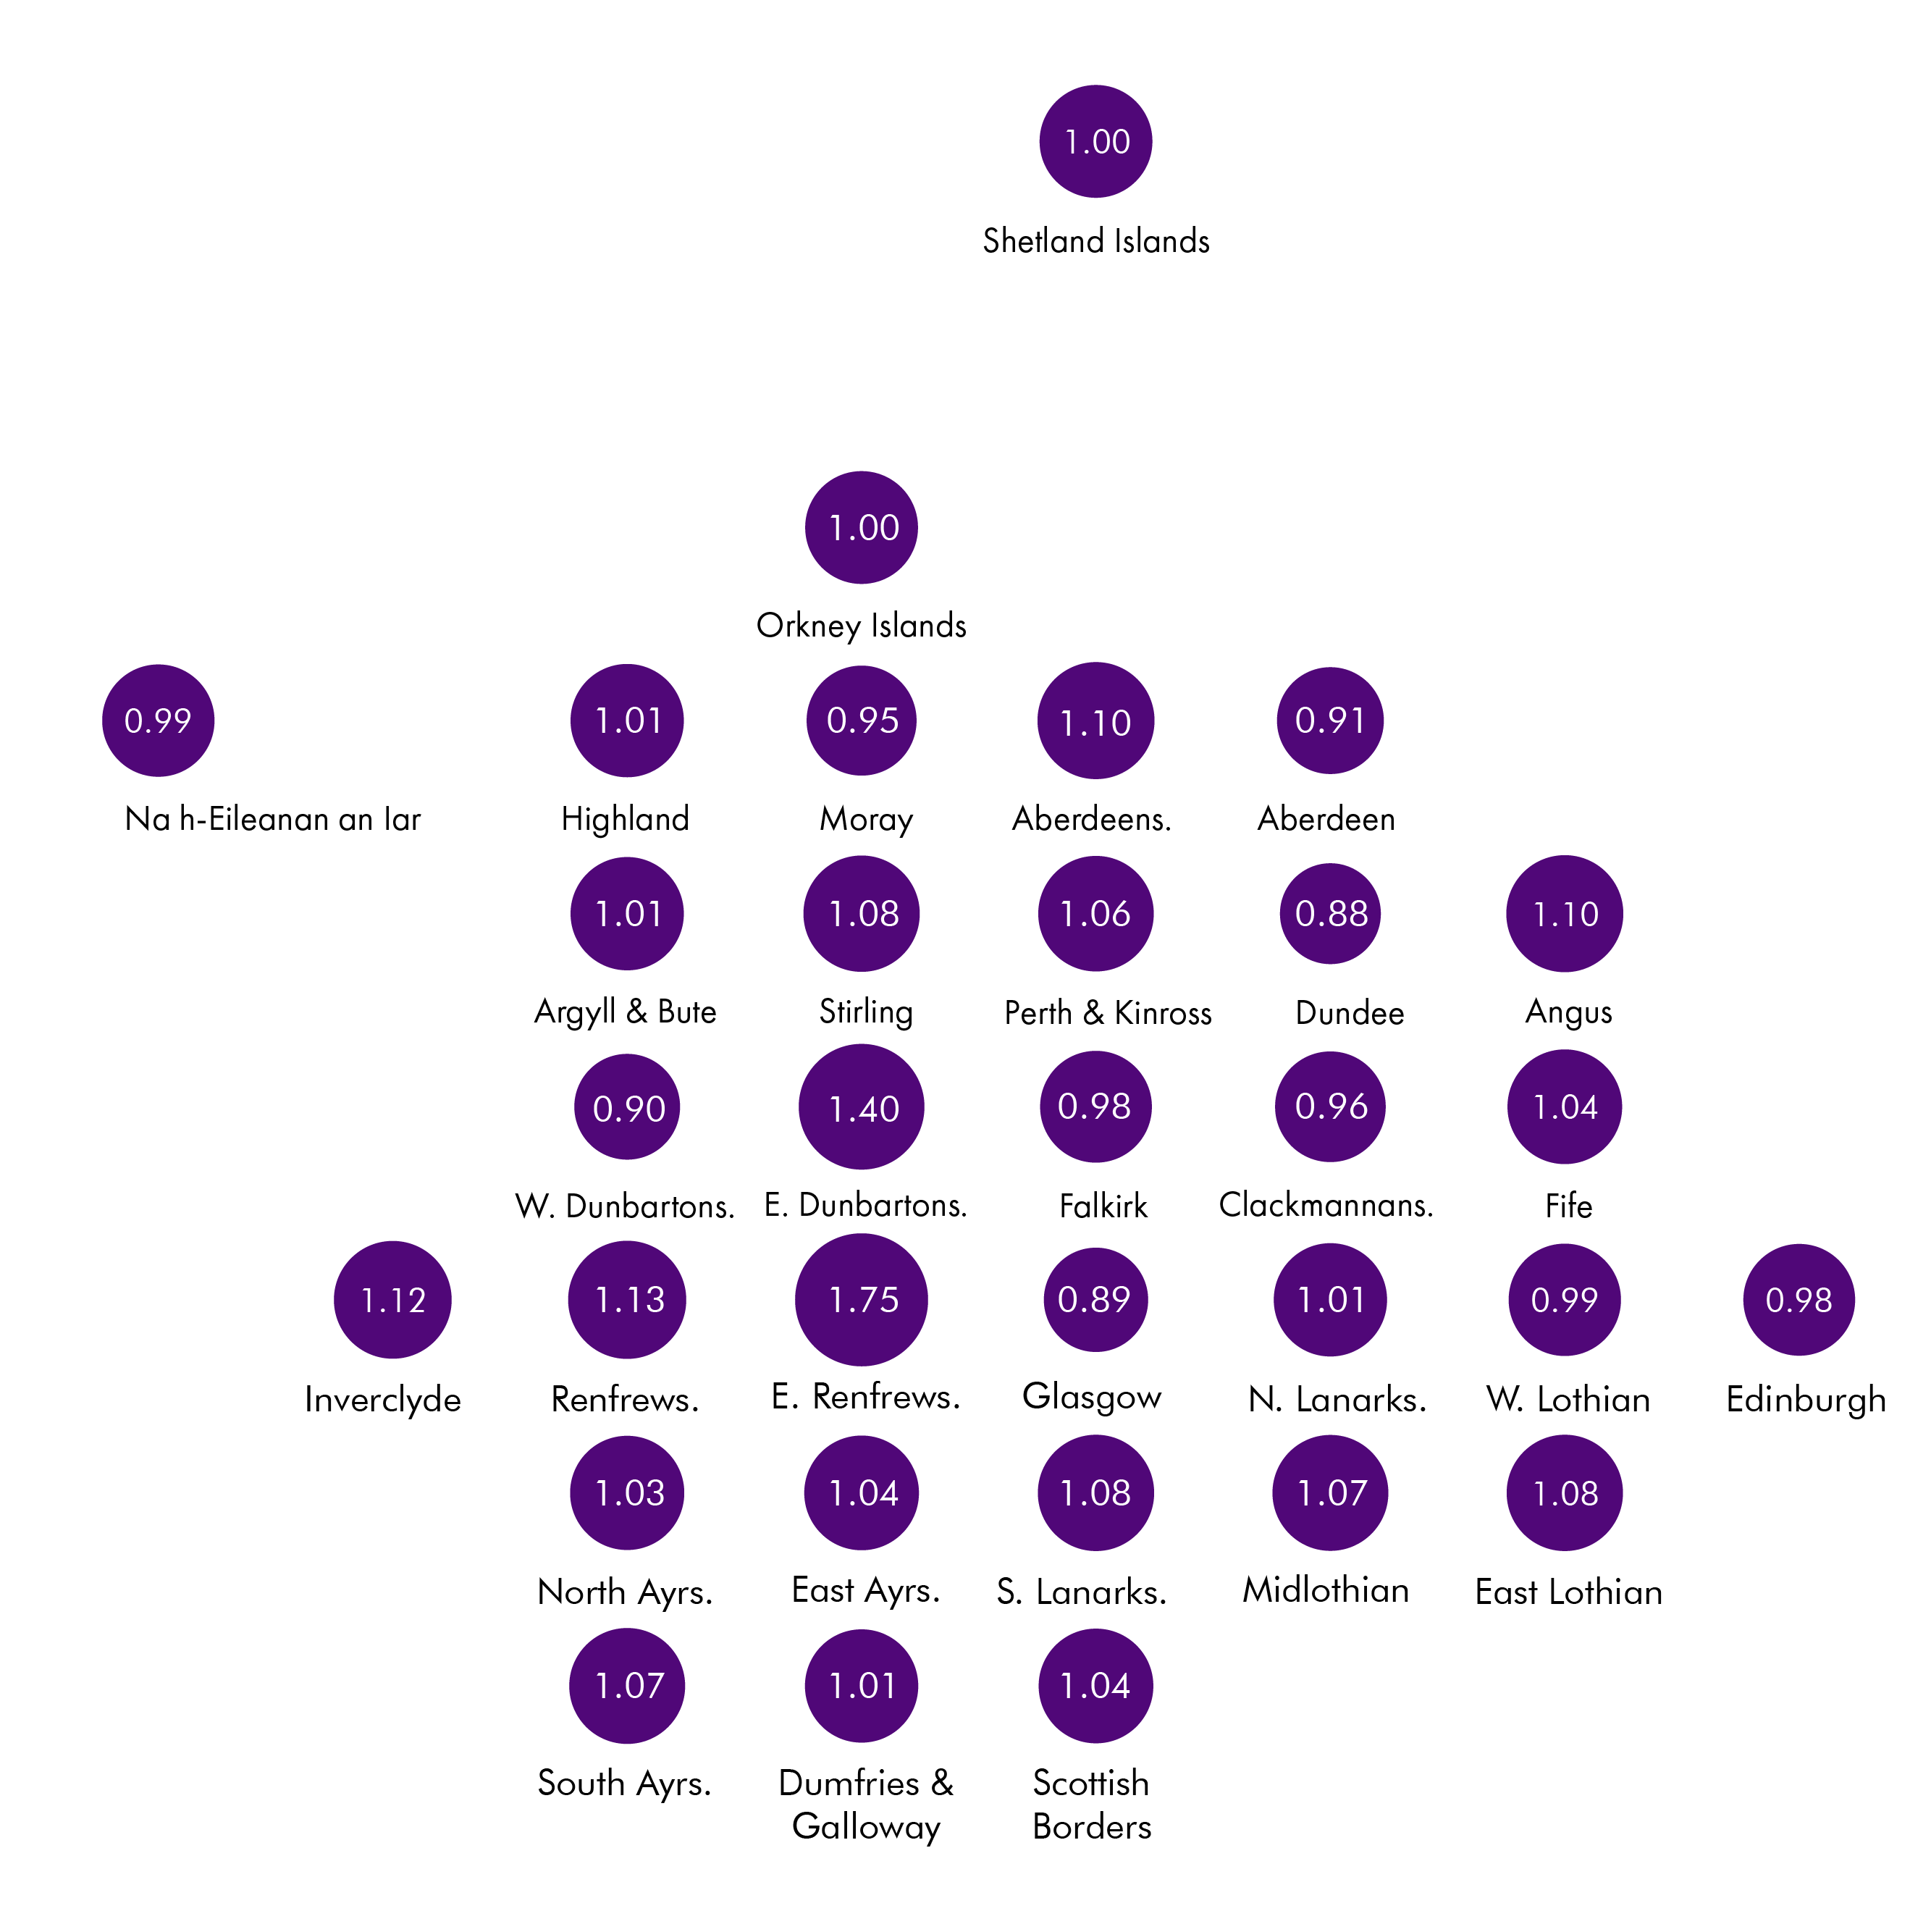
SPICe calculation based on Employee earnings in the UK: 2019
Commuter areas tend to have the highest residence pay to place of work pay ratio with East Renfrewshire having the highest at 1.75. Scotland's four largest cities all have lower rates of pay for the place of work analysis when compared to the residence analysis, with Dundee having the largest proportional gap across Scotland. Unsurprisingly, given the geography of the islands, Orkney, Shetland and Comhairle nan Eilean Siar have very little difference between place of work and residence pay. The data for the map can be found in the annex.
Annex
| Area | Workplace | Residence | Ratio |
|---|---|---|---|
| Aberdeen City | 15.33 | 13.92 | 0.91 |
| Aberdeenshire | 12.46 | 13.76 | 1.10 |
| Angus | 11.28 | 12.37 | 1.10 |
| Argyll and Bute | 12.29 | 12.42 | 1.01 |
| Clackmannanshire | 13.83 | 13.24 | 0.96 |
| Dumfries and Galloway | 10.67 | 10.79 | 1.01 |
| Dundee City | 14.2 | 12.55 | 0.88 |
| East Ayrshire | 12.3 | 12.83 | 1.04 |
| East Dunbartonshire | 12.12 | 16.92 | 1.40 |
| East Lothian | 13.91 | 14.97 | 1.08 |
| East Renfrewshire | 11.06 | 19.32 | 1.75 |
| Edinburgh | 15.03 | 14.74 | 0.98 |
| Falkirk | 13.17 | 12.89 | 0.98 |
| Fife | 12.19 | 12.69 | 1.04 |
| Glasgow City | 14.27 | 12.68 | 0.89 |
| Highland | 12.90 | 13.00 | 1.01 |
| Inverclyde | 10.56 | 11.87 | 1.12 |
| Midlothian | 12.74 | 13.61 | 1.07 |
| Moray | 12.2 | 11.65 | 0.95 |
| Na h-Eileanan Siar | 13.44 | 13.25 | 0.99 |
| North Ayrshire | 12.72 | 13.05 | 1.03 |
| North Lanarkshire | 12.98 | 13.15 | 1.01 |
| Orkney Islands | 12.71 | 12.67 | 1.00 |
| Perth and Kinross | 12.44 | 13.18 | 1.06 |
| Renfrewshire | 12.32 | 13.88 | 1.13 |
| Scottish Borders | 12.10 | 12.55 | 1.04 |
| Shetland Islands | 13.90 | 13.90 | 1.00 |
| South Ayrshire | 12.82 | 13.72 | 1.07 |
| South Lanarkshire | 12.82 | 13.82 | 1.08 |
| Stirling | 14.33 | 15.47 | 1.08 |
| West Dunbartonshire | 13.34 | 12.03 | 0.90 |
| West Lothian | 13.46 | 13.29 | 0.99 |
Employee Earnings in the UK 2019 and SPICe calculations
Sources
Office for National Statistics. (n.d.) Employee earnings in the UK: 2019. Retrieved from <a href="https://www.ons.gov.uk/releases/employeeearningsintheuk2019" target="_blank">https://www.ons.gov.uk/releases/employeeearningsintheuk2019</a> [accessed 5 November 2019]
Office for National Statistics. (2014, September 9). Annual Survey of Hours and Earnings, Low Pay and Annual Survey of Hours and Earnings Pension Results QMI. Retrieved from <a href="https://www.ons.gov.uk/employmentandlabourmarket/peopleinwork/earningsandworkinghours/qmis/annualsurveyofhoursandearningslowpayandannualsurveyofhoursandearningspensionresultsqmi" target="_blank">https://www.ons.gov.uk/employmentandlabourmarket/peopleinwork/earningsandworkinghours/qmis/annualsurveyofhoursandearningslowpayandannualsurveyofhoursandearningspensionresultsqmi</a> [accessed 27 October 2017]
Office for National Statistics. (2014, November 19). Public and Private Sector Earnings - November 2014. Retrieved from <a href="http://webarchive.nationalarchives.gov.uk/20160107090910/http://www.ons.gov.uk/ons/dcp171776_383355.pdf" target="_blank">http://webarchive.nationalarchives.gov.uk/20160107090910/http://www.ons.gov.uk/ons/dcp171776_383355.pdf</a> [accessed 01 November 2017]