Local Government Finance: facts and figures 2013-14 to 2018-19
This briefing provides a range of factual information and analysis on local government finance, including the profile of the local government budget over time, Council Tax and Non-Domestic Rates income, and fees and charges for services, from 2013-14 to 2018-19. This briefing does not aim to give a comprehensive overview of Local Government finance. Rather, it focuses on the most common questions asked of SPICe by MSPs.
Executive Summary
Local government finance is an increasing area of both political and public interest. Comparing changes to this complex area over time can be challenging because of the frequent re-profiling of services, and the need to ensure that like-for-like data is being compared. This briefing, in order to remove some of those challenges, looks primarily at the local government finance settlement from 2013-14 onwards. It does not explore the impact of additional policy commitments on the funds local government has available to deliver core services.
Key Messages
This briefing presents a range of clear, factual information around local government finance, including the following:
The local government settlement
In real terms, whilst both the Revenue and Total settlements for local government rose in 2014-15 and 2015-16, they fell sharply over the next two years. Between 2013-14 and 2017-18 there was a 7.1% fall (-£744.7m) in the local government Revenue settlement in real terms (2018-19 prices).
Local Government Finance Order figures suggest that there will be a 0.3% real terms increase (£28.7m) in the local government Revenue settlement between 2017-18 and 2018-19.
Comparison to Scottish Government
In real terms, between 2013-14 and 2017-18, the local government Revenue settlement decreased at a much faster rate (-7.1% or -£744.7m) than the Scottish Government Revenue budget (including NDRI) (-1.8% or -£547.3m).
Looking at Local Government Finance Order figures for 2017-18 to 2018-19, the Revenue settlement for local government increases by 0.3%, whilst the Scottish Government's Revenue budget continues to fall by 0.4%. It won't be possible to confirm until outturn data is available for 2018-19, but this suggests a reversal in the trend of recent years in which the local government Revenue settlement has fallen at a much steeper rate than that of the Scottish Government.
Share of the Scottish Government budget
In real terms, the local government Revenue settlement as a proportion of the Scottish Government Revenue budget decreased by 1.9 percentage points between 2013-14 and 2017-18.
Local Government Finance Order figures show local government Revenue as a proportion of Scottish Government Revenue increasing by 0.2 percentage points between 2017-18 and 2018-19.
Looking at both Revenue and Capital figures combined, local government's share of the Scottish Government budget decreased by 1.5 percentage points between 2013-14 and 2017-18. Local Government Finance Order figures suggest that this will increase slightly, by 0.2 percentage points, between 2017-18 and 2018-19.
Local Government funding per head
The greatest reduction in funding per head between 2013-14 and 2018-19 has been for Eilean Siar, at £504 per head. The greatest reduction in funding per head between 2013-14 and 2018-19 for a mainland authority has been for Argyll and Bute, which has seen its funding per head reduce by £288. It should be noted, however, that these changes represent both changes to population, and changes to funding, so should note be attributed solely to one or the other.
Orkney has seen the smallest change to funding per head between 2013-14 and 2018-19, at -£6. Of the mainland authorities, North Ayrshire has seen the most minimal change to its funding per head, with a £36 decrease between 2013-14 and 2018-19.
Council Tax
The average annual Council Tax bill for Bands A-D (which were unaffected by the 2017-18 change to multipliers as these only applied to bands E-H) has, between 2016-17 and 2018-19, increased by 5.2%. In cash terms, this ranged from a £40 increase for the average Band A property, to £59 for the average Band D property.
As would be expected, due to the multiplier increases, the average bill for properties in Bands E-H has increased at a steeper rate. Between 2016-17 and 2018-19 the average Council Tax bill for a Band H property has increased by £663, or 28.8%.
Income from fees and charges
In the years 2012-13 to 2015-16, General Fund (non-Housing Revenue Account, or non-HRA) income from fees and charges for services reduced year-on-year. However, between 2015-16 and 2016-17 there was a 7% increase, taking the income from fees and charges back to slightly over 2012-13 levels. This overall trend, however, will be affected by variations in the number of councils reporting income within individual service areas. Specifically, Arms-Length External Organistions (ALEOs) are used to deliver services to varying extents by different councils, and tend to be more prevalent in culture and leisure services.
Introduction
This briefing presents a range of statistical information on local government finance, to help inform parliamentary debate and answer regular questions that SPICe receives. It is focussed on those areas most commonly covered during parliamentary business, primarily the local government finance settlement as set out in the Scottish Government's local government finance circulars. It is therefore not a comprehensive survey of local government finance, like the Scottish Government's Local Government Finance Statistics, or the Accounts Commission's Overview and Financial Overview reports.
This briefing updates an annual series. Please see the related briefings list for past iterations of this briefing and information on other SPICe work in this area.
Early in this briefing series, data stretched back to 1999, however, in last year's briefing, the decision was taken to look at data from 2010-11 onwards only due to the increasing complexity of comparing local government finance over time. To further improve the time series and remove comparability issues relating to the removal of police and fire services from the local government settlement (explored in the next section), this briefing looks at local government finance from 2013-14 onwards. The exception to this falls within the sections on Council Tax and non-domestic rates income (NDRI), and on income from fees and charges to service users.
The data are drawn from a number of publicly available Scottish Government and local government publications. In most cases, data goes to 2018-19, but in some cases data (generally outturn data) is only available to 2016-17.
This briefing presents a number of figures in "real terms" to allow more meaningful year on year comparisons taking account of inflation. In most cases, real terms figures are in 2018-19 prices, using the latest HM Treasury deflators, as published in April 2018. The exception to this is figures showing changes to fees and charges income, which is represented in 2016-17 prices as this is the most recent year available in the dataset. Figures relating to Council Tax (and associated NDRI figures) are shown in cash terms as 2018-19 income figures are estimated figures based on 2017-18 outturn.
A number of abbreviations are used in this briefing - a full list is available at the end of the briefing.
The local government settlement
Presenting the figures
In the 2017 iteration of this briefing1, which covered 2010-11 to 2017-18, two new methodologies were introduced:
The first removed funding for police and fire services for the years prior to 2013-14. This was to make year-on-year comparisons more meaningful following the transfer of responsibility (and the associated funding of more than £0.5bn) to the new centralised police and fire services in 2013-14. This methodology was developed and used in partnership with Auditors at Audit Scotland. Whilst adjusted data from 2010-11 onwards was used in last year's briefing to allow a longer-term comparison, the briefing presented and recommended the use of data from 2013-14 onwards for greater comparability.
The second methodology change sought to resolve challenges around comparing year-on-year data based on the Budget timetable. When exploring the historical trend in local government finance settlements, comparing outturn figures for one year to draft budget figures for the next can be problematic. This is in part because further allocations are typically made to local authorities in-year. For the sake of providing an accurate comparison, outturn data is used for historic comparisons up to the previous financial year. In order to compare the current financial year to the previous financial year, the final settlement (as opposed to final outturn) published in the Local Government Finance Order (LGFO) for each year is compared.
There are now five years of outturn data available since the police and fire changes were made to the local government finance settlement. For that reason, this briefing uses 2013-14 as a baseline year in most instances, removing the need to make police and fire adjustments. There are some exceptions to the baseline year:
Figures on Council Tax and NDRI, which were unaffected by the police and fire changes, go back to 2010-11 to allow a longer-term trend.
Figures on income from fees and charges go back to 2012-13 to allow a five year trend (as the most recent figures date from 2016-17).
As in last year's briefing, in most instances final outturn data is used to compare the longer term trend, with LGFO figures being used to give an indication of the trend for 2017-18 to 2018-19. The exception of this is the per head section, where LGFO figures are used throughout.
As part of the Scottish Government's funding settlement, local authorities are expected to meet certain commitments in return for the full funding package. For 2017-18, for example, local government was expected to maintain the pupil:teacher ratio at 2016 levels, and to secure places for all probationers under the teacher induction scheme. Whilst these commitments can have an effect on the funding available to local authorities to deliver core services, this briefing looks purely at the top-line settlement figures, and does not address the impacts of policy commitments. More detailed discussion on policy commitments can be found in SPICe's Draft Budget 2018-19 briefing on provisional allocations to local authorities: Local Government Finance: Draft Budget 2018-19 and provisional allocations to local authorities2.
Additional funding in 2018-19
At Stage 1 of the Budget Bill the Scottish Government announced1 that £34.5m of additional funding for 2018-19 would be paid in 2017-18. This £34.5m is part of the 2018-19 settlement but as it is being funded from Scottish Government underspends in 2017-18 it is actually being paid on 28 March 2018 and will be recorded as funding in the 2017-18 financial year.
This change means that care must be taken in comparing Local Government Finance Circular data over time. Typically, the final column of Annex B of the Local Government Finance Circular accompanying the Local Government Finance Order will show the final individual Revenue allocations for each local authority in that year. In the case of 2018-19 however, because of the additional funding, Annex L must instead be used. This final summary Annex was only introduced in 2015, meaning that one would have to source data on individual local authority allocations from different sections of the finance circular depending on the year.
Real terms change
A common way of assessing and analysing the total local government budget is to look at the real terms change over time. As noted in the previous section, long-term comparisons over the period up to 2017-18 are made using outturn figures (with 2013-14 as the baseline year), and LGFO figures are used to explore the trend between 2016-17 and 2018-19.
Figures in this section are presented in both monetary and percentage terms, with the latter allowing for easy comparability between different years. Full figures can be found in the annex tables to this briefing.
As Revenue figures represent the core funding available for the delivery of services, and Capital figures can vary widely year-on-year, there is a focus on Revenue figures in these sections.
Figure 1 shows the annual real terms change in the local government Revenue settlement, and demonstrates the difference between LGFO and outturn figures. Figures can be found in Annex Table 1.
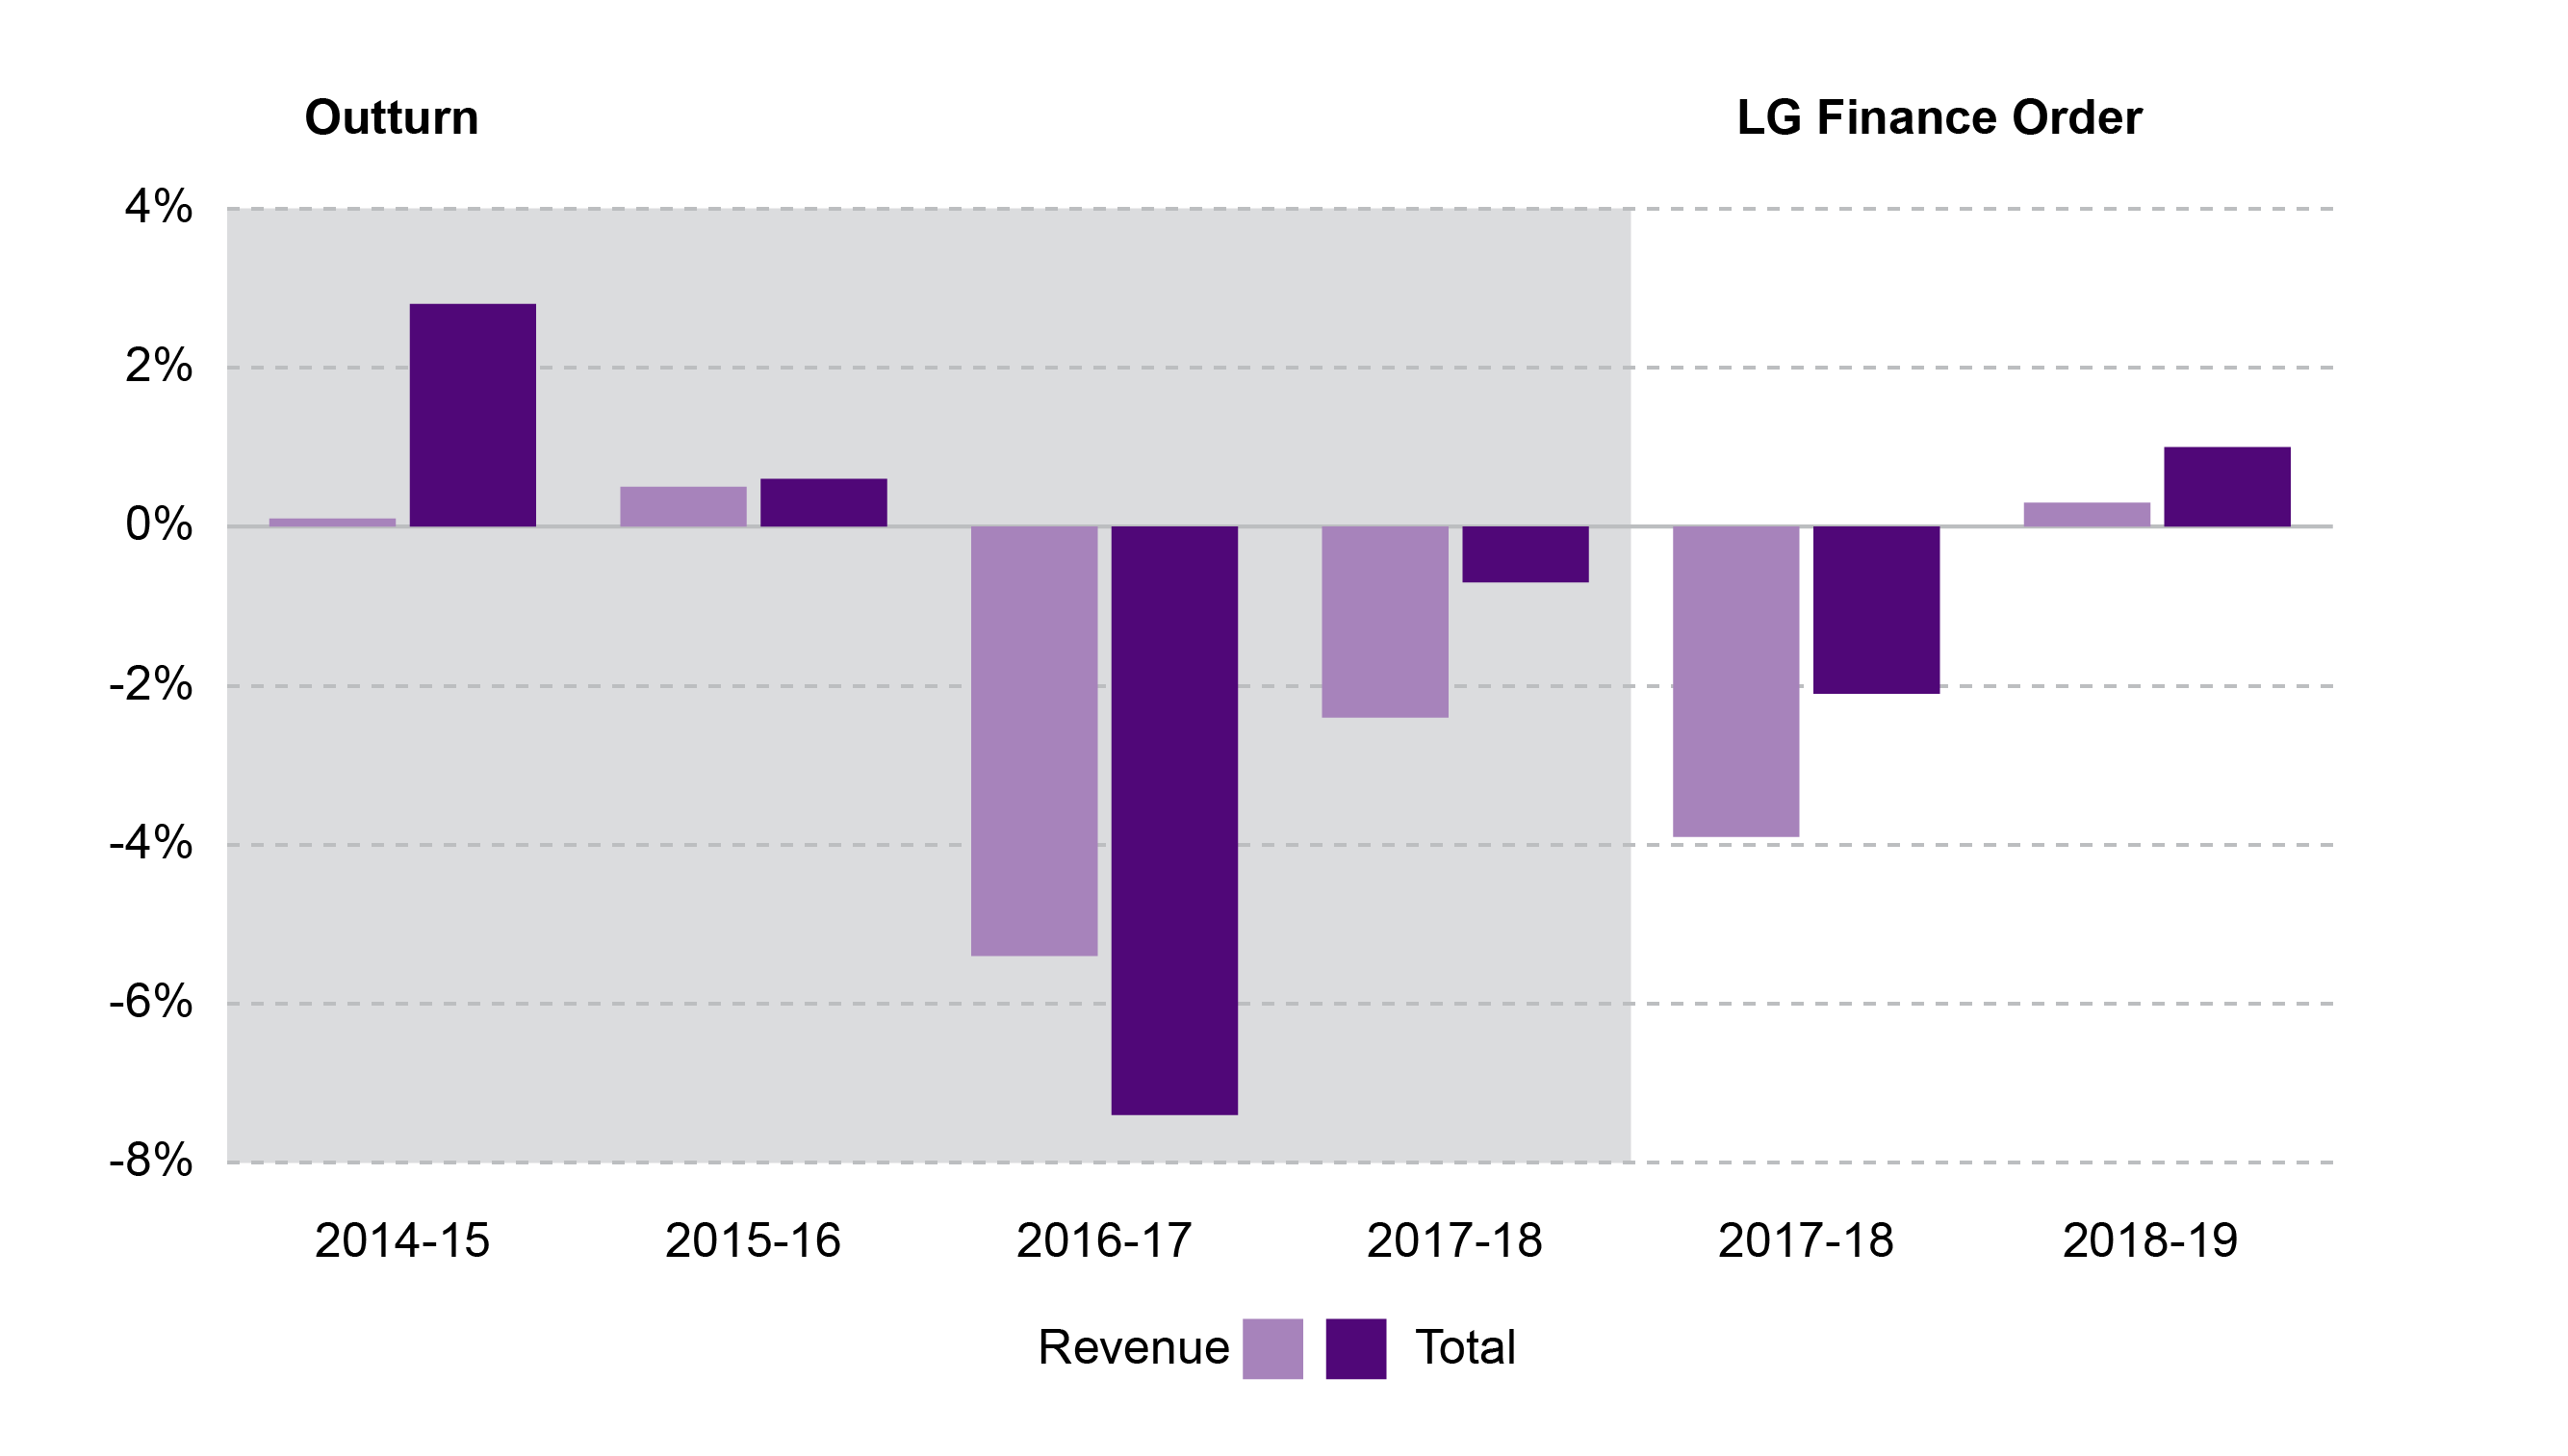
Whilst both the Revenue and Total settlements rose in 2014-15 and 2015-16, they fell sharply over the next two years. Between 2013-14 and 2017-18 there was a 7.1% fall (-£744.7m) in the local government Revenue settlement in real terms.
LGFO figures for 2017-18 suggested a fall of 3.9% (-£230.6m) in the Revenue settlement between 2016-17 and 2017-18. Outturn figures, however, show that in reality this fall was less, at -2.4% (-£70.9m). This is because there are typically additional allocations to local authorities in-year.
LGFO figures suggest that there will be a 0.3% increase (£28.7m) in the local government Revenue settlement between 2017-18 and 2018-19.
Local government and Scottish Government comparison
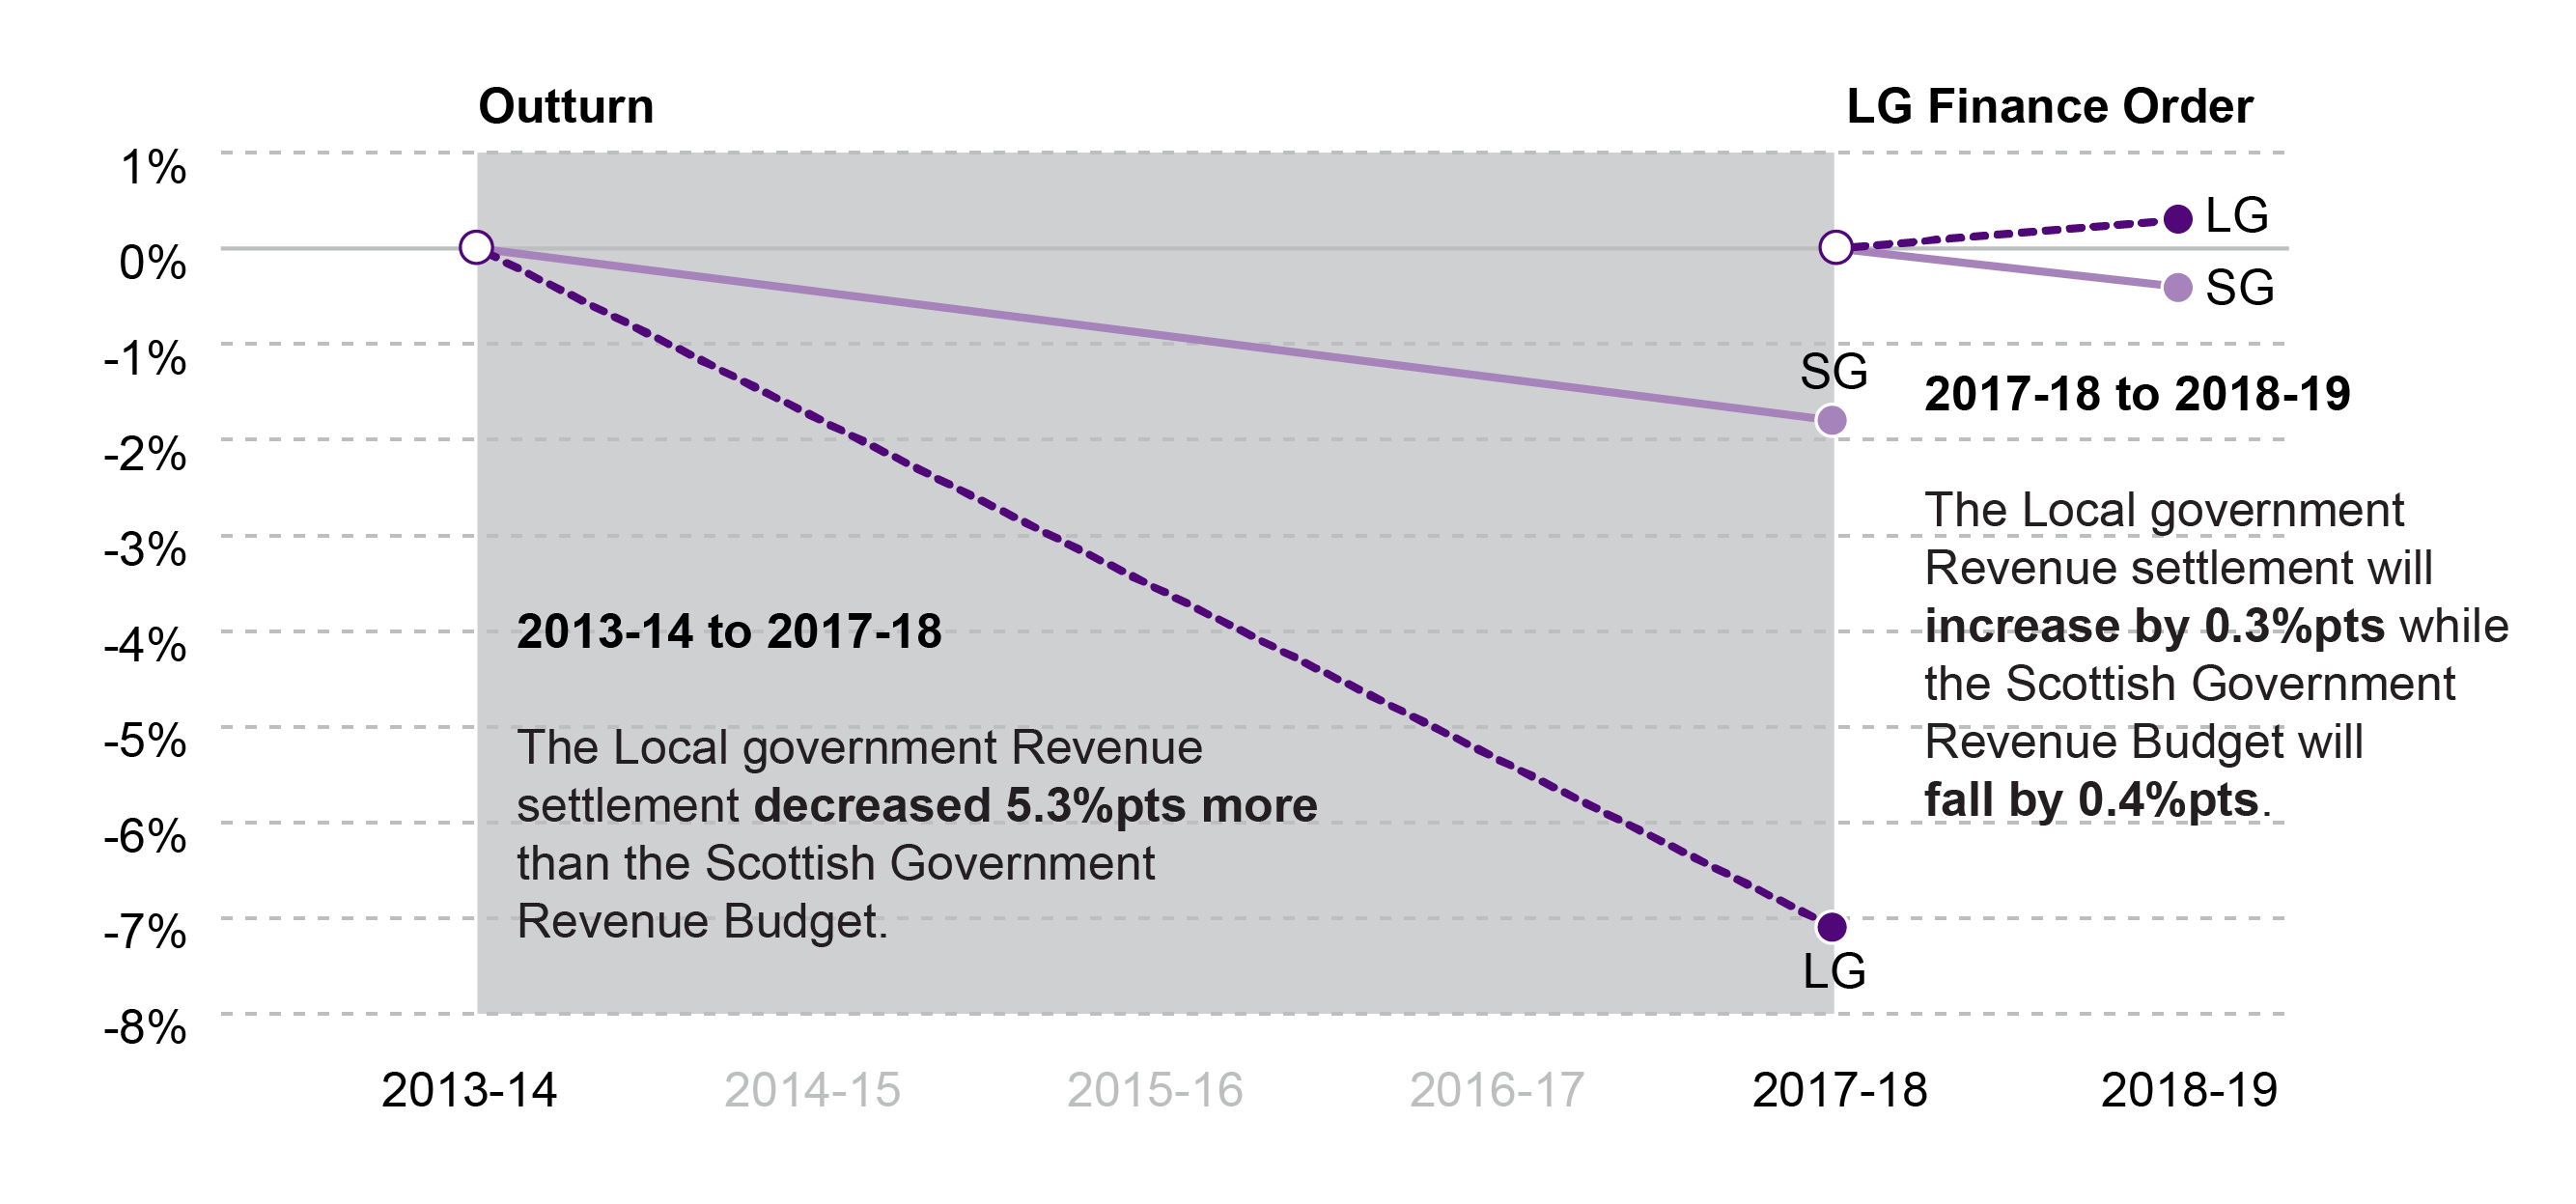
Figure 2 compares long-term changes to the local government Revenue settlement to those in the Scottish Government Revenue budget.
The real terms change figures show that between 2013-14 and 2017-18, the local government Revenue settlement decreased at a much faster rate (-7.1% or £744.7m) than the Scottish Government Revenue budget (-1.8% or £547.3m). Non-Domestic Rates Income is included in both local government and Scottish Government figures.
Looking at the LGFO figures for 2017-18 to 2018-19, the Revenue settlement for local government increases by 0.3%, whilst the Scottish Government's Revenue budget continues to fall by 0.4%. It won't be possible to confirm until outturn data is available for 2018-19, but this suggests a reversal in the trend of recent years in which the local government Revenue settlement has fallen at a much steeper rate than that of the Scottish Government.
This briefing focuses on the local government finance settlement as set out in the Local Government finance circulars. However, during scrutiny of the Draft Budget 2017-18, the Scottish Government included 'Other sources of support' in its headline figures relating to the local government settlement (these did not appear in the Local Government Finance Circular). This included funding for Health and Social Care Integration, and additional income expected from Council tax reform. However, the money for Health and Social Care Integration was already included in the Health budget totals, and therefore contributed to the real terms growth in the Health budget1.
In the 2018-19 Draft Budget, these funds were referenced, but not included in the 'Total Draft Budget Local Government Settlement'2. SPICe discusses these issues, and the potential impact on local government funding, in its annual budget briefings, see: Local Government Finance: Draft Budget 2018-19 and provisional allocations to local authorities.3
If, however, the additional monies for Health and Social Care Integration were to be included alongside the local government Revenue settlement, there would have been a 3.7% fall in real terms in revenue funding for local government between 2013-14 and 2017-18. If the Health and Social Care Integration funding is added to Local Government Finance Circular figures for 2017-18 to 2018-19, there would be a predicted 0.2% increase in the revenue settlement for local authorities.
Share of the Scottish Government Budget
In this section, local government's percentage share of the Scottish Government's budget since 2013-14 is presented in real (2018-19) terms.
In these calculations, the Revenue and Capital figures are presented separately, along with the total for the local government settlement. Therefore, to make the figures comparable, the Scottish Government figures include all fiscal Revenue DEL (more recently titled Fiscal Resource Budget Limit in Budget documents) and NDRI.
Figure 3 looks at the local government revenue, capital and total settlement as a proportion respectively of the Scottish Government's revenue, capital and total budget.
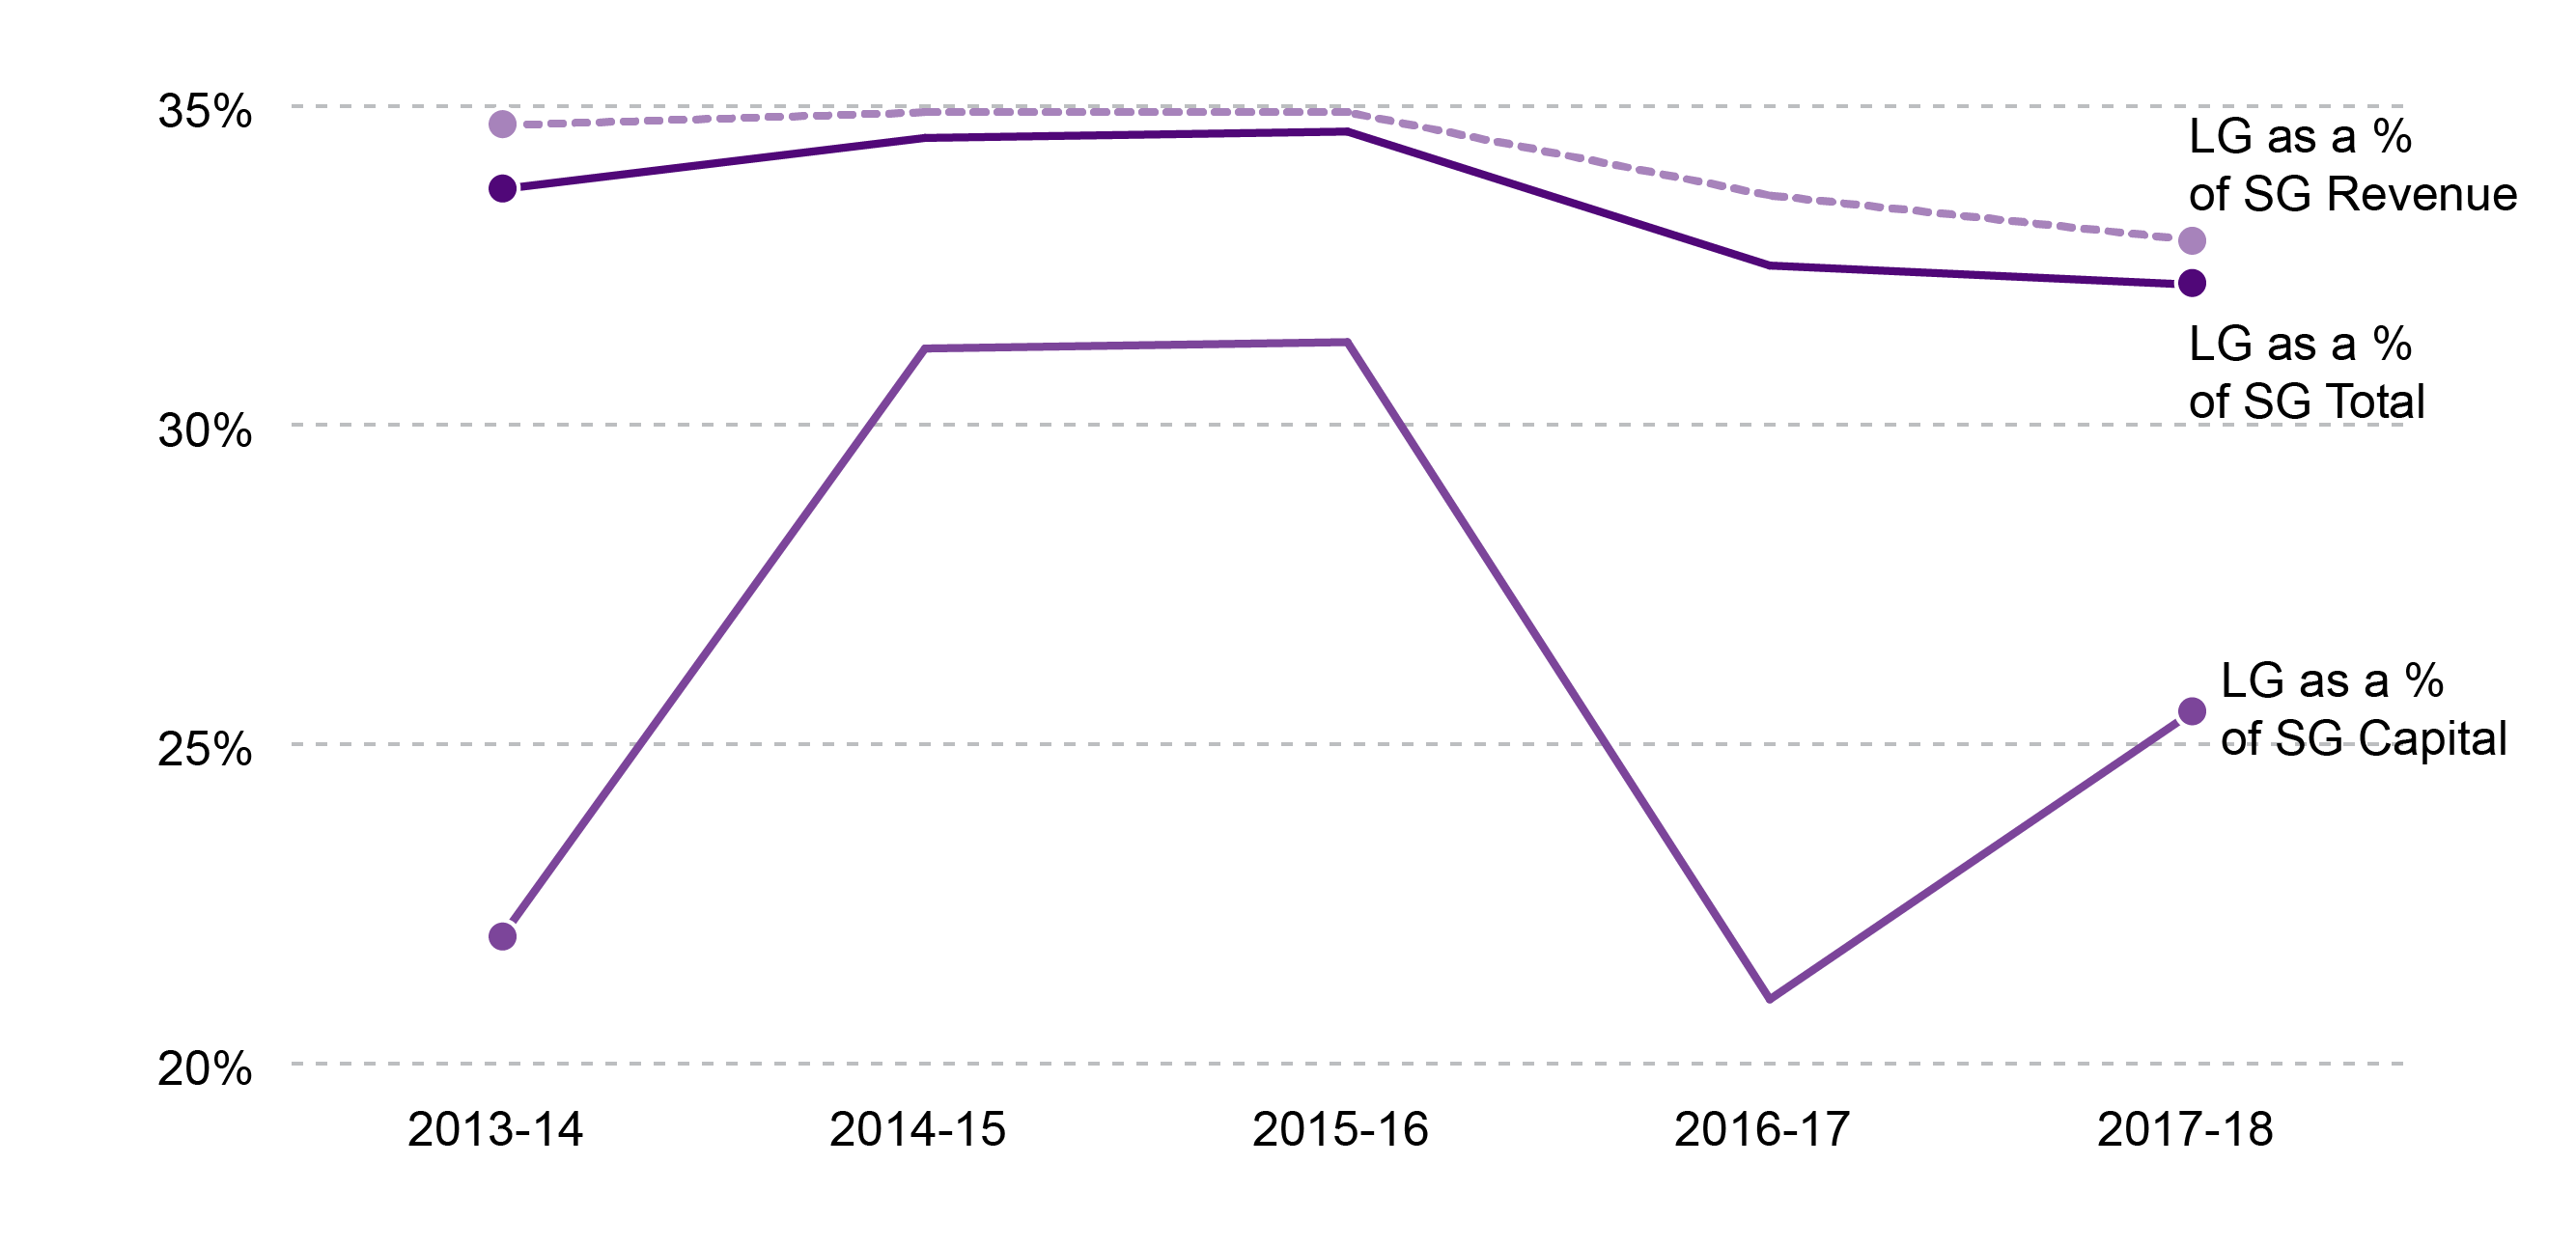
As noted, it is important to look at Revenue and Capital figures separately, as Revenue funding alone represents the funding available for local authorities to deliver core services. It should also be noted that Capital figures can vary widely year-on-year.
Revenue figures:
The local government Revenue settlement as a proportion of the Scottish Government Revenue budget decreased by 1.9 percentage points between 2013-14 and 2017-18.
But, LGFO figures, detailed in Annex Tables 2 and 3, show LG Revenue as a proportion of SG Revenue increasing by 0.2 percentage points between 2017-18 and 2018-19.
It is worth noting that in 2013-14, NDRI made up 25% of the local government Revenue settlement. By 2017-18, this had risen to 28%, reflecting that NDRI is making up an increasing share of the final LG Revenue budget.
Capital figures:
As noted, Capital figures, by comparison, vary much more widely than Revenue figures, which can be seen from the chart. This is mainly because the Capital grant was re-profiled over a number of years.
Total settlement:
Looking at both Revenue and Capital figures combined, local government's share of the Scottish Government's budget decreased by 1.5 percentage points between 2013-14 and 2017-18.
LGFO figures suggest that this will increase slightly, by 0.2 percentage points, between 2017-18 and 2018-19.
Local Government settlement per head
One way of looking at changes in the local government settlement over time is to explore the impact on funding for local authorities per head. The SPICe Briefing Local Government Finance: Draft Budget 2018-19 and provisional allocations to local authorities1 explores the 2018-19 Draft Budget figures, but not the longer term trends.
In order to provide a comparable trend over time, up to the current year, all figures in this section have been taken from the Local Government Finance Order stage of the budget process as opposed to using final outturn figures. Real terms figures are detailed in Annex Table 5, and full tables are available from SPICe on request. Population figures for 2018-19 are taken from the most recent available data, from mid-2017, and previous years are taken from an equivalent point (i.e. 2016 figures for 2017-18 and so forth).
It's important to note that changes to per head funding do not simply represent changes to the Revenue settlement - they also reflect population changes, so the figures below should be attributed to a combination of funding changes and population changes as opposed to solely funding changes. Annex Table 5 shows the relative changes to population and funding. For example, between 2013-14 and 2017-18, Midlothian's funding per head changed by -£141 in real terms, which can be attributed to a -1% change in funding, and a 6.2% increase in population. By comparison, North Lanarkshire's funding per head changed by a similar -£145 in real terms, but the population increased by a minimal 0.5% so this change is more likely to be a result of a 6.8% fall in funding.
Because of adjustments made to the settlement package for island authorities, the narrative differentiates between island and mainland authorities.
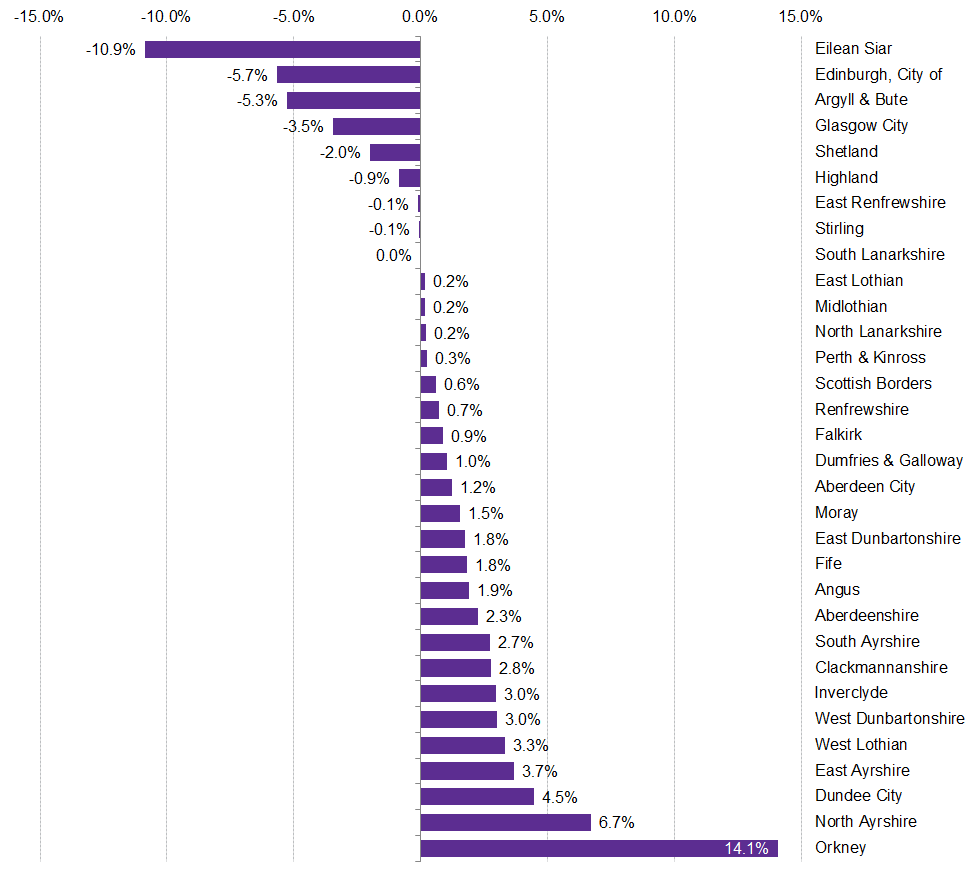
Figure 4 shows the change in £ funding per head across all local authorities.
The greatest reduction in funding per head between 2013-14 and 2018-19 has been for Eilean Siar, at £504 per head. The greatest reduction in funding per head between 2013-14 and 2018-19 for a mainland authority has been for Argyll and Bute, which has seen its funding per head reduce by £288.
Orkney has seen the smallest change to funding per head between 2013-14 and 2018-19, at -£6. Of the mainland authorities, North Ayrshire has seen the most minimal change to its funding per head, with a £36 decrease between 2013-14 and 2018-19.

Figure 5 shows changes to the percentage of the Scottish average per head funding by local authority. It's worth noting that the high populations of Edinburgh and Glasgow, and falling per head figures in those local authorities, have skewed the Scottish per head average.
Amongst the mainland authorities, City of Edinburgh has seen its funding per head, as a percentage of the Scottish average, fall by 5.7 percentage points between 2013-14 and 2018-19.
North Ayrshire, by comparison, has seen the greatest increase of the mainland authorities to its funding per head as a percentage of the Scottish Average, with a 6.7 percentage point uplift.
The island authority with the greatest percentage point change is Eilean Siar, with a 10.9 percentage point decrease between 2013-14 and 2018-19. Orkney has seen, by comparison, a 14.1 percentage point increase.
South Lanarkshire has seen no change to its funding per head as a percentage of the Scottish average. In 2018-19, South Lanarkshire, along with East Renfrewshire, Stirling, East Lothian, Midlothian, North Lanarkshire and Perth and Kinross were all allocated a per head funding settlement as a proportion of the Scottish average within 0.5 percentage points of their 2013-14 settlement.
85% funding floor
The Scottish Government has made the commitment that no local authority will receive less than 85% of the Scottish average per head in terms of Revenue support. This basis for this calculation has changed over recent years, but now also includes funding from Council Tax income. The "85% floor" is calculated by taking these revenue allocations and the assumed Council Tax income figures, and then adjusting for any outliers.
This means that, for this calculation, councils with very high per head allocations (in effect the island local authorities and Argyll and Bute) have their allocations adjusted down. This does not mean their actual allocations are reduced - it is only for the purposes of this calculation. These adjustments are made, and then a new set of per head allocations are calculated. The "cap" for 2018-19 was set at 115% of the combined total Revenue + Council Tax income average. Once this calculation was made, only Aberdeen City Council came out as being below the 85% floor. The revised calculations in January 2018 resulted in Aberdeen receiving an additional £8.7m, which rounded its total allocation to 85% of the Scottish average. The calculation for the 85% floor in 2018-19 is detailed in Annex Table 6. However, it is worth repeating that the adjustments made in this table are only for the purposes of this calculation, and no local authority loses money as a result of the 85% floor.
The floors are calculated at the time of the original consultation Finance Circular in December (which accompanied the Draft Budget), and only re-opened if any adjustments are required as a result of the consultation period.
Council Tax and Non Domestic Rates income
Non-domestic Rates (NDR) are collected by individual councils and pooled by the Scottish Government, who then redistribute it to councils as part of the overall annual local government revenue funding settlement. This is an accounting exercise and local authorities do not actually transfer all their NDR income to Government. Rather, an adjustment is made at the end of the year dependent on what each local authority has collected and what its share of the distributable amount (see below) is. The Government guarantees the level of NDRI + General Revenue Grant to each local authority. Therefore the total amount of money given to each council is not dependent on their NDRI.
The Scottish Government sets out each year in the Draft Budget the amount to be redistributed to councils (the "distributable amount"). This is a policy decision. This amount is then distributed to councils in proportion to their prior-year estimates of what they will raise. For example, Aberdeen City Council's estimate of their 2016-17 NDRI accounted for 7.7% of all councils' estimated contributions and they were allocated 7.7% of the 2017-18 distributable amount determined by the Scottish Government.
Council Tax was frozen at 2007-08 rates between 2008-09 and 2016-17. During this period, the Scottish Government "funded" the freeze through the provision of an additional £70m of funding for local authorities each year of the freeze. It's worth highlighting that the increase shown in Council Tax revenue over the period of the Council Tax freeze reflects changes in the tax base (new houses being built, revaluations of existing properties and changes in the composition of households paying Council Tax).
Figure 6 below shows the trend in income from Council Tax and Non-Domestic Rates since 2010.
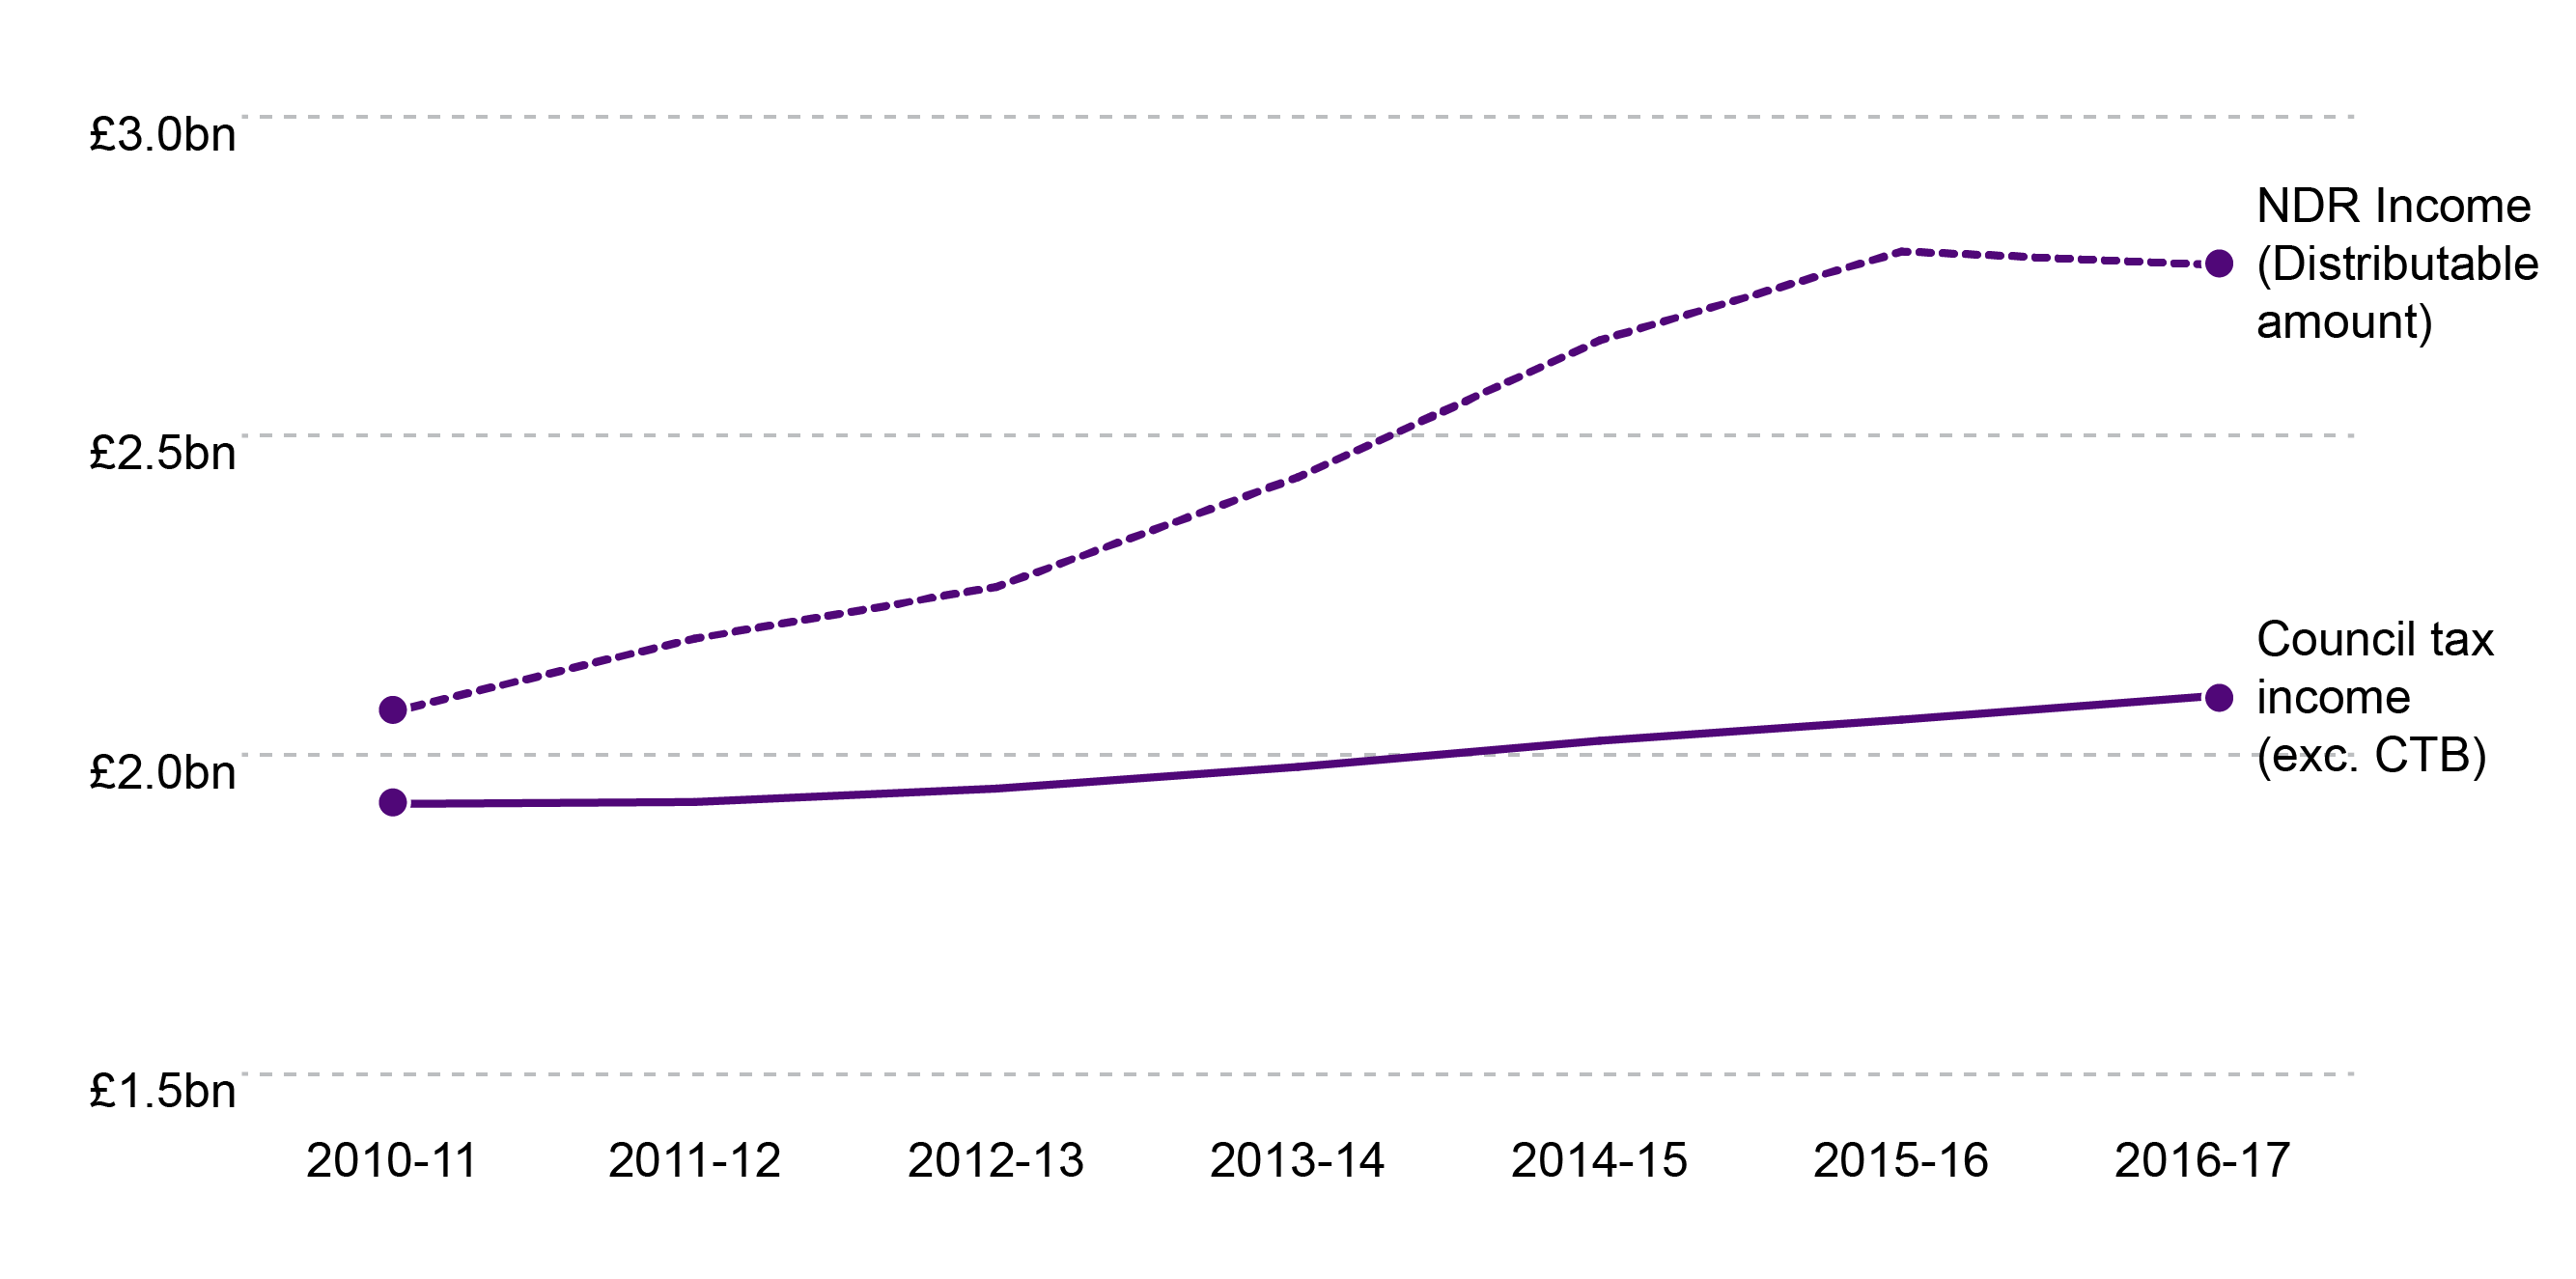
The Council Tax freeze was agreed between the Scottish Government and COSLA in 2008-09, and as a result of this, and increases in NDRI, the following years saw NDRI make up an increasingly higher proportion of income than Council Tax.
The Council Tax freeze ended in 2017-18, and the end of the freeze was accompanied by wider Council Tax reform. Although, at the time of writing, some time has passed since the end of the freeze, the impact of these changes on the relative balance between Council Tax and NDRI will not be traceable on a like-for-like basis until Local Government Finance Statistics for 2017-18 are published, which, based on previous publication dates, will be the final Tuesday in February 2019.
Council Tax reform
As discussed in the 2017-18 iteration of this briefing, the Scottish Government introduced two key changes to Council Tax in 2017-18.
In March 2016, the Scottish Government1 published its proposals for reform of the Council Tax, which focused primarily on adjusting the ratio to Band D of Bands E-H. The Scottish Government estimated that this would generate an additional £100m a year (net of consequential impacts to the Council Tax Reduction Scheme) in direct revenue for councils (not taking into account other proposed changes to Council Tax).The Council Tax (Substitution of Proportion) (Scotland) Order 20162 was agreed to by Parliament on 3 November 2016, and the new multipliers came into effect on 1 April 2017.
In addition to the changes to multipliers, upon the end of the Council Tax freeze in 2017-18, the 2017-18 Local Government Finance settlement included an agreement between the Scottish Government and local government for locally determined Council Tax increases to be capped at 3%. At this point, 21 councils opted to increase the Band D rate of Council Tax (against which all other Bands are set) by the full 3%. Three councils chose increases of 2% or 2.5%, and eight councils opted to apply no increase.
The 3% cap on locally determined Council Tax increases was again agreed for 2018-19, and all 32 local authorities opted to increase Council Tax by the full 3%.
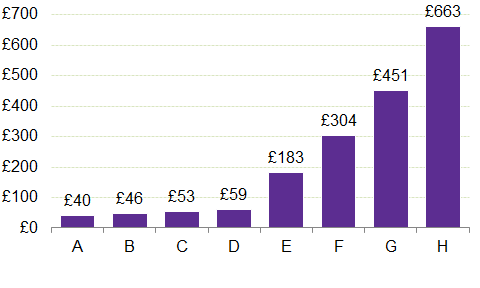
Figure 7 shows the cumulative impact of Council Tax reform over the first two years, with figures kept in cash terms. Percentage changes are set out in Annex Table 8.
Bands A-H all saw minimal increases, with a £40 increase for the average Band A property, rising to £59 for the average Band D property. The average Council Tax bill for bands A-D (which were unaffected by the change to multipliers) has, between 2016-17 and 2018-19, increased by 5.2%.
As would be expected, due to the multiplier increases, the average bill for properties in Bands E-H has increased at a steeper rate. Between 2016-17 and 2018-19 the average Council Tax bill for a Band H property has increased by £663, or 28.8%.
It must be noted, however, that the actual increase in Council Tax bills will vary, both because of the different Band 'landscape' in each local authority, and because not all local authorities chose to impose a 3% rate increase in 2017-18.
Council Tax income
Figure 8 shows the impact of the changes on each local authority. These figures represent revenue calculated taking account of all discounts and exemptions, and the collection rate, but do not take account of Council Tax Reduction (CTR). They are therefore on the basis of the assumed Council Tax income element of the local government finance settlement.
Note that:
Local authorities are funded separately for the Council Tax income they forego due to CTR.
As noted, and unlike other sections of this briefing, figures here are given in cash terms and do not take into account of inflation. This is because 2018-19 figures are estimates based on applying a 3% increase to 2017-18 figures, as opposed to a final outturn figure.
These figures are gross figures which fall in line with the figures in the Local Government Finance settlement, as opposed to net figures which show the actual revenue from Council Tax received by local authorities.
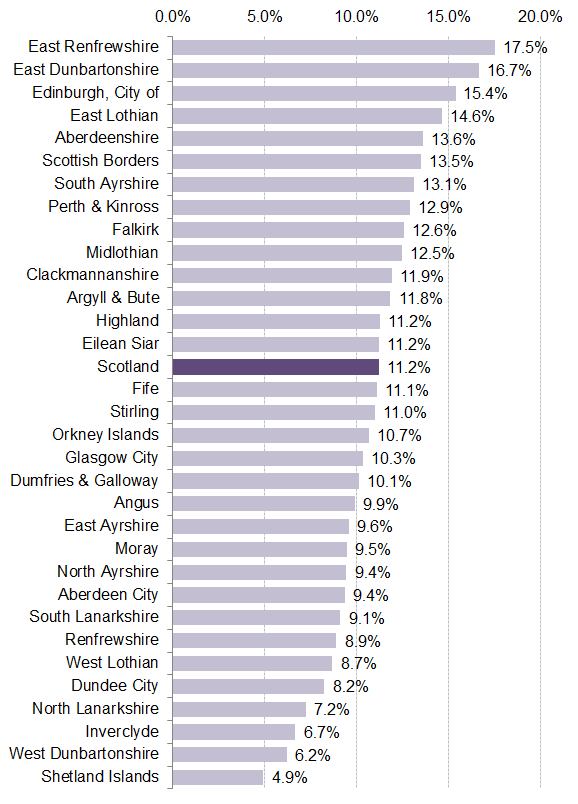
The variations illustrate the relative Council Tax 'story' of each authority - some local authorities have higher proportions of low-band properties, whilst others tend to have higher levels of Band E-H properties. Because all, as opposed to some, councils opted to apply the full 3% increase in 2018-19, there has been a compounding effect to the increases in certain local authorities, and, as a result, some change in the landscape of Council Tax revenue since 2016-17 compared to what was shown in Figure 8 of last year's Facts and Figures briefing.
As might be expected, those local authorities which chose to apply the full 3% increase to the Band D rate in 2017-18, and which also have a higher proportion of Band E-H properties, have retained the highest increase in income.
Those local authorities which saw a high uplift in revenue from the multiplier changes, and chose not to apply a Band D increase in 2017-18, have predictably found themselves with a lower revenue uplift than might be expected based on their number of higher band properties. This applies specifically to Stirling and Aberdeen City.
Those local authorities that did not apply a 3% increase in 2017-18, and also stood to have minimal gains from the changes to multipliers, have had among the lowest increase in Council Tax revenue between 2016-17 and 2018-19. However, Shetland Islands, which applied a 3% increase in 2017-18 but gained little from the multiplier changes, has seen the lowest uplift in revenue overall.
Income from fees and charges for council services
In addition to funding received from the Scottish Government and income generated through NDR and Council Tax, local authorities can increase revenue through fees and charges for services. These are set by each individual council, so there are large variances across the country. Some services which are offered by all councils, such as burial and cremation services, will have varying fees. Other services may not be offered by all councils, and may be offered without a fee in some places, or for a fee elsewhere. There will also be varying use of Arms-Length External Organisations (ALEOs), which are used to deliver services predominantly within culture and leisure services, but not by all local authorities.
SPICe gave an overview of fees and charges in Local Government Finance: Facts and Figures 2010-11 to 2017-181, and found that between 2010-11 and 2015-16, income for Scottish local government as a whole from fees and charges for services had increased by almost 13%, with the most significant increases in charging being in Central Services, Planning and Development Services, Education and Roads and Transport.
In November 2017, SPICe produced a full briefing on fees and charges2. This was based on a revised methodology, using Local Financial Return statistics collated by (and provided by) the Scottish Government, and developed in collaboration with Audit Scotland. This found that-
Excluding HRA income, local authorities received customer and client receipts of £1.26bn - around 8% of councils’ total income in 2015-16. Fees and charges for General Fund services made up around 40% of these customer and client receipts in 2015-16 (£544.2m) i.e. around 3.5% of councils' total income.
Between 2011-12 and 2015-16 the income that councils raised from fees and charges to service users reduced from £569.7m to £544.2m (4.5%, real terms).
The largest area of income from fees and charges for General Fund services came from Social Work (44%), with Roads (12%) and Education (11%) representing the next largest areas of income. Combined, these represented around two thirds of fees and charges income in 2015-16.
The following sections update the high-level data in the Fees and Charges briefing, looking at the years 2012-13 to 2016-17. To compare the income councils are raising from charging for services over time figures have been adjusted into 2016-17 real terms.
General fund income from fees and and charges
Figure 9 updates Figure 3 of the Fees and Charges briefing and shows that, between 2012-13 and 2016-17, the income that the 32 councils raised from fees and charges to service users increased from £594.4m to £597.6m in real terms (+1%). This excludes HRA income.
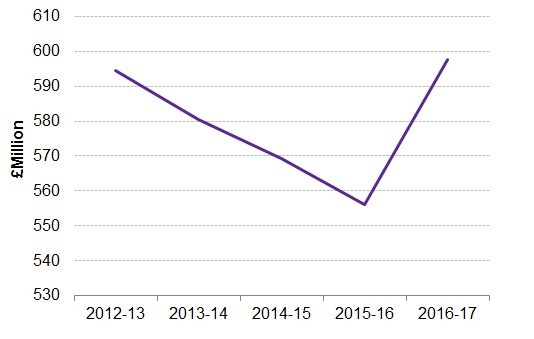
In the years 2012-13 to 2015-16, General Fund income from fees and charges for services reduced year-on-year. However, between 2015-16 and 2016-17 there was a 7% increase, taking the income from fees and charges back to slightly over 2012-13 levels. This chimes with evidence heard by the Local Government and Communities Committee during its scrutiny of the Draft Budget 2017-181 in the Autumn of 2016, when submissions highlighted that, due to a large amount of local authority funding being effectively ring-fenced, councils were increasingly applying fees and charges for non-statutory services. This overall trend, however, will be affected by variations in the number of councils reporting income within individual service areas.
Income by service type
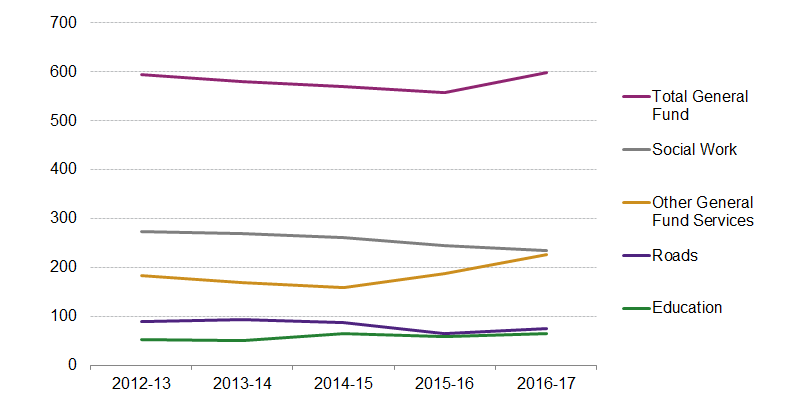
Figure 11 shows that, of the key service areas, by far the largest proportion of income comes from Social Work, with Roads and Education representing the next largest areas of fees and charges respectively.
The only area which has seen an upturn, and which may account for the overall increase in general fund income from fees and charges, is 'Other General Fund Services'. This covers, in order of income proportion, Environmental, Trading, Central, Culture and Related, Planning and Development and Housing (Non-HRA). It is worth noting that in 2016-17, the income from all of these services combined was less than the income from Social Work Services, and the total change change shown between 2015-16 and 2016-17 amounts to a relatively small sum in real terms of £37.4m. Specifically, ALEOs are used to deliver services to varying extents by different councils, and tend to be more prevalent in culture and leisure services.
Annex: Data
Table 1 - Local Government funding from Scottish Government (real terms, 2018-19 prices) - annual change
| £m | Total Revenue | Total Capital | Total Revenue + Capital | Total Revenue annual % change | Total annual % change |
|---|---|---|---|---|---|
| 2013-14 OT | 10,541.8 | 596.1 | 11,137.8 | - | - |
| 2014-15 OT | 10,555.2 | 892.7 | 11,447.9 | 0.1% | 2.8% |
| 2015-16 OT | 10,610.0 | 905.0 | 11,515.0 | 0.5% | 0.6% |
| 2016-17 OT | 10,038.9 | 627.6 | 10,666.5 | -5.4% | -7.4% |
| 2017-18 OT | 9,797.1 | 798.5 | 10,595.6 | -2.4% | -0.7% |
| 2016-17 LGFO | 10,187.2 | 627.6 | 10,814.8 | - | - |
| 2017-18 LGFO | 9,785.7 | 798.5 | 10,584.2 | -3.9% | -2.1% |
| 2018-19 LGFO | 9,814.4 | 876.4 | 10,690.8 | 0.3% | 1.0% |
Source: Source: Draft Budget 2017-18 (Table 1.01), Draft Budget 2018-19 (Table 1.02), Local Government Finance Circulars
Table 2 - Local Government funding from Scottish Government (cash terms) and percentage share
Note that as figures are displayed to one decimal point, rounding may mean that figures, when summed, do not match the percentage calculations displayed.
| Revenue | Capital | Total | ||||||||
|---|---|---|---|---|---|---|---|---|---|---|
| £m | LG Total Revenue | SG Fiscal Resource Budget Limit | SG Revenue Fiscal Resource Budget Limit + NDRI | LG as a % of SG | LG Total Capital | SG Capital Budget Limit | LG as a % of SG | LG Total | SG total | LG as a % of SG |
| 2013-14 | 9,766.4 | 25,671.0 | 28,106.0 | 34.7% | 552.2 | 2,508.0 | 22.0% | 10,318.6 | 30,614.0 | 33.7% |
| 2014-15 | 9,920.6 | 25,808.0 | 28,457.5 | 34.9% | 839.0 | 2,690.0 | 31.2% | 10,759.7 | 31,147.5 | 34.5% |
| 2015-16 | 10,039.4 | 25,991.0 | 28,779.5 | 34.9% | 856.3 | 2,734.0 | 31.3% | 10,895.7 | 31,513.5 | 34.6% |
| 2016-17 | 9,707.9 | 26,088.0 | 28,856.5 | 33.6% | 606.9 | 2,891.0 | 21.0% | 10,314.8 | 31,747.5 | 32.5% |
| 2017-18 | 9,650.7 | 26,679.0 | 29,344.8 | 32.9% | 786.5 | 3,087.0 | 25.5% | 10,437.2 | 32,431.8 | 32.2% |
| 2017-18 LGFO | 9,639.5 | 26,503.0 | 29,168.8 | 33.0% | 786.5 | 3,166.0 | 24.8% | 10,426.0 | 32,334.8 | 32.2% |
| 2018-19 LGFO | 9,814.4 | 26,860.0 | 29,496.0 | 33.3% | 876.4 | 3,413.0 | 25.7% | 10,690.8 | 32,909.0 | 32.5% |
| % Change 2013-14 to 2017-18 | -1.2% | 3.9% | 4.4% | -1.9% | 42.4% | 23.1% | 3.5% | 1.1% | 5.9% | -1.5% |
| % Change 2017-18 to 2018-19 | 1.8% | 1.3% | 1.1% | 0.2% | 11.4% | 7.8% | 0.8% | 2.5% | 1.8% | 0.2% |
Source: Draft Budget 2017-18 (table 1.01), Draft Budget 2018-19 (table 1.02), Local Government Finance Circulars
Table 3 - Local Government funding from Scottish Government (real terms, 2018-19 prices) and percentage share
| Revenue | Capital | Total | ||||||||
|---|---|---|---|---|---|---|---|---|---|---|
| £m | LG Total Revenue | SG Fiscal Resource Budget Limit | SG Revenue Fiscal Resource Budget Limit + NDRI | LG as a % of SG | LG Total Capital | SG Capital Budget Limit | LG as a % of SG | LG Total | SG total | LG as a % of SG |
| 2013-14 | 10,541.8 | 27,709.1 | 30,337.4 | 34.7% | 596.1 | 2,707.1 | 22.0% | 11,137.8 | 33,044.5 | 33.7% |
| 2014-15 | 10,555.2 | 27,458.9 | 30,277.9 | 34.9% | 892.7 | 2,862.1 | 31.2% | 11,447.9 | 33,140.0 | 34.5% |
| 2015-16 | 10,610.0 | 27,468.4 | 30,415.4 | 34.9% | 905.0 | 2,889.4 | 31.3% | 11,515.0 | 33,304.8 | 34.6% |
| 2016-17 | 10,038.9 | 26,977.5 | 29,840.4 | 33.6% | 627.6 | 2,989.6 | 21.0% | 10,666.5 | 32,829.9 | 32.5% |
| 2017-18 | 9,797.1 | 27,083.8 | 29,790.1 | 32.9% | 798.5 | 3,133.8 | 25.5% | 10,595.6 | 32,923.9 | 32.2% |
| 2017-18 LGFO | 9,785.7 | 26,905.1 | 29,611.4 | 33.0% | 798.5 | 3,214.0 | 24.8% | 10,584.2 | 32,825.4 | 32.2% |
| 2018-19 LGFO | 9,814.4 | 26,860.0 | 29,496.0 | 33.3% | 876.4 | 3,413.0 | 25.7% | 10,690.8 | 32,909.0 | 32.5% |
| % Change 2013-14 to 2017-18 | -7.1% | -2.3% | -1.8% | -1.9% | 34.0% | 15.8% | 3.5% | -4.9% | -0.4% | -1.5% |
| % Change 2017-18 to 2019-19 | 0.3% | -0.2% | -0.4% | 0.2% | 9.8% | 6.2% | 0.8% | 1.0% | 0.3% | 0.2% |
Source: Draft Budget 2017-18 (table 1.01), Draft Budget 2018-19 (table 1.02), Local Government Finance Circulars
Table 4 - Scottish Government Fiscal Resource Budget Limit + NDRI (real 2018-19 prices) - annual change
| SG Revenue Fiscal Resource Budget Limit + NDRI | SG Revenue Fiscal Resource Budget Limit + NDRI % change | |
|---|---|---|
| 2013-14 OT | 30,337.4 | - |
| 2014-15 OT | 30,277.9 | -0.2% |
| 2015-16 OT | 30,415.4 | 0.5% |
| 2016-17 OT | 29,840.4 | -1.9% |
| 2017-18 OT | 29,790.1 | -0.2% |
| 2017-18 LGFO | 29,611.4 | -0.6% |
| 2018-19 LGFO | 29,496.0 | -0.4% |
Source: Draft Budget 2017-18 (table 1.01), Draft Budget 2018-19 (table 1.02), Local Government Finance Circulars
Table 5 - Local government funding per head; changes 2013-14 to 2018-19, real terms (2018-19 prices)
| Total Revenue Per Head | Funding change, £m | Funding change, % | Population change | Population change, % | Per head change, £ | % of the Scottish average, percentage points change |
|---|---|---|---|---|---|---|
| Aberdeen City | -15.7 | -4.5% | 3,890 | 3.3% | -95 | 1.2% |
| Aberdeenshire | -12.2 | -2.8% | 6,240 | 3.4% | -87 | 2.3% |
| Angus | -12.2 | -5.7% | 60 | 0.3% | -105 | 1.9% |
| Argyll & Bute | -25.2 | -11.4% | - 100 | -2.0% | -288 | -5.3% |
| Clackmannanshire | -4.7 | -4.7% | 170 | -0.3% | -99 | 2.8% |
| Dumfries & Galloway | -23.9 | -7.7% | - 1,640 | -1.2% | -138 | 1.0% |
| Dundee City | -9.7 | -3.1% | 930 | 0.7% | -78 | 4.5% |
| East Ayrshire | -11.5 | -4.8% | - 790 | -0.4% | -82 | 3.7% |
| East Dunbartonshire | -7.4 | -3.8% | 2,250 | 2.4% | -106 | 1.8% |
| East Lothian | -6.8 | -3.8% | 3,980 | 4.2% | -132 | 0.2% |
| East Renfrewshire | -7.2 | -3.9% | 3,720 | 3.3% | -156 | -0.1% |
| Edinburgh, City of | -66.0 | -8.4% | 30,580 | 6.1% | -226 | -5.7% |
| Eilean Siar | -16.1 | -14.3% | - 610 | -2.9% | -504 | -10.9% |
| Falkirk | -14.0 | -4.8% | 3,330 | 2.0% | -126 | 0.9% |
| Fife | -29.9 | -4.5% | 5,200 | 1.4% | -106 | 1.8% |
| Glasgow City | -86.5 | -6.5% | 25,950 | 3.7% | -233 | -3.5% |
| Highland | -35.8 | -7.4% | 2,290 | 0.9% | -172 | -0.9% |
| Inverclyde | -13.3 | -7.5% | - 1,930 | -2.5% | -115 | 3.0% |
| Midlothian | -1.6 | -1.0% | 5,850 | 6.2% | -141 | 0.2% |
| Moray | -5.1 | -3.1% | 2,850 | 2.8% | -106 | 1.5% |
| North Ayrshire | -8.6 | -3.0% | - 1,780 | -1.6% | -36 | 6.7% |
| North Lanarkshire | -45.3 | -6.8% | 2,070 | 0.5% | -145 | 0.2% |
| Orkney | 1.5 | 2.0% | 470 | 2.0% | -6 | 14.1% |
| Perth & Kinross | -13.7 | -5.2% | 3,360 | 2.6% | -130 | 0.3% |
| Renfrewshire | -18.3 | -5.6% | 2,530 | 0.7% | -131 | 0.7% |
| Scottish Borders | -13.0 | -6.0% | 1,300 | 0.6% | -135 | 0.6% |
| Shetland | -8.5 | -9.0% | - 130 | -0.2% | -346 | -2.0% |
| South Ayrshire | -11.0 | -5.2% | - 240 | -0.5% | -94 | 2.7% |
| South Lanarkshire | -39.0 | -6.5% | 3,840 | 1.0% | -145 | 0.0% |
| Stirling | -8.1 | -4.6% | 2,990 | 3.8% | -147 | -0.1% |
| West Dunbartonshire | -11.9 | -5.9% | - 730 | -0.8% | -115 | 3.0% |
| West Lothian | -4.6 | -1.4% | 5,300 | 2.8% | -79 | 3.3% |
| Scotland | -585.2 | -5.7% | 111,200 | 2.0% | -148 | - |
Source: Local Government Finance Circulars, NRS Mid-Year Population Estimates
Table 6 - SPICe analysis of Finance Circular figures based on 85% Funding Floor calculation, 2018-19
| 85% floor calcs - Total Revenue + Assumed CTax | 2016 mid year population | Total Revenue + assumed CTax | Per head | % of Scottish average | Adjusted total Revenue + assumed CTax | New per head | % of Scottish average |
|---|---|---|---|---|---|---|---|
| Aberdeen City | 229,840 | 422.1 | 1,836 | 83.9% | 422.1 | 1,836 | 84.7% |
| Edinburgh, City of | 507,170 | 939.6 | 1,853 | 84.6% | 939.6 | 1,853 | 85.5% |
| Moray | 96,070 | 192.1 | 2,000 | 91.4% | 192.1 | 2,000 | 92.3% |
| Aberdeenshire | 262,190 | 527.2 | 2,011 | 91.8% | 527.2 | 2,011 | 92.8% |
| Perth & Kinross | 150,680 | 311.9 | 2,070 | 94.6% | 311.9 | 2,070 | 95.5% |
| East Lothian | 104,090 | 215.5 | 2,070 | 94.6% | 215.5 | 2,070 | 95.5% |
| Fife | 370,330 | 776.1 | 2,096 | 95.7% | 776.1 | 2,096 | 96.7% |
| Angus | 116,520 | 244.6 | 2,099 | 95.9% | 244.6 | 2,099 | 96.8% |
| West Lothian | 180,130 | 379.6 | 2,107 | 96.3% | 379.6 | 2,107 | 97.2% |
| Falkirk | 159,380 | 337.7 | 2,119 | 96.8% | 337.7 | 2,119 | 97.7% |
| South Lanarkshire | 317,100 | 682.0 | 2,151 | 98.2% | 682.0 | 2,151 | 99.2% |
| North Lanarkshire | 339,390 | 730.8 | 2,153 | 98.4% | 730.8 | 2,153 | 99.3% |
| Renfrewshire | 175,930 | 379.6 | 2,158 | 98.6% | 379.6 | 2,158 | 99.6% |
| East Dunbartonshire | 107,540 | 233.8 | 2,174 | 99.3% | 233.8 | 2,174 | 100.3% |
| Midlothian | 88,610 | 193.1 | 2,179 | 99.6% | 193.1 | 2,179 | 100.6% |
| Stirling | 93,750 | 205.7 | 2,194 | 100.2% | 205.7 | 2,194 | 101.2% |
| East Ayrshire | 122,200 | 269.7 | 2,207 | 100.8% | 269.7 | 2,207 | 101.8% |
| Scottish Borders | 114,530 | 253.0 | 2,209 | 100.9% | 253.0 | 2,209 | 101.9% |
| South Ayrshire | 112,470 | 249.1 | 2,215 | 101.2% | 249.1 | 2,215 | 102.2% |
| Clackmannanshire | 51,350 | 114.8 | 2,235 | 102.1% | 114.8 | 2,235 | 103.1% |
| Highland | 234,770 | 542.0 | 2,309 | 105.5% | 542.0 | 2,309 | 106.5% |
| Dumfries & Galloway | 149,520 | 345.2 | 2,309 | 105.5% | 345.2 | 2,309 | 106.5% |
| Dundee City | 148,270 | 345.5 | 2,330 | 106.4% | 345.5 | 2,330 | 107.5% |
| East Renfrewshire | 93,810 | 220.3 | 2,348 | 107.3% | 220.3 | 2,348 | 108.3% |
| Glasgow City | 615,070 | 1,463.7 | 2,380 | 108.7% | 1,463.7 | 2,380 | 109.8% |
| North Ayrshire | 135,890 | 324.6 | 2,389 | 109.1% | 324.6 | 2,389 | 110.2% |
| Inverclyde | 79,160 | 192.6 | 2,433 | 111.2% | 192.6 | 2,433 | 112.3% |
| West Dunbartonshire | 89,860 | 222.4 | 2,475 | 113.1% | 222.4 | 2,475 | 114.2% |
| Argyll & Bute | 87,130 | 234.7 | 2,694 | 123.0% | 219.3 | 2,517 | 116.1% |
| Eilean Siar | 26,900 | 105.5 | 3,920 | 179.1% | 67.7 | 2,517 | 116.1% |
| Orkney | 21,850 | 82.8 | 3,789 | 173.1% | 55.0 | 2,517 | 116.1% |
| Shetland | 23,200 | 94.5 | 4,072 | 186.0% | 58.4 | 2,517 | 116.1% |
| Scotland | 5,404,700 | 11,831.6 | 2,189 | 100% | 11,714.6 | 2,167 | 100% |
Source: SPICe calculations based on Local government Finance Circulars, NRS Mid-Year Population Estimates
Table 7 - Council Tax income and Non-Domestic Rates income
| Year | Council Tax income (excluding CTB) (£m) | Council Tax benefit subsidy (£m) | Council Tax income (including CTB) (£m) | NDRI (Distributable amount) (£m) |
|---|---|---|---|---|
| 2010-11 | 1923 | 375 | 2298 | 2068 |
| 2011-12 | 1926 | 376 | 2302 | 2182 |
| 2012-13 | 1947 | 371 | 2318 | 2263 |
| 2013-14 | 1981 | 0 | 1981 | 2435 |
| 2014-15 | 2022 | 0 | 2022 | 2650 |
| 2015-16 | 2055 | 0 | 2055 | 2789 |
| 2016-17 | 2091 | 0 | 2091 | 2769 |
Source: Scottish Local Government Finance Statistics
Table 8 - Council Tax reform, impact on bills, Scotland average
| A | B | C | D | E | F | G | H | |
|---|---|---|---|---|---|---|---|---|
| Average Bill, 2016-17 | £766 | £893 | £1,021 | £1,149 | £1,404 | £1,659 | £1,914 | £2,297 |
| Average Bill, 2017-18 | £782 | £912 | £1,043 | £1,173 | £1,541 | £1,906 | £2,297 | £2,874 |
| Average Bill, 2019-20 | £805 | £940 | £1,074 | £1,208 | £1,587 | £1,963 | £2,366 | £2,960 |
| Increase 2016-17-2018-19 (£) | £40 | £46 | £53 | £59 | £183 | £304 | £451 | £663 |
| Increase (%) | 5.2% | 5.2% | 5.2% | 5.2% | 13.1% | 18.3% | 23.6% | 28.8% |
Source: Scottish Local Government Finance Datasets: Council Tax Data
Table 9 - Changes to Council Tax revenue, 2016-17 to 2018-19
| £m | Gross CT revenue 2016/17 (Sep 16 est) | Gross CT revenue 2017-18 (Sep 17 est) | Est Gross CT revenue 2018-19 | % Difference 2016-2017 to 2018-19 |
|---|---|---|---|---|
| Scotland | 2,375.6 | 2,564.8 | 2,641.8 | 11.2% |
| Aberdeen City | 112.1 | 119.0 | 122.6 | 9.4% |
| Aberdeenshire | 122.4 | 135.0 | 139.1 | 13.6% |
| Angus | 46.9 | 50.0 | 51.5 | 9.9% |
| Argyll & Bute | 46.1 | 50.0 | 51.5 | 11.8% |
| Clackmannanshire | 22.1 | 24.0 | 24.7 | 11.9% |
| Dumfries & Galloway | 62.7 | 67.0 | 69.0 | 10.1% |
| Dundee City | 59.0 | 62.0 | 63.9 | 8.2% |
| East Ayrshire | 50.8 | 54.0 | 55.6 | 9.6% |
| East Dunbartonshire | 54.7 | 62.0 | 63.9 | 16.7% |
| East Lothian | 47.6 | 53.0 | 54.6 | 14.6% |
| East Renfrewshire | 45.6 | 52.0 | 53.6 | 17.5% |
| Edinburgh, City of | 243.7 | 273.0 | 281.2 | 15.4% |
| Eilean Siar | 10.2 | 11.0 | 11.3 | 11.2% |
| Falkirk | 62.2 | 68.0 | 70.0 | 12.6% |
| Fife | 153.9 | 166.0 | 171.0 | 11.1% |
| Glasgow City | 260.4 | 279.0 | 287.4 | 10.3% |
| Highland | 112.0 | 121.0 | 124.6 | 11.2% |
| Inverclyde | 33.8 | 35.0 | 36.1 | 6.7% |
| Midlothian | 41.2 | 45.0 | 46.4 | 12.5% |
| Moray | 38.6 | 41.0 | 42.2 | 9.5% |
| North Ayrshire | 58.4 | 62.0 | 63.9 | 9.4% |
| North Lanarkshire | 127.8 | 133.0 | 137.0 | 7.2% |
| Orkney Islands | 8.4 | 9.0 | 9.3 | 10.7% |
| Perth & Kinross | 73.0 | 80.0 | 82.4 | 12.9% |
| Renfrewshire | 79.5 | 84.0 | 86.5 | 8.9% |
| Scottish Borders | 50.8 | 56.0 | 57.7 | 13.5% |
| Shetland Islands | 8.8 | 9.0 | 9.3 | 4.9% |
| South Ayrshire | 54.6 | 60.0 | 61.8 | 13.1% |
| South Lanarkshire | 133.1 | 141.0 | 145.2 | 9.1% |
| Stirling | 44.5 | 48.0 | 49.4 | 11.0% |
| West Dunbartonshire | 39.8 | 41.0 | 42.2 | 6.2% |
| West Lothian | 71.1 | 75.0 | 77.3 | 8.7% |
Source: Source: CTAXBASE September 2016, September 2017
Table 10 - Income from Charges to Service Users, General Fund (excl. HRA income), real terms (2016-17 prices)
| £m | 2012-13 | 2013-14 | 2014-15 | 2015-16 | 2016-17 | % Change 2015-16 to 2016-17 | % Change 2012-13 to 2016-17 |
|---|---|---|---|---|---|---|---|
| Aberdeen | 14,004.0 | 19,683.5 | 17,182.1 | 23,084.9 | 40,726.0 | 76% | 191% |
| Aberdeenshire | 17,037.5 | 19,928.8 | 23,024.8 | 32,151.0 | 32,244.0 | 0% | 89% |
| Angus | 15,788.9 | 15,309.2 | 13,965.5 | 16,792.4 | 14,573.0 | -13% | -8% |
| Argyll & Bute | 22,872.7 | 21,942.9 | 21,641.8 | 20,833.4 | 21,481.0 | 3% | -6% |
| Clackmannanshire | 4,674.2 | 4,958.7 | 7,883.5 | 7,007.8 | 8,691.0 | 24% | 86% |
| Dumfries & Galloway | 18,695.8 | 18,314.3 | 18,777.5 | 17,832.8 | 12,471.0 | -30% | -33% |
| Dundee | 15,719.5 | 15,343.3 | 15,301.9 | 16,172.1 | 25,292.0 | 56% | 61% |
| East Ayrshire | 7,041.2 | 7,971.0 | 8,307.4 | 7,965.4 | 4,700.0 | -41% | -33% |
| East Dunbartonshire | 6,876.1 | 6,042.3 | 7,400.8 | 7,336.9 | 6,012.0 | -18% | -13% |
| East Lothian | 12,810.4 | 10,444.1 | 9,502.7 | 9,338.0 | 2,976.0 | -68% | -77% |
| East Renfrewshire | 4,630.0 | 4,505.5 | 3,337.2 | 1,121.1 | 1,095.0 | -2% | -76% |
| Edinburgh | 75,377.8 | 74,064.7 | 76,110.7 | 79,024.9 | 89,423.0 | 13% | 19% |
| Eilean Siar | 3,742.7 | 3,931.8 | 4,202.8 | 3,648.5 | 4,248.0 | 16% | 14% |
| Falkirk | 18,249.9 | 19,815.8 | 20,019.6 | 20,043.4 | 20,772.0 | 4% | 14% |
| Fife | 28,011.2 | 27,748.7 | 22,661.2 | 17,283.0 | 17,045.0 | -1% | -39% |
| Glasgow | 98,229.4 | 103,215.5 | 102,065.1 | 83,331.6 | 89,367.0 | 7% | -9% |
| Highland | 31,260.6 | 16,744.5 | 16,229.1 | 13,574.2 | 36,796.0 | 171% | 18% |
| Inverclyde | 5,943.8 | 5,893.3 | 6,140.2 | 5,019.0 | 664.0 | -87% | -89% |
| Midlothian | 18,335.7 | 12,993.2 | 6,912.8 | 14,881.3 | 16,647.0 | 12% | -9% |
| Moray | 8,899.2 | 11,067.1 | 12,562.9 | 12,521.5 | 10,228.0 | -18% | 15% |
| North Ayrshire | 20,146.7 | 20,925.1 | 20,667.9 | 17,997.4 | 17,216.0 | -4% | -15% |
| North Lanarkshire | 11,375.0 | 10,632.0 | 10,284.3 | 5,157.0 | 5,190.0 | 1% | -54% |
| Orkney | 2,137.8 | 2,110.4 | 2,032.5 | 2,090.0 | 2,216.0 | 6% | 4% |
| Perth and Kinross | 11,656.4 | 9,824.7 | 7,837.9 | 6,965.9 | 8,306.0 | 19% | -29% |
| Renfrewshire | 14,152.6 | 16,861.2 | 14,521.5 | 18,992.8 | 13,245.0 | -30% | -6% |
| Scottish Borders | 6,204.8 | 9,028.1 | 7,567.6 | 4,880.0 | 5,355.0 | 10% | -14% |
| Shetland | 31,333.9 | 23,254.9 | 24,562.2 | 24,884.6 | 30,015.0 | 21% | -4% |
| South Ayrshire | 11,554.8 | 10,586.8 | 14,689.9 | 11,303.3 | 12,044.0 | 7% | 4% |
| South Lanarkshire | 18,164.9 | 18,093.5 | 18,200.7 | 17,841.0 | 18,420.0 | 3% | 1% |
| Stirling | 15,831.8 | 13,358.7 | 11,080.4 | 8,843.3 | 10,024.0 | 13% | -37% |
| West Dunbartonshire | 16,916.1 | 20,543.8 | 20,152.1 | 17,433.2 | 9,822.0 | -44% | -42% |
| West Lothian | 6,761.9 | 5,396.7 | 4,333.3 | 10,846.5 | 10,308.0 | -5% | 52% |
| Scotland | 594,437.2 | 580,534.2 | 569,160.1 | 556,198.5 | 597,612.0 | 7% | 1% |
Source: Scottish Government Local Financial Returns
Table 11 - Income from charges to service users, by service, real terms (2016-17 prices)
| £m | 2012-13 | 2013-14 | 2014-15 | 2015-16 | 2016-17 | % Change 2015-16 to 2016-17 | % Change 2012-13 to 2016-17 |
|---|---|---|---|---|---|---|---|
| Education | 51.3 | 49.5 | 64.4 | 58.7 | 64.1 | 9% | 25% |
| Roads | 88.0 | 92.9 | 86.4 | 65.4 | 74.6 | 14% | -15% |
| Social Work | 272.7 | 269.2 | 260.5 | 244.2 | 233.7 | -4% | -14% |
| Other General Fund Services | 182.5 | 168.9 | 157.9 | 187.9 | 225.2 | 20% | 23% |
| Total General Fund | 594.4 | 580.5 | 569.2 | 556.2 | 597.6 | 7% | 1% |
Source: Scottish Government Local Financial Returns
Abbreviations
Various abbreviations are used throughout this briefing. A key is set out below.
ALEO - Arms-Length External Organisation
CT - Council Tax
CTB - Council Tax Benefits
CTR - Council Tax Reduction
DEL - Departmental Expenditure Limit
HRA - Housing Revenue Account
LG - Local Government
LGFO - Local Government Finance Order
NDRI - Non-Domestic Rates Income
OT - Outturn
SG - Scottish Government
Related Briefings
SB 16/28 - Scottish Government proposals for Council Tax reform
SB 17/44 - Local Government Finance: Facts and Figures 2010-11 to 2017-18
SB 17/82 - Local Government Finance: Fees and Charges 2011-12 to 2015-16
SB 17/83 - The social impact of the 2017-18 local government budget
SB 17/88 - Local Government Finance: Draft Budget 2018-19 and provisional allocations to local authorities
SB 17/89 - Draft Budget 2018-19
SB 17/90 - Draft Budget 2018-19: Taxes
Sources
Burn-Murdoch, A. (2017, June 21). Local Government Finance: Facts and Figures 2010-11 to 2017-18. Retrieved from <a href="https://digitalpublications.parliament.scot/ResearchBriefings/Report/2017/6/21/Local-Government-Finance--facts-and-figures-2010-11-to-2017-18" target="_blank">https://digitalpublications.parliament.scot/ResearchBriefings/Report/2017/6/21/Local-Government-Finance--facts-and-figures-2010-11-to-2017-18</a> [accessed 20 November 2017]
Scottish Parliament Information Centre. (2017, December 18). Local Government Finance: Draft Budget 2018-19 and provisional allocations to local authorities. Retrieved from <a href="https://digitalpublications.parliament.scot/ResearchBriefings/Report/2017/12/18/Local-Government-Finance--Draft-Budget-2018-19-and-provisional-allocations-to-local-authorities" target="_blank">https://digitalpublications.parliament.scot/ResearchBriefings/Report/2017/12/18/Local-Government-Finance--Draft-Budget-2018-19-and-provisional-allocations-to-local-authorities</a> [accessed 22 December 2017]
Scottish Government. (2018, January 31). Budget Stage 1. Retrieved from <a href="https://beta.gov.scot/news/budget-stage-1/" target="_blank">https://beta.gov.scot/news/budget-stage-1/</a> [accessed 2 May 2018]
Financial Scrutiny Unit. (2016, December 19). SB 16-103 Scottish Government Draft Budget 2017-18. Retrieved from <a href="http://www.scottish.parliament.uk/ResearchBriefingsAndFactsheets/S5/SB_16-103_Draft_Budget_2017-18.pdf" target="_blank">http://www.scottish.parliament.uk/ResearchBriefingsAndFactsheets/S5/SB_16-103_Draft_Budget_2017-18.pdf</a> [accessed 4 December 2017]
Scottish Government. (2017, December 14). Scottish Government Draft Budget 2018-19. Retrieved from <a href="http://www.gov.scot/Publications/2017/12/8959" target="_blank">http://www.gov.scot/Publications/2017/12/8959</a> [accessed 14 December 2017]
The Scottish Government. (2016, March 2). Council tax reform. Retrieved from <a href="https://news.gov.scot/news/council-tax-reform" target="_blank">https://news.gov.scot/news/council-tax-reform</a> [accessed 27 April 2017]
The Scottish Government. (2016, September 7). The Council Tax (Substitution of Proportion) Order 2016. Retrieved from <a href="http://www.legislation.gov.uk/sdsi/2016/9780111032589/contents" target="_blank">http://www.legislation.gov.uk/sdsi/2016/9780111032589/contents</a> [accessed 27 April 2017]
Burn-Murdich, A. (2017, November 28). Local Government Finance: Fees and Charges 2011-12 to 2015-16. Retrieved from <a href="https://digitalpublications.parliament.scot/ResearchBriefings/Report/2017/11/28/Local-Government-Finance--Fees-and-Charges-2011-12-to-2015-16-1" target="_blank">https://digitalpublications.parliament.scot/ResearchBriefings/Report/2017/11/28/Local-Government-Finance--Fees-and-Charges-2011-12-to-2015-16-1</a> [accessed 2 May 2018]
Scottish Parliament Local Government and Communities Committee. (2017, January 27). Report on the Scottish Government’s Draft Budget 2017-18. Retrieved from <a href="http://www.parliament.scot/S5_Local_Gov/Reports/LGCS052017R02.pdf" target="_blank">http://www.parliament.scot/S5_Local_Gov/Reports/LGCS052017R02.pdf</a> [accessed 15 June 2017]