Labour Market update May 2018
This briefing provides an overview of the Scottish labour market from the latest regional labour market statistics from the Office for National Statistics (ONS).
Executive Summary
This briefing provides an overview of the Scottish labour market from the latest regional labour market statistics1 and UK labour market: May 20182 statistics from the Office for National Statistics (ONS).
The unemployment rate for the UK is 4.2% while in Scotland it sits at 4.3%. The rate for men in Scotland fell over the quarter while the rate for women increased slightly.
Employment increased over the year despite the fall in the employment rate for women.
Over the quarter, the economic inactivity rate in Scotland and the UK fell, by 0.1 percentage points and 0.3 respectively.
| Overall | Men | Women | ||||
|---|---|---|---|---|---|---|
| Rate (%) | Change over the qtr (% pts) | Rate (%) | Change over the qtr (% pts) | Rate (%) | Change over the qtr (% pts) | |
| Unemployment | 4.3% | -0.2 | 4.8% | -0.5 | 3.7% | +0.1 |
| Employment | 74.7% | +0.3 | 78.4% | +0.9 | 71.1% | -0.2 |
| Economic Inactivity | 21.9% | -0.1 | 17.6% | -0.4 | 26.1% | +0.1 |
What are the labour market measurements?
The International Labour Organisation provides the official definition of labour market statistics.
What is unemployment?
Level: Any individual aged 16 and over without a job who has been actively seeking work within the last four weeks and is available to start work within the next two weeks.
Rate: Number of unemployed individuals as a proportion of the total number of economically active people, which includes both the unemployed and those in work.
What is employment?
Level: Any individual aged 16 and over who is undertaking one hour or more a week of paid work.
Rate: Number of people in employment expressed as a percentage of all people aged 16-64.
What is economic inactivity?
Level: Any individual aged 16 to 64 who is not in employment, has not looked for work in the last four weeks, and is unable to start work within the next two weeks.
Rate: Number of people economically inactive expressed as a percentage of all people aged 16-64.
The main reasons for economic inactivity are:
being a student and not having or looking for a job
looking after the family and/or home
being sick (temporary and long-term)
being retired
being discouraged.
You can find out more in formation on labour market statistics in the SPICe Labour market statistics briefing.
Unemployment
The number of unemployed people in Scotland fell by 6,000 over the quarter and by 2,000 over the year.
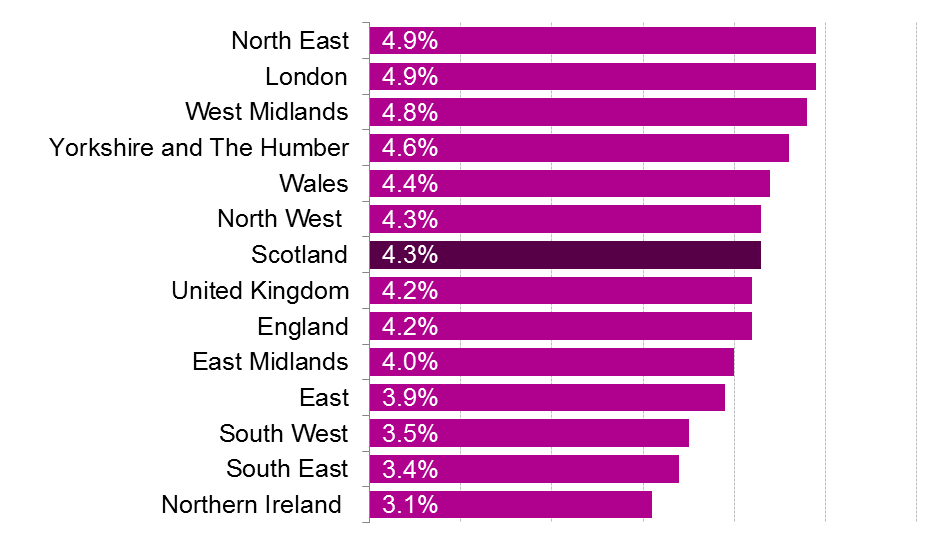
The unemployment rate for the UK is 4.2% while the rate in Scotland sits at 4.3%.
While the rate in Scotland saw a similar fall to the UK over the quarter the UK saw a larger decrease over the year than Scotland.
| Level ('000) | Quarter change ('000) | Year change ('000) | Rate (%) | Quarter change (% pts) | Year change (% pts) | |
|---|---|---|---|---|---|---|
| Scotland | 118 | -6 | -2 | 4.3% | -0.2 | -0.1 |
| UK | 1,425 | -46 | -116 | 4.2% | -0.2 | -0.4 |
Looking at unemployment across the UK, Northern Ireland has the lowest rate at 3.1%, while the North East and London have the highest at 4.9%.
Unemployment by gender
Over the quarter the fall in the unemployment level in Scotland was mainly due to the number of unemployed men decreasing by 7,000, while the number of women increased by 1,000.
The rate for men in Scotland fell over the quarter but increased over the year while for the UK as a whole it fell over both the quarter and year.
The rate for women in Scotland increased slightly over the quarter but fell over the year while for the UK as a whole it fell over both the quarter and year.
In Scotland, unemployment rates are higher for men than women while they are the same across the UK.
The unemployment rate for men is higher in Scotland than for the UK while the rate is lower for women in Scotland than the UK.
| Level ('000) | Quarter change ('000) | Year Change ('000) | Rate (%) | Quarter change (% pts) | Year change (% pts) | ||
|---|---|---|---|---|---|---|---|
| Scotland | Men | 68 | -7 | +4 | 4.8% | -0.5 | +0.3 |
| Women | 50 | +1 | -6 | 3.7% | +0.1 | -0.5 | |
| UK | Men | 756 | -26 | -96 | 4.2% | -0.2 | -0.6 |
| Women | 669 | -20 | -20 | 4.2% | -0.2 | -0.2 |
Unemployment by age
This data is not seasonally adjusted and is compared with the same quarter in previous years.
Despite the increase over the year the youth unemployment rate (16-24) is the second lowest since comparable records began in 2002.
The unemployment rate for 35-49 year old is the lowest since 2008. (3.0% in Jan-Mar 2008)
| Age group | Scotland | UK | |
|---|---|---|---|
| 16-24 | Rate | 10.5% | 11.5% |
| Year change (% pts) | +1.1 | -0.5 | |
| 25-34 | Rate | 3.6% | 3.7% |
| Year change (% pts) | +0.4 | -0.8 | |
| 35-49 | Rate | 3.1% | 2.7% |
| Year change (% pts) | -0.4 | -0.4 | |
| 50-64 | Rate | 3.8% | 3.3% |
| Year change (% pts) | -0.2 | +0.1 |
Employment
The number of people aged 16 and over in employment in Scotland decreased by 2,000 over the quarter, but increased by 10,000 over the year.
The rate in both Scotland and the UK increased over the quarter and the year, however the increase was slightly lower in Scotland.
While the number of people in employment fell the rate increased. This would suggest that the majority of the decrease came from those aged 65 and over.
| Level ('000) | Quarter change ('000) | Year change ('000) | Rate (%) | Quarter change (% pts) | Year change (% pts) | |
|---|---|---|---|---|---|---|
| Scotland | 2,630 | -2 | +10 | 74.7% | +0.3 | +0.6 |
| UK | 32,344 | +197 | +396 | 75.6% | +0.4 | +0.8 |
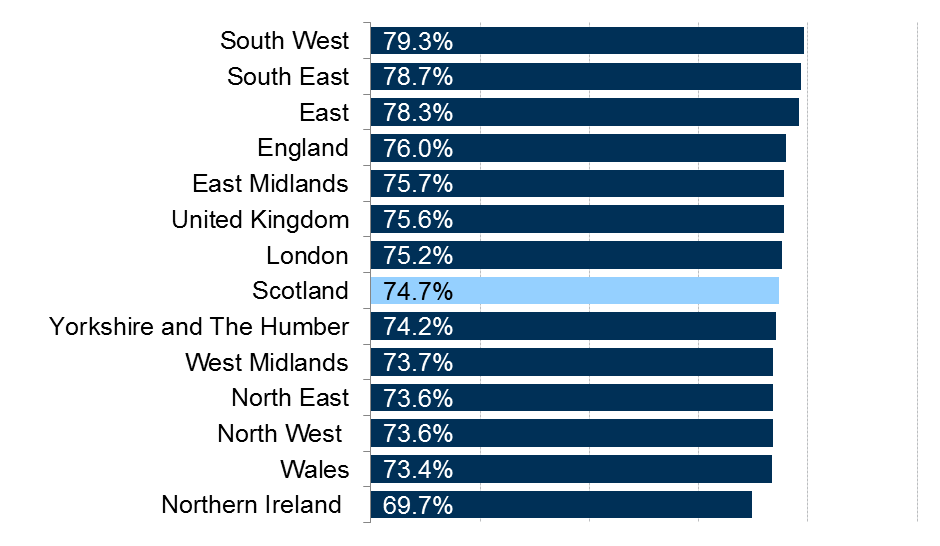
Looking at employment across the UK, the Scottish rate is lower than the UK average. The South West has the highest rate at 79.3%, while Northern Ireland has the lowest at 69.7%.
Employment by gender
Employment levels and rates are higher for men than for women at both the Scottish and UK levels.
The fall in the employment level over the quarter is mainly down to 7,000 women leaving employment, while the number of men in employment increased by 5,000.
While the rate for women fell over the quarter and increased for men, the rate for both men and women in Scotland increased over the year.
The rates for both men and women in Scotland are lower than the UK with the gap larger for men than women, 1.6 percentage points compared to 0.1.
| Level ('000) | Quarter change ('000) | Year change ('000) | Rate (%) | Quarter change (% pts) | Year change (% pts) | ||
|---|---|---|---|---|---|---|---|
| Scotland | Men | 1,353 | +5 | +8 | 78.4% | +0.9 | +1.0 |
| Women | 1,277 | -7 | +2 | 71.1% | -0.2 | +0.3 | |
| UK | Men | 17,128 | +90 | +163 | 80.0% | +0.4 | +0.5 |
| Women | 15,215 | +108 | +234 | 71.2% | +0.4 | +1.0 |
Employment by age
This data is not seasonally adjusted and is compared with the same quarter in previous years.
The employment rate for 50-64 year-olds is the highest since comparable records began in 2002, having increased by 12.9 percentage points since 2002.
| Age group | Scotland | UK | |
|---|---|---|---|
| 16-24 | Rate (%) | 55.6% | 54.1% |
| Year change (% pts) | -3.1 | -0.2 | |
| 25-34 | Rate (%) | 82.3% | 83.5% |
| Year change (% pts) | +0.2 | +1.0 | |
| 35-49 | Rate (%) | 83.9% | 85.3% |
| Year Change (% pts) | +1.9 | +1.4 | |
| 50-64 | Rate (%) | 70.5% | 71.6% |
| Year Change (% pts) | +1.2 | +0.5 |
Economic inactivity
The number of people economically inactive in Scotland fell over the quarter by 5,000 and 19,000 over the year.
Over the quarter, the economic inactivity rate in Scotland and the UK fell by 0.1 percentage points and 0.3 respectively, but fell at the same rate over the year (0.5 percentage points).
| Level ('000) | Quarter change ('000) | Year change ('000) | Rate (%) | Quarter change (% pts) | Year change (% pts) | |
|---|---|---|---|---|---|---|
| Scotland | 748 | -5 | -19 | 21.9% | -0.1 | -0.5 |
| UK | 8,658 | -115 | -171 | 21.0% | -0.3 | -0.5 |
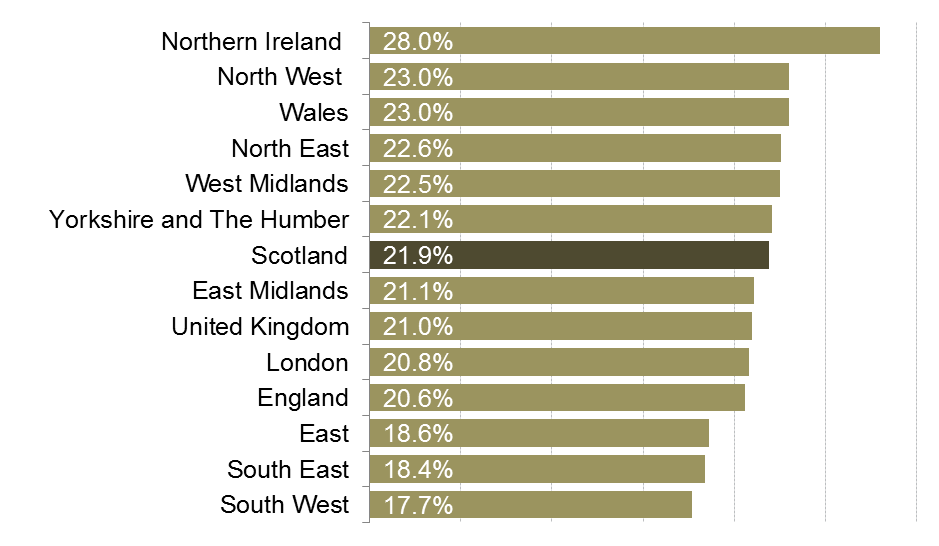
Looking at economic inactivity across the UK, the Scottish rate is higher than the UK average. Northern Ireland has the highest rate at 28.0%, while the South West has the lowest at 17.7%.
Economic inactivity by gender
Economic inactivity rates are higher for women than for men.
The fall in inactivity in Scotland was due to 7,000 men no longer being inactive while there was a increase of 1,000 more women.
The fall in the inactivity rate for men over the year was the highest since 2012 (-1.7 percentage points between Jan-Mar 2011 and Jan-Mar 2012)
The inactivity rate for men and women is higher in Scotland than for the UK.
| Level ('000) | Quarter change ('000) | Year change ('000) | Rate (%) | Quarter change (% pts) | Year change (% pts) | ||
|---|---|---|---|---|---|---|---|
| Scotland | Men | 294 | -7 | -19 | 17.6% | -0.4 | -1.1 |
| Women | 454 | +1 | 0 | 26.1% | +0.1 | 0.0 | |
| UK | Men | 3,353 | -48 | +6 | 16.4% | -0.2 | 0.0 |
| Women | 5,305 | -68 | -177 | 25.6% | -0.3 | -0.9 |
Economic inactivity by age
This data is not seasonally adjusted and is compared with the same quarter in previous years.
The youth inactivity rate is the highest since comparable records began in 2002, having increased 9.3 percentage points.
The economic inactivity rate for 50-64 year olds is the lowest since comparable records began and has fallen by 12.9 percentage points since 2002.
| Age Group | Scotland | UK | |
|---|---|---|---|
| 16-24 | Rate (%) | 37.9% | 38.9% |
| Year change (% pts) | +2.7 | +0.6 | |
| 25-34 | Rate (%) | 14.7% | 13.3% |
| Year change (% pts) | -0.6 | -0.3 | |
| 35-49 | Rate (%) | 13.4% | 12.3% |
| Year change (% pts) | -1.5 | -1.0 | |
| 50-64 | Rate (%) | 26.7% | 25.9% |
| Year change (% pts) | -1.1 | -0.7 |
Claimant Count
The Claimant Count figures presented here are experimental statistics from the ONS for Jobseekers Allowance, plus Universal Credit claimants who are out of work.
Under Universal Credit, a broader span of claimants are required to look for work than under Jobseekers Allowance. As Universal Credit Full Service is rolled out in particular areas, the number of people recorded as being on the Claimant Count is therefore likely to rise.
This is not an official measure of unemployment, but it does provide accurate information on the labour market at a local level.
Scotland and UK comparison
The seasonally adjusted claimant count rate for April in Scotland increased over the month and year at the same rate as the UK.
The Scottish claimant count rate is higher than the UK rate.
| Level | Month Change | Year Change | Rate (%) | Month Change (% pts) | Year Change (% pts) | |
|---|---|---|---|---|---|---|
| Scotland | 89,600 | +3,100 | +9,400 | 2.6% | +0.1 | +0.3 |
| UK | 897,000 | +31,300 | +105,400 | 2.2% | +0.1 | +0.3 |
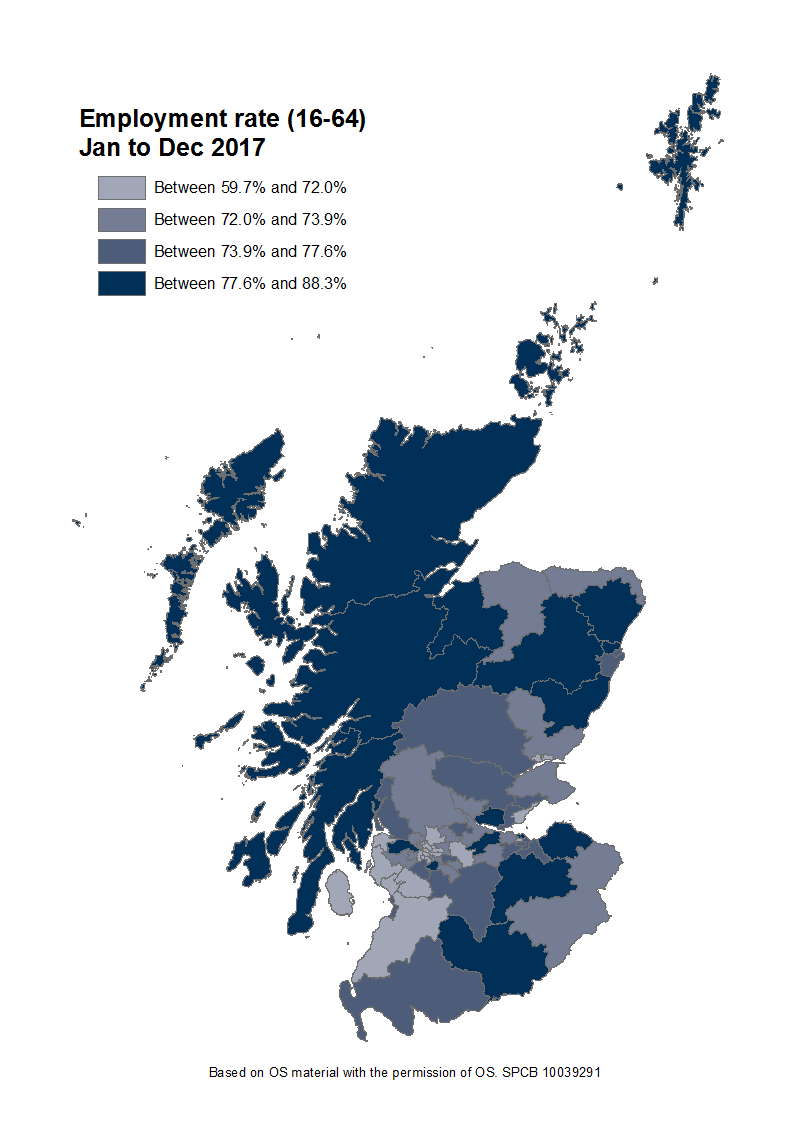
Constituency data: employment rate
The constituency data for Scotland comes from the Annual Population Survey (APS). The APS datasets are produced quarterly, with each dataset containing 12 months of data. This data is based on residence analysis of the APS.
The latest APS data is for Jan 2016-Dec 2017.
The Orkney Islands have the highest employment rate at 88.3%, while Glasgow Kelvin has the lowest at 59.7%. Caithness, Sutherland and Ross saw the biggest increase over the year, while Glasgow Provan saw the largest decrease.
Find out the latest labour market data for your constituency.
Guest indicator: Self-employment
The Annual Population Survey (APS) from the Office for National Statistics provides information on self-employment. The ONS define self-employment as those people who regard themselves as self-employed, that is, who in their main employment work on their own account, whether or not they have employees1.
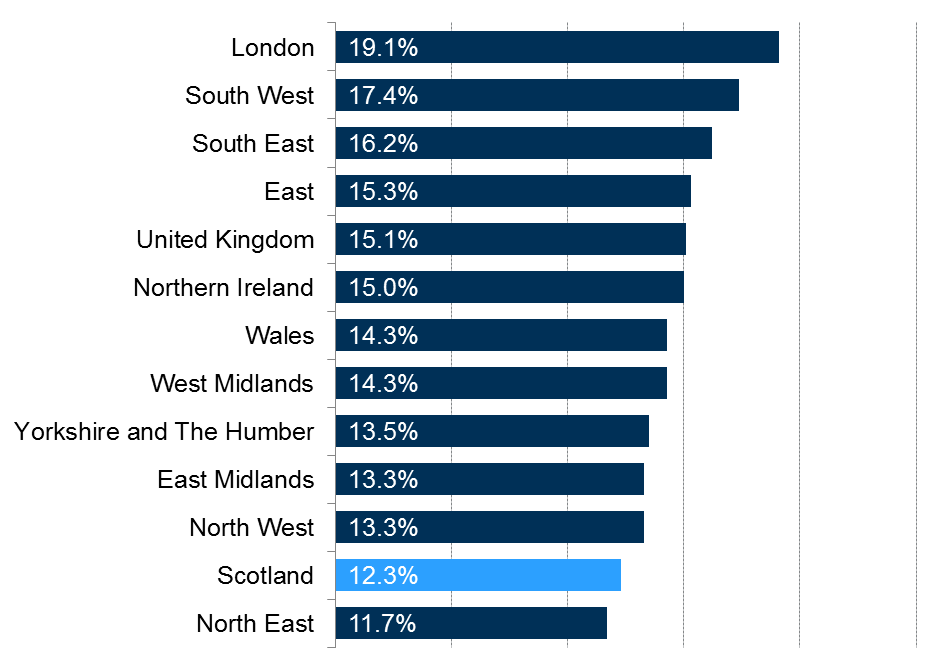
In 2017 there were 323,000 people in who were self-employed, this is 12.3% of people in employment in Scotland. This is the second lowest of the nations and regions of the UK and lower than the UK wide figure of 15.1%. London has the highest proportion with almost 1 in 5 of those in London self employed.
Figure 5: Proportion those in employment who are self employed by nation and region of the UK - 2017 (16+)
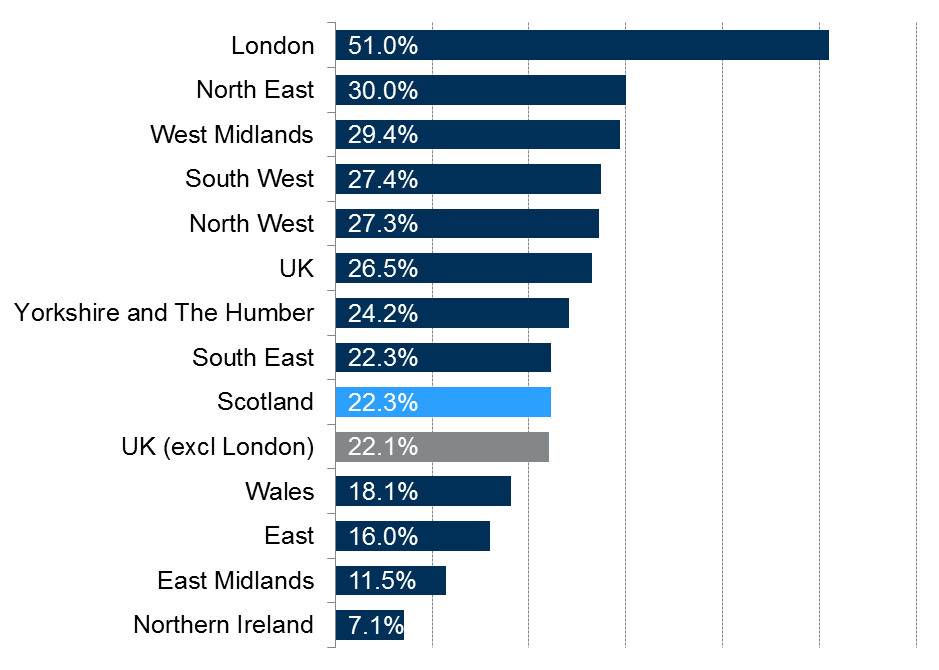
Over the last 10 years, 2007 to 2017, the number of people who are self employed in Scotland has increased by 22.3%. Again this is below the UK wide figure of 26.5%. However when London is removed from the calculation growth in Scotland is around the UK (excl. London) figure of 22.1%.
Figure 6: Growth in the number of self-employed workers by nation and region of the UK between 2007 and 2017 (16+)
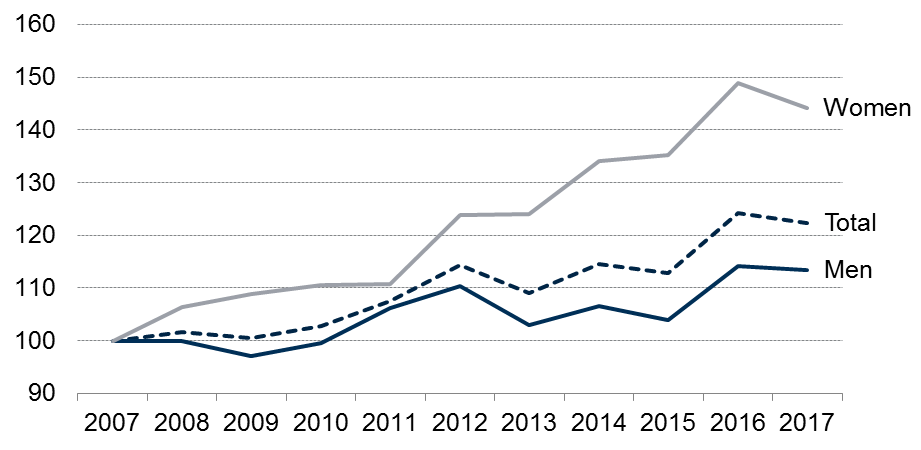
Men make up the majority of those who are self employed in Scotland, accounting for 66%. However, this is a fall from 71% in 2007. Between 2007 and 2017 the number of women who are self employed in Scotland has increased by 44% compared with the number of men increasing by 13%. Women accounted for 57% of the increase in the number of those who are self employed in Scotland between 2007 and 2017.
Figure 7: Growth in the number of self-employed workers in by gender in Scotland between 2007 and 2017 (16+)
Sources
Office for National Statistics. (2018, May 15). Regional labour market statistics in the UK: May 2018. Retrieved from <a href="https://www.ons.gov.uk/releases/regionallabourmarketstatisticsintheukmay2018" target="_blank">https://www.ons.gov.uk/releases/regionallabourmarketstatisticsintheukmay2018</a> [accessed 15 May 2018]
Office for National Statistics. (2018, May 15). UK labour market statistics: May 2018. Retrieved from <a href="https://www.ons.gov.uk/releases/uklabourmarketstatisticsmay2018" target="_blank">https://www.ons.gov.uk/releases/uklabourmarketstatisticsmay2018</a> [accessed 15 May 2018]
Office for National Statistics. (2018, January 2). A guide to labour market statistics. Retrieved from <a href="https://www.ons.gov.uk/employmentandlabourmarket/peopleinwork/employmentandemployeetypes/methodologies/aguidetolabourmarketstatistics#employment" target="_blank">https://www.ons.gov.uk/employmentandlabourmarket/peopleinwork/employmentandemployeetypes/methodologies/aguidetolabourmarketstatistics#employment</a> [accessed 15 May 2018]