Scotland's Exports - 2016
This briefing analyses the Export Statistics Scotland 2016 release from the Scottish Government, providing a breakdown of exports by sector and location.
Executive Summary
This briefing analyses the Export Statistics Scotland 20161 release from the Scottish Government, providing a breakdown of exports by sector and location.
The key points from this years statistics:
Total exports from Scotland were estimated to be worth £75.6bn in 2016, falling by £3.9bn, or 5.0% , from 2015.
International exports were worth £29.8bn in 2016, an increase of £460m, or 1.6%, from 2015.
Exports to the rest of the UK were worth £45.8bn in 2016, a decrease of £4.4bn, or 8.8%, from 2015.
Exports to the EU fell by £0.1bn between 2015 and 2016, and are currently worth £12.7bn.
Services continue to be the largest "broad export sector" at £37.1bn, despite seeing a fall of £1.4bn, or 3.7%, between 2015 and 2016.
Manufacturing exports were worth £26.0bn in 2016 but fell by £0.8bn, or 2.9%, from 2015
In 2016:
"Financial & insurance" (Services) was the highest valued export to the rest of the UK at £7.8bn.
"Refined petroleum & chemical" (Manufacturing) was the highest valued export to the EU at £2.2bn.
"Food & drink" (Manufacturing) was the highest value export to non-EU destinations at £3.4bn.
In order for the Scottish Government target of increasing international exports by 50% between 2010 and 2017 to be met the value of international exports will have to increase by around 21% between 2016 and 2017.
How important are exports to the Scottish economy?
Figure 1 shows the value of exports as a percentage of the Scottish on-shore economy. Presenting export figures in this way shows the relative importance of exports to the economy as a whole over a period of time regardless of changes to prices.
Figure 1: Exports as a proportion of Scottish onshore GDP - 2002 to 2016
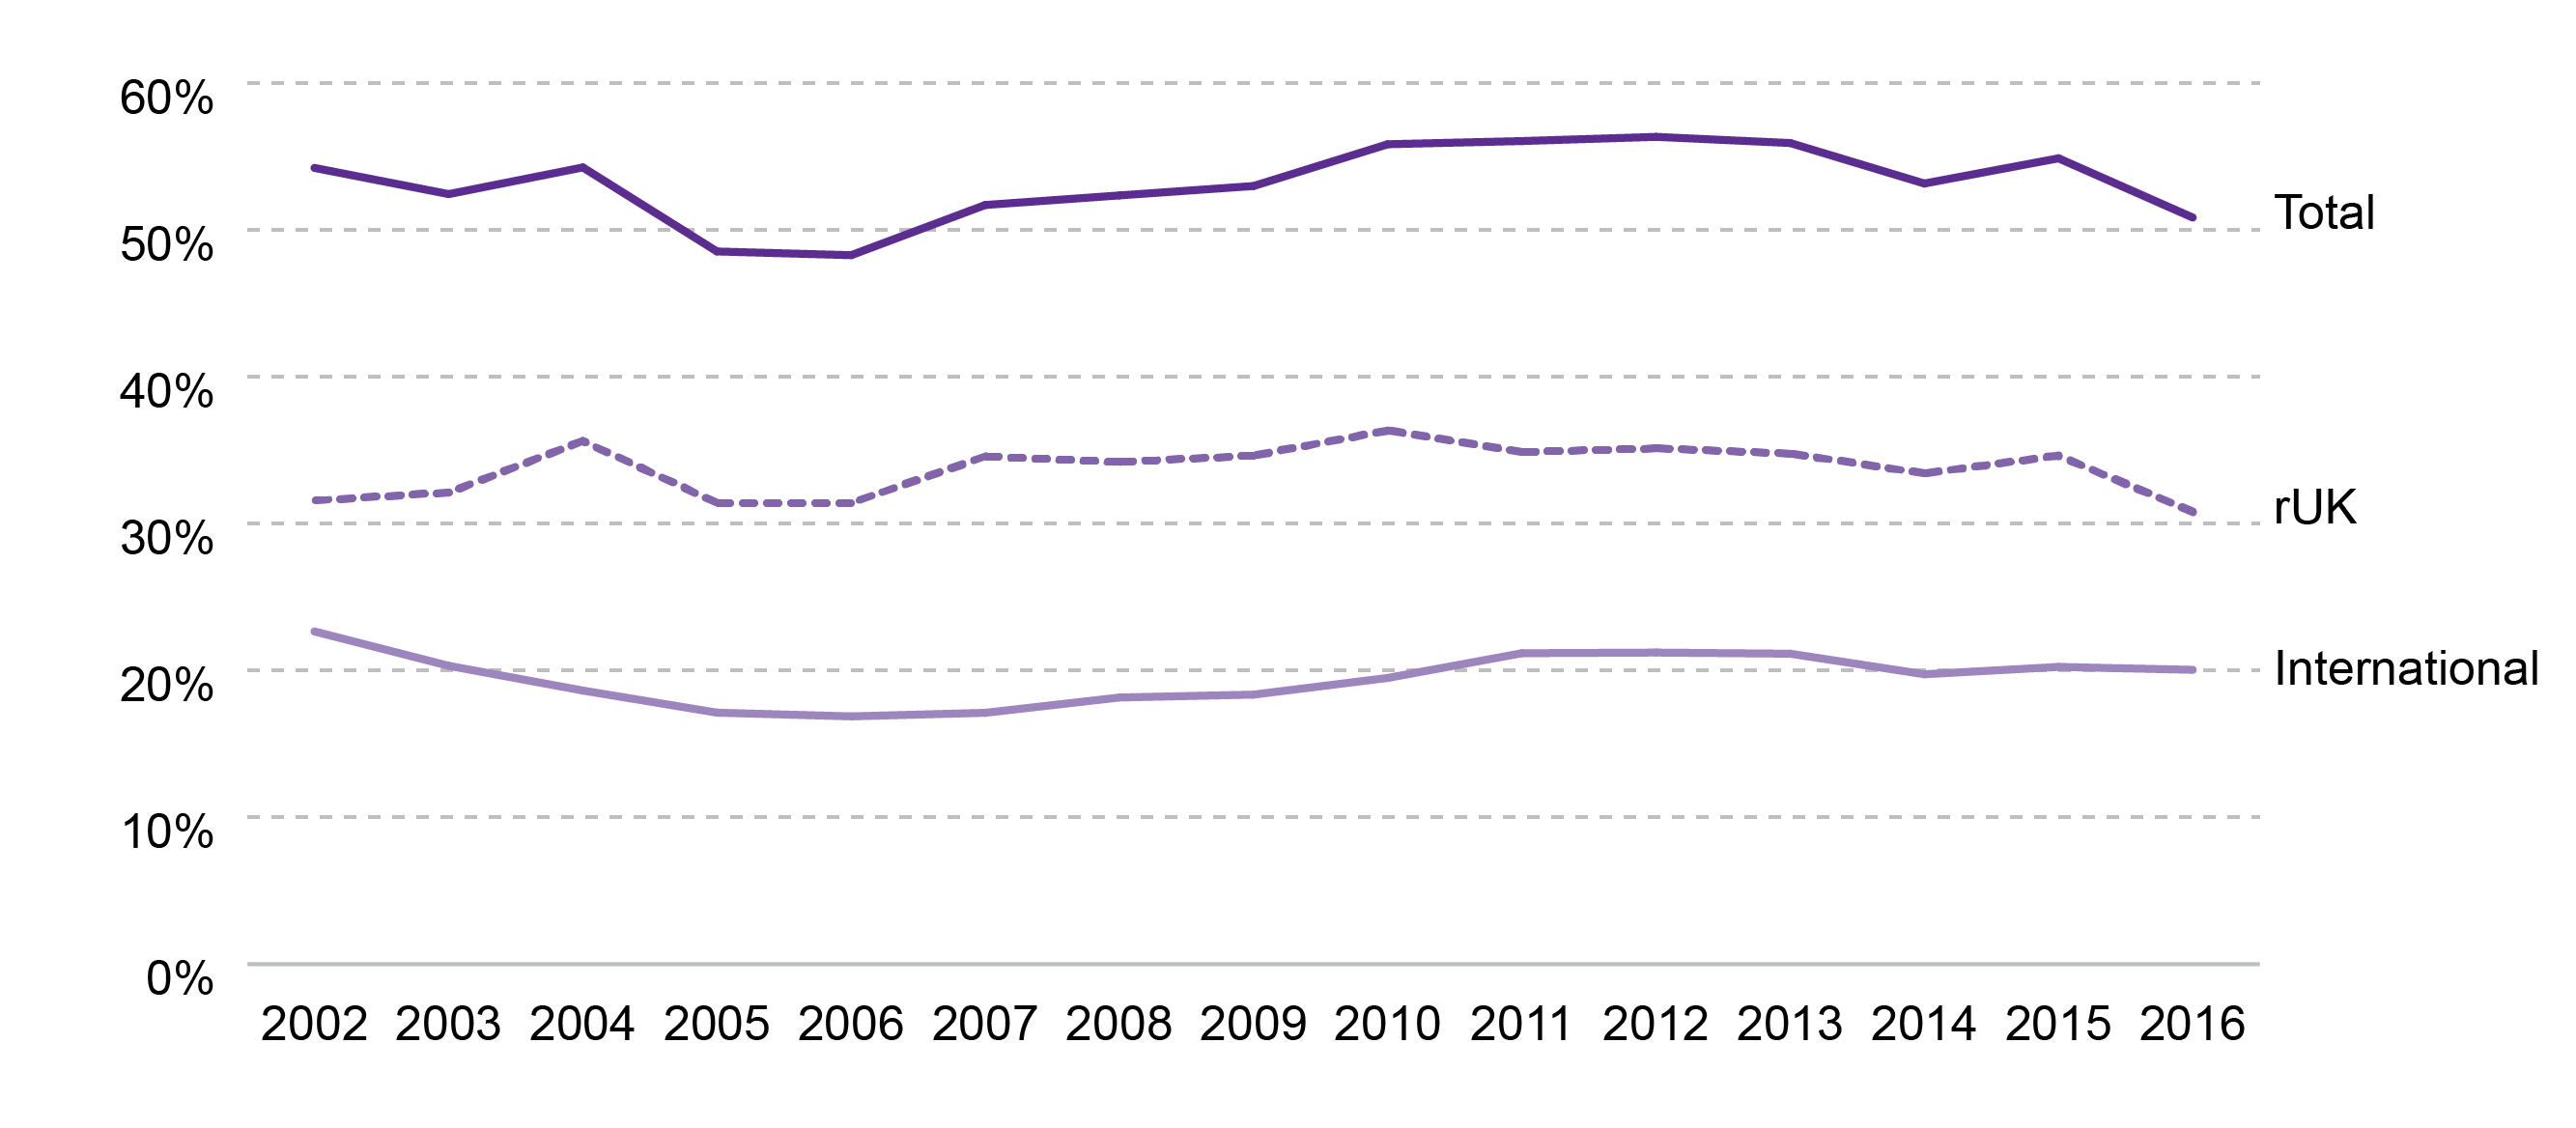
Since 2002 total exports as a proportion of onshore GDP in Scotland has been around 53%, peaking at 56.3% in 2012 and hitting a low of 48.3% in 2006. Looking at a breakdown by destination shows that:
Between 2002 and 2006 exports to the rest of the UK were around 32% of onshore GDP, then from 2007 to 2015 they were around 35% of GDP. The latest figures how they have dropped to 31% of onshore GDP.
Between 2002 and 2006 international exports fell from 23% to 17%, then from 2007 to 2012 they increased to 21%. Since then they have remained around 21% with the 2016 figure falling slightly to 20%.
How much are exports worth?
Total exports from Scotland were estimated to be worth £75.6bn in 2016. This figure consists of exports to the rest of the UK plus international exports but does not include oil and gas exports from the Scottish section of the UK Continental Shelf.
Unless otherwise stated figures in this briefing are in cash terms
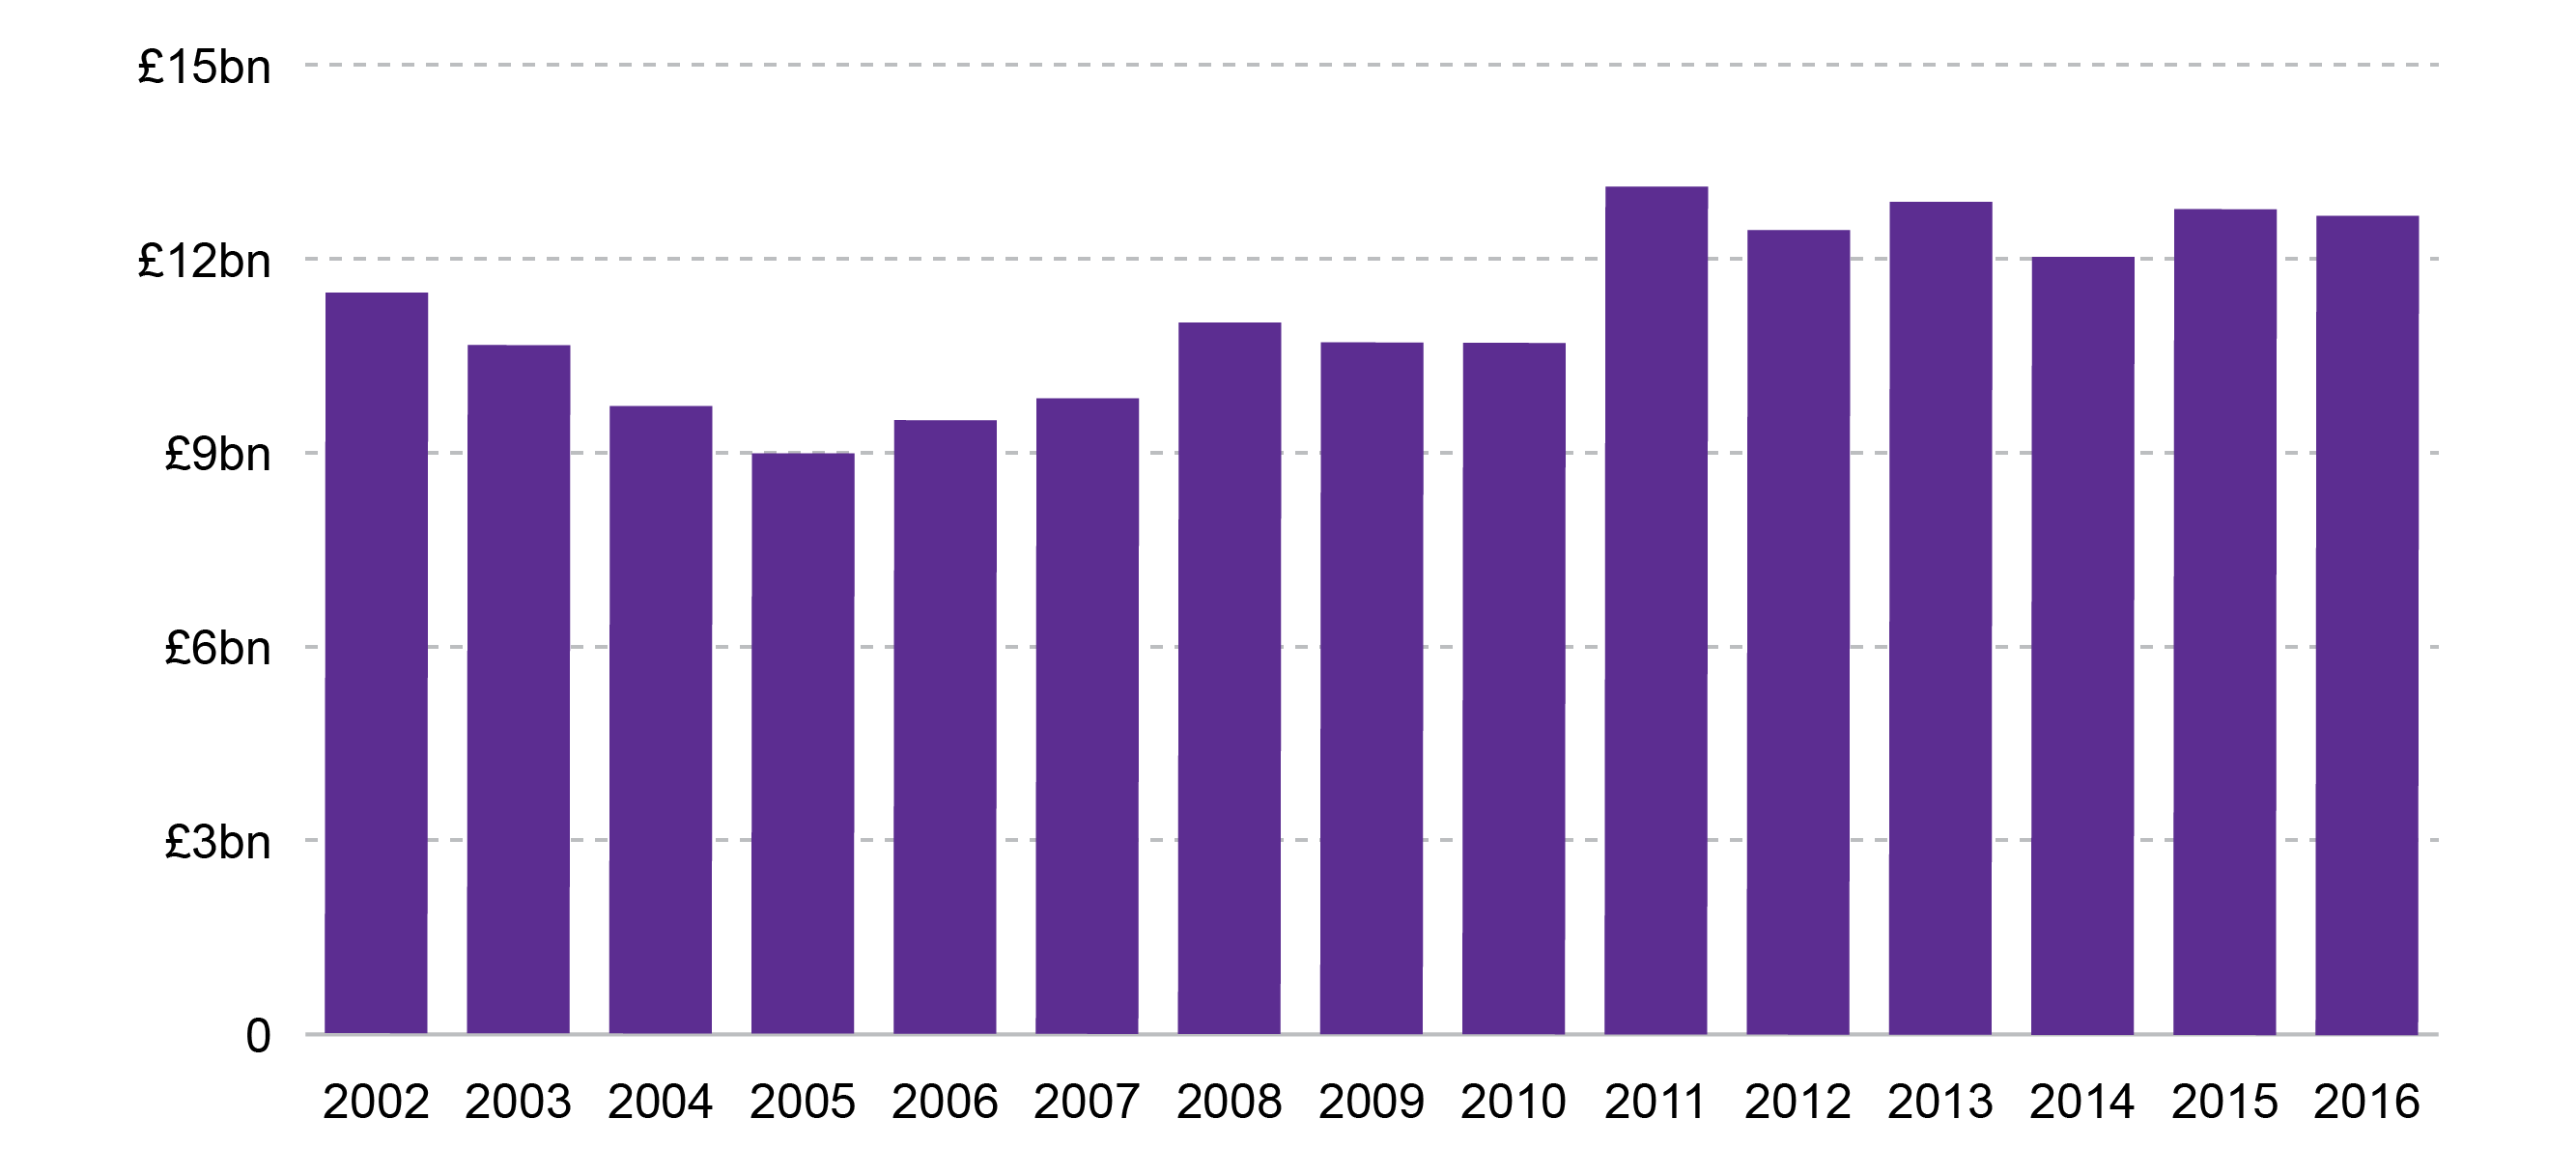
Figure 2: Value of total exports from Scotland - 2002 to 2016
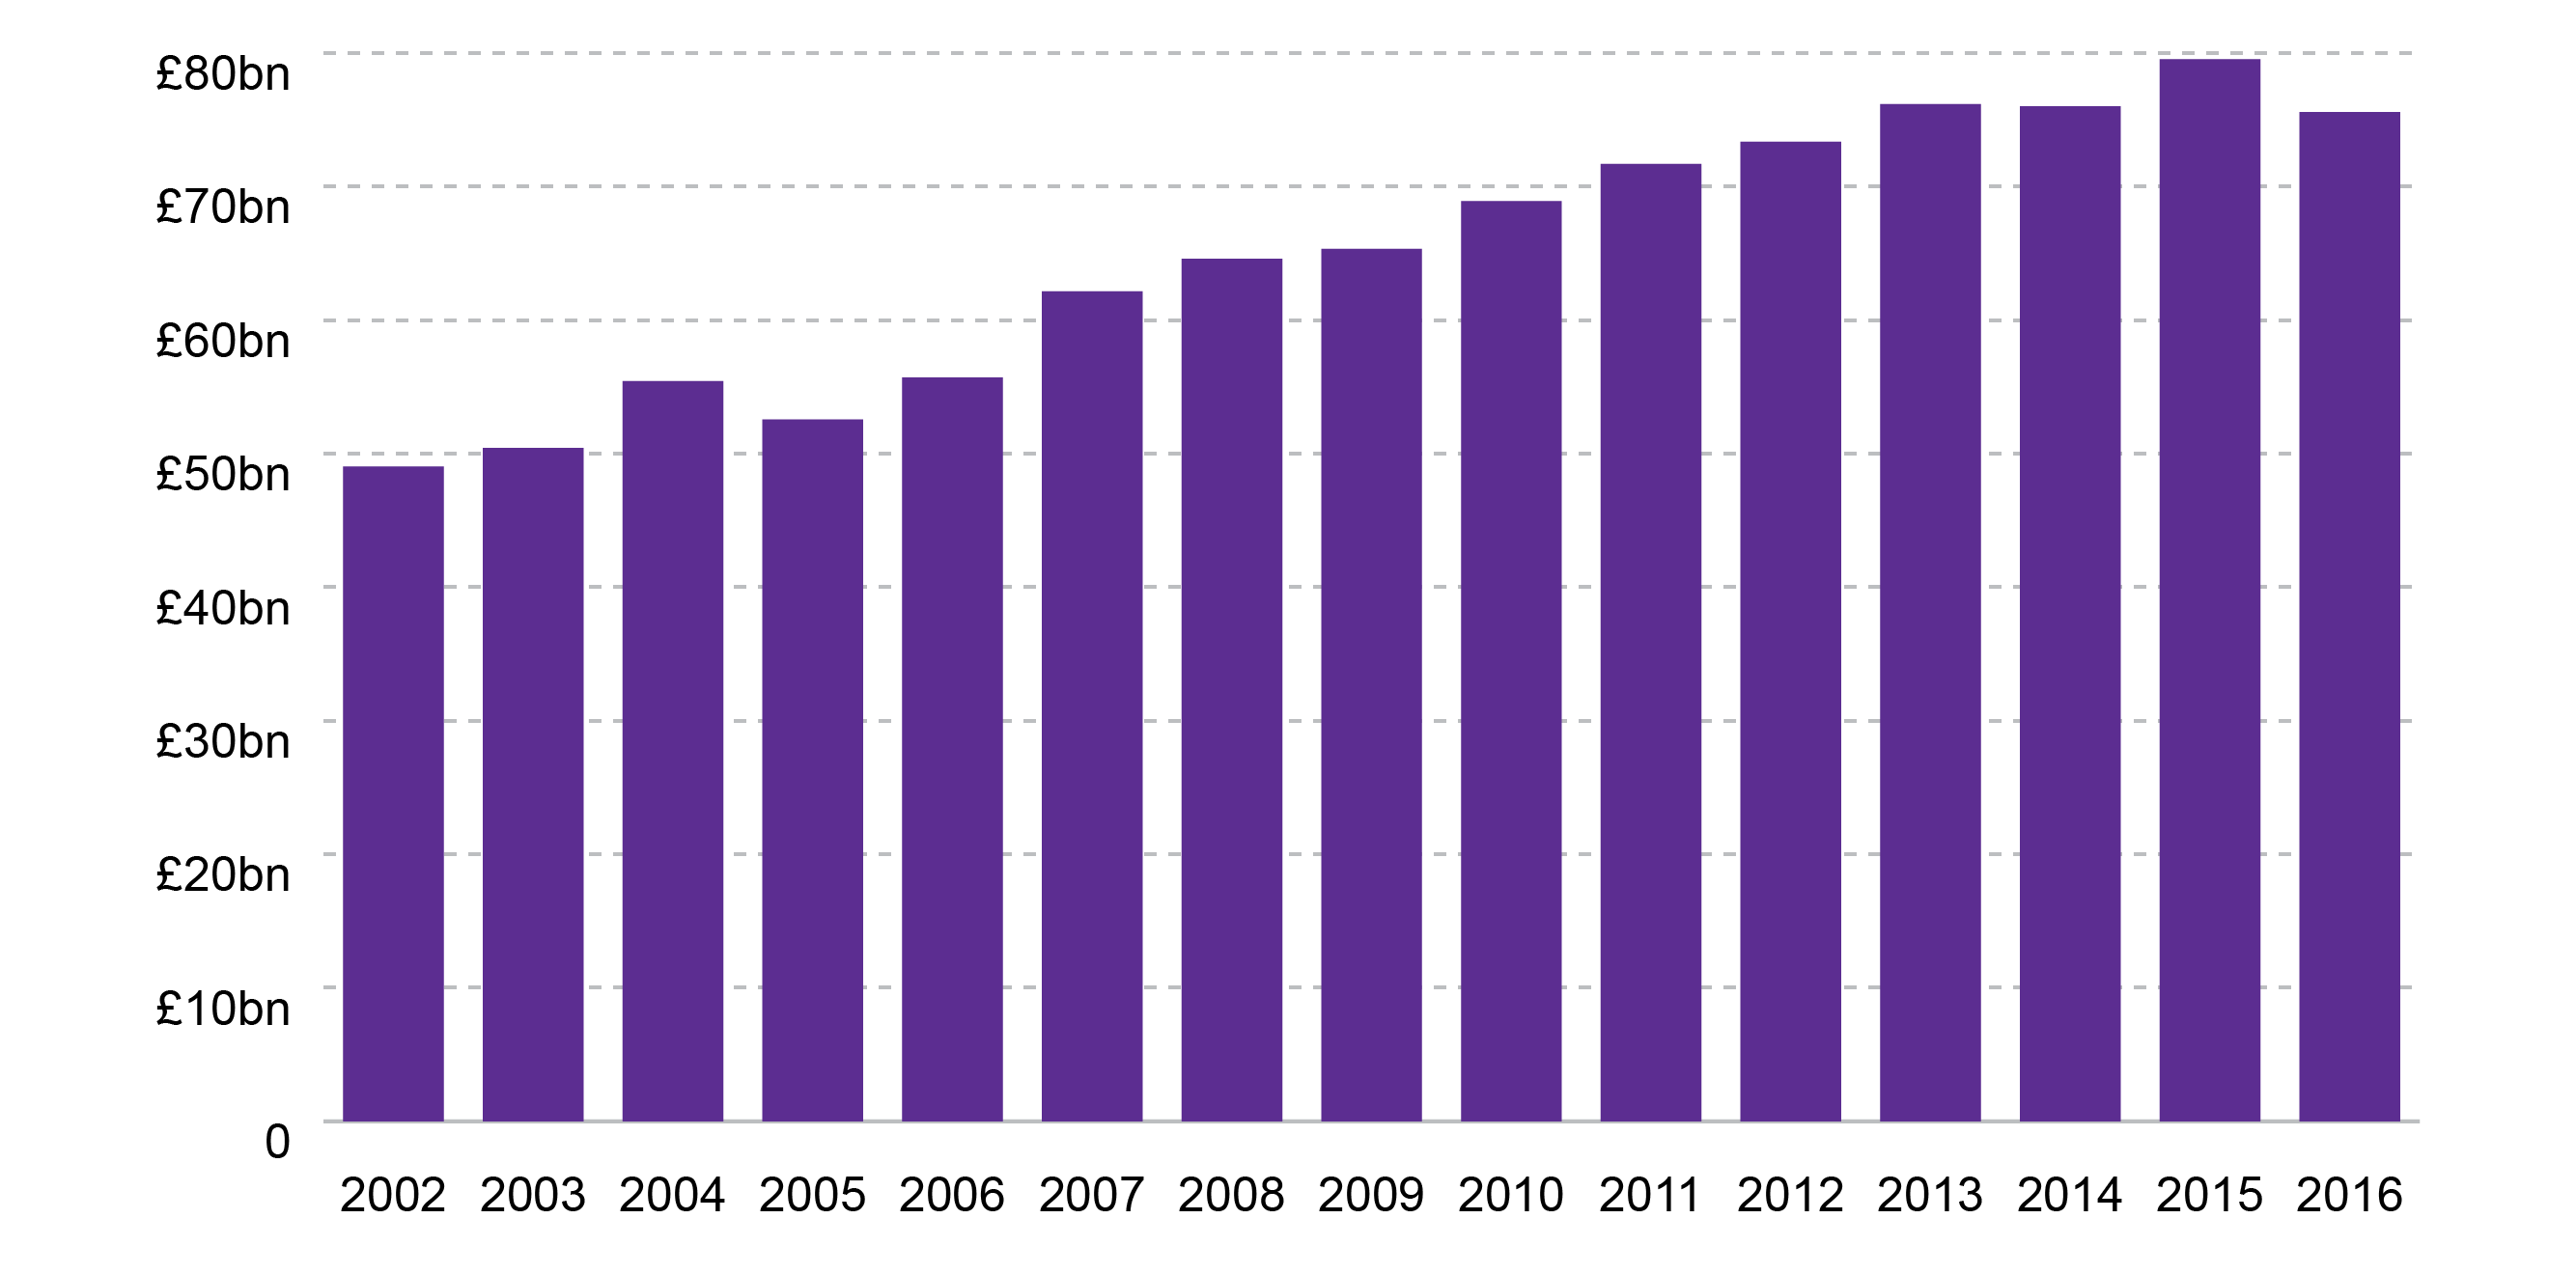
Between 2015 and 2016 the total value of exports fell by 5.0%, or £3.9bn.
Looking at the data from 2002 to 2016 shows that:
Between 2002 and 2016 the total value of exports grew by £26.6bn, or 54.2%.
£15.6bn, or 59%, of growth in the total value of exports came between 2002 and 2008, with an average annual growth rate of around 5%.
£11.0bn of growth in the total value of exports came between 2009 and 2016 with an average annual growth rate has been around 2%.
What does Scotland export?
What do Scotland's overall exports look like?
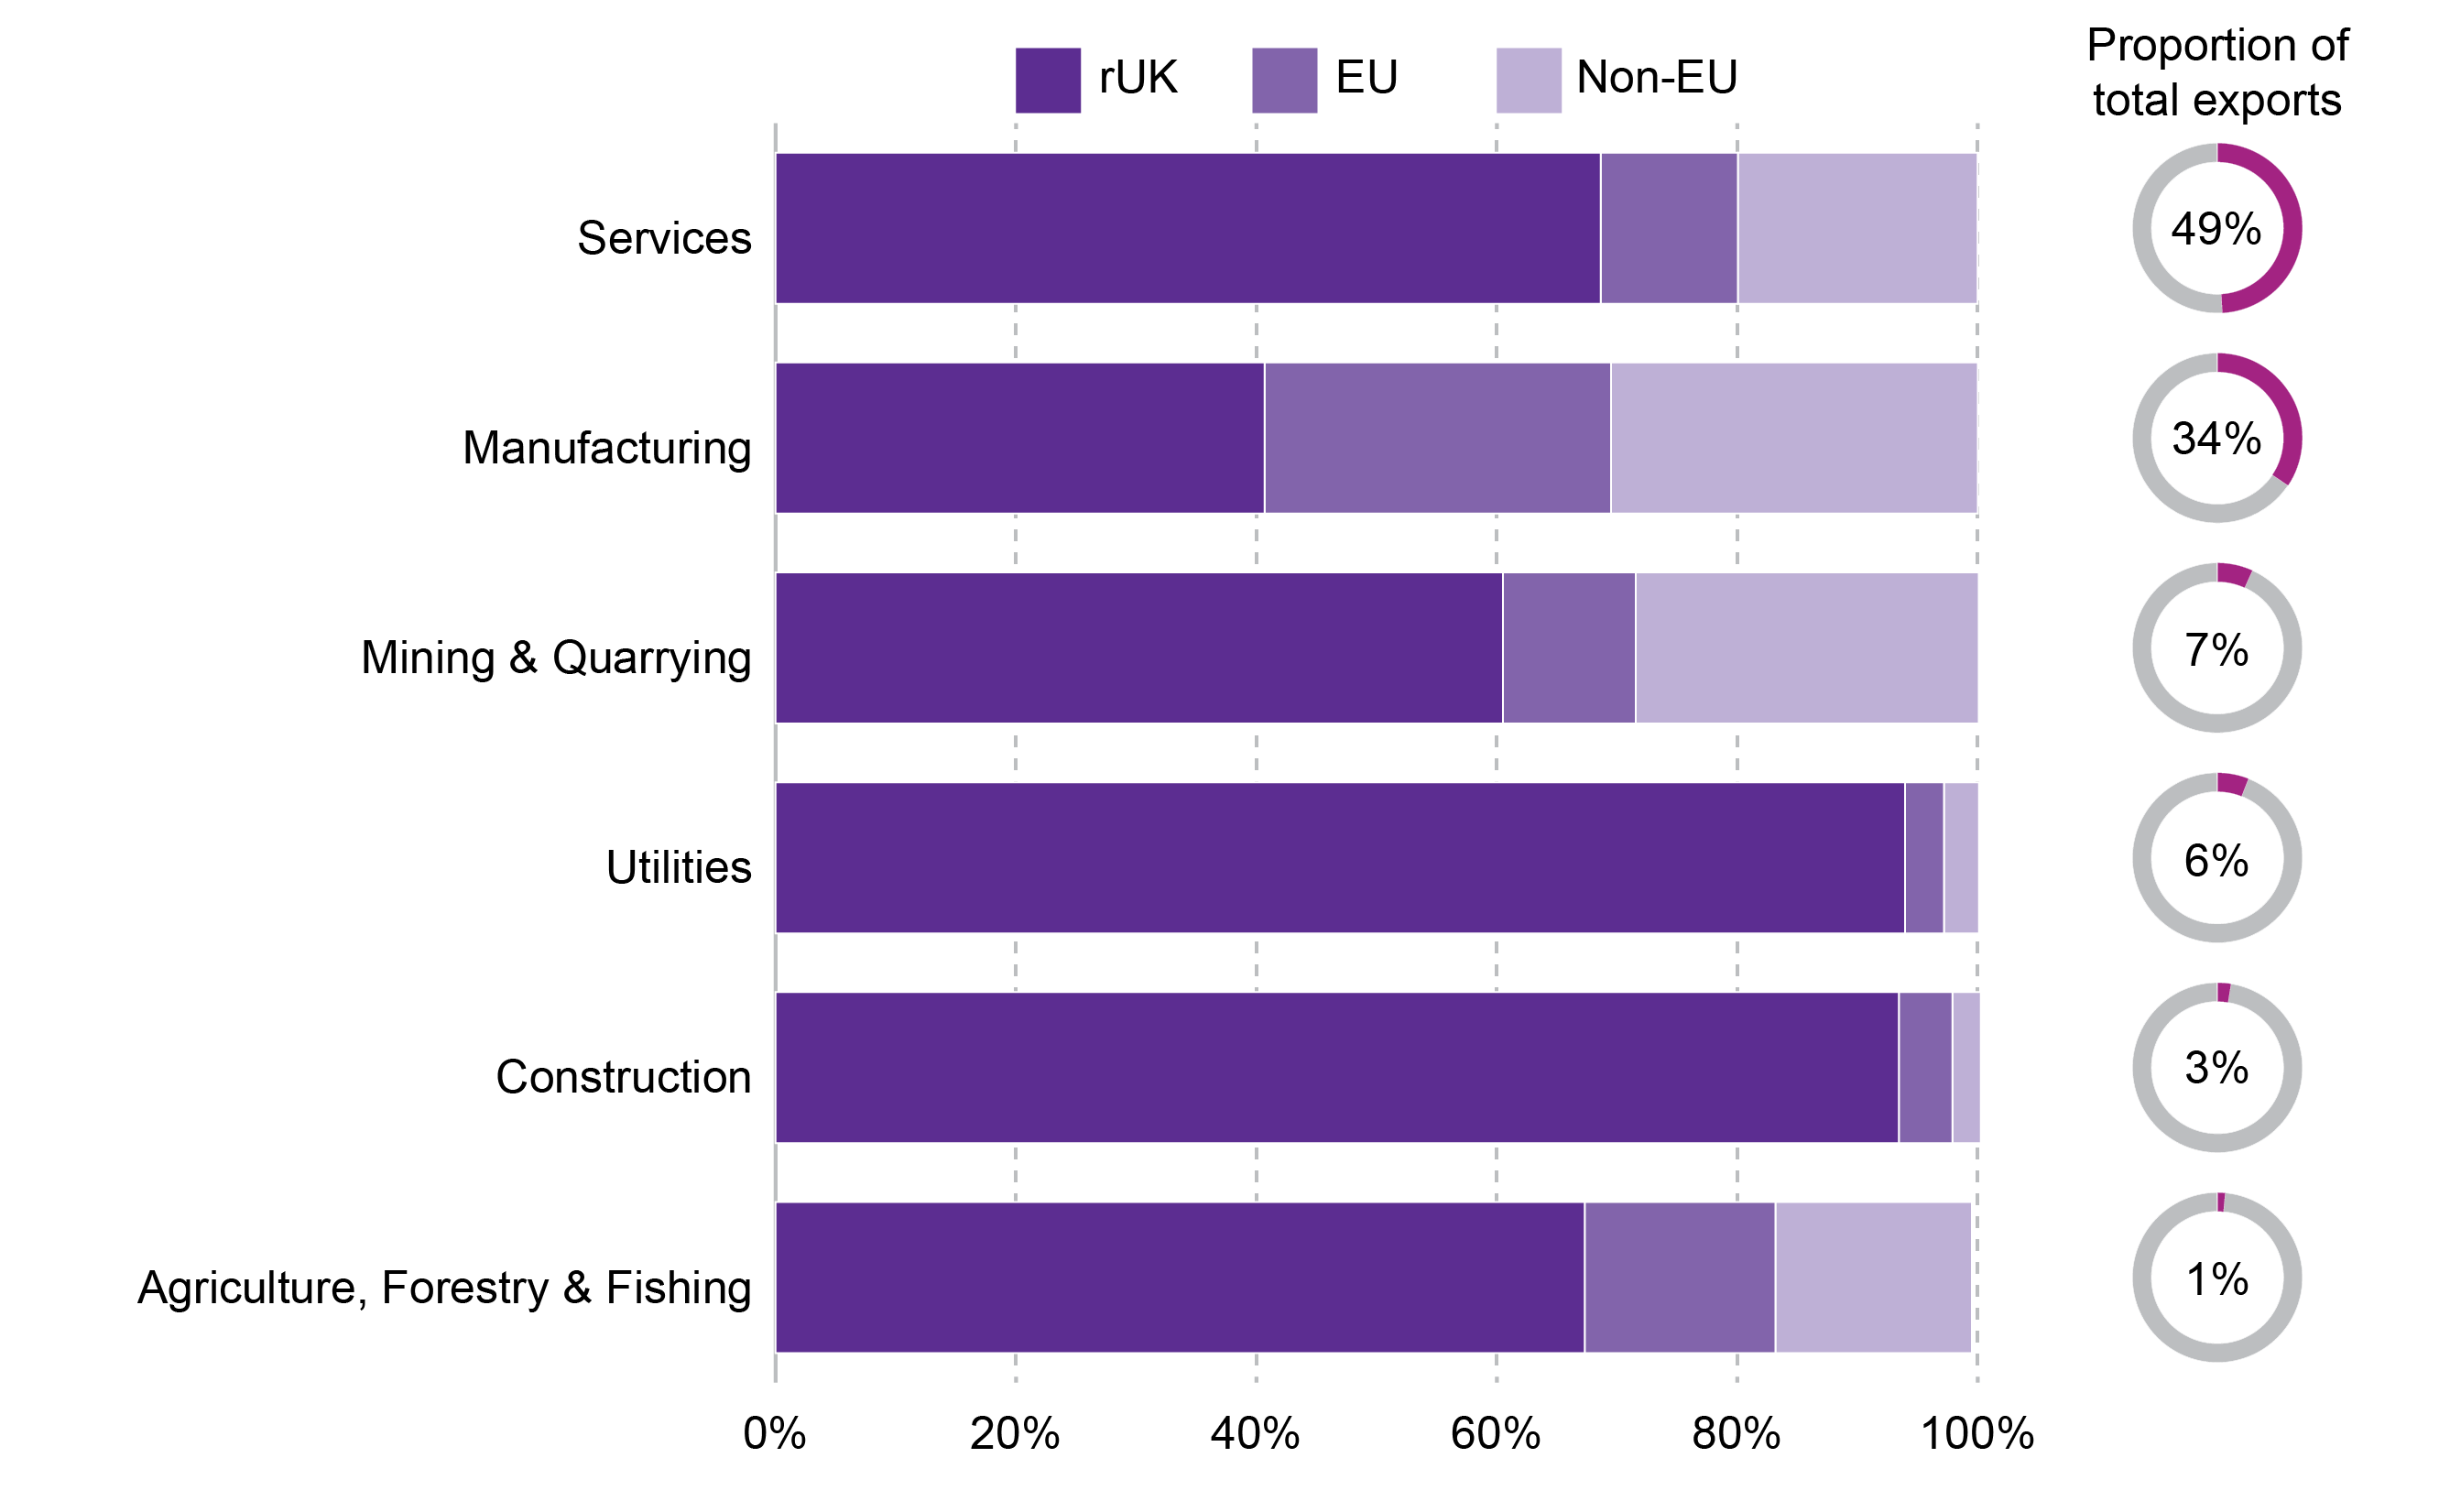
Figure 3: Value of exports by broad sector in Scotland - 2016
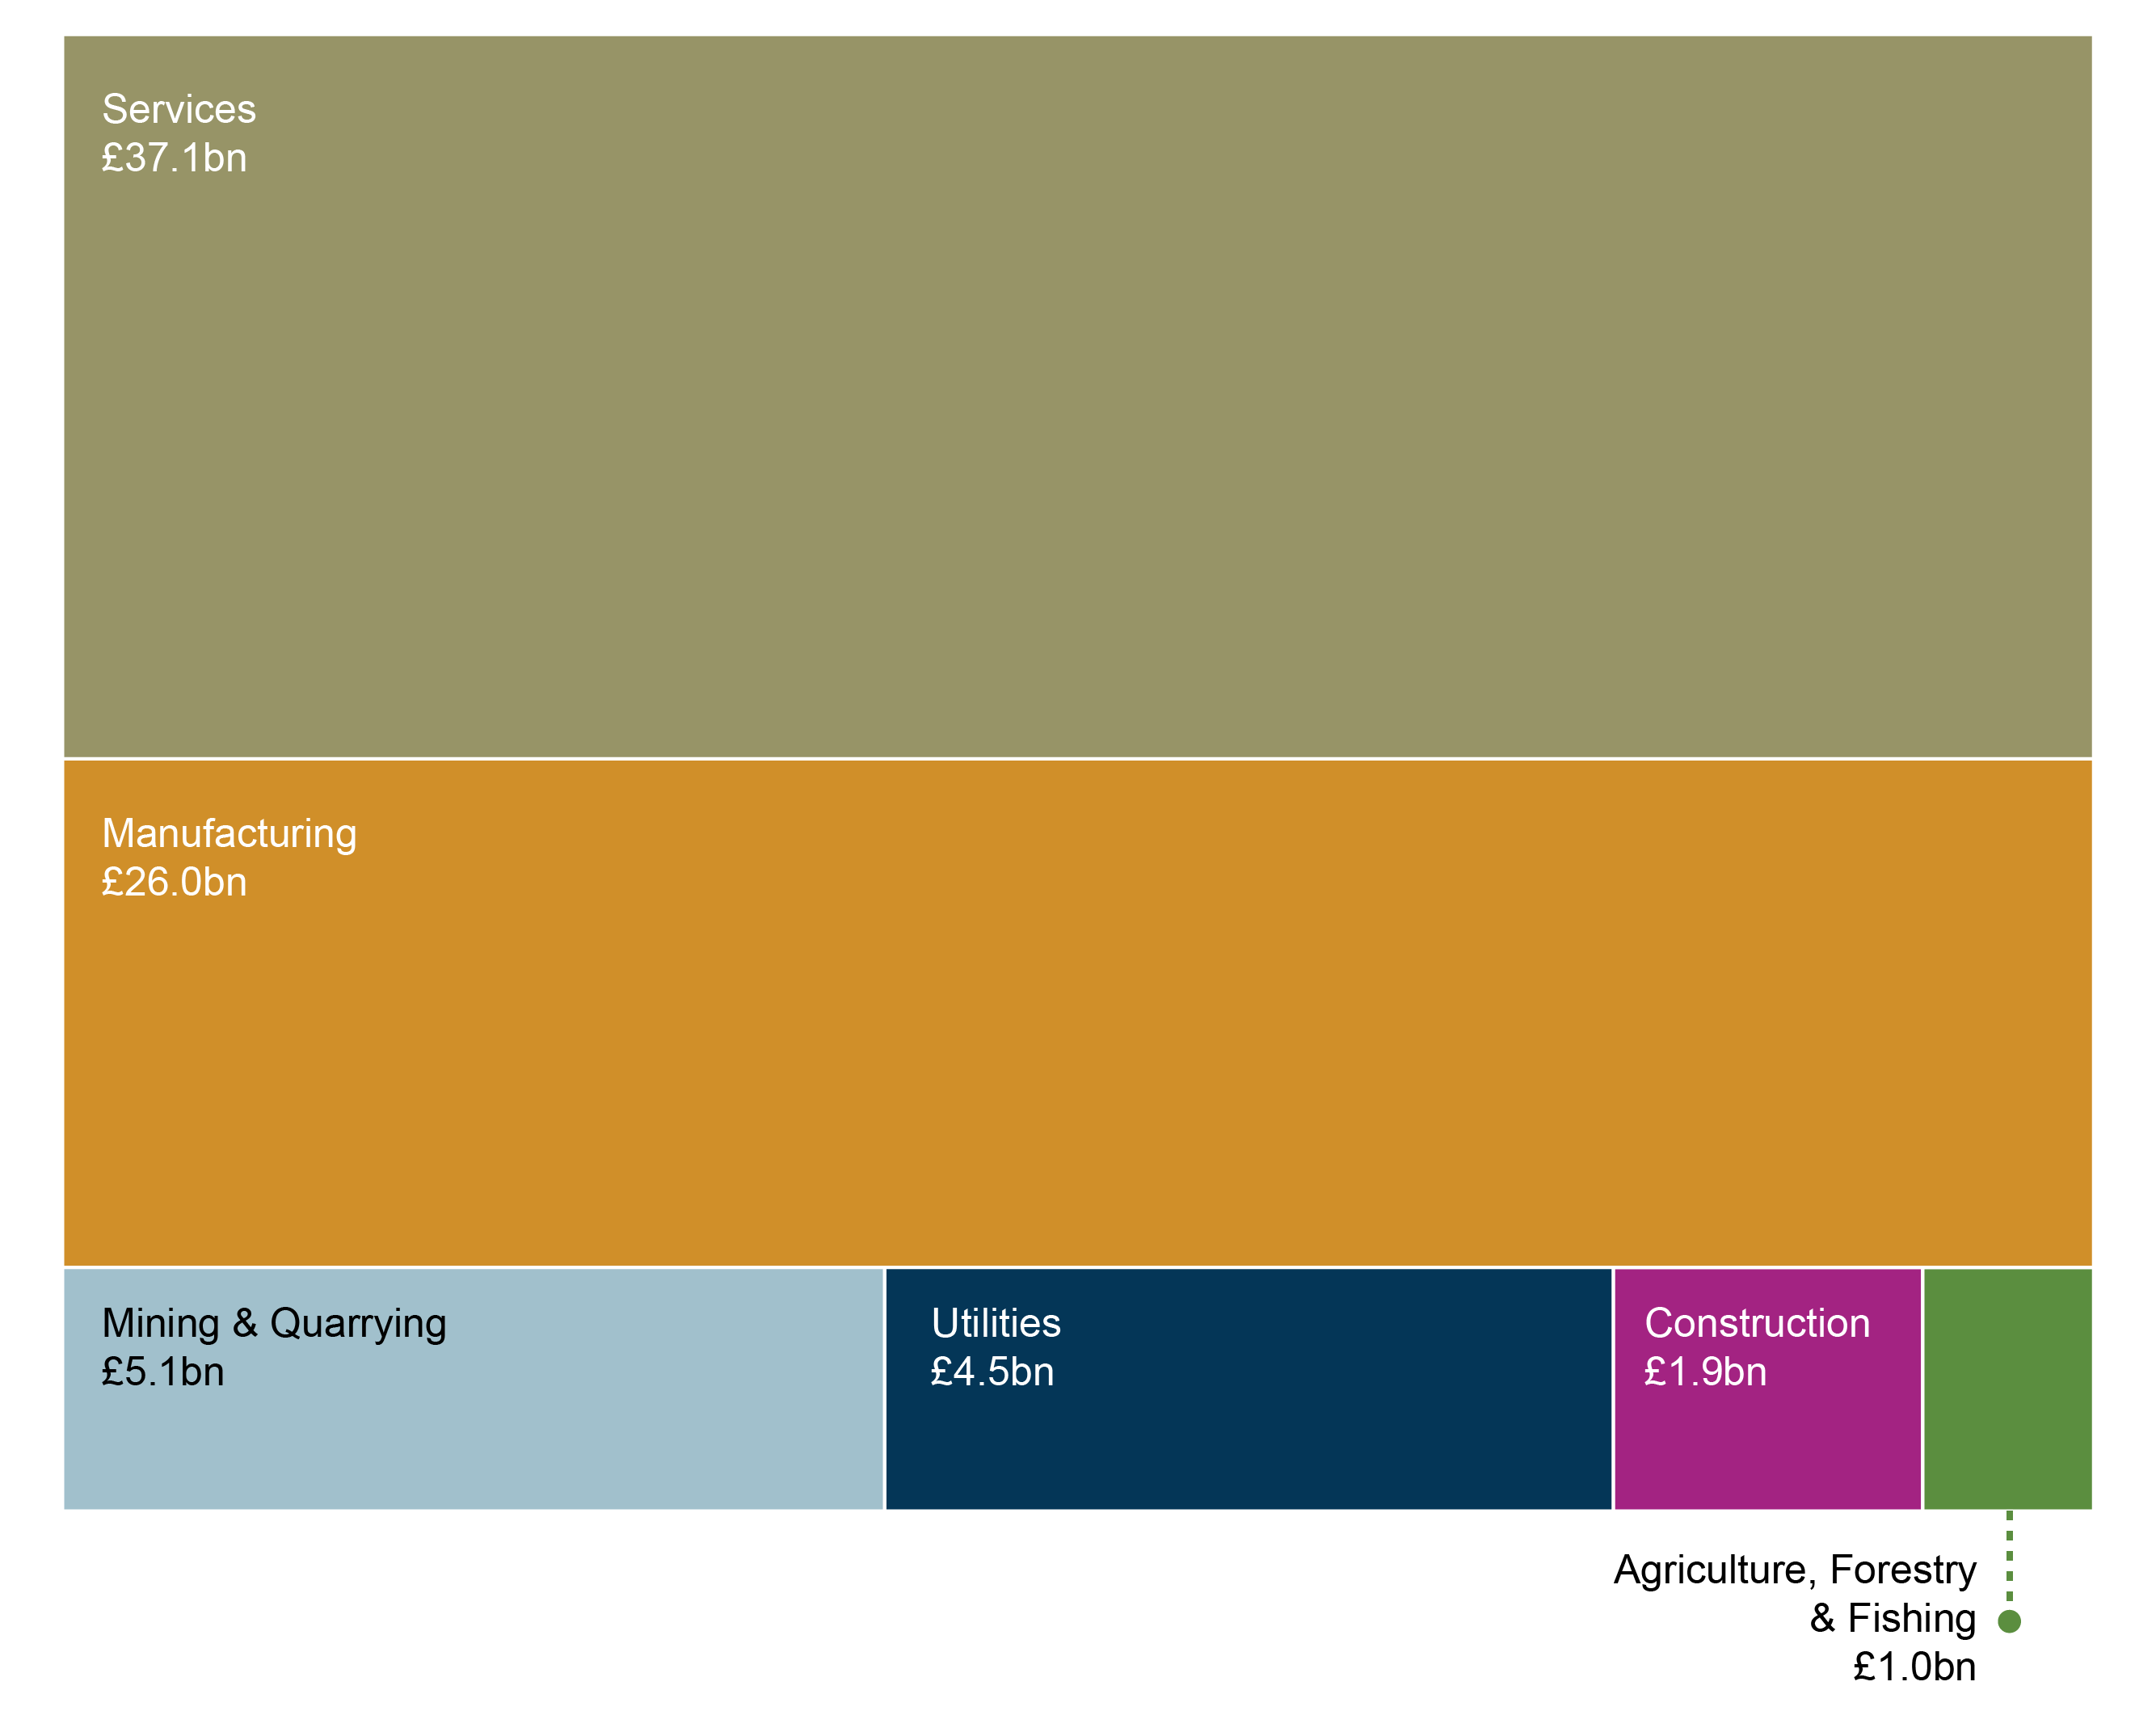
Figure 3 shows total Scottish exports broken down by sector. Between them, services (49%) and manufacturing (34%) comprise £63.1bn, or 84%, of total Scottish exports. The rest is made up of:
Mining and Quarrying (7%) - as the statistics exclude extraction of oil and gas this will include activities related to the preparation of extracted materials, such as oil and gas. This includes such activities as concentrating ores, liquefaction of natural gas and collection of solid fuels. However this does not include the processing of material which is included in manufacturing.
Utilities (6%) - providing electric power or natural gas through permanent infrastructure network such as lines, mains and pipes
Construction (3%) - general and specialised construction activities for buildings and civil engineering works.
Agriculture, Forestry and Fishing (1%) - growing crops, raising and breeding animals, harvesting timber and other plants, animals or animal products from a farm or their natural habitats. Please note that food and drink products are included in manufacturing.
Figure 4: Value of exports from Scotland by broad sector - 2002 to 2016
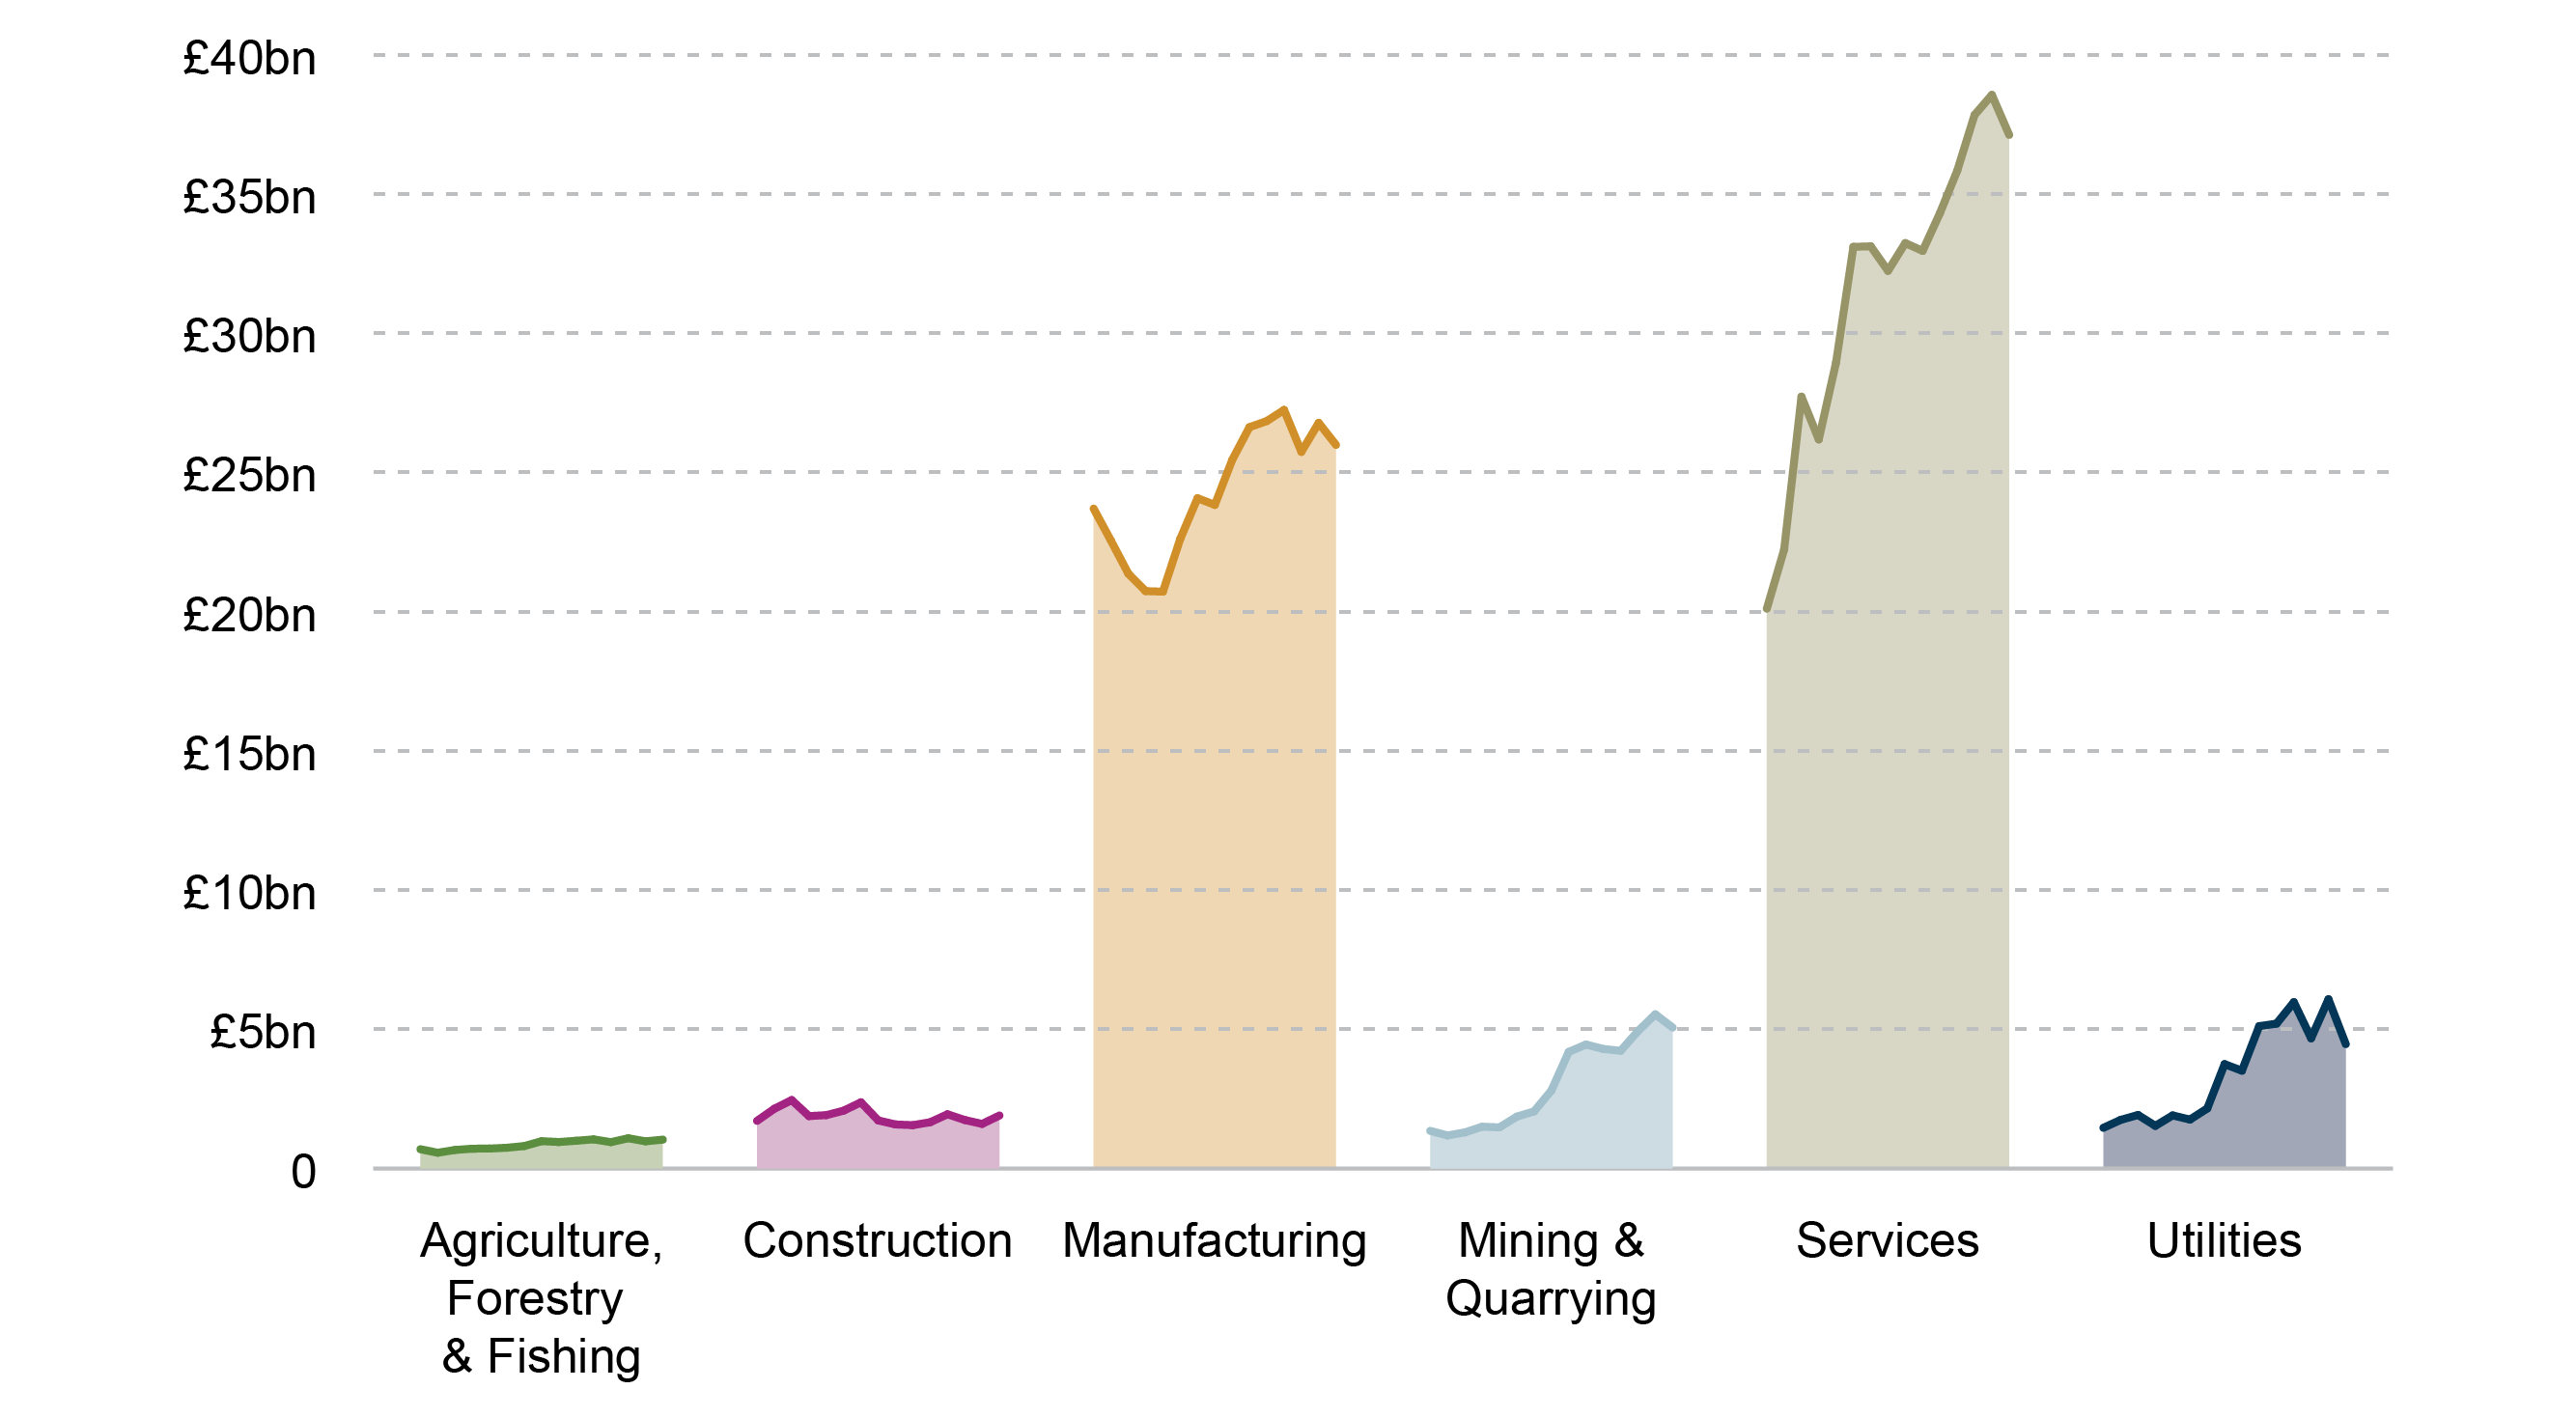
Looking at the value of exports by sector between 2002 and 2015:
“Mining and Quarrying” has seen the largest proportional increase between 2002 and 2016, increasing by 274% or £3.7bn.
“Service” exports have increased by £17.0bn between 2002 and 2015.
"Manufacturing" has seen the smallest proportional increase at 10%
Only "Agriculture, Forestry and fishing" and construction saw increases in exports between 2015 and 2016. "Utilities" saw the largest decrease both proportionally (-26%) and by value (£1.6bn). This can in part be explained by a decrease in electricity exports from Scotland, falling from 29% of total electricity produced in 2015 to 20% in 2016.1
What services does Scotland export?
Services exports are when a business has provided a service such as retail, transport, distribution, and accommodation and food. Total services exports in 2016 were worth £37.1bn and accounted for 49% of all exports.
Figure 5: Value of service sector total exports from Scotland - 2016
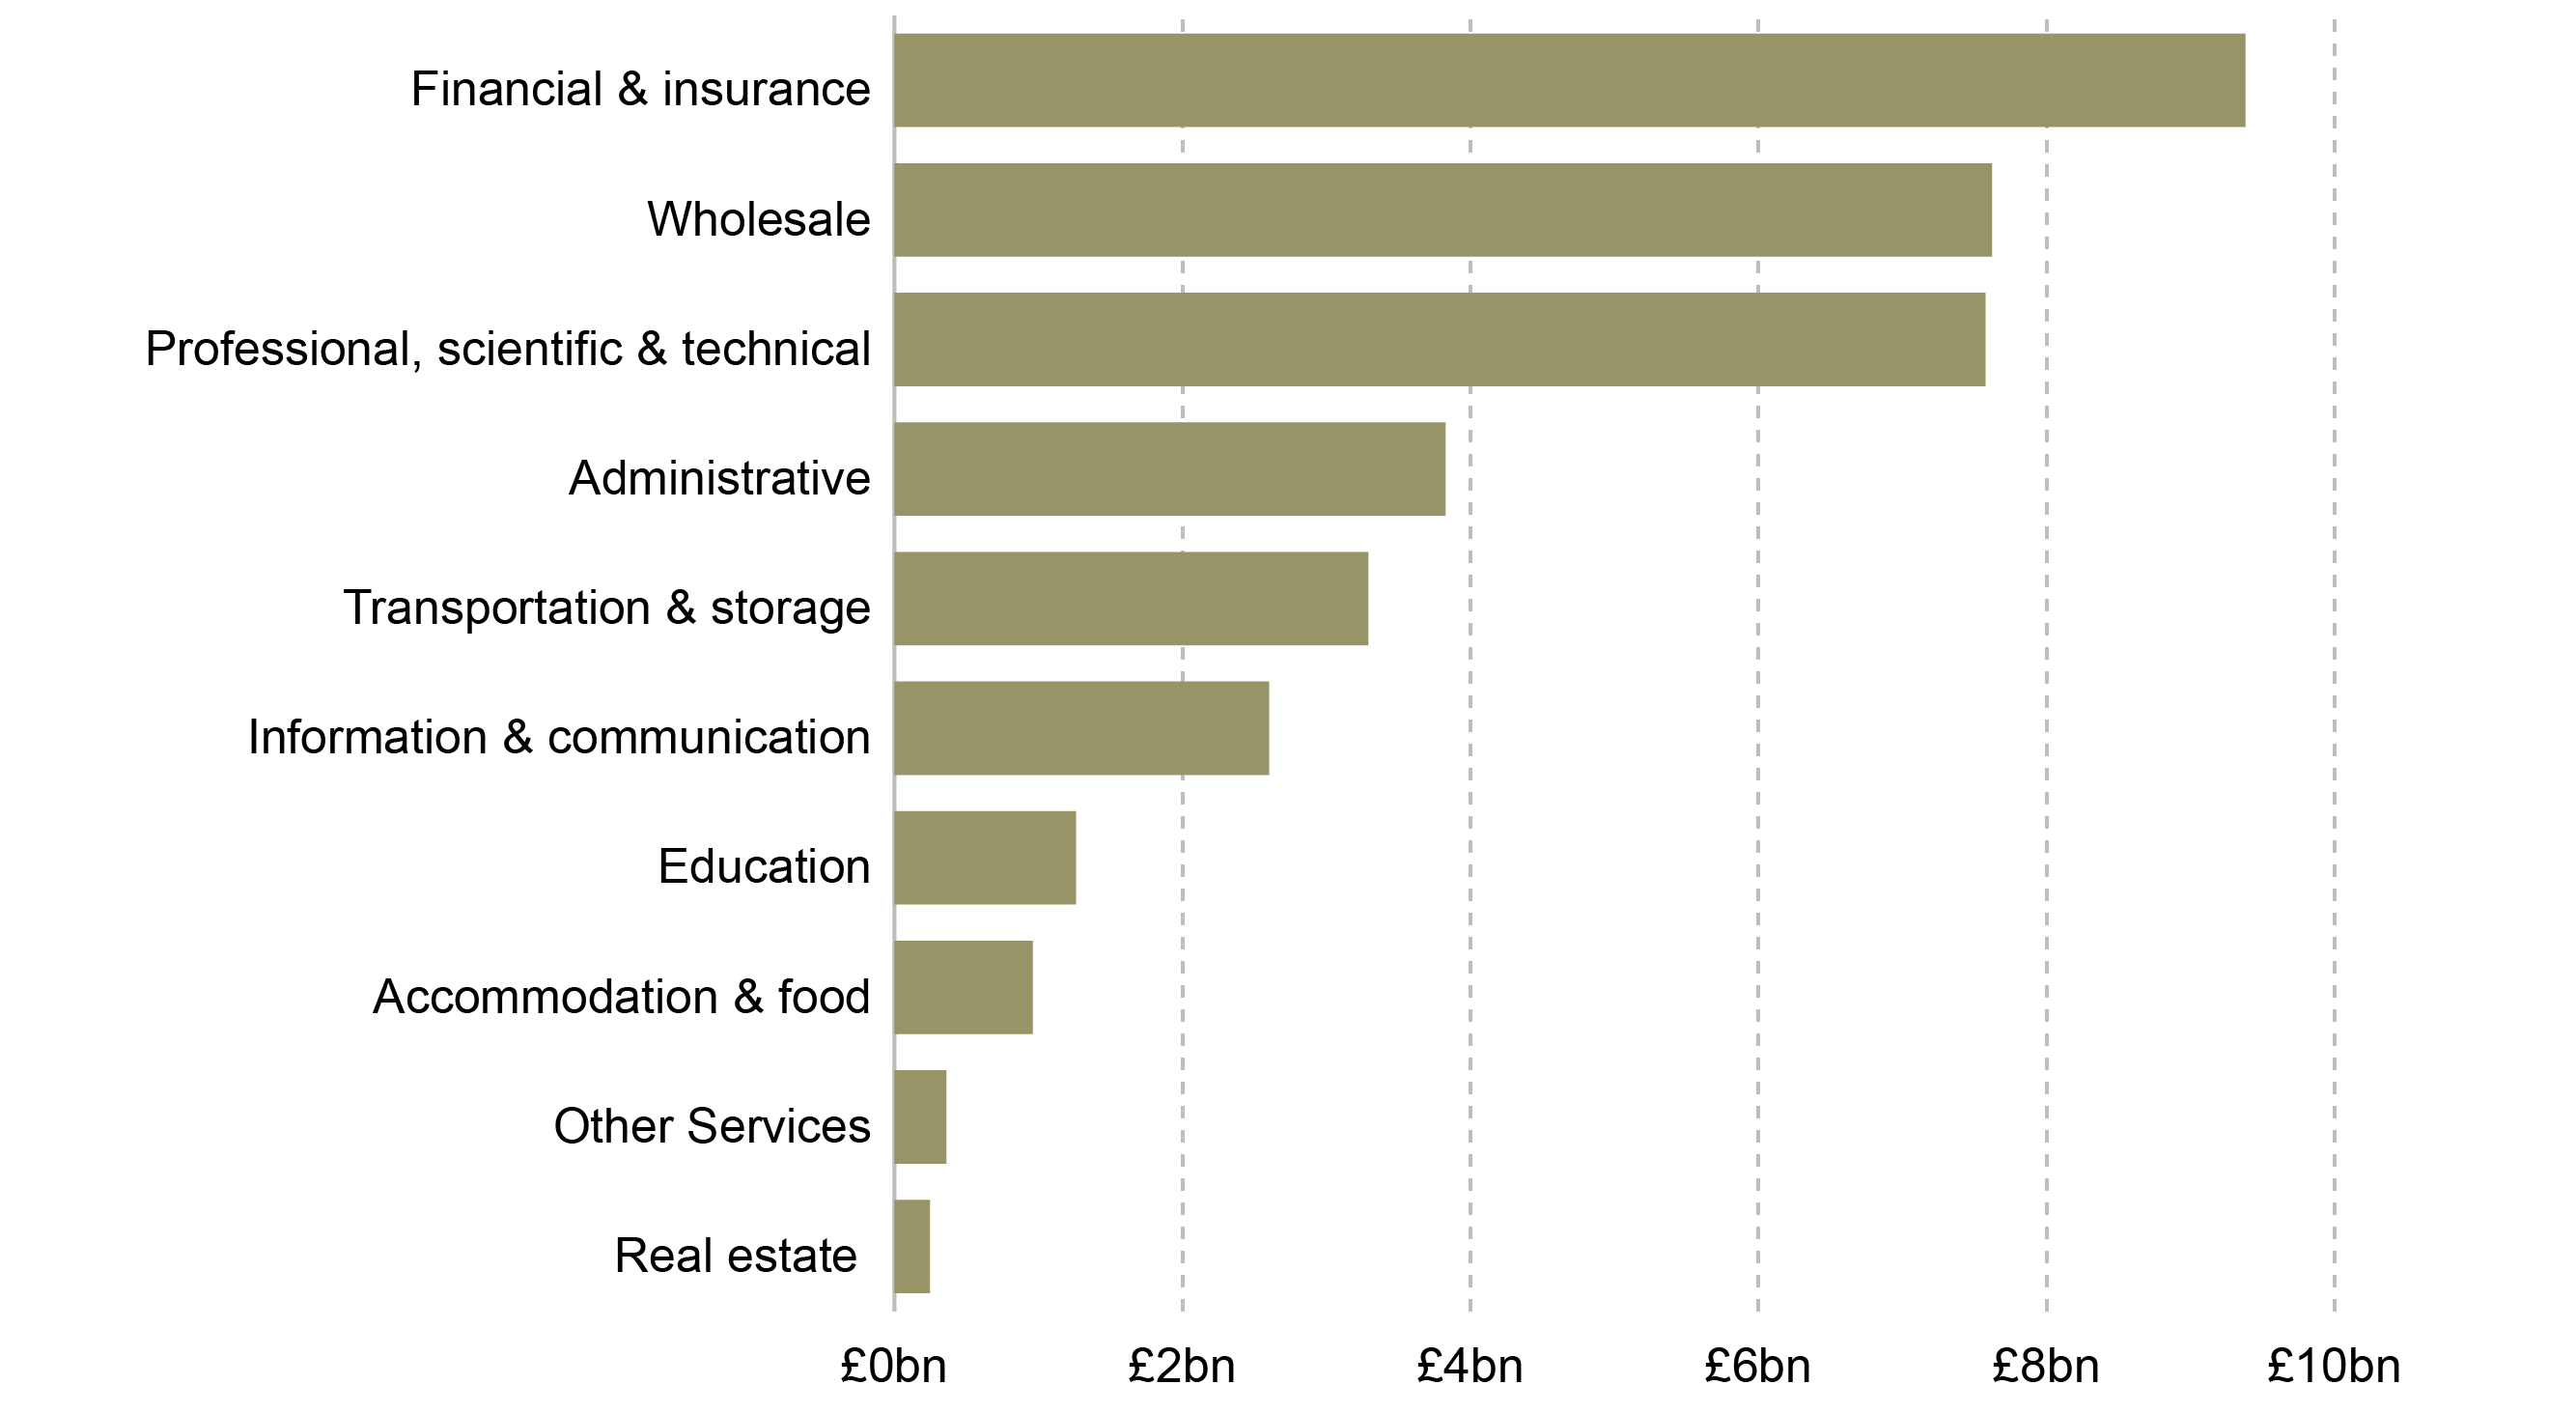
In 2016 “Financial and insurance” exports were the most valuable services exports at £9.4bn. This is also the most valuable exporting sector in Scotland. It was one of only three services sectors which saw growth between 2015 and 2016 (+1.4%), with "Education" (+0.8%) and "Other Service"(+71%.0) the only others. "Other services" consist of "Health and other community ", "social and personal service" as well as "arts, entertainment and recreation."
Figure 6: Value of service sector total exports from Scotland - 2002 to 2016
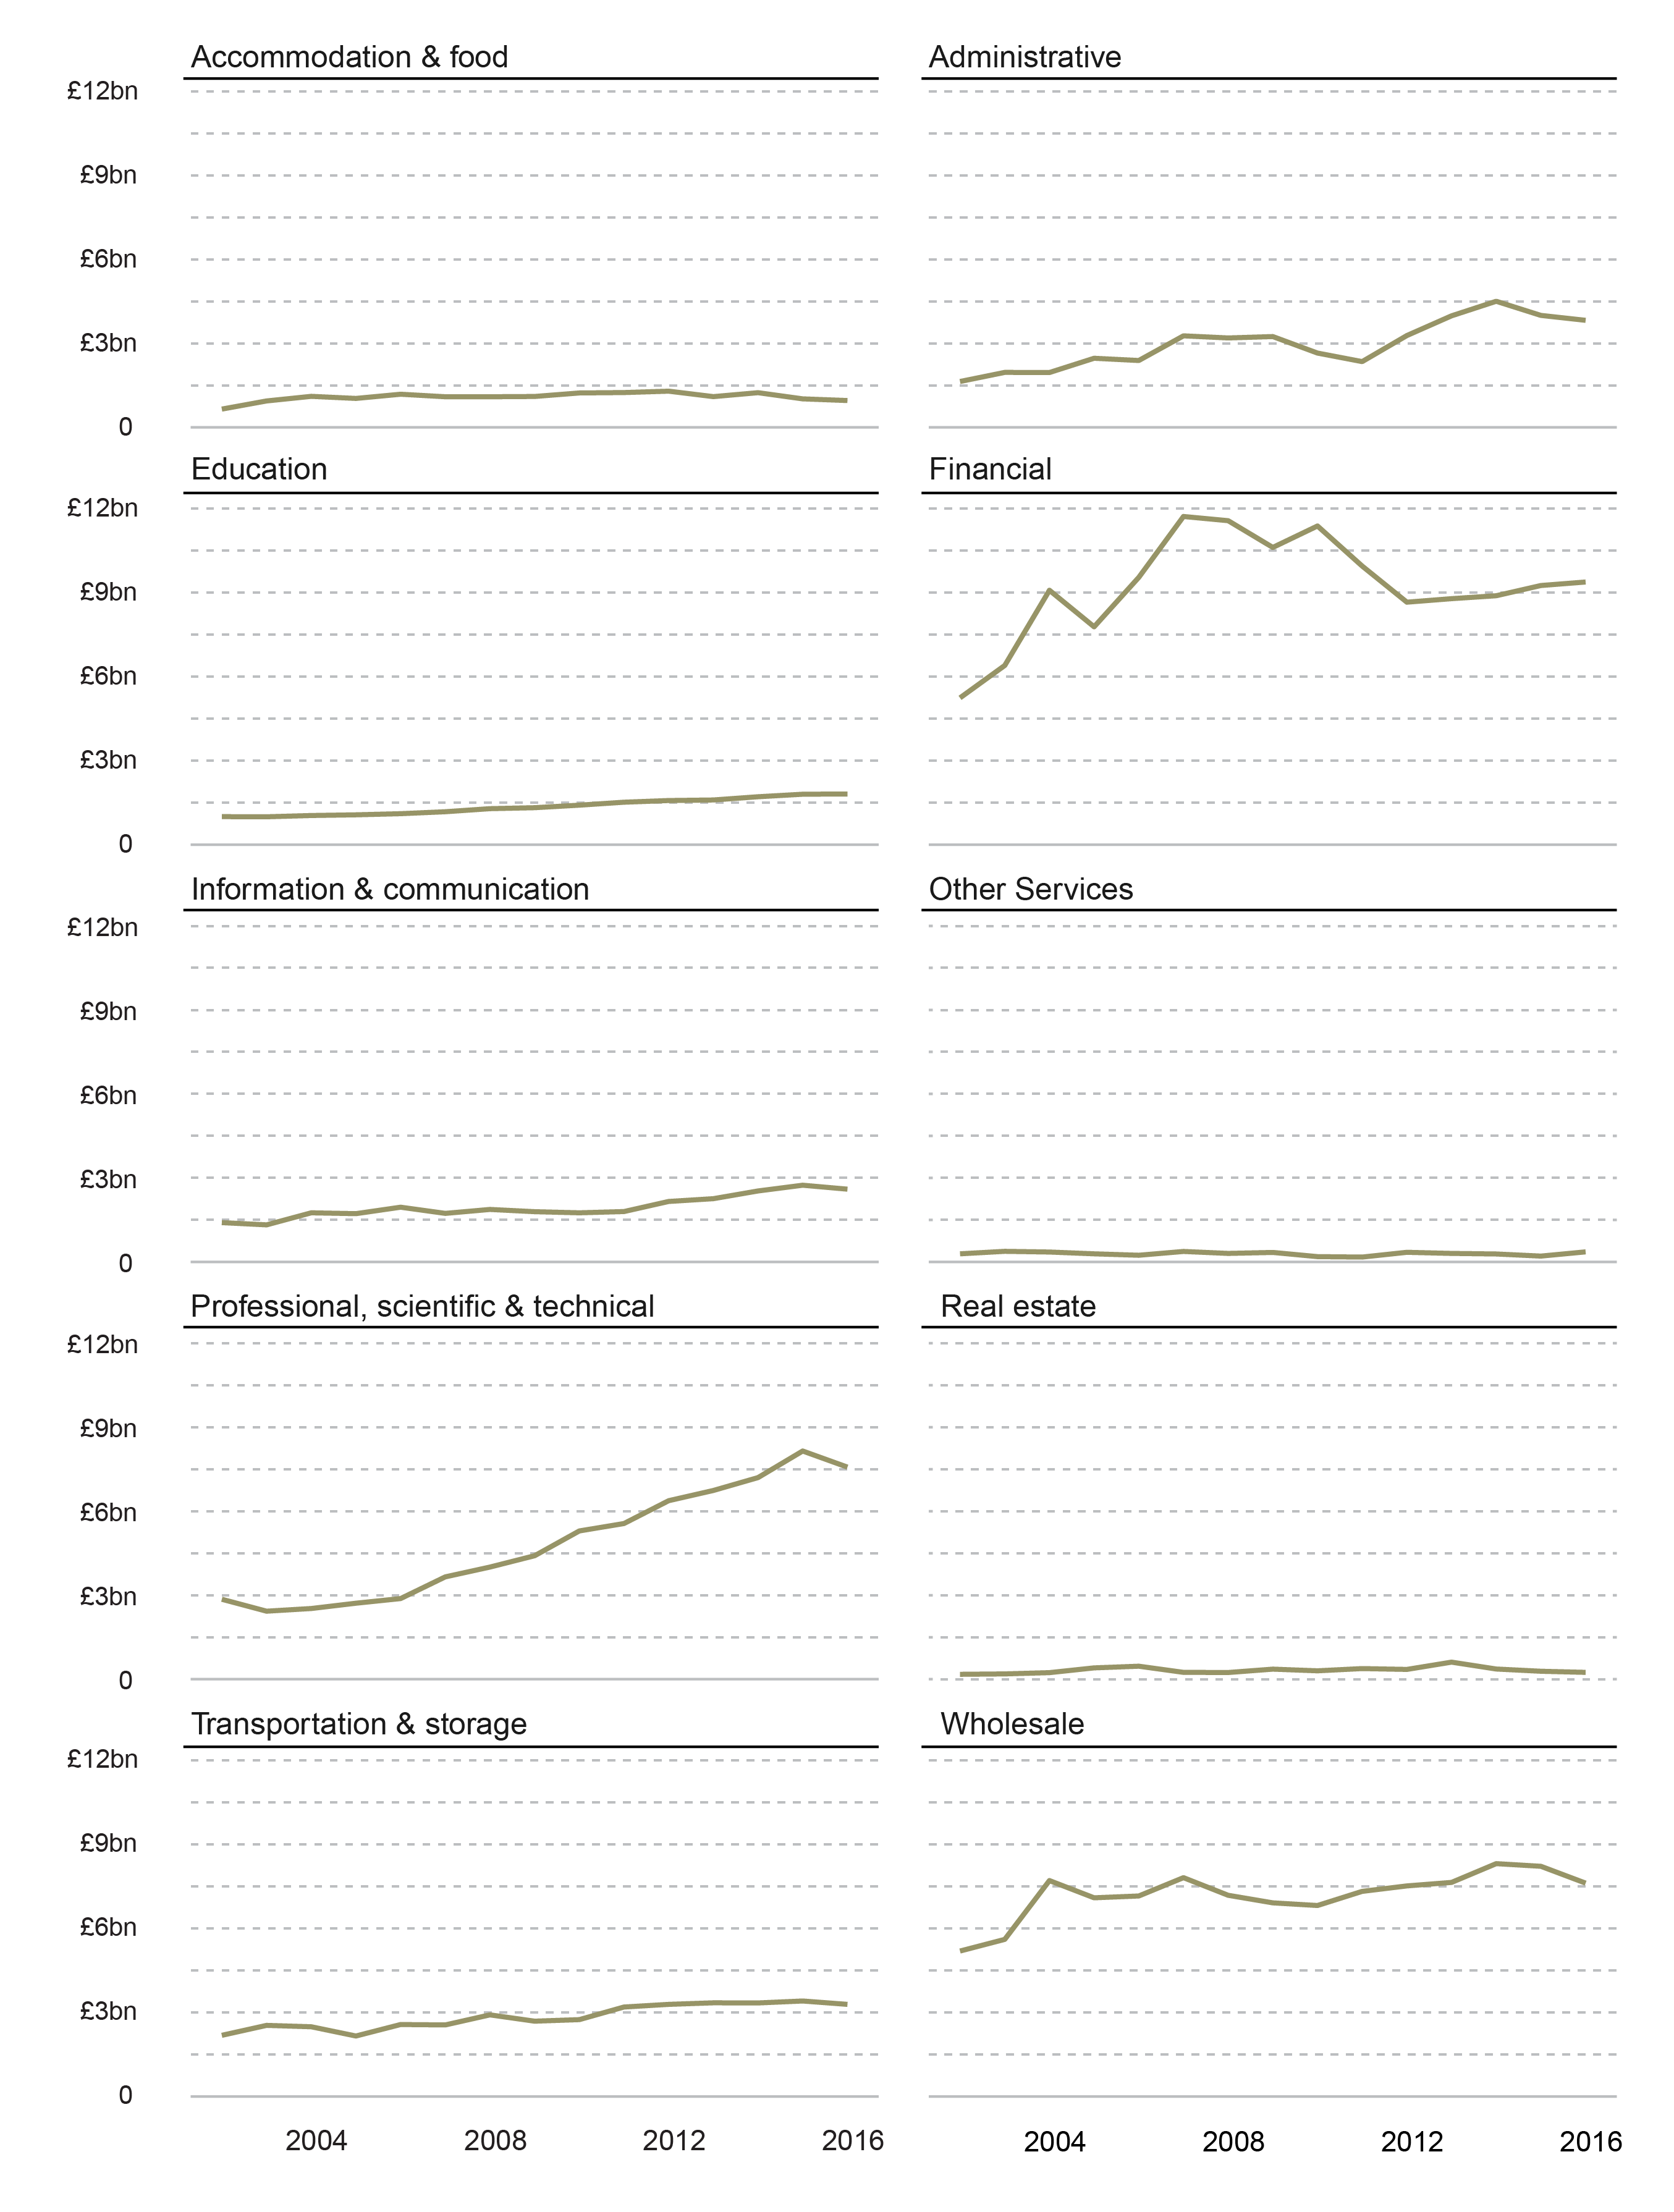
Figure 6 shows the value of service sector exports between 2002 and 2016. Exports from the “Professional, scientific and technical” service sector has seen the largest increase in the value of exports at £4.7bn. Exports from the "Education" sector has seen the highest proportional increase at 180% (£810m).
"Financial and insurance" exports are the highest of the services sectors at £9.4bn. Despite seeing an increase of 1.4% (£125m) between 2015 and 2016 they were below their 2006 peak of £11.7bn.
What manufacturing does Scotland export?
Manufacturing exports are the exports of goods produced, for example, whisky, clothes or petroleum products. In 2016 manufacturing exports were worth £26.0bn and accounted for 34% of all exports.
Figure 7: Value of manufacturing sector total exports from Scotland - 2016
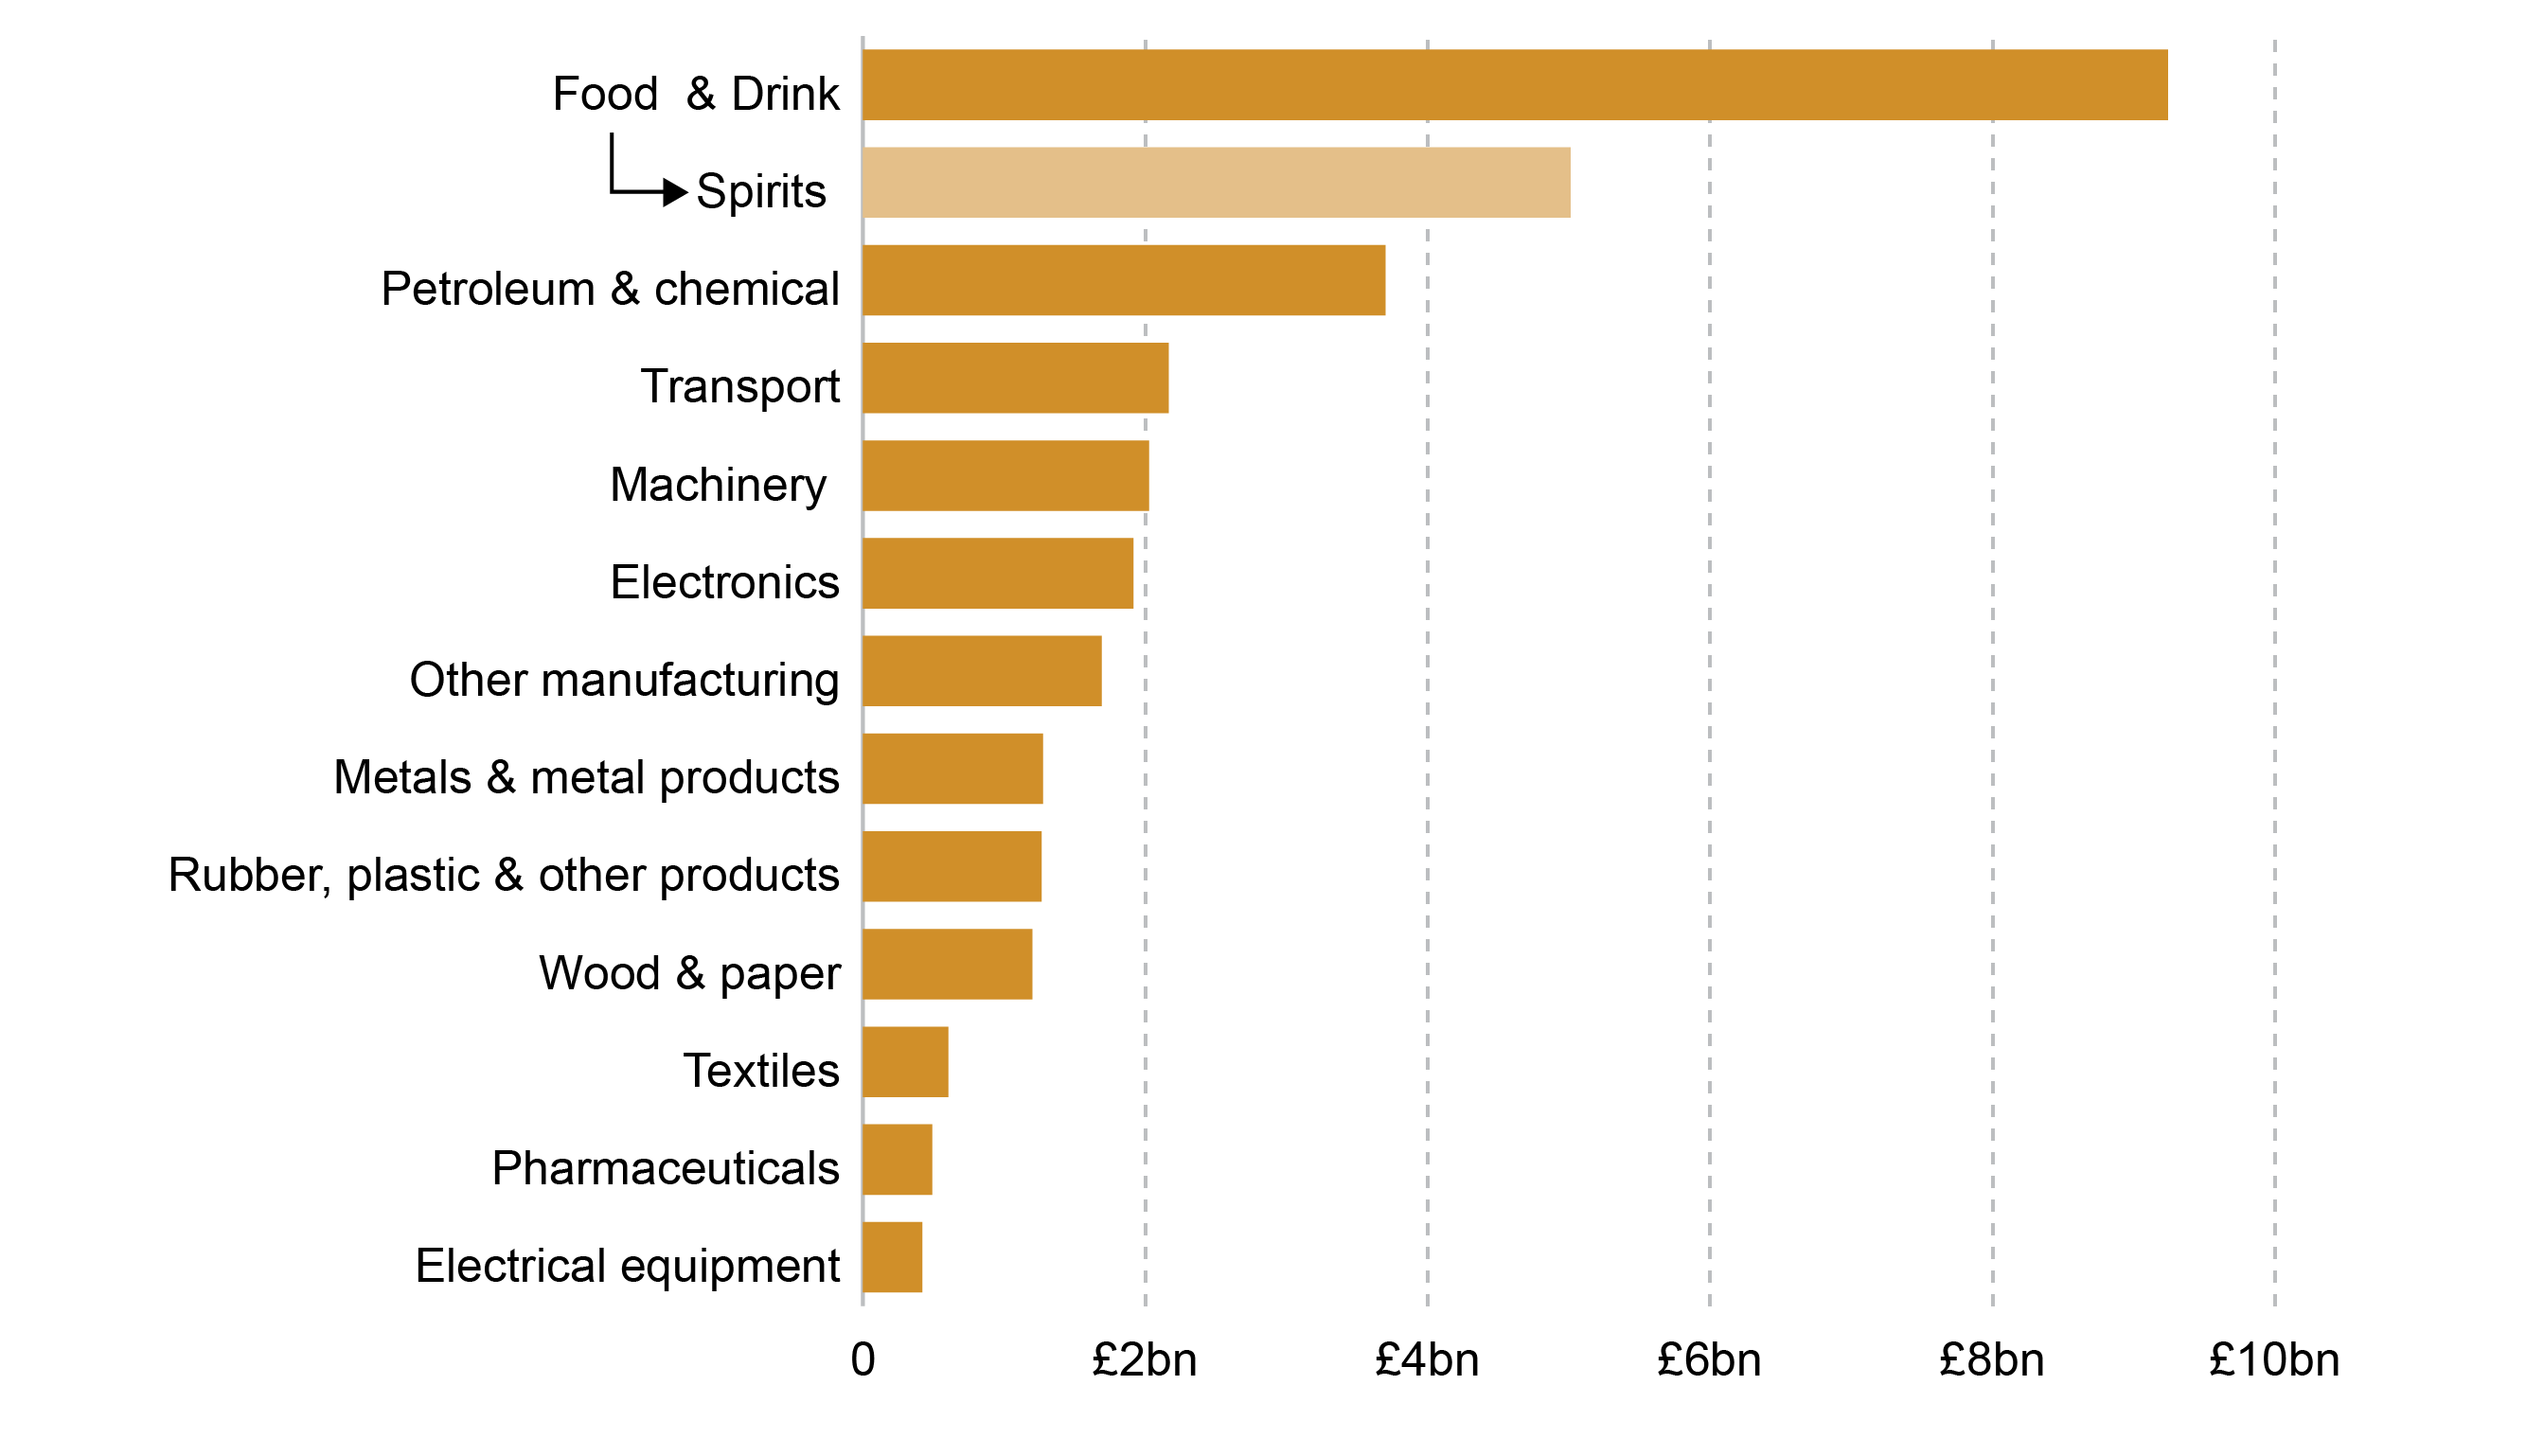
Figure 7 shows the value of manufacturing sector exports in 2016."Food and Drink" exports were the most valuable manufacturing export from Scotland in 2016 at £9.2bn. Within this, Spirits (Distilling, rectifying and blending of spirits), mainly whisky exports, was worth £5bn.
Figure 8: Value of manufacturing sector total exports from Scotland - 2002 to 2016
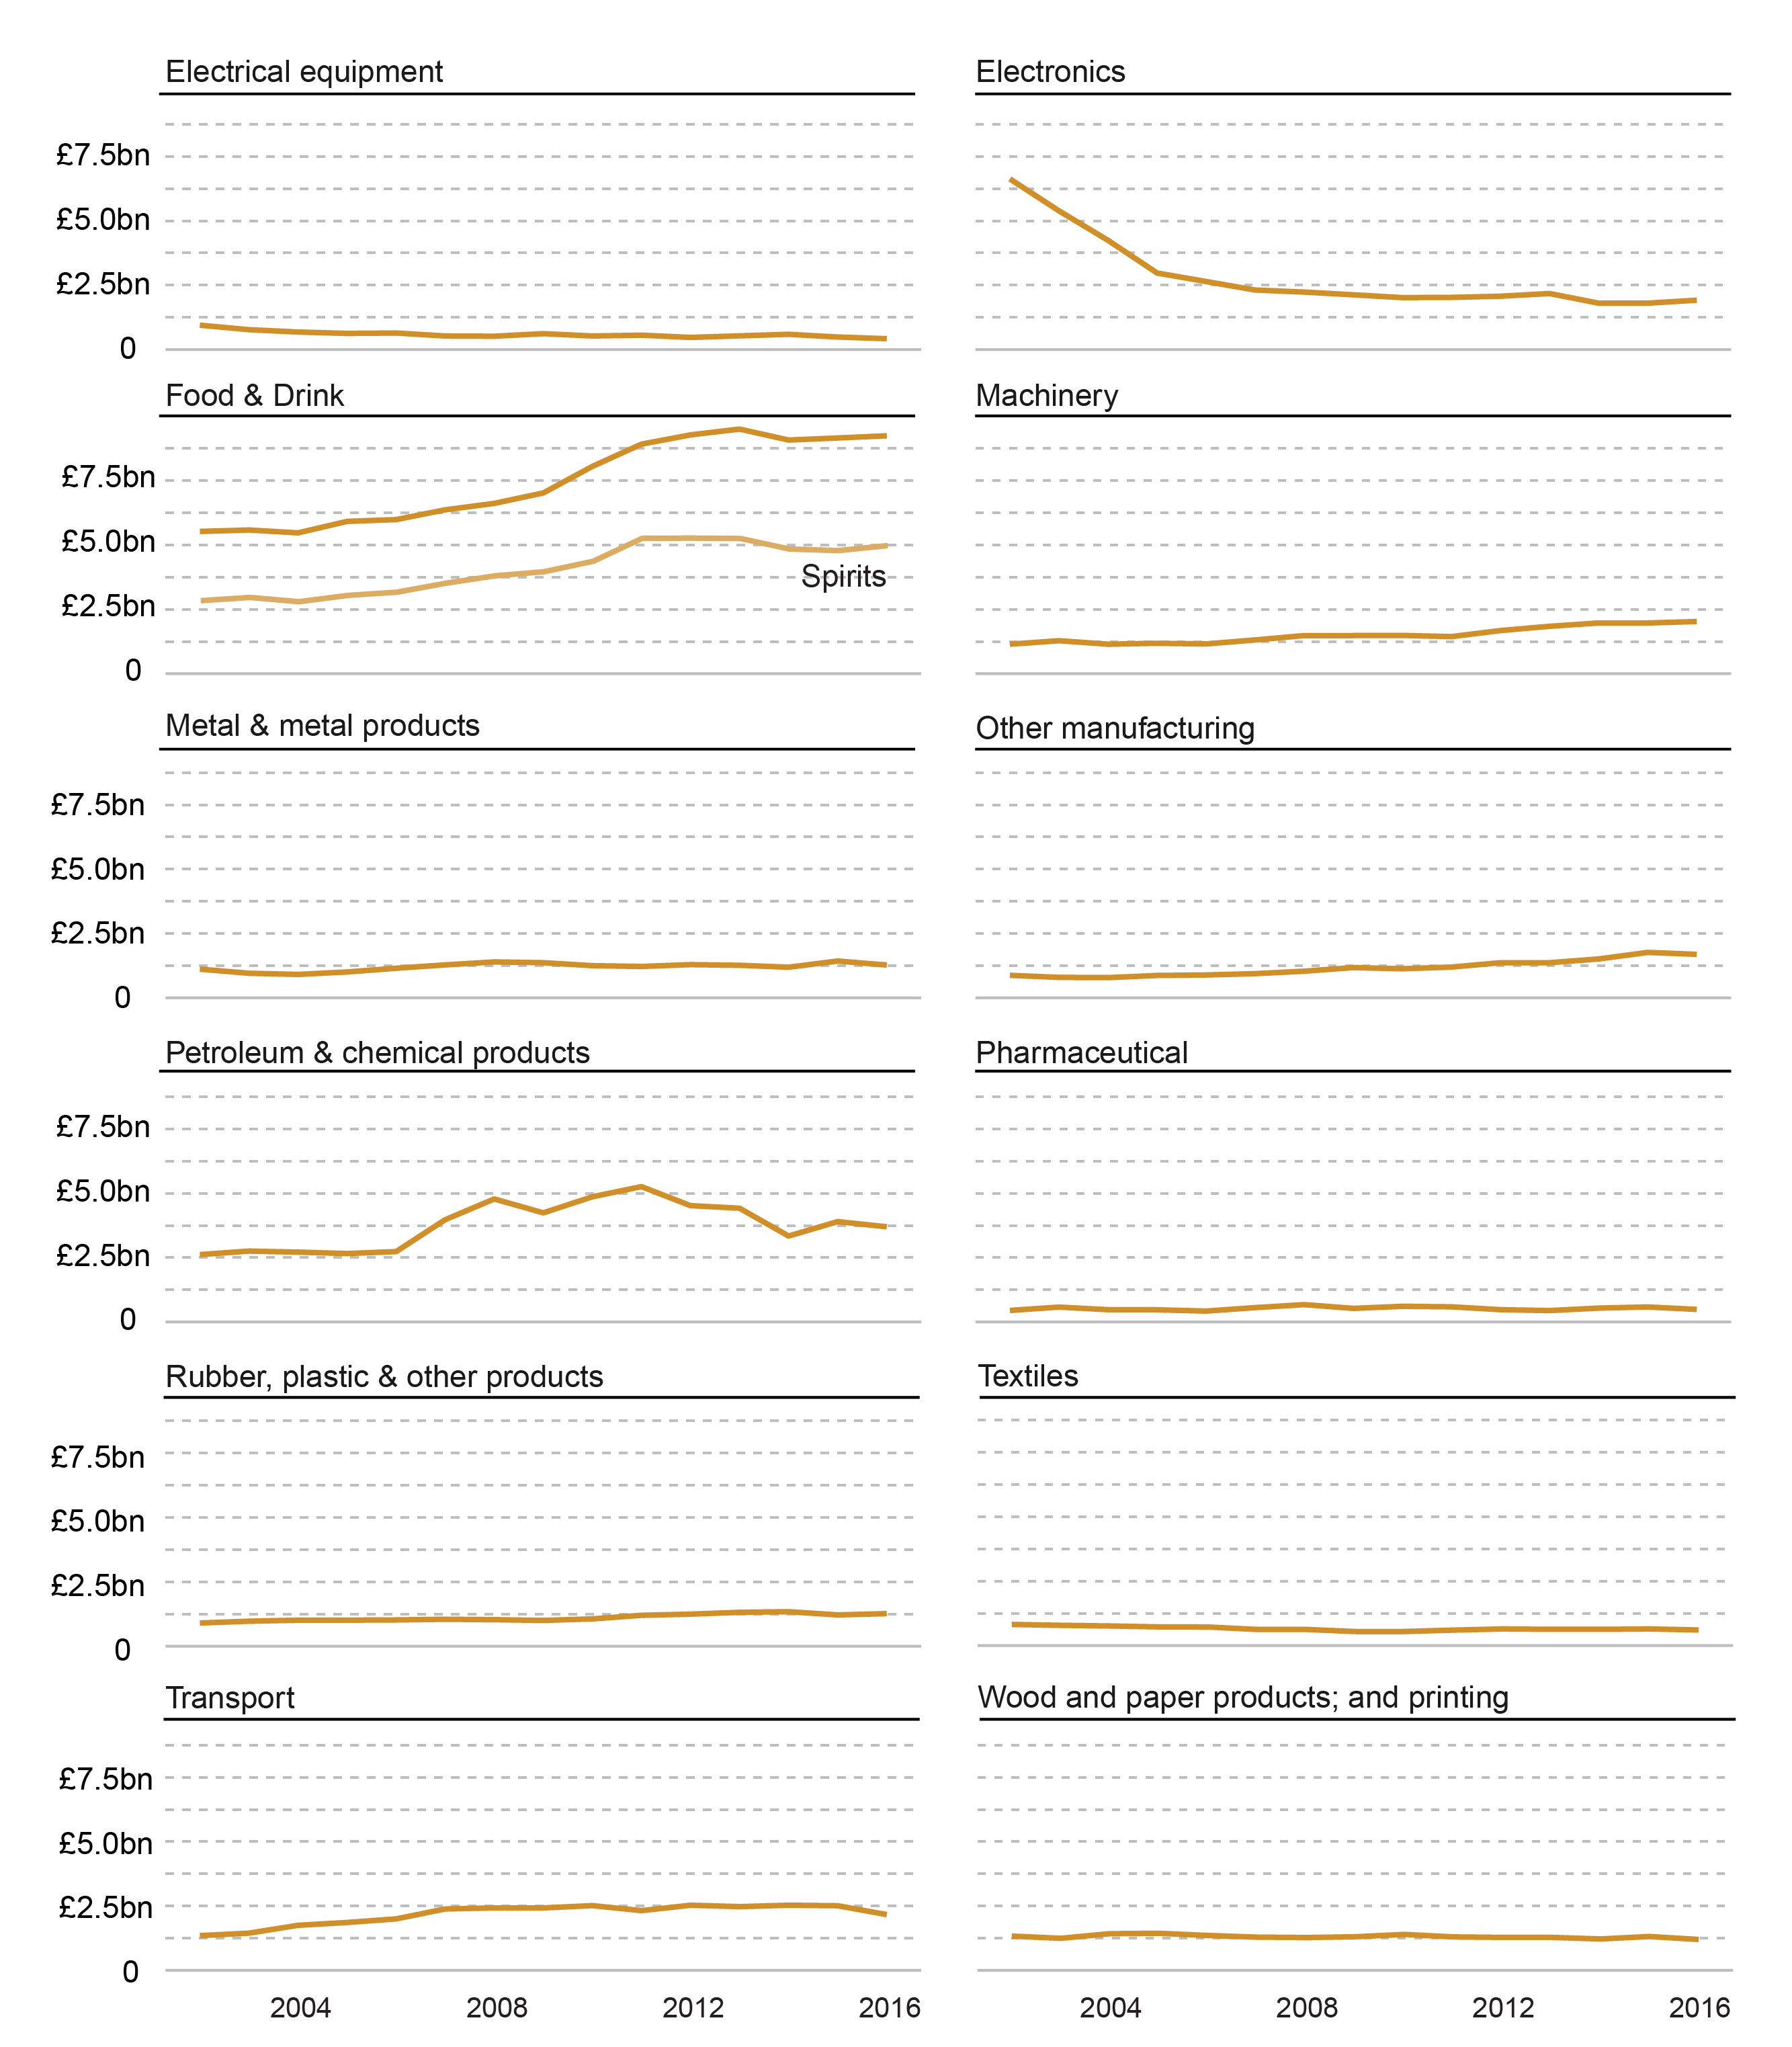
"Computer, electronic and optical products" exports have fallen by £4.7bn,or 71%, between 2002 and 2016. "Food and drink" has seen the largest increase in total exports between 2002 and 2016 at £3.7bn, or 67%. Within this "Spirits" has seen an increase of £2.1bn, or 75%, over this period
"Food and Drink" was one of only four manufacturing sectors to see growth between 2015 and 2016 (+0.9%) with "Electronic," (+6.3%), "Rubber, plastic and other non-metallic mineral products" (+4.1%) and"Machinery" (+2.8%) the only others.
Where does Scotland Export to?
Overall where does Scotland Export to?
Exports Statistics Scotland provides data on exports to the rest of the UK as well as international destinations.This section looks at where Scotland exports to. Looking at the broad exports destinations it also looks at international exports and exports to the EU.
Figure 9: Value of exports by broad geographic area - 2002 to 2016
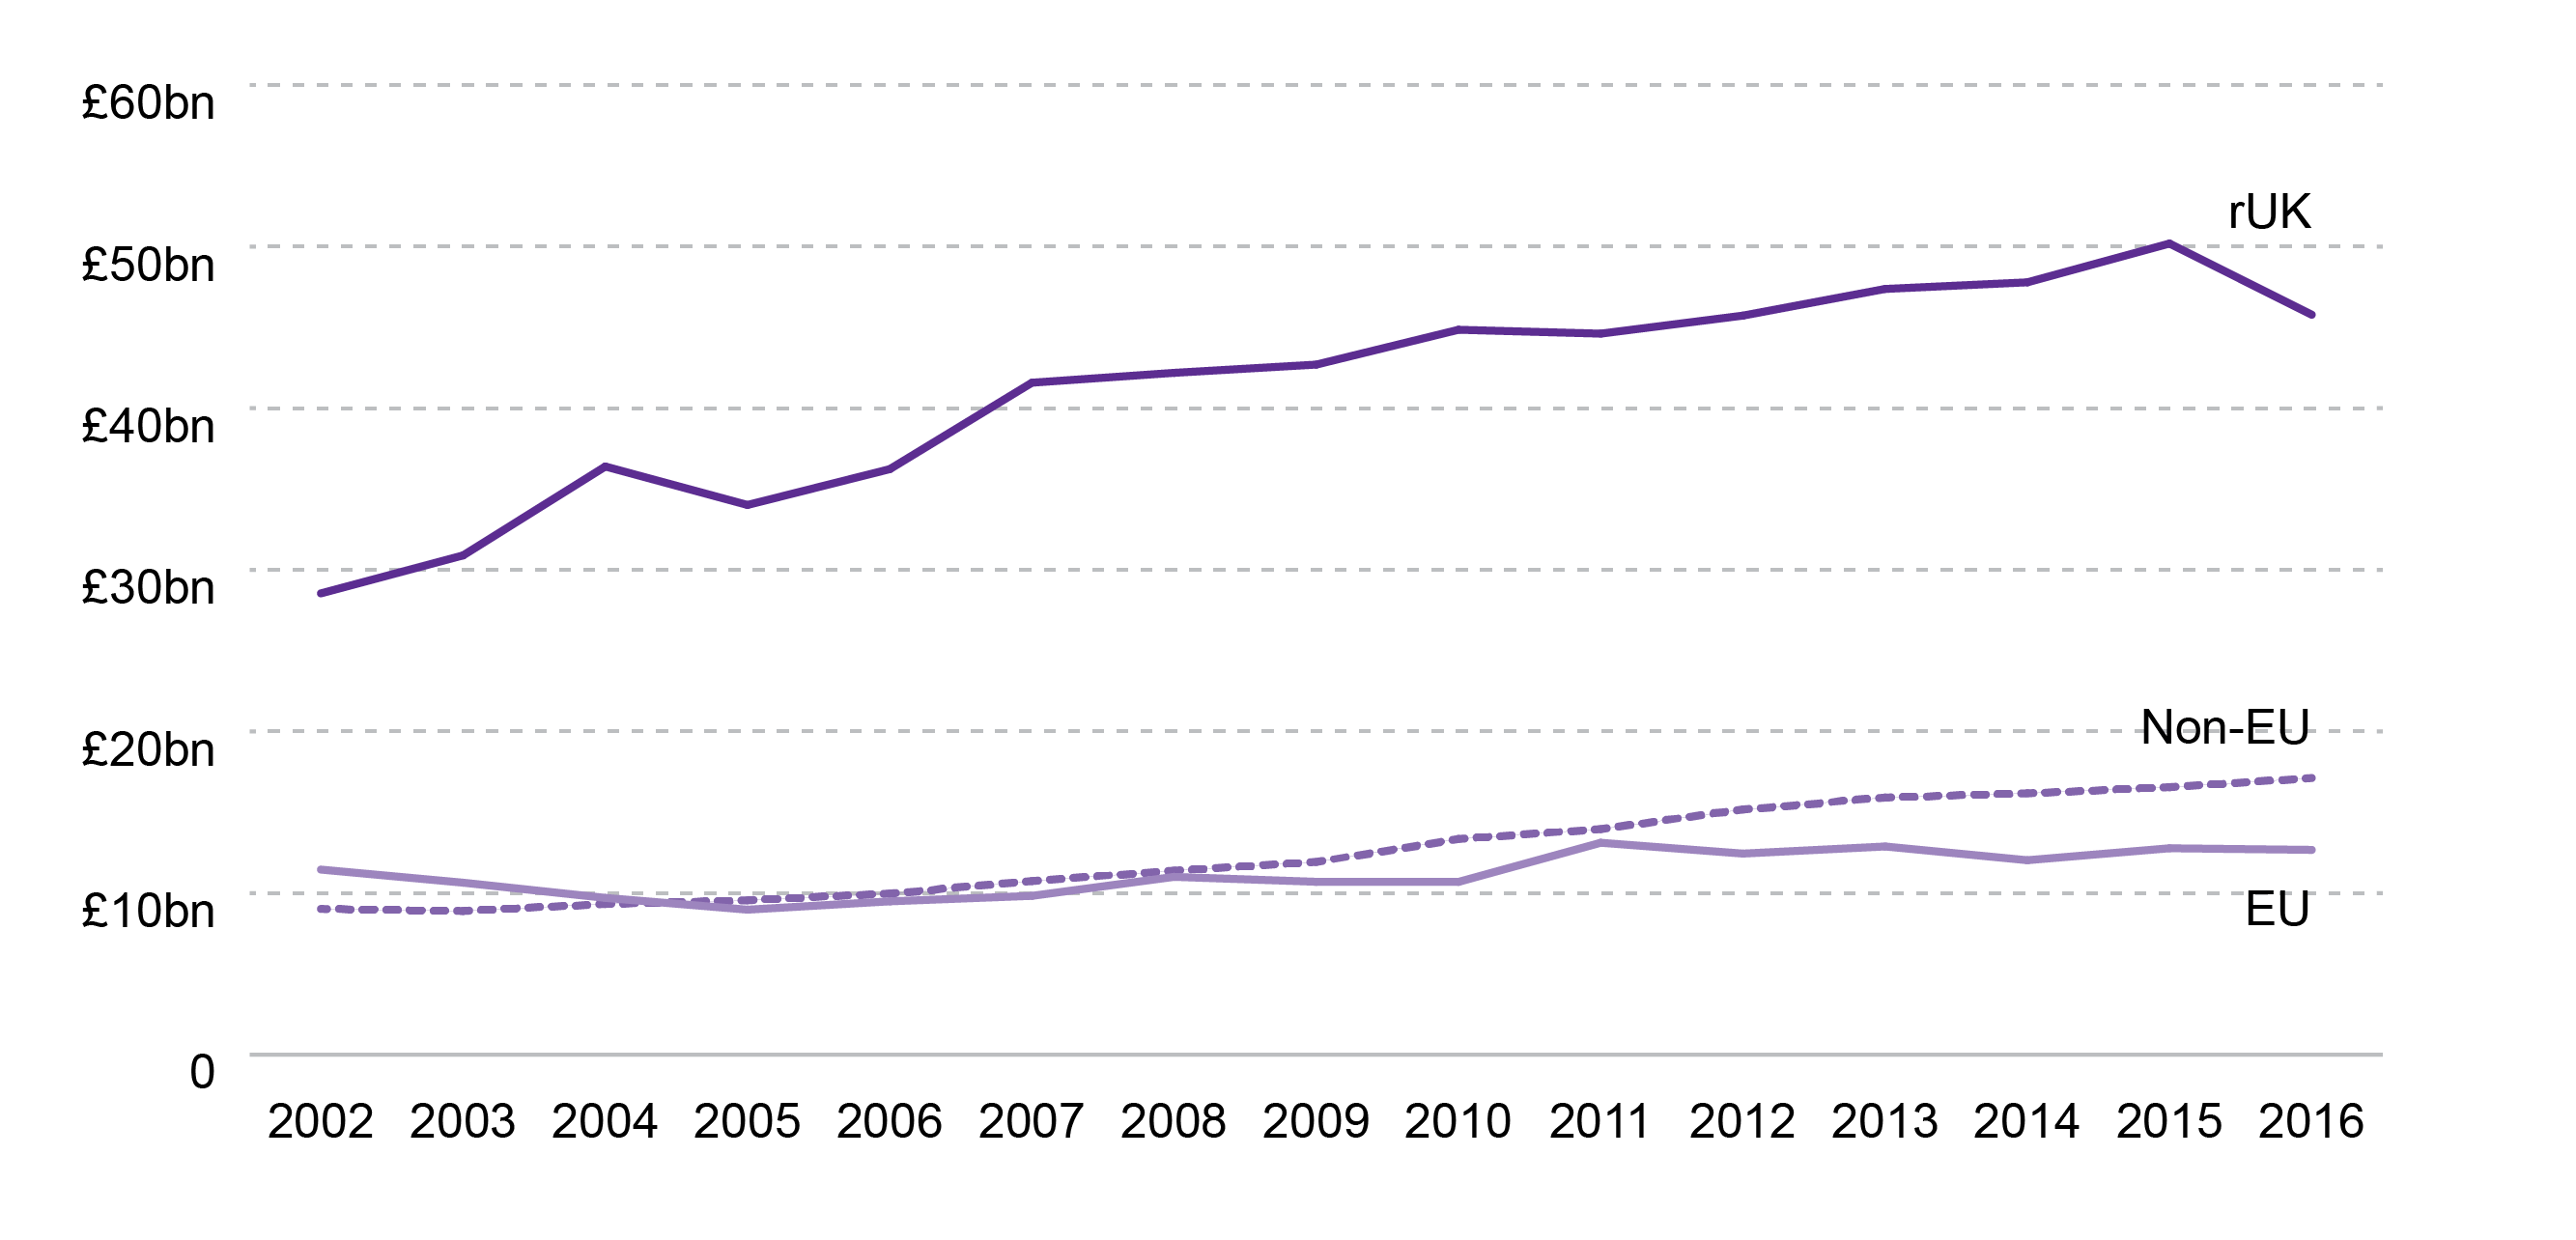
Figure 9 shows the change in exports by broad destination between 2002 and 2016.
In 2016, exports to the rest of the UK were worth £45.8bn, despite a decrease of £4.4bn (8.8%) between 2015 and 2016.
Between 2002 and 2016 exports to the rest of the UK have increased by £17.2bn, or 60%.
International exports were worth £29.8bn in 2016, an increase of £9.3bn, or 45%, from 2002.
Non-EU exports have increased by £8.1bn, or 90%, between 2002 and 2016.
Exports to the EU have increased by £2.1bn, or 11%, between 2002 and 2016.
In terms of exports to the rest of the UK, a proportion may be re-exported internationally. While it is not possible to quantify this exactly, it is likely to be a small proportion of the total. This is because exports from services, utilities and construction, which make up 70% of exports to the rest of the UK, are highly unlikely to be re-exported. The Scottish Government has also suggested that many of the manufactured goods exported to the rest of the UK are in sectors where re-exporting is unlikely1.
On the other hand, some products exported to the rest of the UK are incorporated into other products, and then re-exported. This will be counted as exports to the rest of the UK as only the original product comes from Scotland.
Scotland's international exports
Figure 10: Proportion of total international export to the EU and non-EU destination - 2002 to 2016
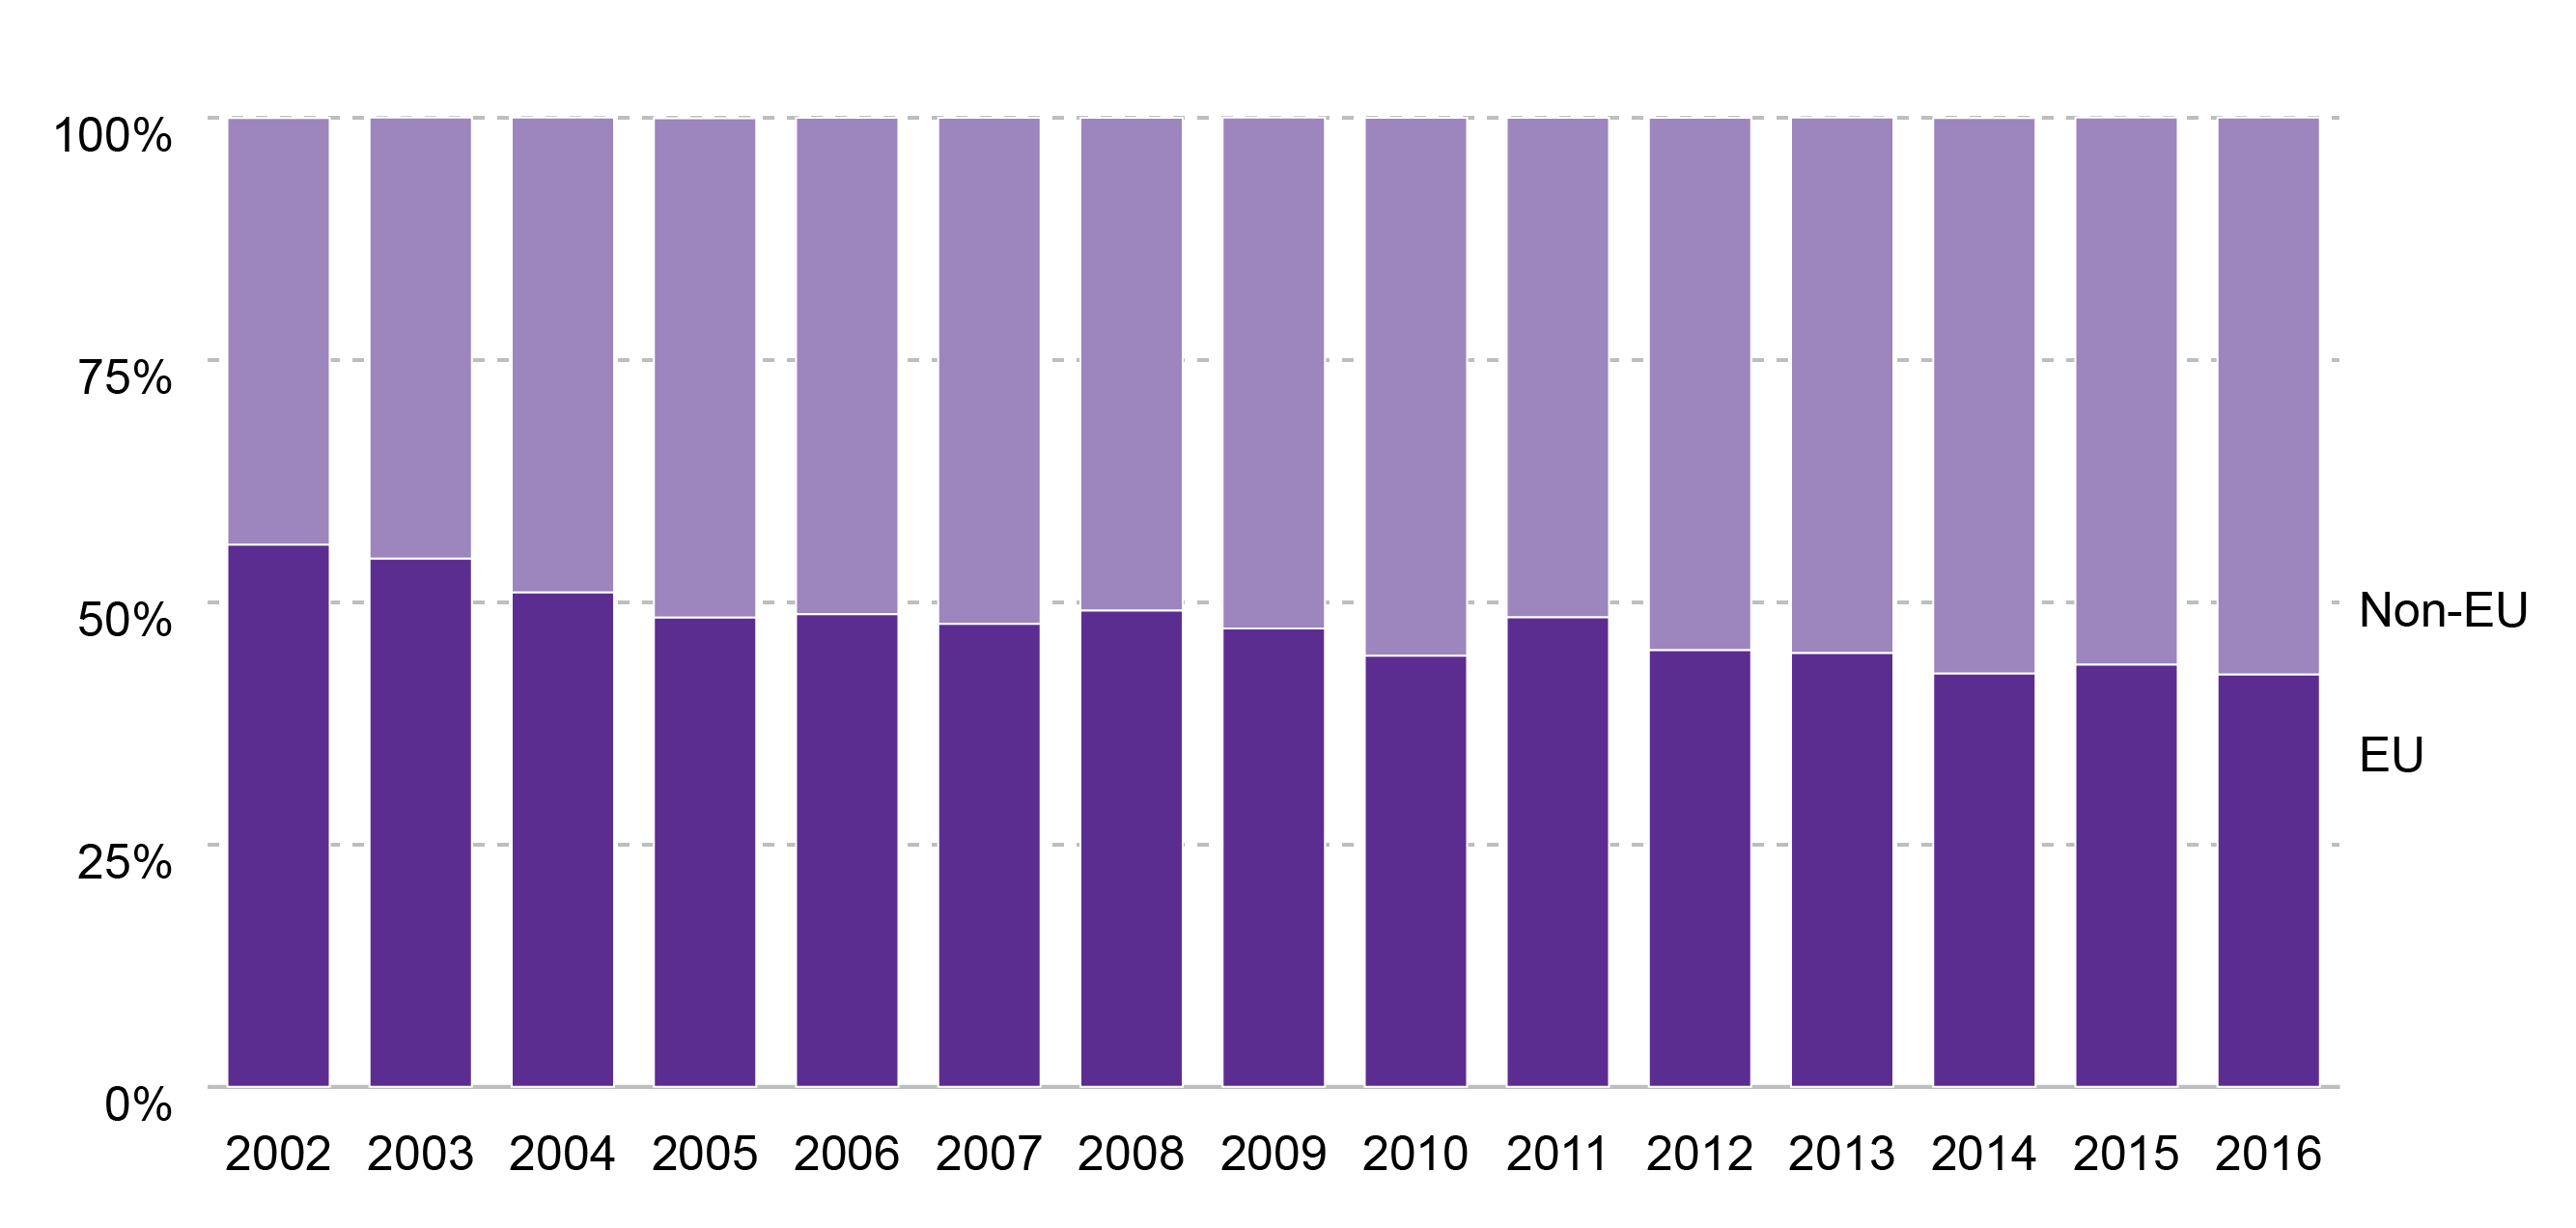
Figure 10 shows the proportion of international Scottish exports which go to EU and non-EU countries. Since 2005 the majority of international exports has gone to non-EU countries. In 2016, 57% of international exports went to non-EU countries. Since 2002, the value of exports to the EU has increased by £1.2bn (+11%), while exports to the rest of the world have increased by £8.1bn (+90%).
Figure 11: Value of international exports by region - 2016
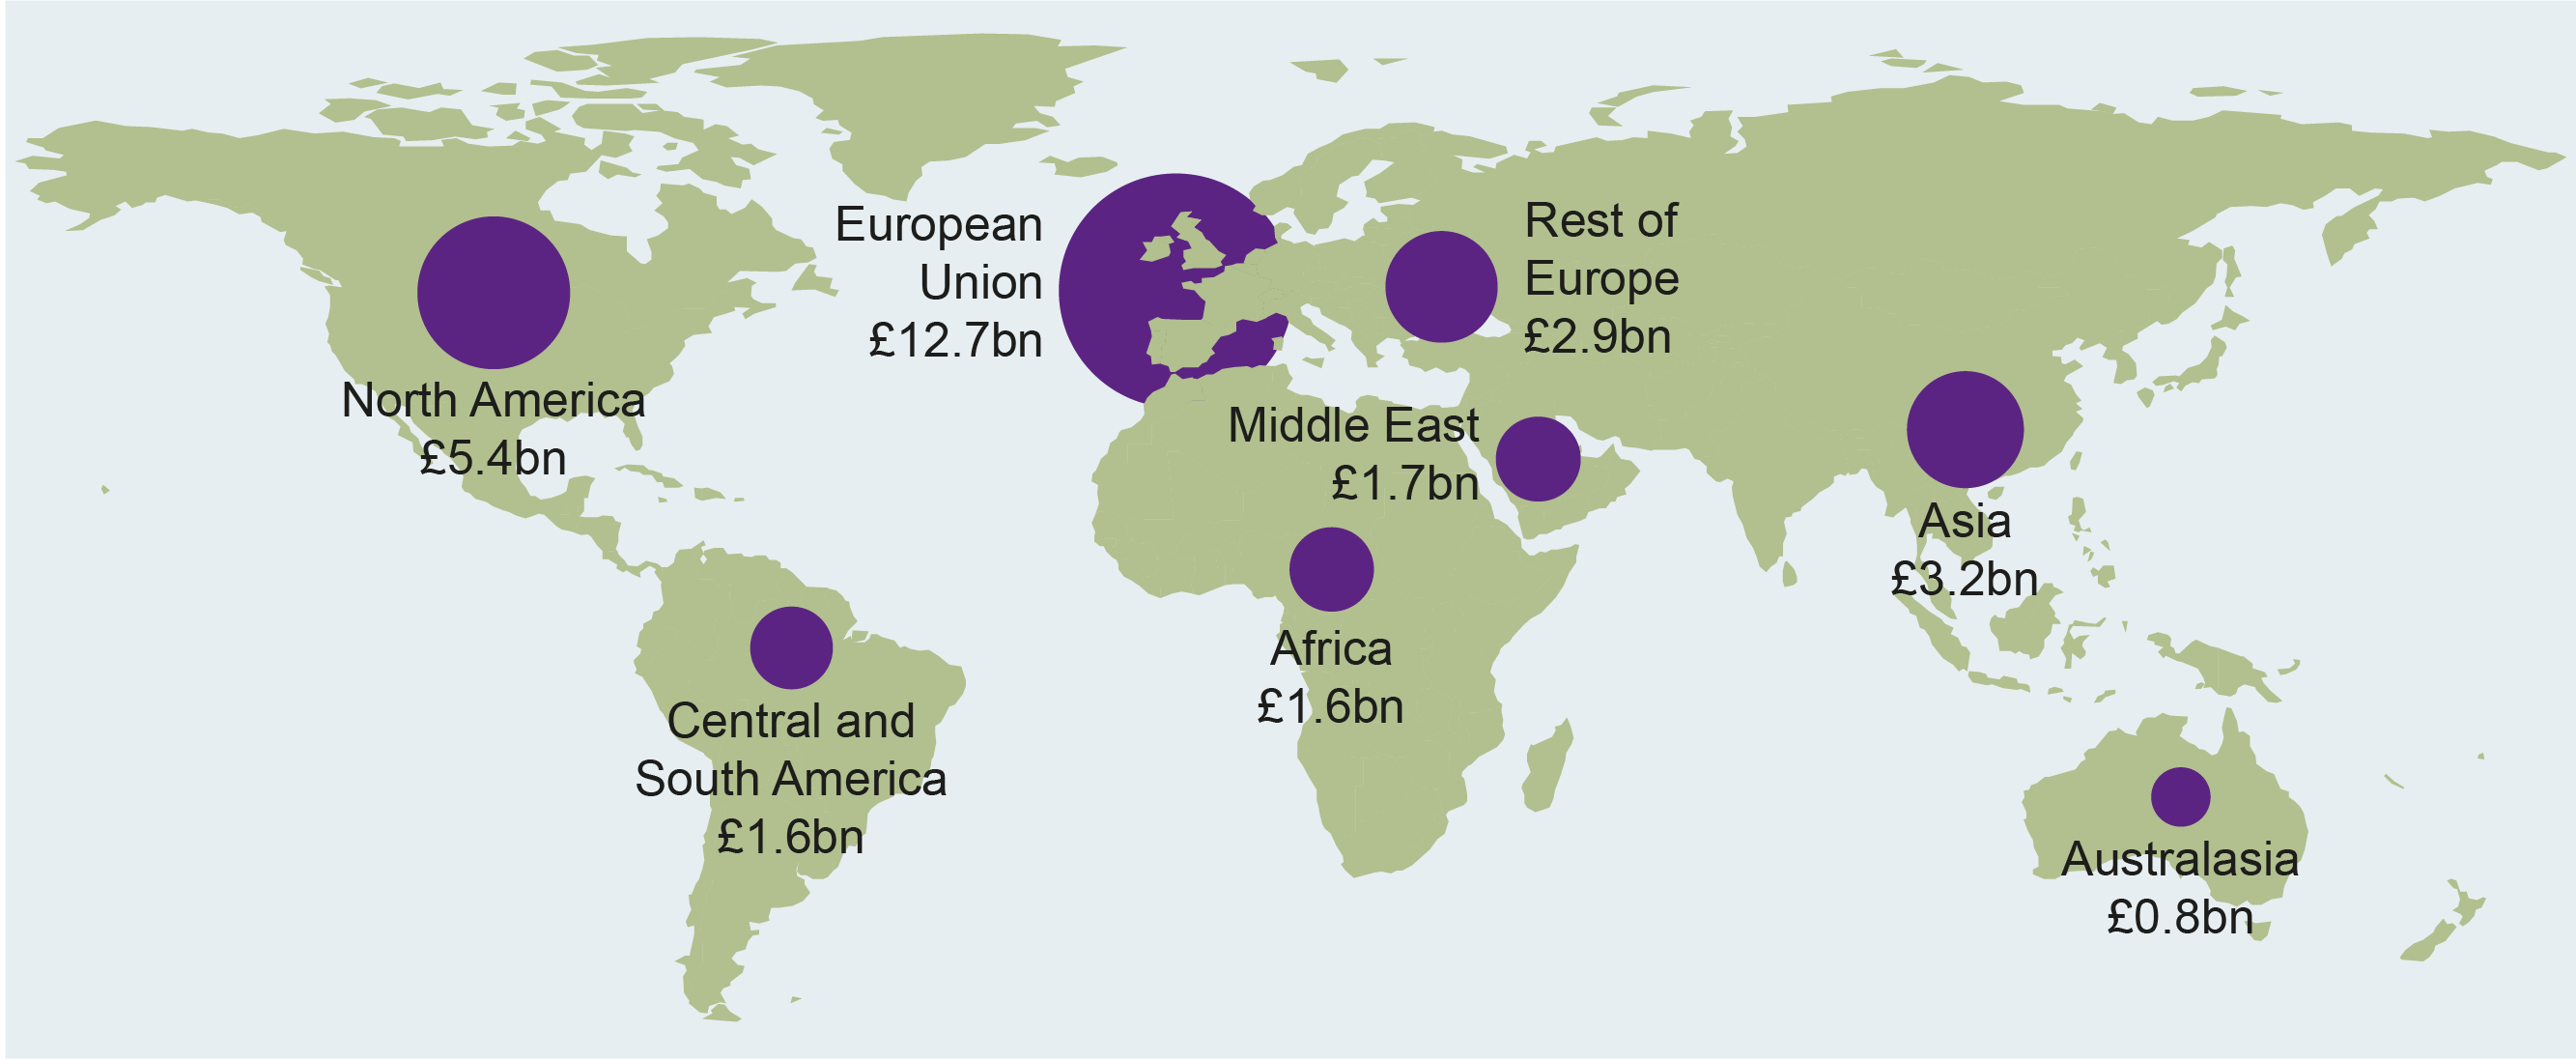
In 2016 the EU was Scotland's largest international export region, worth £12.7bn, accounting for 43% of all international exports. North America was the region with the second highest value of exports at £5.0bn, accounting for 18% of all International exports. The majority of these exports go to the US, which is the single largest country destination for Scotland's international exports (at £4.8bn in 2016).
Scotland's exports to the EU
Figure 12: Value of international exports by EU country - 2016
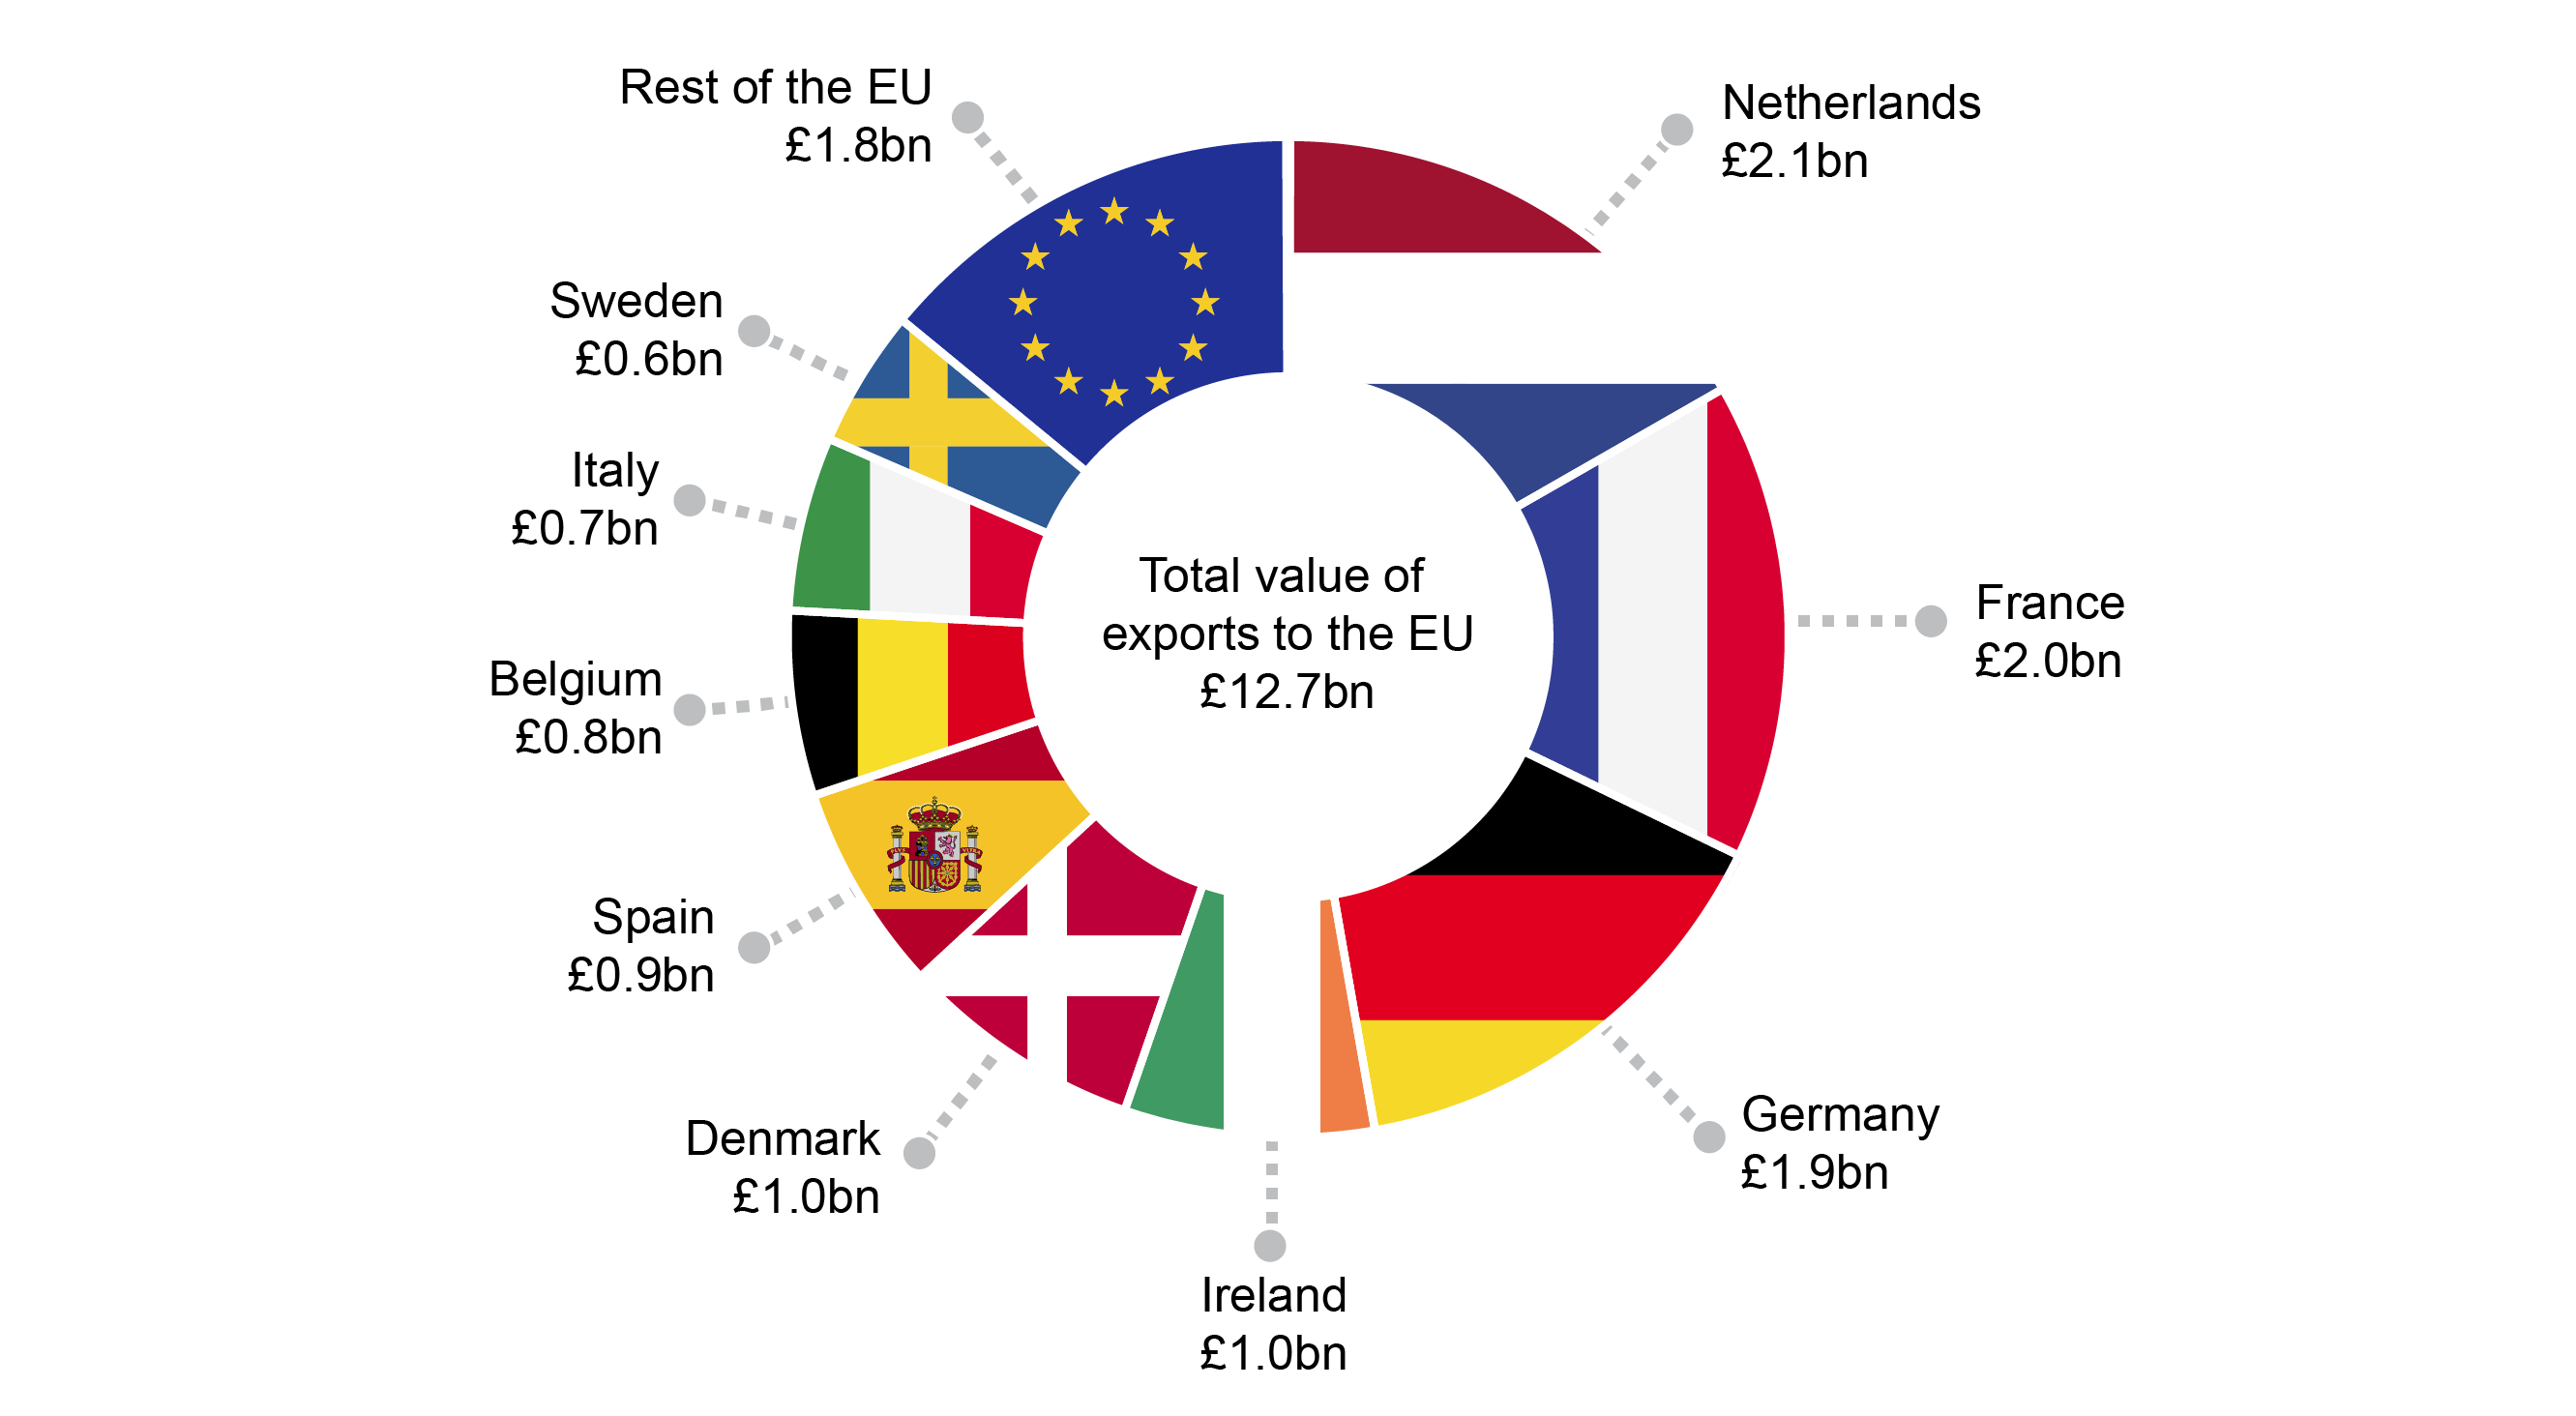
Figure 12 shows the value of exports to countries in the EU with a value over £500m in 2016. Within the EU the Netherlands is Scotland's largest export destination. This is because Rotterdam is one of the largest ports in the world and while goods arrive there, the Netherlands may not be the final destination. Over the year exports to the Netherlands have decreased by £205m or 9%.
In 2016 France received the second highest value of Scottish exports to any EU nation. This is partly explained by France being the second largest international market for Scotch whisky behind the USA1.
Figure 13: Value of exports to the EU - 2002 to 2016 (not adjusted for inflation)
Since 2002 exports to the EU have increased by £1.2bn, or 11%. However between 2002 and 2005 exports fell, by £2.5bn. From 2005 to 2011 they increased by £4.1bn or 46%. Since then exports have fallen by £0.4bn or 3%.
Which exports go where?
Overall which exports go where?
Figure 14 shows the proportion of exports for each sector that go to either the rest of the UK or to international markets. The sectors are ordered by the size of the value of the sector.
Figure 14: Proportion of the of value exports by broad sector and broad destination - 2016
Manufacturing is the only sector which has a higher proportion of exports which go to international destinations at 59%. “Utilities” has the highest proportion of exports to the rest of the UK at 94%. As “Utilities” exports consist of services such as transmission of electricity through the national grid, this is not surprising
Table 1 shows the top 5 exporting sectors to the three broad destination regions: Rest of the UK, EU and non-EU destination in 2016.
| rUK | EU | Non-EU | |||
|---|---|---|---|---|---|
| Sector | Value | Sector | Value | Sector | Value |
| Financial & insurance (Services) | £7,785m | Refined petroleum & chemical (Manufacturing) | £2,215m | Food & drink (Manufacturing) | £3,435m |
| Wholesale (Services) | £5,910m | Food & drink (Manufacturing) | £2,020m | Professional, scientific & technical (Services) | £2,715m |
| Utilities | £4,200m | Wholesale | £1,025m | Mining & Quarrying | £1,445m |
| Professional, scientific & technical (Services) | £3,860m | Professional, scientific & technical (Services) | £1,000m | Financial & insurance (Services) | £1,205m |
| Food and drink (Manufacturing) | £3,785m | Transportation & storage (Services) | £750m | Transport (Manufacturing) | £880m |
Where do Scotland's services exports go?
Services exports, worth £37bn, make up 49% of all exports from Scotland. £25bn, or 69%, of these are classed as exports to the rest of the UK. International services exports are worth £12bn, with the majority(£8bn) going to non-EU destinations.
Figure 15: Proportion of the value of services exports by broad sector and broad destination - 2016
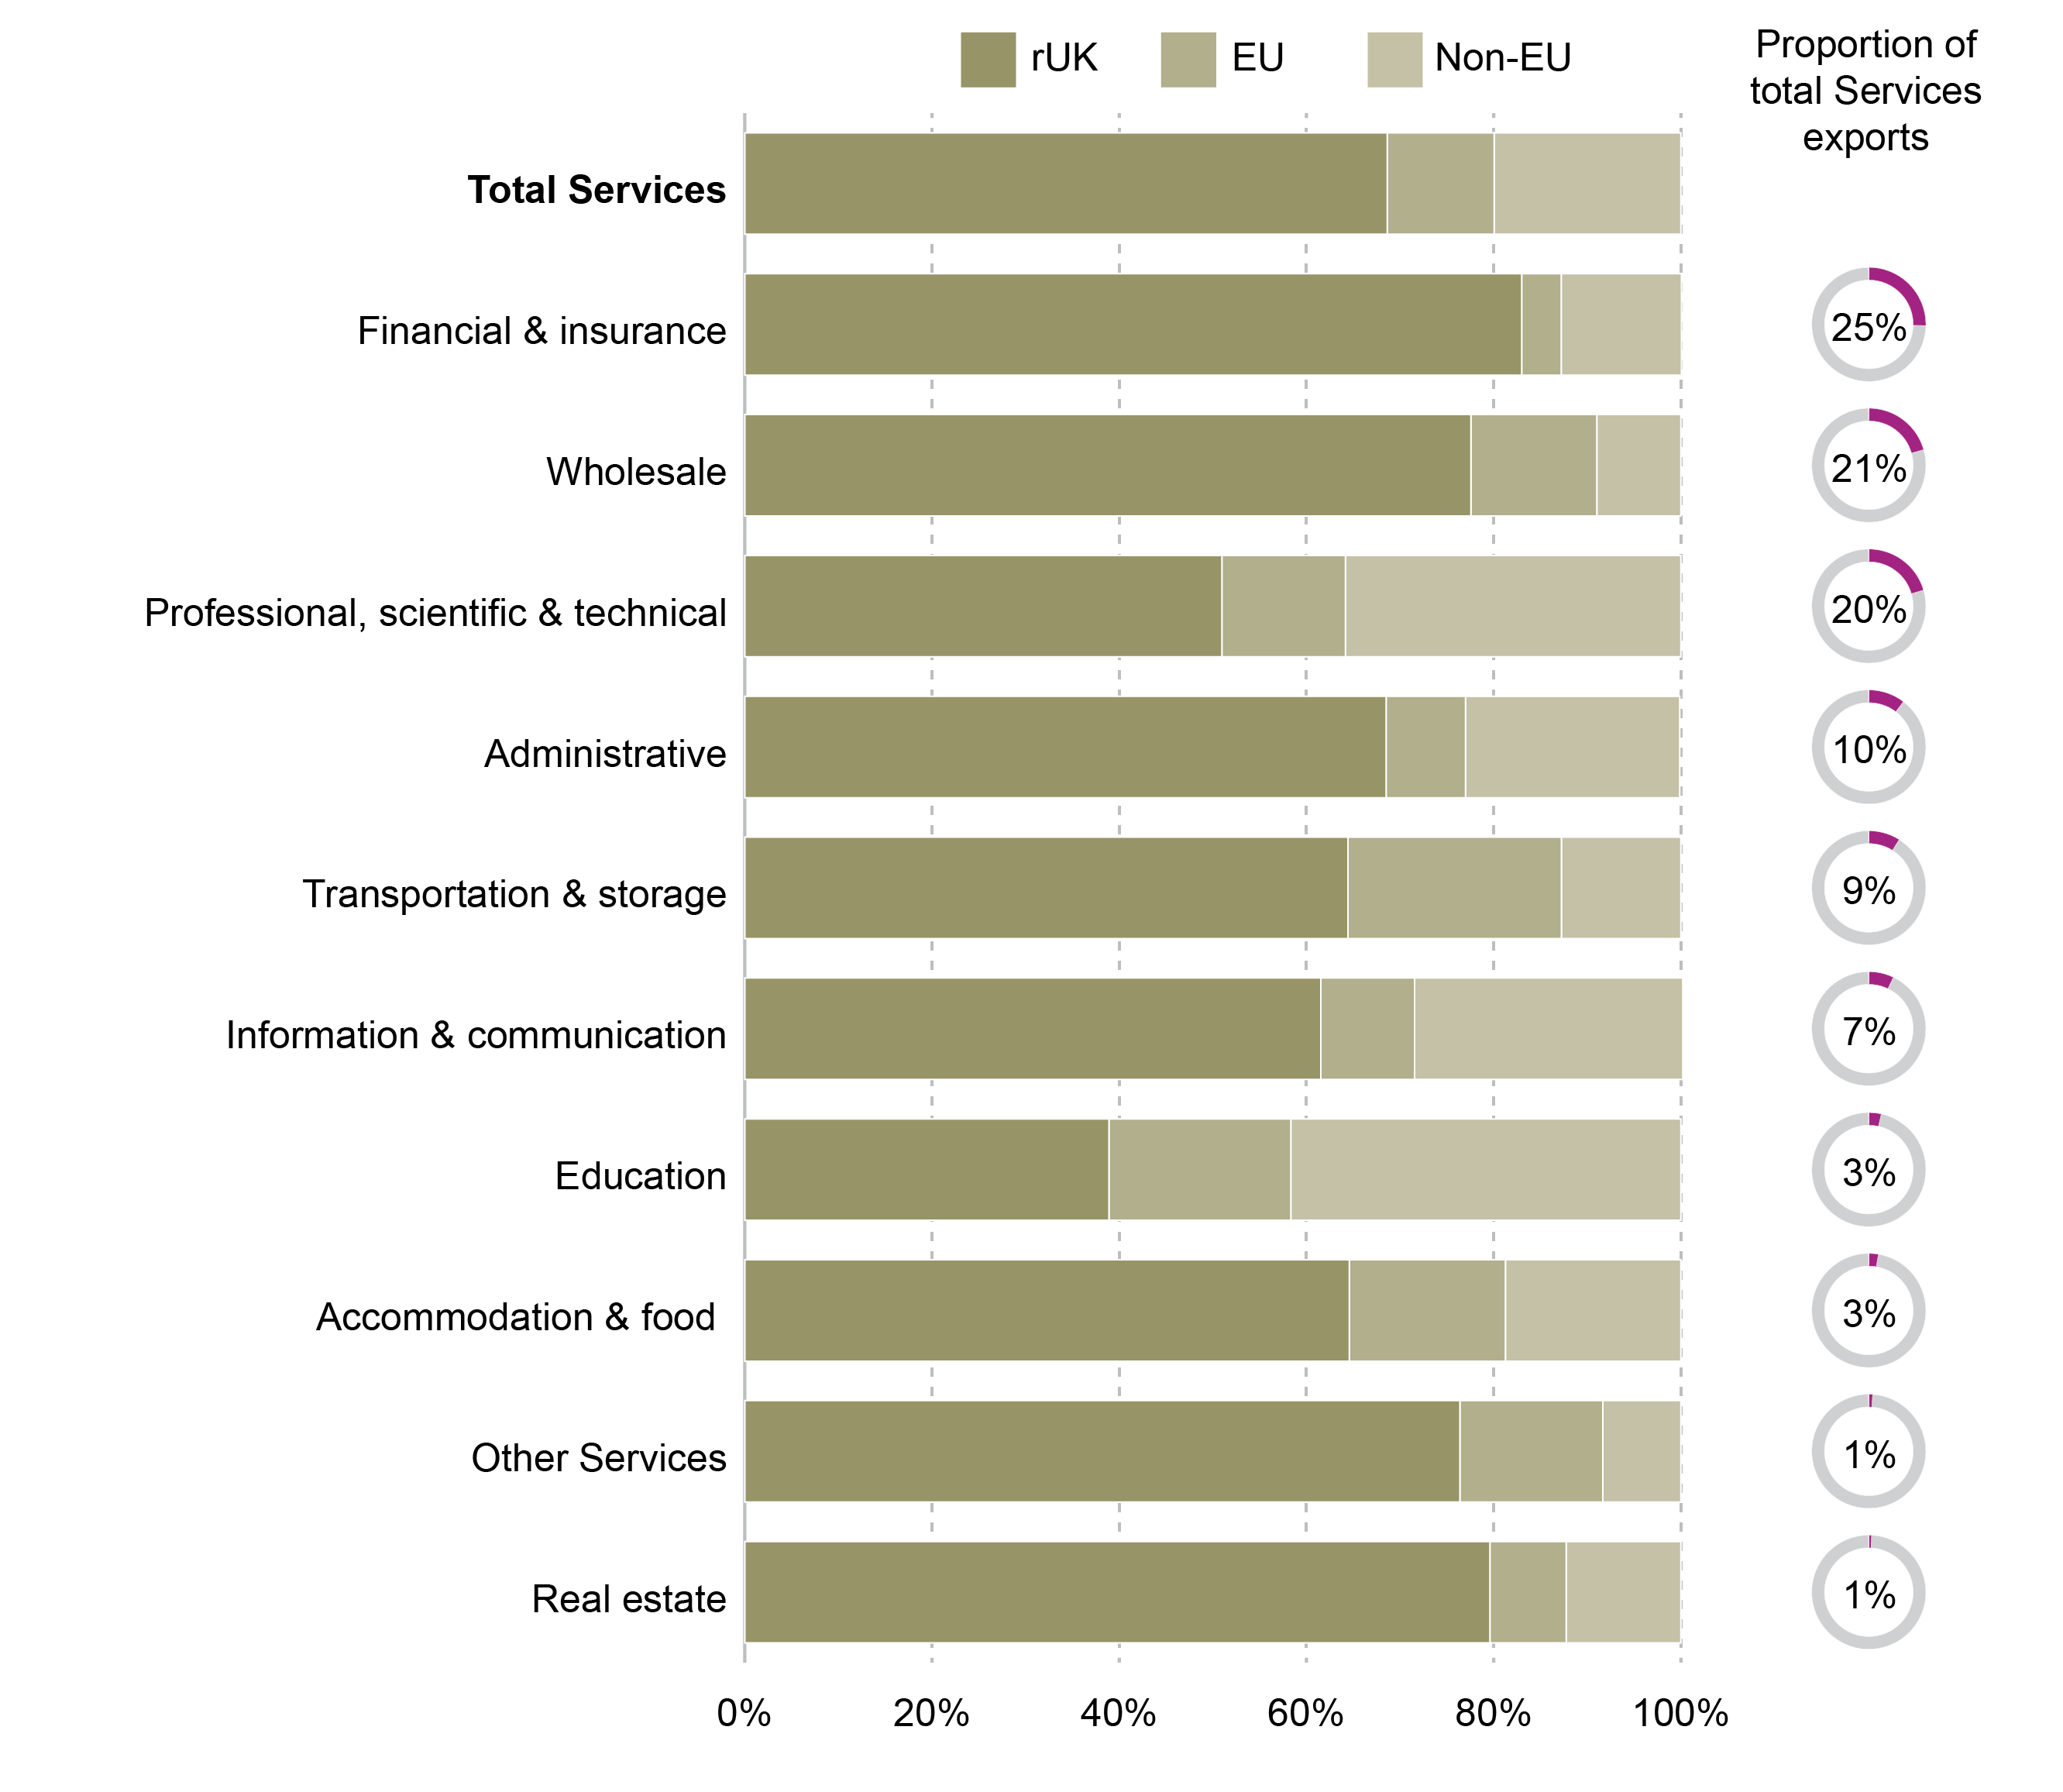
Looking at the services export sector breakdown in more detail, only “Education” has a higher proportion of exports going to international destinations, with the 42% going to Non-EU destinations.
“Financial and insurance” exports were worth £9.4bn in 2016, with 83%, or £7.8bn going to the rest of the UK. Of the £1.3bn international exports from the sector, only £0.4bn went to the EU.
Where do Scotland's manufacturing exports go?
Manufacturing makes up 34% of the value of exports from Scotland. Over half, approximately £15.4bn (59%), are classed as international exports. In 2016 manufacturing exports to non-EU destinations were 6% (£0.4bn) higher than to the EU.
Figure 16: Proportion of the value of manufacturing exports by broad sector and broad destination - 2016
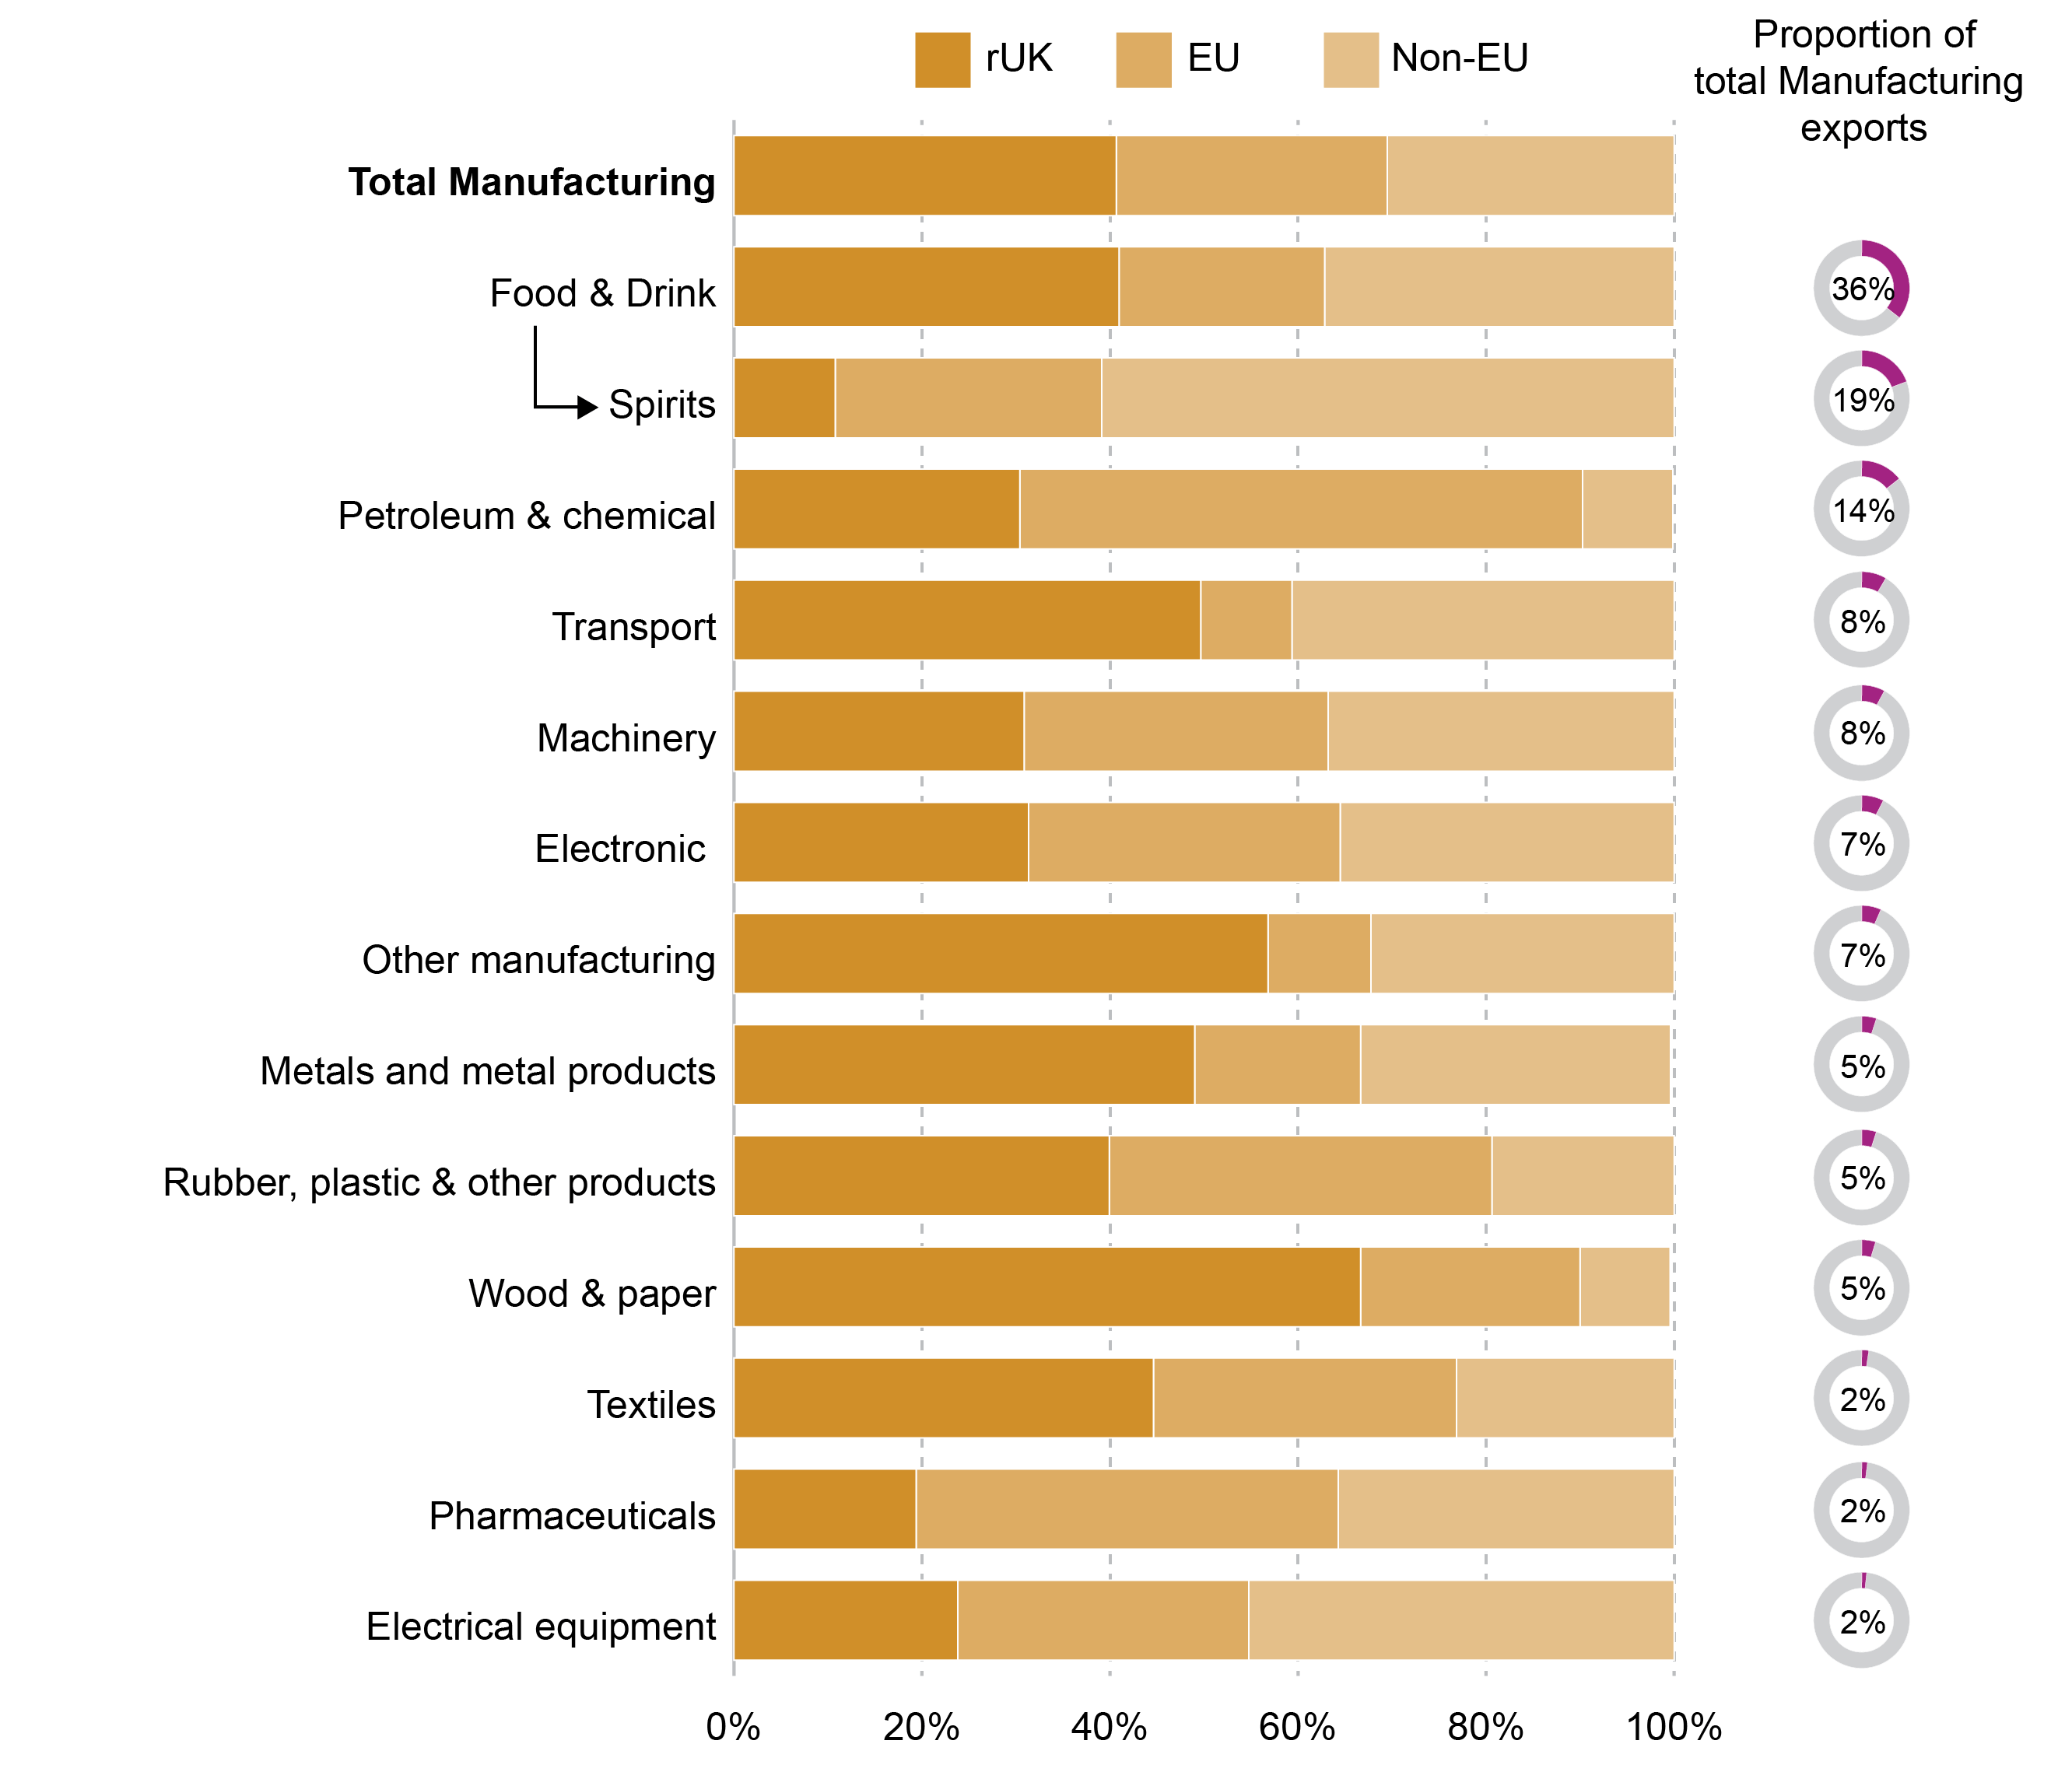
There are two manufacturing sectors which see higher proportions of exports going to the rest of the UK than international destinations. These are:
Wood & paper (wood and paper products; and printing) (67%).
Other manufacturing (furniture, other manufacturing; repair and installation of machinery and equipment) (57%).
Spirits exports ("Distilling, rectifying and blending of spirits" ) has the highest proportion of exports leaving the UK at 89%. The majority (61%) of exports from this sub-sector go to non-EU destinations. The majority of exports within this sector come from the Scotch whisky industry. Seven of the top ten destinations for Scotch Whisky are outside the EU, estimated to value £1.7bn, with the USA the largest market for Scotch Whisky exports by value in 2016 (£0.8bn).1
“Coke, refined petroleum and chemical” product is the second largest manufacturing sector in terms of value of exports, at £3.7bn. Of these exports £2.2bn, or 60%, went to the EU in 2016.
Scottish Government targets
Scotland Performs1 presents information on how Scotland is performing against a range of targets and indicators outlined in the Scottish Government's National Performance Framework. One of these indicators is to “Increase Exports”. This tracks the annual value of international exports (i.e. not including exports to the rest of the UK) and records whether it has increased or decreased compared to the previous year.
The Government specifies that
a decrease of 3.0% or more suggests that the position is worsening
an increase of 3.0% or more suggests the position is improving.
So the increase of 1.6% over the year means that the indicator is maintain performance.
As well as Scotland Performs, the Government set out a target of increasing the value of international exports by 50% by 2017, using 2010 as the baseline, in their 2011 Economic Strategy2.
Figure 3: The value of international exports indexed to 2010 compared to the Scotland Performs target of a 50% increase from 2010 to 2017.
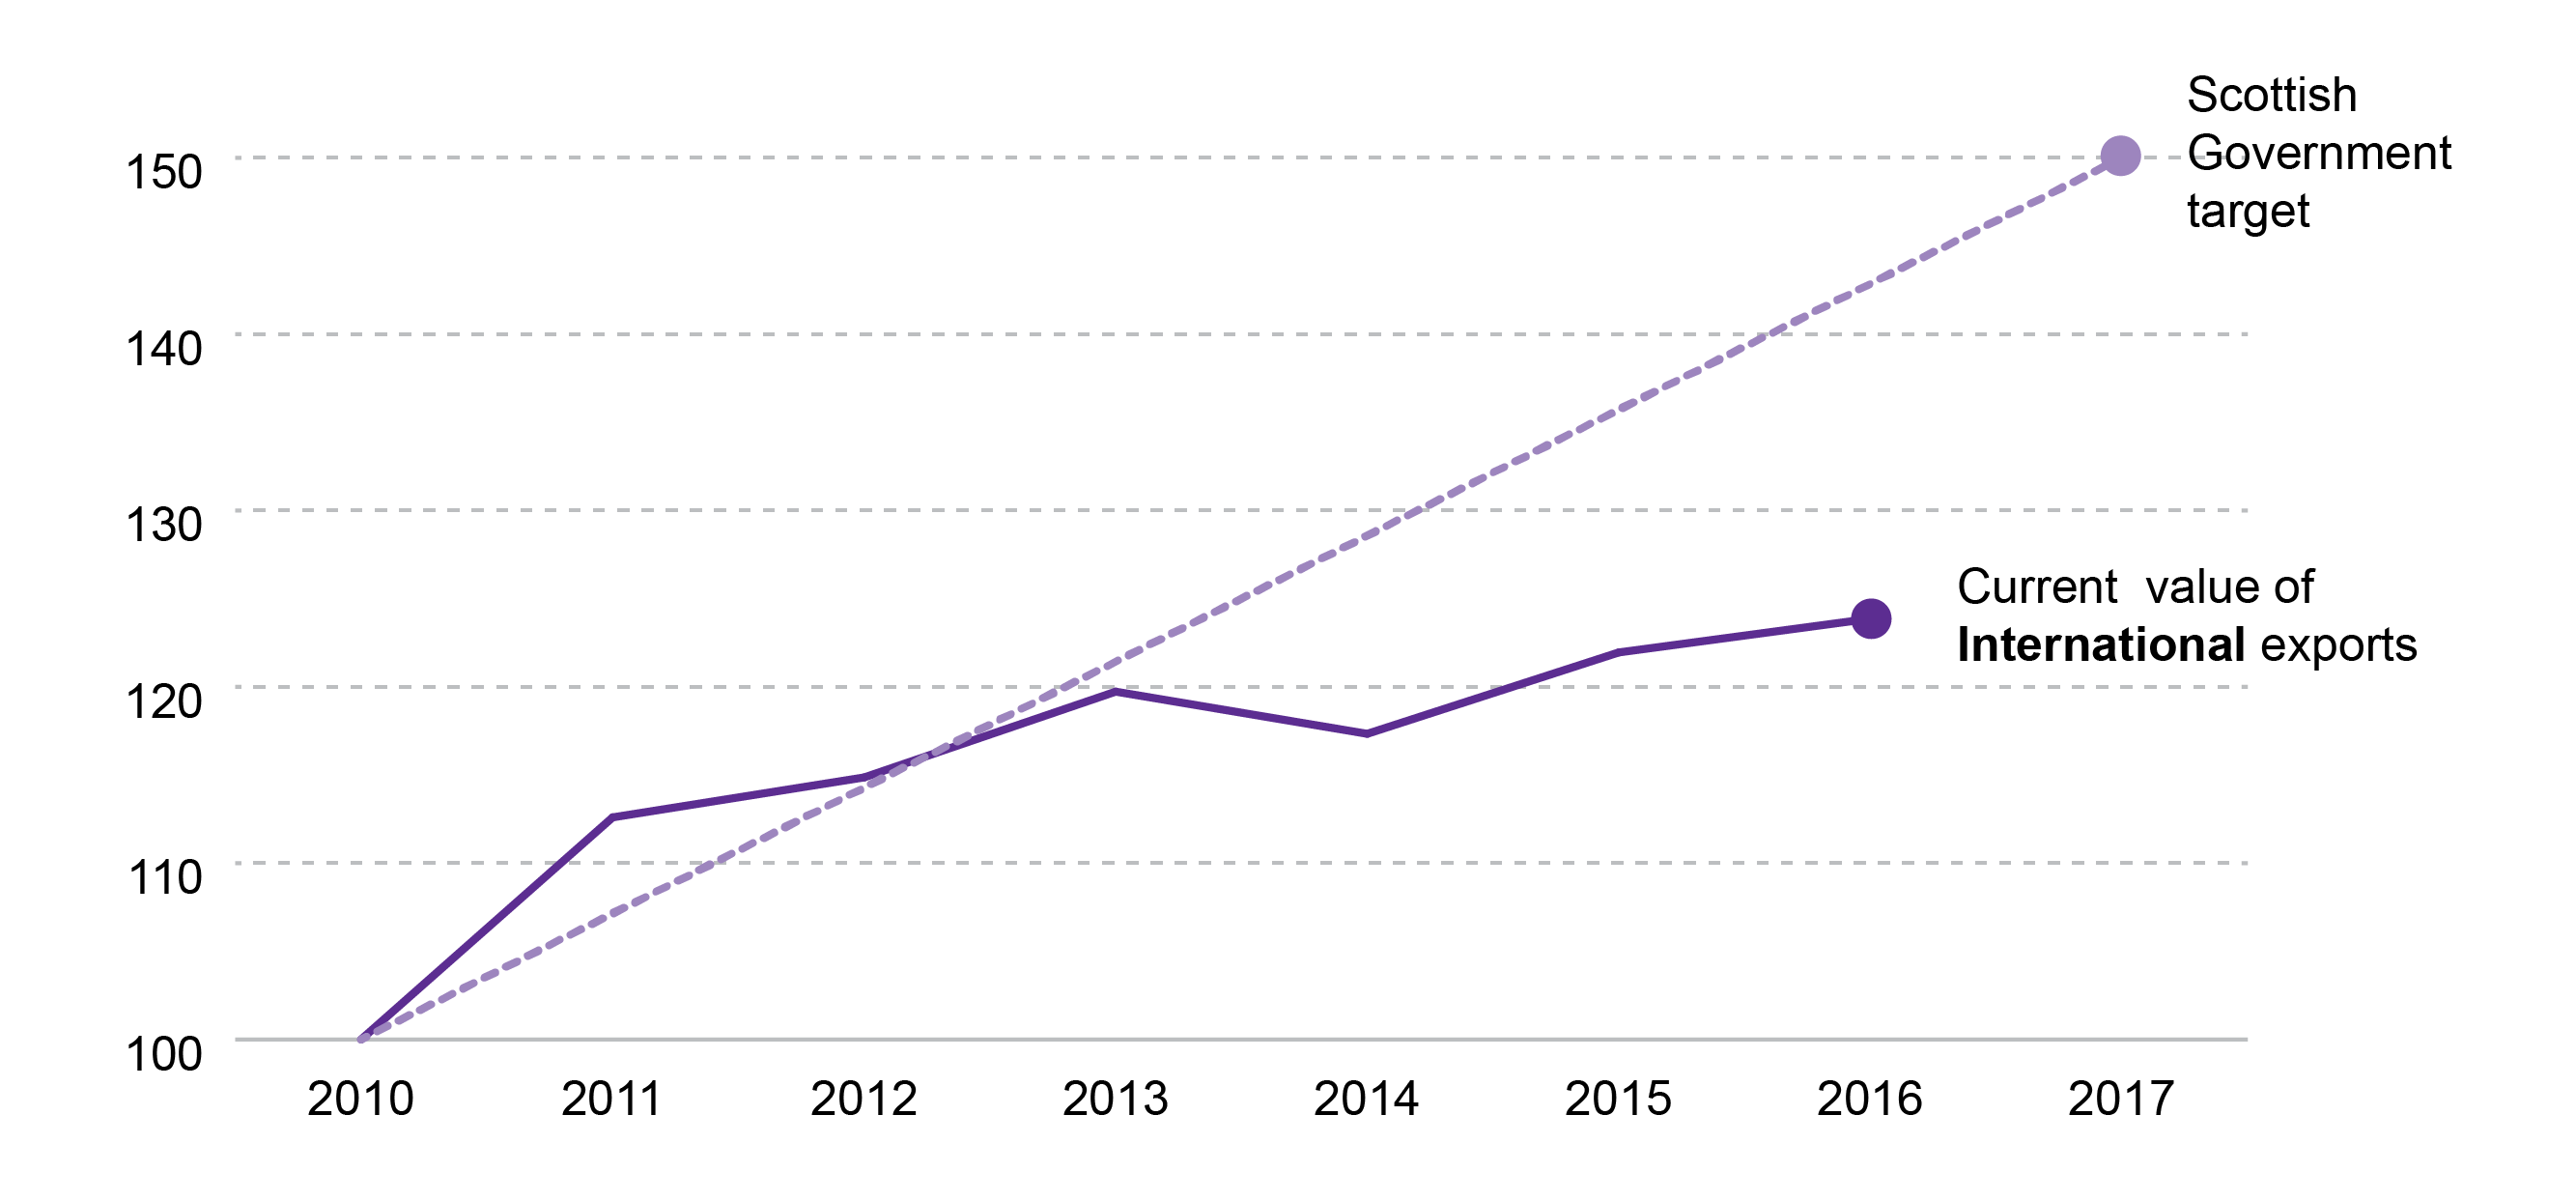
In 2016 international export were 24% above their 2010 level. In order for the target to be reached the value of international exports will have to increase by around 21% between 2016 and 2017.
Are there any exports figures in real terms (adjusted for inflation)?
The Exports Statistics Scotland publication provides a volume index for international exports. This means that the exports are presented as a chain linked volume index which allow export trends to be analysed over time with the effects of price inflation removed1 or in real terms.
It should be noted that these figures are classified as experimental statistics and should be viewed with some caution.
Figure 17: Scottish exports as chain linked volume index - 2002 to 2016
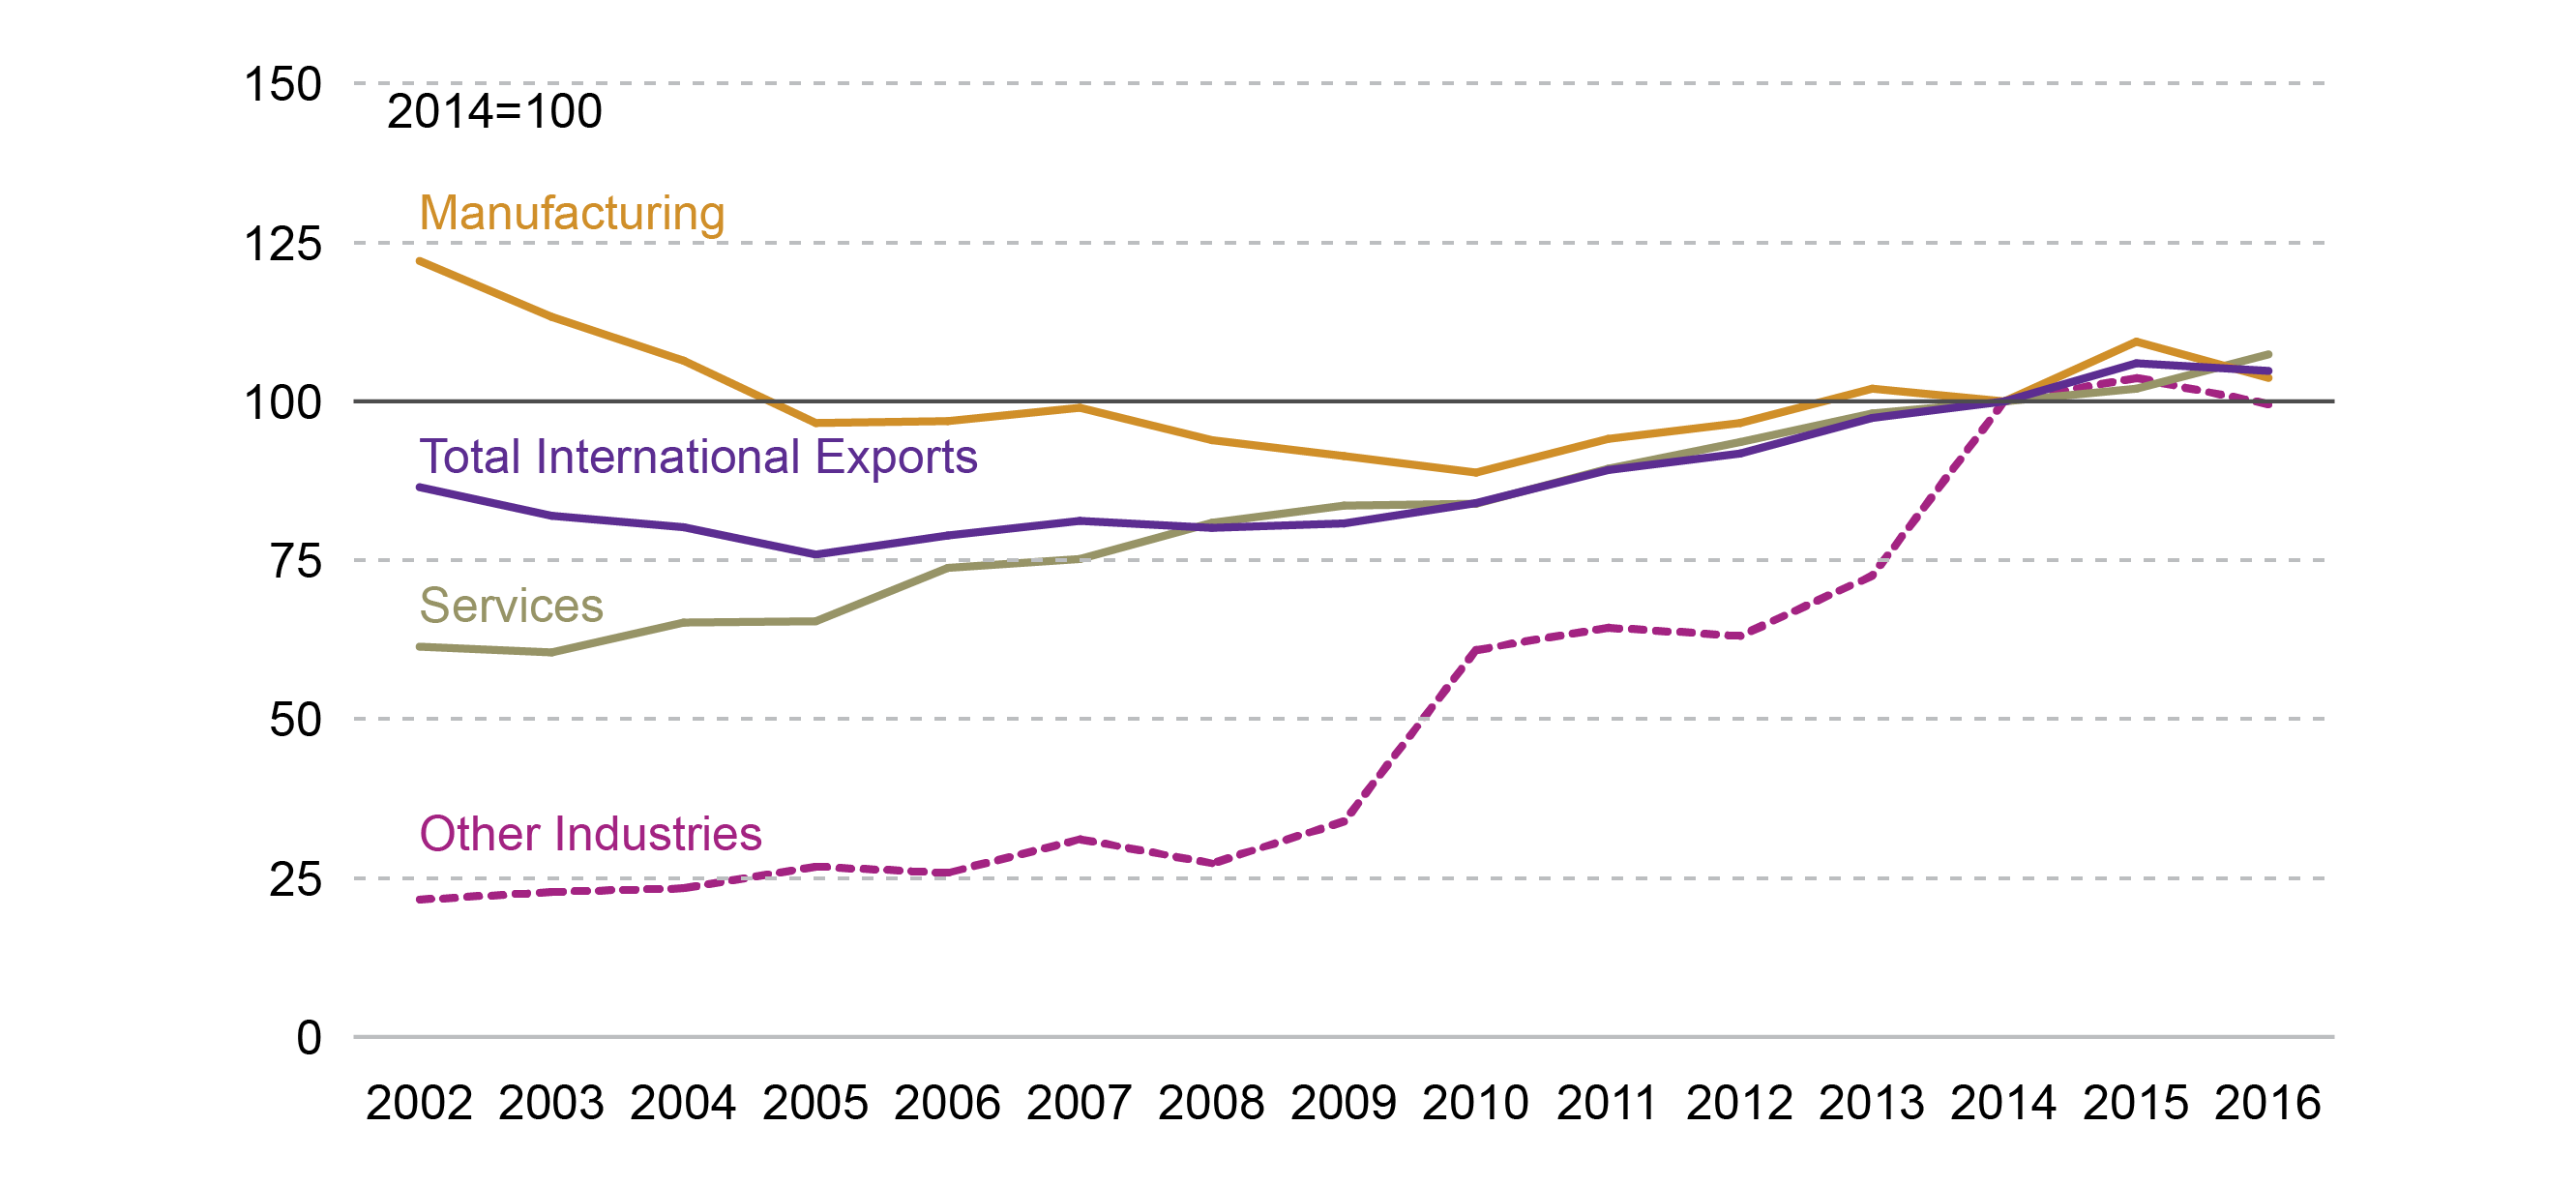
International exports fell in real terms between 2015 and 2016 by 1.2%. Looking at the broad sectors figure 17 shows that between 2015 and 2016:
"Services" saw a 5.2% increase.
"Manufacturing" fell by 5.2%.
"Other industries" fell by 3.9%.
Overall exports have grown by 21% between 2002 and 2016 in real terms.
"Services" exports have increased by 75%
"Manufacturing" exports have fallen by 15%, but grown by 7% between 2005 and 2016.
"Other industries" have increased by 361%.
Annex
The following tables provide the full classifications of the Manufacturing and Services sectors as they appear in the Scottish Government publication.
| Abbreviated version | As appears in the official publication |
|---|---|
| Food & Drink | Food products, beverages and tobacco products |
| Spirits | Of Which Distilling, rectifying and blending of spirits |
| Textiles | Textiles, wearing apparel, leather and related products |
| Wood & paper | Wood and paper products; and printing |
| Petroleum & chemical | Coke, refined petroleum and chemical products |
| Pharmaceuticals | Basic pharmaceutical products and their products |
| Rubber, plastic & other products | Rubber, plastic and other non-metallic mineral products |
| Metals and metal products | Basic metals and fabricated metal products, except machinery |
| Electronic | Computer, electronic and optical products |
| Electrical equipment | Electrical equipment |
| Machinery | Machinery and equipment n.e.c |
| Transport | Transport equipment |
| Other manufacturing | Furniture, other manufacturing; repair and installation of machinery and equipment |
| Abbreviated version | As appears in the official publication |
|---|---|
| Wholesale | Wholesale, retail trade; repair of motor vehicles and motorcycles |
| Transportation & storage | Transportation and storage |
| Accommodation & food | Accommodation and food service activities |
| Information & communication | Information and communication |
| Financial & insurance | Financial and insurance activities |
| Real estate | Real estate activities |
| Professional, scientific & technical | Professional, scientific and technical activities |
| Administrative | Administrative and support service activities |
| Education | Education |
| Other Services | Other Services |
Sources
Scottish Government. (2018, January 24). Export Statistics Scotland 2016. Retrieved from <a href="http://www.gov.scot/Topics/Statistics/Browse/Economy/Exports/ESSPublication/ESSPDF" target="_blank">http://www.gov.scot/Topics/Statistics/Browse/Economy/Exports/ESSPublication/ESSPDF</a> [accessed 30 January 2018]
Scottish Government. (2017). Scottish Trade Statistics – Frequently Asked Questions. Retrieved from <a href="http://www.gov.scot/Topics/Statistics/Browse/Economy/Exports/ESSFAQ" target="_blank">http://www.gov.scot/Topics/Statistics/Browse/Economy/Exports/ESSFAQ</a> [accessed 7 February 2018]
Scotch Whisky Association. (2017, June 07). Scotch at a Glance 2016/17. Retrieved from <a href="http://www.scotch-whisky.org.uk/news-publications/publications/documents/scotch-at-a-glance-201617/#.WmsCndKLS70" target="_blank">http://www.scotch-whisky.org.uk/news-publications/publications/documents/scotch-at-a-glance-201617/#.WmsCndKLS70</a> [accessed 26 January 2018]
Scottish Government. (n.d.) Scotland Performs. Retrieved from <a href="http://www.gov.scot/About/Performance/scotPerforms" target="_blank">http://www.gov.scot/About/Performance/scotPerforms</a> [accessed 7 February 2018]
Scottish Government. (2011, September 12). The Government Economic Strategy. Retrieved from <a href="http://www.gov.scot/Publications/2011/09/13091128/0" target="_blank">http://www.gov.scot/Publications/2011/09/13091128/0</a> [accessed 1 February 2018]