Labour Market Update: February 2018
This briefing provides an overview of the Scottish labour market from the latest regional labour market statistics from the Office for National Statistics (ONS).
Executive Summary
The number of unemployed people in Scotland increased by 14,000 over the quarter but fell by 10,000 over the year. The rate in Scotland, at 4.5%, is slightly above the UK overall, at 4.4%.
The number of people aged 16 and over in employment in Scotland decreased by 20,000 over the quarter but increased by 17,000 over the year. The majority of the decrease in employment level was due to 14,000 men leaving employment.
The employment rate in Scotland fell over the quarter while the UK overall saw an increase.
Over the quarter the economic inactivity rate in Scotland increased whilst the UK's .
This months guest indicator looks at employment for those aged 50 and over. In Oct 2004-Sep 2005 those aged 50 and over made up a quarter of those in employment, but by Oct 2016-Sep 2017 it was around a third.
| Overall | Men | Women | ||||
|---|---|---|---|---|---|---|
| Rate (%) | Change over the qtr (% pts) | Rate (%) | Change over the qtr (% pts) | Rate (%) | Change over the qtr (% pts) | |
| Unemployment | 4.5% | +0.5 | 5.3% | +0.8 | 3.6% | +0.3 |
| Employment | 74.3% | -0.8 | 77.6% | -0.9 | 71.3% | -0.8 |
| Economic Inactivity | 22.1% | +0.5 | 18.0% | +0.3 | 26.0% | +0.6 |
What are the labour market measurements?
The International Labour Organisation provides the official definition of labour market statistics.
What is unemployment?
Level: Any individual aged 16 and over without a job who has been actively seeking work within the last four weeks and is available to start work within the next two weeks.
Rate: Number of unemployed individuals as a proportion of the total number of economically active people, which includes both the unemployed and those in work.
What is employment?
Level: Any individual aged 16 and over who is undertaking one hour or more a week of paid work.
Rate: Number of people in employment expressed as a percentage of all people aged 16-64.
What is economic inactivity?
Level: Any individual aged 16 to 64 who is not in employment, has not looked for work in the last four weeks, and is unable to start work within the next two weeks.
Rate: Number of people economically inactive expressed as a percentage of all people aged 16-64.
The main reasons for economic inactivity are:
being a student and not having or looking for a job
looking after the family and/or home
being sick (temporary and long-term)
being retired
being discouraged.
You can find out more in formation on labour market statistics in the SPICe Labour market statistics briefing.
Unemployment
The number of unemployed people in Scotland increased by 14,000 over the quarter but fell by 10,000 over the year. This is the biggest quarterly increase since 2015 (16,000 increase between Oct-Dec 2014 and Jan-Mar 2015).
The unemployment rate for the UK is 4.4%. The rate in Scotland sits at 4.5%. Despite the rate increasing over the quarter in Scotland, it is still one of the lowest rates since comparable records began in 1992.
| Level ('000) | Quarter change ('000) | Year change ('000) | Rate (%) | Quarter change (% pts) | Year change (% pts) | |
|---|---|---|---|---|---|---|
| Scotland | 124 | +14 | -10 | 4.5% | +0.5 | -0.4 |
| UK | 1,470 | +46 | -123 | 4.4% | +0.1 | -0.4 |
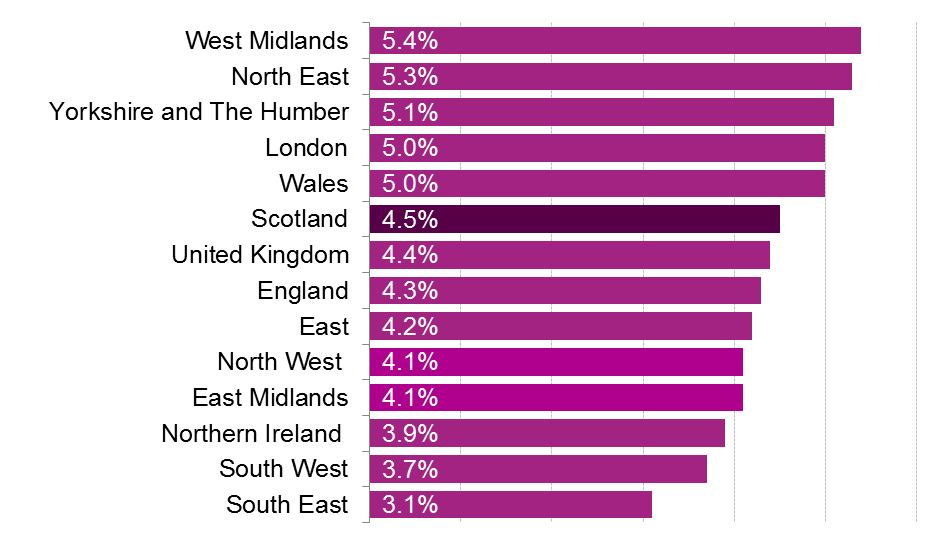
Looking at unemployment across the UK, Scotland has the 6th highest unemployment rate of the nations and regions of the UK. The South East has the lowest rate at 3.1%, while the West Midlands has the highest at 5.4%.
Unemployment by gender
Over the quarter in Scotland, the increase in the unemployment level was due to the number of unemployed men increasing by 11,000 while the number of women increased by 4,000.
The increase over the quarter in the number of unemployed men is the largest since 2009 (15,000 increase between Jul-Sep 2009 and Oct-Dec 2009).
The rate for women increased over the quarter but saw the biggest fall over the year since 2014 (-2.7 percentage points between Oct-Dec 2013 and Oct-Dec 2014.)
| Level ('000) | Quarter change ('000) | Year Change ('000) | Rate (%) | Quarter change (% pts) | Year change (% pts) | ||
|---|---|---|---|---|---|---|---|
| Scotland | Men | 75 | +11 | +3 | 5.3% | +0.8 | +0.2 |
| Women | 48 | +4 | -13 | 3.6% | +0.3 | -0.9 | |
| UK | Men | 782 | +11 | -94 | 4.4% | 0.0 | -0.5 |
| Women | 689 | +35 | -30 | 4.4% | +0.2 | -0.2 |
Unemployment by age
This data is not seasonally adjusted and is compared with the same quarter in previous years.
The unemployment rate for 25-34 year olds (3.7%) is the lowest since comparable records began in 2001.
Looking across the age groups, youth unemployment is the only group where Scotland deviates from the UK, with the Scottish rate 1.8 percentage points lower.
| Age group | Scotland | UK | |
|---|---|---|---|
| 16-24 | Rate | 10.3% | 12.1% |
| Year change (% pts) | +1.3 | -0.1 | |
| 25-34 | Rate | 3.7% | 3.8% |
| Year change (% pts) | -0.7 | -0.7 | |
| 35-49 | Rate | 3.5% | 2.8% |
| Year change (% pts) | -0.3 | -0.3 | |
| 50-64 | Rate | 3.4% | 3.0% |
| Year change (% pts) | -0.9 | -0.3 |
Employment
The number of people aged 16 and over in employment in Scotland decreased by 20,000 over the quarter, but increased by 17,000 over the year.
The employment rate in Scotland fell by 0.8 percentage points over the quarter, while the UK saw an increase of 0.2 percentage points. However, over the year the rate in both Scotland and the UK increased by 0.6 percentage points.
Despite a fall over the quarter, the rate in Scotland is one of the highest since comparable records began in 1992.
| Level ('000) | Quarter change ('000) | Year change ('000) | Rate (%) | Quarter change (% pts) | Year change (% pts) | |
|---|---|---|---|---|---|---|
| Scotland | 2,632 | -20 | +17 | 74.3% | -0.8 | +0.6 |
| UK | 32,147 | +88 | +321 | 75.2% | +0.2 | +0.6 |
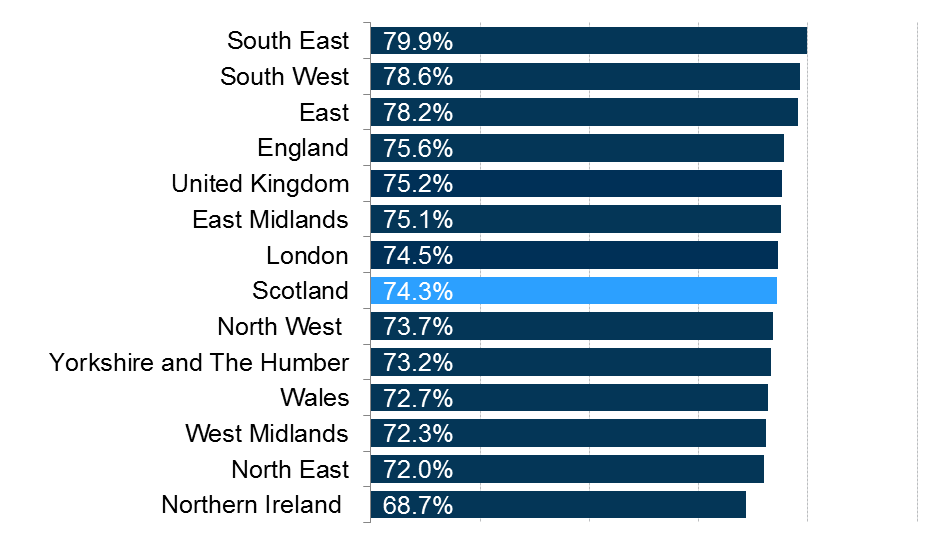
Looking at employment across the UK, the Scottish rate is lower than the UK average. The South East has the highest rate at 79.9%, while Northern Ireland has the lowest at 68.7%.
Employment by gender
Employment levels and rates are higher for men than for women at both the Scottish and UK levels.
The majority of the 20,000 decrease in the number of people in employment in Scotland came from 14,000 men leaving employment. This was the second quarter in a row where the number of men in employment has fallen.
Despite falling over the quarter the rate for both men and women increased over the year.
The female employment rate is higher in Scotland than in the UK (71.3% in Scotland versus 70.8% in the UK).
| Level ('000) | Quarter change ('000) | Year change ('000) | Rate (%) | Quarter change (% pts) | Year change (% pts) | ||
|---|---|---|---|---|---|---|---|
| Scotland | Men | 1,348 | -14 | +17 | 77.6% | -0.9 | +1.0 |
| Women | 1,284 | -6 | 0 | 71.3% | -0.8 | +0.2 | |
| UK | Men | 17,039 | +55 | +143 | 79.7% | +0.2 | +0.4 |
| Women | 15,108 | +33 | +178 | 70.8% | +0.1 | +0.8 |
Employment by age
This data is not seasonally adjusted and is compared with the same quarter in previous years.
The employment rate for 50-64 year olds is the highest since comparable records began in 2001, having increased by 12.6 percentage points since 2001.
Looking across the age groups, the employment rate for 35 to 49 year olds is the only age group where Scotland significantly deviates from the UK (3.4 percentage points lower than the UK).
| Age group | Scotland | UK | |
|---|---|---|---|
| 16-24 | Rate (%) | 57.3% | 55.0% |
| Year change (% pts) | +0.5 | -0.8 | |
| 25-34 | Rate (%) | 82.6% | 83.5% |
| Year change (% pts) | +1.2 | +1.4 | |
| 35-49 | Rate (%) | 81.5% | 84.9% |
| Year Change (% pts) | -0.7 | +0.9 | |
| 50-64 | Rate (%) | 71.2% | 71.4% |
| Year Change (% pts) | +1.2 | +0.5 |
Economic inactivity
The number of people economically inactive in Scotland increased by 15,000 over the quarter but fell by 10,000 over the year.
Over the quarter, the economic inactivity rate in Scotland increased by 0.5 percentage point, whilst the UK's fell by 0.3 percentage points.
Over the year the rate in Scotland and the UK fell by 0.3 percentage points.
| Level ('000) | Quarter change ('000) | Year change ('000) | Rate (%) | Quarter change (% pts) | Year change (% pts) | |
|---|---|---|---|---|---|---|
| Scotland | 753 | +15 | -10 | 22.1% | +0.5 | -0.3 |
| UK | 8,773 | -109 | -95 | 21.3% | -0.3 | -0.3 |
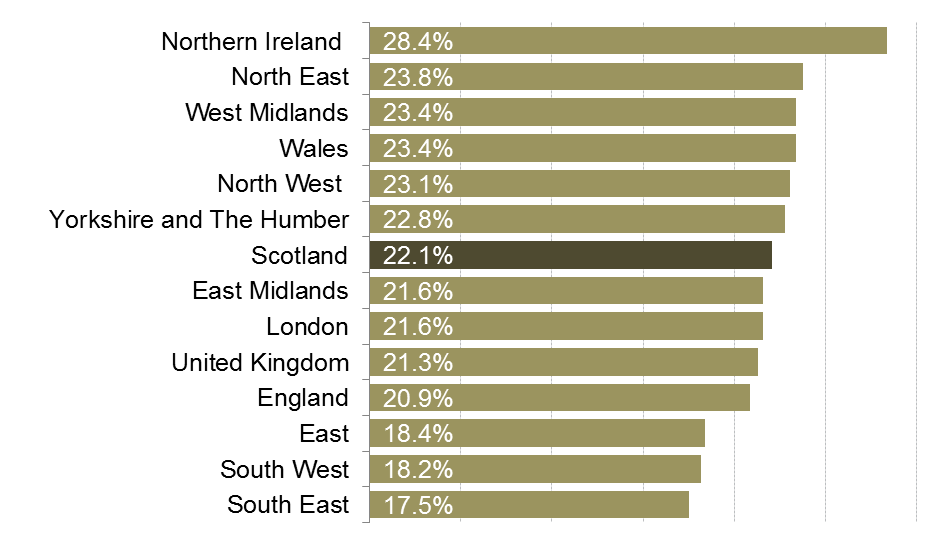
Looking at economic inactivity across the UK, the Scottish rate is higher than the UK average. Northern Ireland has the highest rate at 28.4%, while the South East has the lowest at 17.5%.
Economic inactivity by gender
Economic inactivity rates are higher for women than for men.
The number of economically inactive people in Scotland increased over the quarter, mainly due to 10,000 women becoming economically inactive. The number of inactive men increased by 5,000.
The rate for both men and women increased over the quarter. The rate fell for men and increased for women over the year, with the opposite being true across the UK.
| Level ('000) | Quarter change ('000) | Year change ('000) | Rate (%) | Quarter change (% pts) | Year change (% pts) | ||
|---|---|---|---|---|---|---|---|
| Scotland | Men | 300 | +5 | -19 | 18.0% | +0.3 | -1.1 |
| Women | 453 | +10 | +9 | 26.0% | +0.6 | +0.5 | |
| UK | Men | 3,401 | -44 | +35 | 16.6% | -0.2 | +0.1 |
| Women | 5,372 | -65 | -131 | 25.9% | -0.3 | -0.7 |
Economic inactivity by age
This data is not seasonally adjusted and is compared with the same quarter in previous years.
The economic inactivity rate for 50-64 year olds is the lowest since comparable records began in 2001, it has fallen by 12.4 percentage points since 2001.
Looking across the age groups, the rate for 35-49 year olds is the only age group where Scotland significantly deviates from the UK (2.9 percentage point higher than the UK)
| Age Group | Scotland | UK | |
|---|---|---|---|
| 16-24 | Rate (%) | 36.2% | 37.5% |
| Year change (% pts) | -1.4 | +1.0 | |
| 25-34 | Rate (%) | 14.2% | 13.2% |
| Year change (% pts) | -0.6 | -0.8 | |
| 35-49 | Rate (%) | 15.6% | 12.7% |
| Year change (% pts) | +1.0 | -0.7 | |
| 50-64 | Rate (%) | 26.3% | 26.4% |
| Year change (% pts) | -0.5 | -0.3 |
Claimant Count
The Claimant Count figures presented here are experimental statistics from the ONS for Jobseekers Allowance, plus Universal Credit claimants who are out of work.
Under Universal Credit a broader span of claimants are required to look for work than under Jobseekers Allowance. As Universal Credit Full Service is rolled out in particular areas, the number of people recorded as being on the Claimant Count is therefore likely to rise.
This is not an official measure of unemployment, but it does provide accurate information on the labour market at a local level.
Scotland and UK comparison
The seasonally adjusted claimant count rate for January in Scotland was unchanged over the month and increased over the year.
The Scottish claimant count rate is higher than the UK rate.
| Level | Month Change | Year Change | Rate (%) | Month Change (% pts) | Year Change (% pts) | |
|---|---|---|---|---|---|---|
| Scotland | 83,300 | -800 | +5,200 | 2.4% | 0.0 | +0.2 |
| UK | 823,000 | -7,100 | +58,200 | 2.0% | 0.0 | +0.2 |
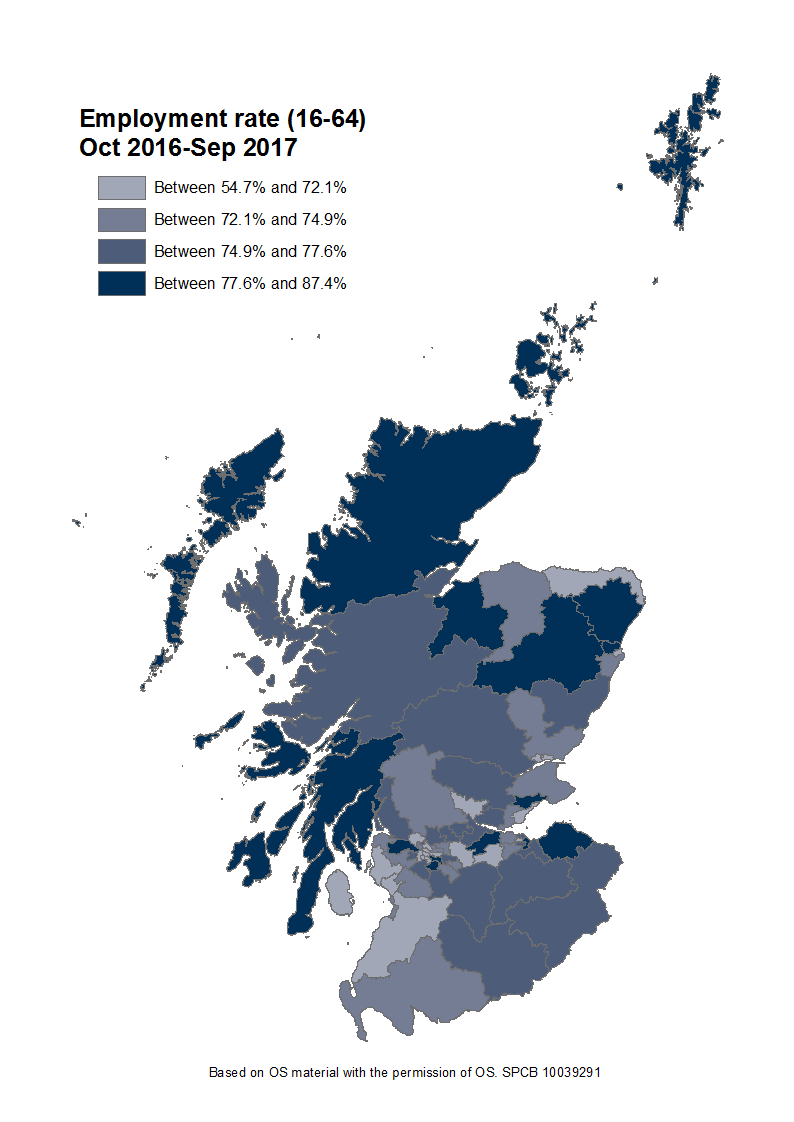
Constituency data: Employment rate
The constituency data for Scotland comes from the Annual Population Survey (APS). The APS datasets are produced quarterly, with each dataset containing 12 months of data. This data is based on residence analysis of the APS.
The latest APS data is for Oct 2016-Sep 2017.
The Orkney Islands have the highest employment rate at 87.4%, while Glasgow Kelvin has the lowest at 54.7%. Glasgow Anniesland saw the biggest increase over the year, while Glasgow Kelvin saw the largest decrease.
Find out the latest labour market data for your constituency.
Guest Indicator: Employment for those aged 50 and over
The employment rate for those aged 50-64 has increased by 12.6 percentage points between 2001 and 2017. This section looks at this in more detail, using data from the Annual Population Survey (APS) regional analysis of labour market status by age.
In Oct 2004-Sep 2005, there were 2.4 million people in employment in Scotland. In Oct 2016-Sep 2017,there were 2.6 million people in employment, which represents an increase of 7%. However, looking at this by broad age ranges tells a different story
Figure 5 shows the growth in the number of people in employment by broad age groups, between Oct 2004-Sep 2005 and Oct 2016-Sep 2017. The number of people in the 16-49 year old age group has fallen by 3% over this period, while the number of people age 50-64 has increased by 30%, and those aged 65 and over has increased by 111%.
Figure 5: Index of employment levels by broad age group between Oct 2004-Sep 2005 and Oct 2016-Sep 2017 (100 = Oct 2004-Sep 2005)
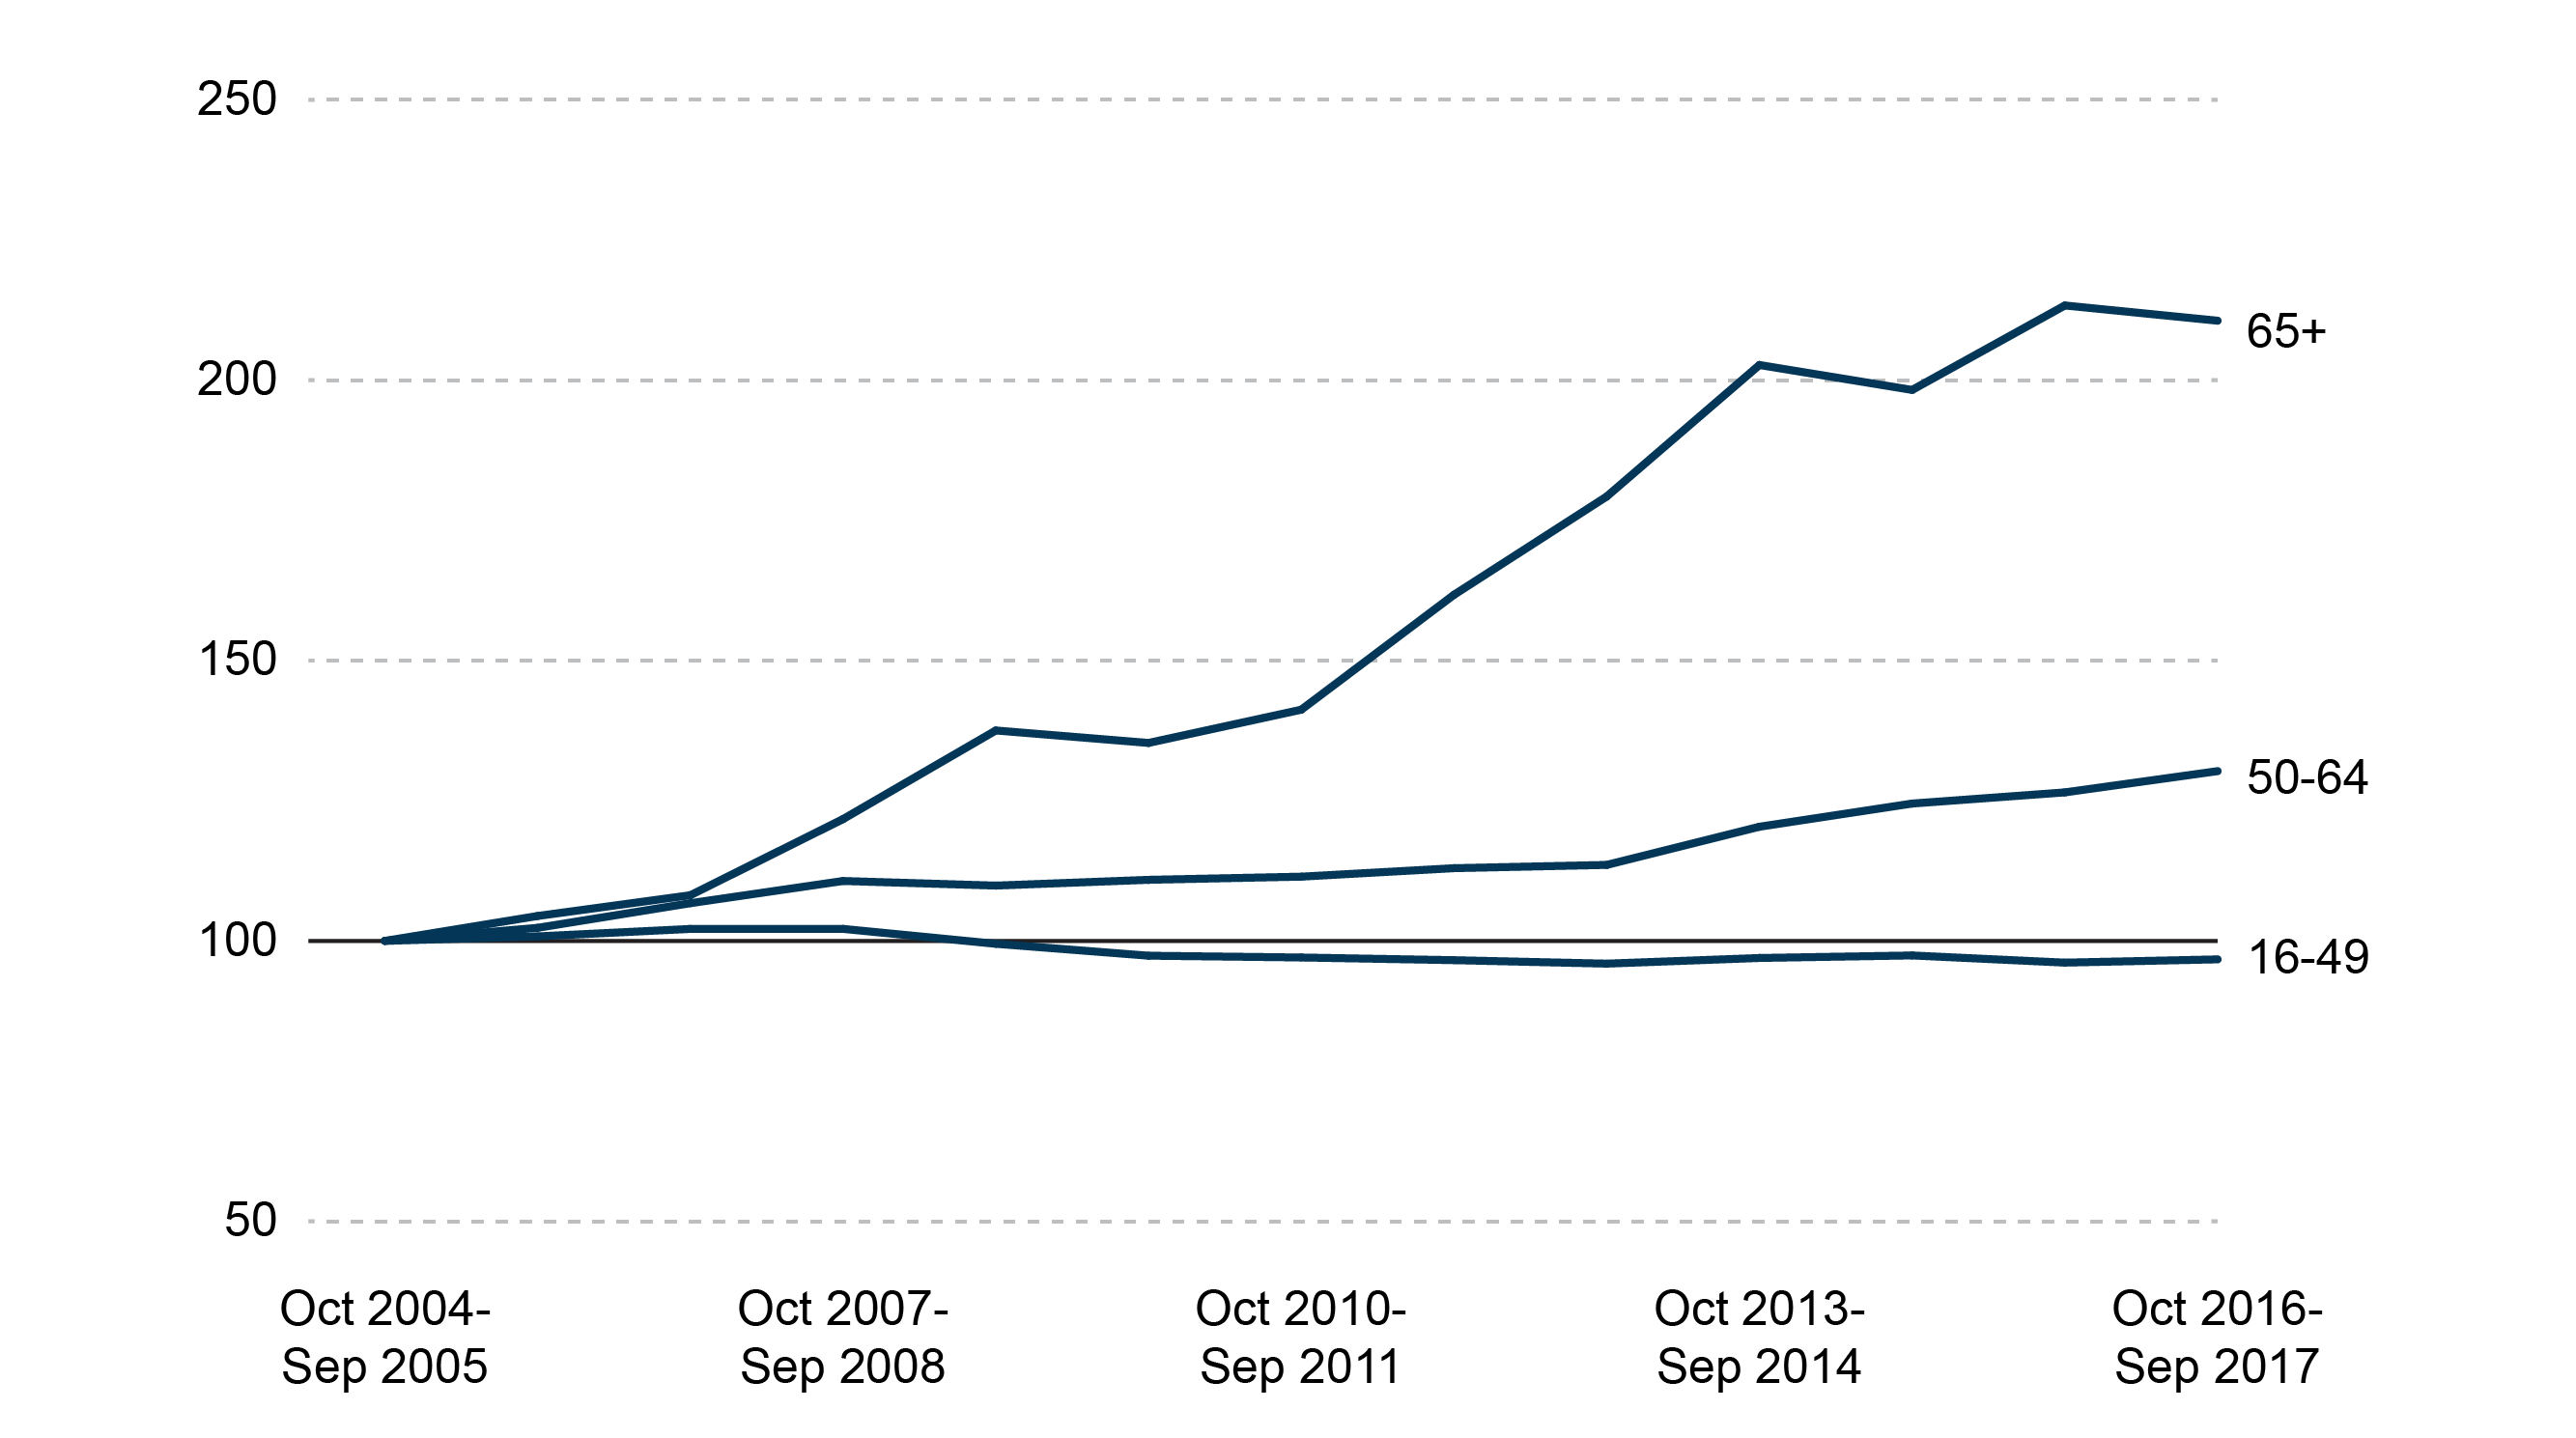
Figure 6 shows how the share of total employment of those aged 50 and over has changed between Oct 2004-Sep 2005 and Oct 2016-Sep 2017. In Oct 2004-Sep 2005 those aged 50 and over made up a quarter of those in employment, but by Oct 2016-Sep 2017 it was around a third.
Figure 6: Proportion of total employment by age group - Oct 2004-Sep 2005 to Oct 2016-Sep 2017
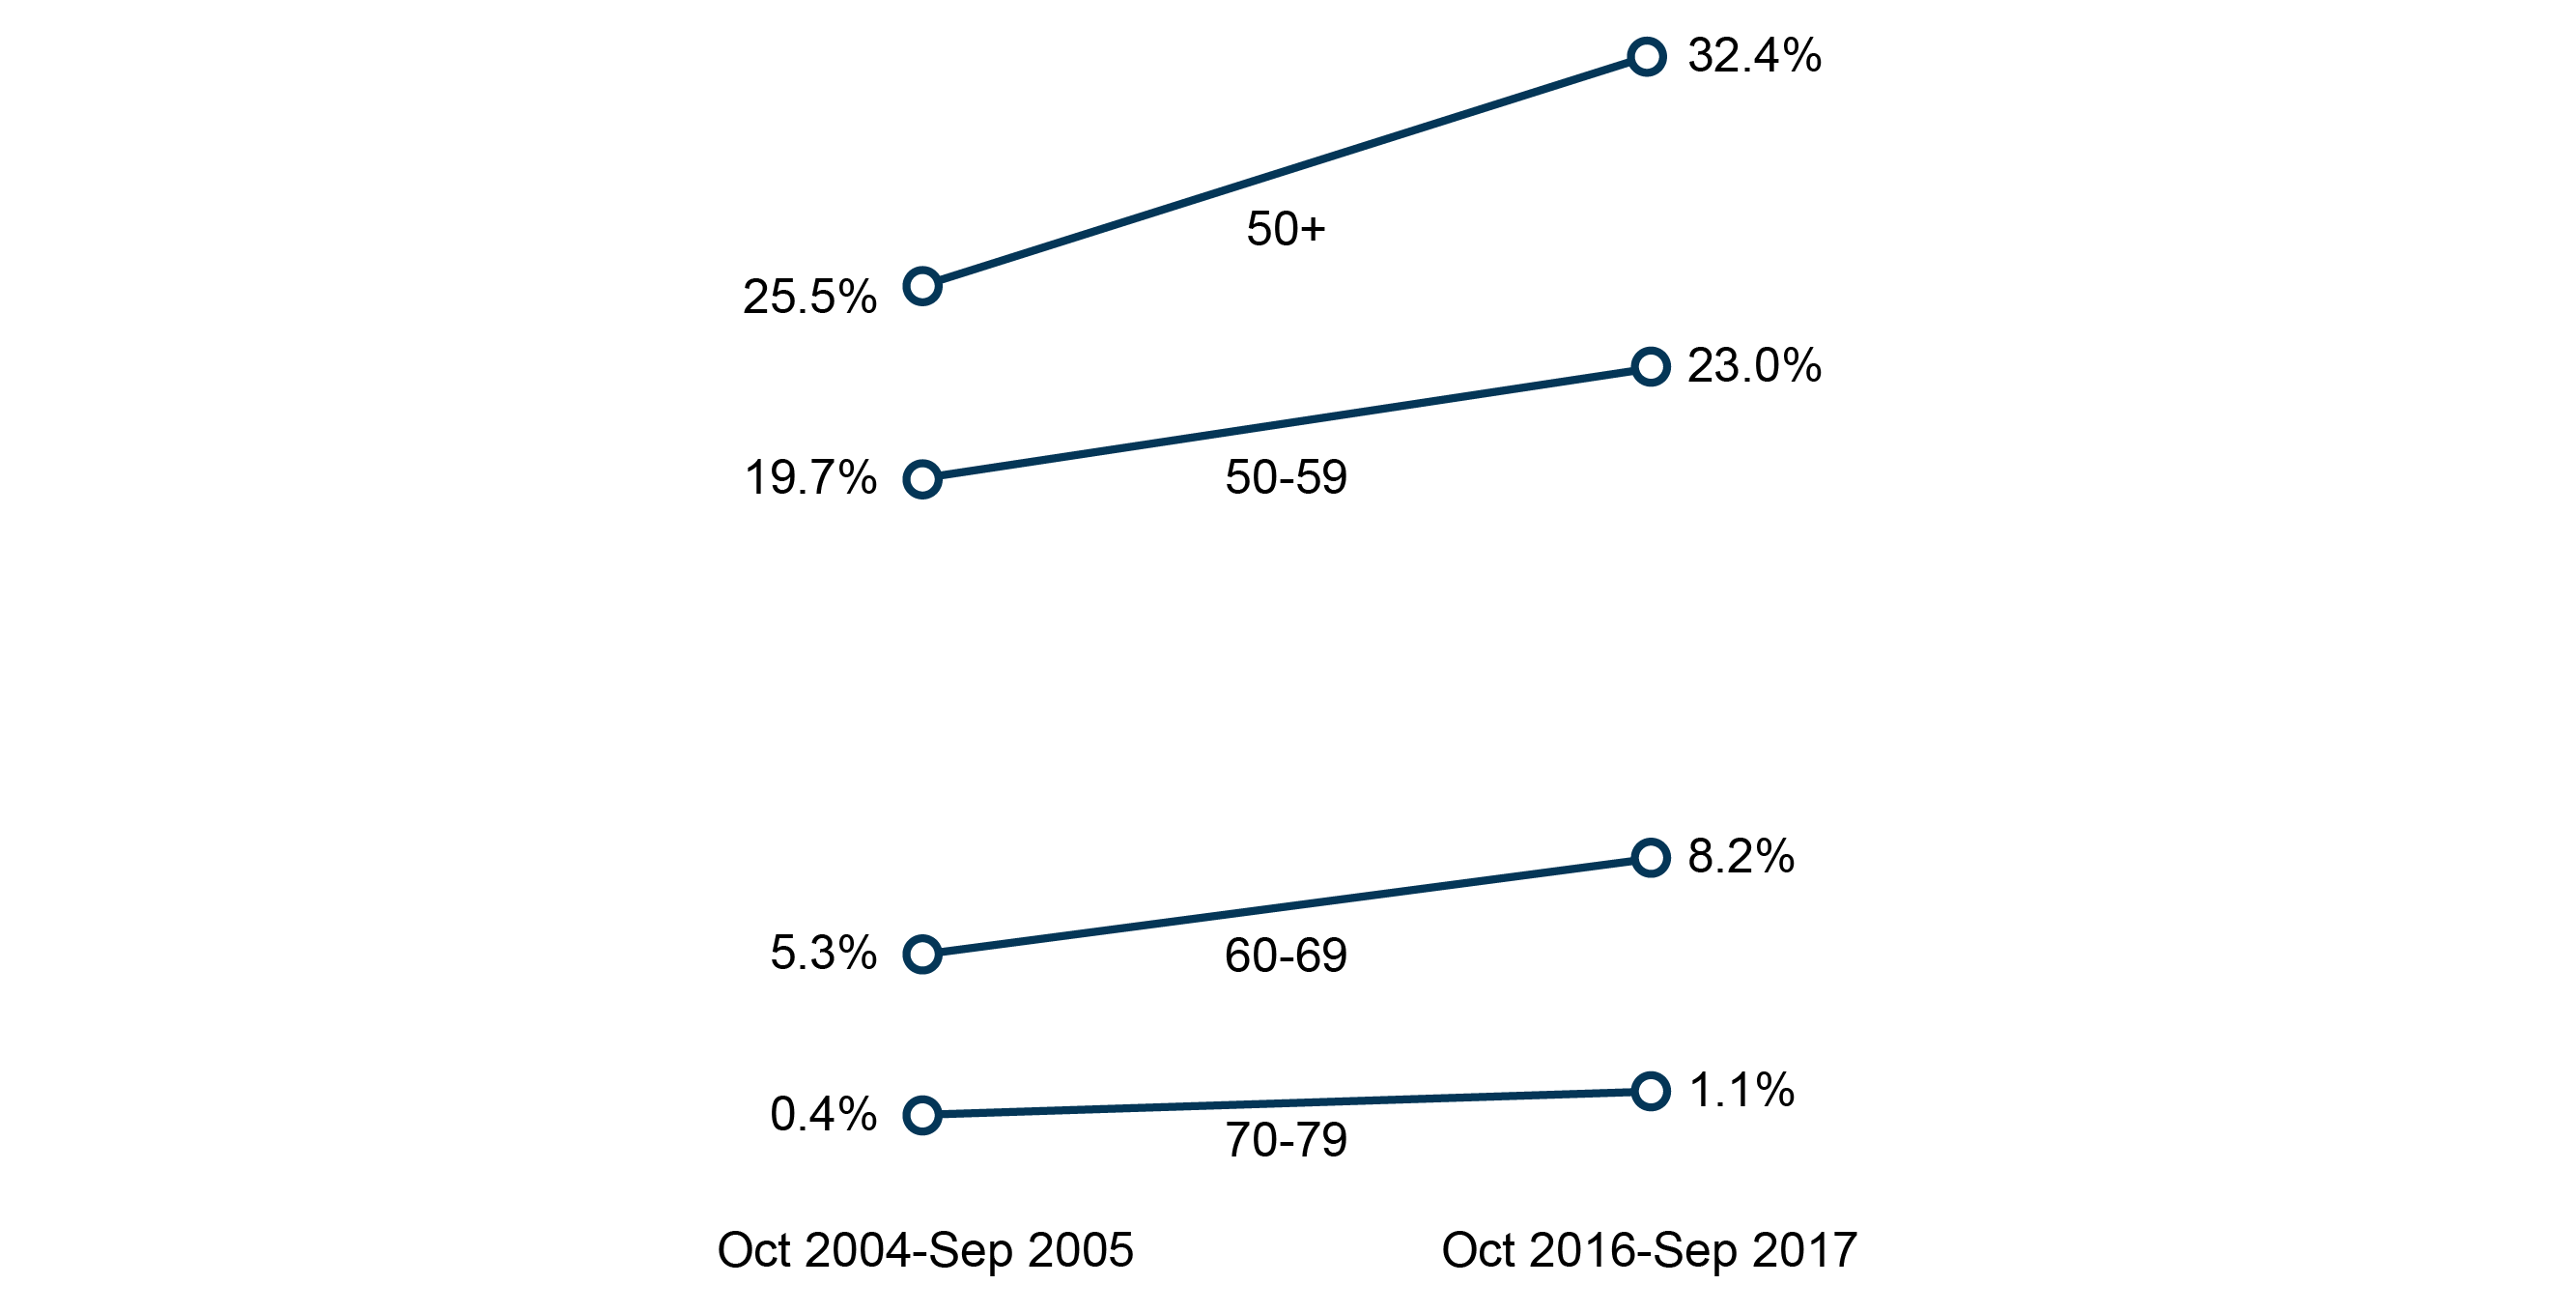
Figure 7 shows the gender breakdown of increases in the number of people aged 50 and over who are in employment. Women accounted for 58% of the increase in the number of people aged 50 and over who are in employment between Oct 2004-Sep 2005 and Oct 2016-Sep 2017.
Figure 7: Proportion of increase in over 50s in employment by gender - Oct 2004-Sep 2005 to Oct 2016-Sep 2017
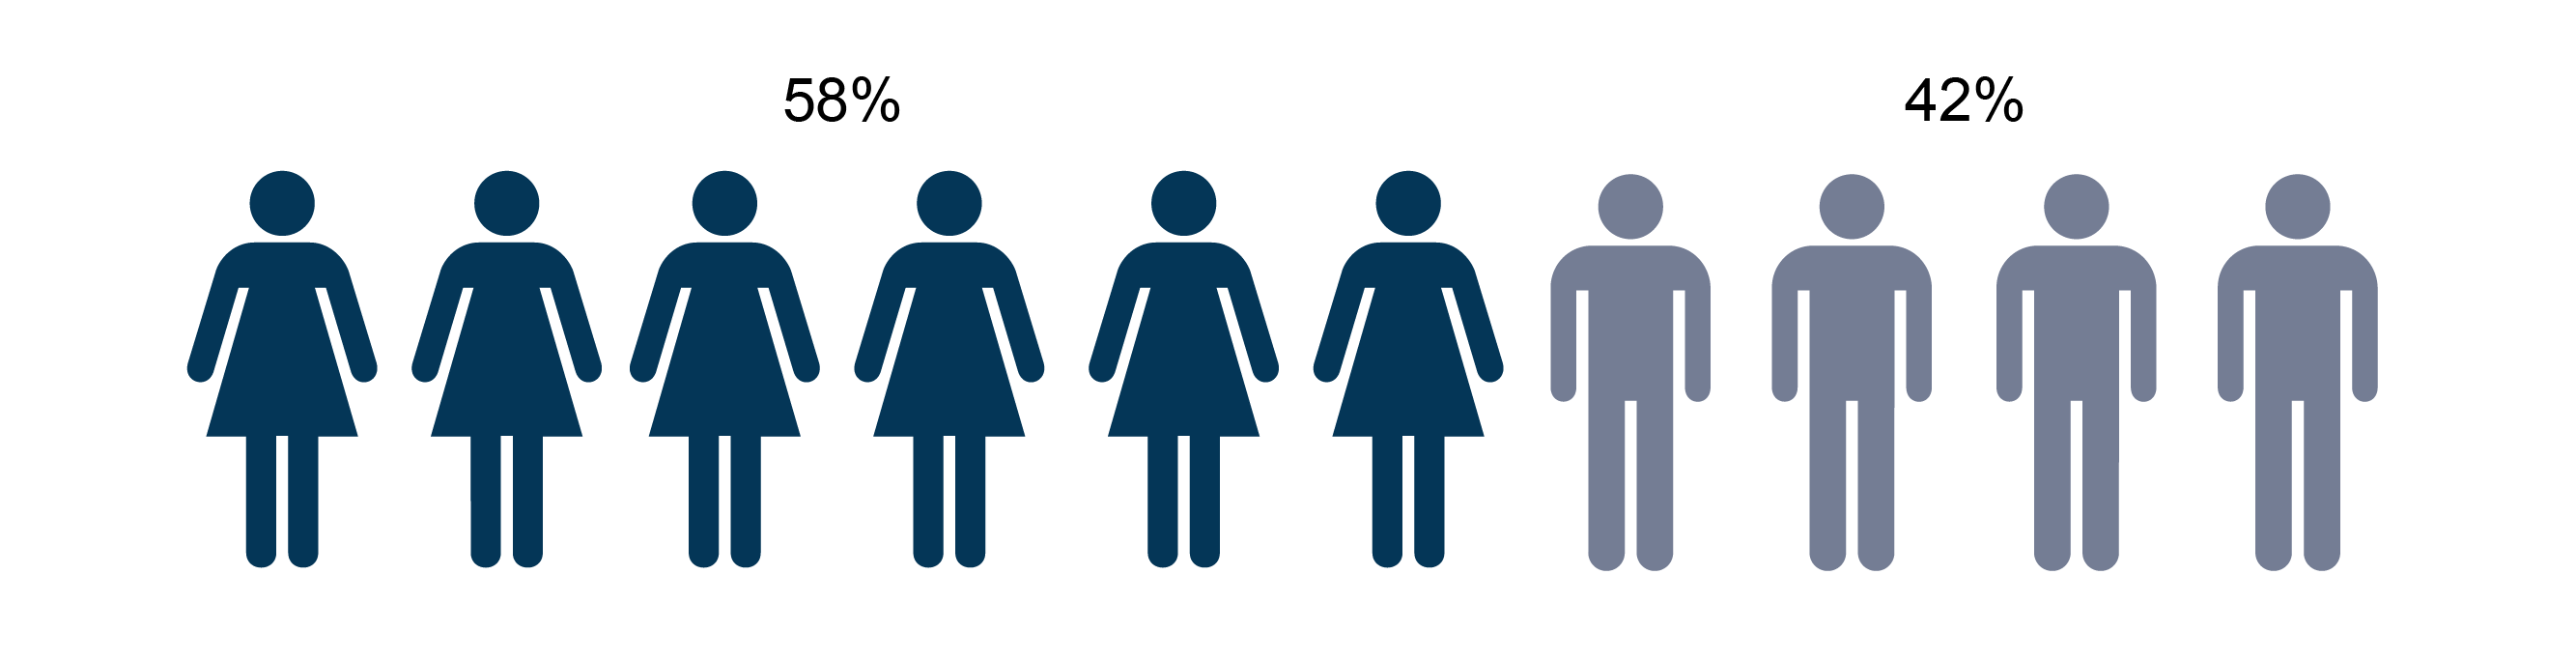
Figure 8 shows the working pattern and gender breakdown of the increase between Oct 2004-Sep 2005 and Oct 2016-Sep 2017. Overall most people, 69%, entered full-time employment, with men more likely than women to be working full-time.
Figure 8: Proportion of the increase in over 50 going who entered employment between Oct 2004-Sep 2005 and Oct 2016-Sep 2017 by working patterns and gender
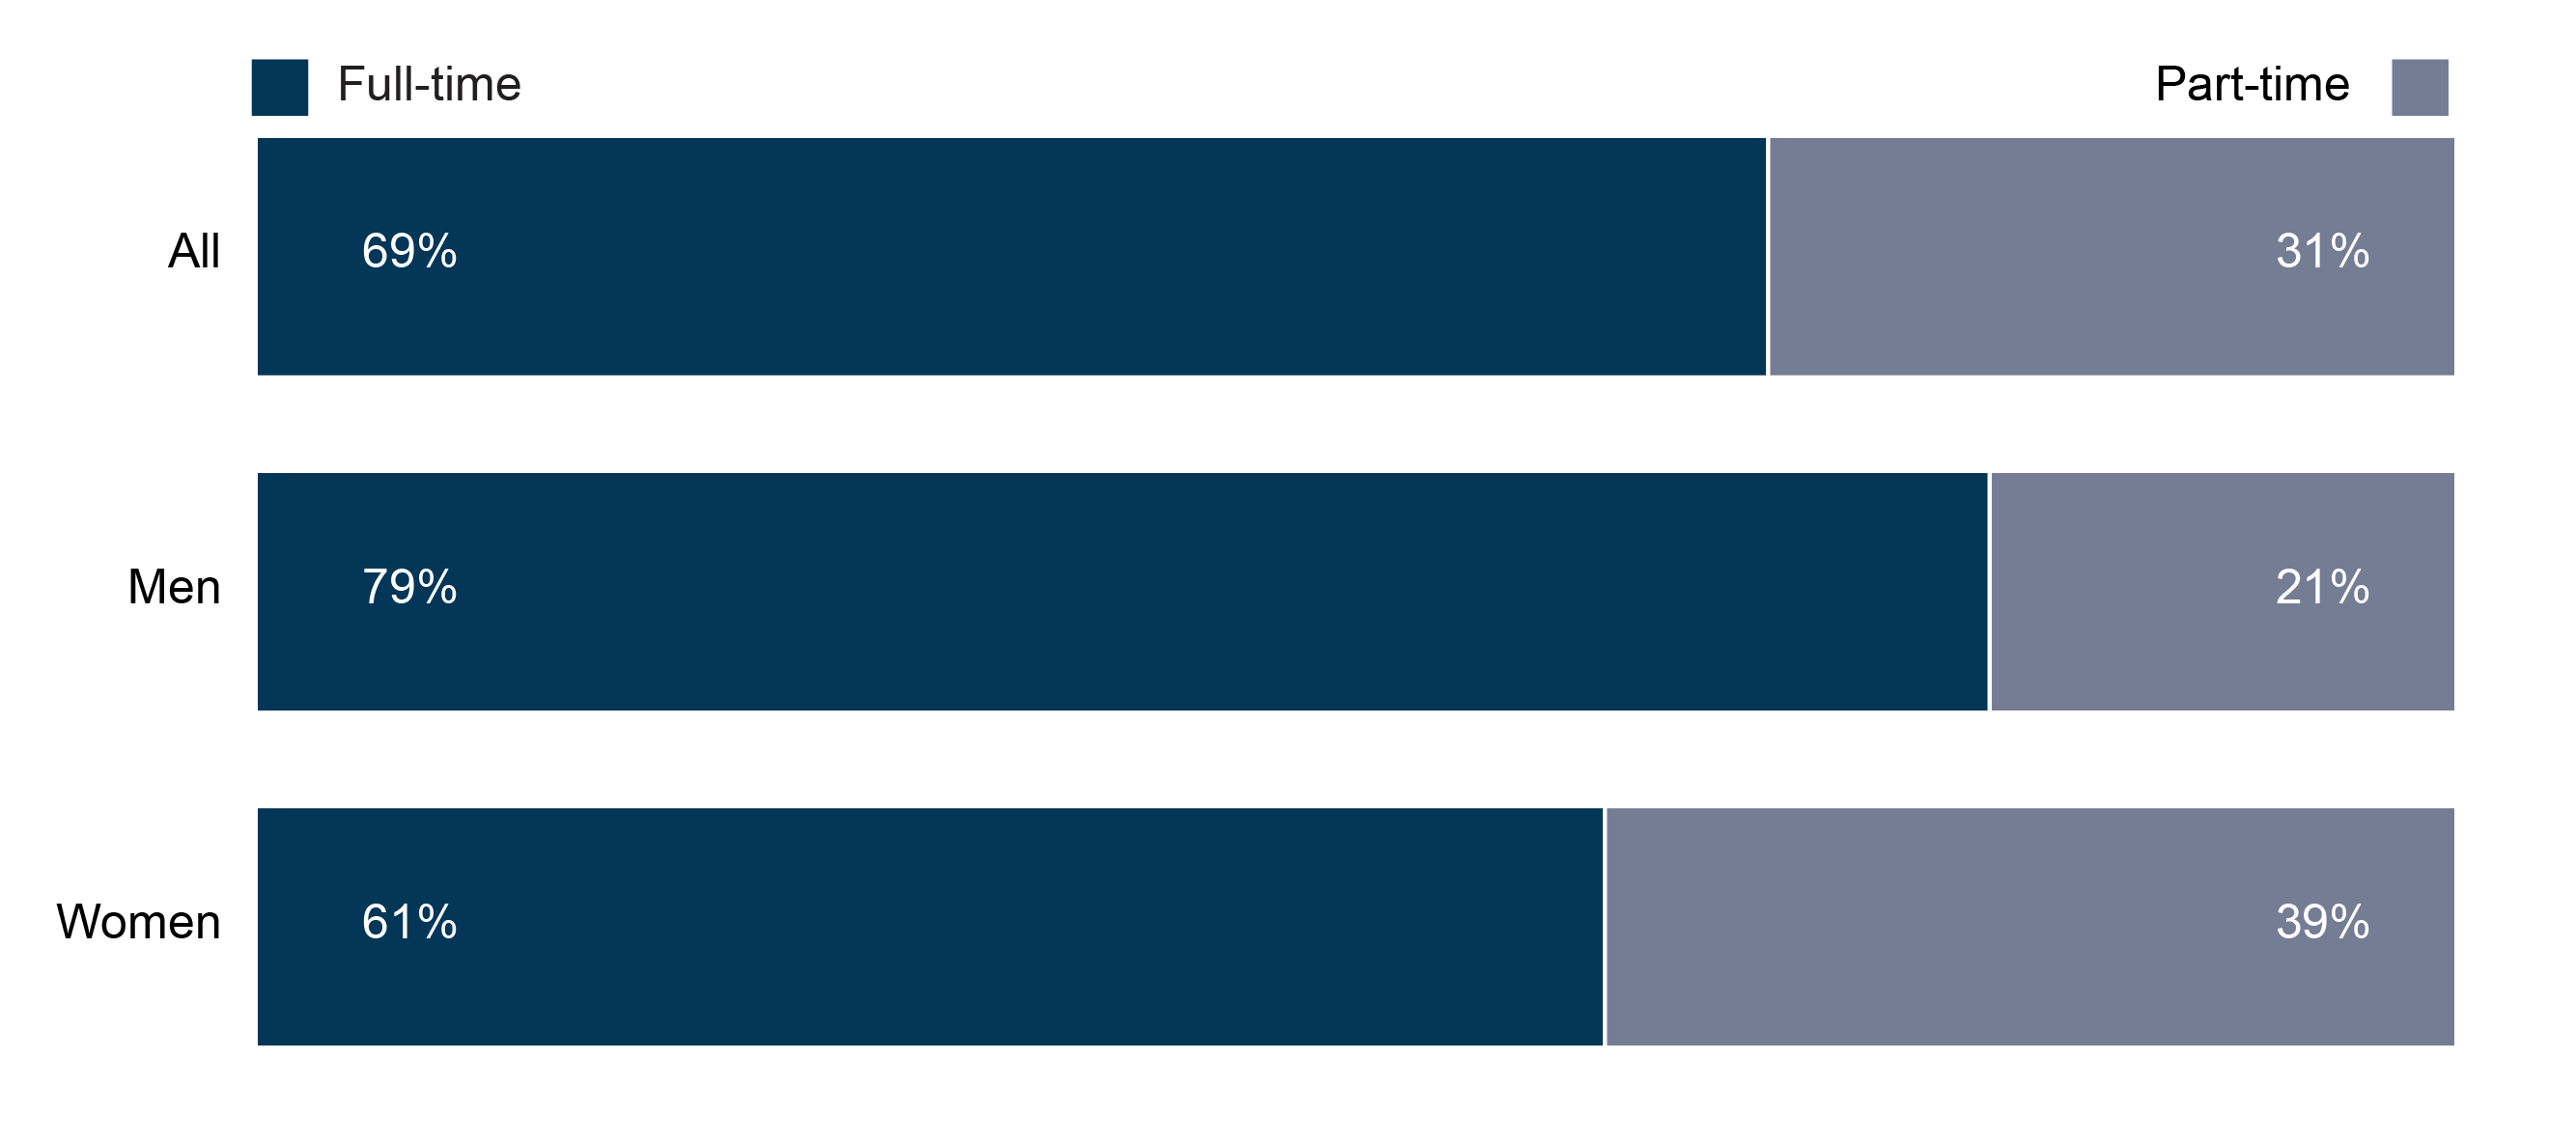
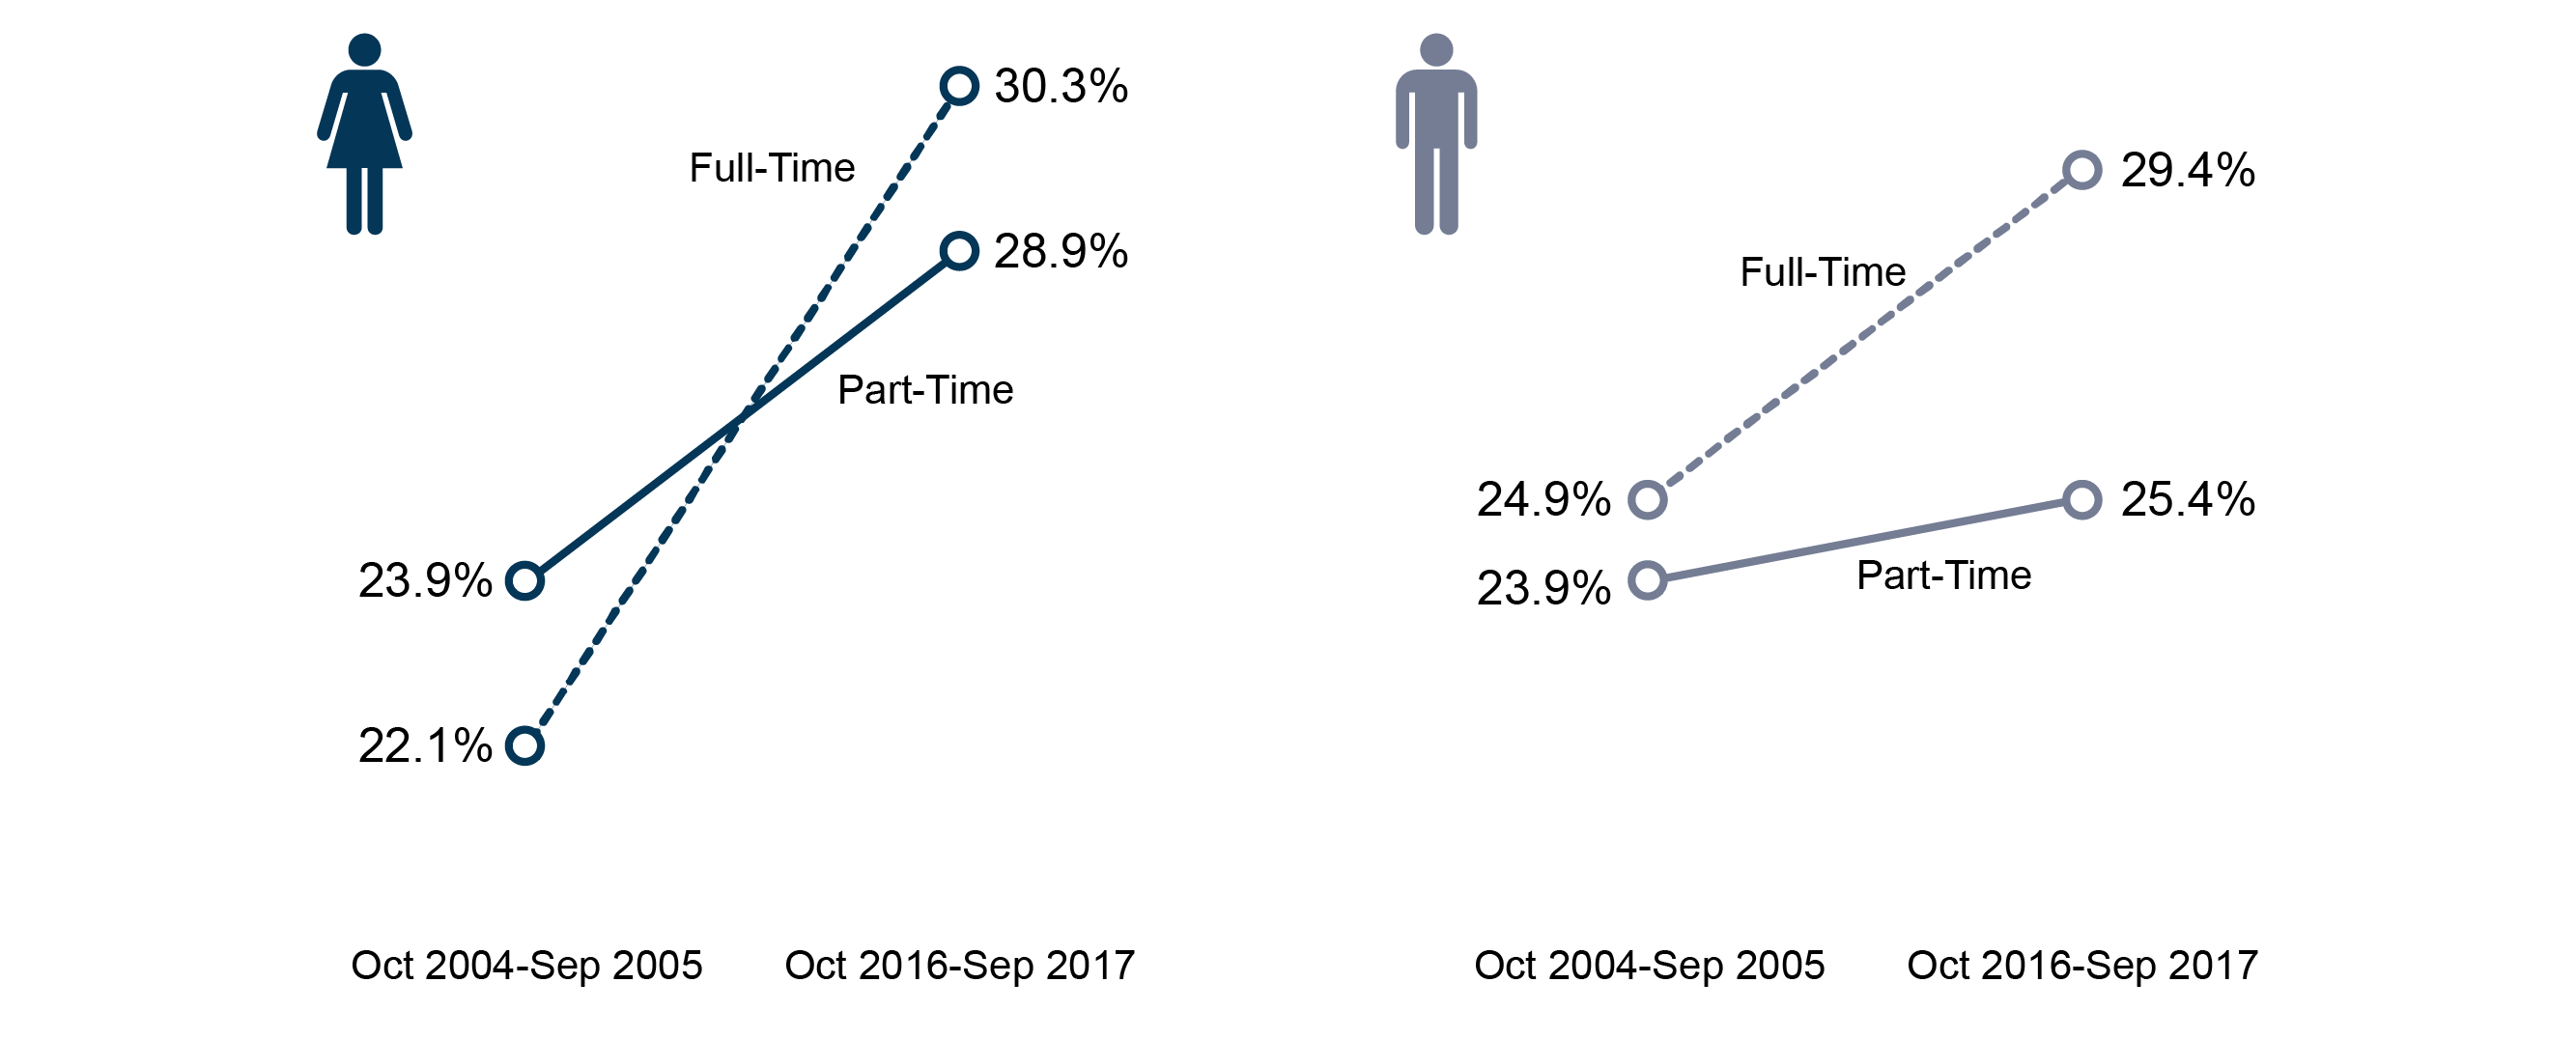
Figure 9 shows how the share of total employment of those aged 50-64 by gender and working pattern has changed between Oct 2004-Sep 2005 and Oct 2016-Sep 2017. Women working full-time aged 50 to 64 now make up 30.3% of all women working full-time. This is an increase of 8.2 percentage points between Oct 2004-Sep 2005 and Oct 2016-Sep 2017.
Figure 9: Change in the proportion of total employment made up by those aged 50 to 64 by working pattern and gender - Oct 2004-Sep 2005 and Oct 2016-Sep 2017