Pro-Poor or Pro-Rich? The social impact of local government budgets, 2016-17 to 2018-19
This briefing assesses the "social impact" of the 2018-19 local government budget by analysing how council savings plans are distributed between "Pro-Poor", "Neutral" and "Pro-Rich" services. It updates previous briefings with the most recent figures, and provides a three-year analysis of data, as well as setting out case studies. It is the result of a joint project between SPICe, the University of Glasgow and Heriot Watt University, funded by SPICe and the University of Glasgow.
Executive summary
Background and context
This briefing is the result of a joint project between SPICe and a research team from the University of Glasgow and Heriot Watt University, funded by SPICe and the University of Glasgow. It is the third in a series of briefings12 tracking the social impact of reductions in local government budgets. It uses and builds upon previous work done by the Universities funded by the Joseph Rowntree Foundation (JRF). This previous work examined how local authorities in England and Scotland have dealt with the significant budget reductions which they have faced since 2010.
As part of the work for the JRF, the research team developed a "social impact tool". This tool allows councils to assess the impact of their savings plans on services used more by better-off groups of people or poorer groups of people. It does this by classifying council services into six categories on a scale between "Pro-Rich" and "Very Pro-Poor". This briefing applies the social impact tool to the budgets of all 32 Scottish local authorities for the 2018-19 financial year.
This analysis is provided for Scottish local government as a whole. The briefing also compares this year's findings to those from the corresponding briefings from 2016-172 and 2017-181 to show a three year trend.
Previous briefings used the Local Government Benchmarking Framework to group local authorities by levels of deprivation and population density. Along with the benchmarking groups they also included local authorities by population size to offer more fine grained analysis. They also used a measure of budgetary pressure derived by the research team. In this briefing we use the benchmarking deprivation grouping and budget pressure only.
There are three new aspects of this briefing in addition to the three year trend:
An interactive workbook, linked to the briefing, which allows councils to explore the data used in this project over the past three years and produce their own charts and benchmarks.
Discussion of policy commitments and ring-fencing.
Mini-case studies which explore how three councils are managing challenges associated with local conditions and budget changes, plus key messages from the case studies.
Summary of main findings
Expenditure
Figure 1 sets out the categorisation of expenditure for all of Scottish local government on the Pro-Rich/Pro-Poor framework.

Key points to note on expenditure:
The largest area of local government spending is on Pro-Poor services, over two thirds of Net Expenditure (69%) is on Neutral-Poor, Pro-Poor and Very Pro-Poor services combined.
Eleven percent of spending is on Neutral services and only 2% of expenditure is on Pro-Rich services.
This pattern of spending is similar across all groups of councils, whether they are grouped by deprivation, population density or population size.
This spread of expenditure means that, when dealing with budget reductions, councils have little option but to make most of their savings from services which are used more by lower income groups.
There has been very little change in expenditure patterns between 2016-17 and 2018-19. There was a minor increase in expenditure on Pro-Poor services (up by 1 percentage points).
Savings plans
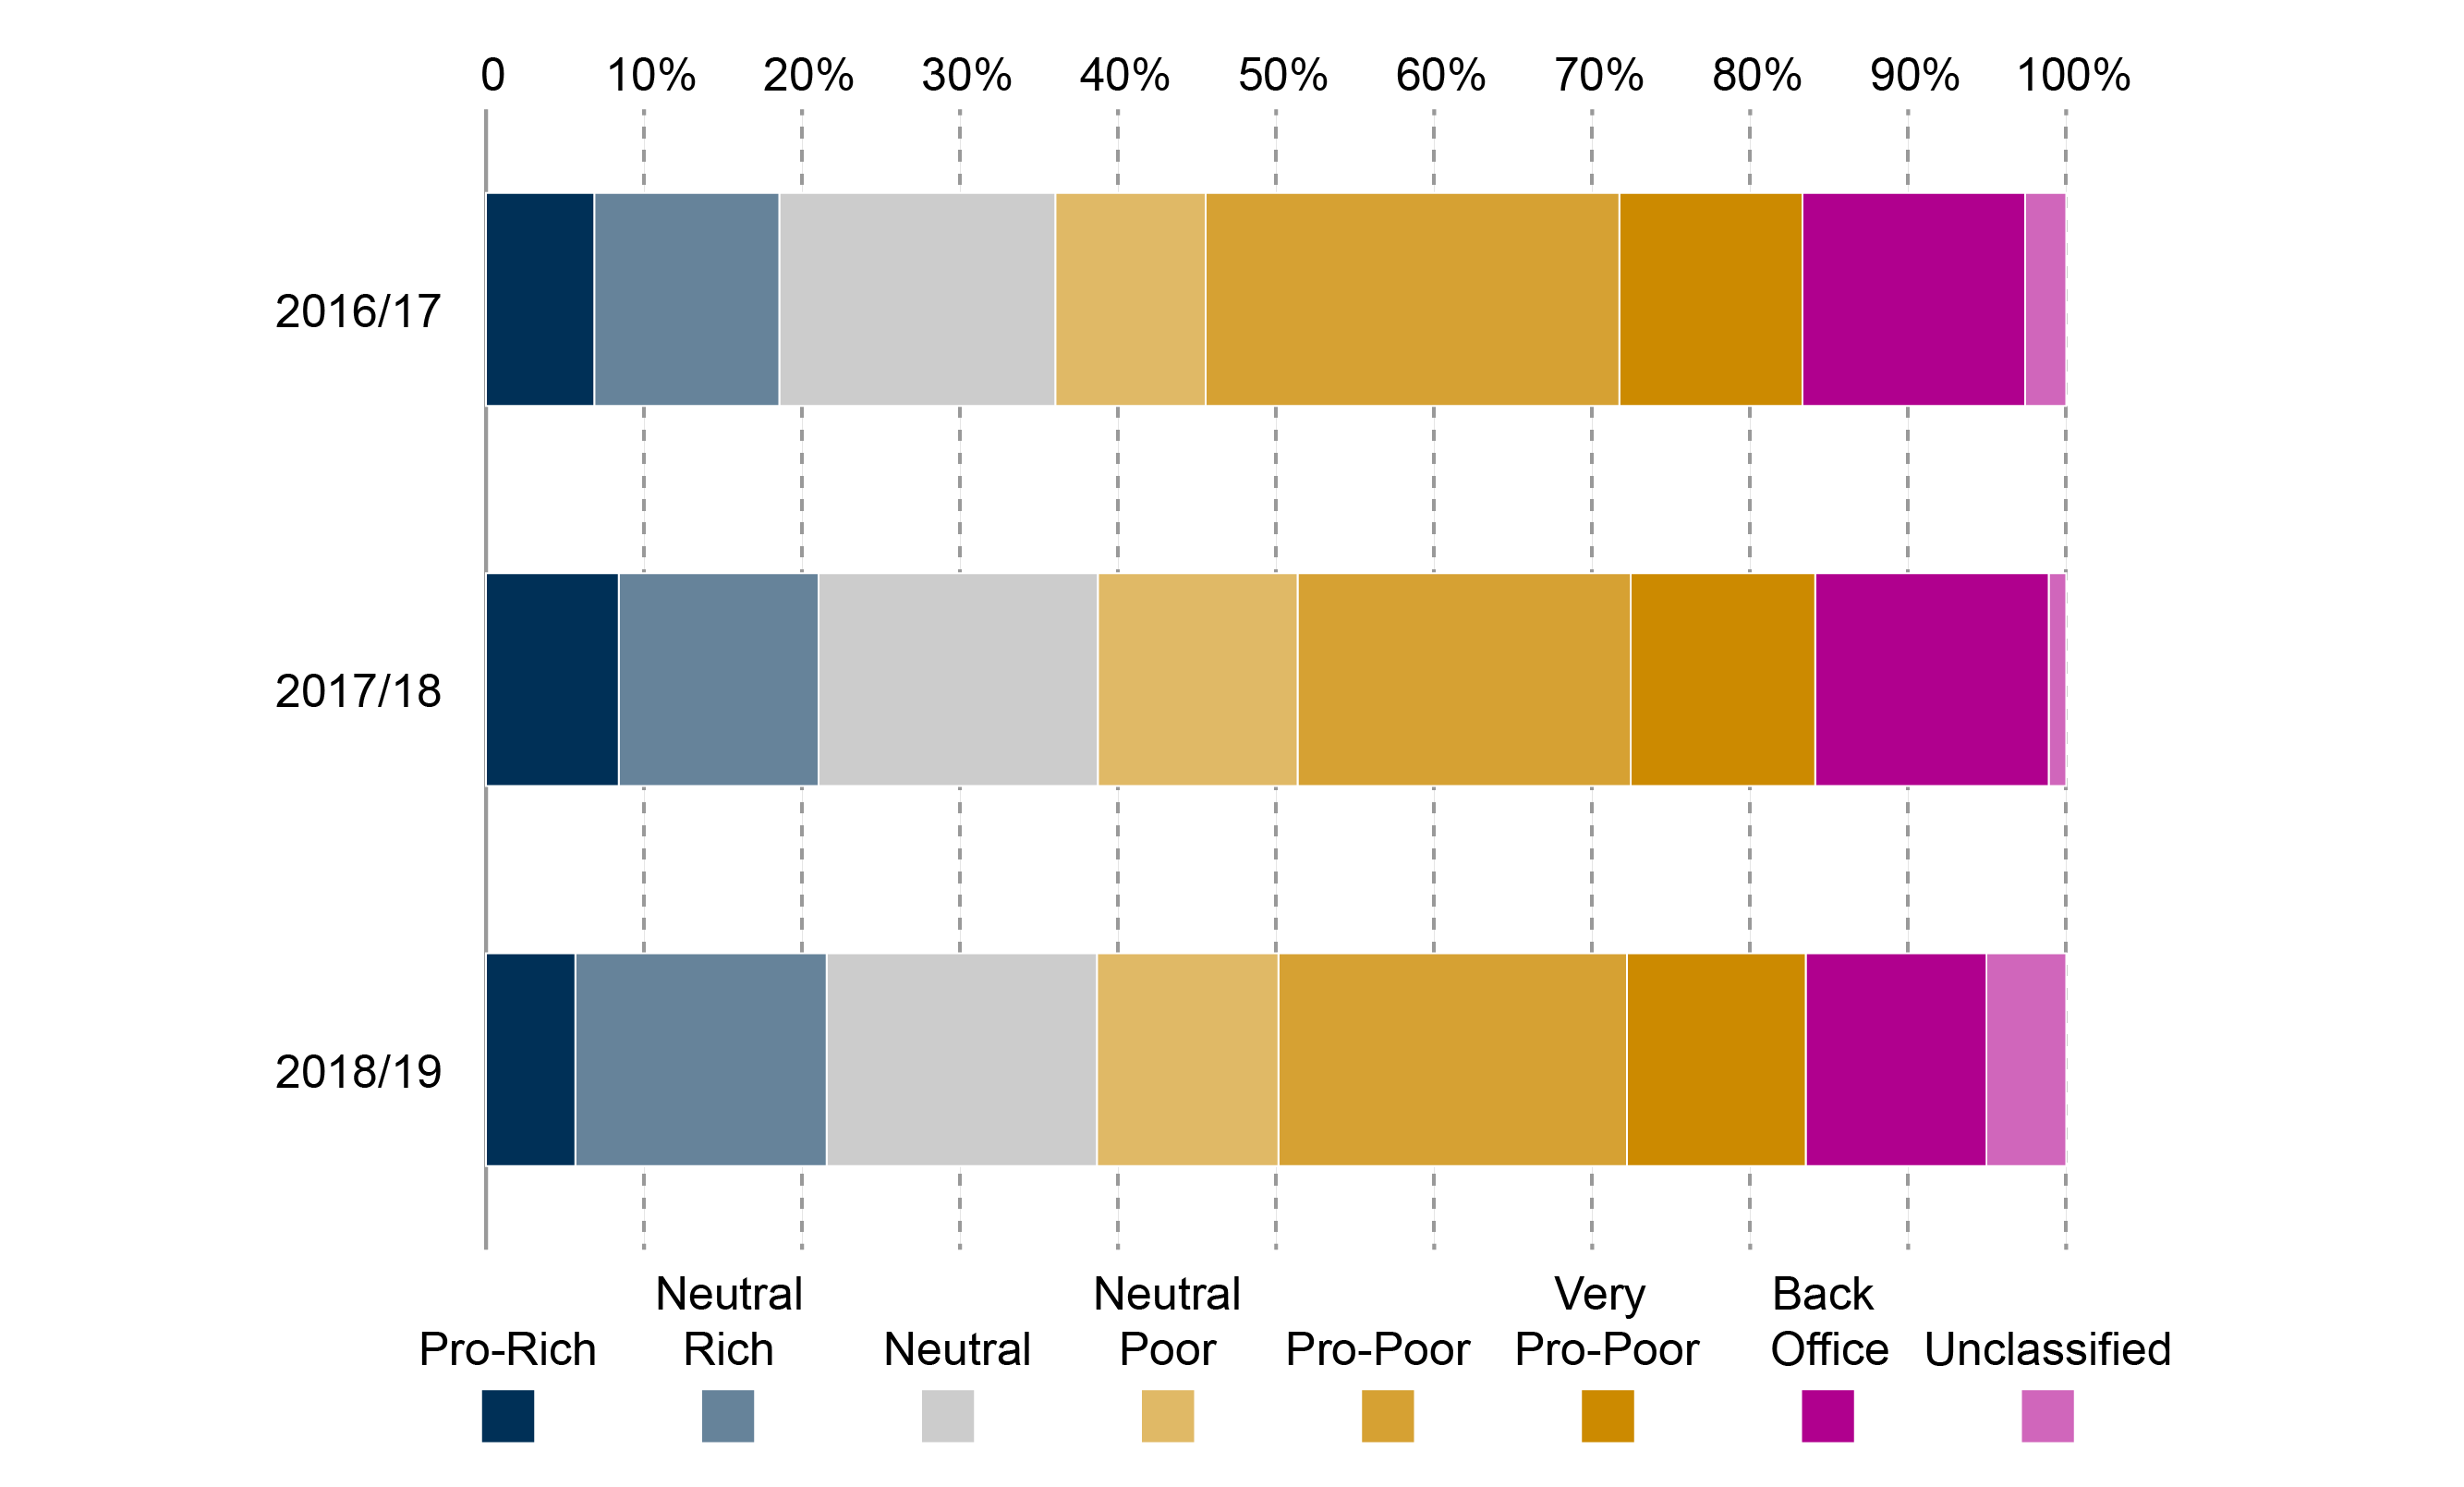
Figure 2 sets out the categorisation of savings for 30 of the 32 Scottish local authorities on the Pro-Rich/Pro-Poor framework.

Key points to note on savings:
The largest proportion of savings are made from Pro-Poor services (22%).
A similarly large proportion of savings made from ‘front-line' services also come from Neutral services (17%). This is unsurprising given the pattern of expenditure.
It is clear that the group of most deprived councils are deriving the largest proportion of their savings from Pro-Poor services (34%).
There is some change in the savings patterns between 2016-17 and 2018-19. Councils have decreased the proportion of savings from Pro-Poor services over time by 4 percentage points from 26% in 2016-17 to 22% in 2018-19.
Savings as a share of expenditure
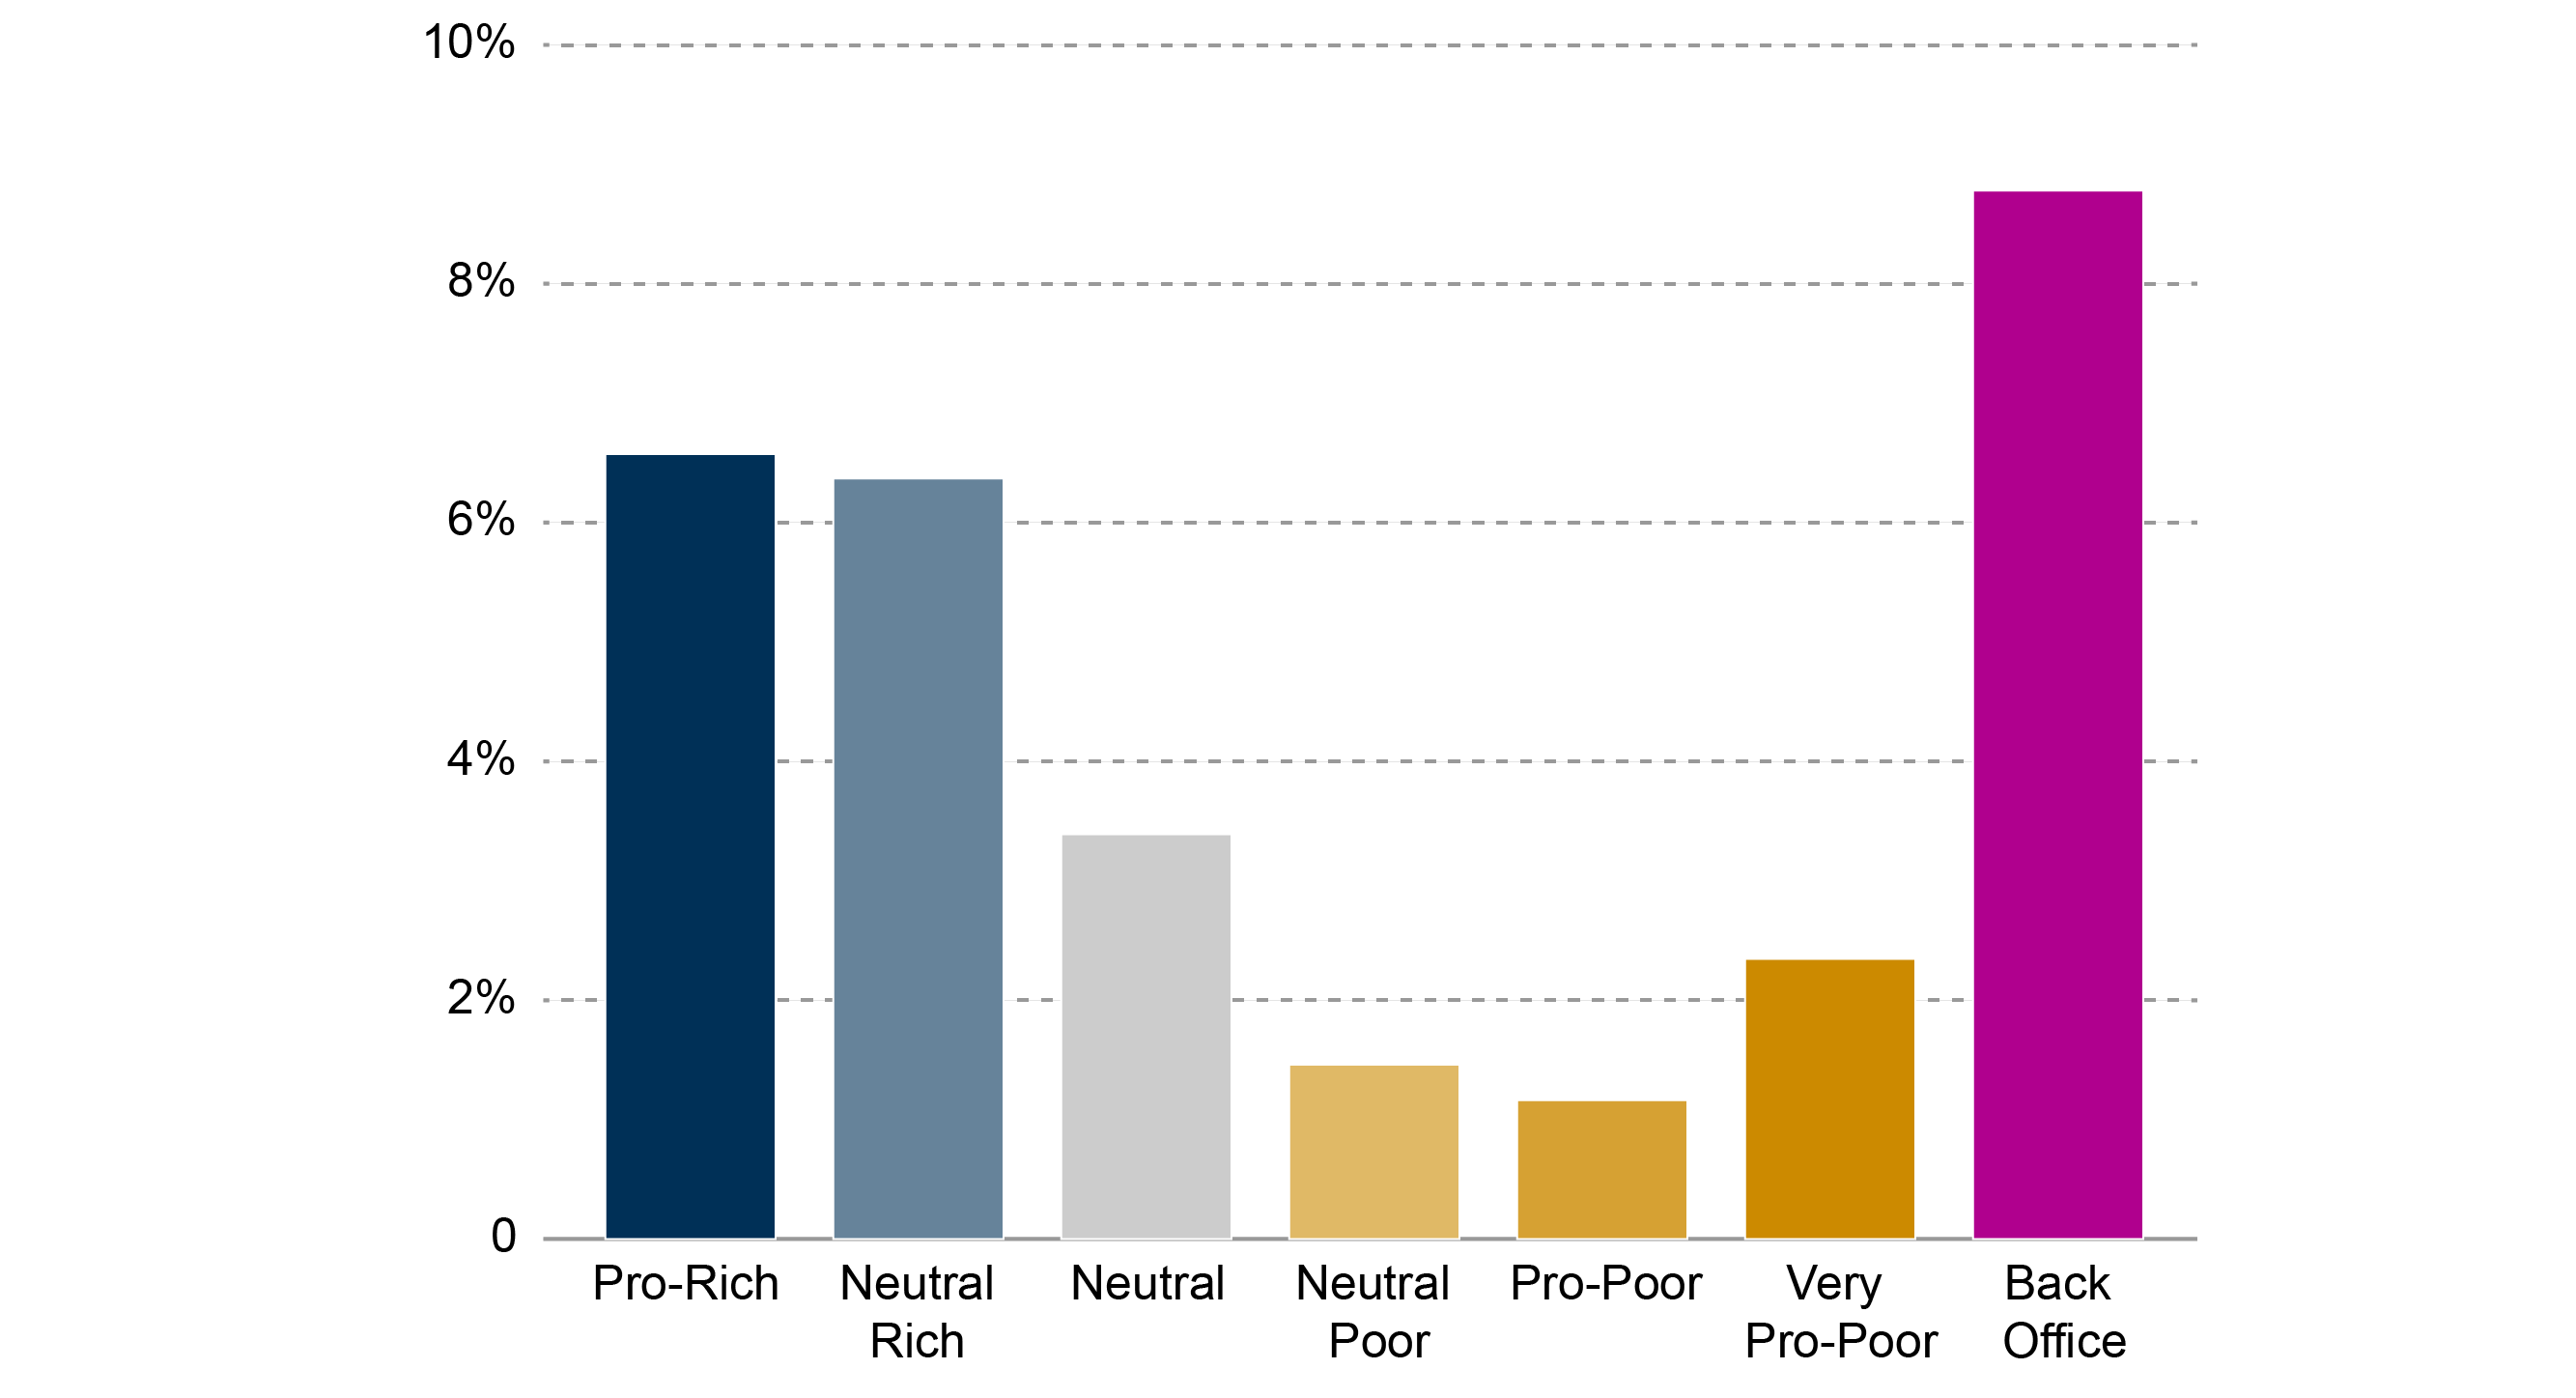
Figure 3 combines the information in Figures 1 and 2. Figure 3 shows savings as a percentage of expenditure on a whole of local government basis, or the "rate of savings".

Key points to note on the rate of savings:
Pro-Poor savings make up the largest absolute element of savings plans. However when these savings are calculated as a percentage of overall expenditure on Pro-Poor services, the rate of savings is only 1%.
Figure 3 also shows that, while savings from Pro-Rich services make a small contribution to overall savings, the level of planned expenditure on Pro-Rich services will be reduced by 7% in 2018-19.
Back Office function are being targeted for the highest rate of savings – 9%.
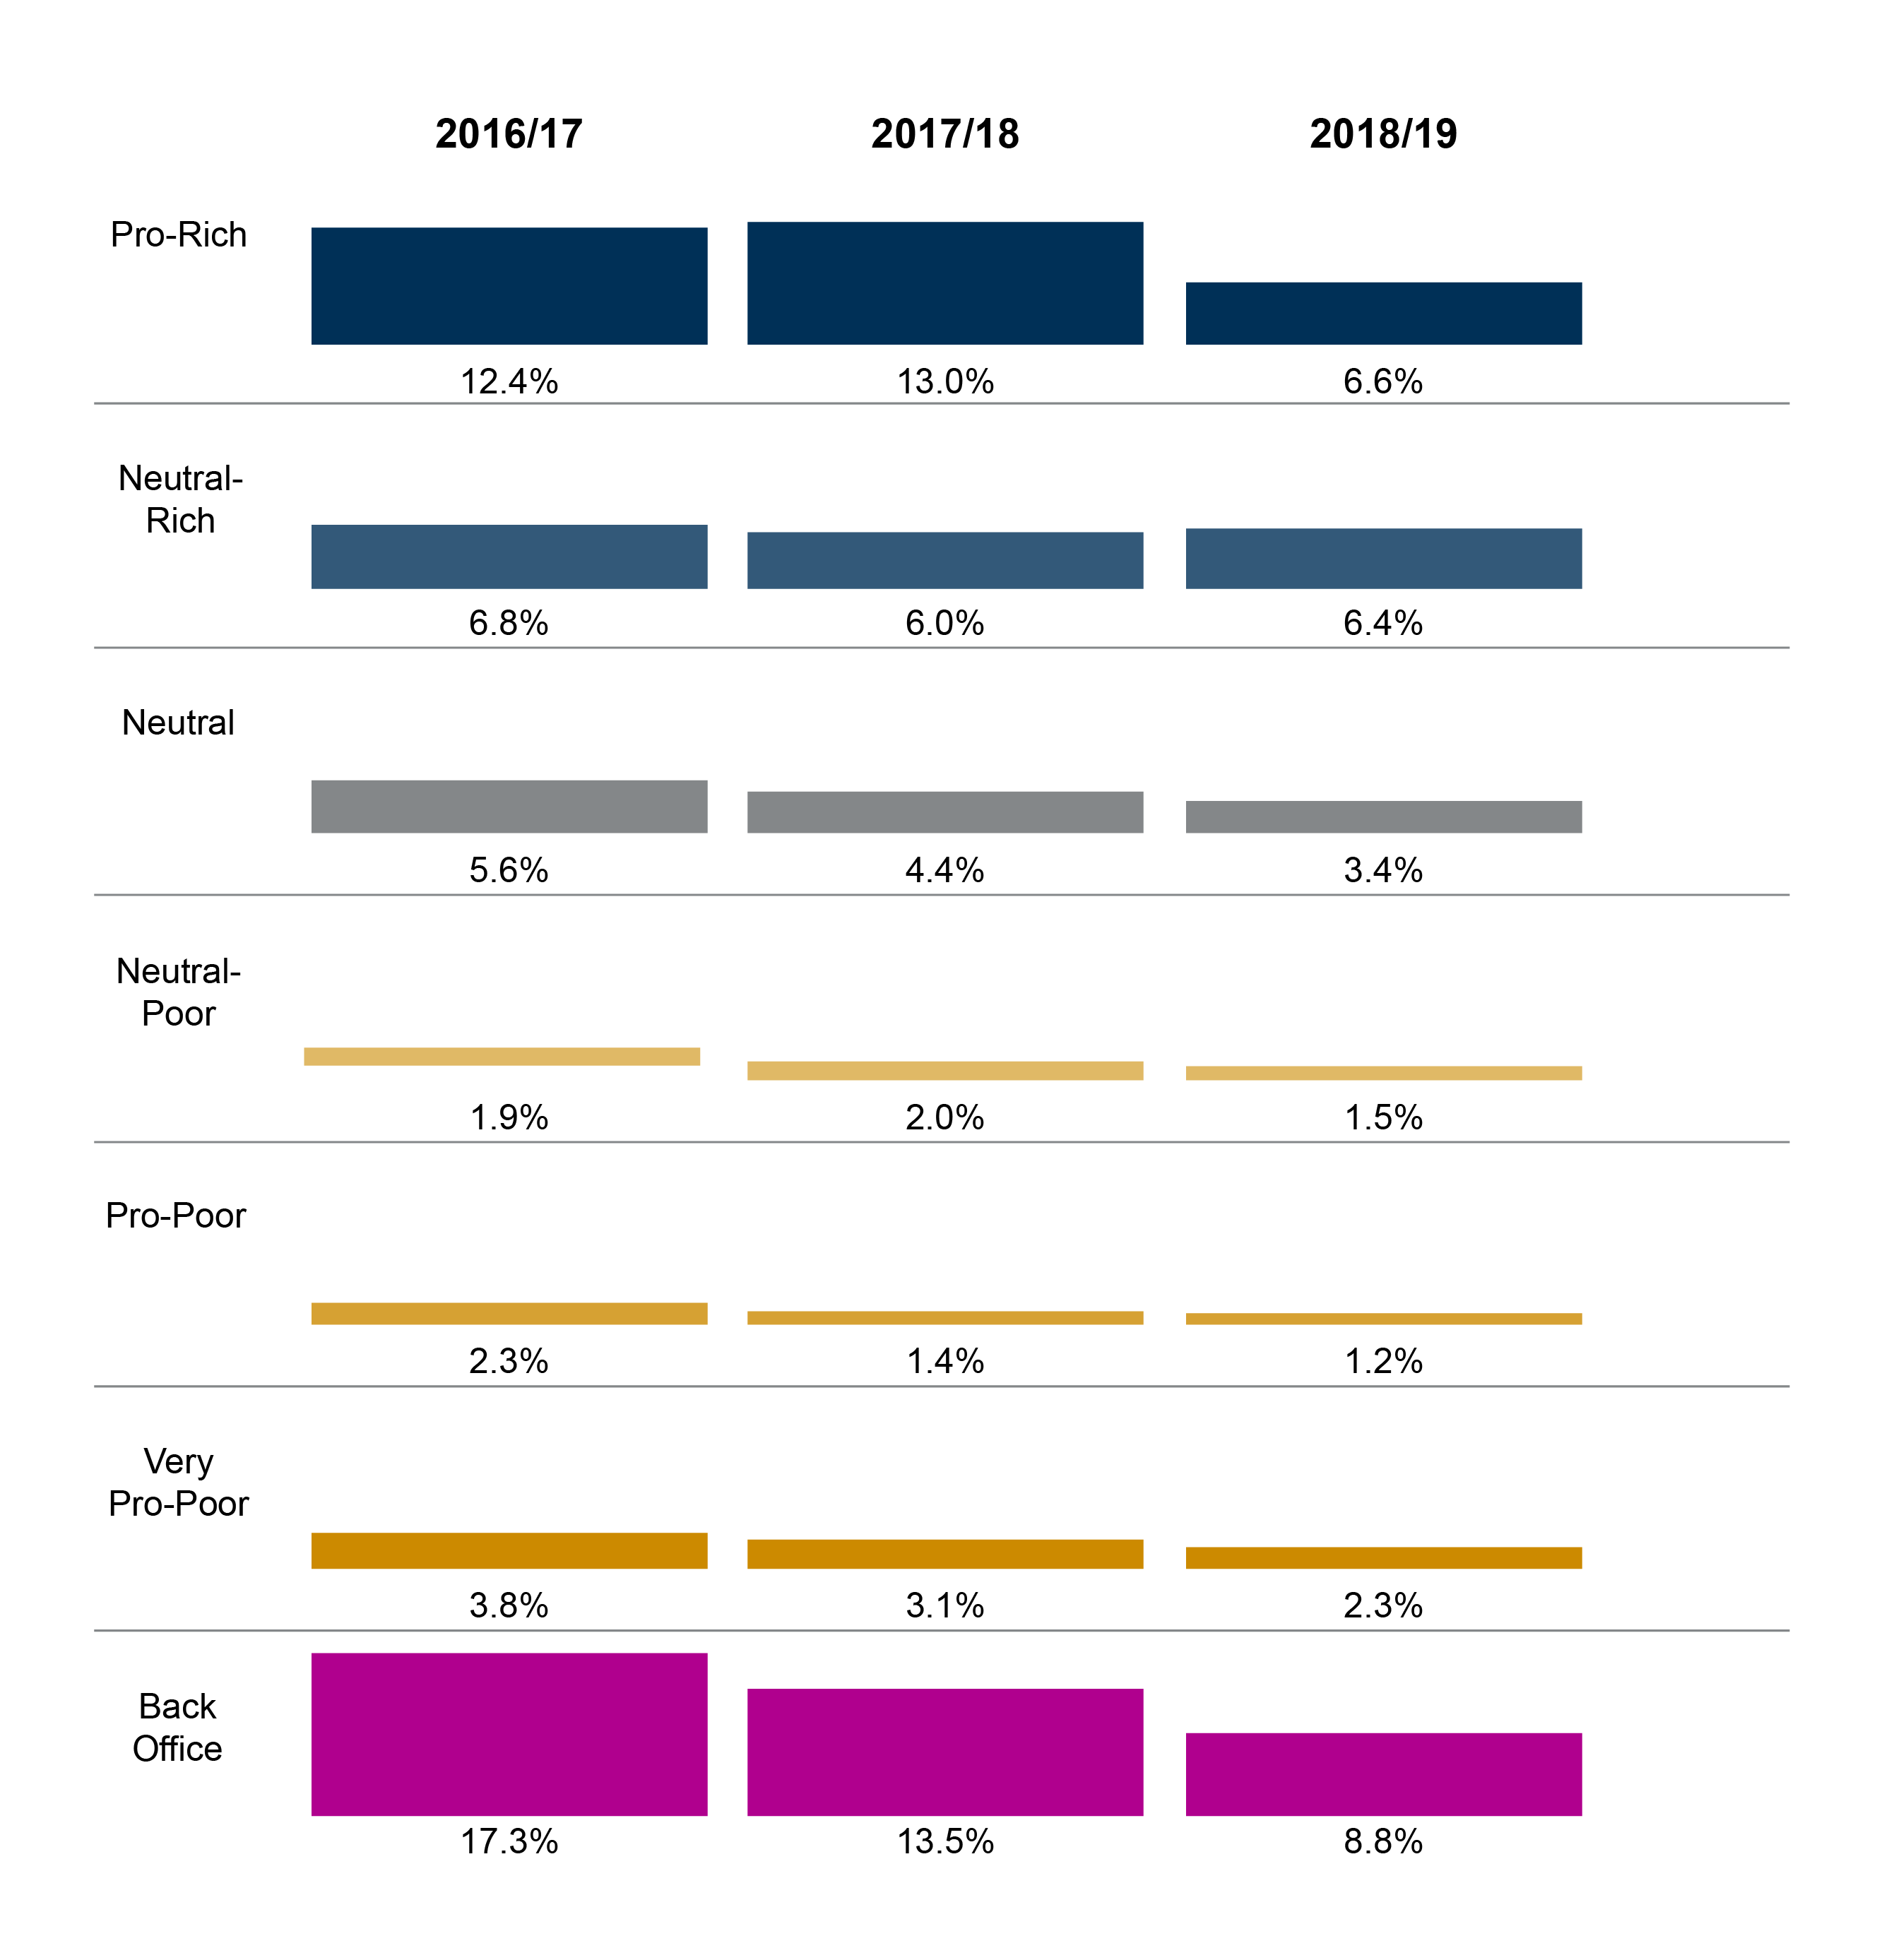
There has been a reduction in the level of savings made from Pro-Rich and Back Office services over the three years. These decreases partly reflect a shrinking of these service areas over time, leaving less capacity for savings, as well as the slight increase in Revenue budget for 2018-19.
Budget pressure
Analysis in this section uses an overall measure of "budget pressure" for each council, as another way to group similar councils together. This measure is produced by calculating each council's total savings requirement as a percentage of total expenditure. Councils are then ranked from highest percentage to lowest as a measure of pressure, and placed into four groups accordingly.
Key points to note on budget pressure:
Most councils are making similar decisions about how to distribute cuts across categories of services. Regardless of the level of budget pressure, the highest savings rate is for Pro-Rich or Neutral-Rich services. This rate then gets progressively smaller across Neutral, Neutral-Poor and Pro-Poor services. The rate then rises again for Very Pro-Poor services.
However, both Very Pro-Poor and Pro-Rich services are being reduced at a greater rate in authorities with the most budget pressure than in the rest. This suggests that budget pressure is a major driver of the rate of savings within service categories and between councils.
The pattern observed in 2016-17 and 2017-18 is still apparent, but not as strong. In other words, a high rate of saving is made from Pro-Rich services, with progressively smaller cuts to Neutral-Poor or Pro-Poor service categories, before rising for Very Pro-Poor services. This relationship weakens across the groups as budget pressure decreases.
Policy commitments and ring-fencing
As part of the Scottish Government's funding settlement, local authorities are expected to meet certain commitments in return for the full funding package. While certain specific commitments are funded as ring-fenced specific grants, other commitments which local authorities must agree to meet are funded from the general revenue budget. In this section we analysed data on the specific, ring-fenced grants from the Local Government Finance Circulars.
Key points to note from our analysis on ring-fencing:
The analysis could not quantify the impact of the other funding commitments local authorities are subject to. Therefore we could not explore how these commitments contribute to the decisions made by councils when planning service provision across all service areas.
Data from the Local Government Finance Circulars on ring-fenced grants for 2018-19 accounted for 3% of councils' expenditure in these service areas.
As we would anticipate, given the targeting of the Pupil Equity Fund, there is a strong relationship between ring-fencing and deprivation benchmarking group, with the higher the deprivation grouping the higher the ring-fencing.
Case studies
Three mini case studies of Dundee City Council, Fife Council and North Ayrshire Council identify key challenges faced by each in managing budget pressure over the past three years. The case studies involved interviews with senior officers in each council and analysis of documentary data.
The case studies explore the context in which each council operates, identifying key characteristics of size, location, level of deprivation, nature of the economy and demographic change. The policies and plans of each council are outlined, noting that all have prioritised tackling poverty and/or inequality via 'fairness' strategies, and have therefore tried to afford some protection to Pro-Poor services in their savings plans. The case studies then consider the challenges and constraints of delivering on this agenda which arise from local conditions and budget pressures.
About the project
This briefing is the result of a joint project between SPICe and a research team from the University of Glasgow and Heriot Watt University, funded by SPICe and the University of Glasgow. The briefing uses and builds on previous work done by the Universities, funded by the Joseph Rowntree Foundation (JRF).
The final phase of the project involved developing a "social impact tool" which allowed individual councils to assess the impact of their savings plans on different social groups. Following this, in 2016, SPICe worked with the research team to produce two briefings on the Social impact of the 2016-17 and 2017-18 local government budgets.1
This briefing also compares this years' findings to those from the corresponding briefings from 2016-171 and 2017-183 to show a three year trend, as well as exploring budgetary challenges and decisions in more detail with case studies.
Maria Gannon, from the University of Glasgow, worked in SPICe for three months in the summer 2018, supported by research intern Alex O'Conor, to complete the project. Professor Annette Hastings carried out the case study element of the briefing assisted by the team at University of Glasgow. The briefing was drafted by Maria Gannon and Ailsa Burn-Murdoch, Senior Researcher in SPICe, with assistance and advice from others listed on the front cover. Information about the authors and contributors is available later in this briefing. Jamie Swan, from the Parliament's Finance Office, provided invaluable technical support in creating the an interactive workbook for local authorities.
The briefing is intended to assist parliamentarians, local authorities and others to critically examine choices made by local government about where savings have been made as a result of financial settlements passed down to them by the Scottish Government.
The social impact tool
Development of the tool
Councils across the UK have had to make savings to their budgets since 2010. This is mainly due to reductions in government grants and increased demand for services caused by demographic and other pressures. Councils have also had to deal with public service reform and its impacts on their budgets.
These savings have been made in a range of ways which were captured in a framework which distinguished efficiency, investment (to save), and service retrenchment approaches. The original JRF-funded project examined the nature of the savings via this framework. It also developed a second framework designed to analyse the extent to which these savings had a disproportionate impact on poorer groups of service users. This second framework was based on the fact that, while councils provide services which benefit everyone to some extent, some services are used more often or more intensively by people with low incomes or living in disadvantaged circumstances. The service classification used throughout this briefing grew from this work and a detailed description of this framework is included in the original study report1.
Service classification – what makes a service Pro-Rich, Neutral or Pro-Poor?
The classification of services in this briefing is based on a number of research studies conducted over the last 20 years by Professor Glen Bramley. The classification has been used to inform the previous work for the Joseph Rowntree Foundation, on which this briefing is based, and was updated in 2017.
The social impact tool classifies council services into six categories on a scale between "Pro-Rich" and "Very Pro-Poor". "Pro-Rich" implies the service is used disproportionately by more affluent households. It does not imply that only more affluent households use the service. "Pro-Poor" implies that the service is used disproportionately by lower income households. But again, it does not imply that only lower income households use the service.
In the classification, "more affluent" is defined as "higher income, higher social class, or living in a less deprived neighbourhood"; and "poorer" is defined as "lower income, lower social class or living in a more deprived neighbourhood".
The term "used more" is defined as "household being more likely to use the service, or to use it more frequently".
The research which led to the creation of the service classification combined data from service administration with data from several national surveys of service use. It analysed these data in relation to several measures of individual socio-economic status as well as small area-based measures from the English and Scottish Indices of Multiple Deprivation. The analysis therefore represents the views of tens of thousands of service and survey respondents on public services usage. Full detail on all of the sources used for this exercise can be found in the Technical Report1 to the 2015 Joseph Rowntree paper.
Some services are classed as "Back Office" functions and these are outwith the classification since they are non-service specific and relate to more generic services and functions such as Human Resources, ICT and democratic functions. The analysis also provides details of the "Non-service related" expenditure and savings made by local authorities – this includes items like as debt management.
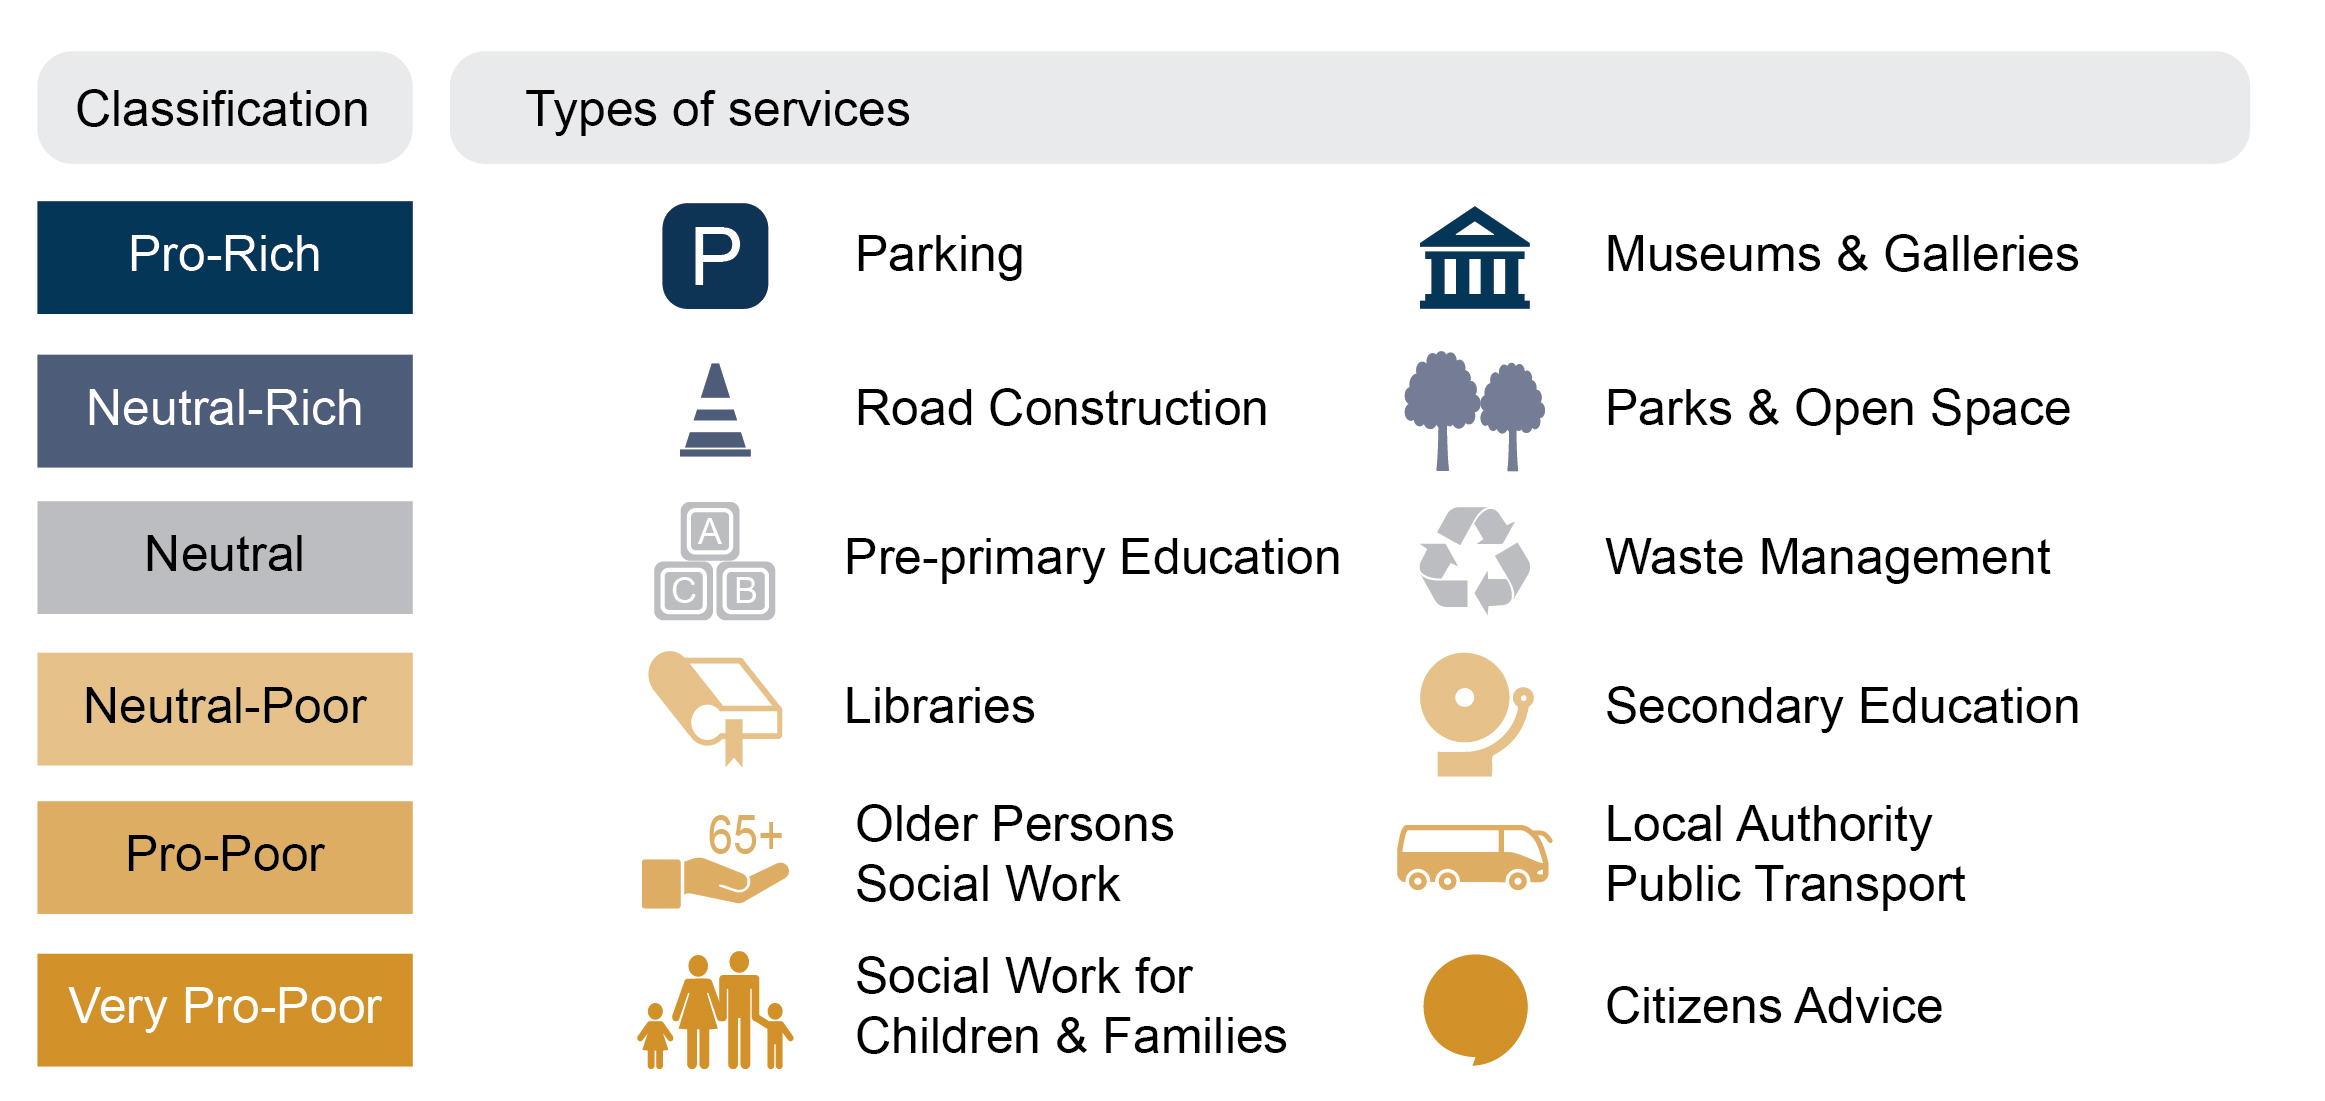
Annex A to this briefing contains a full breakdown of how each service area is classified. Some examples of typical classifications are set out below:
Pro-Rich services are used more by better-off groups. Includes car parking, and museums and galleries.
Neutral-Rich services are used slightly more by better off groups. Includes road construction, parks and open spaces.
Neutral services are used fairly equally by groups across the socio-economic spectrum. Includes pre-school education and waste management.
Neutral-Poor services are used a little more by poorer groups. Includes libraries and secondary education.
Pro-Poor services are used more by poorer groups. Includes older persons' social work and local authority-run public transport.
Very Pro-Poor services are used much more by poorer groups. Includes social work services focussed on children and families, and citizens' advice services.
A further technical note on the classification is available on request from SPICe.
Data sources and methodology
Data sources
The key source data for assessing expenditure and savings plans is set out in the following two paragraphs.
Expenditure
The key source for assessing local government planned expenditure in 2018-19 is the Scottish Government Statistics publication, Provisional Outturn 2017-18 and Budget Estimates 2018-191. This data is collected through the Provisional Outturn and Budget Estimates (POBE) return from local authorities. It covers data on "Net Revenue Expenditure" for services provided by Scottish local authorities. "Net Revenue expenditure" is local authority expenditure that is financed from general Revenue funding, Non-Domestic Rates, Council Tax and balances, and so does not include other sources of income, like fees and charges.
Savings plans
This project has used published local authority budget documents for 2018-19 to assess local authority savings plans. Most were available from council websites, and some additional information was provided by council staff. A full list of sources is provided in Annex C.
Methodology
A description of the methodology used to assess all local authority savings plans against the Pro-Rich/Pro-Poor framework is set out in Annex D in the previous briefing1, this includes an explanation of the mapping of savings to service areas, and a worked example of how this would be collated from information contained within budget documents
This process meant that each local authority's savings plans could be classified according to the Pro-Rich/Pro-Poor categories. The savings were then compared to the expenditure data by Pro-Rich/Pro-Poor category to give the rate of savings planned from each service category.
Local government budget - context
Previous SPICe briefings (see Related briefings) discuss longer term, historic local government financial information. This section of the briefing summarises the budget position as well as information on Council Tax income (included within "Net Revenue Expenditure"). Further detail can be found in Local Government Finance: facts and figures 2013-14 to 2018-191.
Local government settlement 2015-16 to 2018-19
Following two years in which the Scottish Government's Revenue settlement for local authorities fell significantly, the 2018-19 settlement showed a reversal in trend, with the Revenue budget increasing, albeit only very slightly, for the first time since 2015-16.
The 2018-19 settlement is explored in detail in the SPICe briefing on the Draft Budget 2018-19 and provisional allocations to local authorities1. At Stage 1 of the Budget Bill the Scottish Government announced that £34.5m of additional funding for 2018-19 would be paid in 2017-18. This £34.5m is part of the 2018-19 settlement, but as it is being funded from Scottish Government underspends in 2017-18 it was physically paid on 28 March. SPICe blogged about these changes at the time, and released a final blog on the local government settlement once the these were made available.
Table 1 below sets out the most up to date allocations to local authorities, as in Finance Circular 4/20182, which was published in March 2018, after the Parliament agreed the Local Government Finance Order 2018, compared to the equivalent figures from 2015-16 (Local Government Finance Circular 2/2015).
| £m | 2015-16 (cash) | 2018-19 (cash) | Cash change | Cash change % | 2015-16 (real, 2018-19 prices) | Real change | Real change % |
|---|---|---|---|---|---|---|---|
| Total Revenue | 9,994.1 | 9,779.9 | -214.2 | -2.1% | 10,599.0 | -819.1 | -7.7% |
| Distributable Revenue Funding | 9,871.0 | 9,724.3 | -146.8 | -1.5% | 10,468.5 | -744.2 | -7.1% |
| Distributable Revenue Funding 2017-18 (to be included in funding for 2018-19) | 34.5 | 34.5 | 0.0 | 34.5 | |||
| Total Revenue plus Distributable Revenue Funding 2017-18 | 9,994.1 | 9,814.4 | -179.7 | -1.8% | 10,599.0 | -784.6 | -7.4% |
| Capital Funding | 856.3 | 876.4 | 20.1 | 2.3% | 908.1 | -31.8 | -3.5% |
| Total Funding | 10,850.4 | 10,690.8 | -159.6 | -1.5% | 11,507.1 | -816.3 | -7.1% |
The total allocation for local government in 2018-19 is £10,690.8 million, which represents a real terms decrease of 7.1% on the 2015-16 settlement, at the same stage of the Budget process. Updated figures can be broken down as follows-
Total Revenue Funding decreases in cash terms by 2.1% (-£214.2 million), or -7.7% (-£819.1 million) in real terms between 2015-16 and 2018-19.
If the additional £34.5 million funding is included, this Revenue Funding decreases by 1.8% in cash terms (-£179.7 million), or by -7.4% in real terms (-£784.6 million).
Once Capital funding is taken into account, Total Funding for local authorities decreases by 1.5% in cash terms (-£159.6 million), or -7.1% (-£816.3 million) in real terms.
In summary, whilst the 2018-19 settlement represented a slight increase in Revenue funding for local authorities, in the period since 2015-16, revenue funding for local authorities has fallen significantly in real terms.
Council tax income
Aside from government grants and NDRI, the other main element that funds Net Revenue Expenditure is Council Tax.
The SPICe 'facts and figures' briefings on local government finance published in 20171 and 20182 explored the impacts of Council Tax reform income on individual local authorities. This highlighted the Council Tax 'landscape' of Scotland, in which certain local authorities have higher proportions of low-band properties, and greater numbers of recipients of Council Tax reduction, whilst others tend to have higher levels of Band E-H properties.
The SPICe briefing, Local Government Finance: The funding formula and local taxation income3, sets out the wider context of Council Tax, alongside Revenue Funding and Non-Domestic Rates income.
Findings: Analysis of local authorities' savings plans 2018-19
Introduction
This part of the briefing analyses the savings plans of Scotland's councils. It is in four sections.
Section 1 analyses the current expenditure patterns of the councils against the Pro-Rich to Pro-Poor categorisation.
Section 2 analyses the savings patterns by these categories.
Section 3 assesses the rate of savings – the savings as a share of expenditure for each category of service.
Section 4 analyses budget pressure.
The analysis is presented on a whole of local government basis. The savings plans for all 32 councils were analysed to produce the 2018-19 findings.
For this version of the briefing, we have provided the data for the past three years for all local authorities in the form of an interactive Excel workbook. This allows authorities to access their own data, benchmark themselves against other councils and produce charts and analyses which may be helpful for budget planning or monitoring. These data can be found on the SPICe webpages. We wish to note our thanks to Jamie Swan from the Scottish Parliament's Finance Office for producing the interactive workbook. A further version of the workbook, with additional functionality, will be published in early 2019.
The chart below, based on information in the Service Classification section above, provides a colour coded reference point and examples for the following charts and graphs.
Section 1: Local authority expenditure
Local authority expenditure 2018-19
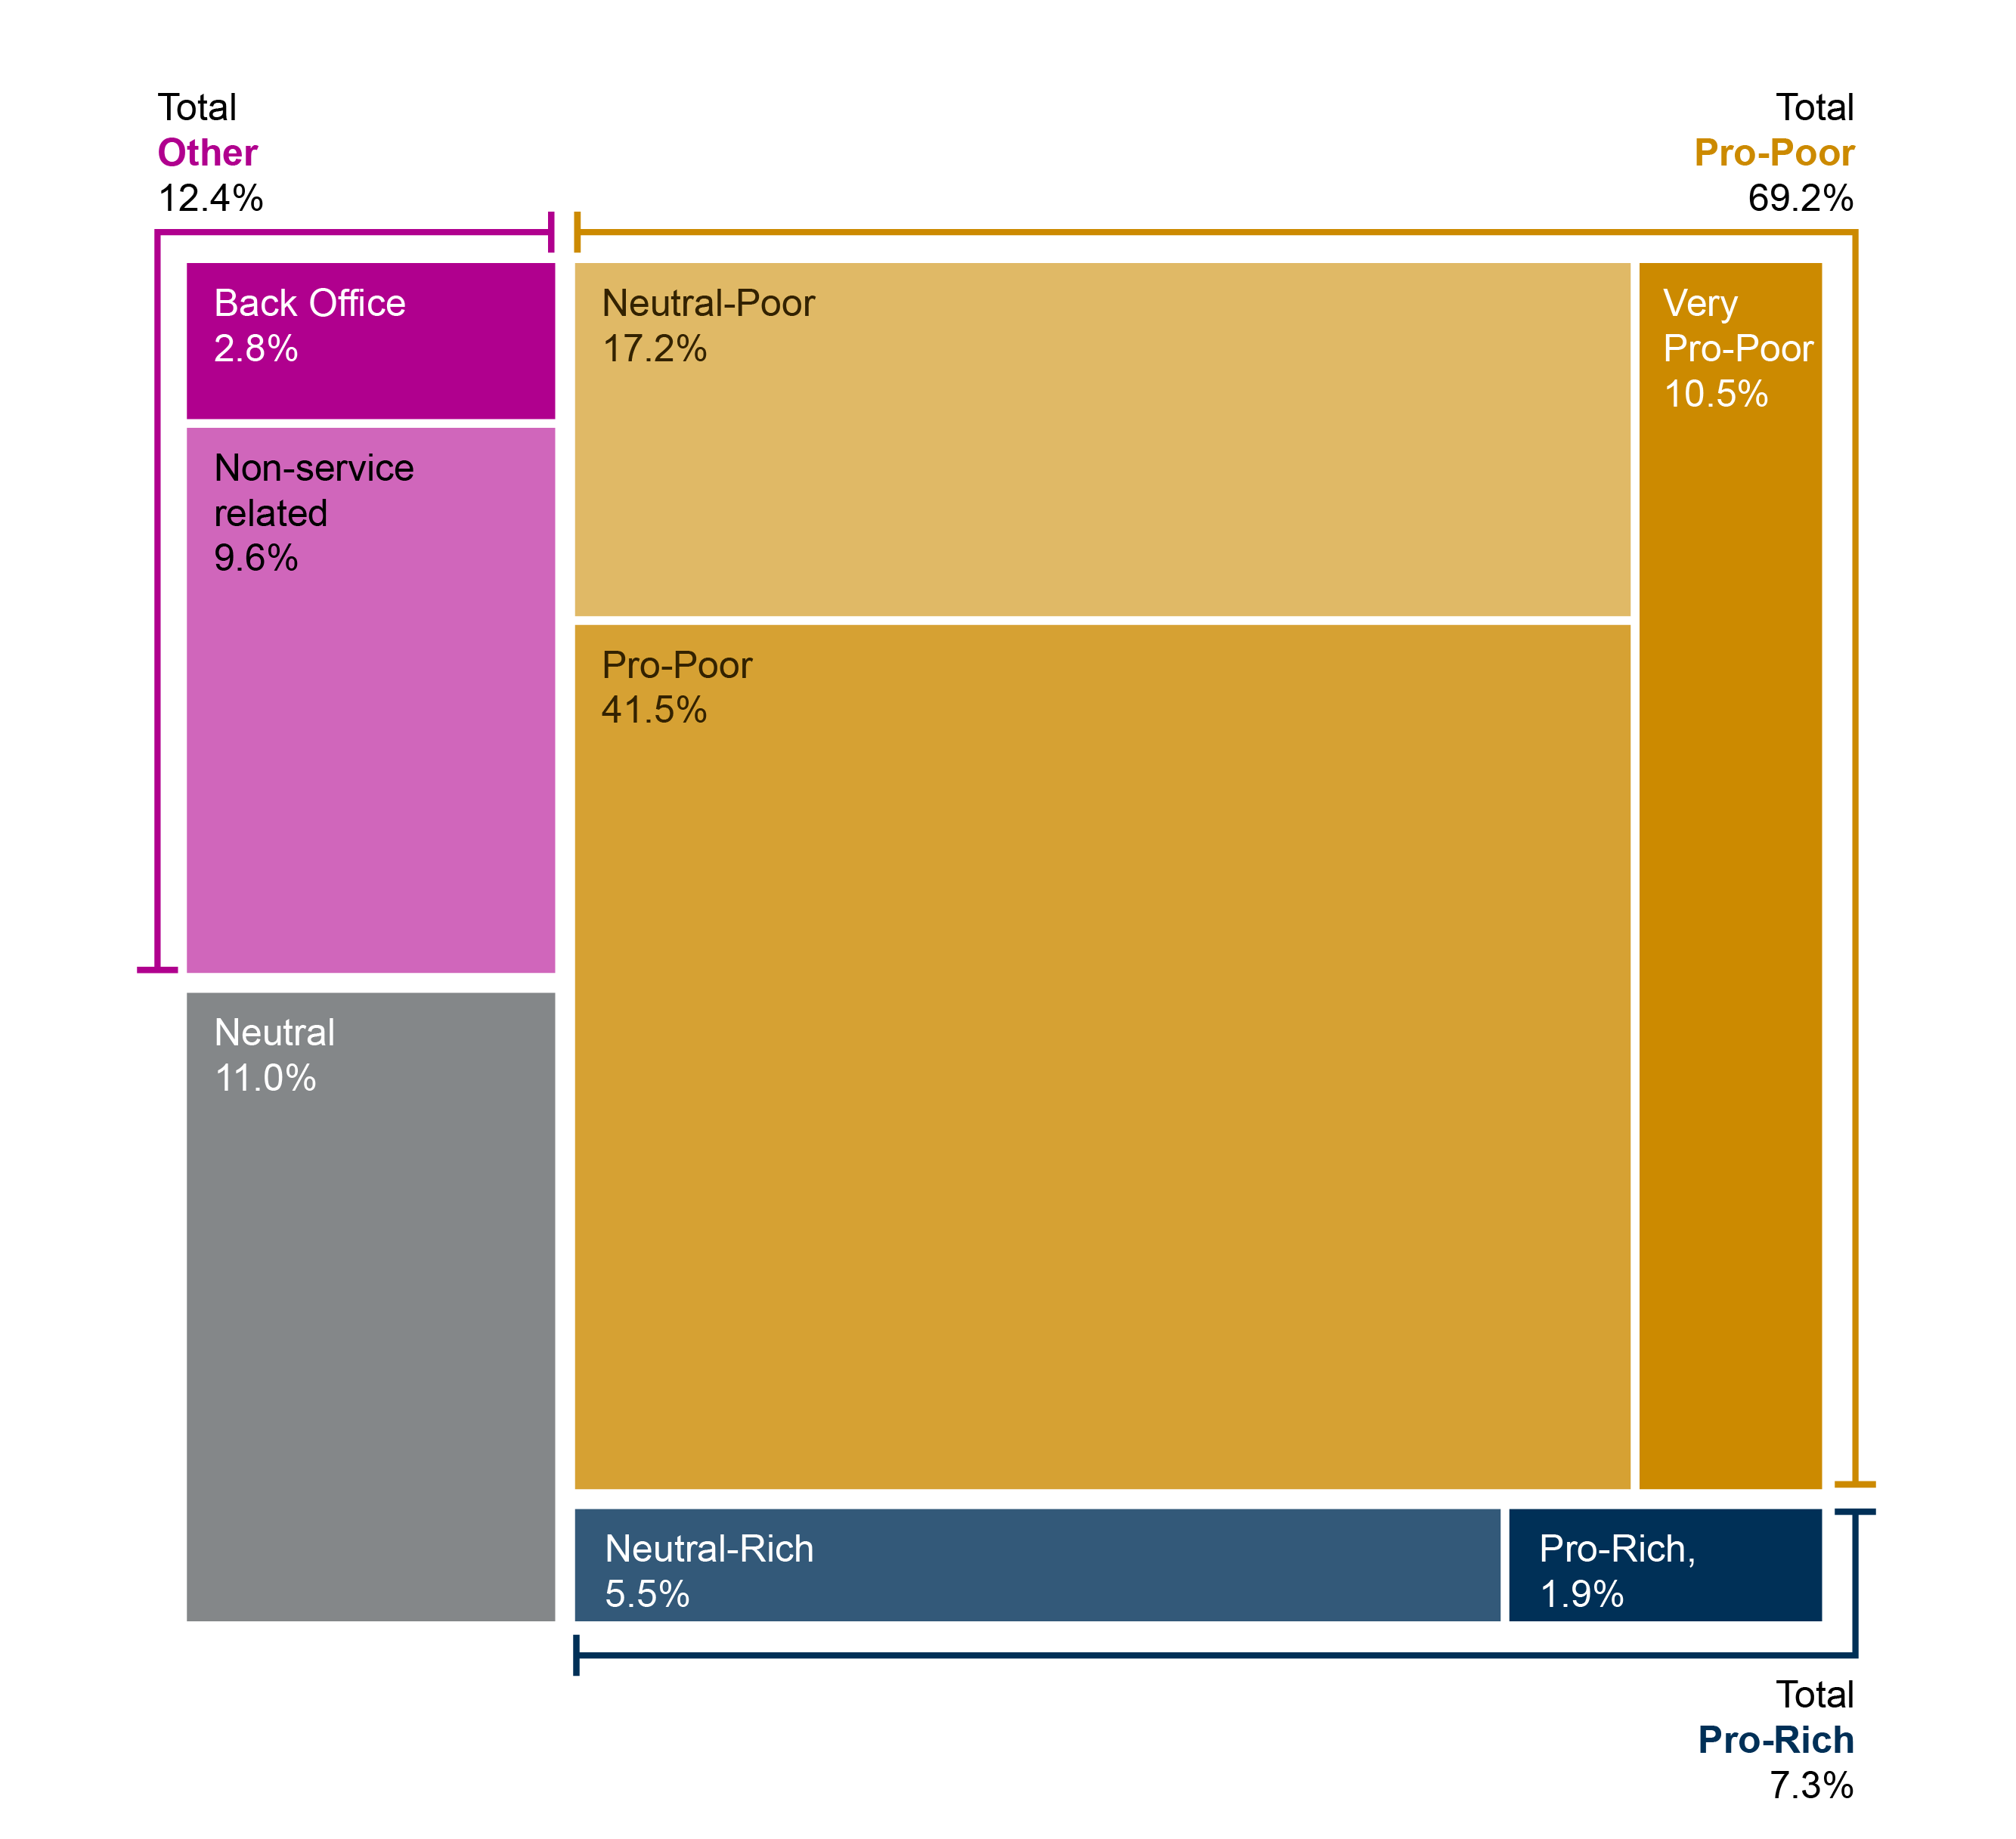
Figure 5 below shows the distribution of local authority expenditure across the Pro-Rich/Pro-Poor framework.
The largest area of local government spending is on Pro-Poor services. Over two thirds of Net Expenditure (69%) is on Neutral-Poor, Pro-Poor and Very Pro-Poor services combined. 11% of expenditure is on the Neutral services used fairly evenly across the socio-economic spectrum. Only 2% of expenditure is on services which are Pro-Rich, and 5% on Neutral-Rich services.
This demonstrates that, as they attempt to make savings, councils will have little option but to make the majority of their savings from services which are used more by lower income groups.
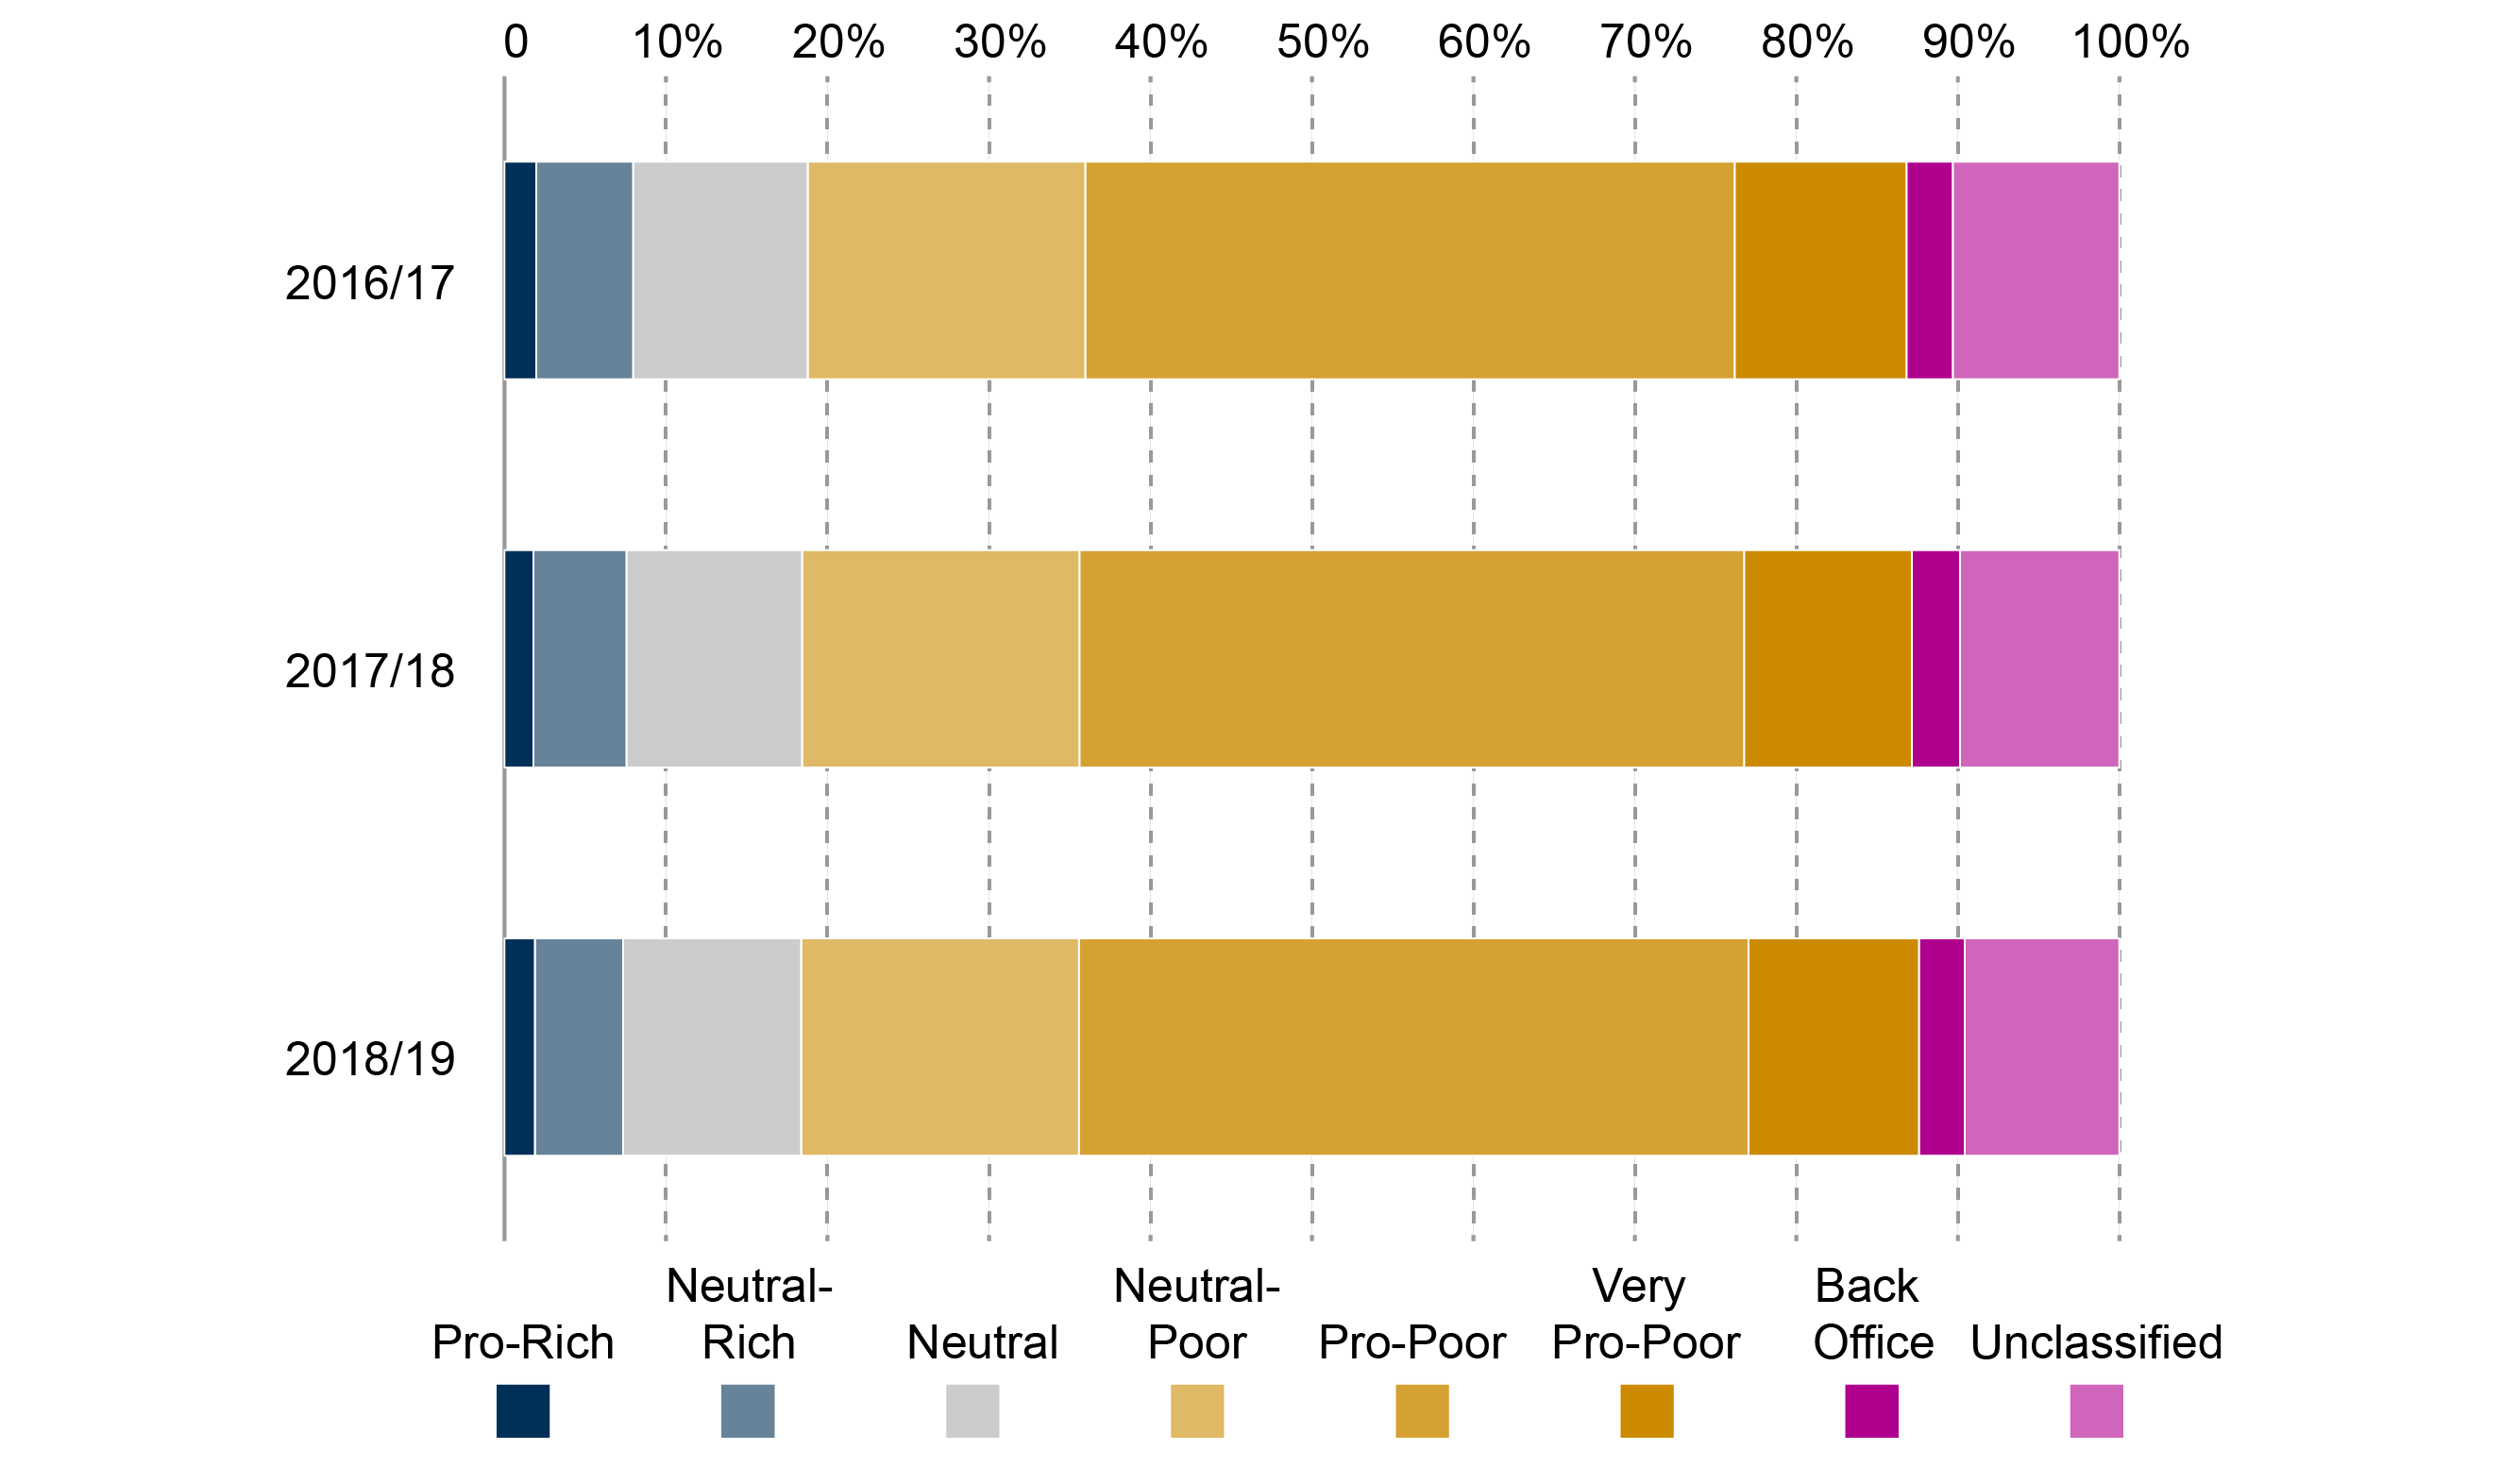
Local authority expenditure 2016-17 to 2018-19
There has been very little change in spending patterns between 2016-17 and 2018-19. There was a minor increase in expenditure on Pro-Poor services (up by 1% point). The sum of Neutral Poor, Pro-Poor and Very Pro-Poor expenditure in 2016-17 accounts for 68% of local authorities' spending, and in 2018-19 the figure is 69%. This emphasizes that services relied upon by more deprived groups continue to be the focus of the majority of local authority service expenditure. At the other end of the spectrum, the spending on Pro-Rich services has remained at around 2% over the three years.
Section 2: Local authority savings plans
Local authority savings 2018-19
This section looks at local authorities' savings for 2018-19 and how they are distributed across the different service categories. Figure 8 shows the data for all Scottish local government.
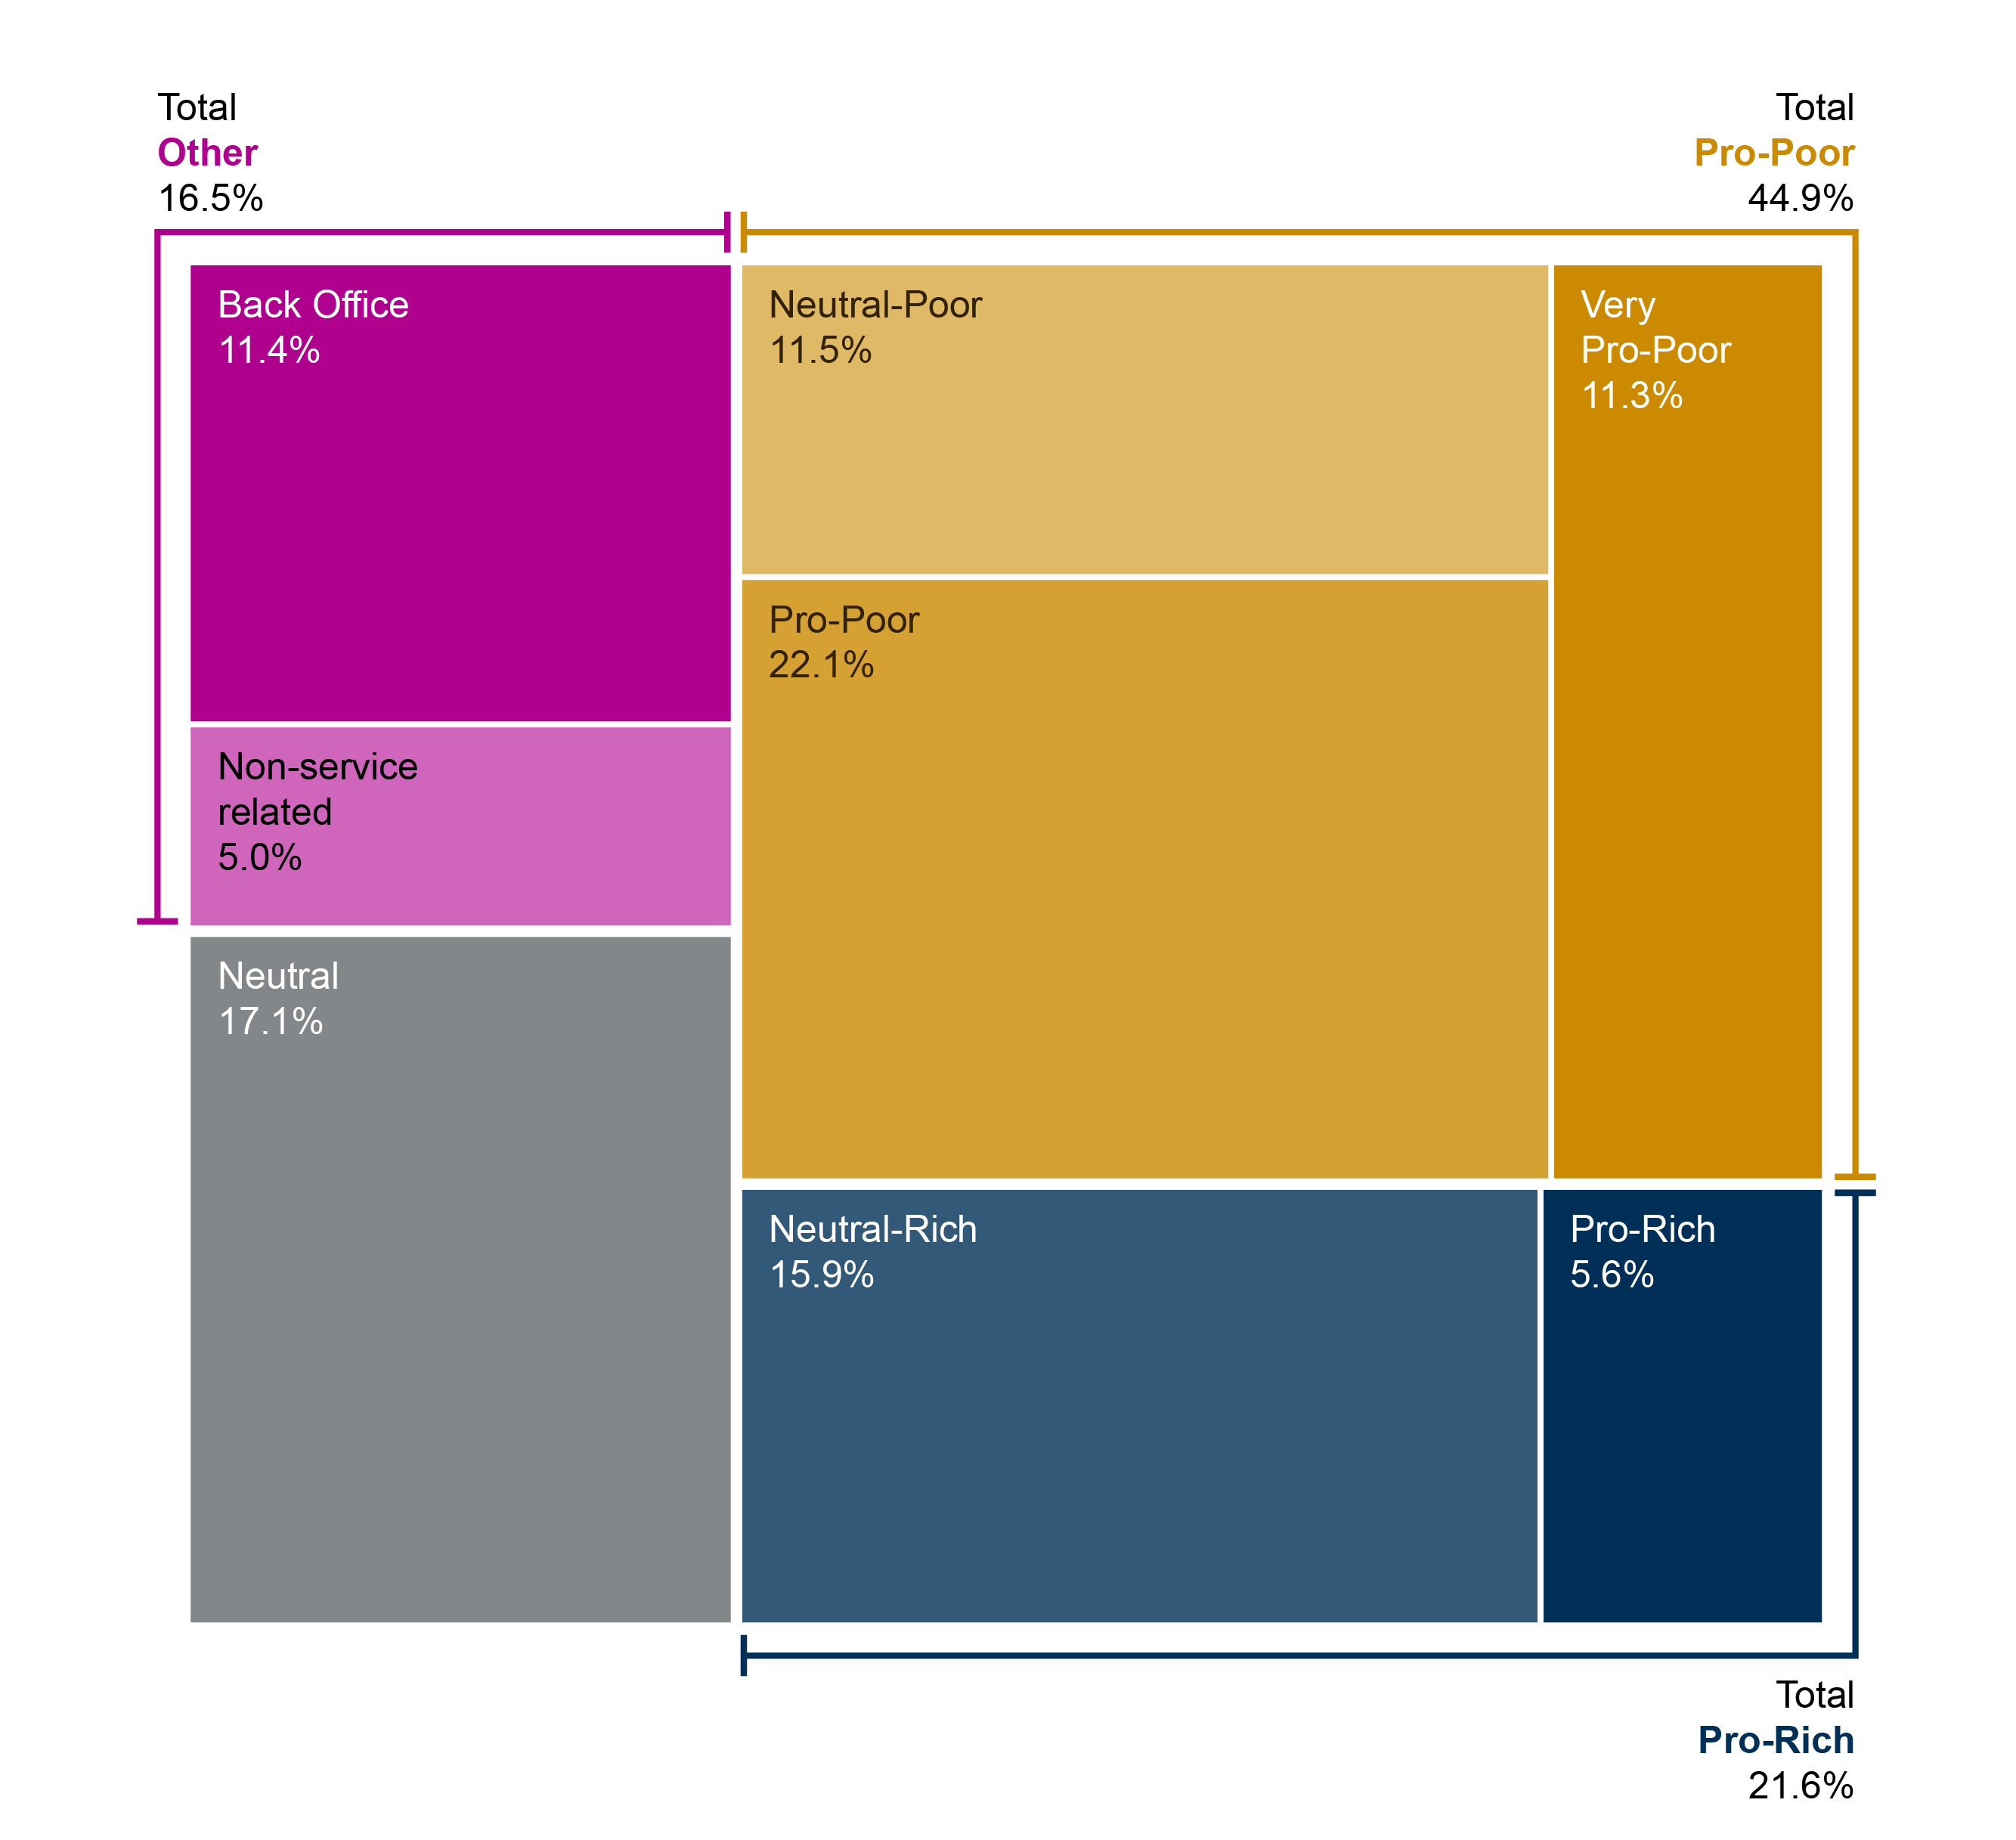
As expected the bulk of savings are being made from the services which account for the bulk of councils' expenditure - and these are used more by lower income groups. Thus Scottish local authorities made 22% of their savings in 2018-19 from Pro-Poor services. When the savings made from Neutral Poor, Pro-Poor and Very Pro-Poor services are taken together, it shows that just under 45% of local authorities' savings are from services relied upon more by lower income groups.
Savings from Neutral services such as waste management or street cleaning are the next largest category after Pro-Poor services - at 17% of all savings. Councils are also making considerable cuts to Back Office services (11%). A smaller proportion of savings (6%) come from Pro-Rich services. A third of all councils are making savings from 'non-service related' items, an average of 5% of their overall savings.
Local authority savings 2016-17 to 2018-19
When we examined local authorities' savings plans across the service categorisation over the three years we found that councils have decreased the proportion of savings from Pro-Poor services over time by 4 percentage points from 26% in 2016-17 to 22% in 2018-19. The proportion of savings from Back Office functions has also decreased from 14% to 11%. In 2016-17 the proportion of savings from Neutral-Rich services such as road maintenance was 12%. By 2018-19 councils are making 16% of their savings in this service area. The proportion of savings from Pro-Rich and Very Pro-Poor services have not changed much over time, both decreasing by 1 percentage point.
Section 3: Local authority savings as share of expenditure
Local authority savings as a share of expenditure 2018-19
In this section, the two previous sets of data are combined to show how the levels of savings compare to levels of expenditure. The Scotland-wide results are shown in Figure 11 below.
This measure is important in that it shows the “rate of savings” planned for each service category. However, the analysis shown in the previous section - the proportion of the overall savings required by councils coming from Pro-Rich to Pro-Poor service categories - is also important. It draws attention to the scale of savings being made, and therefore to the loss of resource to these categories of council services.
The difference in the two measures is clear when we look at Pro-Poor services. The analysis in the previous section showed that, Pro-Poor savings make up a large proportion of savings plans.
But when this is calculated as a percentage of the overall expenditure on Pro-Poor services, it shows that Pro-Poor services are only being reduced by 1%.
It also shows that, while savings from Pro-Rich services make a small contribution to overall savings, the rate of savings from Pro-Rich services is 6% in 2018-19.
Local authority savings as a share of expenditure 2016-17 to 2018-19
From Figure 13 it is clear that cuts to Back Office functions have decreased over the three years - from 17% in 2016-17 to 9% in 2018-19. There is also a reduction in the level of savings made from Pro-Rich services from 12% in 2016-17 to 7% by 2018-19. There are more minor decreases in savings from both Neutral and Very Pro-Poor services. These decreases, particularly the larger ones, could possibly reflecting a shrinking of this service area over time thus leaving less capacity for savings. However we should bear in mind that some of this reduction in savings could be due to the slight increase in the local authority Revenue budget for 2018-19.
Section 4: Local authority savings plans compared with budget pressure
Budget Pressure 2018-19
In this section the total local authority expenditure and the total level of savings planned from all services are combined to produce an overall measure of budget pressure for each council, i.e. the total savings amount as a percentage of overall expenditure. After ordering from highest to lowest budget pressure the local authorities were grouped accordingly (see Annex B). The data is presented for frontline service areas.
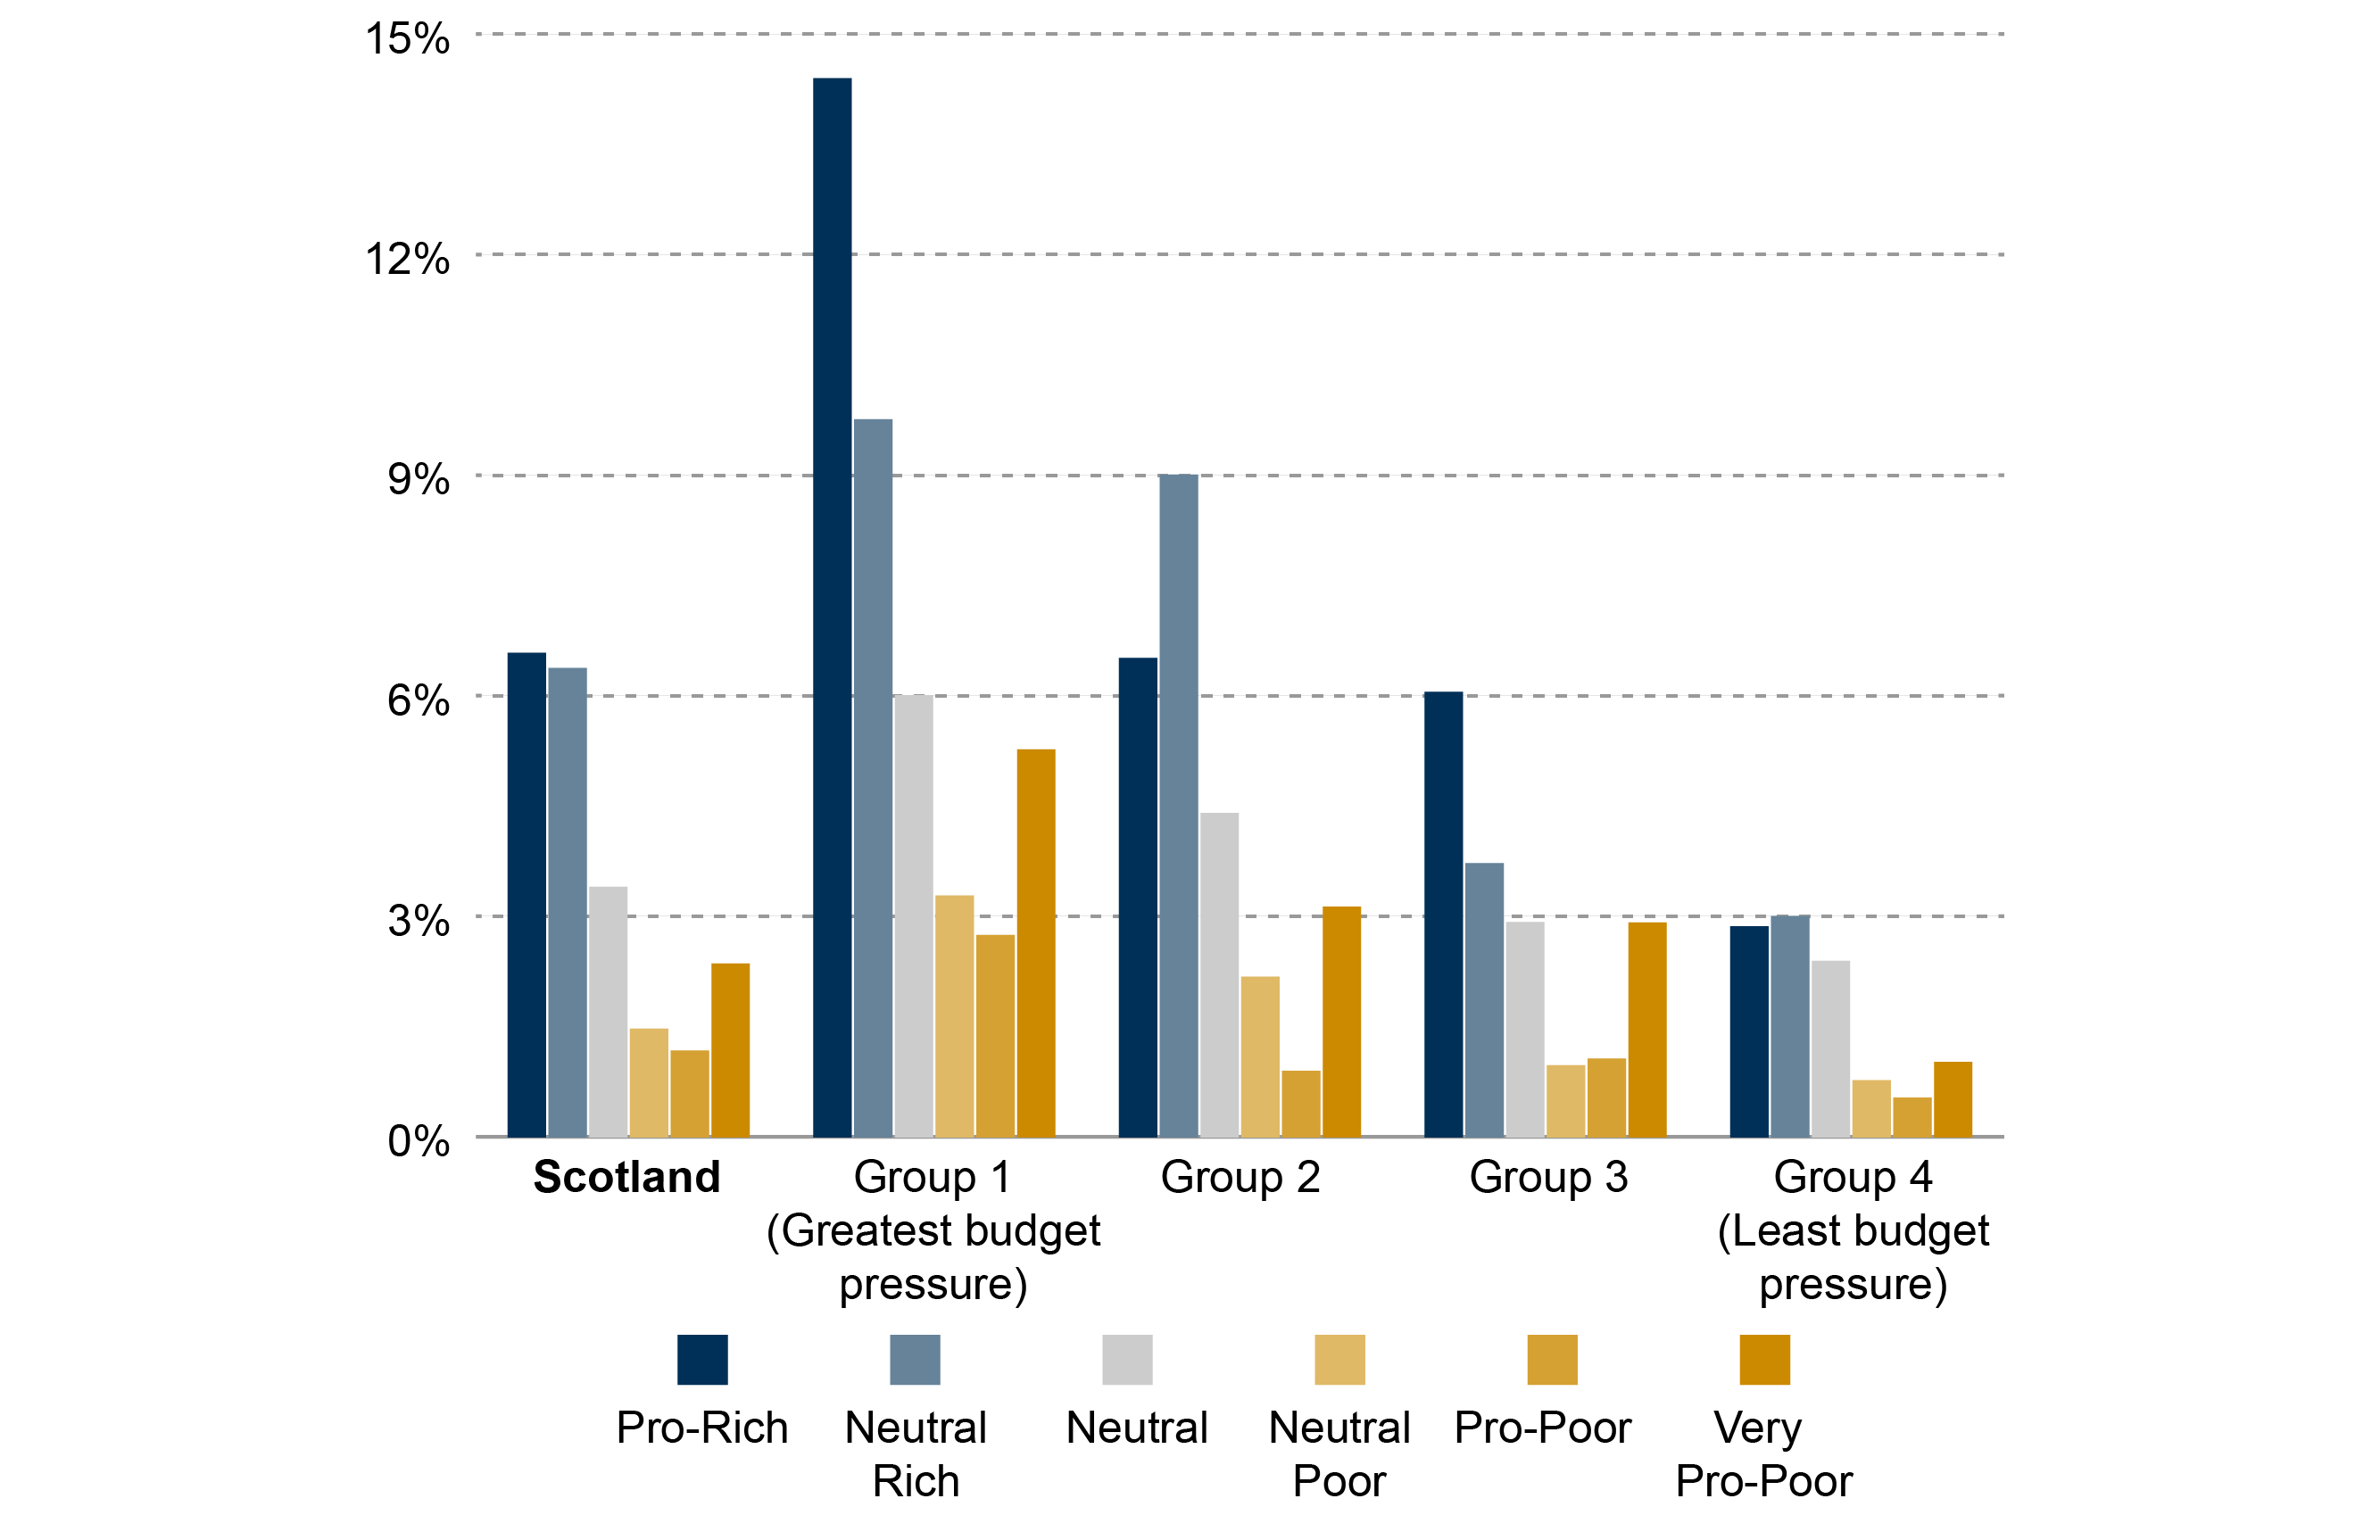
This analysis highlights that authorities are quite similar in how they distribute savings but what drives rates of savings for any group of services is total savings requirement. In Figure 14 the clear 'J-shaped' relationship between service classification and level of cut that we saw in the previous two briefings is still apparent, but not as strong as before. In other words, a high rate of saving is made from Pro-Rich services, with progressively smaller cuts to Neutral-Poor or Pro-Poor service categories, before rising for Very Pro-Poor services. This relationship is apparent for all four groups but weakens across the groups as budget pressure decreases: it is therefore weakest for 'Group 4' where the pressure is lowest.
Policy commitments and ring-fencing
As part of the Scottish Government's funding settlement, local authorities are expected to meet certain commitments in return for the full funding package. For example, in 2017-18, local government was expected to maintain the pupil:teacher ratio at 2016 levels, and to secure places for all probationers under the teacher induction scheme. These commitments can have an effect on the funding available to local authorities to deliver core services.
While certain specific commitments are funded as ring-fenced specific grants, other commitments which local authorities must agree to meet are funded from the general revenue budget. The Accounts Commission, in its report Local government in Scotland: Challenges and performance 20181, however, noted that that there were additional spending obligations through both UK and Scottish Government policy priorities which did not always receive additional funding. These include the apprenticeship levy, and equal pay claims.
As noted in previous iterations of this report, local government faces the additional challenge of balancing spending commitments and budget pressure with increased service demand. In Challenges and performance 2018, the Accounts Commission noted that -
The impact of increasing social care demands from an ageing population on council budgets is clear and means a higher proportion of council money being spent on social care services. This has reduced the amount councils have to spend on other areas and going forward, this has the potential to cause tensions between local and national priorities and risk the viability of some services.
Accounts Commission. (2018, April 5). Local government in Scotland: Challenges and performance 2018. Retrieved from http://www.audit-scotland.gov.uk/report/local-government-in-scotland-challenges-and-performance-2018 [accessed 18 September 2018]
It was not possible to collate the data for local authorities on how all of these commitments impact on particular service areas. Although they have an impact on how local authorities approach their spending plans, these are not ring-fenced specific grants. Instead we used data from the Local Government Finance Circulars as these include information on a number of ring-fenced grants at local authority level. The following analysis is based on these data.
We found that:
The Local Government Finance Circular's data on ring-fenced grants for 2018-19 related to Gaelic, Pupil Equity Fund, Early Years Expansion and Criminal Justice Social work funding. This translated to 3% of councils' expenditure in these service areas.
As we would anticipate, given the targeting of the Pupil Equity Fund, there is a strong relationship between ring-fencing and deprivation benchmarking group, with the higher the deprivation grouping the higher the ring-fencing.
The analysis could not quantify the impact of the other funding commitments local authorities are subject to and therefore could not explore how these commitments relating to specific areas of expenditure contribute to the decisions made by councils when planning service provision across all service areas.
Case Studies
Following the previous SPICe briefing, we were invited by the Local Government and Communities Committee to conduct a small number of mini-case studies designed to capture the different challenges faced by councils with different characteristics in delivering savings requirements. This section reports on three councils - Dundee, Fife and North Ayrshire - selected for their contrasting locational, economic and demographic characteristics. The case studies are based on interviews with senior officers in each council (11 in total) and analysis of a range of strategic and background documents.
Dundee
Local conditions and challenges
Dundee City has by far the smallest land area of all 32 Scottish councils, yet has a relatively large population of 148,210 making it, along with Glasgow, the most dense council area in Scotland. The city has a high concentration of deprived areas, with the council ranking 5th highest by deprivation of the 32 councils, although the West End and the Ferry areas are more affluent. In contrast, Dundee is surrounded by the significantly less deprived councils of Angus and Perth & Kinross, which rank 22nd and 24th by deprivation respectively
Dundee's population declined by nearly 15% between 1981 and 2004. There has been some growth in recent years, by over 5,000 people since 2004, and with a minor increase in population set to continue to 2026. In addition to a slightly expanding population, Dundee has a young working age demographic, with over 13.5% of those living in Dundee being aged 18-25 in 2014, the highest percentage of any Scottish council. Dundee is projected to have the largest decrease in population of over-65s out of every council, and is one of only three Scottish councils showing a reduction in this group, with the number of over-65s expected to shrink 3% by 20261.
Dundee's public sector employment is comparatively large, providing 27.8% of jobs in 2017 compared to the Scottish average of 25.3%. Representing 17,900 employees, employment in this sector is set to increase by a further 750 posts due to the decision to locate the new Scotland Social Security headquarters in the city. The City Council alone provides 6,900 of the public sector roles in the city. Dundee's professional, science, and technical sector showed the most growth between 2009-2014, increasing by 300 employees. Although there has been growth in skilled jobs, the largest employer by sector is Wholesale, Retail, and Repairs. The third largest enterprise in the city, Michelin Tyres Plc, may close its Dundee tyre factory unless a task force finds an alternative solution - with 850 jobs at risk2. Dundee faces very high levels of unemployment, having the joint highest unemployment rate among local authorities. The Council have noted that although Dundee has experienced economic recovery and high-skill growth, this has primarily benefited the wider region rather than Dundee's resident population, which remains subject to low wages and unemployment.
Politics, policies and plans
Dundee Council is governed by a coalition of SNP and Independent councillors, changing from an outright SNP majority in the 2017 local government elections.
The City Plan for Dundee 2017-2026 presents five strategic priorities1:
Fair Work and Enterprise
Children and Families
Health, Care, and Wellbeing
Community Safety and Justice
Building Stronger Communities
Central to the City Plan is the idea of delivering on these priorities through the framework of fairness, which is described as guiding the Council's actions: "Underpinning all of this plan is the city's determination to tackle poverty and inequality". To do this the Plan draws on the Dundee Fairness Commission report, A Fair Way to Go, published in May 2016, and the Fairness Action Plan developed by the Dundee Partnership in November 2016. A key recommendation from the Fairness Commission was to establish a Poverty Truth Commission.
Dundee City Council has attempted to emphasise the city's cultural aspects and bolster the tourism industry, with the City Plan recommending to "grow the visitor economy and create employment opportunities in new and existing tourism related businesses". This takes advantage of Dundee's bid to become the UK City of Culture in 2017, and its designation as the UK's first "UN City of Design". Recently, the focus of the strategy has been the opening of the V&A museum as part of a £1 billion redevelopment of the waterfront area, projected to create 7,000 jobs. This investment was challenged by some Dundee residents, as one officer noted that "local perception being really mixed between ‘isn't it an amazing thing?' and ‘isn't it a waste of money when we could be doing stuff around our streets?'". However, it was also an opportunity to demonstrate its poverty strategy:
Our line is, [businesses] won't be coming to the central waterfront unless they pay the living wage.
The Council notes that it must negotiate high-quality jobs in these areas to prevent the perception that the waterfront investment is leaving Dundee services under-resourced.
An anti-poverty strategy can also be seen in Dundee's approach to service change and channel shift. Like other councils, Dundee has attempted to protect front-facing customer services by streamlining processes rather than reducing roles. Officers highlighted that reductions in services could result in spiralling negative outcomes:
What we don't want to do is leave someone who is in hardship at the moment … that would cause them more distress and not being able to pay their rent.
To make processes more efficient, a main focus of Council policy in the future will be automated payments, as one officer describes:
Automation of benefit claims [will be] a costly outlay, but it will hopefully in the future make things more efficient.
Officers noted that efficient use of data had already resulted in savings, as they had eliminated the separation between housing benefit applications and applications for free school meals. Through this reorganisation, service users only had to submit a single application, reducing duplication of work. By focusing on an anti-poverty strategy and streamlining services, Dundee has attempted to minimise the visibility of savings to customer services for the service user.
Budget challenges
The current (2018-19) annual budget for Dundee City Council is £549.2m. In the past three years, as a result of budget cuts and cost pressures, the Council has had to make savings of £22.9m in 2016-17, £11.5m in 2017-18 and £14.5m in 2018-19. A simple measure of budget pressure can be derived by dividing total expenditure by the total level of budget cuts, and we use this measure in Section 4 of the briefing to explore patterns in the distribution of savings to services. On this measure, Dundee experienced relatively high budget pressure in the first two years – for instance, in 2016-17 it was the 10th most pressurised council. By 2018-19, however, its relative level of budget pressure had dropped to 21st of the Scottish councils.
Cost pressures create additional budgetary pressures. In Dundee, the Council's current cost pressures are experienced largely because of pay awards, pension contributions (especially for teachers), and as a result of additional property costs including rates, energy and maintenance. Unlike many councils, Dundee does not cite increases in demand for social care as a cost pressure, reflecting the projected decrease in over-65s and younger population profile. The Council also points to significant cost pressures as a result of new statutory requirements and policy initiatives introduced by the Scottish Government, such as introduction of the continuing care provisions via The Children and Young People (Scotland) Act 2014.
Dundee has had lowest level of usable reserves of all 32 Councils for a number of years. This has been noted as a financial risk for the Council by Audit Scotland. A recent budget report notes the challenge this represents:
The savings and efficiencies requirements … assume that there will be no reserves available to help address the projected budget shortfalls over the next three financial years. Indeed, of light of Audit Scotland's observations, the Council should actually be looking to increase its reserves over the short to medium term.
Savings plans
We examined Dundee's savings plans for the past three years using the Social Impact framework which – as indicated in Figure 4 – splits services into ‘Pro-rich', ‘Neutral', ‘Pro-poor', and ‘Back Office' categories. Council officers noted that they had also used the framework to assess whether proposed savings were likely to impact on more deprived or more affluent segments of the population, with an officer asked to offer an anti- poverty perspective unpinned by the framework.
Our analysis shows a substantial rate of savings from Pro-Rich services in 2016-17 and 2017-18, at 15.5% and 16.5% respectively, higher than Scottish averages. Savings from Pro-Rich services then dropped to 3% in 2018-19, less than half the Scottish average. The rate of savings from Neutral services followed a similar pattern, declining from 17.5% in year one when they outstripped the Scottish average, and then reducing over time as well as in relation to the Scottish average. The scale of the cut in Neutral service in 2016-17 reflects the severity of budget pressure in this year "our most challenging year in terms of the level of savings we had to make". It was achieved largely via a review of street cleaning, which led to a reduction of 45 posts. Officers described the dilemma this strategy involved: Dundee had prided itself on having a high standard of street cleaning, but ironically, this made the service a target for cuts - as a reasonable standard could still be achieved with reduced resources. An officer articulated the resultant long term threat to the service as institutional memory faded:
When you do let these things go it's very difficult to then bring them back up.
2016-17 was also a year in which Back Office functions saw a very high rate of savings of almost 40%. While the scale of this cut reflects the peculiar challenge of that year's budget, it also reflects a longer trend of reducing expenditure in this area "even a couple of years before austerity". As was the case with Pro-Rich and Neutral savings, the scale of the cut reduced by only a further 15% in year two, and 7% in year three. This trend reflected reduced overall pressure and the fact that the duration and intensity of cumulative cuts meant:
There's probably not much that we can shave from our service areas now.
In contrast to all other service categories, Pro-Poor services experienced a low rate of savings - below Scottish averages - in years one and two. Council officers indicated that this pattern reflected the Council's strategic intent to afford protection to services relied on by poorer groups (noting of course that small rates of savings on large expenditure streams can still represent substantial sums). However, the rate increased to 4.5% - above the Scottish average - in 2018-19. This higher rate is largely a result of the decision to allocate a flat cash award to the largely Pro-Poor Health and Social Care Partnership, rather than increase the award in line with pay and other pressures.
Key challenges
Dundee's high concentration of deprivation and the tightness of its boundaries creates difficulties in generating sources of income. Officers noted the greater difficulties in raising revenue from resident taxes now, compared to the situation prior to local government re-organisation in 1996:
It's worse in terms of Council Tax generation. We used to have wealthier suburbs.
Moreover, Dundee has grown to serve as a regional hub for more affluent surrounding areas:
We are a small city with very tight boundaries, but we're also a regional centre supporting the councils around us as well.
Tourism-focused measures such as the Transient Visitor Levy being considered in Edinburgh may not generate revenue for Dundee, as visitors would not necessarily seek accommodation in the city. These problems are compounded by the fact that deprivation within Dundee makes it socially costly to increase fees for services in order to take full advantage of tourism and transit, creating a further dilemma:
We're having to put up our prices for stuff, and that's immediately exclusive.
Overall, council officers stressed that previous strategies for finding savings requirements were becoming increasingly difficult. One official noted that, especially in 2016-17, the demands for savings made direct cuts necessary, preventing transformational change:
In the past those conversations were always more about service redesign.
However, another official said that this was increasingly how the Council worked, and that the method of making savings had permanently shifted:
In the early days the changes we were making were almost voluntary within services … things we'd like to be doing anyway. It's become more about the money, if not always about money.
These comments were mirrored by another officer, who described a growing divide between how the Council aimed to make savings, and the actual choices available as the need for cuts continued:
It's worse than it's ever been. The thing we're struggling with now is the rhetorical drive for an improvement agenda when there are fewer people and less money spent. So the gap between rhetoric and reality seems to be getting bigger.
Summary of challenges
Dundee faces some unique difficulties as a result of its unusual characteristics as a council, having high levels of deprivation and population alongside a physically small council area. Although there has been economic recovery and the population is set to increase, high-skilled jobs are seen to primarily benefit the wider region, while more deprived residents of Dundee itself are more likely to work in low-wage and insecure sectors. This, combined with Dundee's large public sector, highlights an essential role for the Council in ensuring inclusive growth and equitable services, which Dundee have shown in their approach to investment and regeneration. Dundee has centred its poverty strategy on council decision-making, providing efficiency savings where possible and promoting the best use of data. Despite this, the extent of savings requirements coupled with the difficulties in generating income have already affected Council services, to the extent that council officers have raised concerns that further cuts would negatively impact the sustainability of service provision.
Fife
Local conditions and challenges
Fife Council is the third biggest council by population, with a headcount of 368,080. While it covers a large area, its population size means that it is towards the median in term of density. In fact, Fife is often described as ‘average' for Scotland in terms of characteristics and also outcomes. However, average statistics mask significant differences between groups in the population and different geographical areas within Fife. North East Fife is largely rural and affluent, and South West Fife is made up of the large town of Dunfermline and wealthier dormitory settlements for Edinburgh. Overall SIMD deprivation at the council level ranks Fife as the 11th most deprived council in Scotland. However Mid-Fife mainly consists of post-industrial towns and contains some of the most disadvantaged data zones - Buckhaven South in Levenmouth is the 27th most deprived out of 6,976 zones in Scotland. Life expectancy in the most deprived areas in Fife is lower than in the most affluent areas by eight years for men and seven for women. A key issue in Fife is that severe deprivation is often located in small pockets and can be masked by the affluence of neighbouring areas.
Demographic trends differ across Fife. The more affluent areas in the South are projected to have the fastest and highest growth rates in both population and those of pensionable age of any area within Fife, while more affluent areas in the North East will see a reduction in the population. Within Mid-Fife the central areas of Kirkcaldy and Glenrothes have a stable or slightly declining population projection over the next 10 years, while the peripheral regions of Cowdenbeath and Levenmouth expect steady growth. Overall, Fife will see a 1.9% increase in its population by 2026, lower than the Scottish average of 3.2%, while its over-65 population will increase by 6%, just above the Scottish average of 5%1.
Types of employment in Fife are divided along similar lines. The North East is heavily reliant on the Education & Health sector, largely due to the presence of the University of St Andrews. In Dunfermline and the South West the largest sector is Finance & Professional, providing roughly one in four jobs. In Mid-Fife areas, historically centres of manufacturing and coal mining, the Education & Health sector is now consistently the largest. Fife's public sector accounts for 27.7% of employment in the region as a whole, higher than the Scottish average of 25.3%, and of this Fife Council accounts for almost 40% of public sector employment. Fife's unemployment rate is 4.2%, just over the 4.1% Scottish average, however this obscures large differences between the areas with access to city regions, and the more peripheral areas in Mid-Fife. One senior officer described how:
the areas that do benefit from the City Region effects are essentially the M90 corridor, that whole area's doing pretty well, but then you've got archipelagos like Levenmouth that are geographically isolated.
In addition to easy access to Dundee City, North-East Fife benefits from being included in the Tay Cities Deal area, while South West Fife has access to other councils covered by the Edinburgh and South East City Region Deal.
Politics, policies and plans
The Council is controlled by an SNP/Labour coalition with joint leadership. This administration replaced a Labour minority administration after the 2017 local elections.
The Community Planning Partnership's Plan for Fife 2017-20271 has four priorities:
Opportunities for All
Thriving Places
Inclusive Growth and Jobs
Community Led Services
It is underpinned by a vision for a fairer Fife, and the 2015 report Fairness Matters2 which responds to the Fairer Fife commission's recommendations. The Plan for Fife therefore aims "to reduce inequalities and to promote fairness in everything we do". Senior officers suggested that the principle drove action:
The key touch word would be fairness.
Fife have attempted to mitigate the effects of budget cuts through more efficient use of resources, assisted by understanding the area-specific needs better through local Strategic Assessments for each of seven local committee areas, drafted with the help of information from the Know Fife dataset which provides detailed information for all data-zones in Fife. There has also been a focus on participatory budgeting in order to identify the most effective ways that savings could be made, as one senior officer stated, "we see it as a way to make better use of shrinking resources", indicating its potential use for mainstream services as well as special projects. There is also an emphasis on ‘channel shift', diverting customers towards digital and call centre interactions across council services, but at the same time as a 15% reduction in call centre staffing in this financial year.
Fife attempts to use medium-term planning to minimise reductions in staffing and deliver transformational change. Describing the three-year budget plan, one council officer described how initial savings opportunities did not have to be firm:
Some of this is a matter of putting down waymarkers ... until more detailed evidenced based work is done, but there is a process for getting from A to B.
The officer suggested that this could prevent a reduction of services:
Rather than just plucking two posts out every year, we're attempting longer term plans that by the end of the three years, we aim to have delivered a way of using our staff resources more efficiently.
In addition to medium-term planning, Fife is looking at new funding models to supplement Council investment, including drawing from community resources and local fundraising to make up shortfalls and provide new services:
Things like crowdfunding … rather than providing one off grants for community groups … we could maybe put in 50%, and encourage groups to raise an element themselves.
The Council is increasingly attempting to develop services provided by the community - the Plan for Fife describes the current model of council-provided services as "increasingly unsustainable", particularly with "continuing resource constraints". Fife's approach to managing savings requirements has been to increase the responsibility of communities in terms of services, as is states:
The public sector can't do everything, and future success lies in helping people do more for themselves.
Budget challenges
The current (2018-19) annual budget for Fife Council is £785.3m. In the past three years, as a result of budget cuts and cost pressures, the Council has had to make savings of £29.4m in 2016-17, £19.5m in 2017-18 and £12.8m in 2018-19. A simple measure of budget pressure can be derived by dividing total expenditure by the total level of budget cuts, and we use this in Section 4 of the briefing to explore patterns in the distribution of savings to services. On this measure, Fife experienced relatively high budget pressure in the first two years – for instance, in 2016-17 it was the 9th most pressurised council and in 2017-18 the 10th. By 2018-19, however, its relative level of budget pressure had dropped to 27th in Scotland by this measure.
Cost increases and pressures create additional budgetary pressures. In Fife, the Council's current cost pressures are experienced largely as a result of inflationary pressures associated with pay awards and demand associated with demographics in respect of an ageing population and looked after children. Fife's useable reserves outturn position for 2017-18 was 5% lower than at the start of the year and is the 4th lowest position in Scotland when compared as a percentage of Council annual revenue.
Savings plans
Fife Council's savings plans for the three years 2016-17, 2017-18 and 2018-19 were analysed for this briefing using the Social Impact framework, which splits services into ‘Pro-rich', ‘Neutral', ‘Pro-poor', and ‘Back Office' categories (See Figure 4). The Council also considered the distribution of its 2016-17 savings plans using this framework and published this analysis in its 2017 Strategic Assessment document1.
For the budget years 2016-17 to 2017-18, Fife implemented a slightly higher rate of savings from its Pro-Rich services than the Scottish average. However, in 2018-19 the rate of savings from Pro-Rich services dropped quite considerably (from a high of 15% in 2016-17 to 5% - at this point dropping below the Scottish average). There was a similar trend in relation to savings from Back Office functions, which were at 17% of expenditure in 2016-17 and 2017-18, but dropped sharply to 4% in 2018-19, about half the Scottish average. Like other councils, Fife has attempted to make savings from areas of Council business which are less visible to the public – one officer suggested that the corporate centre was "significantly reduced in recent years".
In contrast, while the rate of savings from both Neutral and Pro-Poor services also declined, this was in a more linear progression. Thus Neutral savings reduced by roughly 5% each year from 17.5% to 8% in year, falling below the Scottish average. The rate of cut in Pro-Poor services reduced by 2.5% yearly from 7% to 2%, tracking the Scottish average in years one and two, and falling below in year three.
This pattern could suggest that in years with better settlements and a little less pressure, the Council was able to afford a degree of protection to Pro-Poor and customer-facing Neutral services. A council officer suggested this was the case:
there is still a degree of protection in certain areas.
However, it was also the case that savings levels reduced for both Back Office and Pro-Rich services. Indeed, officers indicated that distinctions between Back Office functions and customer-facing services were becoming difficult to maintain with respect to budget cuts, as it was "getting more difficult to identify efficiency savings."
Key challenges
Alongside the effects of savings requirements, the stark demographic and socio-economic divisions within Fife have caused challenges about the allocation of resources. This is highlighted in the 2017 Strategic Assessment1, which identifies that:
Areas which need the biggest impact also have the lowest expectations, how can we make major impact if the local people do not necessarily feel that there is an issue?
Mid-Fife in particular has been targeted for Council investment due to its isolation from businesses and city regions in the North and South, with one official indicating that in order to mitigate inequality "the devolved budgets to support the local community planning process gives a weighting towards the four Mid-Fife areas". However, Council assistance can be drawn into more affluent areas. One officer highlighted that Community Asset Transfers have given "more articulate, more capable, community groups an opportunity to not only grab the assets, but also there's a pull in terms of officer time, because we've got to support these groups".
Fife has a conflict between ensuring equitable access to services, and attempting to raise money and make the Council more self-reliant. These twin pressures can act against one another, as:
commercialisation, increasing fees and charges and whatnot, can be at odds with some of the other policies ... We're trying to help certain areas but at the same time we're trying to become more commercial.
The long-term effects of savings requirements have started to generate conflict between the fairness agenda which highlights the need to improve access to services, and the necessity of making cuts which require reductions in service provision, as noted by one council officer:
I think services have gone so far that some of the options aren't necessarily transformational, they are about stopping services or cutting services, it would be difficult to get away from that given the financial position that we're in.
Summary of challenges
While Fife is often described as Scotland's 'average' council, its averageness is, in fact, a product of its diversity. It has a mix of very affluent and severely disadvantaged settlements, those which are well-connected into thriving labour markets, and those which are relatively isolated. A key issue in Fife is the need to re-balance and redirect resources towards areas with severe need, in a context marked both by budget pressure, but also by significant investment and opportunity in parts of the council area. The divisions within Fife reflect historic communities and competition between them can be an issue at times. Such divisions could be amplified by a strategy which aims to support the involvement of communities in the delivery of local services, as pre-existing inequalities may have an effect. It would therefore seem likely that the fortunes of some of the more disadvantaged parts of Fife will continue to be heavily influenced by the impacts of public sector decision making and activity for some time to come.
North Ayrshire
Local conditions and challenges
North Ayrshire is a medium sized council both in terms of its population headcount (135,800), and in its level of density. The council area includes a range of coastal towns, the islands of Arran and Cumbrae, and an inland which is a mix of rural and post-industrial settlements. While the council area as a whole scores highly in terms of SIMD deprivation, ranking 4th highest of the 32 councils, deprived data zones are clustered in the Three Towns area and Irvine, with some affluent coastal commuter towns in its Northern part. There are big inequalities in life expectancy, education, and employment rates between different localities in the council area. It has the second highest level of child poverty of any Scottish local authority area.
Elderly and younger populations are concentrated in different localities within North Ayrshire. More affluent parts of the Council have an older population, with the North Coast and Arran having the highest proportion of over-65s. More deprived settlements are characterised by both a larger working age group, and a larger youth cohort. Despite the differences, all areas within North Ayrshire face an ageing demographic trend, and some will see a significant reduction in population. Apart from in some specific settlements in the North Coast, there is little inward migration, and indeed outward migration of younger, more skilled households is a particular issue, with areas such as Arran facing a fall in their working age population of nearly 50% by 2026. Overall North Ayrshire will see demographic pressures coming from an increase in the over-65 population across the local authority, alongside a notable decrease in young and working age residents.
While tourism is a mainstay of the island economies and supports the northern settlements, in many parts of North Ayrshire the local economy has yet to recover from de-industrialisation. A particular issue is low job density (0.57 compared to Glasgow's ratio of 1.05), and the fact that North Ayrshire has no higher education institutions. Rates of labour market participation are low, with an employment rate of 69.8% compared to the Scottish average of 74.5%. North Ayrshire has a high proportion of adults with a long-term physical or mental health condition, at 35% compared to the Scottish average of 28%, and employment rates are particularly low for this group, at 36.4%, with the Scottish average being 45.4%.
The Council itself is the largest single employer within the local authority boundary, with 6,900 employees, meaning the economy is heavily reliant on the local public sector. However, overall public sector employment is lower than the Scottish average, at 24.3% in North Ayrshire compared to 25.3% in Scotland. Along with Dundee, it has the joint highest unemployment rate. Despite the area only being 30 minutes from Glasgow, North Ayrshire Council stated that it has not benefited from the same levels of growth that the city region and other parts of central Scotland have experienced. There is only one job for every two working age residents and although 5,500 people travel to the city every day, the lack on investment and opportunity locally results in high levels of economic exclusion. These challenges drove the Council's case to the Scottish Government for a more "nuanced regional economic policy to help address this degree of inequality- a "one size fits all" approach for Scotland does not work for all areas."
Politics, policies and plans
North Ayrshire Council has been governed via by a Labour minority administration since 2016, following a by-election. The current administration replaces an SNP minority.
The North Ayrshire Council Plan 2015-20201, which is being reviewed currently, identifies five key priorities:
Growing our economy, increasing employment and regenerating towns
Working together to develop stronger communities
Ensuring people have the right skills for learning, life and work
Helping all our people to stay safe, healthy and active
Protecting and enhancing the environment for future generations
The Plan sets out a range of principles which underpin the delivery of these priorities. Of particular relevance is "a commitment to reducing inequality through early intervention and prevention, and targeting resources at those most in need". This principle embeds the North Ayrshire Community Planning Partnership's Fair for All strategy in the work of the Council. Fair for All aims to understand and respond to a range of socio-economic and health inequalities, emphasising the role which the distribution and quality of local public services can play in addressing these challenges2. The strategy has a place-based focus, moving away from service silos to focus on localities given the extent of geographical inequality. Council officers were unanimous in their view that Fair for All is central to the Council's and CPP's work and drives decision making.
North Ayrshire Council pioneered work with the Scottish Government on the Inclusive Growth diagnostic policy tool. The output from the diagnostic evidences the growing levels of regional inequality and acts as a driver for the Council setting priorities to address inclusive growth3. It has influenced the Council's priorities and budget decisions, including the allocation of £850,000 in the 2017-18 budget to the Challenge Poverty Fund for programmes such as the Basic Income pilot and a new Supported Employment service. The Council is in the initial stages of work with East and South Ayrshire to develop a new, long term, regional economic strategy for Ayrshire, encompassing the delivery of the Ayrshire Regional Growth Deal.
The Council is investing in a number of initiatives that deliver social, economic and environmental benefits. An example is its long term 'invest to save' strategy to help tackle climate change, investing £5m in a solar panel and biomass boiler retrofit programme. This project, as part of the wider North Ayrshire Environmental Sustainability & Climate Strategy, has contributed to a reduction in the Council's carbon emissions from its estate of over 24% over the last five years. The solar panel retrofit programme targets the Council's social housing stock and, together with a roll-out of district heating, is instrumental in tackling fuel poverty.
Key to the delivery of the Council Plan is an ambitious Digital Transformation Programme, Smarter Ways of Working: A Digital Strategy for North Ayrshire Council, focused on transforming Customer and Digital Services through expanding digital access to services4. This strategy is also central to the Council's transformational approach to mitigating the impacts of funding not keeping pace with cost and demand for services. For example, North Ayrshire has tried to streamline its customer services by removing the divide between Back Office and front office roles. In relation to Council Tax, this has involved moving "everyone from the Back Office into the front office so that it's fairly seamless to the public". Scottish Welfare Fund applications are now assessed during the initial phone application process, resulting in a quicker response time for applicants.
We've not cut any service at all, we've changed the way that services are delivered.
Another strand of the digital transformation programme is "Building a single view of our customers" through co-ordinating the use of data. One example is the automatic linking of Free School Meals and Clothing Grants applications through data matching between the education and benefits departments of the Council in its Customer Relationship Management system.
Budget challenges
North Ayrshire's current (2018-19) annual budget is £328m. In the past three years, as a result of budget cuts and cost pressures, the Council has had to make savings of £18.2m in 2016-17, £7.1m in 2017-18 and £10.5m in 2018-19. In Section 4 of this briefing, we identify a simple measure of budget pressure in which a councils' total expenditure is divided by the total level of budget cuts. By this measure, North Ayrshire's level of budget pressure was in the middle of the spectrum in 2017-18, but less severe in the two other years covered by the analysis (20th in 2016-17 and 24th in 2018-19).
However, budget pressures and therefore savings requirements are also a consequence of annual cost increases and service pressures. The key cost pressures which the Council has had to budget for over the last three years have included pay awards and pension and National Insurance contributions. There have been also been costs associated with waste treatment, the apprenticeship levy, revenue consequences of Capital investment in the school estate, and investment in technology as a result of the Digital Strategy. Unsurprisingly, demographic trends translate as pressures on the Health and Social Care Partnership budget. Within its annual budget, North Ayrshire makes provision for inflation on key commodities such as PFI, Non-Profit Distributing contracts, as well as national care home and social care contracts and property costs. However, provision is not made for general inflation, which means a real terms reduction in resources to support service delivery. As at 31 March 2018 the council had earmarked general fund reserves of £38.8m, these will reduce over the next few years as commitments are realised, for example Capital investment. Un-earmarked general fund reserves are sitting at £6.6m, 2% of net expenditure, the lower level of recognised best practice.
Savings plans
We have analysed the savings plans of North Ayrshire for the past three years using the Social Impact framework which – as indicated in Figure 4 – splits services into ‘Pro-rich', ‘Neutral', ‘Pro-poor', and ‘Back Office' categories.
Over the three years of this analysis, North Ayrshire has made savings from Pro-rich services which are significantly lower than Scottish averages, although the savings rate had increased from a low of 0.6% in 2016-17 to 4.8% in 2018-19. (The Scottish average in 2016-17 was 12.3%, in 2018-19 it was 6.5%). Officers were strongly of the view that the characteristics of the local context mean that there is very little scope to extract significant savings from Pro-Rich services. For example, more urban and affluent councils have been able to increase parking charges. North Ayrshire does not currently charge for parking, but a future plan to impose charges was approved by the Council last year with proposals being developed to establish a scheme.
The highest rate of savings has been made to Neutral services across the three years – although even at its highest level – 11.2% in 2017-18 - this remained below the Scottish average of 12.2%. The rate of savings from Back Office functions reduced each year: from 10.1% in year one; to 6.5% in year two; and then down to 4.5% in year three - in all years below Scottish averages. Officers suggested that this relatively low rate reflects the fact that North Ayrshire has consistently had the lowest percentage spend on administrative support services of any council from 2013 onwards. It therefore had limited capacity to make savings on Back Office functions. An officer suggested:
we are at a critical economic minimum with a potential that any further reductions would have a negative impact on the wider range of services provided by the Council.
Pro-poor services have been largely protected from high rates of savings. In 2016-7 there was a cut of 5.3%, which decreased to 2.5% in 2017-18, before increasing slightly to 3% in 2018-19 – all below Scottish averages. The Council's emphasis on targeting resources towards need, reducing inequalities in outcomes and an increasing place-based focus was cited as a key driver of this degree of protection. However, concerns were raised as to whether the council would be able to continue to shield Pro-poor services from cuts:
The difficulty moving forward … is at some point if real resources continue to reduce that priority services may be affected.
Key challenges
A view was expressed with regard to the annual budget process, that the need to meet service savings targets could impact on an outcomes focus. In response to this view the Council noted it was managing these challenges through the establishment of a Transformation Think Tank. This would allow a move away from service targets "and ensure more collaborative solutions to the financial challenge with no unintended consequences that conflict with our key priorities".
Summary of challenges
North Ayrshire is clearly challenged on many fronts. It is an example of one of Scotland's relatively peripheral councils, quite isolated from substantial economic opportunities, and faced with tackling a set of enduring difficulties. The local economy is unlikely to provide the quantity and quality of paid employment necessary to tackle historic and entrenched inequalities, or to counter population loss and ageing, for some considerable time. Public sector agencies - their strategies and services - are therefore critical for improving local outcomes. Budget pressures and the savings they require will have an undoubted impact on the Council's ability to deliver the improved and more equal outcomes it aspires to. It has clearly attempted to work more effectively, focusing its efficiency savings in areas which would remain invisible to service users, such as Back Office processes. Despite this, officials interviewed questioned the sustainability of this approach, due to the scale of the savings required and the effects of cuts which prevent effective change within services.
Common messages from the case studies
There were some common messages that emerged from the discussions with senior officers involved in the case study councils. Thus, the case studies make apparent the extent to which the councils feel challenged in their capacity to develop strategies that simultaneously deliver savings, improve services and outcomes, and meet the needs of the poorest households and communities.
Senior officers also stated concerns about single year financial settlements and the challenges of annualised budgeting, indicating that these can militate against the three year financial planning cycles that councils are attempting to move towards. There was also discussion of the balance between internal vs external drivers for the 'protecting the poor' agendas in relation to managing savings requirements. Some officers expressed an appetite for additional forms of audit and benchmarking in this regard. Ring-fencing within budget allocations was an area of contention, with officers voicing strong opposition to any increase in the degree or extent of ring-fencing. Finally, there was widespread recognition of the scale of the opportunities created by new data and technology to improve the effectiveness of services and, over the longer term, generate efficiencies.
Annex A – Pro-Rich and Pro-Poor classification
| Service Heading | Service | Pattern of use/ benefit | |
|---|---|---|---|
| 1 | Education | Pre-primary education | Neutral |
| 2 | Education | Primary education | Pro-Poor |
| 3 | Education | Secondary education | Neutral-Poor |
| 4 | Education | Special education | Pro-Poor |
| 5 | Education | Community Learning | Pro-Rich |
| 6 | Education | Other non-school funding | Neutral-Poor |
| 7 | Cultural and related services | Museums and galleries | Pro-Rich |
| 8 | Cultural and related services | Other cultural and heritage services | Pro-Rich |
| 9 | Cultural and related services | Promotional events | Neutral-Rich |
| 10 | Cultural and related services | Other tourism | Neutral-Rich |
| 11 | Cultural and related services | Countryside recreation and management | Neutral-Rich |
| 12 | Cultural and related services | Sport facilities | Neutral-Rich |
| 13 | Cultural and related services | Community parks and open spaces | Neutral-Rich |
| 14 | Cultural and related services | Other recreation and sport | Neutral-Rich |
| 15 | Cultural and related services | Library Service | Neutral-Poor |
| 16 | Social work | Service Strategy | Pro-Poor |
| 17 | Social work | Children's Panel | Very Pro-Poor |
| 18 | Social work | Children and families | Very Pro-Poor |
| 19 | Social work | Older persons | Pro-Poor |
| 20 | Social work | Adults with physical or sensory disabilities | Pro-Poor |
| 21 | Social work | Adults with learning disabilities | Pro-Poor |
| 22 | Social work | Adults with mental health needs | Pro-Poor |
| 23 | Social work | Adults with other needs | Pro-Poor |
| 24 | Social work | Criminal justice social work services | Pro-Poor |
| 25 | Roads and transport | Road construction | Neutral-Rich |
| 26 | Roads and transport | Winter maintenance | Neutral-Rich |
| 27 | Roads and transport | Maintenance & repairs | Neutral-Rich |
| 28 | Roads and transport | Road lighting | Neutral-Rich |
| 29 | Roads and transport | School crossing patrols | Neutral-Rich |
| 30 | Roads and transport | Road Safety and Traffic Calming | Neutral-Rich |
| 31 | Roads and transport | Other network and traffic management | Neutral-Rich |
| 32 | Roads and transport | Parking | Pro-Rich |
| 33 | Roads and transport | Local authority public transport | Pro-Poor |
| 34 | Roads and transport | Non-LA public transport: Concessionary fares | Pro-Poor |
| 35 | Roads and transport | Non-LA public transport: Support to operators and voluntary groups | Pro-Poor |
| 36 | Roads and transport | Non-LA public transport: Co-ordination | Back Office |
| 37 | Environmental services | Trading Standards - Citizens Advice | Very Pro-Poor |
| 38 | Environmental services | Trading Standards - Other (Consumer Protection) | Neutral |
| 39 | Environmental services | Waste Management - Waste Collection | Neutral |
| 40 | Environmental services | Waste Management - Waste Disposal | Neutral |
| 41 | Environmental services | Waste Management - Other | Neutral |
| 42 | Environmental services | Other - Cemetery, cremation and mortuary services | Neutral |
| 43 | Environmental services | Other - Coast Protection | Neutral |
| 44 | Environmental services | Other - Flood defence and land drainage | Neutral |
| 45 | Environmental services | Other - Environmental Health | Neutral |
| 46 | Planning and economic development | Planning: Building control | Pro-Rich |
| 47 | Planning and economic development | Planning: Development control | Pro-Rich |
| 48 | Planning and economic development | Planning: Policy | Pro-Rich |
| 49 | Planning and economic development | Planning: Environmental initiatives | Neutral |
| 50 | Planning and economic development | Economic development | Neutral |
| 51 | Non-HRA Housing | Administration of Housing Advances | Very Pro-Poor |
| 52 | Non-HRA Housing | Renovation and Improvement Grants (excl admin costs) | Very Pro-Poor |
| 53 | Non-HRA Housing | Administration of Renovation and Improvement Grants | Very Pro-Poor |
| 54 | Non-HRA Housing | Other Private Sector Housing Renewal | Very Pro-Poor |
| 55 | Non-HRA Housing | Housing Benefits: Rent Allowance | Very Pro-Poor |
| 56 | Non-HRA Housing | Housing Benefits: Rent Rebate | Very Pro-Poor |
| 57 | Non-HRA Housing | Homelessness | Very Pro-Poor |
| 58 | Non-HRA Housing | Housing Support Services | Very Pro-Poor |
| 59 | Non-HRA Housing | Welfare Services | Very Pro-Poor |
| 60 | Non-HRA Housing | Other non-HRA Housing (excl. admin of Housing Benefits) | Very Pro-Poor |
| 61 | Central services | Council Tax Collection | Back Office |
| 62 | Central services | Non-Domestic Rates Collection | Back Office |
| 63 | Central services | Administration of Council Tax Reduction & Housing Benefit | Very Pro-Poor |
| 64 | Central services | Emergency Planning | Neutral |
| 65 | Central services | Licensing | Neutral |
| 66 | Central services | Conducting Elections | Neutral |
| 67 | Central services | Registration of Electors | Neutral |
| 68 | Central services | Non-Domestic Lands Valuation | Back Office |
| 69 | Central services | Council Tax Valuation | Back Office |
| 70 | Central services | Non-Road Lighting | Neutral-Rich |
| 71 | Central services | General Grants, Bequests & Donations | Pro-Poor |
| 72 | Central services | Registration of Births, Deaths & Marriages | Neutral |
| 73 | Central services | Corporate and Democratic Core | Back Office |
| 74 | Central services | Equal Pay/Single Status (prior year cost/provision only) | Back Office |
| 75 | Central services | Non Distributed Costs | Back Office |
| 76 | Central services | Miscellaneous | Back Office |
| 77 | Other Expenditure | Surplus(-)/Deficit(+) on trading operations not already included | Non-service Related |
| 78 | Other Expenditure | Capital expenditure charged to the General Fund | Non-service Related |
| 79 | Other Expenditure | Interest and Investment income (record a credit as a negative value) | Non-service Related |
| 80 | Other Expenditure | Statutory repayment of debt - Loans fund | Non-service Related |
| 81 | Other Expenditure | Statutory repayment of debt - Credit arrangements (Finance leases / PPP/PFI) | Non-service Related |
| 82 | Other Expenditure | Interest payable and similar charges | Non-service Related |
| 83 | Other Expenditure | Premiums and discounts | Non-service Related |
| 84 | Other Expenditure | Debt Management Expenses | Non-service Related |
| 85 | Other Expenditure | Contingency | Non-service Related |
Annex B – Local authorities grouped by budget pressure
| Budget pressure group | Local authority | Budget pressure (savings as percentage of expenditure) |
|---|---|---|
| Group 1 (greatest budget pressure) | Clackmannanshire | 5.9% |
| East Dunbartonshire | 5.1% | |
| Renfrewshire | 4.4% | |
| Scottish Borders | 4.3% | |
| Midlothian | 3.8% | |
| Angus | 3.7% | |
| Aberdeenshire | 3.6% | |
| West Lothian | 3.6% | |
| Group 2 | Moray | 3.2% |
| Aberdeen City | 3.1% | |
| Eilean Siar | 2.5% | |
| Orkney | 2.3% | |
| South Ayrshire | 2.2% | |
| East Lothian | 2.2% | |
| South Lanarkshire | 2.2% | |
| Dumfries & Galloway | 2.1% | |
| Group 3 | Perth & Kinross | 2.1% |
| Glasgow | 2.0% | |
| East Renfrewshire | 1.9% | |
| Highland | 1.8% | |
| Shetland | 1.7% | |
| Dundee City | 1.7% | |
| North Ayrshire | 1.6% | |
| Falkirk | 1.6% | |
| Group 4 (least budget pressure) | Inverclyde | 1.6% |
| Edinburgh | 1.5% | |
| Fife | 1.4% | |
| East Ayrshire | 1.3% | |
| Argyll & Bute | 1.0% | |
| Stirling | 0.8% | |
| West Dunbartonshire | 0.5% | |
| North Lanarkshire | 0.4% |
Annex C – Local Authority Budget Documents
Note - those local authority budget documents that are not hyperlinked in the table above were provided direct to SPICe.
About the authors
Maria Gannon is Research Associate in Urban Studies at the School of Social and Political Sciences, University of Glasgow.
Ailsa Burn-Murdoch is a Senior Researcher in the Financial Scrutiny Unit in SPICe.
Andrew Aiton is Data Visualisation Manager in the Financial Scrutiny Unit in SPICe.
Nick Bailey is Professor of Urban Studies at the School of Social and Political Sciences, University of Glasgow.
Glen Bramley is Professor of Urban Studies based in the Institute for Social Policy, Housing, Environment and Real Estate, Heriot Watt University, Edinburgh.
Allan Campbell is Head of the Financial Scrutiny Unit in SPICe.
Kayleigh Finnigan is Data Visualisation Assistant in SPICe.
Annette Hastings is Professor of Urban Studies at the School of Social and Political Sciences, University of Glasgow.
Alex O Conor is a research intern at the University of Glasgow.
Acknowledgements
The authors are grateful to the Joseph Rowntree Foundation which supported an earlier programme of work which underpins this briefing. They are also grateful to the University of Glasgow and SPICe for the co-funding of the research and writing of this briefing. The authors would also like to thank the Improvement Service for sharing their benchmarking family groupings.
Related briefings
SB 16/28 - Scottish Government proposals for Council Tax reform
SB 17/44 - Local Government Finance: Facts and Figures 2010-11 to 2017-18
SB 17/82 - Local Government Finance: Fees and Charges 2011-12 to 2015-16
SB 17/83 - The social impact of the 2017-18 local government budget
SB 17/88 - Local Government Finance: Draft Budget 2018-19 and provisional allocations to local authorities
SB 17/89 - Draft Budget 2018-19
SB 17/90 - Draft Budget 2018-19: Taxes
SB 18/34 - Local Government Finance: Facts and Figures 2013-14 to 2018-19
SB 18/60 - Local Government Finance: The Funding Formula and local taxation income
Sources
Gannon, M., Burn-Murdoch, A., Aiton, A., Bailey, N., Bramley, G., Campbell, A., … Hastings, A. (2017, December 5). The social impact of the 2017-18 local government budget. Retrieved from <a href="https://digitalpublications.parliament.scot/ResearchBriefings/Report/2017/12/5/The-social-impact-of-the-2017-18-local-government-budget#" target="_blank">https://digitalpublications.parliament.scot/ResearchBriefings/Report/2017/12/5/The-social-impact-of-the-2017-18-local-government-budget#</a> [accessed 15 December 2017]
Gannon, M., Campbell, A., Bailey, N., Hastings, A., Bramley, G., & Aiton, A. (2016, October 31). The social impact of the 2016-17 local government budget. Retrieved from <a href="http://www.parliament.scot/ResearchBriefingsAndFactsheets/S5/SB_16-84_The_social_impact_of_the_2016-17_local_government_budget.pdf" target="_blank">http://www.parliament.scot/ResearchBriefingsAndFactsheets/S5/SB_16-84_The_social_impact_of_the_2016-17_local_government_budget.pdf</a> [accessed 23 November 2017]
Hastings, A., Bailey, N., Besemer, K., Bramley, G., Gannon, M., & Watkins, D. (2013, November). Coping with the cuts? Local government and poorer communities. Retrieved from <a href="https://www.jrf.org.uk/sites/default/files/jrf/migrated/files/local-government-communities-full.pdf" target="_blank">https://www.jrf.org.uk/sites/default/files/jrf/migrated/files/local-government-communities-full.pdf</a> [accessed 4 December 2017]
Hastings, A., Bailey, N., Bramley, G., Gannon, M., & Watkins, D. (2015, October 7). The cost of the cuts: a social impact tool for local authorities. Retrieved from <a href="https://www.jrf.org.uk/report/cost-cuts-social-impact-tool-local-authorities" target="_blank">https://www.jrf.org.uk/report/cost-cuts-social-impact-tool-local-authorities</a> [accessed 4 December 2017]
Scottish Government. (2018, June 19). Provisional Outturn and Budget Estimates 2018. Retrieved from <a href="https://www.gov.scot/Publications/2018/06/8964" target="_blank">https://www.gov.scot/Publications/2018/06/8964</a> [accessed 26 September 2018]
Burn-Murdoch, A. (2018, May 21). Local government finance: facts and figures 2013-14 to 2018-19. Retrieved from <a href="https://digitalpublications.parliament.scot/ResearchBriefings/Report/2018/5/21/Local-Government-Finance--facts-and-figures-2013-14-to-2018-19#" target="_blank">https://digitalpublications.parliament.scot/ResearchBriefings/Report/2018/5/21/Local-Government-Finance--facts-and-figures-2013-14-to-2018-19#</a> [accessed 11 June 2018]
Burn-Murdoch, A. (2017, December 18). Local Government Finance: Draft Budget 2018-19 and provisional allocations to local authorities. Retrieved from <a href="https://digitalpublications.parliament.scot/ResearchBriefings/Report/2017/12/18/Local-Government-Finance--Draft-Budget-2018-19-and-provisional-allocations-to-local-authorities" target="_blank">https://digitalpublications.parliament.scot/ResearchBriefings/Report/2017/12/18/Local-Government-Finance--Draft-Budget-2018-19-and-provisional-allocations-to-local-authorities</a> [accessed 22 December 2017]
Scottish Government. (2018, March 6). Local Government Finance Circular 4/2018: settlements for 2018-2019. Retrieved from <a href="https://www.gov.scot/publications/local-government-finance-circular-42018/" target="_blank">https://www.gov.scot/publications/local-government-finance-circular-42018/</a> [accessed 26 September 2018]
Burn-Murdoch, A. (2017, June 21). Local Government finance: facts and figures 2011-12 to 2017-18. Retrieved from <a href="https://digitalpublications.parliament.scot/ResearchBriefings/Report/2017/6/21/Local-Government-Finance--facts-and-figures-2010-11-to-2017-18#" target="_blank">https://digitalpublications.parliament.scot/ResearchBriefings/Report/2017/6/21/Local-Government-Finance--facts-and-figures-2010-11-to-2017-18#</a> [accessed 23 November 2017]
Berthier, A., Burn-Murdoch, A., Aiton, A., & Finnigan, K. (2018, November 9). Local Government Finance: The funding formula and local taxation income. Retrieved from <a href="https://digitalpublications.parliament.scot/ResearchBriefings/Report/2018/11/9/Local-Government-finance--the-Funding-Formula-and-local-taxation-income#" target="_blank">https://digitalpublications.parliament.scot/ResearchBriefings/Report/2018/11/9/Local-Government-finance--the-Funding-Formula-and-local-taxation-income#</a> [accessed 28 November 2018]
Accounts Commission. (2018, April 5). Local government in Scotland: Challenges and performance 2018. Retrieved from <a href="http://www.audit-scotland.gov.uk/report/local-government-in-scotland-challenges-and-performance-2018" target="_blank">http://www.audit-scotland.gov.uk/report/local-government-in-scotland-challenges-and-performance-2018</a> [accessed 18 September 2018]
National Records of Scotland. (2018, March 28). Population Projection for Scottish Areas (2016 Based). Retrieved from <a href="https://www.nrscotland.gov.uk/files//statistics/population-projections/sub-national-pp-16/pop-proj-principal-2016-tab-publication.pdf" target="_blank">https://www.nrscotland.gov.uk/files//statistics/population-projections/sub-national-pp-16/pop-proj-principal-2016-tab-publication.pdf</a> [accessed 6 December 2018]
Dundee City Council. (2016). About Dundee. Retrieved from <a href="https://www.dundeecity.gov.uk/sites/default/files/publications/aboutdundee2016.pdf" target="_blank">https://www.dundeecity.gov.uk/sites/default/files/publications/aboutdundee2016.pdf</a> [accessed 6 December 2018]
Dundee Partnership. (2017). Dundee City Plan 2017-2026. Retrieved from <a href="https://www.dundeecity.gov.uk/sites/default/files/publications/cityplan.pdf" target="_blank">https://www.dundeecity.gov.uk/sites/default/files/publications/cityplan.pdf</a> [accessed 6 December 2018]
Fife Council. (2017). Plan for Fife: 2017-2027’. Retrieved from <a href="http://publications.fifedirect.org.uk/c64_Plan_for_Fife_FPB_21nov17.pdf" target="_blank">http://publications.fifedirect.org.uk/c64_Plan_for_Fife_FPB_21nov17.pdf</a> [accessed 6 December 2018]
Fairer Fife Commission. (2015). Fairness Matters. Retrieved from <a href="https://publications.fifedirect.org.uk/c64_Fairness_Matters_Report_2015.pdf" target="_blank">https://publications.fifedirect.org.uk/c64_Fairness_Matters_Report_2015.pdf</a> [accessed 6 December 2018]
Fife Council. (2017). Fife Strategic Assessment 2017. Retrieved from <a href="http://publications.fifedirect.org.uk/c64_StrategicAssessment2017final.pdf" target="_blank">http://publications.fifedirect.org.uk/c64_StrategicAssessment2017final.pdf</a> [accessed 6 December 2018]
North Ayrshire Council. (2015). Council Plan 2015-2020. Retrieved from <a href="https://www.north-ayrshire.gov.uk/Documents/CorporateServices/ChiefExecutive/PolicyandPerformance/council-plan/index.html" target="_blank">https://www.north-ayrshire.gov.uk/Documents/CorporateServices/ChiefExecutive/PolicyandPerformance/council-plan/index.html</a> [accessed 6 December 2018]
North Ayrshire Community Planning Partnership. (2018). Fair for All. Retrieved from <a href="http://www.northayrshire.community/wp-content/uploads/sites/60/2018/08/Fair-for-All-Strategy-Update.pdf" target="_blank">http://www.northayrshire.community/wp-content/uploads/sites/60/2018/08/Fair-for-All-Strategy-Update.pdf</a> [accessed 6 December 2018]
Scotland's Centre for Regional Inclusive Growth. (2017). North Ayrshire Inclusive Growth Diagnostic. Retrieved from <a href="http://www.inclusivegrowth.scot/wp-content/uploads/2018/06/SCRIG-Content-North-Ayrshire-Inclusive-Growth-Diangostic-FINAL-1.pdf" target="_blank">http://www.inclusivegrowth.scot/wp-content/uploads/2018/06/SCRIG-Content-North-Ayrshire-Inclusive-Growth-Diangostic-FINAL-1.pdf</a> [accessed 6 December 2018]
North Ayrshire Council. (2017). Smarter Ways of Working: A Digital Strategy for North Ayrshire Council. Retrieved from <a href="https://www.north-ayrshire.gov.uk/Documents/CorporateServices/ITCustServices/digital-strategy.pdf" target="_blank">https://www.north-ayrshire.gov.uk/Documents/CorporateServices/ITCustServices/digital-strategy.pdf</a> [accessed 6 December 2018]