Local Government Finance: Budget 2019-20 and provisional allocations to local authorities
This briefing focuses on both the overall and individual allocations to local authorities within the Scottish Budget 2019-20. Another briefing has been published by SPICe, covering the overall Budget 2019-20.
Executive summary
This briefing sets out a summary and analysis of the local government budget for 2019-20, and the provisional allocations to local authorities.
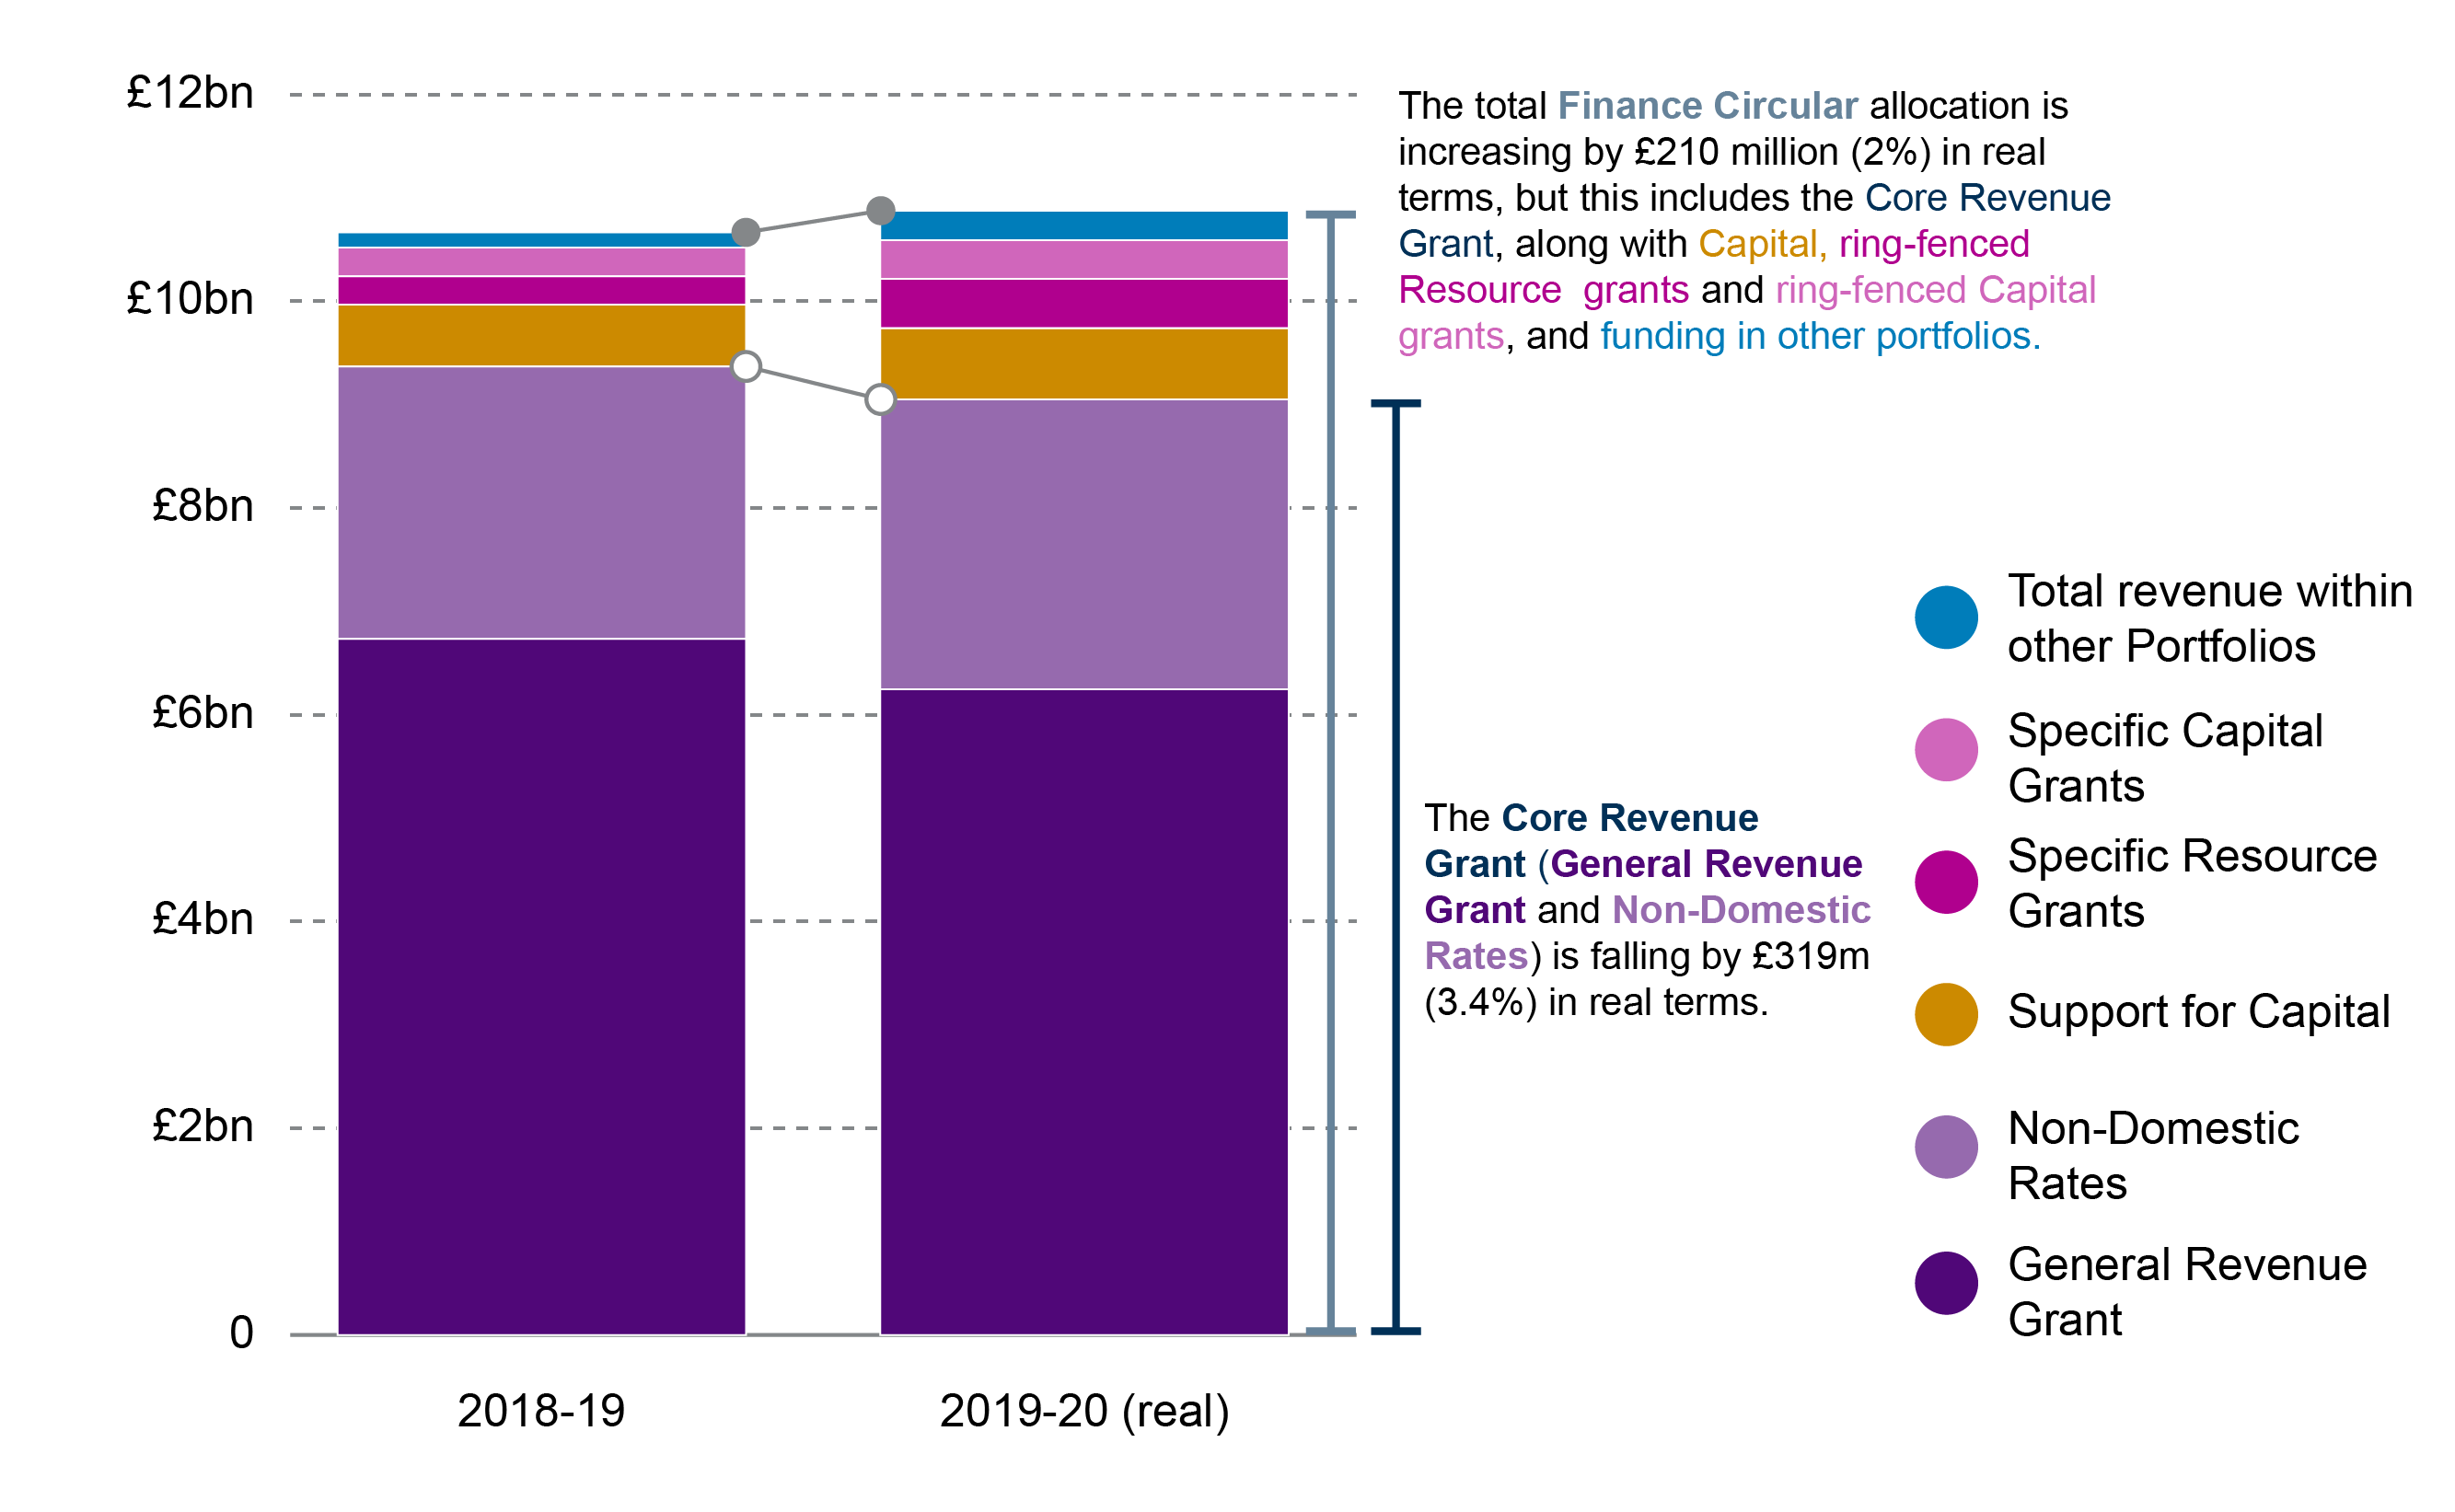
The total allocation to local government in the 2019-20 Budget is £10,779.9 million. This is mostly made up of General Revenue Grant (GRG) and Non-Domestic Rates Income (NDRI), with smaller amounts for General Capital Grant and Specific (or ring-fenced) Revenue and Capital grants. This represents a 2.5% increase in cash terms, or a 0.7% increase in real terms.
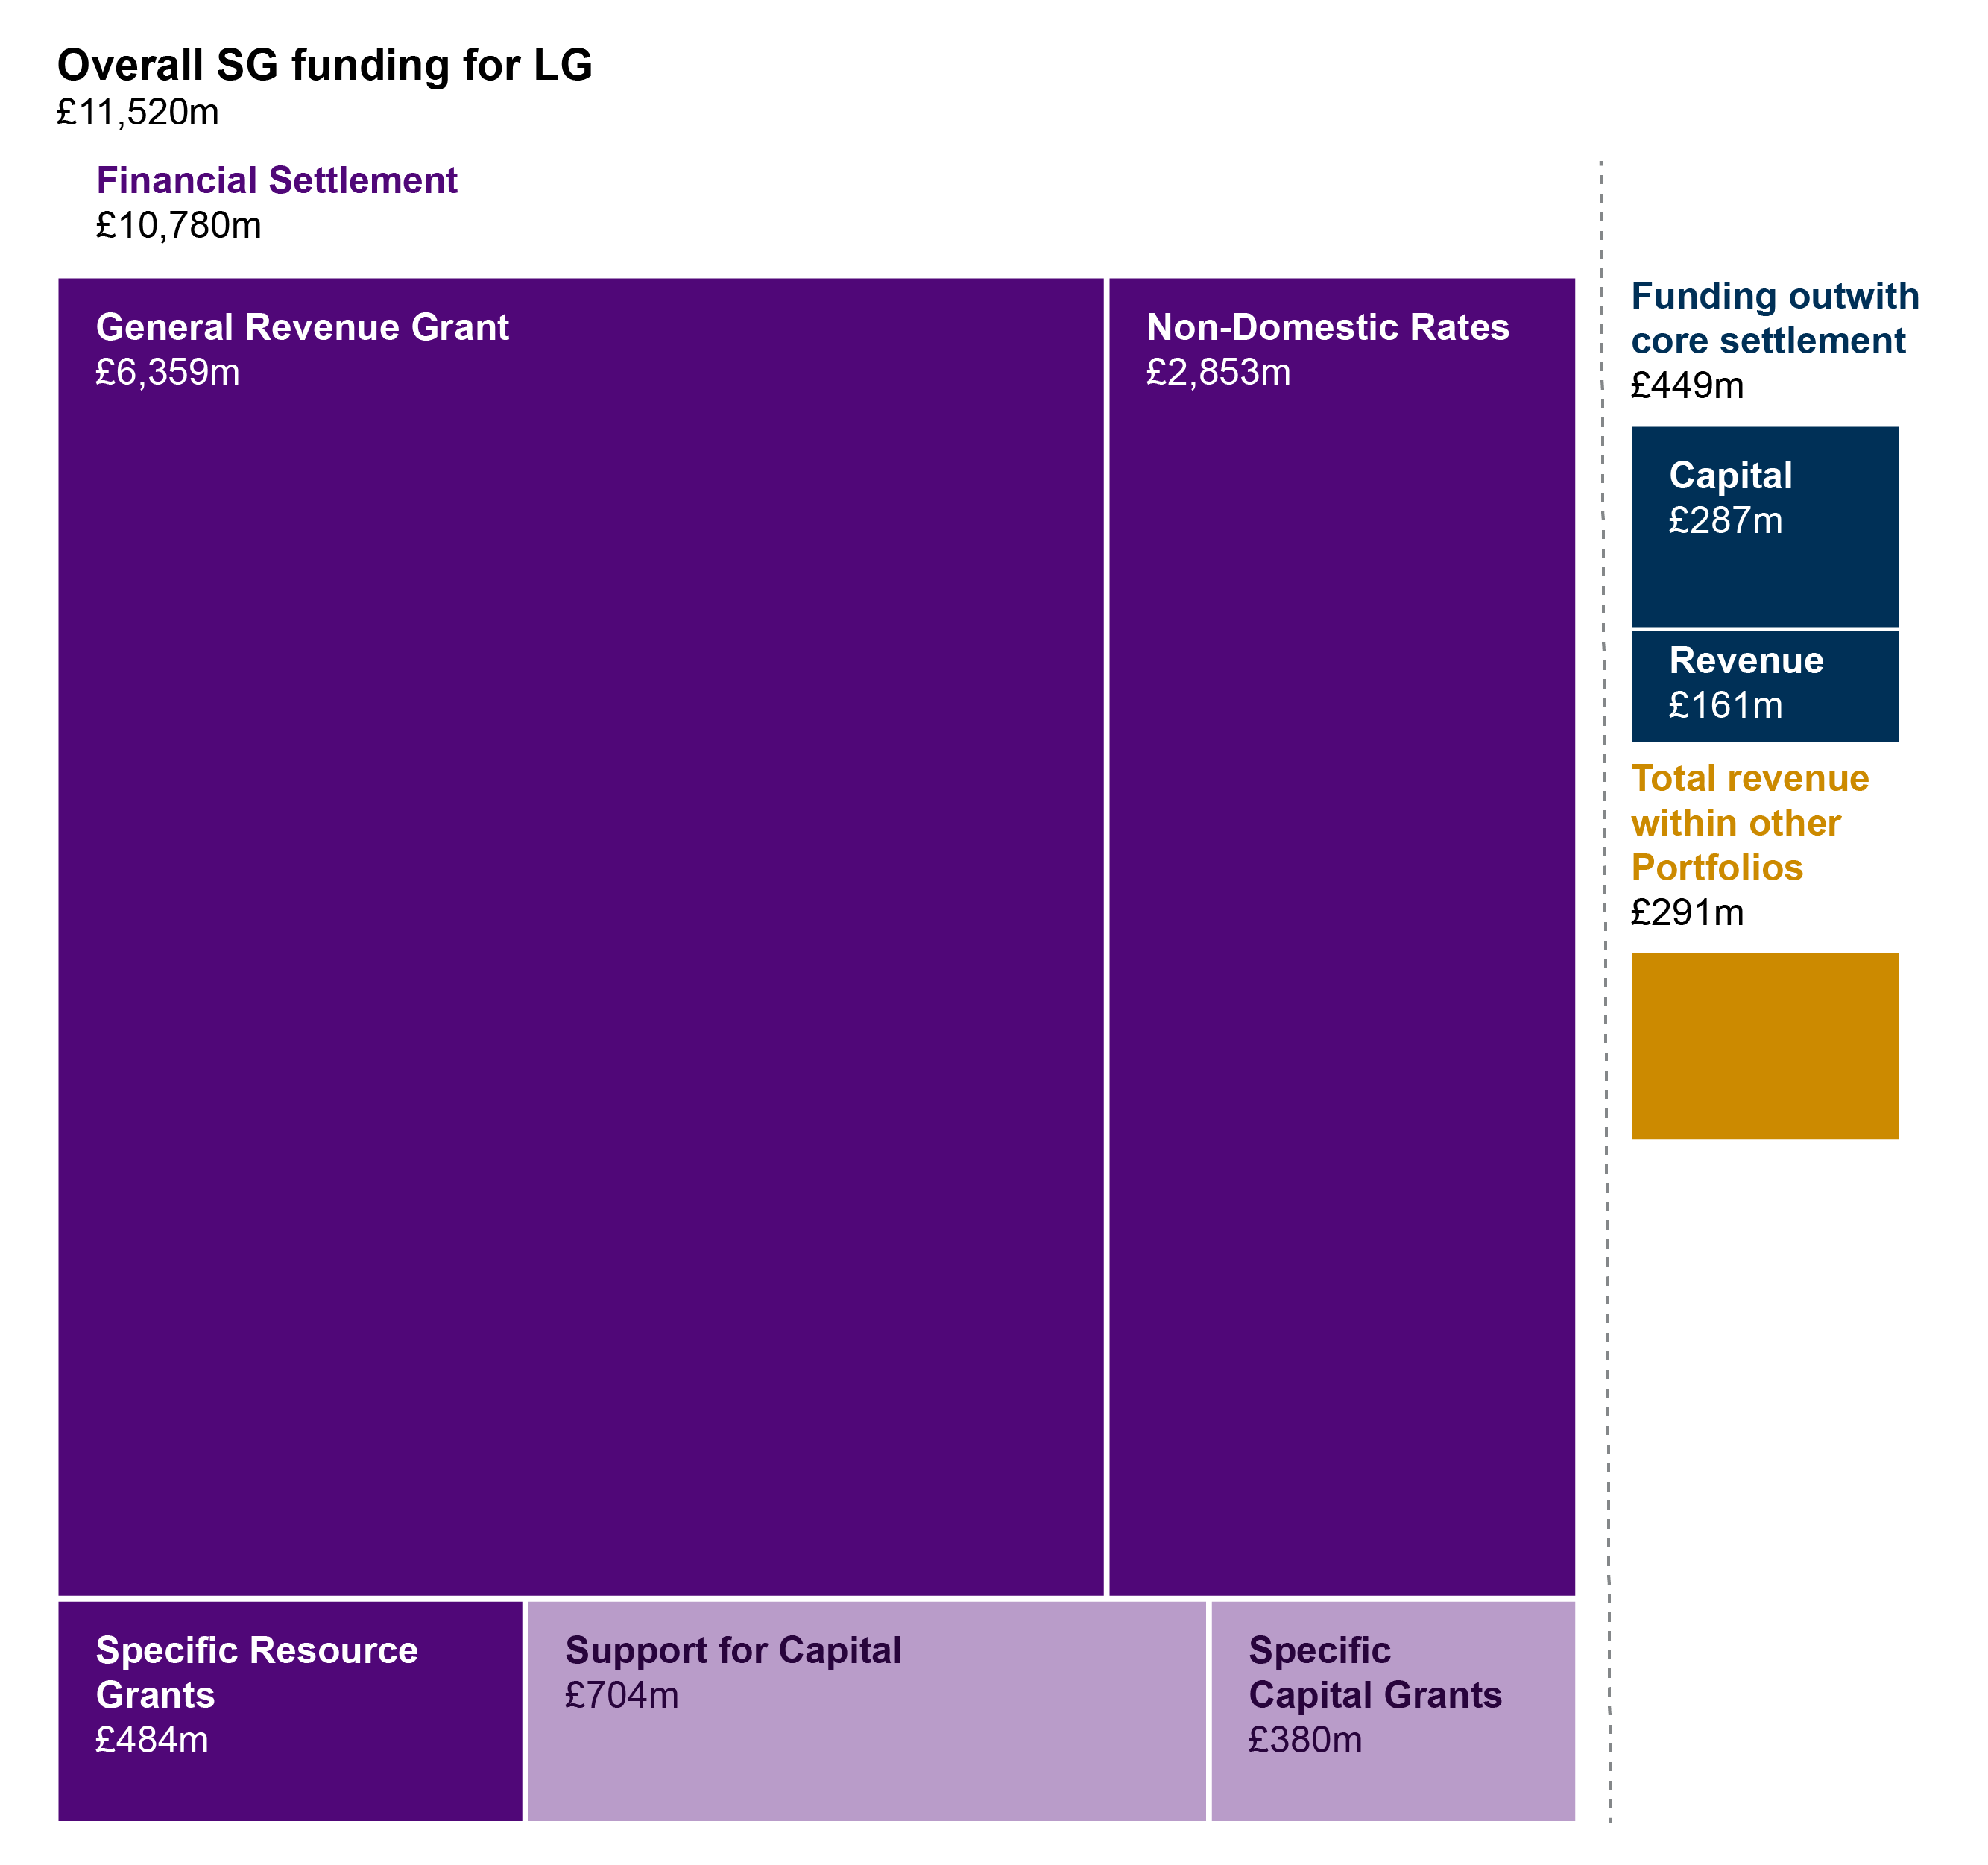
Once Revenue funding within other portfolios (but still from the Scottish Government to local authorities) is included, the total is £11,071.2 million, a cash increase of 3.8% (£405.1 million), or 2% (£210.5 million) in real terms. This £210 million real terms figure was used by the Cabinet Secretary as the headline Local Government figure in his Budget speech1.
However, when looking specifically at the non-ringfenced Revenue funding available for councils to deliver services (GRG+NDRI) this falls by 1.7% (-£157.2 million) in cash terms, or 3.4% (-£319.1 million) in real terms between 2018-19 and 2019-20.
Figure 1 below illustrates how these different interpretations of the local government funding are constructed.

Scottish Government. (2018, December 12). Scottish Budget 2019-20. Retrieved from https://www.gov.scot/publications/scottish-budget-2019-20/ [accessed 14 December 2018]
Other key points to note on local government funding in 2019-20:
Non-Domestic Rates Income sees a dramatic increase, of 8.2% (£217 million) in cash terms, or 6.3% (£166.8 million) in real terms. £100 million of this increase comes from a decision to include forecast funds from future years to the 2019-20 Budget.
The increase in Non-Domestic Rates, as well as an increase in Specific Revenue Grants, masks a fall in the General Revenue Grant, which is down 5.6% (-£374.2 million) in cash terms, or 7.2% (-£486 million) in real terms. However, again, it should be noted that the Government guarantees the combined GRG and distributable NDRI figure, approved by Parliament, to each local authority.
In 2019-20, Total Capital funding increases by 23.7% in cash terms (£207.6 million), or 21.5% in real terms (£188.2 million). This increase represents a boost to both general support for Capital, and Specific Capital Grants. However, as set out in previous Budget documents, £150 million of funding which was “reprofiled” out of the local government settlement in 2016-17 has been added back into 2019-20. If this sum were removed, “Support for Capital” would fall significantly in both cash (-7.5%) and real (-9.1%) terms.
Between 2013-14 and 2018-19 (therefore not including 2019-20 allocations) the local government Revenue budget fell at a steeper rate (-7.1%) than the Scottish Government Revenue Budget (-0.8%) (including Non-Domestic Rates Income on both sides).
The Scottish Government has set a 3% cap on Council Tax increases in 2019-20. This could potentially raise an additional £80 million for local authorities, if all 32 agree to raise Council Tax by the maximum 3%.
Understanding the local government budget
Funding for local authorities in Scotland is drawn from a number of sources, but by far the greatest portion of funding comes from the settlement from the Scottish Government. In recent years this has been announced at the point of the Draft Budget, and subsequently updated in advance of the Budget Bill. In addition, further allocations to local authorities are made in-year.
Following the recommendations of the Budget Process Review Group1, a new Budget process was introduced for 2019-20, in which there is no Draft Budget. Instead, Budget figures were announced on 12 December 2018, and further adjustments are possible as part of the Bill process.
Presenting the figures
As covered in previous SPICe briefings on the Scottish Government Draft Budget, the fiscal years (2016-171 and 2017-182) were characterised by reductions in the core grant to local authorities, together with a number of changes to the way in which the total amount of resources available to local authorities has been presented. This was followed by an uplift in Revenue funding for local government in 2018-19, and further presentational changes.
Presentation of the headline figures for local government can be complicated by-
Which number is used for the Scottish Government's direct grants to local government - either the "Total Local Government" line (which includes capital, and specific, ring-fenced grants) or the the sum of "General Resource Grant + Non-Domestic Rates Income".
Whether figures are presented in cash or real terms.
Whether figures for "Total Estimated Expenditure" are used, which also include income raised from Council Tax.
Whether "Revenue funding within other Portfolios" is included, such as funding for Health and Social Care.
Additional allocations made, and the financial year in which these allocations are accounted for. For instance, at Stage 1 of the Budget Bill in 2018-19, the Scottish Government announced that £34.5 million of additional funding for 2018-19 would be paid in 2017-18. This £34.5 million was part of the 2018-19 settlement but as it was funded from Scottish Government underspends in 2017-18 it was actually paid on 28 March 2018 and was recorded as funding in the 2017-18 financial year.
Taken together, different combinations of these issues can lead to huge variations in the headline £ million and percentage change figures that are presented. This issue was discussed in detail during the 2017-18 parliamentary budget process. For 2018-19, the Government made a number of changes to make presentation of the local government numbers clearer and easier to follow. This is discussed in the Transparency section of the 2018-19 briefing on Draft Budget and provisional allocations to local authorities3. The transparency changes made for the 2018-19 Draft Budget have been replicated for the 2019-20 Budget. Again, SPICe welcomes these changes, which make the complex local government budget process somewhat easier to follow.
The local government funding formula
The Scottish Government estimates how much local government needs to fund the services it provides. It then applies a needs-based formula to allocate the total available funding. Once these initial allocations are calculated, the Scottish Government adjusts these initial figures using the Main Funding Floor, to ensure that no council is disproportionately disadvantaged in its year-on-year funding allocations. This provides those local authorities with reducing need an opportunity to reduce their spending to match their reducing funding. From this total, Council Tax income, Distributable Non-Domestic Rates income, and specific revenue grants are deducted to obtain the General Resource Grant (GRG), which together with the Distributable Non-Domestic Rates income makes up the guaranteed non-ring-fenced funding the Scottish Government provides to local government. A further funding floor is applied to ensure that no local authority receives less than 85% of the Scottish average of per head Revenue funding, and finally, a figure for Distributable revenue funding is reached.
The Scottish Government agrees with COSLA the Total Revenue funding that will be made available for the duration of the Spending Review. However, in recent years, the Draft Budget has been presented as a single-year budget. This is the same for the 2019-20 Budget.
The funding formula for local government is set out in full in the 'Green Book' for Grant Aided Expenditure1, and the local government funding formula, as well as how the Scottish Government takes into account income from Council Tax and Non-Domestic Rates, is discussed in detail in the SPICe briefing Local Government Finance: The funding formula and local taxation income2.
Budget 2019-20 - Local government funding
Local government total allocations
The total allocation to local government in the 2019-20 Budget is £10,779.9 million. This is mostly made up of General Revenue Grant (GRG) and Non-Domestic Rates Income (NDRI), with smaller amounts for General Capital Grant and Specific (or ring-fenced) Revenue and Capital grants.
Once Revenue funding within other portfolios (but still within the totals in the Finance Circular) is included, the total is £11,071.2 million. Further, once a number of funding streams attached to particular portfolio policy initiatives, but outside the totals in the Circular are included, the total rises to £11,519.9 million. Figure 2 below illustrates these different funding streams.
Funding figures are drawn from tables 6.10, 6.14 and 6.15 of the Scottish Budget 2019-20 documentScottish Government. (2017). Scottish Budget: Draft Budget 2018-19. Retrieved from http://www.gov.scot/Resource/0052/00529171.pdf
Of course, aside from government grant, Non-Domestic Rates Income, and income from the Council Tax, local authorities also receive a range of other income, mainly from sales, and fees and charges for services. However, while this is an important part of the bigger picture of local authority finance, this other income does not play a part in the annual budget process. In addition, amounts are generally not known until outturn data is available, often around a year after the end of the fiscal year in question.
Central and local government, and different political parties, will have different preferences for what to include when discussing funding for local government. In this briefing, as before, SPICe has set out how different figures are arrived at, to allow for the greatest transparency in parliamentary scrutiny.
The Convention of Scottish Local Authorities (COSLA) sets out, in its "Budget Reality" figures, its own interpretation of the settlement. This has been calculated by combining GRG, NDRI and Revenue funding in other portfolios, then adding in £34.5 million that was paid in 2017-18 but used as part of the 2018-19 Budget back to 2018-19. From this figure, COSLA then deduct around £400 million of new commitments from the funding package, to produce their figure for the "cut to the core budget". Prior to the budget, COSLA published Fair Funding for Essential Services, which outlined COSLA's approach in some detail.
Our approach
In the total allocations section, we set out the different totals for local government. However, in the remainder of this section of the briefing, which focuses on the year on year change figures, we concentrate on the numbers within the central local government budget - that is, the breakdown of the £10,779.9 million figure in Table 6.14 of the Budget, and the headline numbers in the Local Government Finance Circular
The Scottish Government guarantees the combined GRG and distributable NDRI figure, approved by Parliament, to each local authority. If NDRI is lower than forecast, this is compensated for by an increase in GRG and vice versa. Therefore, to calculate Local Government's Revenue settlement, the combined GRG + NDRI figure is used. Further detail on NDRI within the Budget 2019-20 can be found in the main SPICe briefing on the Budget 2019-20.
This briefing, reflecting recent changes to the Budget process and in line with the Scottish Government's presentation, compares Budget 2019-201 figures to those 2018-19 figures presented in the Budget document for overall figures. On the advice of the Scottish Government, individual allocations to local authorities are compared to the local government finance circular published in March 2018, which accompanied the Local Government Finance Order. Figures are given in both cash and real (2018-19), £million and percentage, terms.
In this briefing we sometimes refer to the "core" revenue settlement. We use this as shorthand to refer to the discretionary element of the local government revenue settlement - i.e. the amount of money to deliver services over which local authorities have control. There is no agreed definition of what constitutes the "core" - COSLA in "Fair Funding for Essential Services 2019-20" goes into detail on its view of the core budget, and makes a clear distinction between "core" and "initiative" funding. However, the Scottish Government's view is that core revenue funding should include specific, ring fenced grants, in addition to GRG and NDRI as this also provides funding to support delivery of core services such as education.
Local government budget breakdown
Headline figures
Table 1 below sets out the breakdown of the total local government budget, as set out in the Budget 2019-20 document, in cash and real terms.
| Local Government | 2018-19 | 2019-20 (cash) | Cash change | Cash change % | 2019-20 (real) | Real change | Real change % |
|---|---|---|---|---|---|---|---|
| General Revenue Grant | 6,733.5 | 6,359.3 | -374.2 | -5.6% | 6,247.5 | -486.0 | -7.2% |
| Non-Domestic Rates | 2,636.0 | 2,853.0 | 217.0 | 8.2% | 2,802.8 | 166.8 | 6.3% |
| Support for Capital | 598.4 | 703.8 | 105.4 | 17.6% | 691.4 | 93.0 | 15.5% |
| Specific Resource Grants | 273.7 | 483.6 | 209.9 | 76.7% | 475.1 | 201.4 | 73.6% |
| Specific Capital Grants | 278.0 | 380.2 | 102.2 | 36.8% | 373.5 | 95.5 | 34.4% |
| Local Government Advice and Policy | - | 3.0 | - | - | - | - | - |
| Total Level 2 | 10,519.6 | 10,782.9 | 263.3 | 2.5% | 10,593.3 | 73.7 | 0.7% |
| GRG+NDRI | 9,369.5 | 9,212.3 | -157.2 | -1.7% | 9,050.4 | -319.1 | -3.4% |
| GRG, NDRI and SRG | 9,643.2 | 9,695.9 | 52.7 | 0.5% | 9,525.5 | -117.7 | -1.2% |
| Total Capital | 876.4 | 1,084.0 | 207.6 | 23.7% | 1,064.9 | 188.5 | 21.5% |
The total allocation to local government in the 2019-20 Budget is £10,779.9 million, a 2.5% increase in cash terms, or a 0.7% increase in real terms, since 2018-19. This is mostly made up of General Revenue Grant (GRG) and Non-Domestic Rates Income (NDRI), with smaller amounts for General Capital Grant and Specific (or ring-fenced) Revenue and Capital grants.
Once Revenue funding within other portfolios (but still from the Scottish Government to local authorities) is included, the total is £11,071.2 million, a cash increase of 3.8% (£405.1 million), or 2% (£210.5 million) in real terms. This £210 million real terms figure was used by the Cabinet Secretary as the headline Local Government figure in his Budget speech1.
The General Revenue Grant, combined with Non-Domestic Rates represents the core settlement available to local authorities to deliver services. When looking specifically at the non-ringfenced funding available for councils to deliver services, GRG+NDRI, this falls by 1.7% (-£157.2 million) in cash terms, or 3.4% (-£319.1 million) in real terms between 2018-19 and 2019-20.
Figure 3, reproduced from the Executive Summary, shows clearly how these two different headline figures are constructed from different elements of local government funding. Full figures can be found in Table 1 of the Annex.
Further detail and alternative interpretations
Below is further detail on the different components of funding, and some other, alternative ways of interpreting the figures.
Non-Domestic Rates Income sees a dramatic increase, of 8.2% (£217 million) in cash terms, or 6.3% (£166.8 million) in real terms. It should be noted that £100 million of this increase comes from a decision to include forecast funds from future years to the 2019-20 Budget.
The Statutory Background to the Non Domestic Rating Account is set out in the annual account. The legislation makes it clear that all non-domestic rates collected must be redistributed but it does not give any timescale for doing so. The account states that, if there is a surplus, it is carried forward by debiting the account for the year and crediting the next year's account, so increasing the amount available for redistribution the following year. A deficit is carried forward by crediting the account for the year and debiting the next year's account (Schedule 12, Paragraph 8). This account demonstrates that, looking at the non-domestic rates account over a number of years, all non-domestic rates paid to Scottish Ministers are redistributed to authorities.
When looking at GRG + NDRI, and also taking Specific Revenue Grants into account, there is a 0.5% cash increase in Total Revenue Funding for 2019-20 (+£52.7 million). In real terms, this results in a reduction of 1.3% (-£120.6 million). However, again, it should be noted that there is a sizeable increase in Specific Revenue Grants in 2018-19 – 76.7% (£209.9 million) in cash terms, or 73.6% (£95.5 million).
Total Capital funding increases by 23.7% in cash terms (£207.6 million), or 21.5% in real terms (£188.2 million). This increase represents a boost to both general support for Capital, and Specific Capital Grants. It should be noted, however, that, as set out in previous Budget documents, £150 million of funding which was “reprofiled” out of the local government settlement in 2016-17 has been added back into 2019-20. If this sum were removed, “Support for Capital” would fall significantly in both cash (-7.5%) and real (-9.1%) terms.
Historical changes
The briefing, Local government finance: facts and figures 2013-14 to 2018-19 also looked at real terms change over time, comparing the local government settlement to the Scottish Government budget. Figure 4 updates the outturn data shown in Figure 3 from the facts and figures briefing.
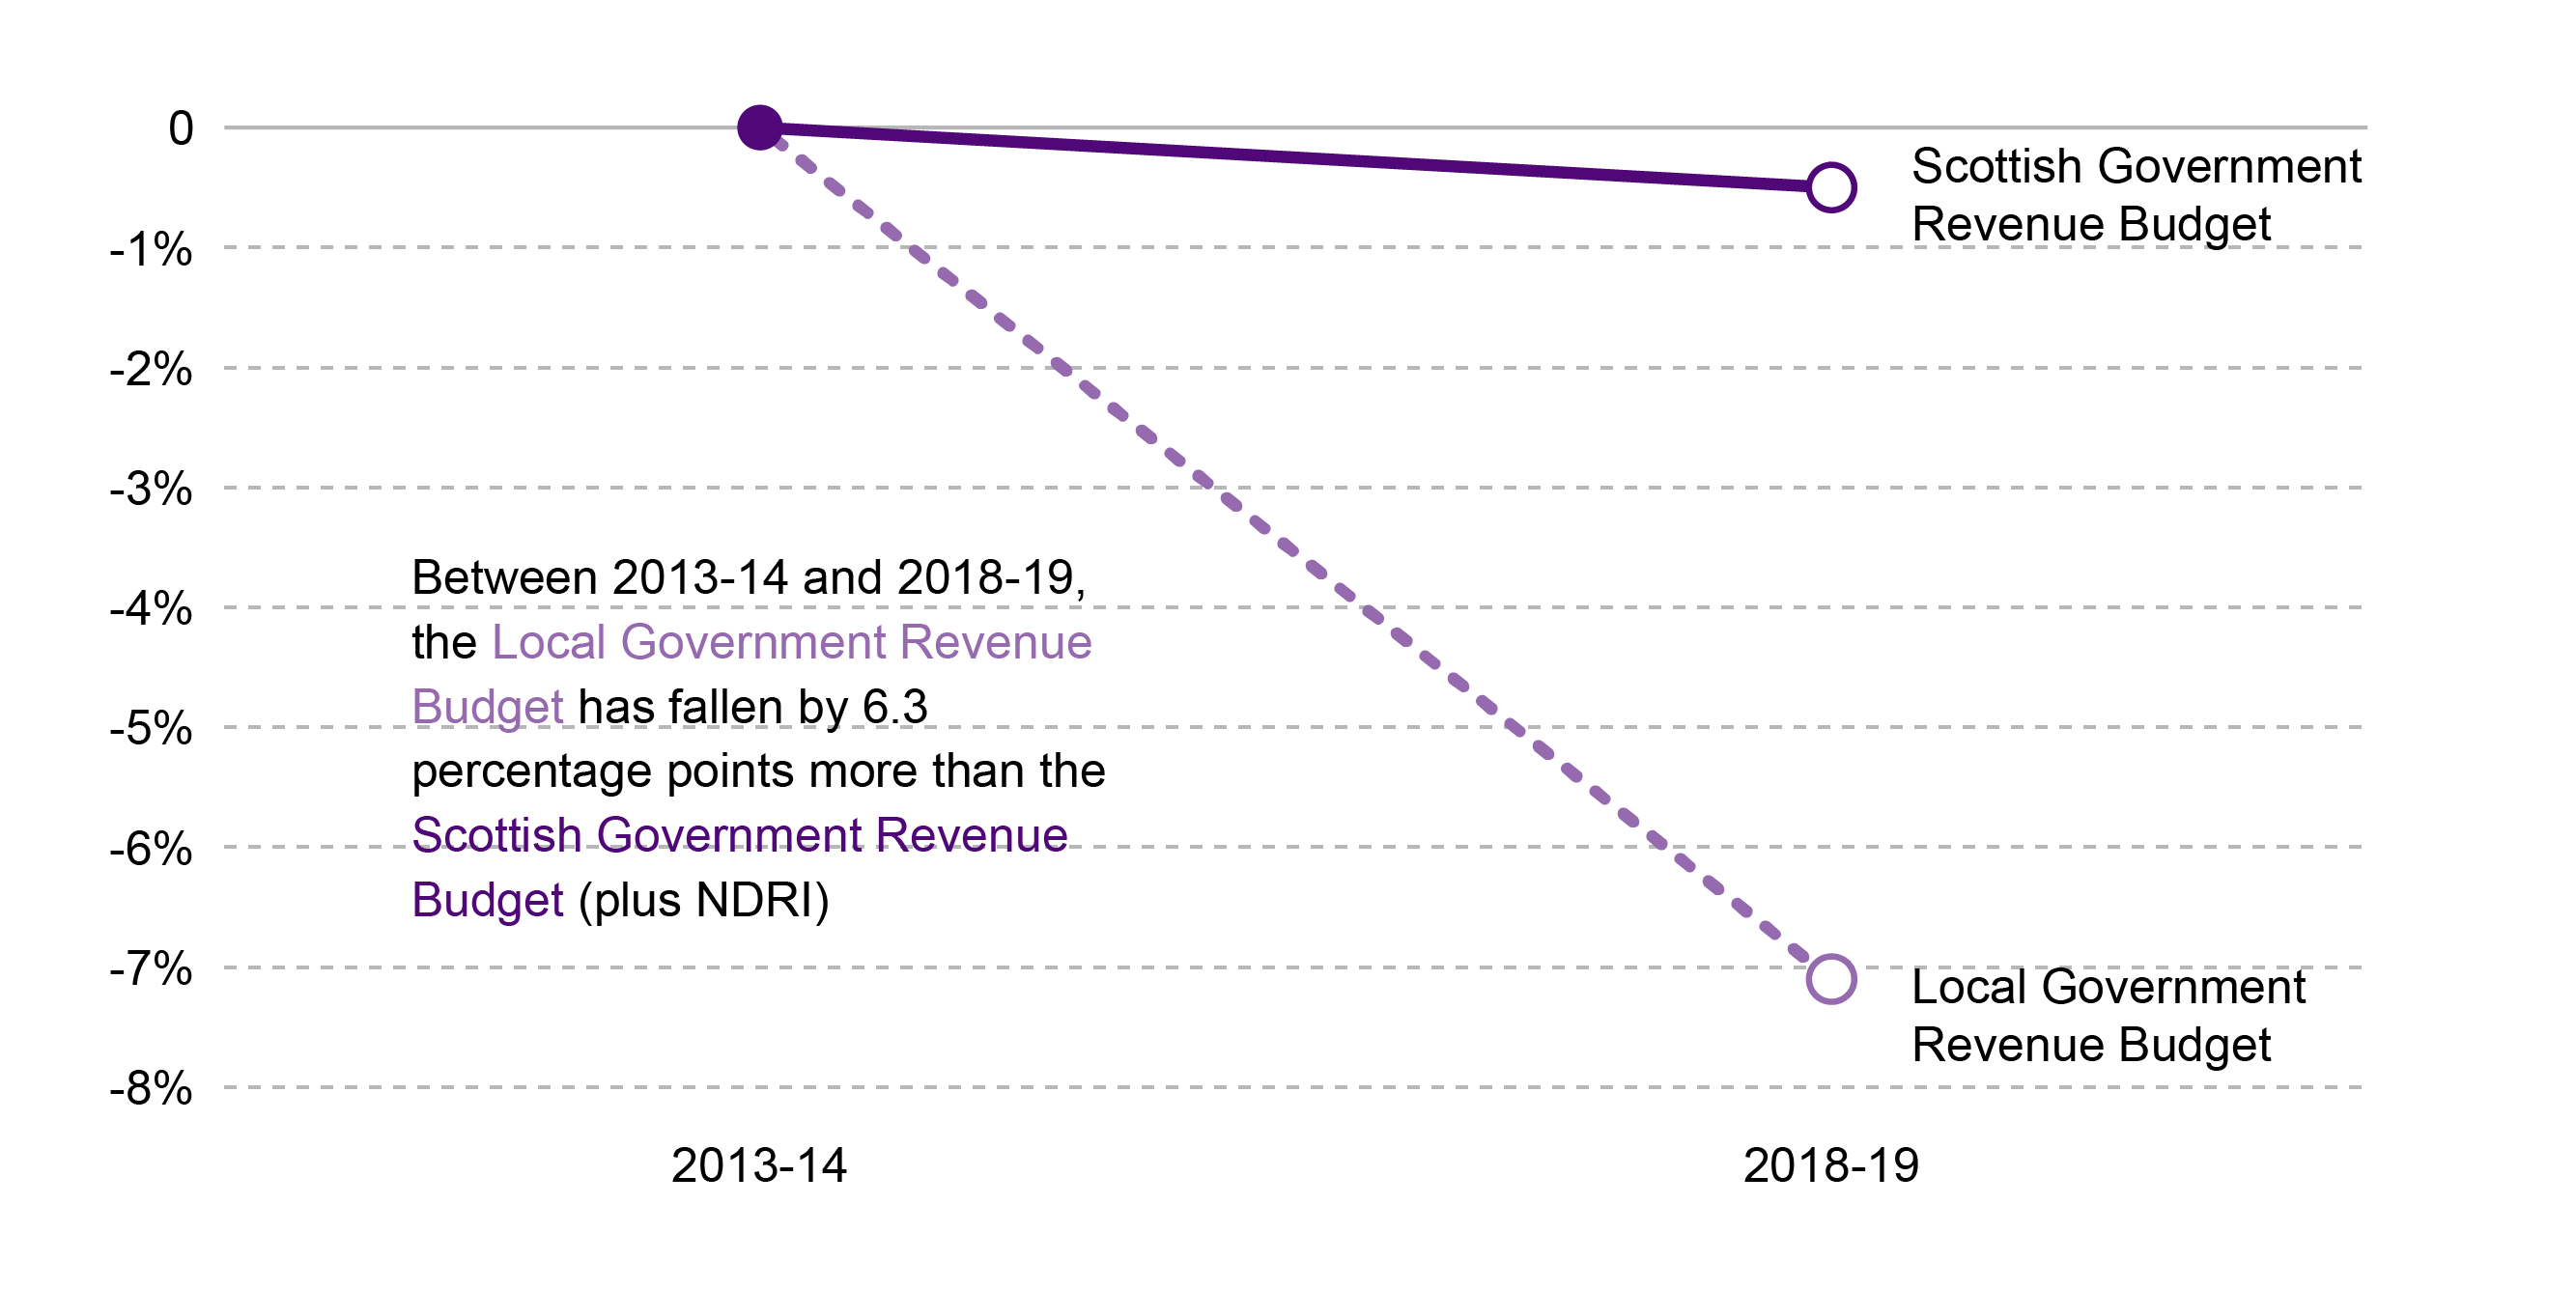
Local Government figures are based on "Total Revenue" outturn figures from the Local Government Finance Circulars (6/2013 and 8/2018) Annex A, and include ring-fenced grants and NDRI. Scottish Government figures are based on the Scottish Government's Fiscal Resource Budget Limit plus NDRI.
This updated figure shows that the real terms trends previously observed have continued. Between 2013-14 and 2018-19 the local government Revenue budget fell at a steeper rate (-7.1%) than the Scottish Government Revenue Budget (-0.8%) (including NDRI). This does not show year-on-year changes - a further breakdown of long term trends for individual local authorities will be included in the forthcoming 2019 SPICe facts and figures briefing (expected Spring 2019).
Allocations to local authorities
Local Government Finance Circular 8/20181 was published a few days after the Budget, on 17 December 2018, and contains provisional allocations to local authorities.
Allocations in the circular are provisional and subject to consultation, therefore local authorities should not set their final budgets on the basis of these figures. Any local authority not intending to agree the offer, and associated terms, must notify the Scottish Government by 18 January 2019. This is also the date by which any discrepancies identified by local authorities or COSLA should be raised with the Scottish Government.
Consultation on the figures presented in the circular will take place between the Scottish Government and COSLA in advance of the Local Government Finance (Scotland) Order 2019 being presented to the Scottish Parliament in late February 2019. Final allocations will be published in a circular in late February.
Provisional Revenue allocations
In order to account for additional funding allocated at Stage 1 of the Budget process for 2018-19, along with the new Budget process, the Scottish Government have confirmed that the most accurate basis for comparison would be to compare provisional allocations from Finance Circular 8/2018, published to accompany the Budget 2019-20, to figures from the March 2018 finance circular (4/2018). It should be noted that there are significant funds still to be distributed in 2019-20, and therefore final figures will be higher.
Figures for real terms change, per head allocations and percentage of the Scottish average are based on Total Revenue funding settlements, as set out in Column 12 of Annex B of the Local Government Finance Circulars.
Real terms change, 2018-19 to 2019-20
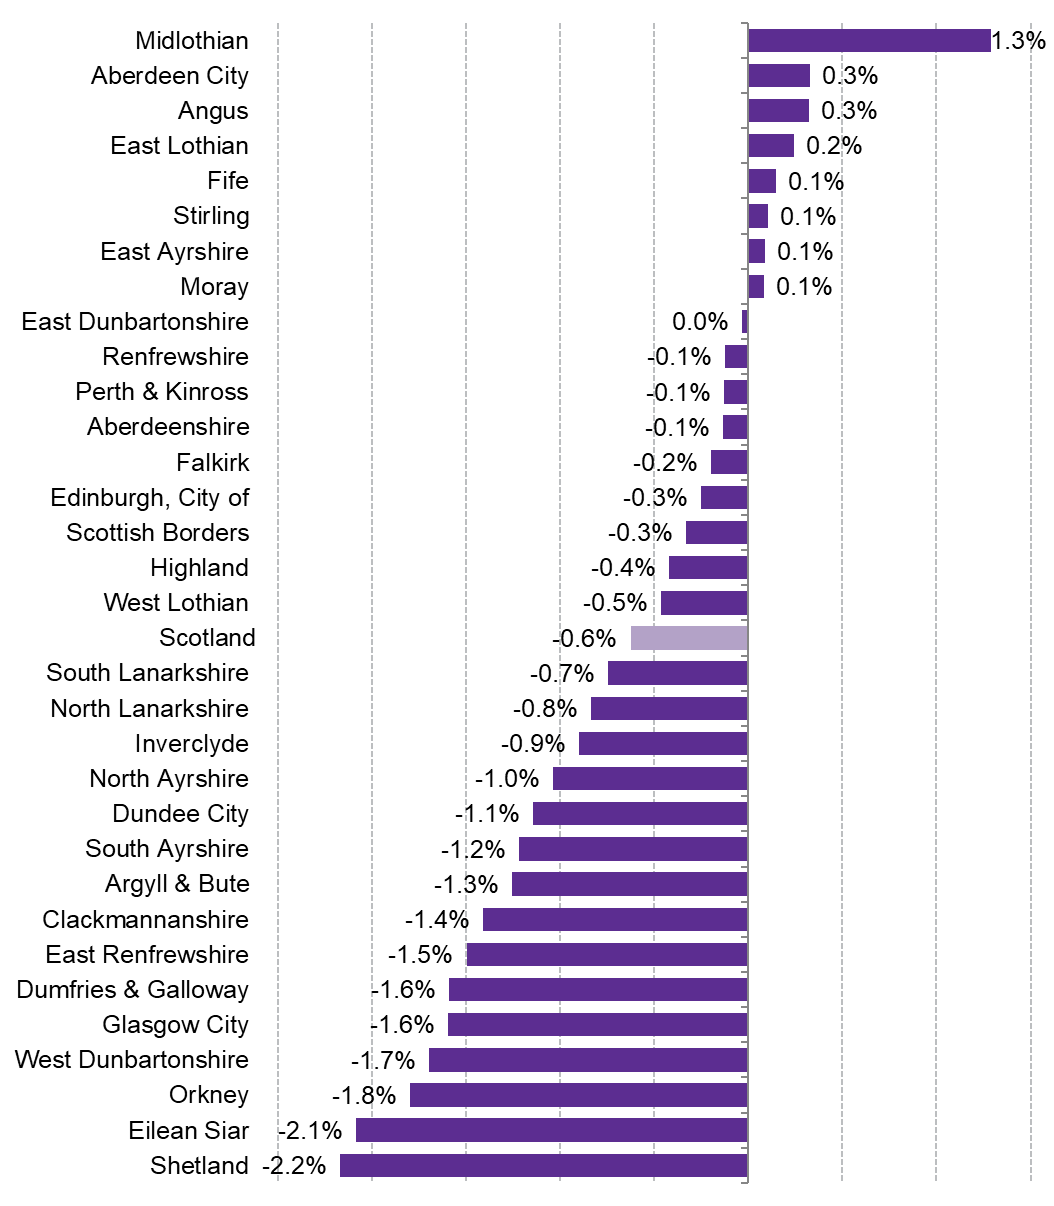
Figure 5 shows that Midlothian Council sees a real terms funding increase of 1.3%, and that eight other local authorities also see a modest real terms increase. The remaining local authorities see a fall in Revenue funding in 2019-20, with the three island authorities facing the steepest fall. Full figures are available in Table 2 of the Annex.
It is worth noting that, where Midlothian Council is concerned, the Accounts Commission's report, Local Government in Scotland: Challenges and Performance 20181, notes that Midlothian Council has seen in recent years, and is expected to see, the greatest population increase of all Scottish councils, and the greatest increase in the population of children, which are both key components of the local government funding formula.
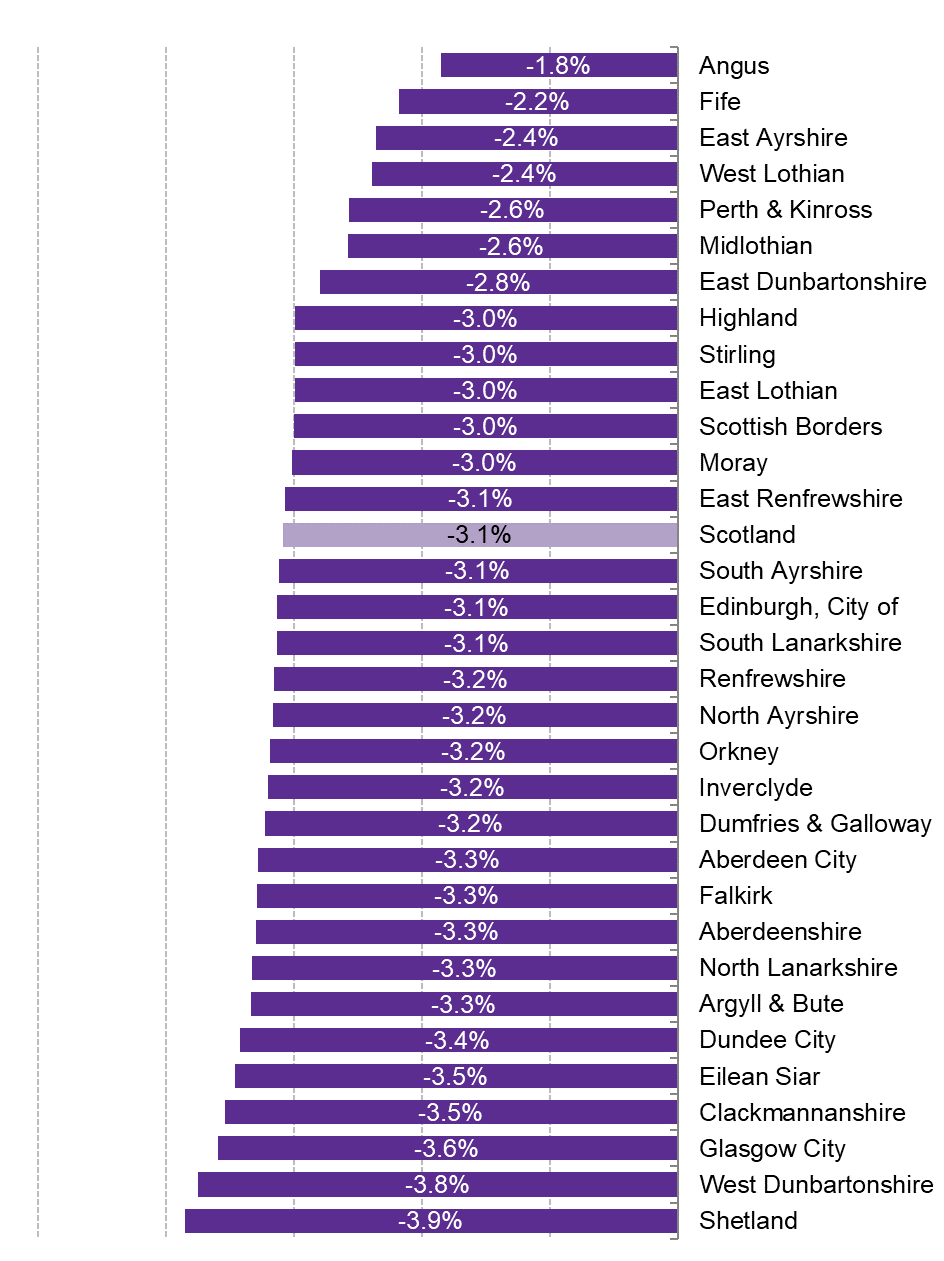
Real terms change, 2018-19 to 2019-20, excluding ring-fenced grants
As noted in the Local government budget breakdown section, the General Revenue Grant, combined with Non-Domestic Rates represents the core, discretionary settlement available to local authorities to deliver services. When looking specifically at this non-ringfenced funding available for councils to deliver services, as set out in the Budget document, this falls by 1.7% (-£157.2 million) in cash terms, or 3.4% (-£319.1 million) in real terms between 2018-19 and 2019-20.
The Government's view is that the Real terms change figures presented in the preceding section provide the best comparison with 2018-19 figures, and that excluding ring-fenced grants would mean excluding funding for some core local authority services, and joint Scottish Government and local government priorities.
However, having explored the impact that ring-fenced grants have on the overall local government settlement, and received requests for this specific information from MSPs, SPICe has also broken this down to an individual local authority level. Note that the Scotland totals in Annex Table 3 differ slightly from the headline figures noted above from the Budget, as there are some funds in the Finance Circular which have yet to be distributed to local authorities.
The following represents the change in non-ringfenced Revenue funding available for councils between 2018-19 and 2019-20. This is calculated by deducting "Total ring-fenced grants" from the "Revised Total" Revenue funding.
Revenue allocations per head
Figure 7 below shows the provisional revenue allocations on a per head basis. Full details can be found at Annex Table 4.
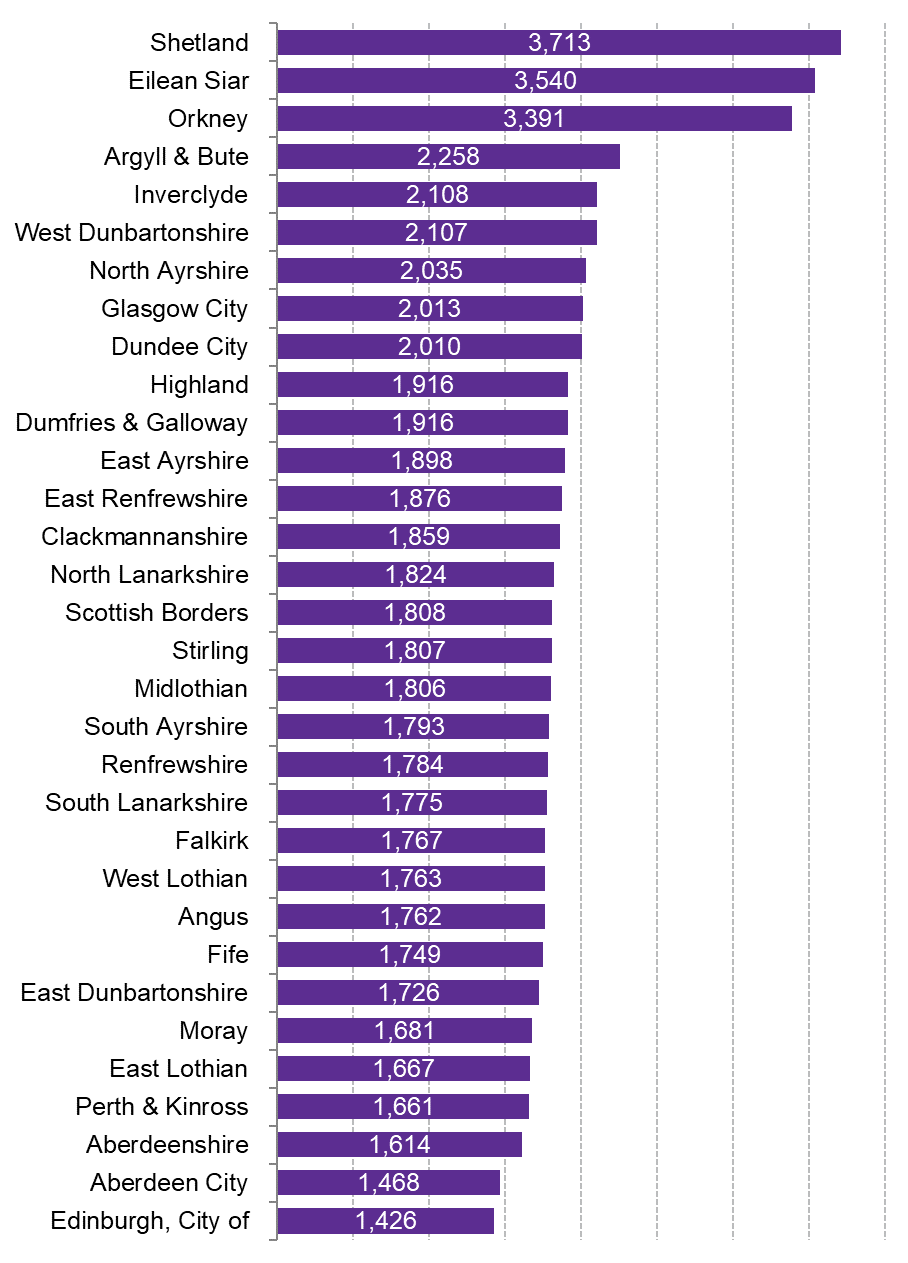
As in previous years, the three island authorities receive the greatest amount of Total Revenue funding per head, which reflects the particular circumstances of delivering public services in island communities1.
The City of Edinburgh, Aberdeen City and Aberdeenshire have the lowest allocations per head. As detailed in the SPICe briefing Local Government Finance: The funding formula and local taxation income2, two of these councils receive a high proportion of income from Council Tax (in 2018-19, this was 50% for Aberdeen City and 34% for City of Edinburgh) compared to the Scottish average of 21%).
The Scottish Government has made the commitment that no local authority will receive less than 85% of the Scottish average per head in terms of Revenue support. This includes funding from Council Tax income. The only local authority affected by this adjustment in 2019-20 is City of Edinburgh. This is a change from previous years, where Aberdeen City has been the sole recipient of funding as a result of the 85% funding floor.
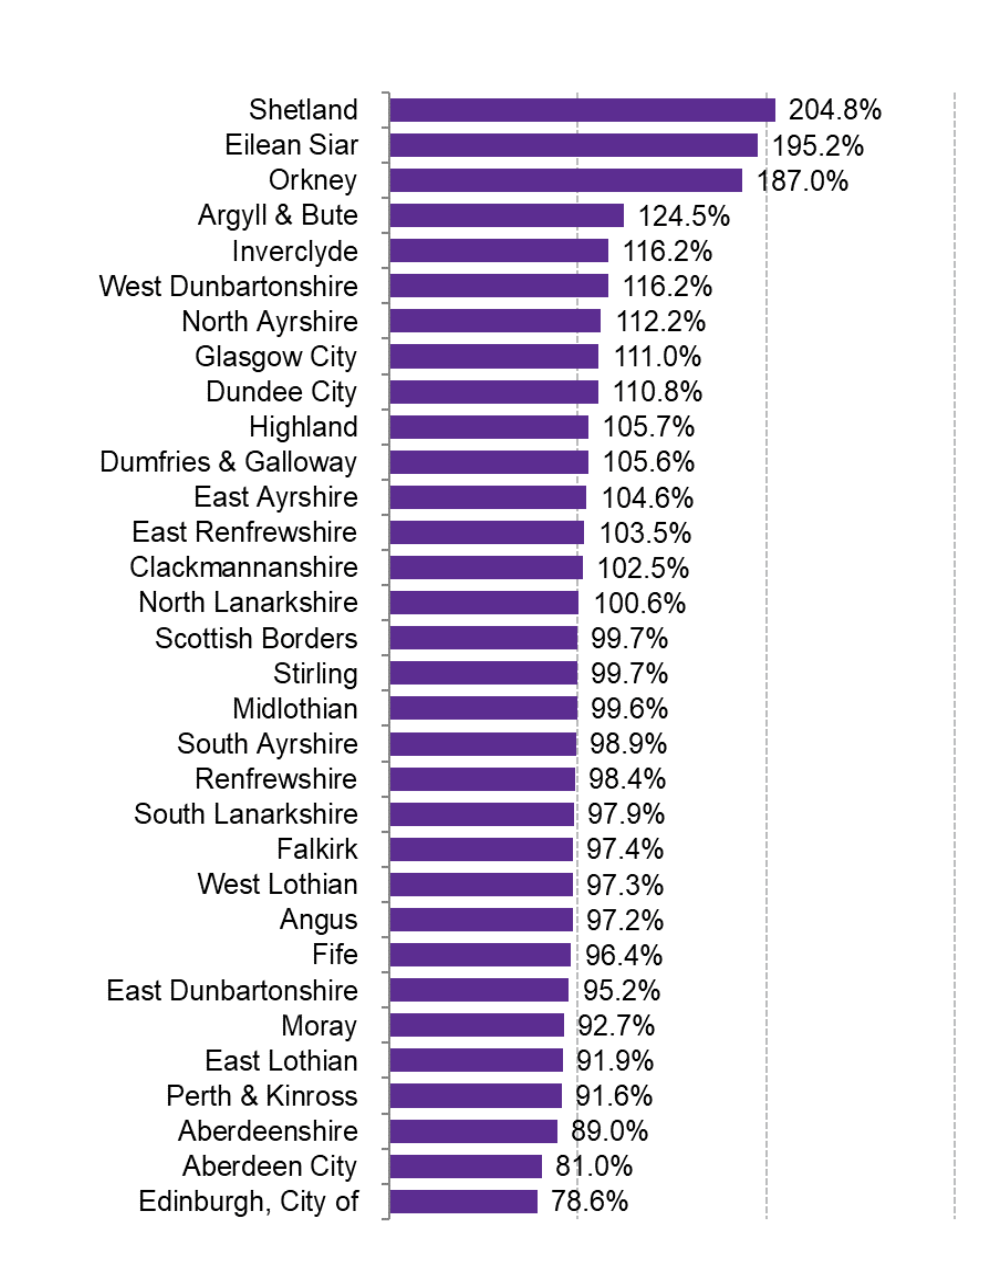
Percentage of the Scottish average
Figure 8 shows the data presented in Figure 6 in percentage terms. This shows that, as in previous years, the island authorities receive the highest amount of funding per head, whilst the City of Edinburgh, followed by Aberdeen City and Aberdeenshire, receive the lowest percentage of the Scottish average funding per head. Figures are set out in Annex Table 4.
Provisional Capital allocations
As noted in the 'Local government budget breakdown' section, Total Capital funding increases by 23.7% in cash terms (£207.6 million), or 21.5% in real terms (£188.2 million). This increase represents a boost to both general support for Capital, and Specific Capital Grants. This shows in increases across the board for local authorities, most dramatically in North Ayrshire, however it should be noted that North Ayrshire saw a dramatic fall in Capital in 2018-19.
A full breakdown of the figures, and the actual allocations for 2019-20, are in Table 5 of the Annex. These are presented for information only and figures should be treated with caution. As Capital grants can vary widely year to year depending on planned infrastructure investment, looking at Capital funding over time does not show an accurate trend in local government investment, so these figures are purely illustrative.
Annex
Table 1 - Local Government funding
| Local Government | 2018-19 | 2019-20 (cash) | Cash change | Cash change % | 2019-20 (real) | Real change | Real change % |
|---|---|---|---|---|---|---|---|
| Local Government Spending Plans (Table 6.10) | |||||||
| General Revenue Grant | 6,733.5 | 6,359.3 | -374.2 | -5.6% | 6,247.5 | -486.0 | -7.2% |
| Non-Domestic Rates | 2,636.0 | 2,853.0 | 217.0 | 8.2% | 2,802.8 | 166.8 | 6.3% |
| Support for Capital | 598.4 | 703.8 | 105.4 | 17.6% | 691.4 | 93.0 | 15.5% |
| Specific Resource Grants | 273.7 | 483.6 | 209.9 | 76.7% | 475.1 | 201.4 | 73.6% |
| Specific Capital Grants | 278.0 | 380.2 | 102.2 | 36.8% | 373.5 | 95.5 | 34.4% |
| Local Government Advice and Policy | - | 3.0 | - | - | - | - | - |
| Total Level 2 | 10,519.6 | 10,782.9 | 263.3 | 2.5% | 10,593.3 | 73.7 | 0.7% |
| GRG+NDRI | 9,369.5 | 9,212.3 | -157.2 | -1.7% | 9,050.4 | -319.1 | -3.4% |
| GRG, NDRI and SRG | 9,643.2 | 9,695.9 | 52.7 | 0.5% | 9,525.5 | -117.7 | -1.2% |
| Total Capital | 876.4 | 1,084.0 | 207.6 | 23.7% | 1,064.9 | 188.5 | 21.5% |
| Revenue funding in other portfolios (Table 6.14) | |||||||
| Local Government Budget Settlement | 10519.60 | 10779.90 | 260.3 | 2.5% | 10,590.4 | 70.8 | 0.7% |
| Total revenue within other Portfolios | 146.5 | 291.3 | 144.8 | 98.8% | 286.2 | 139.7 | 95.3% |
| Finance Circular | 10,666.1 | 11,071.2 | 405.1 | 3.8% | 10,876.6 | 210.5 | 2.0% |
| Funding outwith core settlement (Table 6.15) | |||||||
| Revenue | 153.8 | 161.4 | 7.6 | 4.9% | 158.6 | 4.8 | 3.1% |
| Capital | 210.0 | 287.3 | 77.3 | 36.8% | 282.2 | 72.2 | 34.4% |
| Total funding outwith core | 363.8 | 448.7 | 84.9 | 23.3% | 440.8 | 77.0 | 21.2% |
| Overall SG funding for LG | 11,029.9 | 11,519.9 | 490.0 | 4.4% | 11,317.4 | 287.5 | 2.6% |
Table 2 - Provisional Revenue allocations
| 2018-19 (from circular 4/2018) | 2019-20 (from circular 8/2018) | Cash change | Cash change % | 2019-20 (real, 2018-19) | Real change | Real change % | |
|---|---|---|---|---|---|---|---|
| Aberdeen City | 328.9 | 335.9 | 7.0 | 2.1% | 330.0 | 1.1 | 0.3% |
| Aberdeenshire | 415.5 | 422.4 | 6.9 | 1.7% | 415.0 | -0.6 | -0.1% |
| Angus | 200.7 | 204.9 | 4.2 | 2.1% | 201.3 | 0.6 | 0.3% |
| Argyll & Bute | 195.0 | 196.0 | 1.0 | 0.5% | 192.5 | -2.4 | -1.3% |
| Clackmannanshire | 95.3 | 95.7 | 0.3 | 0.4% | 94.0 | -1.3 | -1.4% |
| Dumfries & Galloway | 285.3 | 285.8 | 0.5 | 0.2% | 280.8 | -4.5 | -1.6% |
| Dundee City | 297.0 | 298.9 | 1.9 | 0.6% | 293.6 | -3.4 | -1.1% |
| East Ayrshire | 227.1 | 231.4 | 4.3 | 1.9% | 227.3 | 0.2 | 0.1% |
| East Dunbartonshire | 183.5 | 186.7 | 3.2 | 1.8% | 183.4 | -0.1 | 0.0% |
| East Lothian | 171.3 | 174.7 | 3.5 | 2.0% | 171.7 | 0.4 | 0.2% |
| East Renfrewshire | 177.3 | 177.8 | 0.5 | 0.3% | 174.7 | -2.7 | -1.5% |
| Edinburgh, City of | 720.6 | 731.7 | 11.1 | 1.5% | 718.8 | -1.8 | -0.3% |
| Eilean Siar | 95.7 | 95.4 | -0.3 | -0.3% | 93.7 | -2.0 | -2.1% |
| Falkirk | 278.5 | 282.9 | 4.4 | 1.6% | 277.9 | -0.6 | -0.2% |
| Fife | 637.0 | 649.4 | 12.4 | 1.9% | 638.0 | 0.9 | 0.1% |
| Glasgow City | 1248.2 | 1,250.3 | 2.1 | 0.2% | 1,228.3 | -19.9 | -1.6% |
| Highland | 444.6 | 450.6 | 6.0 | 1.4% | 442.7 | -1.9 | -0.4% |
| Inverclyde | 164.6 | 166.0 | 1.4 | 0.9% | 163.1 | -1.5 | -0.9% |
| Midlothian | 157.8 | 162.7 | 4.9 | 3.1% | 159.9 | 2.0 | 1.3% |
| Moray | 158.0 | 161.0 | 3.0 | 1.9% | 158.2 | 0.1 | 0.1% |
| North Ayrshire | 274.3 | 276.4 | 2.0 | 0.7% | 271.5 | -2.8 | -1.0% |
| North Lanarkshire | 614.2 | 620.0 | 5.8 | 0.9% | 609.1 | -5.1 | -0.8% |
| Orkney | 74.6 | 74.6 | 0.0 | 0.0% | 73.3 | -1.3 | -1.8% |
| Perth & Kinross | 246.8 | 250.9 | 4.1 | 1.7% | 246.5 | -0.3 | -0.1% |
| Renfrewshire | 310.3 | 315.5 | 5.2 | 1.7% | 309.9 | -0.4 | -0.1% |
| Scottish Borders | 204.9 | 207.9 | 3.0 | 1.5% | 204.3 | -0.7 | -0.3% |
| Shetland | 86.1 | 85.7 | -0.4 | -0.4% | 84.2 | -1.9 | -2.2% |
| South Ayrshire | 200.9 | 202.0 | 1.1 | 0.6% | 198.5 | -2.4 | -1.2% |
| South Lanarkshire | 559.0 | 564.7 | 5.8 | 1.0% | 554.8 | -4.2 | -0.7% |
| Stirling | 166.7 | 169.9 | 3.2 | 1.9% | 166.9 | 0.2 | 0.1% |
| West Dunbartonshire | 188.7 | 188.8 | 0.1 | 0.1% | 185.5 | -3.2 | -1.7% |
| West Lothian | 315.6 | 319.7 | 4.2 | 1.3% | 314.1 | -1.5 | -0.5% |
| Scotland | 9724.3 | 9836.4 | 112.1 | 1.2% | 9,663.5 | -60.8 | -0.6% |
Table 3 - Provisional Revenue allocations, excluding ring-fenced grants
| 2018-19 (from circular 4/2018) | 2019-20 (from circular 8/2018) | Cash change | Cash change % | 2019-20 (real) | Real change | Real change % | |
|---|---|---|---|---|---|---|---|
| Aberdeen City | 320.6 | 315.6 | -5.0 | -1.5% | 310.1 | -10.5 | -3.3% |
| Aberdeenshire | 408.1 | 401.7 | -6.4 | -1.6% | 394.7 | -13.4 | -3.3% |
| Angus | 196.2 | 196.0 | -0.2 | -0.1% | 192.6 | -3.6 | -1.8% |
| Argyll & Bute | 191.7 | 188.6 | -3.1 | -1.6% | 185.3 | -6.4 | -3.3% |
| Clackmannanshire | 92.2 | 90.5 | -1.7 | -1.8% | 88.9 | -3.3 | -3.5% |
| Dumfries & Galloway | 278.7 | 274.5 | -4.2 | -1.5% | 269.7 | -9.0 | -3.2% |
| Dundee City | 286.6 | 281.7 | -4.9 | -1.7% | 276.7 | -9.8 | -3.4% |
| East Ayrshire | 220.0 | 218.7 | -1.3 | -0.6% | 214.9 | -5.2 | -2.4% |
| East Dunbartonshire | 180.5 | 178.6 | -1.9 | -1.1% | 175.4 | -5.0 | -2.8% |
| East Lothian | 167.9 | 165.7 | -2.1 | -1.3% | 162.8 | -5.0 | -3.0% |
| East Renfrewshire | 174.8 | 172.4 | -2.3 | -1.3% | 169.4 | -5.4 | -3.1% |
| Edinburgh, City of | 701.3 | 691.5 | -9.8 | -1.4% | 679.3 | -22.0 | -3.1% |
| Eilean Siar | 93.9 | 92.3 | -1.6 | -1.7% | 90.6 | -3.2 | -3.5% |
| Falkirk | 271.1 | 266.9 | -4.2 | -1.6% | 262.2 | -8.9 | -3.3% |
| Fife | 617.7 | 615.0 | -2.7 | -0.4% | 604.2 | -13.5 | -2.2% |
| Glasgow City | 1205.6 | 1,183.0 | -22.6 | -1.9% | 1,162.2 | -43.4 | -3.6% |
| Highland | 434.8 | 429.3 | -5.5 | -1.3% | 421.7 | -13.0 | -3.0% |
| Inverclyde | 160.0 | 157.7 | -2.4 | -1.5% | 154.9 | -5.1 | -3.2% |
| Midlothian | 153.6 | 152.4 | -1.3 | -0.8% | 149.7 | -4.0 | -2.6% |
| Moray | 154.9 | 152.9 | -2.0 | -1.3% | 150.2 | -4.7 | -3.0% |
| North Ayrshire | 265.4 | 261.6 | -3.8 | -1.4% | 257.0 | -8.4 | -3.2% |
| North Lanarkshire | 596.0 | 586.4 | -9.5 | -1.6% | 576.1 | -19.8 | -3.3% |
| Orkney | 68.4 | 67.4 | -1.0 | -1.5% | 66.3 | -2.2 | -3.2% |
| Perth & Kinross | 242.4 | 240.4 | -2.0 | -0.8% | 236.2 | -6.2 | -2.6% |
| Renfrewshire | 301.4 | 297.1 | -4.3 | -1.4% | 291.9 | -9.5 | -3.2% |
| Scottish Borders | 201.1 | 198.6 | -2.5 | -1.3% | 195.1 | -6.0 | -3.0% |
| Shetland | 80.3 | 78.6 | -1.7 | -2.1% | 77.2 | -3.1 | -3.9% |
| South Ayrshire | 195.9 | 193.2 | -2.7 | -1.4% | 189.8 | -6.1 | -3.1% |
| South Lanarkshire | 544.2 | 536.6 | -7.6 | -1.4% | 527.2 | -17.1 | -3.1% |
| Stirling | 162.9 | 160.9 | -2.1 | -1.3% | 158.1 | -4.9 | -3.0% |
| West Dunbartonshire | 182.5 | 178.8 | -3.7 | -2.0% | 175.7 | -6.8 | -3.8% |
| West Lothian | 306.1 | 304.1 | -2.0 | -0.6% | 298.8 | -7.3 | -2.4% |
| Scotland | 9456.7 | 9328.8 | -127.9 | -1.4% | 9,164.8 | -291.9 | -3.1% |
Table 4 - Provisional Revenue allocations, per head
| 2019-20 actual | 2017 mid year population | Per head | % of scottish average | |
|---|---|---|---|---|
| Aberdeen City | 335.9 | 228,800 | 1,468 | 81.0% |
| Aberdeenshire | 422.4 | 261,800 | 1,614 | 89.0% |
| Angus | 204.9 | 116,280 | 1,762 | 97.2% |
| Argyll & Bute | 196.0 | 86,810 | 2,258 | 124.5% |
| Clackmannanshire | 95.7 | 51,450 | 1,859 | 102.5% |
| Dumfries & Galloway | 285.8 | 149,200 | 1,916 | 105.6% |
| Dundee City | 298.9 | 148,710 | 2,010 | 110.8% |
| East Ayrshire | 231.4 | 121,940 | 1,898 | 104.6% |
| East Dunbartonshire | 186.7 | 108,130 | 1,726 | 95.2% |
| East Lothian | 174.7 | 104,840 | 1,667 | 91.9% |
| East Renfrewshire | 177.8 | 94,760 | 1,876 | 103.5% |
| Edinburgh, City of | 731.7 | 513,210 | 1,426 | 78.6% |
| Eilean Siar | 95.4 | 26,950 | 3,540 | 195.2% |
| Falkirk | 282.9 | 160,130 | 1,767 | 97.4% |
| Fife | 649.4 | 371,410 | 1,749 | 96.4% |
| Glasgow City | 1,250.3 | 621,020 | 2,013 | 111.0% |
| Highland | 450.6 | 235,180 | 1,916 | 105.7% |
| Inverclyde | 166.0 | 78,760 | 2,108 | 116.2% |
| Midlothian | 162.7 | 90,090 | 1,806 | 99.6% |
| Moray | 161.0 | 95,780 | 1,681 | 92.7% |
| North Ayrshire | 276.4 | 135,790 | 2,035 | 112.2% |
| North Lanarkshire | 620.0 | 339,960 | 1,824 | 100.6% |
| Orkney | 74.6 | 22,000 | 3,391 | 187.0% |
| Perth & Kinross | 250.9 | 151,100 | 1,661 | 91.6% |
| Renfrewshire | 315.5 | 176,830 | 1,784 | 98.4% |
| Scottish Borders | 207.9 | 115,020 | 1,808 | 99.7% |
| Shetland | 85.7 | 23,080 | 3,713 | 204.8% |
| South Ayrshire | 202.0 | 112,680 | 1,793 | 98.9% |
| South Lanarkshire | 564.7 | 318,170 | 1,775 | 97.9% |
| Stirling | 169.9 | 94,000 | 1,807 | 99.7% |
| West Dunbartonshire | 188.8 | 89,610 | 2,107 | 116.2% |
| West Lothian | 319.7 | 181,310 | 1,763 | 97.3% |
Table 5 - Provisional Capital allocations
| 2018-19 | Total general capital grant payable 2019-20 | Specific capital grants - settlement 2019-20 | Total Capital funding (2019-20) | Cash change | Cash change % | 2018-19 (real) | Real change | Real change % | |
|---|---|---|---|---|---|---|---|---|---|
| Aberdeen City | 24.0 | 36.645 | 9.0 | 45.6 | 21.6 | 90.2% | 44.8 | 20.8 | 86.8% |
| Aberdeenshire | 37.5 | 47.964 | 10.4 | 58.4 | 20.9 | 55.7% | 57.3 | 19.9 | 53.0% |
| Angus | 12.8 | 20.131 | 3.4 | 23.5 | 10.8 | 84.3% | 23.1 | 10.3 | 81.0% |
| Argyll & Bute | 13.1 | 21.878 | 2.6 | 24.5 | 11.5 | 87.8% | 24.1 | 11.0 | 84.4% |
| Clackmannanshire | 5.5 | 8.068 | 1.9 | 10.0 | 4.5 | 81.1% | 9.8 | 4.3 | 77.9% |
| Dumfries & Galloway | 21.9 | 27.803 | 3.4 | 31.2 | 9.4 | 42.9% | 30.7 | 8.8 | 40.3% |
| Dundee City | 20.4 | 27.361 | 4.1 | 31.5 | 11.1 | 54.7% | 30.9 | 10.6 | 52.0% |
| East Ayrshire | 12.9 | 22.897 | 8.3 | 31.2 | 18.3 | 142.7% | 30.6 | 17.8 | 138.3% |
| East Dunbartonshire | 9.7 | 13.850 | 2.9 | 16.7 | 7.0 | 72.2% | 16.4 | 6.7 | 69.1% |
| East Lothian | 12.2 | 15.824 | 5.8 | 21.6 | 9.4 | 77.0% | 21.2 | 9.0 | 73.9% |
| East Renfrewshire | 7.3 | 12.984 | 4.8 | 17.7 | 10.4 | 143.2% | 17.4 | 10.1 | 138.9% |
| Edinburgh, City of | 78.0 | 107.886 | 49.2 | 157.1 | 79.1 | 101.3% | 154.3 | 76.2 | 97.7% |
| Eilean Siar | 8.1 | 10.384 | 1.2 | 11.6 | 3.5 | 43.5% | 11.4 | 3.3 | 40.9% |
| Falkirk | 14.8 | 22.102 | 6.1 | 28.2 | 13.4 | 90.6% | 27.7 | 12.9 | 87.2% |
| Fife | 34.7 | 50.805 | 12.6 | 63.4 | 28.7 | 82.8% | 62.3 | 27.6 | 79.6% |
| Glasgow City | 136.1 | 178.834 | 98.5 | 277.3 | 141.2 | 103.7% | 272.3 | 136.2 | 100.1% |
| Highland | 41.3 | 50.165 | 12.5 | 62.6 | 21.3 | 51.7% | 61.5 | 20.2 | 49.0% |
| Inverclyde | 8.4 | 11.719 | 2.3 | 14.0 | 5.7 | 67.4% | 13.8 | 5.4 | 64.4% |
| Midlothian | 9.9 | 17.000 | 6.4 | 23.4 | 13.5 | 136.9% | 23.0 | 13.1 | 132.6% |
| Moray | 11.0 | 15.355 | 3.0 | 18.3 | 7.3 | 67.0% | 18.0 | 7.0 | 64.0% |
| North Ayrshire | 1.9 | 24.705 | 6.6 | 31.3 | 29.4 | 1550.9% | 30.7 | 28.8 | 1521.4% |
| North Lanarkshire | 32.6 | 47.063 | 11.1 | 58.2 | 25.6 | 78.4% | 57.2 | 24.5 | 75.2% |
| Orkney | 6.4 | 8.283 | 0.8 | 9.1 | 2.7 | 42.1% | 9.0 | 2.5 | 39.5% |
| Perth & Kinross | 17.0 | 34.288 | 5.8 | 40.1 | 23.1 | 135.6% | 39.4 | 22.4 | 131.4% |
| Renfrewshire | 16.3 | 23.672 | 5.4 | 29.1 | 12.7 | 77.9% | 28.5 | 12.2 | 74.7% |
| Scottish Borders | 26.3 | 23.957 | 3.0 | 26.9 | 0.7 | 2.5% | 26.5 | 0.2 | 0.7% |
| Shetland | 6.6 | 9.026 | 1.3 | 10.4 | 3.7 | 56.0% | 10.2 | 3.5 | 53.2% |
| South Ayrshire | 11.2 | 18.863 | 6.0 | 24.8 | 13.6 | 121.5% | 24.4 | 13.2 | 117.6% |
| South Lanarkshire | 28.9 | 41.482 | 8.5 | 50.0 | 21.1 | 72.8% | 49.1 | 20.2 | 69.8% |
| Stirling | 10.7 | 14.923 | 2.8 | 17.7 | 6.9 | 64.7% | 17.4 | 6.6 | 61.8% |
| West Dunbartonshire | 14.6 | 13.361 | 2.2 | 15.6 | 1.0 | 6.9% | 15.3 | 0.7 | 5.0% |
| West Lothian | 15.3 | 22.711 | 5.1 | 27.8 | 12.5 | 82.1% | 27.3 | 12.0 | 78.8% |
| Undistributed | 150.0 | 59.090 | 50.0 | 109.1 | -40.9 | 107.1 | -42.9 | ||
| Total | 857.3 | 1,061.079 | 357.1 | 1,418.2 | 560.9 | 65.4% | 1,392.8 | 535.5 | 62.5% |
| SPT | 19.0 | 23.1 | 23.1 | 46.3 | 27.2 | 143.1% | 45.4 | 26.4 | 138.7% |
| Total | 876.4 | 1,084.2 | 380.2 | 1,464.5 | 588.1 | 67.1% | 1,438.3 | 561.9 | 64.1% |
Abbreviations
COSLA - Convention of Scottish Local Authorities
GRG - General Revenue Grant
LG - Local Government
NDRI - Non-Domestic Rates Income
SG - Scottish Government
SRG - Specific Resource Grants
Related Briefings
SB 17/82 - Local Government Finance: Fees and Charges 2011-12 to 2015-16
SB 17/88 - Local Government Finance: Draft Budget 2018-19 and provisional allocations to local authorities
SB 17/89 - Draft Budget 2018-19
SB 17/90 - Draft Budget 2018-19: Taxes
SB 18/34 - Local Government Finance: Facts and Figures 2013-14 to 2018-19
SB 18/60 - Local Government Finance: The Funding Formula and local taxation income
SB 18/82 - Pro-poor or pro-rich? The social impact of local government budgets, 2016 to 2019
SB 18/84 - Budget 2019-20
Sources
Scottish Government. (2018, December 12). Budget Statement 2019-2020. Retrieved from <a href="https://www.gov.scot/publications/budget-statement-2019-20/" target="_blank">https://www.gov.scot/publications/budget-statement-2019-20/</a> [accessed 14 December 2018]
Scottish Government. (2018, December 12). Scottish Budget 2019-20. Retrieved from <a href="https://www.gov.scot/publications/scottish-budget-2019-20/" target="_blank">https://www.gov.scot/publications/scottish-budget-2019-20/</a> [accessed 14 December 2018]
Budget Process Review Group. (2017, undefined). Final report.
Campbell, A. (2016, January 21). SB 16-07 Local Government Funding: Draft Budget 2016-17 and provisional allocations to local authorities. Retrieved from <a href="http://www.parliament.scot/ResearchBriefingsAndFactsheets/S4/SB_16-07_Local_Government_Funding-_Draft_Budget_2016-17_and_provisional_allocations_to_local_authorities.pdf" target="_blank">http://www.parliament.scot/ResearchBriefingsAndFactsheets/S4/SB_16-07_Local_Government_Funding-_Draft_Budget_2016-17_and_provisional_allocations_to_local_authorities.pdf</a> [accessed 15 December 2017]
Financial Scrutiny Unit. (2016, December 19). SB 16-103 Scottish Government Draft Budget 2017-18. Retrieved from <a href="http://www.scottish.parliament.uk/ResearchBriefingsAndFactsheets/S5/SB_16-103_Draft_Budget_2017-18.pdf" target="_blank">http://www.scottish.parliament.uk/ResearchBriefingsAndFactsheets/S5/SB_16-103_Draft_Budget_2017-18.pdf</a> [accessed 4 December 2017]
Burn-Murdoch, A. (2017, December 18). Local Government Finance: Draft Budget 2018-19 and provisional allocations to local authorities. Retrieved from <a href="https://digitalpublications.parliament.scot/ResearchBriefings/Report/2017/12/18/Local-Government-Finance--Draft-Budget-2018-19-and-provisional-allocations-to-local-authorities" target="_blank">https://digitalpublications.parliament.scot/ResearchBriefings/Report/2017/12/18/Local-Government-Finance--Draft-Budget-2018-19-and-provisional-allocations-to-local-authorities</a> [accessed 22 December 2017]
Scottish Government. (2017, March 9). 'Green Book' for Grant Aided Expenditure. Retrieved from <a href="http://www.gov.scot/Resource/0051/00515060.pdf" target="_blank">http://www.gov.scot/Resource/0051/00515060.pdf</a> [accessed 13 December 2017]
Berthier, A., Burn-Murdoch, A., Aiton, A., & Finnigan, K. (2018, November 9). Local Government Finance: The funding formula and local taxation income. Retrieved from <a href="https://digitalpublications.parliament.scot/ResearchBriefings/Report/2018/11/9/Local-Government-finance--the-Funding-Formula-and-local-taxation-income" target="_blank">https://digitalpublications.parliament.scot/ResearchBriefings/Report/2018/11/9/Local-Government-finance--the-Funding-Formula-and-local-taxation-income</a> [accessed 5 December 2018]
Scottish Government. (2017). Scottish Budget: Draft Budget 2018-19. Retrieved from <a href="http://www.gov.scot/Resource/0052/00529171.pdf" target="_blank">http://www.gov.scot/Resource/0052/00529171.pdf</a>
Scottish Government. (2018, December 17). Local government finance circular 8/2018: settlement for 2019-2020. Retrieved from <a href="https://www.gov.scot/publications/local-government-finance-circular-8-2018-settlement-for-2019-20/" target="_blank">https://www.gov.scot/publications/local-government-finance-circular-8-2018-settlement-for-2019-20/</a> [accessed 19 December 2018]
Accounts Commission. (2018, April 5). Local government in Scotland: Challenges and performance 2018. Retrieved from <a href="http://www.audit-scotland.gov.uk/report/local-government-in-scotland-challenges-and-performance-2018" target="_blank">http://www.audit-scotland.gov.uk/report/local-government-in-scotland-challenges-and-performance-2018</a> [accessed 18 September 2018]
Berthier, A., Burn-Murdoch, A., Aiton, A., & Finnigan, K. (2018, November 9). Local Government Finance: The funding formula and local taxation income. Retrieved from <a href="https://digitalpublications.parliament.scot/ResearchBriefings/Report/2018/11/9/Local-Government-finance--the-Funding-Formula-and-local-taxation-income#" target="_blank">https://digitalpublications.parliament.scot/ResearchBriefings/Report/2018/11/9/Local-Government-finance--the-Funding-Formula-and-local-taxation-income#</a> [accessed 28 November 2018]