Labour Market update: January 2018
This briefing provides an overview of the Scottish labour market from the latest regional labour market statistics from the Office for National Statistics (ONS).
Executive Summary
The unemployment rate in Scotland was unchanged over the quarter and remains at 4.0%. Despite the rate being unchanged over the quarter in Scotland, it is still one of the lowest rates since comparable records began in 1992.
The employment rate in Scotland fell over the quarter and is now 75.0% which is just below the UK figure of 75.3%.
Economic inactivity increased over the quarter, mainly driven by an increase in men becoming economically inactive.
| Overall | Men | Women | ||||
|---|---|---|---|---|---|---|
| Rate (%) | Change over the qtr (% pts) | Rate (%) | Change over the qtr (% pts) | Rate (%) | Change over the qtr (% pts) | |
| Unemployment | 4.0% | 0.0 | 4.7% | 0.0 | 3.3% | -0.1 |
| Employment | 75.0% | -0.2 | 78.3% | -0.4 | 72.0% | 0.0 |
| Economic Inactivity | 21.7% | +0.2 | 17.8% | +0.3 | 25.5% | +0.1 |
What are the labour market measurements?
The International Labour Organisation provides the official definition of labour market statistics.
What is unemployment?
Level: Any individual aged 16 and over without a job who has been actively seeking work within the last four weeks and is available to start work within the next two weeks.
Rate: Number of unemployed individuals as a proportion of the total number of economically active people, which includes both the unemployed and those in work.
What is employment?
Level: Any individual aged 16 and over who is undertaking one hour or more a week of paid work.
Rate: Number of people in employment expressed as a percentage of all people aged 16-64.
What is economic inactivity?
Level: Any individual aged 16 to 64 who is not in employment, has not looked for work in the last four weeks, and is unable to start work within the next two weeks.
Rate: Number of people economically inactive expressed as a percentage of all people aged 16-64.
The main reasons for economic inactivity are:
being a student and not having or looking for a job
looking after the family and/or home
being sick (temporary and long-term)
being retired
being discouraged.
You can find out more in formation on labour market statistics in the SPICe Labour market statistics briefing.
Unemployment
The number of unemployed people in Scotland fell by 1,000 over the quarter and by 25,000 over the year. This is the biggest annual fall since 2013 (30,000 decrease between Sep-Nov 2012 and Sep-Nov 2013).
The unemployment rate for the UK is 4.3% and is the joint lowest since 1975. The rate in Scotland sits at 4.0%. Despite the rate being unchanged over the quarter in Scotland, it is still one of the lowest rates since comparable records began in 1992.
| Level ('000) | Quarter change ('000) | Year change ('000) | Rate (%) | Quarter change (% pts) | Year change (% pts) | |
|---|---|---|---|---|---|---|
| Scotland | 112 | -1 | -25 | 4.0% | 0.0 | -1.0 |
| UK | 1,439 | -3 | -160 | 4.3% | 0.0 | -0.5 |
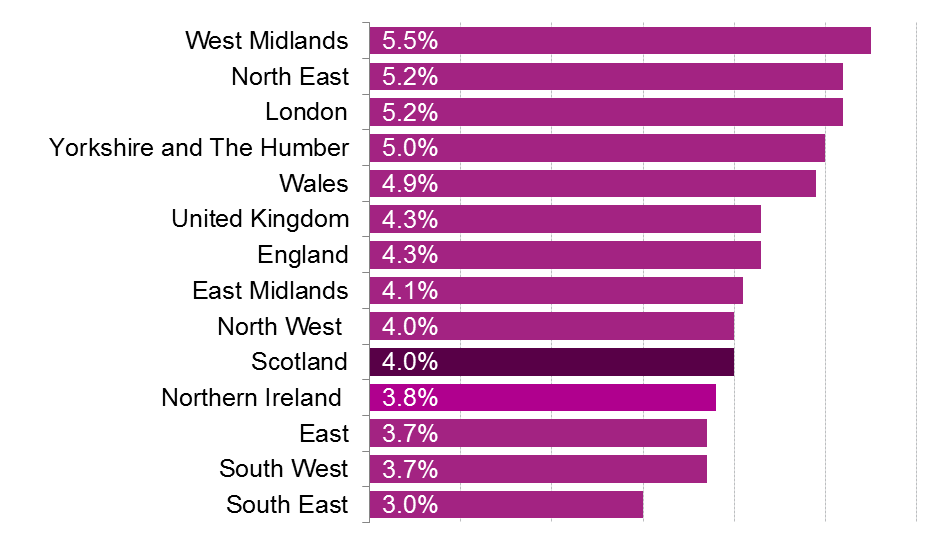
Looking at unemployment across the UK, Scotland has the 5th lowest unemployment rate of the nations and regions of the UK. The South East has the lowest rate at 3.0%, while the West Midlands has the highest at 5.5%.
Unemployment by gender
Over the quarter in Scotland, the decrease in the unemployment level was due to the number of unemployed women falling by 1,000 while the number of men was unchanged.
The annual decrease in the number of unemployed women and the unemployment rate is the largest since 2013.
The unemployment rate for women is the lowest since comparable records began in 1992.
| Level ('000) | Quarter change ('000) | Year Change ('000) | Rate (%) | Quarter change (% pts) | Year change (% pts) | ||
|---|---|---|---|---|---|---|---|
| Scotland | Men | 68 | 0 | +4 | 4.7% | 0.0 | -0.4 |
| Women | 44 | -1 | -21 | 3.3% | -0.1 | -1.6 | |
| UK | Men | 768 | -7 | -112 | 4.3% | -0.1 | -0.7 |
| Women | 671 | +3 | -48 | 4.3% | 0.0 | -0.4 |
Unemployment by age
This data is not seasonally adjusted and is compared with the same quarter in previous years.
The unemployment rate for 25-34 year olds (3.4%)is the lowest since comparable records began in 2001, when comparing the same quarter.
Looking across the age groups, the youth unemployment rate is the only age group where Scotland significantly deviates from the UK (2.9 percentage points lower).
| Age group | Scotland | UK | |
|---|---|---|---|
| 16-24 | Rate | 9.7% | 12.6% |
| Year change (% pts) | -0.2 | -0.4 | |
| 25-34 | Rate | 3.4% | 3.9% |
| Year change (% pts) | -1.6 | -0.7 | |
| 35-49 | Rate | 3.2% | 2.7% |
| Year change (% pts) | -0.8 | -0.7 | |
| 50-64 | Rate | 3.3% | 3.0% |
| Year change (% pts) | -1.5 | -0.3 |
Employment
The number of people aged 16 and over in employment in Scotland increased by 7,000 over the quarter and by 57,000 over the year.
The employment rate in Scotland fell by 0.2 percentage points over the quarter while the UK saw a increase of 0.2 percentage points. However, over the year the rate in Scotland increased by 1.6 percentage points, while the UK increased by 0.9 percentage points
Despite a slight fall over the quarter, the rate in Scotland in one of the highest since comparable records began in 1992. In the UK the employment rate is the joint highest since comparable records began in 1971.1
| Level ('000) | Quarter change ('000) | Year change ('000) | Rate (%) | Quarter change (% pts) | Year change (% pts) | |
|---|---|---|---|---|---|---|
| Scotland | 2,662 | +7 | +57 | 75.0% | -0.2 | +1.6 |
| UK | 32,207 | +102 | +415 | 75.3% | +0.2 | +0.9 |
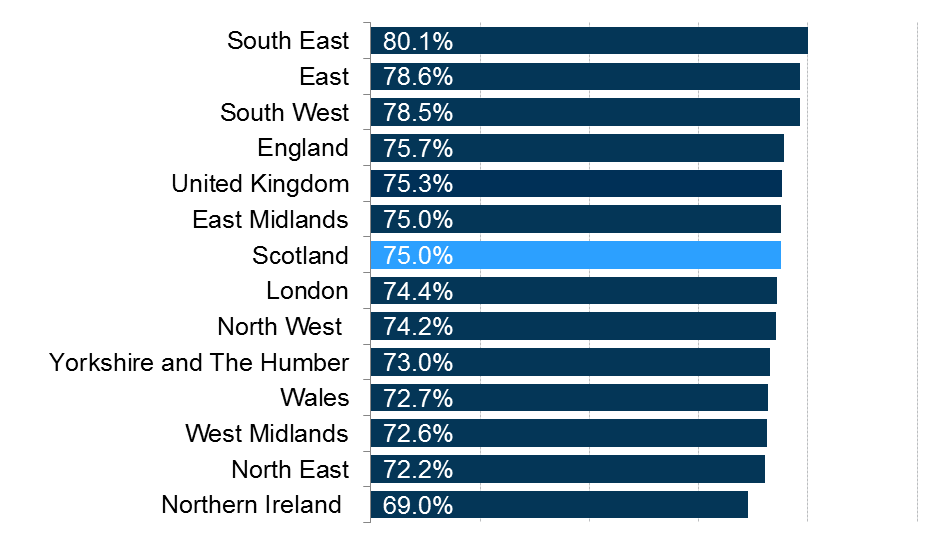
Looking at employment across the UK, Scotland has the 6th highest employment rate of the nations and regions of the UK. The South East has the highest rate at 80.1%, while Northern Ireland has the lowest at 69.0%.
Employment by gender
Employment levels and rates are higher for men than for women at both the Scottish and UK levels.
The majority of the 7,000 increase in the number people in employment in Scotland came from and extra 6,000 men entering employment.
The male employment rate, at 78.3%, is one of the highest on record but is below the UK male employment rate of 79.9%.
The female employment rate is higher in Scotland than in the UK (72.0% in Scotland versus 70.8% in the UK).
| Level ('000) | Quarter change ('000) | Year change ('000) | Rate (%) | Quarter change (% pts) | Year change (% pts) | ||
|---|---|---|---|---|---|---|---|
| Scotland | Men | 1,367 | +6 | +28 | 78.3% | -0.4 | +1.2 |
| Women | 1,294 | +1 | +29 | 72.0% | 0.0 | +1.9 | |
| UK | Men | 17,089 | +83 | +209 | 79.9% | +0.3 | +0.8 |
| Women | 15,118 | +19 | +206 | 70.8% | +0.1 | +1.0 |
Employment by age
This data is not seasonally adjusted and is compared with the same quarter in previous years.
The employment rate for 50-64 year olds is the highest since comparable records began in 2001, when comparing the same quarter, having increased by 14.0 percentage points since 2001.
Looking across the age groups, the youth employment rate is the only age group where Scotland significantly deviates from the UK (3.9 percentage points higher).
| Age group | Scotland | UK | |
|---|---|---|---|
| 16-24 | Rate (%) | 58.9% | 55.0% |
| Year change (% pts) | +0.9 | -0.4 | |
| 25-34 | Rate (%) | 82.9% | 83.5% |
| Year change (% pts) | +2.6 | +1.4 | |
| 35-49 | Rate (%) | 82.1% | 85.0% |
| Year Change (% pts) | -0.1 | +1.3 | |
| 50-64 | Rate (%) | 72.0% | 71.6% |
| Year Change (% pts) | +2.9 | +0.8 |
Economic inactivity
The number of people economically inactive in Scotland increased by 6,000 over the quarter but fell by 28,000 over the year, which is one is the biggest annual decreases since 2014.
Over the quarter the economic inactivity rate in Scotland increased by 0.2 percentage point, whilst the UK's fell by 0.2 percentage points.
Over the year the rate in Scotland fell by 0.8 percentage point, while it fell by 0.5 percentage points for the UK as a whole.
| Level ('000) | Quarter change ('000) | Year change ('000) | Rate (%) | Quarter change (% pts) | Year change (% pts) | |
|---|---|---|---|---|---|---|
| Scotland | 741 | +6 | -28 | 21.7% | +0.2 | -0.8 |
| UK | 8,734 | -79 | -167 | 21.2% | -0.2 | -0.5 |
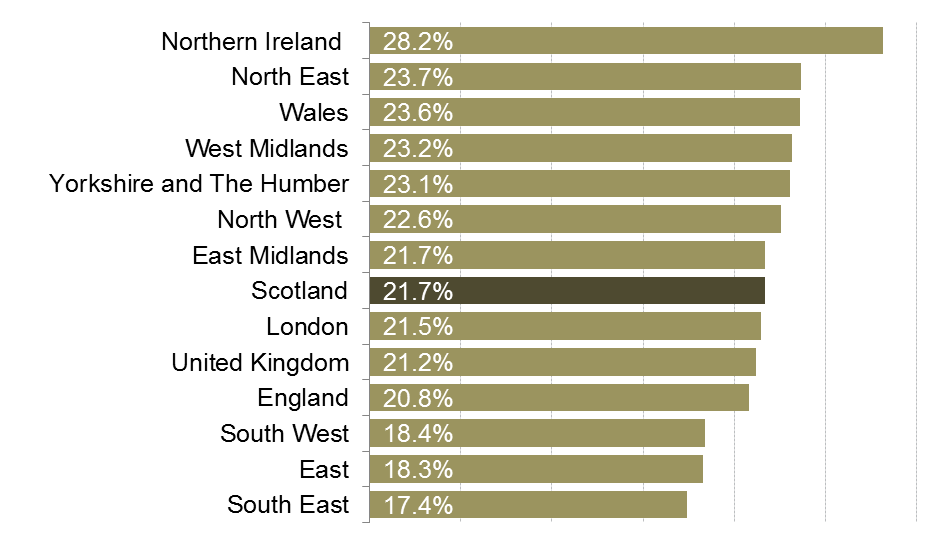
Looking at economic inactivity across the UK, the Scottish rate is higher than the UK average. Northern Ireland has the highest rate at 28.2%, while the South East has the lowest at 17.4%.
Economic inactivity by gender
Economic inactivity rates are higher for women than for men.
The number of economically inactive people in Scotland increased over the quarter, mainly due to 5,000 men becoming economically inactive, the number of inactive women increased by 2,000.
Over the year the economic inactivity rate for men fell be 0.9 percentage points in Scotland and 0.2 percentage points in the UK overall.
| Level ('000) | Quarter change ('000) | Year change ('000) | Rate (%) | Quarter change (% pts) | Year change (% pts) | ||
|---|---|---|---|---|---|---|---|
| Scotland | Men | 296 | +5 | -15 | 17.8% | +0.3 | -0.9 |
| Women | 445 | +2 | -13 | 25.5% | +0.1 | -0.7 | |
| UK | Men | 3,357 | -53 | -29 | 16.4% | -0.3 | -0.2 |
| Women | 5,377 | -26 | -139 | 26.0% | -0.1 | -0.7 |
Economic inactivity by age
This data is not seasonally adjusted and is compared with the same quarter in previous years.
The economic inactivity rate for 50-64 year olds is the lowest since comparable records began in 2001, when comparing the same quarter, it fell by 13.5 percentage points since 2001.
Looking across the age groups, the youth inactivity rate (2.2 percentage points lower) and the rate for 35-49 year olds (2.5 percentage point higher) both deviate significantly from the UK.
| Age Group | Scotland | UK | |
|---|---|---|---|
| 16-24 | Rate (%) | 34.8% | 37.0% |
| Year change (% pts) | -1.2 | +0.8 | |
| 25-34 | Rate (%) | 14.2% | 13.1% |
| Year change (% pts) | -1.3 | -0.8 | |
| 35-49 | Rate (%) | 15.2% | 12.7% |
| Year change (% pts) | +0.8 | -0.7 | |
| 50-64 | Rate (%) | 25.6% | 26.2% |
| Year change (% pts) | -1.8 | -0.6 |
Claimant Count
The Claimant Count figures presented here are experimental statistics from the ONS for Jobseekers Allowance, plus Universal Credit claimants who are out of work.
Under Universal Credit a broader span of claimants are required to look for work than under Jobseekers Allowance. As Universal Credit Full Service is rolled out in particular areas, the number of people recorded as being on the Claimant Count is therefore likely to rise.
This is not an official measure of unemployment, but it does provide accurate information on the labour market at a local level.
Scotland and UK comparison
The seasonally adjusted claimant count rate for December in Scotland was unchanged over the month and increased over the year.
The Scottish claimant count rate is higher than the UK rate.
| Level | Month Change | Year Change | Rate (%) | Month Change (% pts) | Year Change (% pts) | |
|---|---|---|---|---|---|---|
| Scotland | 84,100 | +1,100 | +4,800 | 2.4% | 0.0 | +0.1 |
| UK | 832,500 | +8,600 | +49,400 | 2.0% | 0.0 | +0.1 |
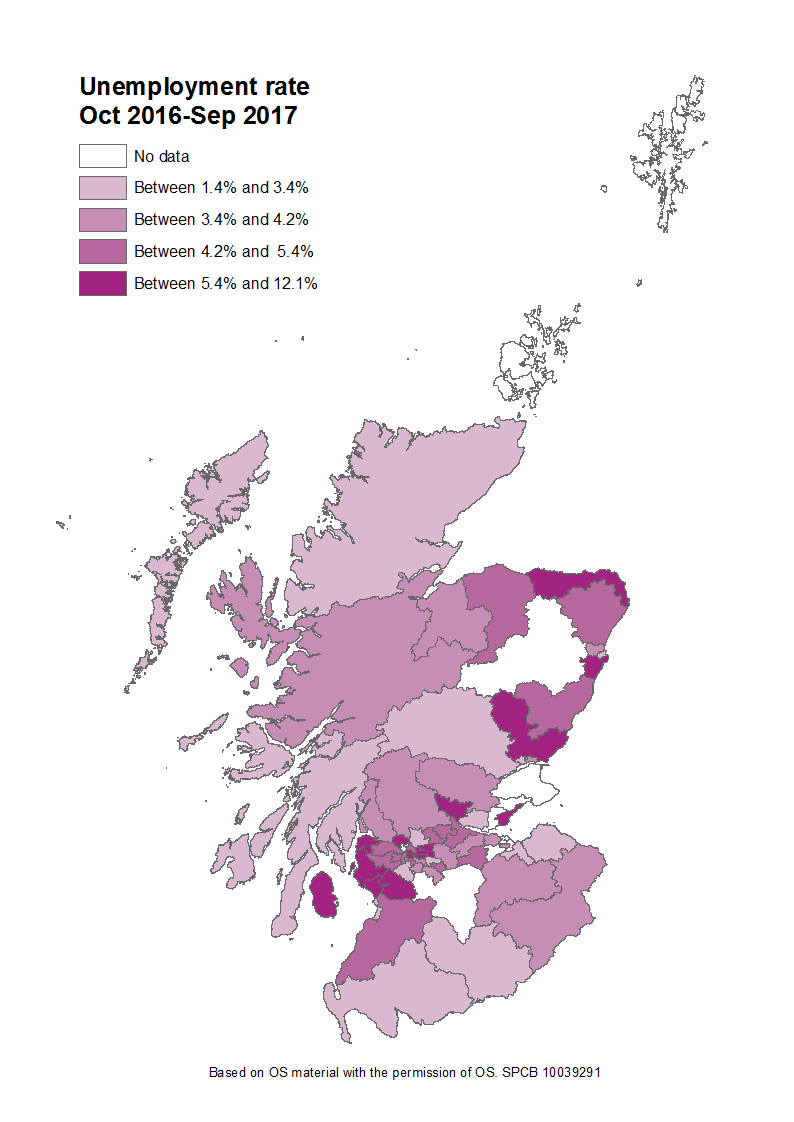
Constituency data: Unemployment rate
The constituency data for Scotland comes from the Annual Population Survey (APS). The APS datasets are produced quarterly, with each dataset containing 12 months of data.
The latest APS data is for Oct 2016-Sep 2017.
Glasgow Kelvin have the highest unemployment rate at 12.1%, while Argyll and Bute has the lowest at 1.4%. Glasgow Kelvin saw the biggest increase over the year, while Dundee City West saw the largest decrease.
Find out the latest labour market data for your constituency.
Guest Indicator: Second Jobs
The latest figures from the Annual Population Survey (Oct 2016 - Sep 2017) show that there are 91,000 people in Scotland who have a second job.
Figure 5: Number of people with a second job indexed (Oct 2004 - Sep 2005 = 100) - Oct 2004 - Sep 2005 to Oct 2016 - Sep 2017
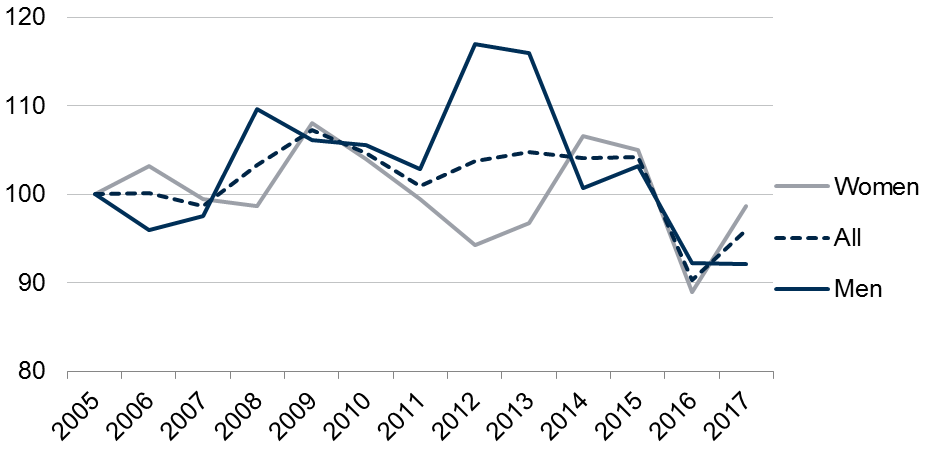
The number of people with a second job has increased 5,000 on the previous year, or 6%. However this increase has come for a low point over the last 12 years. The total number of people who had a second job peaked in Oct 2008 - Sep 2009 at 102,000.
Looking at the gender breakdown shows that
Since 2012 (Oct 2011 - Sep 2012) when the number of men with a second job peaked the figure has fallen by 27%.
Since 2009 (Oct 2008 - Sep 2009) when the number of women with a second job peaked it has fallen by 9%, however there was an significant increase between 2016 and 2017 (Oct 2015 - Sep 2016 to Oct 2016 - Sep 2017).
Figure 6: Proportion of people with a second job by gender - Oct 2004 - Sep 2005 to Oct 2016 - Sep 2017
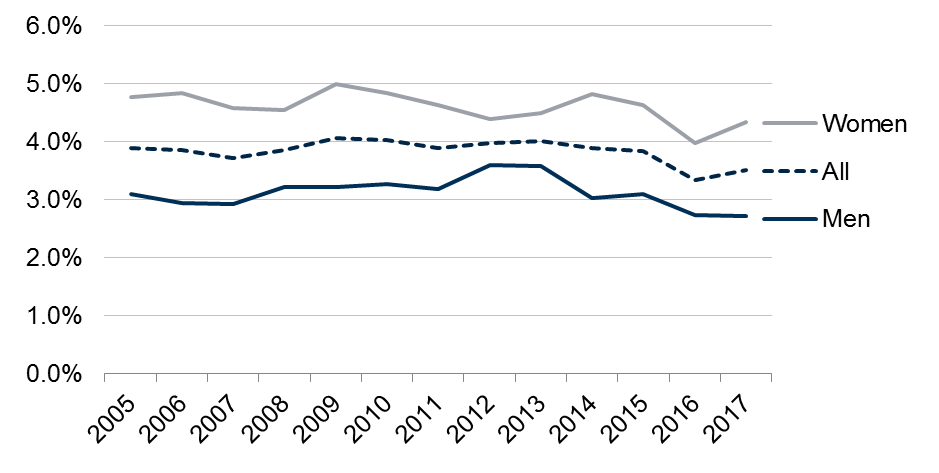
Currently 3.5% of people in employment in Scotland have a second job, this has remain largely unchanged for the past 12 years. Women are more likely to have a second job than men. The proportion of women with a second job peaked at 5.0% in 2009 (Oct 2008 - Sep 2009), but now sits at 4.3%. The proportion of men with a second job peaked in 2012 (Oct 2011 - Sep 2012) at 3.6% but now sits at 2.7%.
Figure 7: Proportion people with second jobs by industry - Oct 2016 to Sep 2017
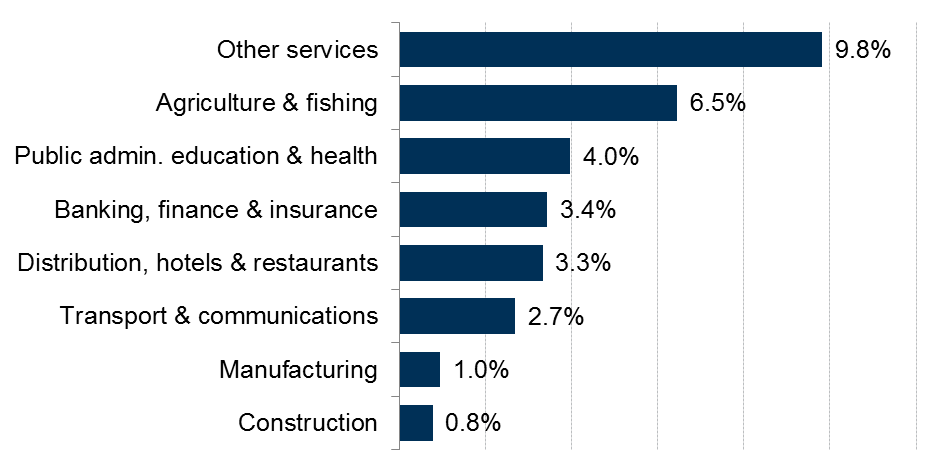
"Other services" has the highest proportion of people with a second job at 9.8%. "Other services" include membership organisations, the repair of computers and personal and household goods and a variety of personal service activities such as hairdressing or funeral related activities.
Figure 8: Proportion people with second jobs by industry and gender - Oct 2016 to Sep 2017
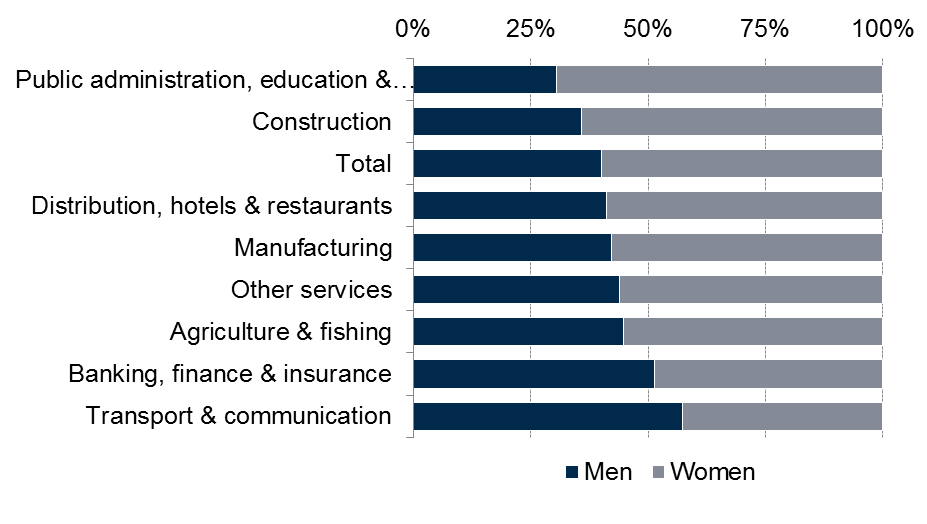
The gender split by industry shows that "Public admin. education & health" has the highest proportion of women who have a second job while "Transport & communication" has the lowest. There are only two industries, "Banking, finance & insurance" and "Transport & communication", that have a higher proportion of men with second jobs than women.
Sources
Office for National Statistics. (2018, January 24). UK labour market: January 2018. Retrieved from <a href="https://www.ons.gov.uk/employmentandlabourmarket/peopleinwork/employmentandemployeetypes/bulletins/uklabourmarket/january2018#employment" target="_blank">https://www.ons.gov.uk/employmentandlabourmarket/peopleinwork/employmentandemployeetypes/bulletins/uklabourmarket/january2018#employment</a> [accessed 24 January 2018]