Labour Market Update: September 2017
This briefing provides an overview of the Scottish labour market from the latest regional labour market statistics from the Office for National Statistics (ONS).
Executive Summary
The unemployment rate in Scotland sits at 3.8%1 which is the lowest rate since comparable records began in 1992. The youth unemployment rate is the lowest since comparable records began in 2001.
The employment rate increased by 1.8 percentage points over the quarter to 75.2% and is the highest since comparable records began in 1992. The increase in employment is mainly due to men entering employment.
Over the quarter Scotland has seen the largest decrease in economic inactivity since comparable record began in 1992.
| Overall | Men | Women | ||||
|---|---|---|---|---|---|---|
| Rate | Change over the qtr (% pts) | Rate | Change over the qtr (% pts) | Rate | Change over the qtr (% pts) | |
| Unemployment | 3.8% | -0.2 | 4.1% | +0.2 | 3.5% | -0.6 |
| Employment | 75.8% | +1.8 | 79.6% | +1.9 | 72.2% | +1.7 |
| Economic Inactivity | 21.2% | -1.6 | 17.0% | -2.0 | 25.1% | -1.2 |
What are the labour market measurements?
The International Labour Organisation provides the official definition of labour market statistics.
What is unemployment?
Level: Any individual aged 16 and over without a job who has been actively seeking work within the last four weeks and is available to start work within the next two weeks.
Rate: Number of unemployed individuals as a proportion of the total number of economically active people, which includes both the unemployed and those in work.
What is employment?
Level: Any individual aged 16 and over who is undertaking one hour or more a week of paid work.
Rate: Number of people in employment expressed as a percentage of all people aged 16-64.
What is economic inactivity?
Level: Any individual aged 16 to 64 who is not in employment, has not looked for work in the last four weeks, and is unable to start work within the next two weeks.
Rate: Number of people economically inactive expressed as a percentage of all people aged 16-64.
The main reasons for economic inactivity are:
being a student and not having or looking for a job
looking after the family and/or home
being sick (temporary and long-term)
being retired
being discouraged
You can find out more in formation on labour market statistics in the SPICe Labour market statistics briefing.
Unemployment
The number of unemployed people in Scotland fell by 4,000 over the quarter and 24,000 over the year.
The unemployment rate for the UK is 4.3% and has not been this low since 1975.1 The rate in Scotland sits at 3.8%. This is the lowest rate since comparable records began in 1992.
Scotland has the third lowest unemployment rate of the regions and nation of the UK.2
| Level ('000) | Quarter change ('000) | Year change ('000) | Rate | Quarter change (% pts) | Year change (% pts) | |
|---|---|---|---|---|---|---|
| Scotland | 106 | -4 | -24 | 3.8% | -0.2 | -0.9 |
| UK | 1,455 | -75 | -175 | 4.3% | -0.2 | -0.5 |
Regional labour market statistics in the UK: September 2017 and UK labour market: September 2017
Unemployment by gender
Over the quarter in Scotland, the fall in the unemployment level was primarily due to the decrease in the number of unemployed women, a fall of 8,000, while the number of unemployed men increased over the quarter.
Over the year the unemployment level and rate for men in Scotland saw the largest decrease since the change between 2012 and 2013. The number of unemployed women is at it's lowest level since comparable records began in 1992.
| Level ('000) | Quarter change ('000) | Year Change ('000) | Rate | Quarter change (% pts) | Year change (% pts) | ||
|---|---|---|---|---|---|---|---|
| Scotland | Men | 59 | +3 | -17 | 4.1% | +0.2 | -1.2 |
| Women | 47 | -7 | -7 | 3.5% | -0.6 | -0.6 | |
| UK | Men | 788 | -52 | -111 | 4.4% | -0.3 | -0.6 |
| Women | 667 | -23 | -63 | 4.2% | -0.2 | -0.5 |
Unemployment by age
The unemployment rates for 16-24 year olds, 25-34 year olds and 35-49 year olds in Scotland are now at the lowest since comparable records began in 2002.
| Age group | Scotland | UK | |
|---|---|---|---|
| 16-24 | Rate | 9.4% | 12.6% |
| Year change (% pts) | -3.0 | -1.7 | |
| 25-34 | Rate | 3.1% | 3.7% |
| Year change (% pts) | -0.4 | -0.6 | |
| 35-49 | Rate | 2.5% | 2.9% |
| Year change (% pts) | -0.7 | -0.3 | |
| 50-64 | Rate | 3.3% | 3.2% |
| Year change (% pts) | -1.4 | -0.2 |
Employment
The number of people aged 16 and over in employment in Scotland increased by 49,000 over the quarter and 44,000 over the year.
The employment rate in Scotland increased by 1.8 percentage points over the year while the UK saw an increase of 0.5 percentage points.
The UK employment rate is the highest since comparable records began in 1971.1 Scotland's employment rate is the highest since comparable records began in 1992.
| Level ('000) | Quarter change ('000) | Year change ('000) | Rate | Quarter change (% pts) | Year change (% pts) | |
|---|---|---|---|---|---|---|
| Scotland | 2,674 | +49 | +44 | 75.8% | +1.8 | +1.8 |
| UK | 32,136 | +181 | +379 | 75.3% | +0.5 | +0.8 |
Employment by gender
Employment levels and rates are higher for men than for women at both the Scottish and UK levels.
The employment level in Scotland increased by 49,000 over the quarter, with the increase almost equally split between men and women.
The male employment rate, at 79.6%, is one of the highest on record but is still below the pre-recession peak of 80.1% (Nov-Jan 2007). The female employment rate is higher in Scotland than in the UK, and fourth highest of the regions and nations of the UK.
| Level ('000) | Quarter change ('000) | Year change ('000) | Rate | Quarter change (% pts) | Year change (% pts) | ||
|---|---|---|---|---|---|---|---|
| Scotland | Men | 1,377 | +24 | +19 | 79.6% | +1.9 | +2.0 |
| Women | 1,297 | +25 | +25 | 72.2% | +1.7 | +1.6 | |
| UK | Men | 17,021 | +50 | +116 | 79.8% | +0.3 | +0.5 |
| Women | 15,115 | +131 | +262 | 70.8% | +0.7 | +1.1 |
Employment by age
The youth employment rate for Scotland is the highest since comparable records began in 2002 and is the highest of the regions and nations of the UK.
It is the seventh consecutive year where there has been an increase in the employment rate for 50-64 year olds with the rate now at its highest since comparable records began in 2002.
| Age group | Scotland | UK | |
|---|---|---|---|
| 16-24 | Rate | 61.7% | 54.8% |
| Year change (% pts) | +2.0 | +0.4 | |
| 25-34 | Rate | 83.8% | 83.7% |
| Year change (% pts) | +1.8 | +1.3 | |
| 35-49 | Rate | 83.8% | 84.6% |
| Year Change (% pts) | +1.0 | +0.8 | |
| 50-64 | Rate | 71.5% | 71.1% |
| Year Change (% pts) | +2.4 | +0.4 |
Employment, unemployment and economic inactivity by age group (not seasonally adjusted), Educational status and labour market status for people aged from 16 to 24 (not seasonally adjusted) and Regional labour market: Estimates of employment by age
Economic inactivity
The number of people economically inactive in Scotland decreased by 54,000 over the quarter but only 35,000 over the year.
Inactivity in Scotland is now the fourth lowest in the UK and around the UK average.1
Over the quarter the economic inactivity rate in Scotland fell by 1.6 percentage points whilst the UK's fell by 0.3 percentage points. This is the largest decrease in economic inactivity in Scotland over the quarter since comparable records began in 1992.
| Level ('000) | Quarter change ('000) | Year change ('000) | Rate | Quarter change (% pts) | Year change (% pts) | |
|---|---|---|---|---|---|---|
| Scotland | 722 | -54 | -35 | 21.2% | -1.6 | -1.0 |
| UK | 8,743 | -107 | -96 | 21.2% | -0.3 | -0.3 |
Economic inactivity by gender
Economic inactivity rates are higher for women than for men.
The number of economically inactive people in Scotland decreased by 54,000 over the quarter, mainly due to 33,000 men leaving economic inactivity. This is the largest decrease in economically inactive men since comparable records began in 1992.
| Level ('000) | Quarter change ('000) | Year change ('000) | Rate | Quarter change (% pts) | Year change (% pts) | ||
|---|---|---|---|---|---|---|---|
| Scotland | Men | 283 | -33 | -15 | 17.0% | -2.0 | -0.9 |
| Women | 439 | -21 | -21 | 25.1% | -1.2 | -1.2 | |
| UK | Men | 3,364 | -5 | +42 | 16.4% | 0.0 | +0.1 |
| Women | 5,379 | -102 | -138 | 26.0% | -0.5 | -0.7 |
Economic inactivity by age
The economic inactivity rate for 50-54 year olds is the lowest it has been since comparable records began in 2002 (May-Jul 2002 38.8%).
| Age Group | Scotland | UK | |
|---|---|---|---|
| 16-24 | Rate | 31.9% | 37.2% |
| Year change (% pts) | -1.1 | +0.8 | |
| 25-34 | Rate | 13.6% | 13.1% |
| Year change (% pts) | -1.5 | -0.6 | |
| 35-49 | Rate | 14.1% | 12.8% |
| Year change (% pts) | -0.5 | -0.5 | |
| 50-64 | Rate | 26.0% | 26.5% |
| Year change (% pts) | -1.5 | -0.3 |
Claimant Count
The Claimant Count figures presented here are the experimental statistics from the ONS for Jobseekers Allowance, plus Universal Credit claimants who are out of work.
Under Universal Credit a broader span of claimants are required to look for work than under Jobseekers Allowance. As Universal Credit Full Service is rolled out in particular areas, the number of people recorded as being on the Claimant Count is therefore likely to rise.
This is not an official measure of unemployment, but it does provide accurate information on the labour market at a local level.
Scotland and UK comparison
The seasonally adjusted claimant count rate for August in Scotland increased by 0.1 percentage point over the year.
The Scottish claimant count rate is higher than the UK rate.
| Level | Month Change | Year Change | Rate | Month Change (% pts) | Year Change (% pts) | |
|---|---|---|---|---|---|---|
| Scotland | 81,400 | -100 | +3,000 | 2.3% | 0.0 | +0.1 |
| UK | 806,300 | -2,800 | +29,500 | 1.9% | -0.1 | 0.0 |
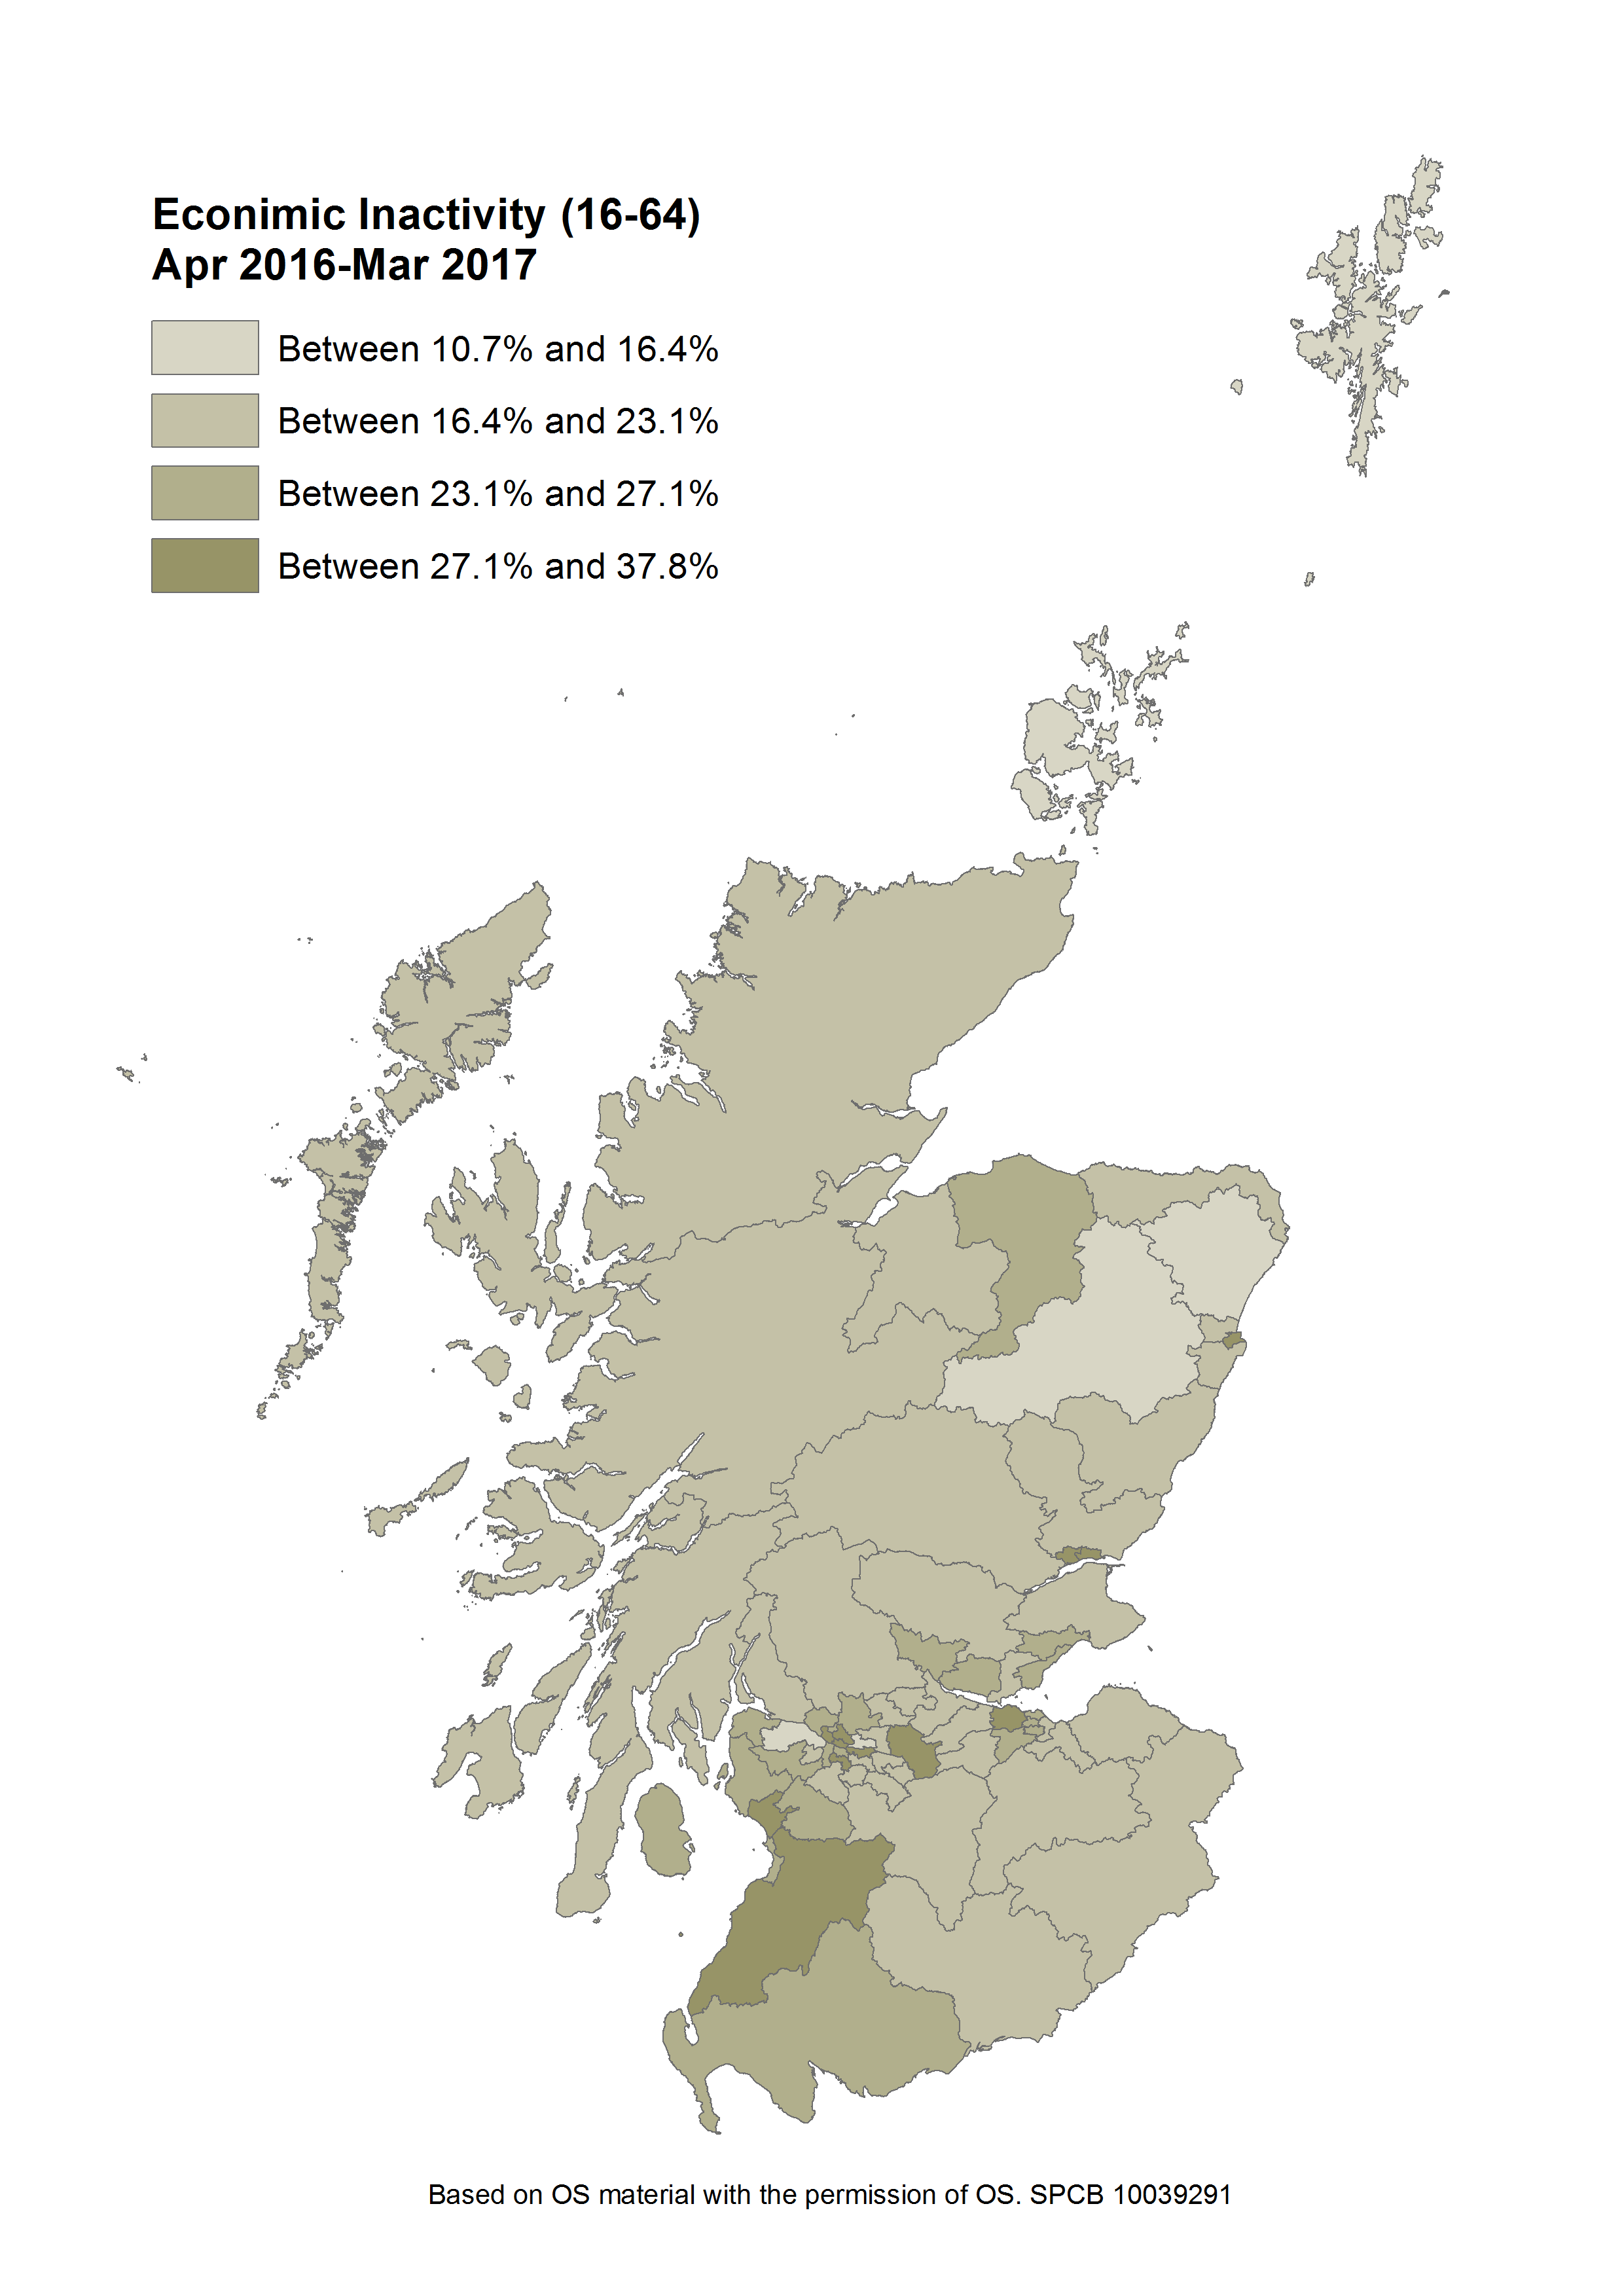
Constituency data: Economic inactivity rate
The constituency data for Scotland comes from the Annual Population Survey (APS). The APS datasets are produced quarterly, with each dataset containing 12 months of data.
The latest APS data is for Apr 2016-Mar 2017.
Glasgow Cathcart has the highest economic inactivity at 37.8% while the Shetland Islands has the lowest at 10.7%. Glasgow Cathcart also saw the biggest increase over the year, while Glasgow Maryhill and Springburn saw the largest decrease.
Find out the latest labour market data for your constituency.
The Scottish Labour Market since the devolution referendum
This week saw the 20th anniversary since Scotland voted on whether or not to have its own parliament. This section takes a brief look at how the labour market has changed since 1997 in Scotland.
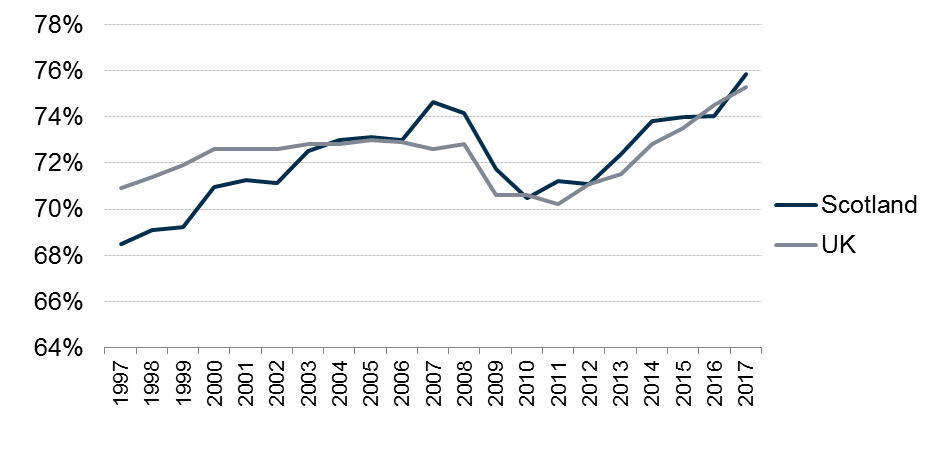
In 1997 the employment rate was 2.4 percentage points lower than the UK. It is now 0.5 percentage points higher than the UK, at an all time high of 75.8%.
Figure 2: Employment rates (16-64) in Scotland and the UK at May-Jul of each year since 1997
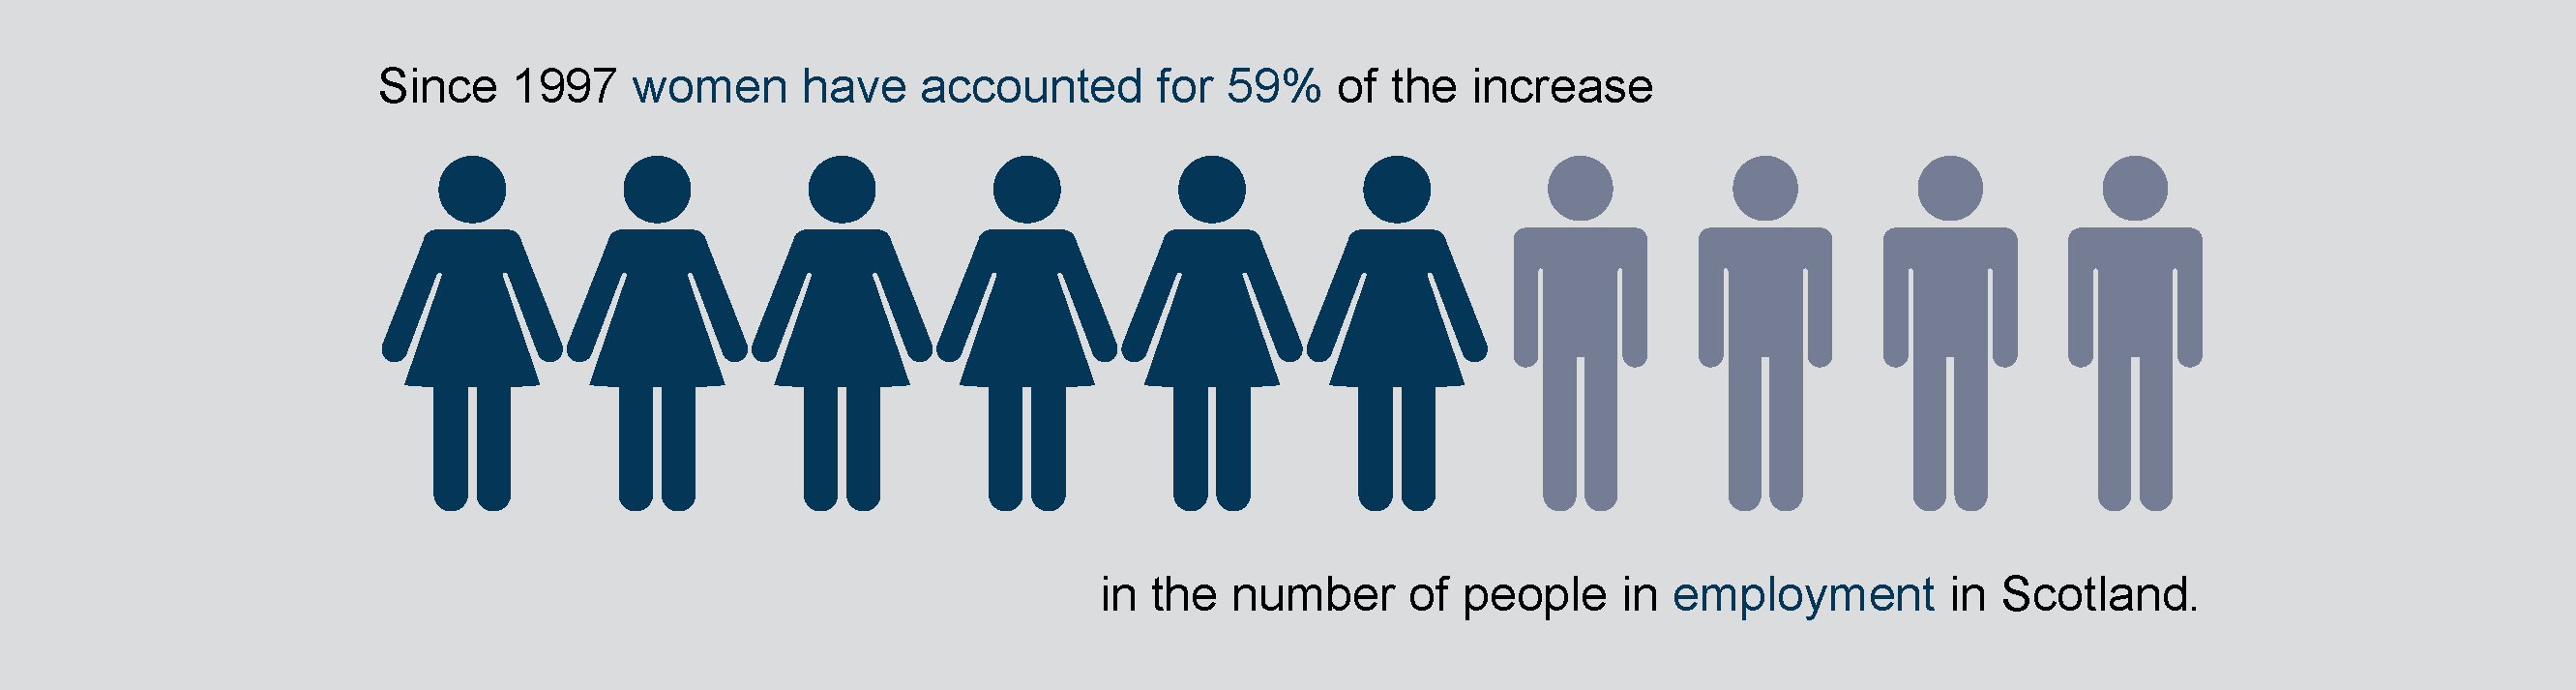
Since 1997 women have accounted for 59% of the increase in the number of people in employment in Scotland.
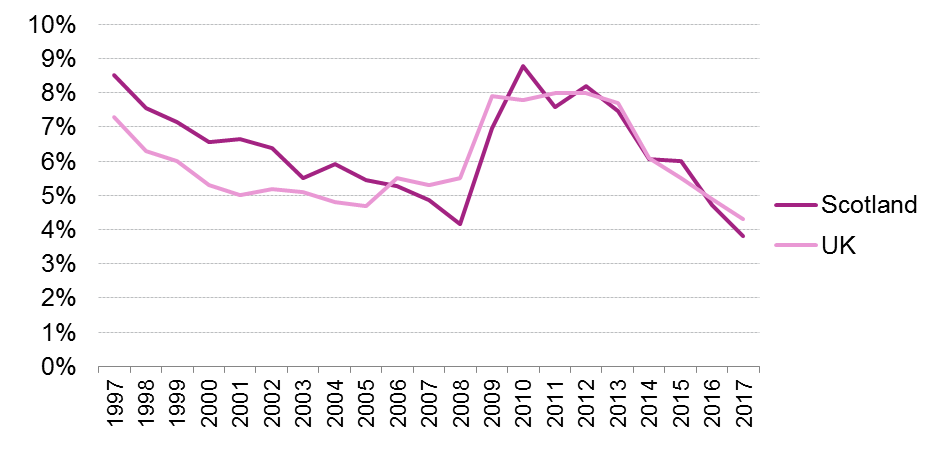
In 1997 the unemployment rate in Scotland was 1.2 percentage points higher than UK. t is now 0.5 percentage points lower than the UK, at an all time low of 3.8%.
Figure 3: Unemployment rates (16+) in Scotland and the UK at May-Jul of each year since 1997
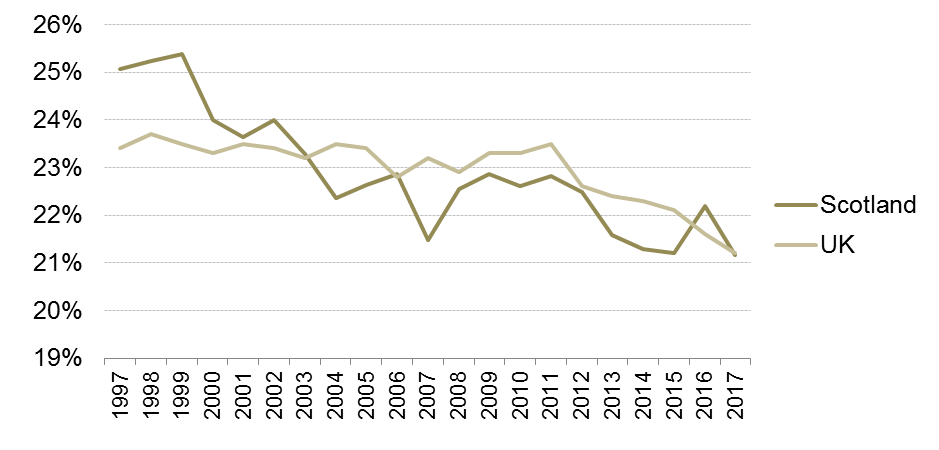
In 1997 the economic inactivity rate in Scotland was 1.7 percentage points higher than UK. It is now the same as the UK at 21.2%.
Figure 4: Economic inactivity rates (16-64) in Scotland and the UK at May-Jul of each year since 1997
Sources
Office for National Statistics. (2017, September 13). HI00 Regional labour market: Headline LFS indicators for all regions. Retrieved from <a href="https://www.ons.gov.uk/employmentandlabourmarket/peopleinwork/employmentandemployeetypes/datasets/headlinelabourforcesurveyindicatorsforallregionshi00" target="_blank">https://www.ons.gov.uk/employmentandlabourmarket/peopleinwork/employmentandemployeetypes/datasets/headlinelabourforcesurveyindicatorsforallregionshi00</a> [accessed 13 September 2017]
Office for National Statistics. (2017, September 13). UK labour market: September 2017. Retrieved from <a href="https://www.ons.gov.uk/employmentandlabourmarket/peopleinwork/employmentandemployeetypes/bulletins/uklabourmarket/september2017" target="_blank">https://www.ons.gov.uk/employmentandlabourmarket/peopleinwork/employmentandemployeetypes/bulletins/uklabourmarket/september2017</a> [accessed 13 September 2017]