Local Government Elections 2017 : Composition of Councils
This briefing analyses the political make-up of Scotland's councils following the local government elections held on 4 May 2017.
Executive Summary
Local government elections were held on 4 May 2017 using the Single Transferable Vote system.
No council has a majority administration. 12 councils are now led by a minority administration (six SNP, six Labour), 17 are in a coalition, and the remaining three are led by independent councillors (Comhairle nan Eilean Siar, Shetlands and Orkney Islands).
Some councils took more than a month to make up their political administrations. The last council to do so was Edinburgh Council, with Labour and the SNP signing a coalition agreement on 16 June 2017.
Background
The local government elections held on 4 May 2017 saw 2,572 nominations put forward and 1,227 councillors elected (47.7% of candidates). Turnout was 46.0% excluding rejected ballot papers, or 46.9% including rejected papers.
SPICe Briefing SB 17/35 Local Government Elections 2017 provides more information on the local government elections.
Council seats
All the figures in this briefing for the 2017 local elections, unless otherwise specified, are those provided to the Electoral Management Board for Scotland.
Figure 1 shows council seats by party (this refers to political parties as well as groups e.g. independent councillors) and by local authority after the 2017 local elections.
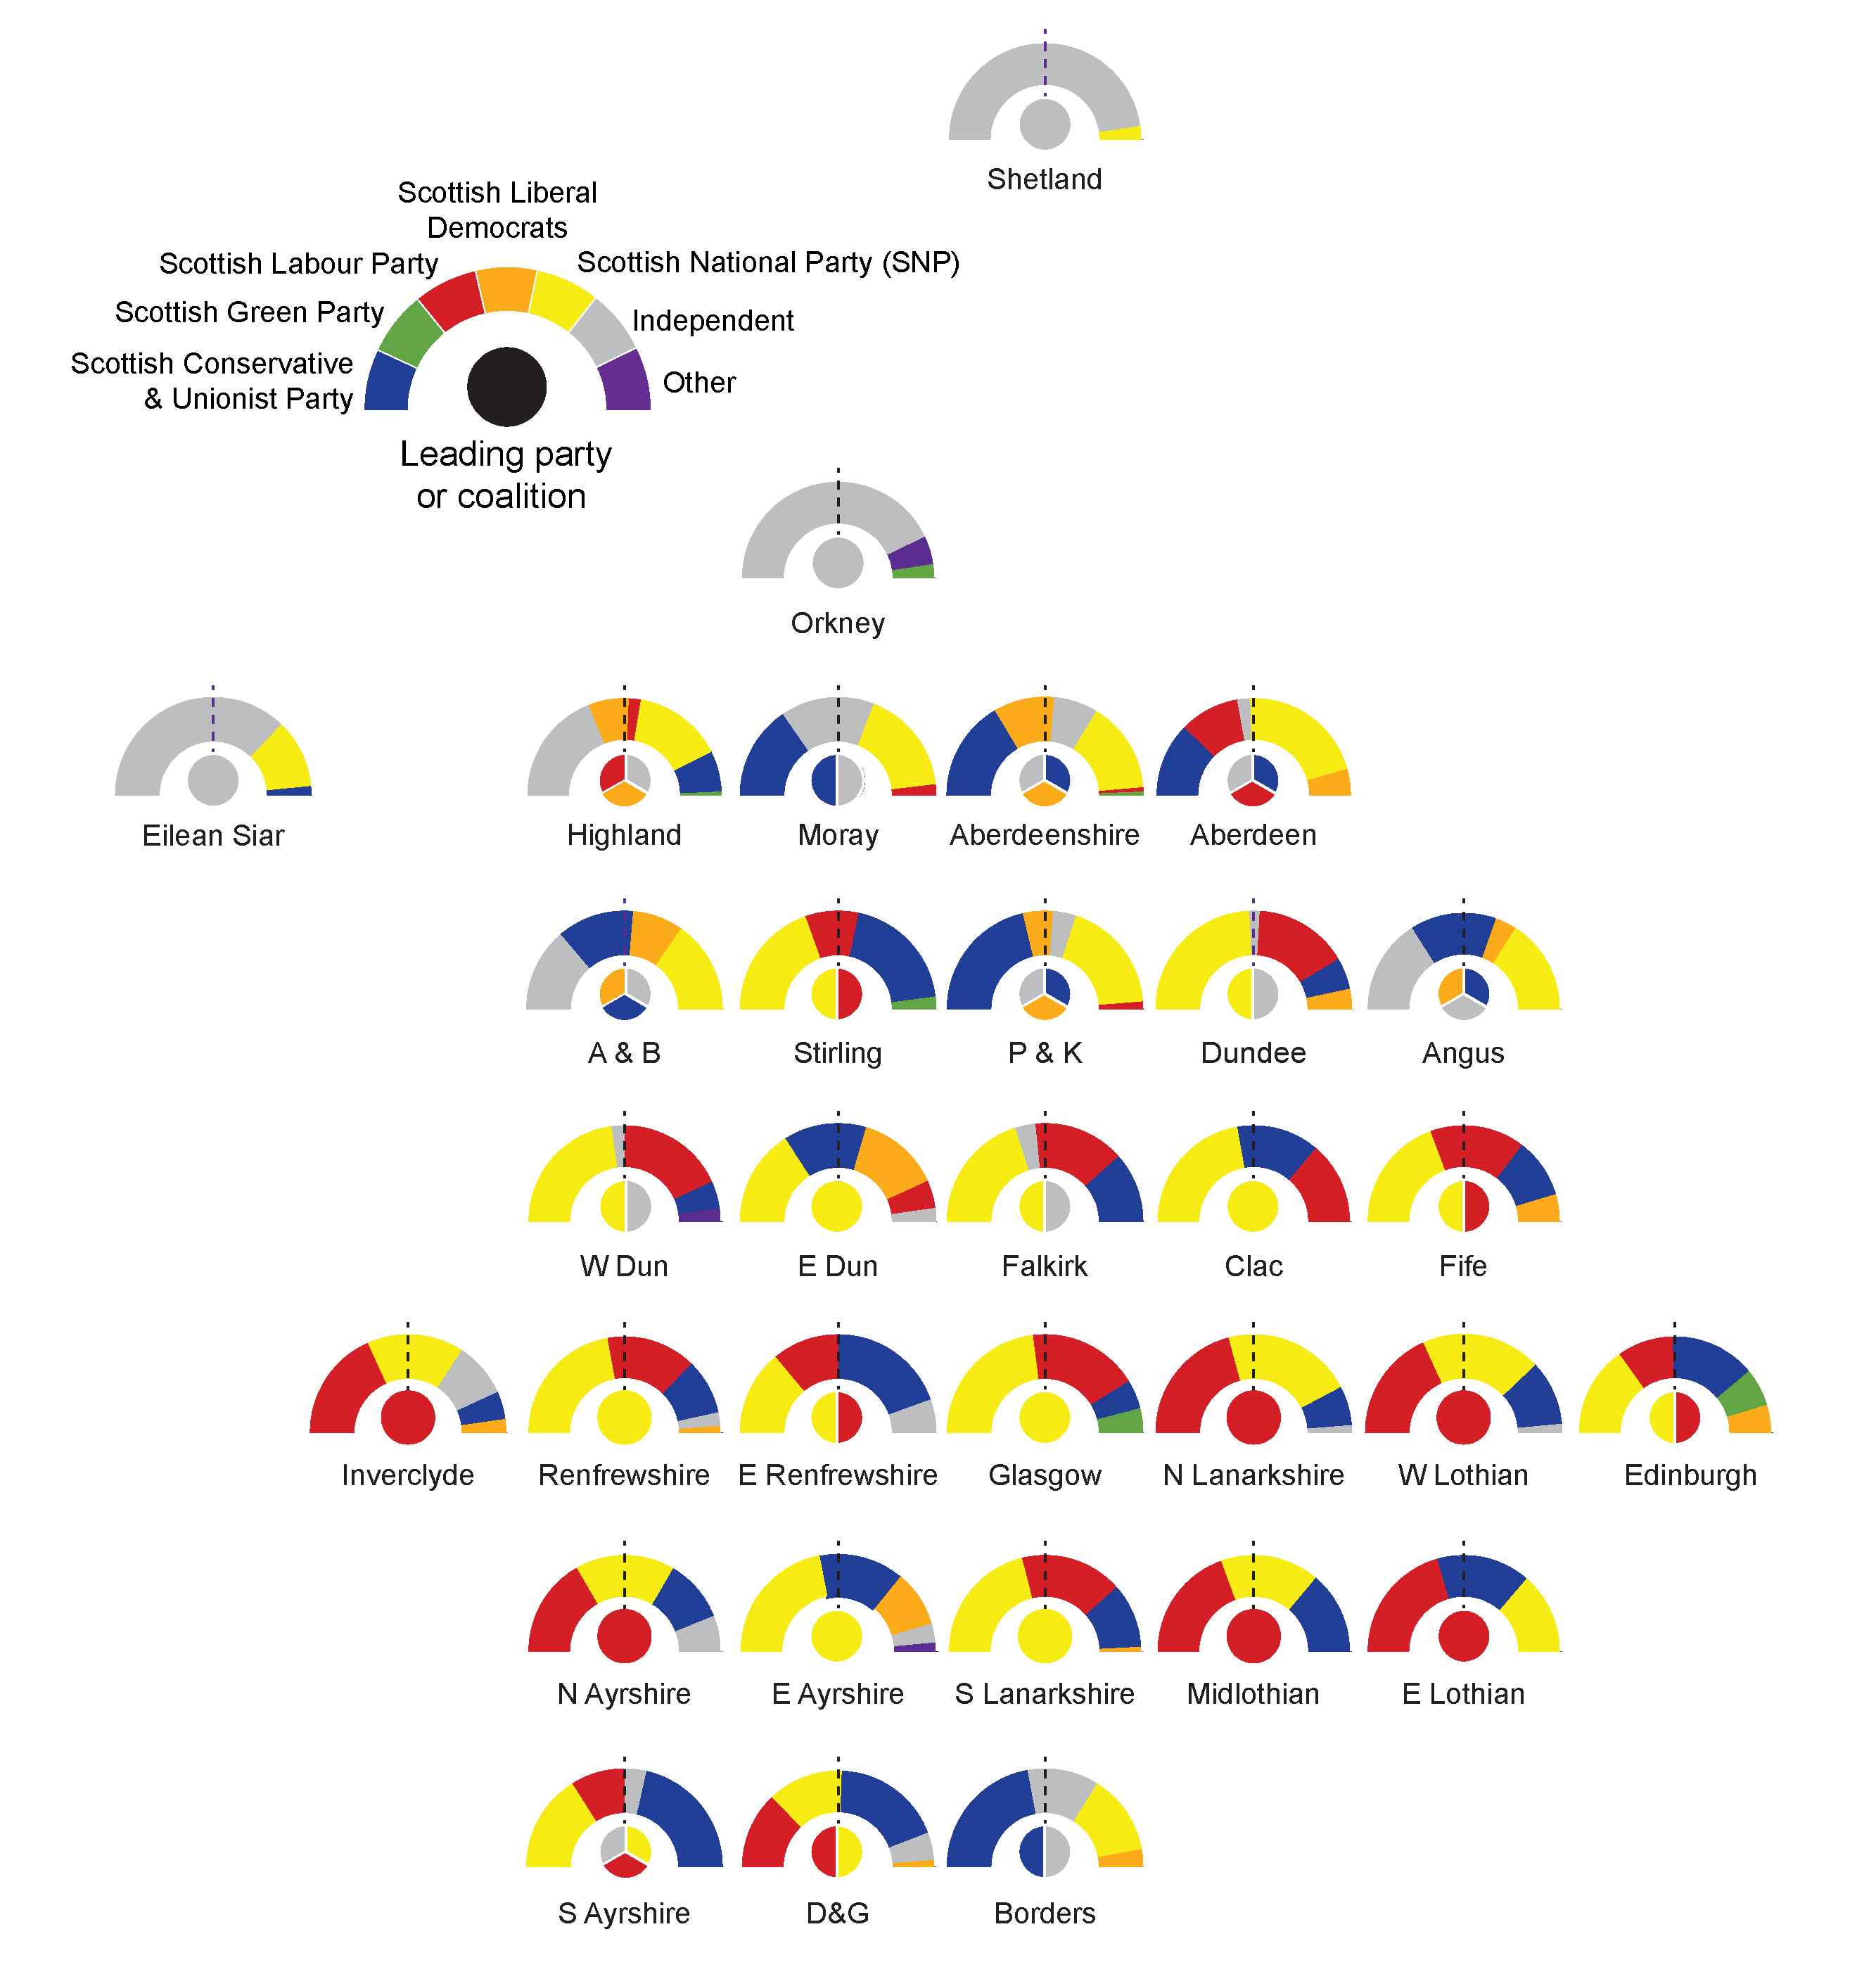
Table 1 shows the different types of administrations across Scotland's councils. 12 councils have a minority administration, with the Scottish National Party (SNP) and Scottish Labour (Labour) each leading six councils. There are also 17 coalitions, with a SNP-Labour administration leading five councils.
Comhairle nan Eilean Siar, the Shetland Islands and the Orkney Islands, where independent candidates won a majority of seats (74%, 95% and 86% respectively), are also led by independent councillors.
| Political administration of council1 | Number of councils | % total Councils |
|---|---|---|
| SNP minority | 6 | 18.8% |
| Labour minority | 6 | 18.8% |
| SNP & Labour | 5 | 15.6% |
| Scottish Conservative & Unionist Party ("Conservatives") Independent & Scottish Liberal Democrat Party ("Liberal Democrats") | 4 | 12.5% |
| SNP & Independent | 3 | 9.4% |
| Independent | 3 | 9.4% |
| Conservatives & Independent | 2 | 6.3% |
| Conservatives, Labour* & Independent | 1 | 3.1% |
| Independent, Liberal Democrats & Labour | 1 | 3.1% |
| SNP, Labour & Independent | 1 | 3.1% |
* Aberdeen Labour
Prior to the 2017 local government elections, there were 4 Labour-Conservative coalitions (Aberdeen City, East Lothian, South Ayrshire and Stirling). There are none post-2017 local elections.
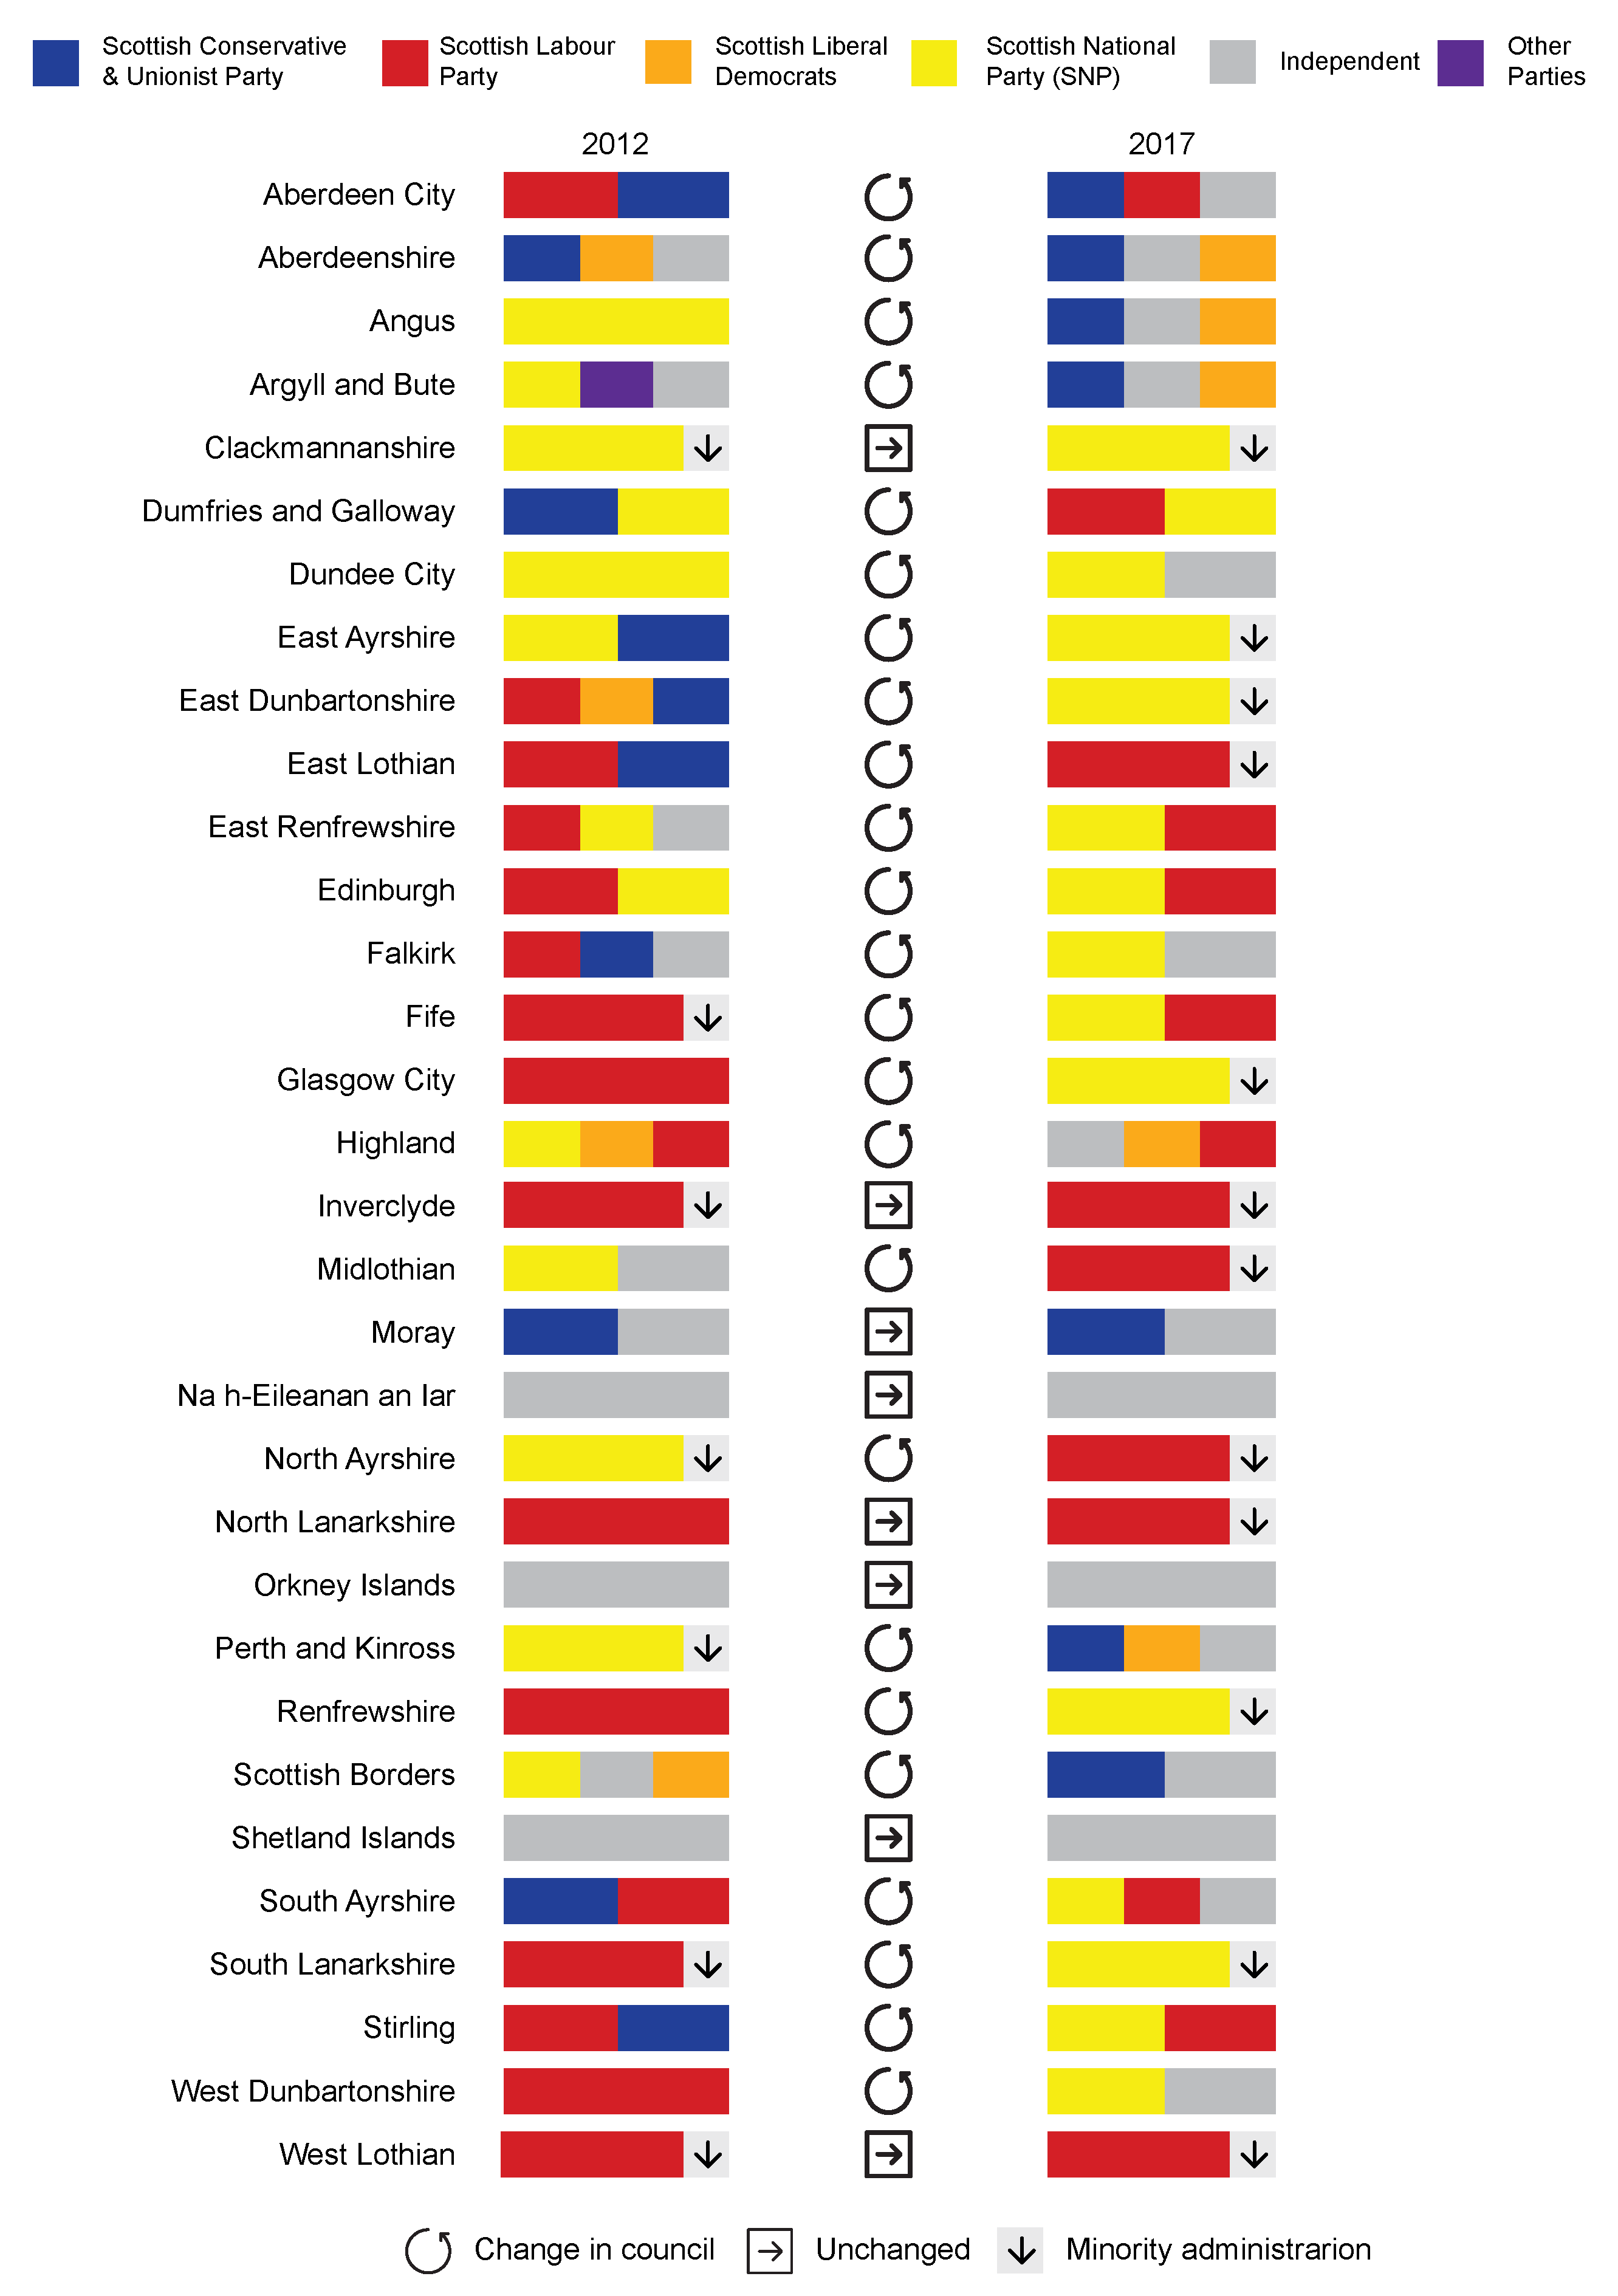
Figure 2 compares the make-up of council administrations before and after the 2017 local government elections, and shows the council leader's party as well as the largest party in terms of council seats.
| Make-up pre-2017 elections2 | Make-up post-2017 elections | Leader's party | Largest party | Largest party in the political administration | |
|---|---|---|---|---|---|
| Aberdeen City | Labour, Conservatives | Conservatives, Aberdeen Labour,* Independent | Aberdeen Labour | SNP | No |
| Aberdeenshire | Conservatives, Liberal Democrats, Independent | Conservatives, Independent, Liberal Democrats | Conservatives | Conservatives | Yes |
| Angus | SNP | Conservatives, Independent, Liberal Democrats | Independent | SNP & Independents (same number of seats) | Independents: yesSNP: no |
| Argyll and Bute | SNP, Argyll First, Independent | Conservatives, Independent, Liberal Democrats | Liberal Democrats | SNP | No |
| Clackmannanshire | SNP minority | SNP minority | SNP | SNP | Yes |
| Dumfries and Galloway | Conservatives, SNP | Labour, SNP | Labour | Conservatives | No |
| Dundee City | SNP | SNP, Independent | SNP | SNP | Yes |
| East Ayrshire | SNP, Conservatives | SNP minority | SNP | SNP | Yes |
| East Dunbartonshire | Labour, Liberal Democrats, Conservatives | SNP minority | SNP | SNP | Yes |
| East Lothian | Labour, Conservatives | Labour minority | Labour | Labour | Yes |
| East Renfrewshire | Labour, SNP, Independent | SNP, Labour | SNP | Conservatives | No |
| Edinburgh | SNP, Labour | SNP, Labour | SNP | SNP | Yes |
| Comhairle nan Eilean Siar | Independent | Independent | Independent | Independent | Yes |
| Falkirk | Labour, Conservatives, Independent | SNP, Independent | SNP | SNP | Yes |
| Fife | Labour minority | SNP, Labour | Labour & SNP | SNP | Yes |
| Glasgow City | Labour | SNP minority | SNP | SNP | Yes |
| Highland | SNP, Liberal Democrats, Labour | Independent, Liberal Democrats, Labour | Independent | Independent | Yes |
| Inverclyde | Labour minority | Labour minority | Labour | Labour | Yes |
| Midlothian | SNP, Independent | Labour minority | Labour | Labour | Yes |
| Moray | Conservatives, Independent | Conservatives, Independent | Independent | SNP | No |
| North Ayrshire | SNP minority | Labour minority | Labour | Labour & SNP (same number of seats) | Labour: yesSNP: no |
| North Lanarkshire | Labour | Labour minority | Labour | SNP | No |
| Orkney Islands | Independent | Independent | Independent | Independent | Yes |
| Perth and Kinross | SNP minority | Conservatives, Liberal Democrats, Independent | Conservatives | Conservatives | Yes |
| Renfrewshire | Labour | SNP minority | SNP | SNP | Yes |
| Scottish Borders | SNP, Independent, Liberal Democrats | Conservatives, Independent | Conservatives | Conservatives | Yes |
| Shetland Islands | Independent | Independent | Independent | Independent | Yes |
| South Ayrshire | Conservatives, Labour | SNP, Labour, Independent | SNP | Conservatives | No |
| South Lanarkshire | Labour minority | SNP minority | SNP | SNP | Yes |
| Stirling | Labour, Conservatives | SNP, Labour | SNP | Conservatives & SNP (same number of seats) | SNP: YesConservative: no |
| West Dunbartonshire | Labour | SNP, Independent | SNP | SNP | Yes |
| West Lothian | Labour minority | Labour minority | Labour | SNP | No |
* The BBC reported on 17 May 2017 that Scottish Labour's executive committee suspended Labour councillors in Aberdeen after they failed to stand down from a coalition with the Conservatives and Independents.3
Figure 2 shows the political make-up of council administrations before and after the 2017 local government elections.
Minority administrations
Table 3 shows the Councils with a minority administration, and the share of seats won by the party in that administration.
| Council | Political administration | Share of seats won by minority party in power | Is the party with the largest share of seats the one in the minority administration? |
|---|---|---|---|
| Clackmannanshire | SNP minority | 44.4% | Yes |
| East Ayrshire | SNP minority | 43.8% | Yes |
| East Dunbartonshire | SNP minority | 31.8% | Yes |
| East Lothian | Labour minority | 40.9% | Yes |
| Glasgow | SNP minority | 45.9% | Yes |
| Inverclyde | Labour minority | 36.4% | Yes |
| Midlothian | Labour minority | 38.9% | Yes |
| North Ayrshire | Labour minority | 33.3% | SNP got the same number of seats as Labour |
| North Lanarkshire | Labour minority | 41.6% | No (SNP got 42.9%) |
| Renfrewshire | SNP minority | 44.2% | Yes |
| South Lanarkshire | SNP minority | 42.2% | Yes |
| West Lothian | Labour minority | 36.4% | No (SNP got 39.4%) |
Of the 12 councils led by a minority, six are SNP and six are Labour. East Dunbartonshire has the weakest minority administration in terms of share of council seats, with the SNP only holding 31.8% of seats. The strongest minority administration is in Glasgow, with SNP councillors holding 45.9% of seats.
In all but three councils, the minority party leading the administration also won the highest share of seats in the local government elections. In North Lanarkshire and West Lothian however, the party leading the council (Labour) got less seats than the SNP. In North Ayrshire there is a Labour minority administration and Labour and the SNP got the same number of seats.
Council leaders' party
Table 4 shows the number of leaders in different parties. Fife has chosen two c0-leaders (SNP and Labour) so there are 33 council leaders in total. The SNP has the highest number of leaders, at 14, followed by independent councillors, six of whom are council leaders.
| Party | Leader's party |
|---|---|
| SNP | 14 |
| Labour | 8 |
| Independent | 6 |
| Conservatives | 3 |
| Liberal Democrats | 1 |
| Aberdeen Labour | 1 |
| Total | 33 |
Councils where the largest party was excluded from the political administration
Table 5 shows the councils where the party which won the highest share of seats did not end up in the make-up of the council, or if the two biggest parties got the same number of seats, one was excluded from the political administration. This was the case in eleven councils.
| Party with the largest share of seats but not in the political administration | Share of first preference votes of that party | Share of seats of that party | Political administration | |
|---|---|---|---|---|
| Aberdeen City | SNP | 32.4% | 42.2% | Conservatives, Aberdeen Labour, Independent |
| Angus | SNP (same number of seats as Independents) | SNP: 31.2%Independents: 25% | 32.1% each | Conservative, Independent, Liberal Democrats |
| Argyll & Bute | SNP | 27.7% | 30.6% | Conservative, Independent, Liberal Democrats |
| Dumfries & Galloway | Conservatives | 37.2% | 37.2% | Labour, SNP |
| East Renfrewshire | Conservatives | 38.3% | 38.9% | SNP, Labour |
| Moray | SNP | 31.6% | 34.6% | Conservatives, Independent |
| North Ayrshire | SNP (same number of seats as Labour) | SNP: 35.2%, Labour: 26.1% | 33.3% each | Labour minority |
| North Lanarkshire | SNP | 38.4% | 42.9% | Labour minority |
| South Ayrshire | Conservatives | 43.4% | 42.9% | SNP, Labour, Independent |
| Stirling | Conservatives (same number of seats as SNP) | Conservative: 37.2%SNP: 34.8% | 39.1% each | SNP, Labour |
| West Lothian | SNP | 37.3% | 39.4% | Labour minority |
Sources
Maddix, C. (2017). Scotland’s new political landscape. LGiU Scotland. Retrieved from <a href="http://www.lgiuscotland.org.uk/2017/06/16/scotlands-new-political-landscape/" target="_blank">http://www.lgiuscotland.org.uk/2017/06/16/scotlands-new-political-landscape/</a> [accessed 28 June 2017]
Liddell, G. (2012). SB12-38 Local government elections 2012. SPICe. Scottish Parliament. Retrieved from <a href="http://www.parliament.scot/ResearchBriefingsAndFactsheets/S4/SB12-38.pdf" target="_blank">http://www.parliament.scot/ResearchBriefingsAndFactsheets/S4/SB12-38.pdf</a> [accessed 28 June 2017]
BBC. (2017). Labour councillors in Aberdeen suspended over Tory coalition. Retrieved from <a href="http://www.bbc.co.uk/news/uk-scotland-north-east-orkney-shetland-39940006" target="_blank">http://www.bbc.co.uk/news/uk-scotland-north-east-orkney-shetland-39940006</a> [accessed 27 June 2017]