Labour Market update: May 2017
This briefing provides an overview of the Scottish labour market from the latest regional labour market statistics from the Office for National Statistics (ONS).
Executive Summary
The unemployment rate in Scotland sits at 4.4% which is the lowest rate since 2008. Over the year it saw the biggest decrease since 1995. The youth unemployment rate is the lowest since comparable record began in 2001. The employment rate increased slightly to 74.0%, but is still below the overall figure for the UK.
| Overall | Men | Women | ||||
|---|---|---|---|---|---|---|
| Rate | Change over the qtr (% pts) | Rate | Change over the qtr (% pts) | Rate | Change over the qtr (% pts) | |
| Unemployment | 4.4% | -0.5 | 4.5% | -0.6 | 4.2% | -0.4 |
| Employment | 74.0% | +0.3 | 77.5% | +0.9 | 70.8% | -0.3 |
| Economic Inactivity | 22.5% | +0.1 | 18.8% | -0.3 | 26.0% | +0.6 |
What are the labour market measurements?
The International Labour Organisation provides the official definition of labour market statistics.
What is Unemployment?
Level: Any individual aged 16 and over without a job who has been actively seeking work within the last four weeks and is available to start work within the next two weeks
Rate: Number of unemployed individuals as a proportion of the total number of economically active people, which includes both the unemployed and those in work.
What is Employment?
Level: Any individual aged 16 and over who is undertaking one hour or more a week of paid work
Rate: Number of people in employment expressed as a percentage of all people aged 16-64
What is Economic Inactivity?
Level: Any individual aged 16 to 64 who is not in employment, has not looked for work in the last four weeks, and is unable to start work within the next two weeks.
Rate: Number of people economically inactive expressed as a percentage of all people aged 16-64
The main reasons for economic inactivity are:
Being a student and not having or looking for a job
Looking after the family and/or home
Being sick (temporary and long-term)
Being retired
Being discouraged
Unemployment
The number of unemployed people in Scotland fell by 14,000 over the quarter and 48,000 over the year.
The unemployment rate for the UK has fallen to 4.6% and has not been lower since 1975. The rate in Scotland sits at 4.4%. This is the lowest rate since 2008 (Apr-Jun 2008 4.2%)
Over the year Scotland has seen the biggest decrease in the unemployment rate since 1995.
| Level ('000) | Quarter change ('000) | Year change ('000) | Rate | Quarter change (% pts) | Year change (% pts) | |
|---|---|---|---|---|---|---|
| Scotland | 120 | -14 | -48 | 4.4% | -0.5 | -1.7 |
| UK | 1,541 | -53 | -152 | 4.6% | -0.2 | -0.5 |
Unemployment by Gender
Over the year in Scotland, the fall in the unemployment level was mainly due to a decrease in the number of unemployed men of 39,000.
Over the year the unemployment rate for men in Scotland saw a decrease of 2.7 percentage points compared to 0.4 for the UK.
In Scotland this is the largest fall since comparable records began in 1993. The male unemployment rate has not been this low since 2008 (Apr-Jun 2008: 4.4%).
| Level ('000) | Quarter change ('000) | Year Change ('000) | Rate | Quarter change (% pts) | Year change (% pts) | ||
|---|---|---|---|---|---|---|---|
| Scotland | Men | 64 | -8 | -39 | 4.5% | -0.6 | -2.7 |
| Women | 56 | -6 | -8 | 4.2% | -0.4 | -0.7 | |
| UK | Men | 852 | -23 | -66 | 4.8% | -0.1 | -0.4 |
| Women | 688 | -30 | -86 | 4.4% | -0.2 | -0.6 |
Unemployment by age
The youth unemployment rate in Scotland is now at the lowest rate since comparable records began in 2002. Jan-Mar 2017 saw the largest fall in the unemployment rate since 2013.
The unemployment rate for 25-34 year olds is the lowest since comparable records began in 2002.
| Age group | Scotland | UK | |
|---|---|---|---|
| 16-24 | Rate | 9.4% | 12.0% |
| Year change (% pts) | -6.4 | -1.2 | |
| 25-34 | Rate | 3.1% | 4.5% |
| Year change (% pts) | -1.9 | -0.2 | |
| 35-49 | Rate | 3.6% | 3.2% |
| Year change (% pts) | -0.5 | -0.2 | |
| 50-64 | Rate | 4.1% | 3.2% |
| Year change (% pts) | -0.4 | -0.6 |
Employment
The number of people aged 16 and over in employment in Scotland increased by 5,000 over the quarter and 41,000 over the year.
The employment rate in Scotland increased by 0.3 percentage point over the year while the UK saw an increase of 0.2 percentage point.
The UK employment rate is the highest since comparable records began in 1971.
| Level ('000) | Quarter change ('000) | Year change ('000) | Rate | Quarter change (% pts) | Year change (% pts) | |
|---|---|---|---|---|---|---|
| Scotland | 2,620 | +5 | +41 | 74.0% | +0.3 | +0.9 |
| UK | 31,947 | +122 | +381 | 74.8% | +0.2 | +0.6 |
Employment by Gender
Employment levels and rates are higher for men than for women at both the Scottish and UK level.
The employment level in Scotland increased despite 9,000 women leaving employment. This was due to14,000 men entering employment.
The UK saw an overall increase in employment of 122,000 people over the quarter mainly due to 70,000 men finding work.
| Level ('000) | Quarter change ('000) | Year change ('000) | Rate | Quarter change (% pts) | Year change (% pts) | ||
|---|---|---|---|---|---|---|---|
| Scotland | Men | 1,345 | +14 | +24 | 77.5% | +0.9 | +1.3 |
| Women | 1,275 | -9 | +17 | 70.8% | -0.3 | +0.5 | |
| UK | Men | 16,966 | +70 | +122 | 79.5% | +0.2 | +0.3 |
| Women | 14,982 | +52 | +260 | 70.2% | +0.2 | +1.0 |
Employment by Age
The employment rate for 16-24 year-olds in Scotland has increased by 3.9 percentage points over the year and is the highest since 2015. (Jan-Mar 2017: 59.2%).
The 1.5 percentage point increase for 25-34 year olds is the biggest since 2014 (Jan-Mar 2013 to Jan-Mar 2014: +3.0 percentage points)
It is the third consecutive year where there has been a decrease in the employment rate for 35-49 year olds with the rate now the lowest since 2013 (Jan-Mar 2013: 81.0%)
| Age group | Scotland | UK | |
|---|---|---|---|
| 16-24 | Rate | 58.7% | 54.3% |
| Year change (% pts) | +3.9 | +0.4 | |
| 25-34 | Rate | 82.0% | 82.4% |
| Year change (% pts) | +1.5 | +0.8 | |
| 35-49 | Rate | 82.0% | 83.9% |
| Year Change (% pts) | -0.1 | +0.2 | |
| 50-64 | Rate | 69.3% | 71.1% |
| Year Change (% pts) | +0.4 | +1.1 |
Economic Inactivity
The number of people economically inactive in Scotland increased by 4,000 over the quarter and 15,000 over the year.
Over the quarter the economic inactivity rate in Scotland increased by 0.1 percentage points whilst the UK's fell by 0.1.
| Level ('000) | Quarter change ('000) | Year change ('000) | Rate | Quarter change (% pts) | Year change (% pts) | |
|---|---|---|---|---|---|---|
| Scotland | 767 | +4 | +15 | 22.5% | +0.1 | +0.5 |
| UK | 8,829 | -40 | -82 | 21.5% | -0.1 | -0.3 |
Economic Inactivity by Gender
Economic inactivity rates are higher for women than for men.
The number of economically inactive people in Scotland increased mainly due to 10,000 women becoming economically inactive. While there was a decrease of 6,000 men.
Since 2015 when female inactivity was at its lowest (Jan-Mar 2015: 23.4%) the rate has increased by 2.6 percentage points.
| Level ('000) | Quarter change ('000) | Year change ('000) | Rate | Quarter change (% pts) | Year change (% pts) | ||
|---|---|---|---|---|---|---|---|
| Scotland | Men | 313 | -6 | +17 | 18.8% | -0.3 | +1.0 |
| Women | 454 | +10 | -2 | 26.0% | +0.6 | -0.1 | |
| UK | Men | 3,347 | -18 | +29 | 16.4% | -0.1 | +0.1 |
| Women | 5,482 | -22 | -111 | 26.5% | -0.1 | -0.6 |
Economic Inactivity by Age
The economic inactivity rate for 35-49 year olds is the highest it has been since 2002 (Jan-Mar 2002: 16.2%).
The economic inactivity rate for 50-54 year olds is the lowest it has been since comparable records began in 2002.
| Age Group | Scotland | UK | |
|---|---|---|---|
| 16-24 | Rate | 35.2% | 38.3% |
| Year change (% pts) | +0.3 | +0.4 | |
| 25-34 | Rate | 15.3% | 13.7% |
| Year change (% pts) | +0.1 | -0.6 | |
| 35-49 | Rate | 15.0% | 13.3% |
| Year change (% pts) | +1.5 | -0.1 | |
| 50-64 | Rate | 27.8% | 26.6% |
| Year change (% pts) | -0.1 | -0.6 |
Claimant Count
The Claimant Count figures presented here are the experimental statistics from the ONS for Jobseekers Allowance, plus Universal Credit claimants who are out of work.
Under Universal Credit a broader span of claimants are required to look for work than under Jobseekers Allowance. As Universal Credit Full Service is rolled out in particular areas, the number of people recorded as being on the Claimant Count is therefore likely to rise.
This is not an official measure of unemployment, but it does provide accurate information on the labour market at a local level.
Scotland and UK comparison
The seasonally adjusted claimant count rate for April in Scotland increased by 0.1 percentage point over the month as well as the year.
There was no change over the quarter or year in the claimant count rate in the UK.
The Scottish claimant count rate is higher than the UK rate.
| Level | Month Change | Year Change | Rate | Month Change (% pts) | Year Change (% pts) | |
|---|---|---|---|---|---|---|
| Scotland | 80,000 | +2,100 | +4,300 | 2.3% | +0.1 | +0.1 |
| UK | 792,800 | +19,400 | +29,800 | 1.9% | +0.0 | +0.0 |
Constituency data: Employment Rate
The constituency data for Scotland comes from the Annual Population Survey (APS). The APS datasets are produced quarterly, with each dataset containing 12 months of data. The latest APS data is for 2016.
The Shetland Islands have the highest employment rate at 86.6% while Glasgow Maryhill and Springburn has the lowest at 59.7%. Glasgow Provan saw the biggest increase over the year, while Glasgow Cathcart saw the largest decrease.
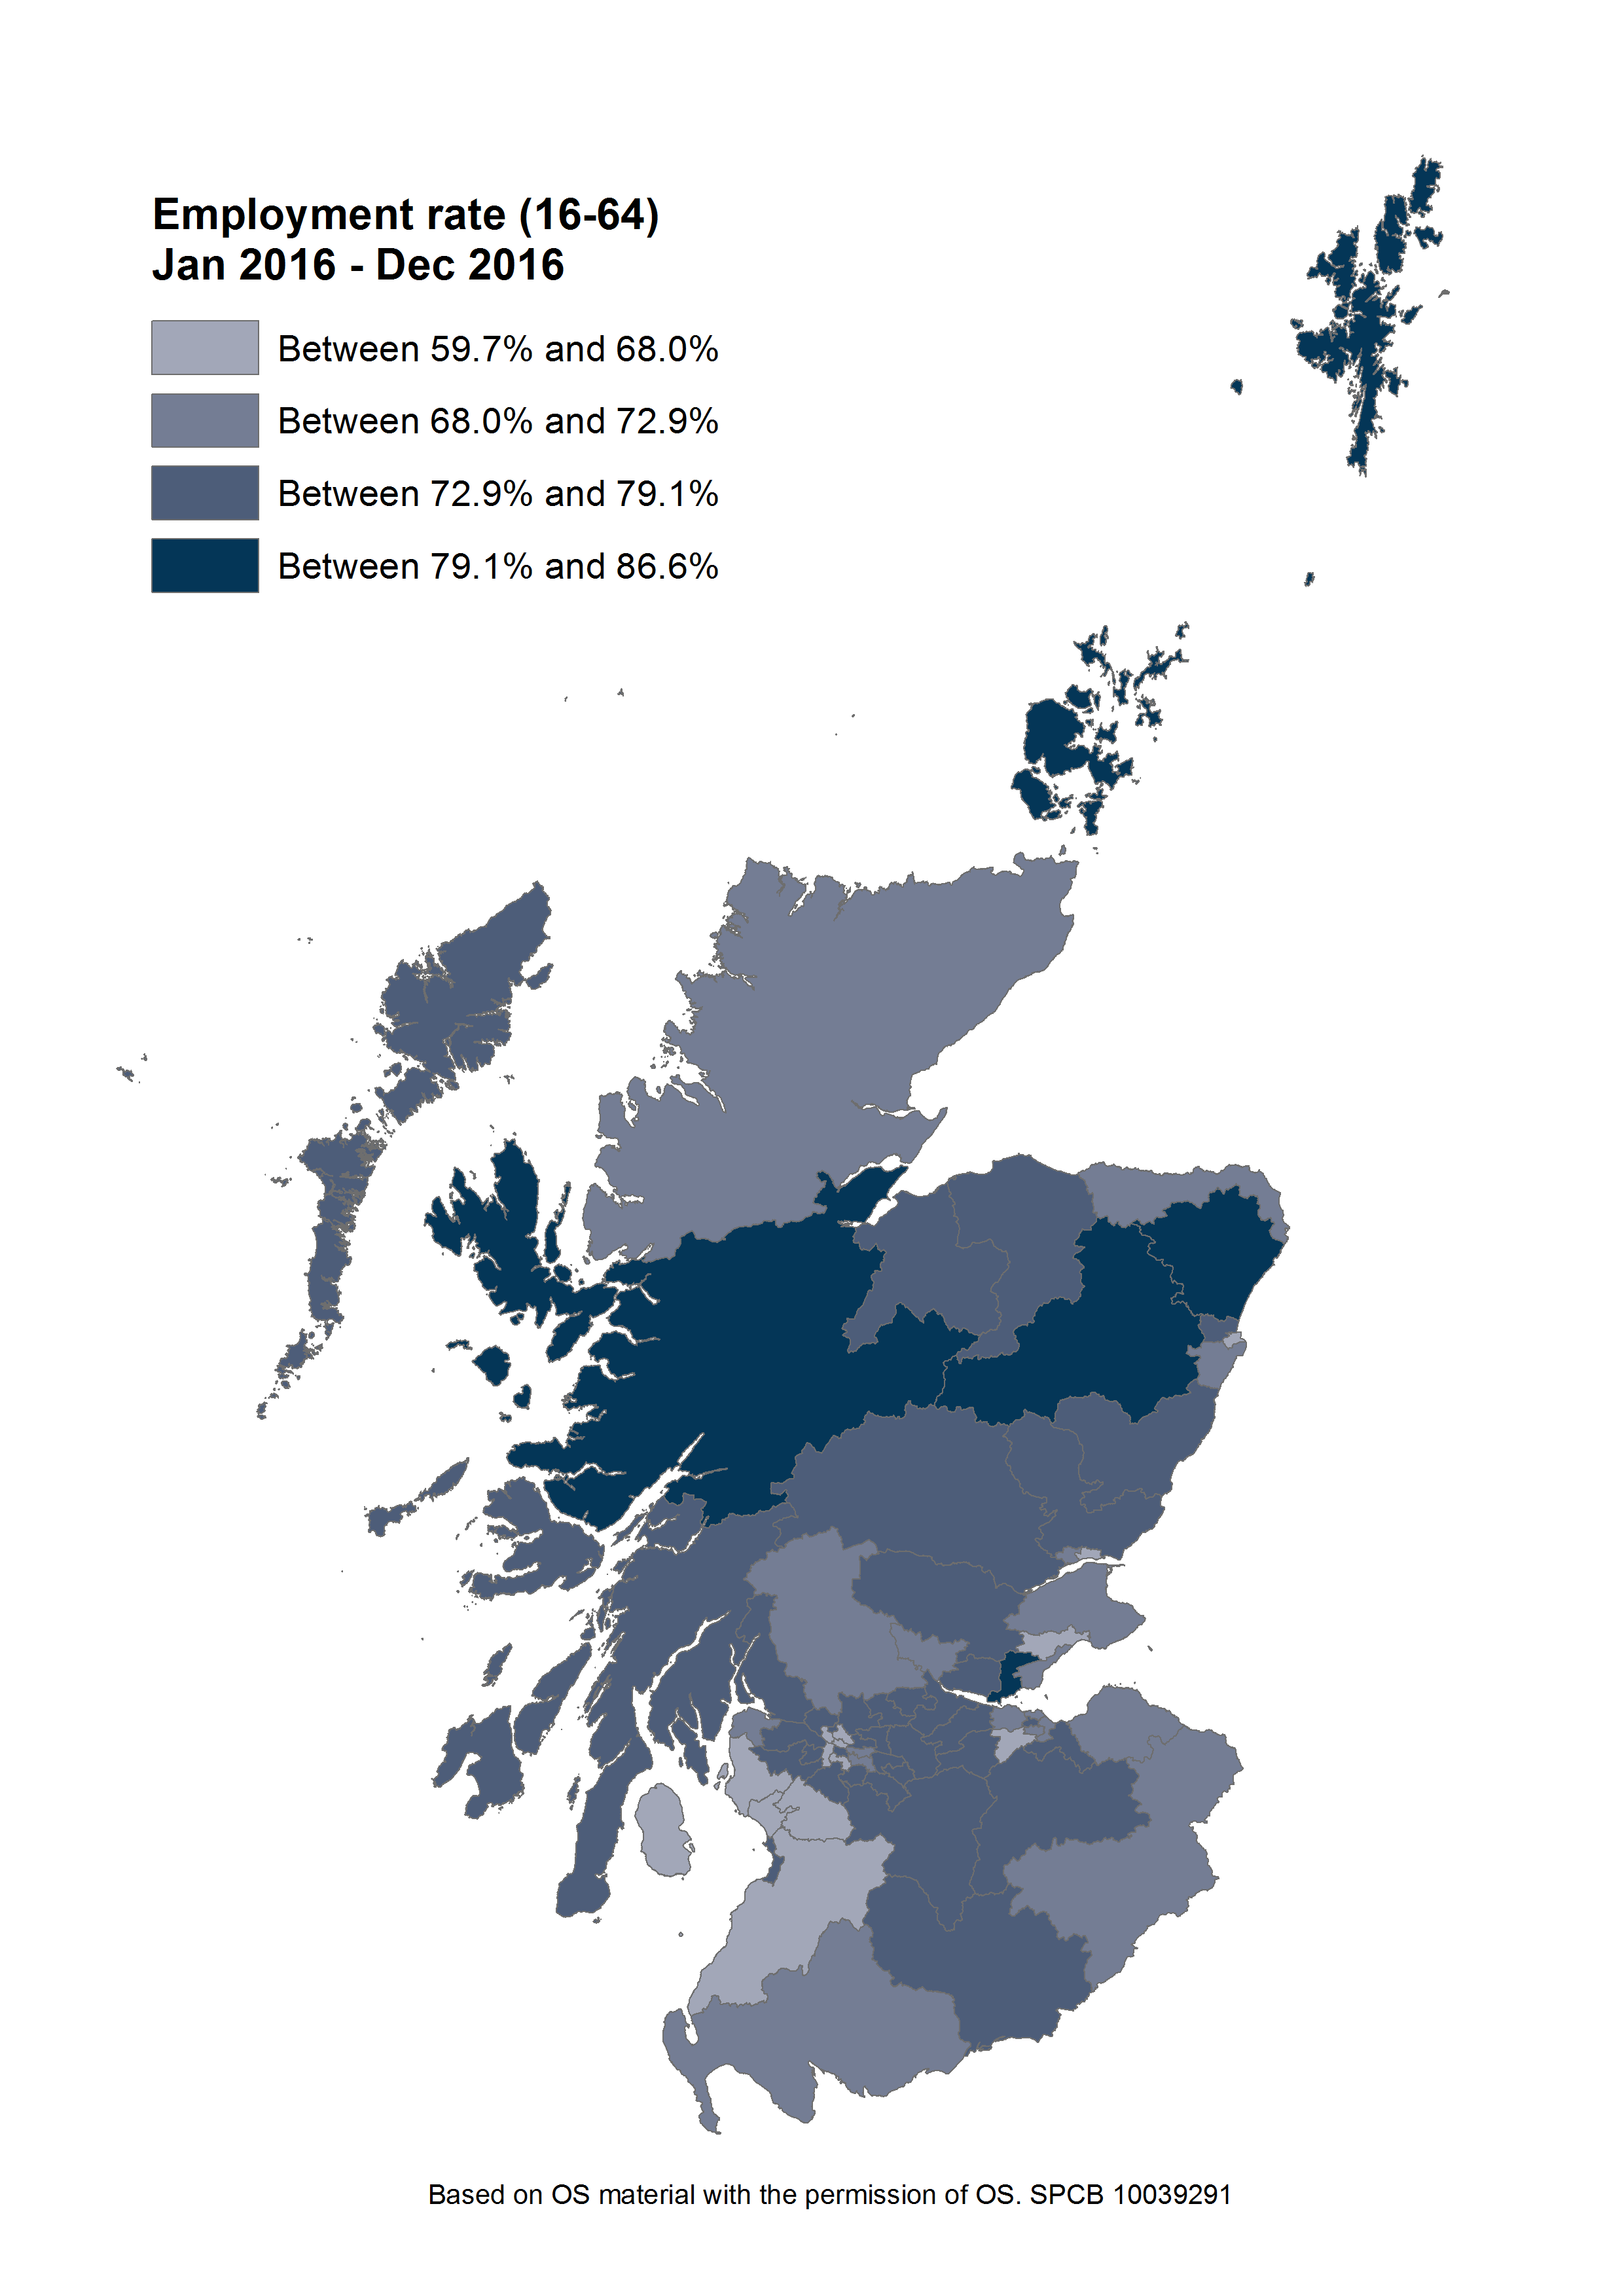
Find out the latest labour market data for your constituency.
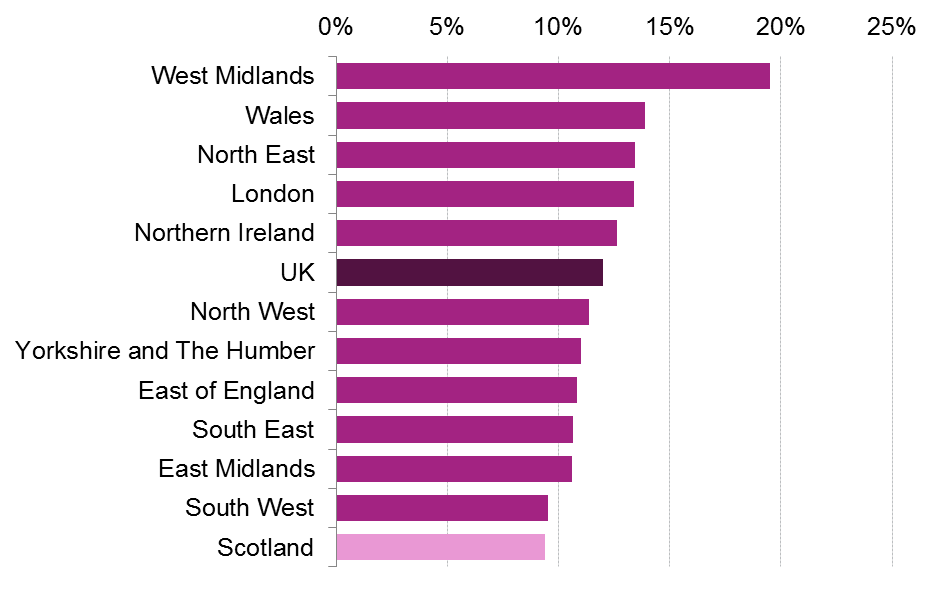
Guest Indicator: 16-24 year olds
The youth unemployment rate in Scotland is the lowest since comparable record began in 2002, at 9.4%. This give Scotland the lowest youth employment rate across the UK.
Figure 2: Youth unemployment figures across the UK,Jan-Mar 2017
The youth employment rate is higher than for the rest of the population in Scotland (ie, those aged 25-64). Figure 3 shows the economic inactivity rate is also higher for 16-24 year olds. This is because this age group will have the highest proportion of people in full-time eduction, which is one of the main reasons for economic inactivity classification.
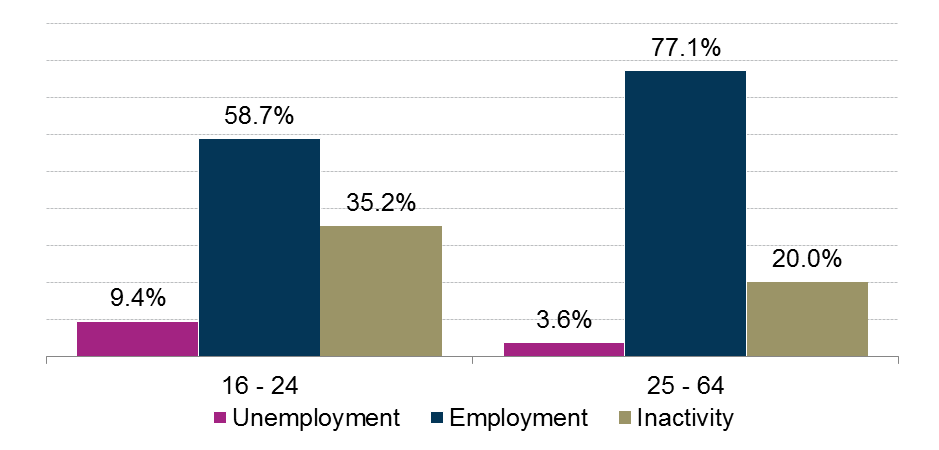
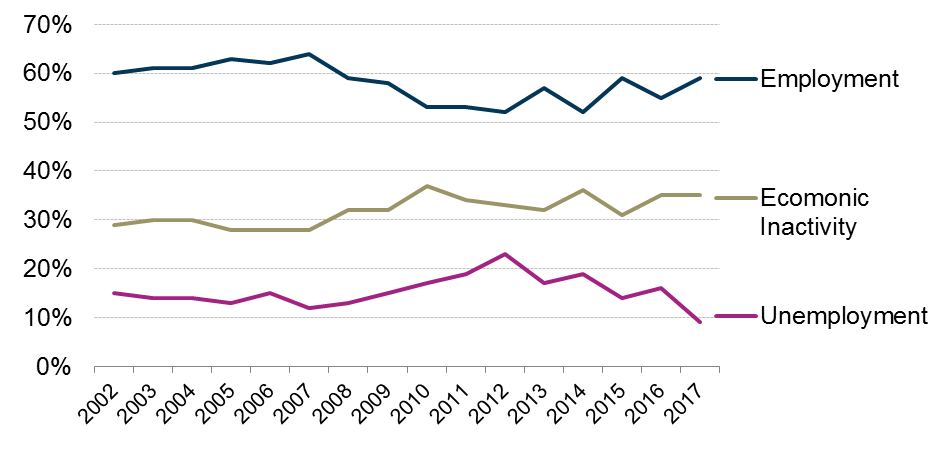
Figure 4 show how employment, unemployment and economic inactivity has changed for 16-24 year olds since 2003.
Since 2012 the youth unemployment rate has decreased significantly, from 22.9% to 9.4%. Over the same period employment has grown from 52.1% to 58.7% and economic inactivity has increased from 32.5% to 35.2%.
Since 2008 the employment rate has been below 60%.
Since 2008 the economic inactivity rate has remained above 30%.