Labour Market Update: April 2017
This briefing provides an overview of the Scottish labour market from the latest regional labour market statistics from the Office for National Statistics (ONS).
Executive Summary
The unemployment rate in Scotland sits at 4.5% which is the lowest rate since 2008. Over the year it saw the biggest decrease since 1995. The youth unemployment rate is the lowest since comparable record began in 2001. However the employment rate fell slightly to 73.4%.
The economic inactivity rate is at it highest since 2010, with the rate for men at its highest since comparable records began in 1992.
| Overall | Men | Women | ||||
|---|---|---|---|---|---|---|
| Rate | Change over the qtr (% pts) | Rate | Change over the qtr (% pts) | Rate | Change over the qtr (% pts) | |
| Unemployment | 4.5% | -0.5 | 4.6% | -0.6 | 4.5% | -0.4 |
| Employment | 73.4% | -0.1 | 76.9% | -0.2 | 70.1% | -0.1 |
| Economic Inactivity | 23.0% | +0.5 | 19.4% | +0.8 | 26.5% | +0.3 |
Unemployment
This section looks at unemployment in Scotland. The International Labour Organisation's definition of unemployment is:
Level: Any individual aged 16 and over without a job who has been actively seeking work within the last four weeks and is available to start work within the next two weeks
Rate: Number of unemployed individuals as a proportion of the total number of economically active people, which includes both the unemployed and those in work.
Scotland and UK comparison
The number of unemployed people in Scotland fell by 15,000 over the quarter and 47,000 over the year.
The unemployment rate for the UK has fallen to 4.7% and has not been lower since June to August 19751. The rate in Scotland sits at 4.5%.
Over the year Scotland has seen the biggest decrease in the unemployment rate since 1995.
| Level ('000) | Quarter change ('000) | Year change ('000) | Rate | Quarter change (% pts) | Year change (% pts) | |
|---|---|---|---|---|---|---|
| Scotland | 123 | -15 | -47 | 4.5% | -0.5 | -1.6 |
| UK | 1,559 | -45 | -141 | 4.7% | -0.1 | -0.4 |
Unemployment by Gender
Over the year in Scotland, the fall in the unemployment level was mainly due to a decrease in the number of unemployed men by 38,000. .
Over the year the unemployment rate for men in Scotland saw a decrease of 2.5 percentage points compared to 0.4 for the UK.
In Scotland this is the largest fall since comparable records began in 1992. The male unemployment rate has not been this low since 2008 (Mar-May 2008: 4.2%)
| Level ('000) | Quarter change ('000) | Year Change ('000) | Rate | Quarter change (% pts) | Year change (% pts) | ||
|---|---|---|---|---|---|---|---|
| Scotland | Men | 64 | -9 | -38 | 4.6% | -0.6 | -2.5 |
| Women | 60 | -6 | -9 | 4.5% | -0.4 | -0.6 | |
| UK | Men | 853 | -30 | -76 | 4.8% | -0.2 | -0.4 |
| Women | 706 | -15 | -65 | 4.5% | -0.1 | -0.5 |
Unemployment by age
The youth unemployment rate in Scotland is now at the lowest rate since comparable records began in 2001.
The unemployment rate for 25-34 year olds is the lowest since comparable records began in 2001.
| Age group | Scotland | UK | |
|---|---|---|---|
| 16-24 | Rate | 8.9% | 11.7% |
| Year change (% pts) | -6.9 | -1.3 | |
| 25-34 | Rate | 3.4% | 4.6% |
| Year change (% pts) | -1.5 | -0.3 | |
| 35-49 | Rate | 3.9% | 3.1% |
| Year change (% pts) | -0.5 | -0.2 | |
| 50-64 | Rate | 4.3% | 3.3% |
| Year change (% pts) | +0.2 | -0.4 |
Employment
This section looks at employment in Scotland. The International Labour Organisation's definition of employment is:
Level: Any individual aged 16 and over who is undertaking one hour or more a week of paid work
Rate: Number of people in employment expressed as a percentage of all people aged 16-64
Scotland and UK comparison
The number of people aged 16 and over in employment in Scotland decreased by 8,000 over the quarter and 12,000 over the year.
The employment rate in Scotland fell by 0.1 percentage point from over the year while the UK saw an increase of 0.1 percentage point.
The UK employment rate is the joint highest since comparable records began in 19711.
| Level ('000) | Quarter change ('000) | Year change ('000) | Rate | Quarter change (% pts) | Year change (% pts) | |
|---|---|---|---|---|---|---|
| Scotland | 2,596 | -8 | -12 | 73.4% | -0.1 | -0.4 |
| UK | 31,841 | +39 | +312 | 74.6% | +0.1 | +0.5 |
Employment by Gender
Employment levels and rates are higher for men than for women at both the Scottish and UK level.
In Scotland the decrease in the level of employment over the year was driven mainly by 5,000 men leaving employment, compared to 3,000 women.
The UK saw an increase of 39,000 over the quarter due to 38,000 men finding work.
| Level ('000) | Quarter change ('000) | Year change ('000) | Rate | Quarter change (% pts) | Year change (% pts) | ||
|---|---|---|---|---|---|---|---|
| Scotland | Men | 1,334 | -5 | -6 | 76.9% | -0.2 | -0.1 |
| Women | 1,261 | -3 | -6 | 70.1% | +0.1 | -0.7 | |
| UK | Men | 16,921 | +38 | +71 | 79.4% | +0.2 | +0.2 |
| Women | 15,626 | +1 | +241 | 69.9% | +0.1 | +0.8 |
Employment by Age
The employment rate for 16-24 year-olds in Scotland has fallen by 0.5 percentage points over the year and is the lowest since 2013. (Dec-Feb 2013: 51.1%).
The 1.5 percentage points fall in the employment rate for the 50-64 age group is the largest fall since comparable records began in 2001.
| Age group | Scotland | UK | |
|---|---|---|---|
| 16-24 | Rate | 56.4% | 54.5% |
| Year change (% pts) | -0.5 | +0.1 | |
| 25-34 | Rate | 80.8% | 82.1% |
| Year change (% pts) | -0.4 | +0.5 | |
| 35-49 | Rate | 82.4% | 84.0% |
| Year Change (% pts) | +0.3 | +0.3 | |
| 50-64 | Rate | 68.5% | 70.9% |
| Year Change (% pts) | -1.5 | +0.8 |
Economic Inactivity
This section looks at economic inactivity in Scotland. The International Labour Organisation's definition of economic inactivity is:
Level: Any individual aged 16 to 64 who is not in employment, has not looked for work in the last four weeks, and is unable to start work within the next two weeks.
Rate: Number of people economically inactive expressed as a percentage of all people aged 16-64.
Scotland and UK comparison
The number of people economically inactive in Scotland increased by 18,000 over the quarter and 60,000 over the year, which is the largest annual increase since comparable records began in 1992.
Over the quarter the economic inactivity rate in Scotland increased by 0.8 percentage point whilst the UK's was unchanged.
The change in the economic inactivity rate over the year in Scotland was the highest since comparable records began in 1992.
The economic inactivity rate in Scotland is the highest it has been since 2010 (Mar-May 2010 23.6%).
| Level ('000) | Quarter change ('000) | Year change ('000) | Rate | Quarter change (% pts) | Year change (% pts) | |
|---|---|---|---|---|---|---|
| Scotland | 786 | +18 | +60 | 23.0% | +0.8 | +1.8 |
| UK | 8,884 | -10 | -36 | 21.6% | 0.0 | -0.2 |
Economic Inactivity by Gender
Economic inactivity rates are higher for women than for men.
The number of economically inactive people increased mainly due to 13,000 men becoming economically inactive.
Over the year the inactivity rate from men in Scotland increased by 2.4 percentage points which is the largest annual increase since comparable records began in 1992.
The inactivity rate for men is the highest since comparable records began in 1992.
Since 2015 when female inactivity was at its lowest (Dec-Feb 2015: 24.0%) the rate has increased by 2.5%.
| Level ('000) | Quarter change ('000) | Year change ('000) | Rate | Quarter change (% pts) | Year change (% pts) | ||
|---|---|---|---|---|---|---|---|
| Scotland | Men | 323 | +13 | +39 | 19.4% | +0.8 | +2.4 |
| Women | 463 | +4 | +21 | 26.5% | +0.3 | +1.2 | |
| UK | Men | 3,369 | -13 | +57 | 16.5% | -0.1 | +0.2 |
| Women | 5,514 | +3 | -93 | 26.7% | 0.0 | -0. |
Economic Inactivity by Age
Youth economic inactivity is at its highest rate since comparable records began in 2001. The yearly increase is the highest since comparable records began in 2001.
The economic inactivity rate for 25-34 year-olds is the highest it has been since 2003 (Dec-Feb 2003: 16.6%).
| Age Group | Scotland | UK | |
|---|---|---|---|
| 16-24 | Rate | 38.1% | 38.3% |
| Year change (% pts) | +5.7 | +0.8 | |
| 25-34 | Rate | 16.4% | 14.0% |
| Year change (% pts) | +1.7 | -0.3 | |
| 35-49 | Rate | 14.3% | 13.3% |
| Year change (% pts) | +0.2 | -0.2 | |
| 50-64 | Rate | 28.4% | 26.7% |
| Year change (% pts) | +1.4 | -0.5 |
Claimant Count
The Claimant Count figures presented here are the experimental statistics from the ONS for Jobseekers Allowance, plus Universal Credit claimants who are out of work.
This is not an official measure of unemployment, but it does provide accurate information on the labour market at a local level.
Scotland and UK comparison
The seasonally adjusted claimant count rate for March in both Scotland and the UK as a whole increased by 0.1 percentage point over the month as well as the year.
The Scottish claimant count rate is higher than the UK rate.
| Level | Month Change | Year Change | Rate | Month Change (% pts) | Year Change (% pts) | |
|---|---|---|---|---|---|---|
| Scotland | 77,000 | +2,300 | +2,600 | 2.2% | +0.1 | +0.1 |
| UK | 765,400 | +25,500 | +11,800 | 1.9% | +0.1 | +0.1 |
Constituency data: Unemployment Rate
The constituency data for Scotland comes from the Annual Population Survey (APS). The APS datasets are produced quarterly, with each dataset containing 12 months of data. The latest APS data is for 2016.
Cunninghame South has the highest unemployment rate at 11.6% while Inverness and Nairn has the lowest at 1.4%. Aberdeen Central saw the biggest increase over the year, while Cumbernauld and Kilsyth saw the largest decrease.
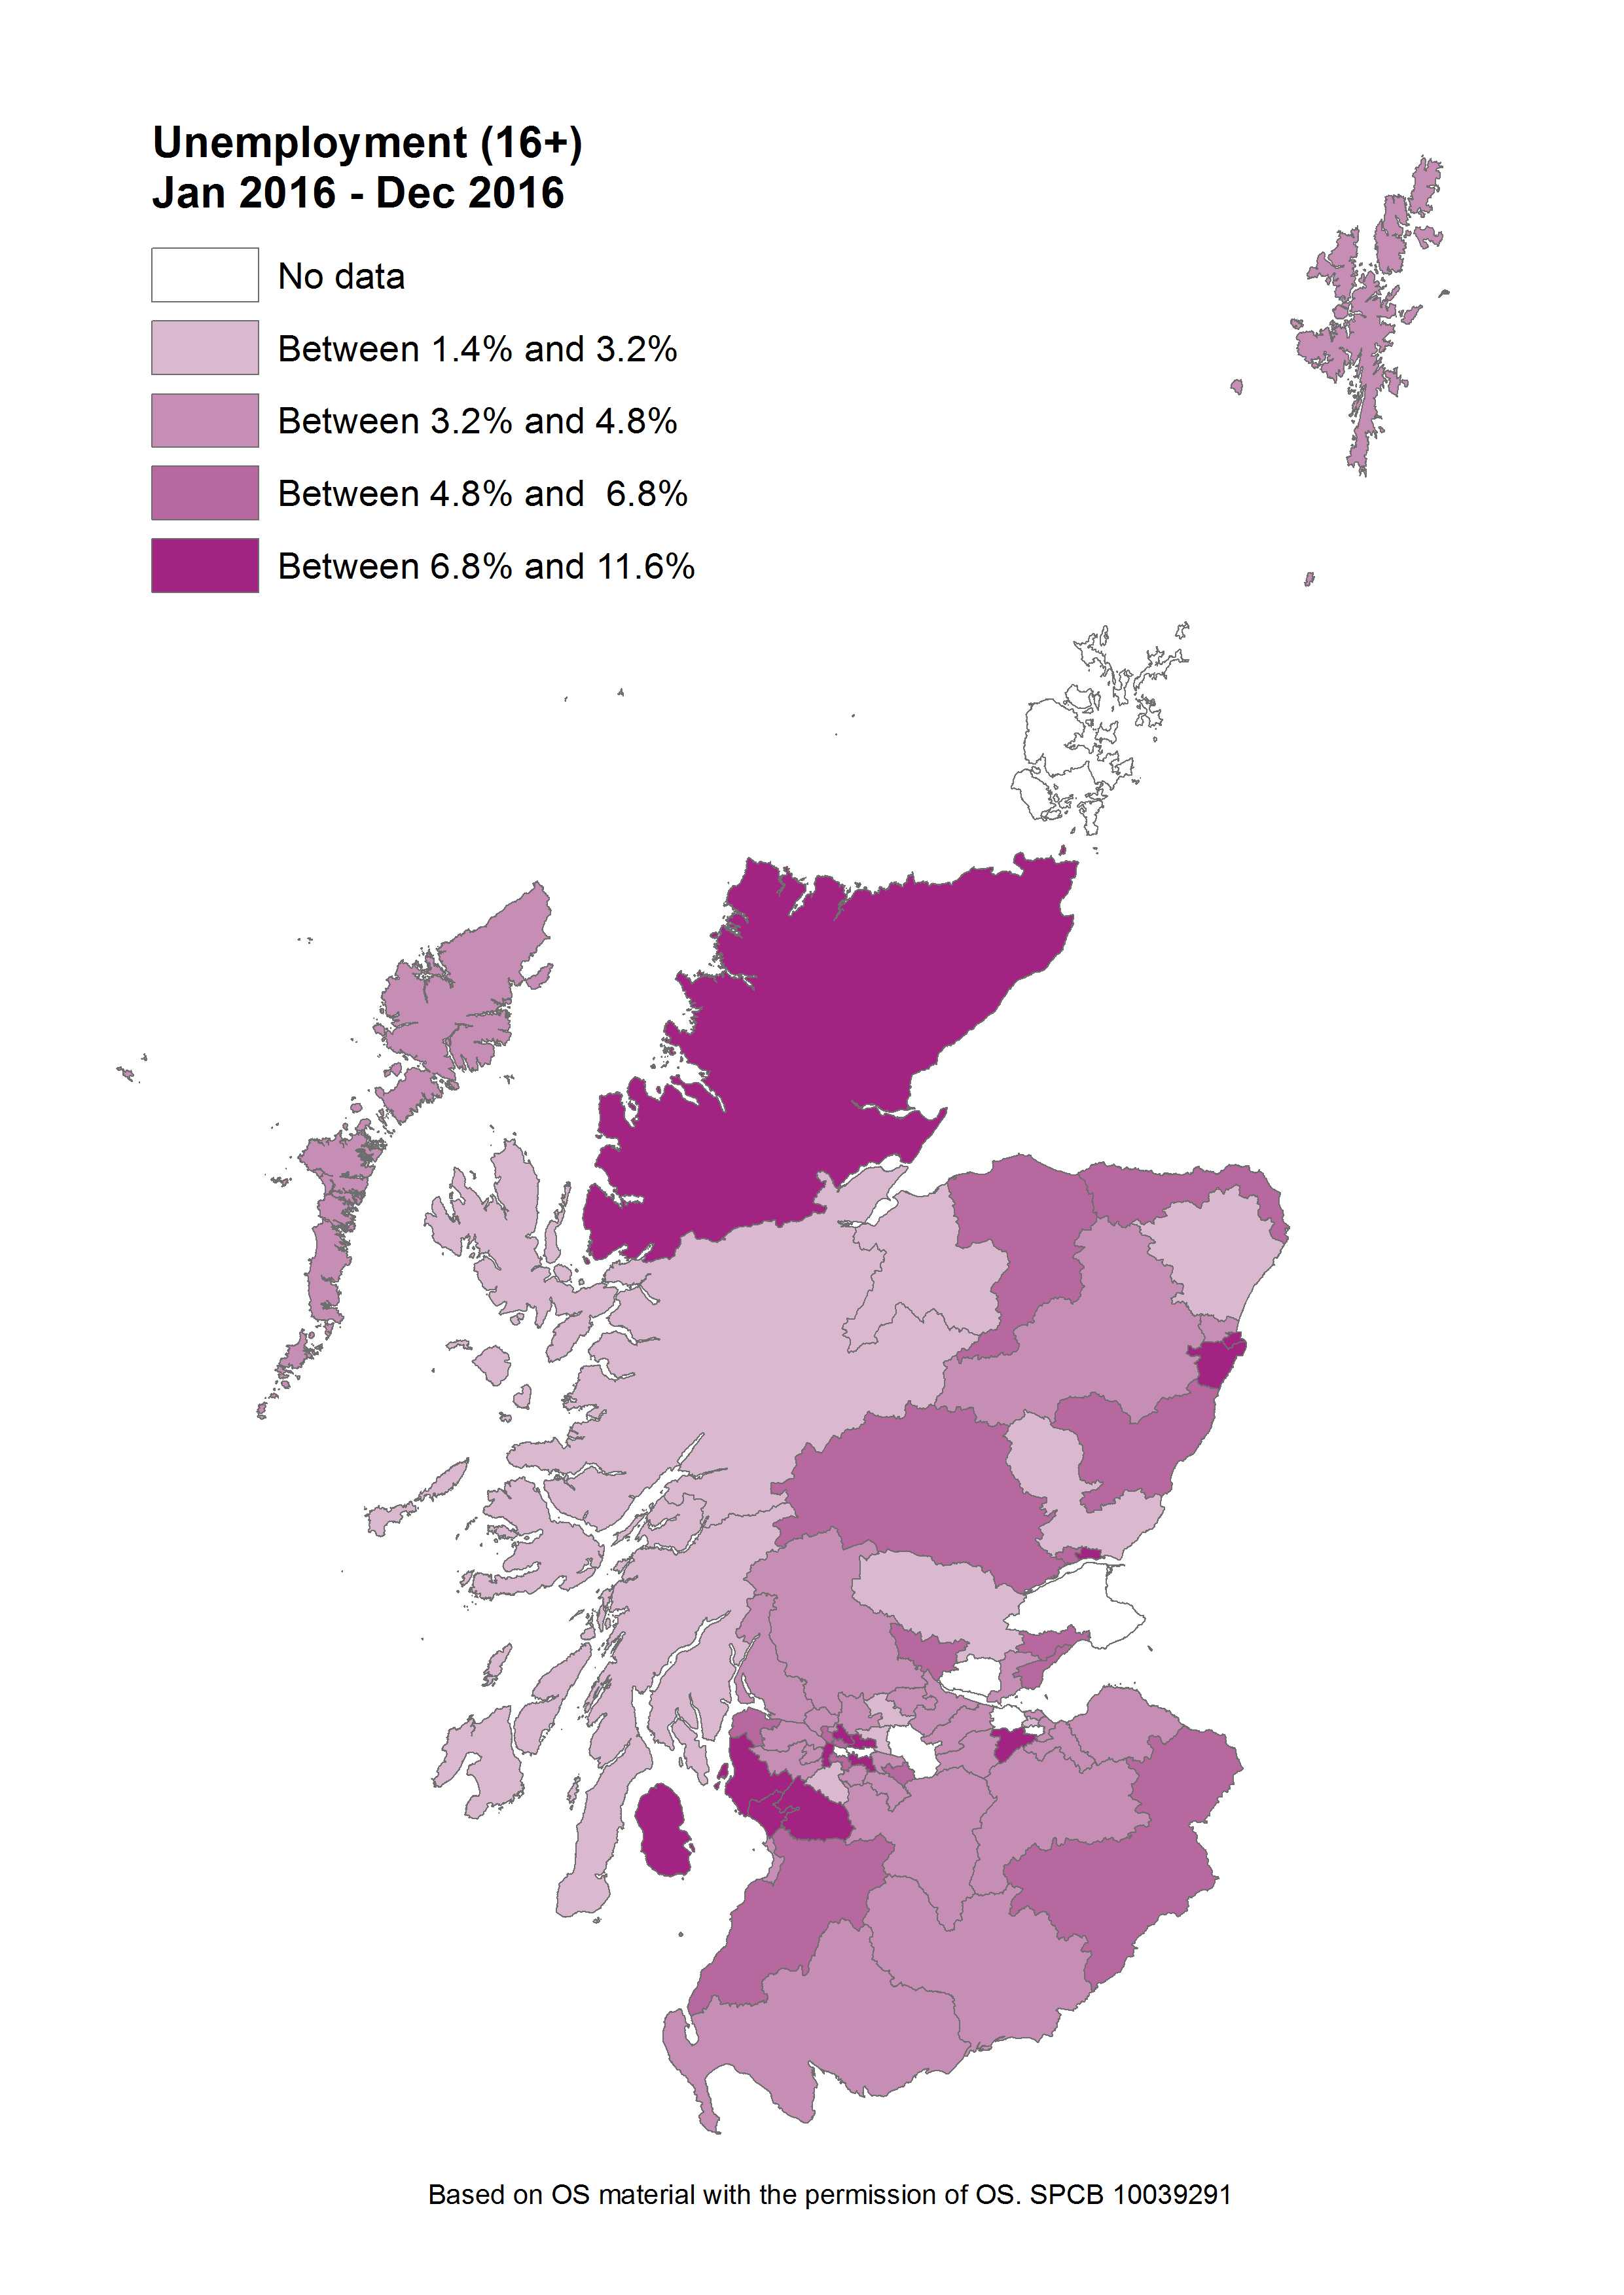
Find out the latest labour market data for your constituency.
Guest Indicator: Economic inactivity
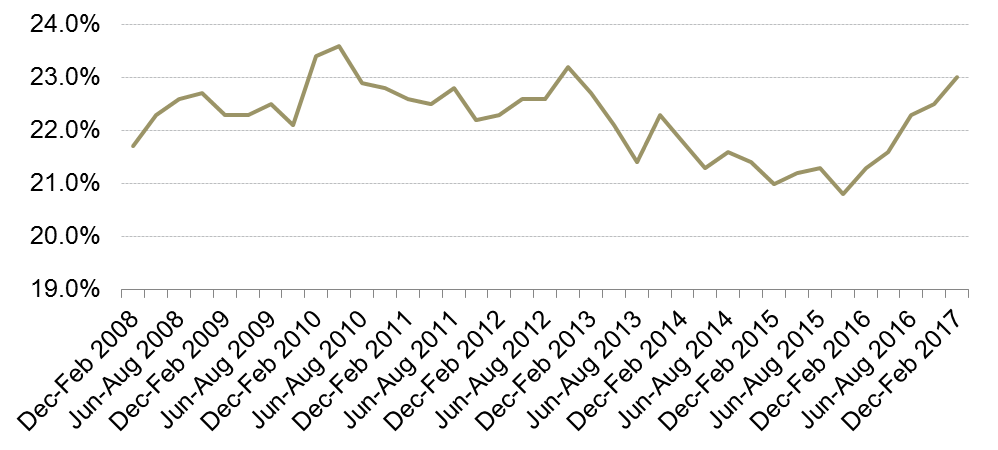
Economic inactivity in Scotland has risen in each of the last 5 quarters and is now the highest it has been since 2012 (Sep-Nov 2012 23.3%).
Economic Inactivity rates Dec-Feb 2008 to Dec-Feb 2017 - Scotland
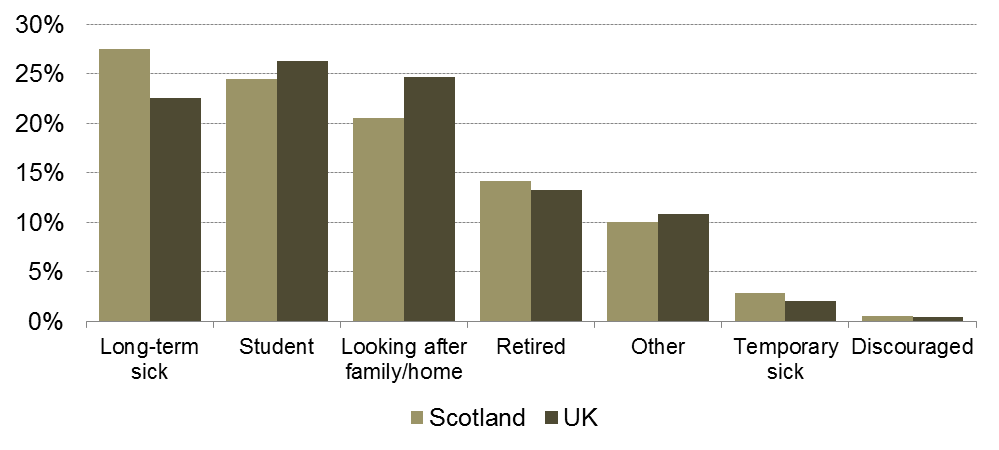
In Scotland the most common reason given for economic inactivity is long-term illness. This accounts for 27.5% of economic inactivity numbers in Scotland compared to 22.6% across the UK as a whole. The most common reason in the UK is that people are studying.
Comparison of reasons for economic inactivity in Scotland and the UK, 2016
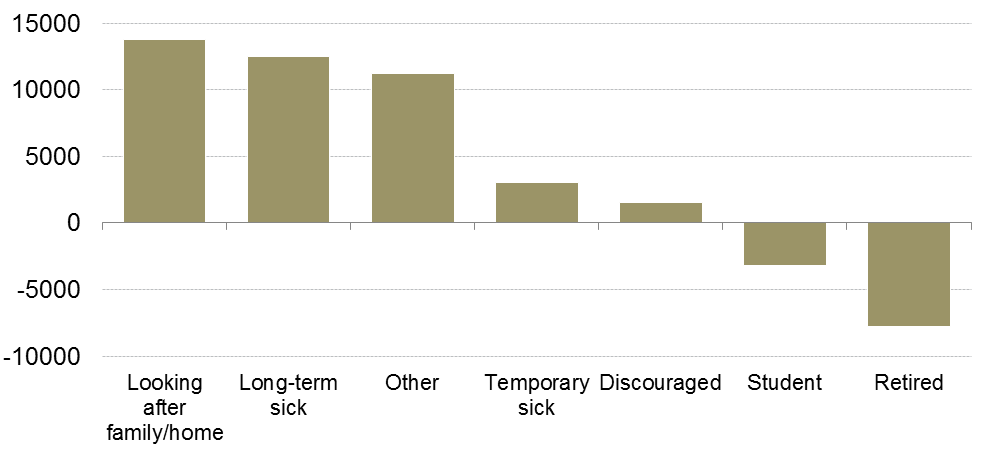
Between 2015 and 2016 an extra 31,000 people became economically inactive. While there was a drop in the number of retired people, there was an extra 13,800 people looking after the home/family. There was also a significant increase in the number of people who are long-term sick.
Change in the level of economically inactive people in Scotland between 2015 and 2016
Sources
Office for National Statistics. (2017, April 12). UK labour market statistics: Apr 2017. Retrieved from <a href="https://www.ons.gov.uk/releases/uklabourmarketstatisticsapr2017" target="_blank">https://www.ons.gov.uk/releases/uklabourmarketstatisticsapr2017</a>
Office for National Statistics. (2017, April 12). UK labour market statistics: Apr 2017. Retrieved from <a href="https://www.ons.gov.uk/releases/uklabourmarketstatisticsapr2017" target="_blank">https://www.ons.gov.uk/releases/uklabourmarketstatisticsapr2017</a> [accessed 12 April 2017]