The social impact of the 2017-18 local government budget
This briefing assesses the "social impact" of the 2017-18 local government budget by analysing how council savings plans are distributed between "Pro-Poor", "Neutral" and "Pro-Rich" services. It is the result of a joint project between SPICe, the University of Glasgow and Heriot Watt University, funded by SPICe and the University of Glasgow Economic and Social Research Council (ESRC) Impact Acceleration Account.
Executive summary
Background and context
This briefing is the result of a joint project between SPICe and a research team from the University of Glasgow and Heriot Watt University, funded by SPICe and the ESRC. It uses and builds upon previous work done by the Universities funded by the Joseph Rowntree Foundation (JRF). This previous work examined how local authorities in England and Scotland have dealt with the significant budget reductions which they have faced since 2010.
As part of the work for the JRF, the research team developed a “social impact tool”. This tool allows councils to assess the impact of their savings plans on services used more by better-off groups of people or poorer groups of people. It does this by classifying council services into six categories on a scale between “Pro-Rich” and “Very Pro-Poor”. This briefing applies the social impact tool to the budgets of 30 out of the 32 Scottish local authorities for the 2017-18 financial year.
This analysis is provided for Scottish local government as a whole, and for groupings of local authorities, grouped according to a number of factors – levels of deprivation, population density, population size and budgetary pressure. The briefing also compares this year's findings to those from the corresponding 2016-17 briefing1.
An additional element of the analysis for this year is an examination of savings patterns in relation to how local authorities have reacted to changes in Council Tax. Local authorities have been grouped according the level of increase in revenue they have experienced as a result of their use of the relaxation of the Council Tax freeze and the changes in band ratios.
Data on savings made by each local authority are also provided.
Summary of main findings
Expenditure
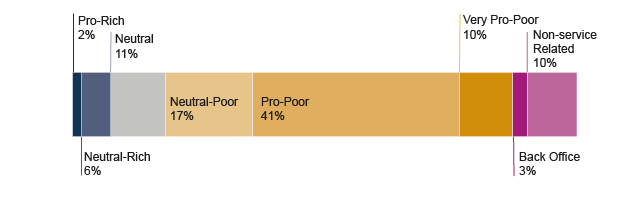
Figure 1 sets out the categorisation of expenditure for all of Scottish local government on the Pro-Rich/Pro-Poor framework.
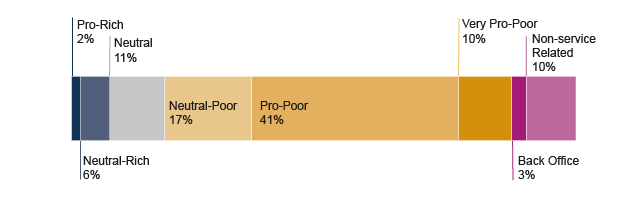
Key points to note on expenditure:
The largest area of local government spending is on Pro-Poor services, over two thirds of net expenditure (68%) is on Neutral-Poor, Pro-Poor and Very Pro-Poor services combined.
Eleven percent of spending is on Neutral services and only 2% of expenditure is on Pro-Rich services.
This pattern of spending is similar across all groups of councils, whether they are grouped by deprivation, population density or population size.
This spread of expenditure means that, when dealing with budget reductions, councils have little option but to make most of their savings from services which are used more by lower income groups.
There has been very little change in expenditure patterns between 2016-17 and 2017-18. Where there were changes, these were all 1% point or lower. There was a minor increase in expenditure on Pro-Poor services (up by 1.1% points). The greatest decrease in spending was on non-service related items (down 0.5% points).
Savings plans
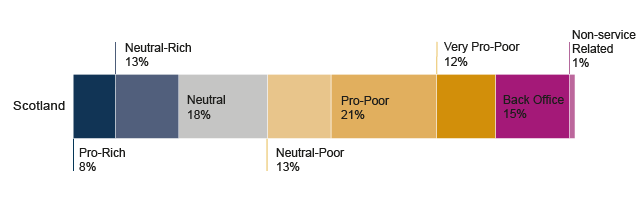
Figure 2 sets out the categorisation of savings for 30 of the 32 Scottish local authorities on the Pro-Rich/Pro-Poor framework.
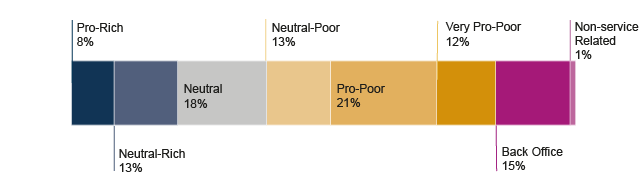
Key points to note on savings:
There is some change in the savings patterns between 2016-17 and 2017-18. In 2017-18, more of the savings came from reductions in expenditure on ‘front-line’ services. The proportion of savings made from non-service related sources decreased slightly.
The largest proportion of savings are made from Pro-Poor services (21%). However, in 2016-17, 27% of savings came from Pro-Poor services meaning that this share has reduced by 6% points in the current year.
A similarly large proportion of savings made from ‘front-line’ services also come from Neutral services (18%). This is unsurprising given the pattern of expenditure.
When we group councils by size, it is evident that the biggest councils are in fact making the largest proportion of their savings from Neutral services (20% compared with only 17% of savings coming from Pro-Poor services)
When we compare the least with the most deprived councils, it is clear that the least deprived are making more of their savings from Pro-Poor services than the most deprived councils (29% compared with 22%).
Savings as a share of expenditure
Figure 3 combines the information in Figures 1 and 2. Figure 3 shows savings as a percentage of expenditure on a whole of local government basis, or the “rate of savings”.
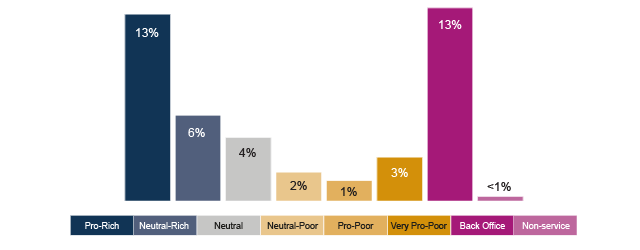
Key points to note on the rate of savings:
In Figure 2, we saw that Pro-Poor savings make up the largest absolute element of savings plans. However when these savings are calculated as a percentage of overall expenditure on Pro-Poor services, the rate of savings is only 1%.
Figure 3 also shows that, while savings from Pro-Rich services make a small contribution to overall savings, the level of planned expenditure on Pro-Rich services will be reduced by 13% in 2017-18.
Pro-Rich services and Back Office function are being targeted for the highest rate of savings – 13%.
When compared to the 2016-17 savings, the rate of savings from Pro-Rich services has remained relatively stable while the rate of savings from Neutral, Pro-Poor and Very Pro-Poor services have decreased. This could be interpreted as a move to protect both services used by all residents equally as well as those relied upon by the most vulnerable. It should be borne in mind however that the magnitude of change is small and that trends over 2 years of data should be treated with caution. The biggest change is in back office where the savings rate has fallen by 4% points.
Budget pressure
Analysis in this section uses an overall measure of “budget pressure” for each council, as another way to group similar councils together. This measure is produced by calculating each council’s total savings requirement as a percentage of total expenditure. Councils are then ranked from highest percentage to lowest as a measure of pressure, and placed into four groups accordingly.
Key points to note on budget pressure:
Most councils are making similar decisions about how to distribute cuts across categories of services. Regardless of the level of budget pressure, the highest savings rate is for Pro-Rich services. This rate then gets progressively smaller across Neutral-Rich, Neutral, Neutral-Poor and Pro-Poor services. The rate then rises again for Very Pro-Poor services.
However, both Very Pro-Poor and Pro-Rich services are being reduced at a greater rate in authorities with the most budget pressure than in the rest. This suggests that budget pressure is a major driver of the rate of savings within service categories and between councils.
There is continuity between the patterns observed between 2016-17 and 2017-18. Thus, it is still the case that the greater the budget pressure the higher the rate of savings. The service areas where the highest rate of savings are being made, Pro-Rich and Very Pro-Poor, have remained the same. However there was a change in the service group with the lowest rate of savings. In 2016-17 Neutral Poor services had the lowest rate of savings but in 2017-18 Pro-Poor services have the lowest rate of savings regardless of budget pressure.
Council Tax changes
Two kinds of change to Council Tax have affected local authorities since the 2016-17 Briefing:
An increase in multiplier rates for Bands E-H designed to make the tax more progressive. These were applied to all local authorities and in this Briefing we refer to them as non-discretionary changes.
Permission for authorities to raise Council Tax rates by up to 3% and which we therefore refer to as discretionary changes.
Key points to note on Council Tax change:
Increases in the non-discretionary multiplier ratios for properties in Bands E-H were more important for raising revenue from Council Tax than the relaxation of the Council Tax freeze. The average gain to Council Tax income was greater from the non-discretionary change, and there was a much greater range of increases due to change in the multiplier ratios.
While Council Tax Revenue makes up only a small part of councils’ total revenue, it makes up a bigger proportion of the income of less deprived authorities. This means that the least deprived authorities saw greater increases in income from Council Tax than more deprived authorities as a result of these changes – mainly because they benefited much more from the non-discretionary changes.
This would suggest that the reforms to Council Tax to date have benefited better off councils more than more deprived councils.
At this early stage of the implementation we cannot tell if the extra revenue from Council Tax is having an impact on how councils distribute savings across the Pro-Poor to Pro-Rich spectrum.
About the project
This briefing is the result of a joint project between SPICe and a research team from the University of Glasgow and Heriot Watt University, funded by SPICe and the Economic and Social Research Council (ESRC). The briefing uses and builds on previous work done by the Universities, funded by the Joseph Rowntree Foundation (JRF).
Since the 2010 UK Comprehensive Spending Review, the research team has been examining how local authorities in England and Scotland have dealt with the significant budget reductions which they have faced. The research focussed on the impact of budget cuts on disadvantaged people and places in particular. Major outputs published by JRF include:
The final phase of the project involved developing a “social impact tool” which allowed individual councils to assess the impact of their savings plans on different social groups. Following this, in 2016, SPICe worked with the research team to produce a briefing on the Social impact of the 2016-17 local government budget.4
This briefing applies the tool to the savings plans of all 32 of Scotland’s local authorities for the 2017-18 financial year, and compares the findings to the 2016-17 briefing.
Maria Gannon, from the University of Glasgow, worked in SPICe part-time for six months in the latter part of 2017 to complete the project. The briefing was drafted by Maria Gannon and Ailsa Burn-Murdoch, Senior Researcher in SPICe, with assistance and advice from others listed on the front cover. Information about the authors and contributors is available later in this briefing.
The briefing is intended to assist parliamentarians, local authorities and others to critically examine choices made by local government about where savings have been made as a result of financial settlements passed down to them by the Scottish Government.
The social impact tool
Development of the tool
Councils across the UK have had to make savings to their budgets since 2010. This is mainly due to reductions in government grants and increased demand for services caused by demographic pressures. Councils have also had to deal with public service reform.
These savings have been made in a range of ways. The original JRF-funded project examined these. Savings included:
efficiency measures designed to help authorities to “work smarter”.
“invest to save” activities focused on spending now to reduce future needs and costs.
reductions in services.
changes in eligibility thresholds for services.
consolidation of facilities.
The original project also developed a new framework to analyse the extent to which these savings had a disproportionate impact on poorer groups of service users. This was based on the fact that, while councils provide services which benefit everyone to some extent, some services are used more often or more intensively by people with low incomes or living in disadvantaged circumstances.
Therefore, the decisions made about what level of savings to make from which services can lead to different degrees of impact on different groups of service users. The social impact tool was designed to allow individual councils to assess the impact of their savings plans.
Service classification – what makes a service Pro-Rich, Neutral or Pro-Poor?
The classification of services in this briefing is based on a number of research studies conducted over the last 20 years by Professor Glen Bramley. The classification has been used to inform the previous work for the Joseph Rowntree Foundation, on which this briefing is based.
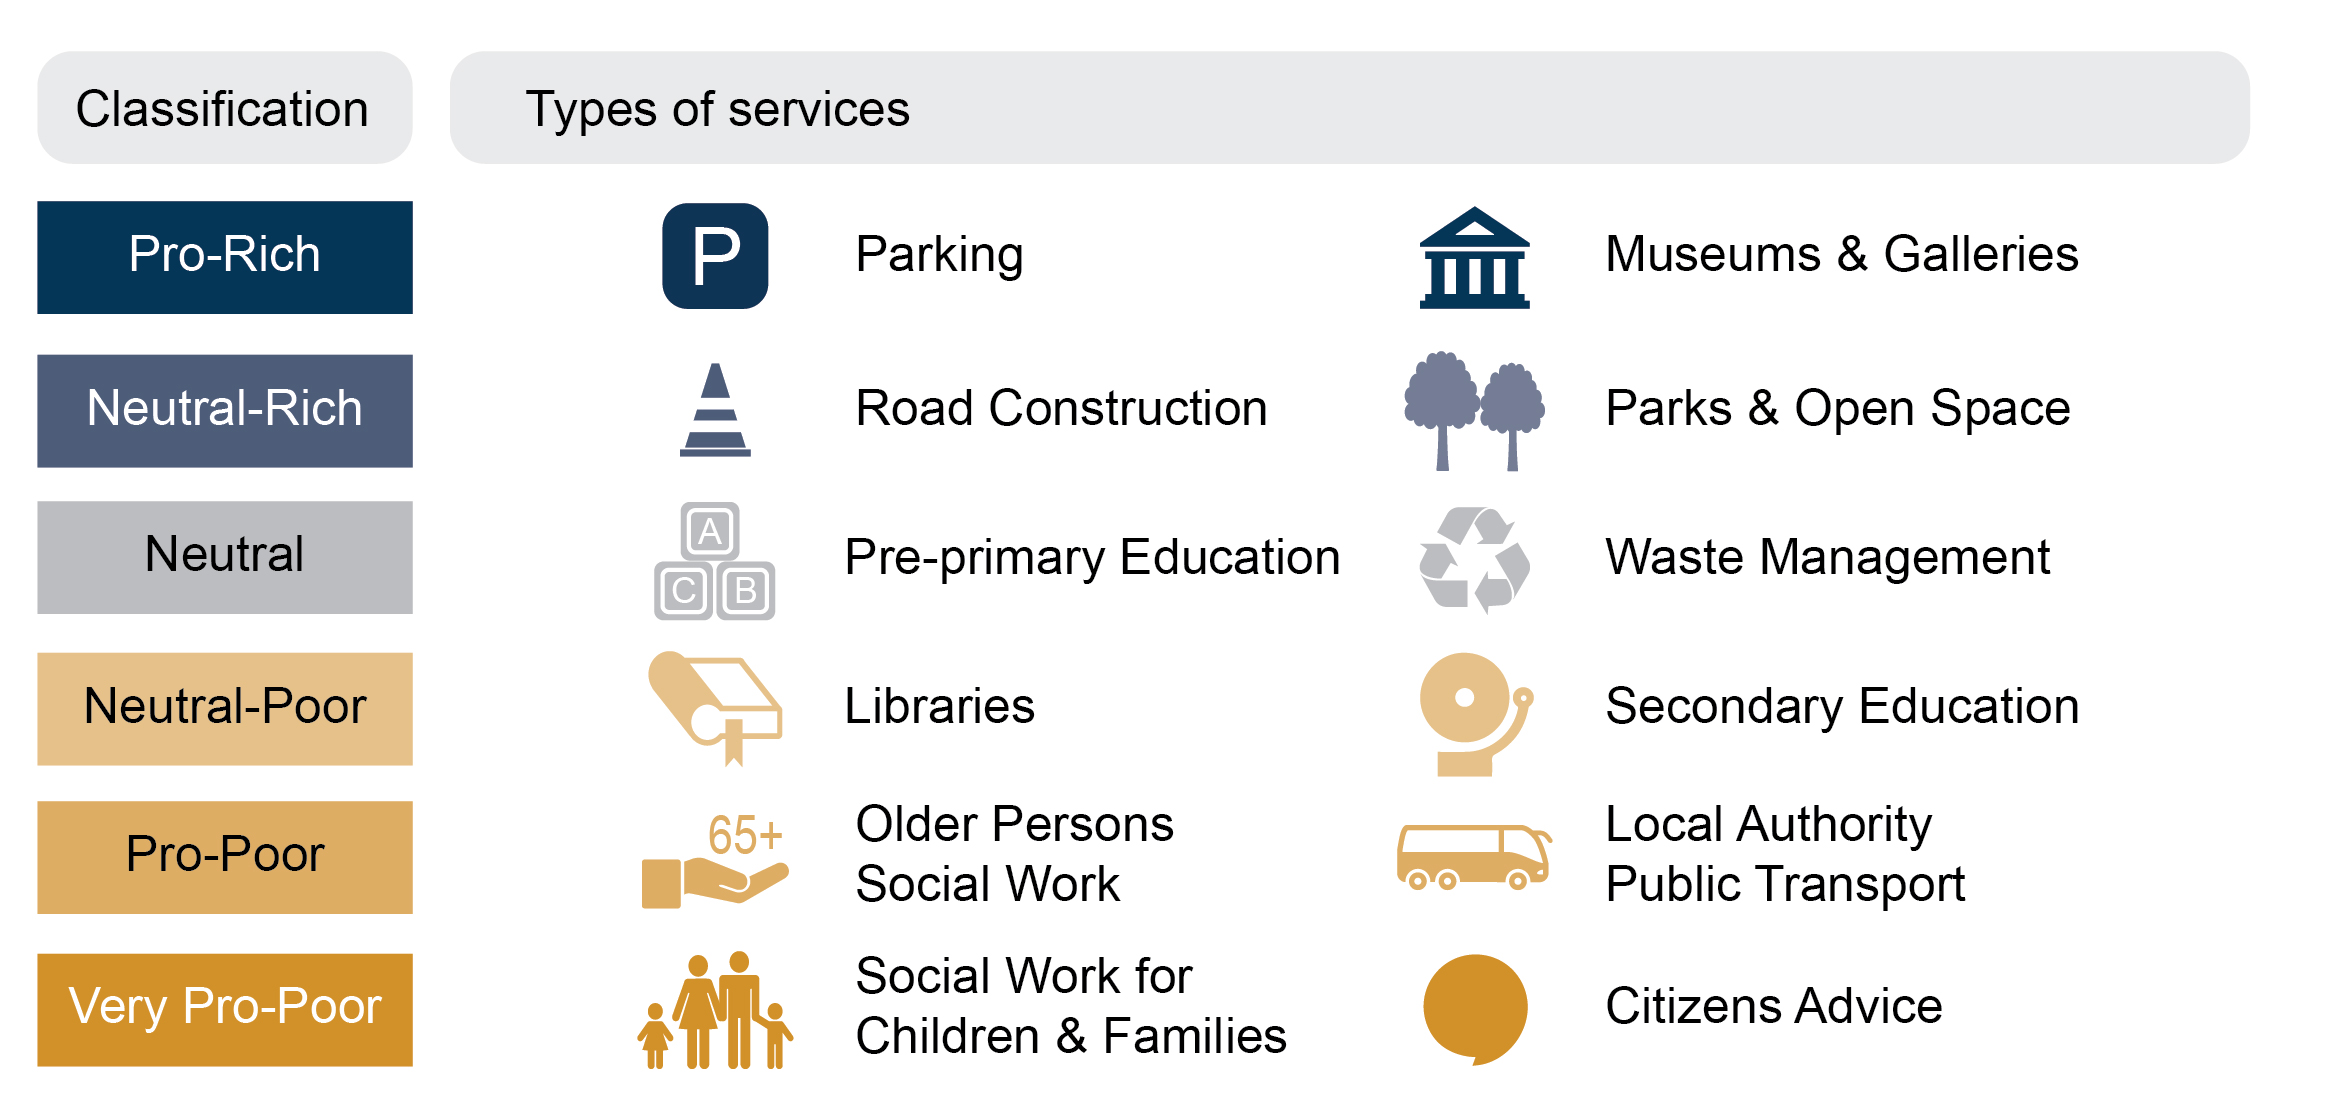
The social impact tool classifies council services into six categories on a scale between “Pro-Rich” and “Very Pro-Poor”. “Pro-Rich” implies the service is used disproportionately by more affluent households. It does not imply that only more affluent households use the service. “Pro-Poor” implies that the service is used disproportionately by lower income households. But again, it does not imply that only lower income households use the service.
In the classification, “more affluent” is defined as “higher income, higher social class, or living in a less deprived neighbourhood”; and “poorer” is defined as “lower income, lower social class or living in a more deprived neighbourhood”.
The term “used more” is defined as “household being more likely to use the service, or to use it more frequently”.
The authors acknowledge the feedback received from the Local Government and Communities Committee and others on the previous version of this briefing. We recognise that the “Pro-Rich” and “Pro-Poor” terminology used here can be challenging. Therefore, further explanation has been added to this section of the briefing.
Professor Bramley’s research which led to the creation of the classification combined data from service administration with data from several national surveys of service use. It analysed these data in relation to several measures of individual socio-economic status as well as small area-based measures from the English and Scottish Indices of Multiple Deprivation. The analysis therefore represents the views of tens of thousands of service and survey respondents on public services usage. Full detail on all of the sources used for this exercise can be found in the Technical Report1 to the 2015 Joseph Rowntree paper.
Some services are classed as “back office” functions and these are outwith the classification since they are non-service specific and relate to more generic services and functions such as Human Resources, ICT and democratic functions. The analysis also provides details of the “non-service related” expenditure and savings made by local authorities – this includes items like as debt management
Annex A to this briefing contains a full breakdown of how each service area is classified. Some examples of typical classifications are set out below:
Pro-Rich services are used more by better-off groups. Includes car parking, and museums and galleries.
Neutral-Rich services are used slightly more by better off groups. Includes road construction, parks and open spaces.
Neutral services are used fairly equally by groups across the socio-economic spectrum. Includes pre-school education and waste management.
Neutral-Poor services are used a little more by poorer groups. Includes libraries and secondary education.
Pro-Poor services are used more by poorer groups. Includes older persons’ social work and local authority-run public transport.
Very Pro-Poor services are used much more by poorer groups. Includes social work services focussed on children and families, and citizens’ advice services.
A further technical note on the classification is available on request from SPICe.
Data sources and methodology
Data sources
The key source data for assessing local government planned expenditure in 2017-18 is the Scottish Government Statistics publication, Provisional Outturn 2016-17 and Budget Estimates 2017-181. This data is collected through the Provisional Outturn and Budget Estimates (POBE) return from local authorities. It covers data on “net revenue expenditure” for services provided by Scottish local authorities. “Net revenue expenditure” is local authority expenditure that is financed from general revenue funding, non-domestic rates, Council Tax and balances, and so does not include other sources of income, like fees and charges.
This project has used published local authority budget documents for 2017-18 to assess local authority savings plans. Most were available from council websites, and some additional information was provided by council staff. A full list of sources is provided in Annex C.
Methodology
A brief description of the methodology used to assess all local authority savings plans against the Pro-Rich/Pro-Poor framework is set out below:
The first step was to map the information in individual local authority savings plans to the service descriptions used in the Scottish Local Government Finance expenditure data (see Annex A for further information).
In some cases this meant adding up the amounts attached to a number of relevant savings plans in order to get a total saving relating to a particular service.
A worked example is set out in Annex D, which outlines how savings for “Cultural and related services” for a hypothetical council would be collated from information contained in their budget documents.
On occasion, there was insufficient data included in the budget documents to complete this assessment. Therefore, further information was sought from other local authority documents such as Equality Impact Assessments or service reviews.
In some cases, savings plans were cross-cutting in nature and so impacted on a number of departments and services. Sometimes it was possible to distribute these savings across the relevant departments according to the proportion of saving related to each particular service. But where there was insufficient detail, cross-cutting savings were distributed evenly across all of the services to which they related.
This process meant that each local authority's savings plans could be classified according to the Pro-Rich/Pro-Poor categories. The savings were then compared to the expenditure data by Pro-Rich/Pro-Poor category to give the rate of savings planned from each service category.
Local government budget - context
Previous SPICe Briefings discuss longer term, historic local government financial information1. This section of the briefing summarises the budget position as well as information on Council Tax income (included within “net revenue expenditure”).
Local government settlement 2017-18
The budget settlement for local government in the 2017-18 Draft Budget was contentious. A wide range of figures were presented, which showed either cuts to the local authority settlement or (once “other sources of support” were included) the amount available for local authorities rising.
The presentation and transparency of the local government settlement was explored in detail in the SPICe Briefing on the Draft Budget1, and in the Local Government and Communities Committee report on the Draft Budget2. This briefing does not go into these issues again. During the budget process, and as part of an agreement with the Scottish Green Party, additional funds for local government were added to the budget at Stage 2 of the Budget Bill.
Table 1 below sets out the most up to date allocations to local authorities, as in Finance Circular 1/20173, which was published in March 2017, after the Parliament agreed the Local Government Finance Order 2017, compared to the equivalent figures from 2016-17 (Local Government Finance Circular 1/20164). It shows that, in real terms, between 2016-17 and 2017-18 the Total Funding for Local Government falls by 0.4%, and Total Revenue falls by 2.2%.
It should be noted that planned re-profiling of Capital funding has an impact on year-to-year comparisons for both Capital and Total Funding – this is explored further in CoSLA’s January 2017 briefing on the Local Government settlement5.
| Local Government funding 2017-18 - comparisons | 2016-17 (£m) | 2017-18 (cash) (£m) | Cash change (£m) | Cash change % | 2016-17 (real) (£m) | Real change (£m) | Real change % |
|---|---|---|---|---|---|---|---|
| Total Revenue | 9,693.4 | 9,639.5 | -54.0 | -0.6% | 9,851.4 | -212.0 | -2.2% |
| Distributable Revenue Funding | 9,560.4 | 9,527.1 | -33.4 | -0.3% | 9,716.3 | -189.2 | -1.9% |
| Capital Funding | 606.9 | 786.5 | 179.6 | 29.6% | 616.8 | 169.7 | 27.5% |
| Total Funding | 10,300.3 | 10,426.0 | 125.7 | 1.2% | 10,468.2 | -42.2 | -0.4% |
Local authorities are also expected to meet certain commitments in return for the full funding package. For 2017-18, local government is expected to maintain the pupil:teacher ratio at 2016 levels, and secure places for all probationers under the teacher induction scheme. These commitments can have an effect on where local authorities can choose to make savings.
As well as having to meet spending commitments set by the Scottish Government, local authorities are also experiencing increased service demand due to population changes. CoSLA, in its submission to the Local Government and Communities Committee on Draft Budget Scrutiny 2018-196, said that “Just to stand still on current services, local government would need a revenue increase of £545m, 5.7% arising from inflation and demand”.
The Accounts Commission, in its report Local government in Scotland Performance and challenges 20177, set out that—
“Councils continue to face significant financial and demographic challenges, and the scale of these continues to grow. Council budgets are under increasing pressure from a long-term decline in revenue funding (in real terms) from the Scottish Government, and council services are under pressure from an ageing and growing population. Policy and legislative requirements are also changing how councils work and the services they must deliver.”
Historical local government budgets
Making comparable, year-on-year calculations of budget change in real terms over time is complicated by the regular changes made to the responsibilities and funding of local government. In 2013-14, responsibility (and the associated funding of more than £1,500 million) for police and fire was transferred from local government to the new centralised police and fire services. This makes comparisons difficult as the amounts for police and fire to be removed from the local government settlement were only negotiated for 2013-14 and 2014-15. Going back beyond these years, any numbers are only estimates.
In terms of the Scottish Government’s own budget, to ensure the most comparable figures, we include all of the Resource and Capital Departmental Expenditure Limit (DEL) – essentially all of the money that the Government has control of (its spending on all devolved services), and as we include NDRI on the local government side, we also include NDRI in the Scottish Government numbers.
Figure 4 shows the real terms change in outturn revenue budget figures over the periods 2010-11 to 2016-17 and 2013-14 to 2016-17, as well as the changes to the equivalent LG Finance Order figures between 2016-17 and 2017-18.
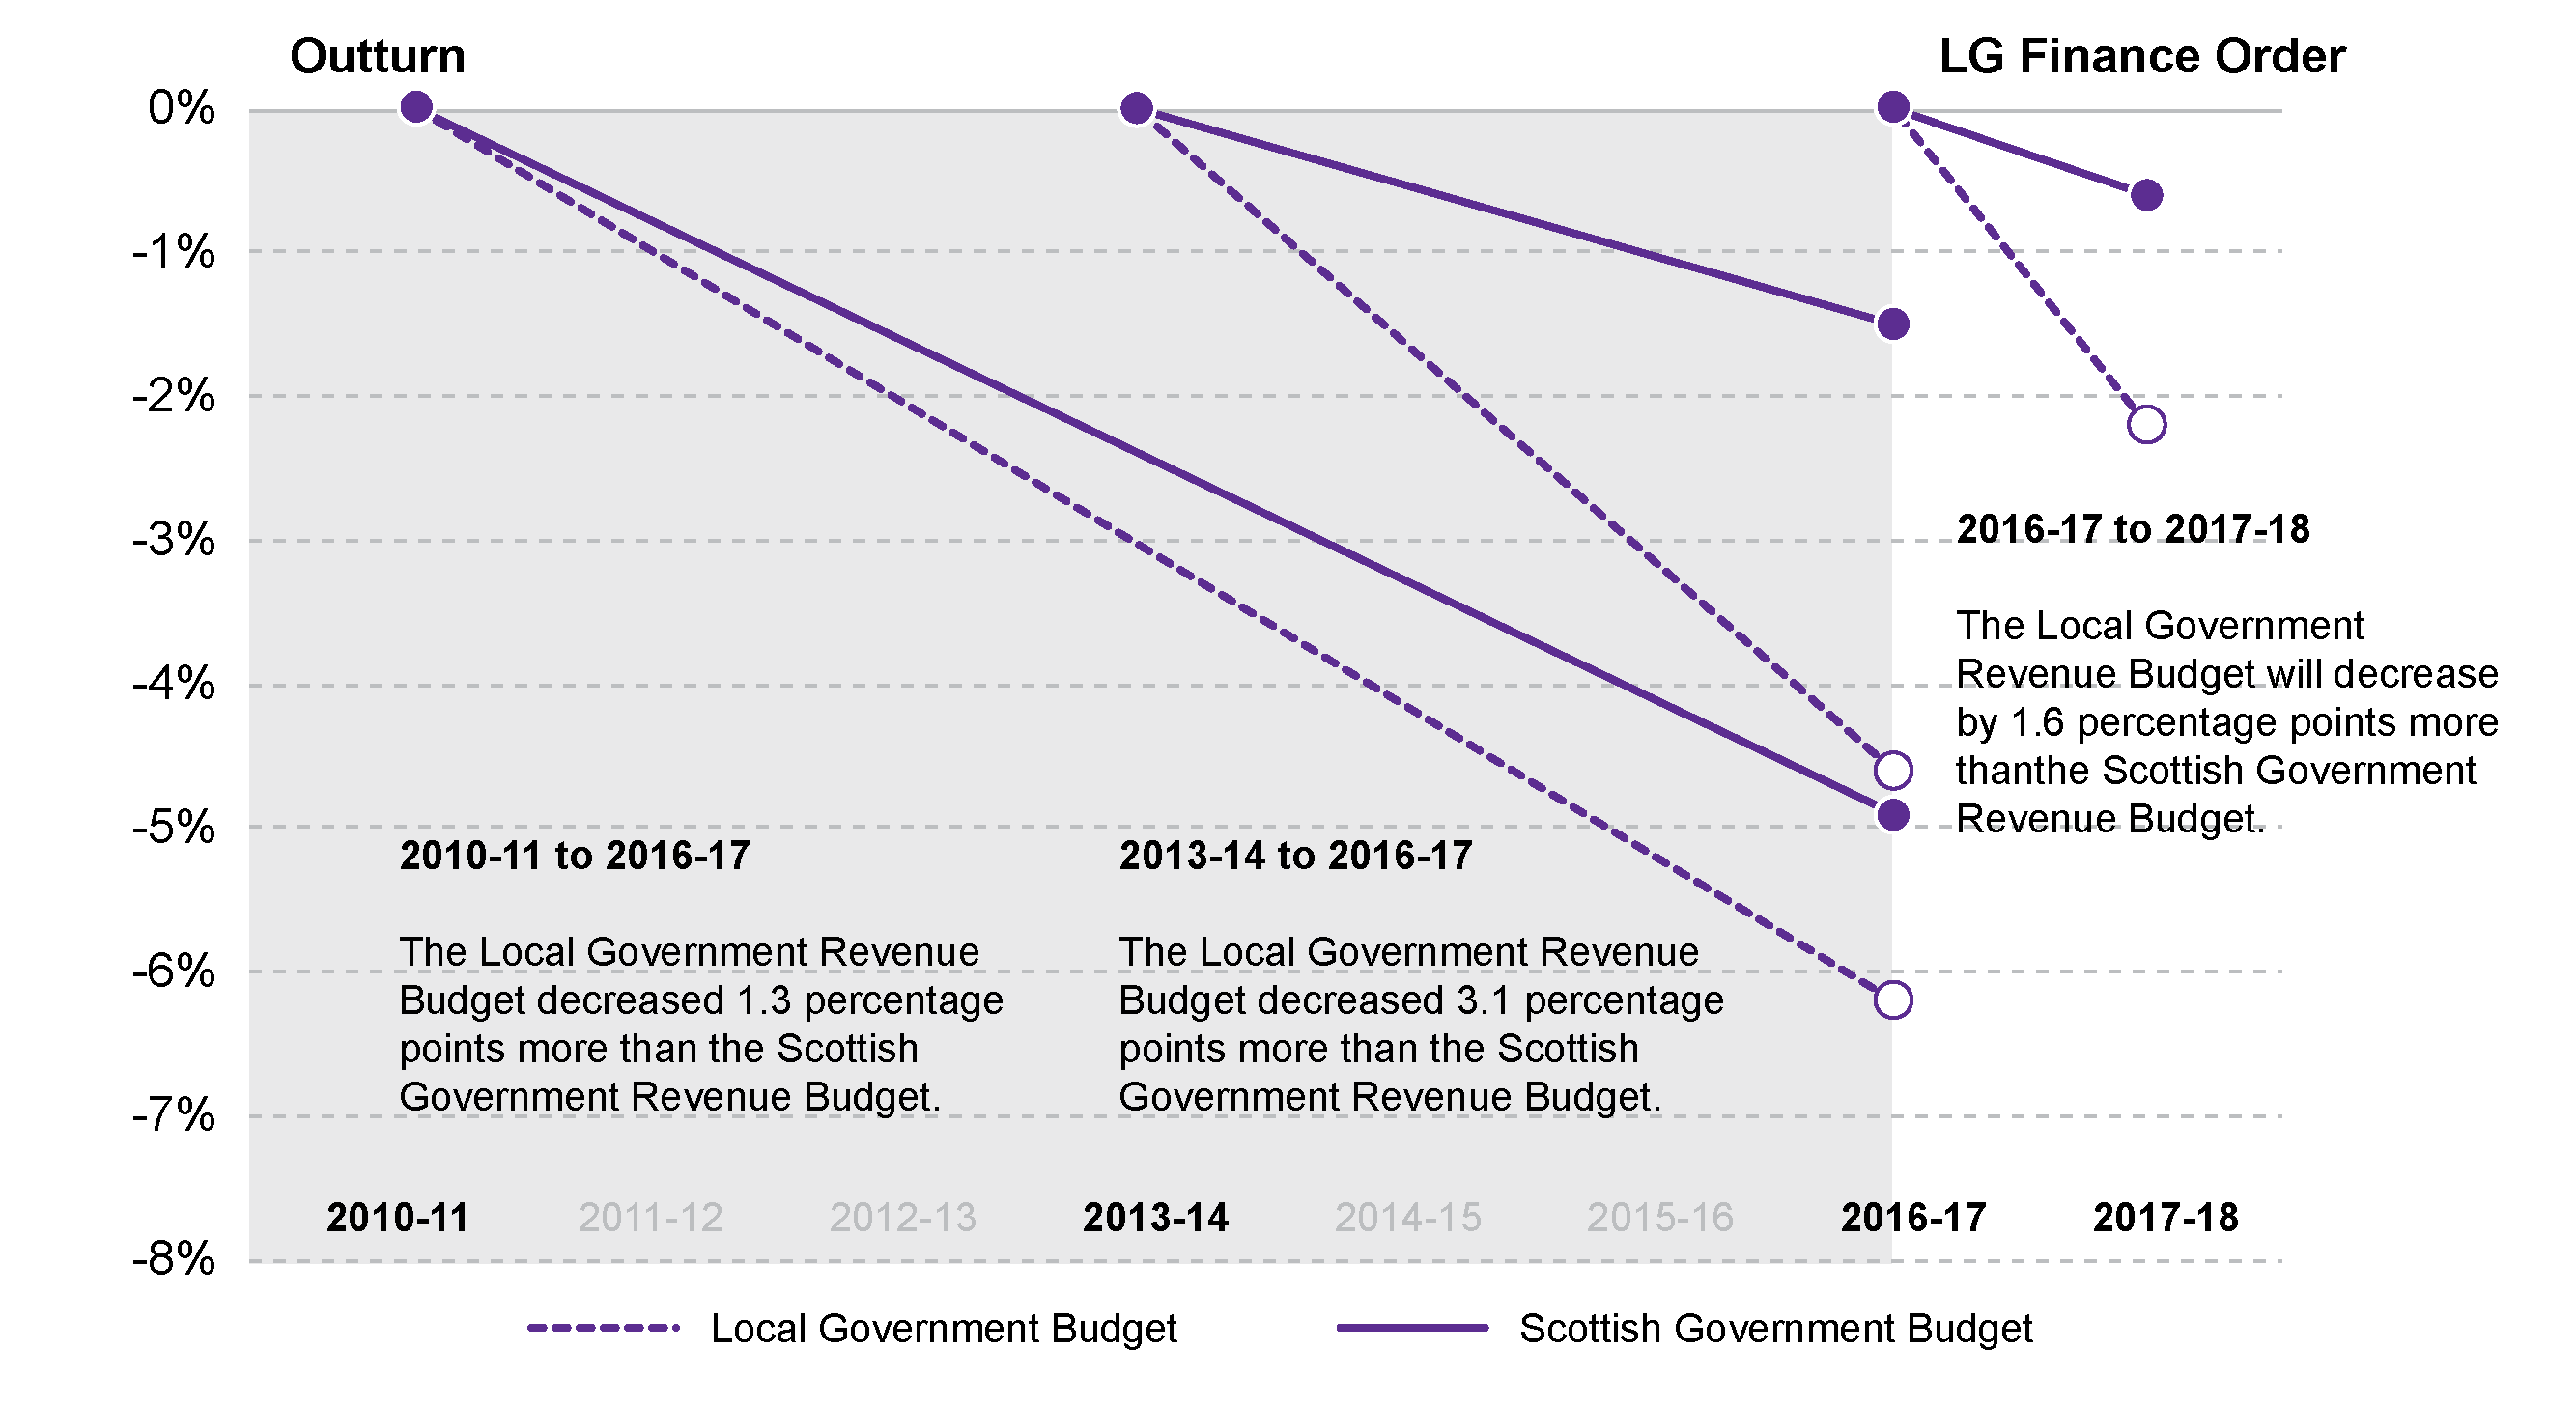
Real terms change figures show that, over 2010-11 to 2016-17, if the spend on police and fire in the years up to 2012-13 is adjusted out, then the local government revenue budget decreased only slightly faster (-6.2%) than the Scottish Government budget (-4.9%).
However, looking at the more reliably comparable years following the removal of police and fire services from the local government budget, from 2013-14 to 2016-17, then the local government revenue budget has decreased at a much faster rate (-4.6%) than the Scottish Government revenue budget (-1.5%).
Looking at the LG Finance Order figures for 2016-17 to 2017-18, the revenue budget for local government continues to fall (by 2.2%) whilst the Scottish Government revenue budget falls by only 0.6%.
Further detail, including detail on adjustments for re-profiling and other changes, are detailed in Local Government Finance: facts and figures, 2010-11 to 2017-181.
Council tax income
Aside from government grant and NDRI, the other main element that funds net revenue expenditure is Council Cax. Council tax income remained largely static between 2007-08 and 2016-17 due to the Council Cax freeze, which was funded through an additional £70m included each year in the overall Local Government settlement.
In 2017-18, the Scottish Government introduced two key changes to Council Tax.
The Council Tax freeze ended, however increases applied by local authorities were capped at 3% (Referred to in this Briefing as discretionary changes).
The multiplier ratios against the Band D Council Tax rate for properties in Bands E-H were increased, generating additional estimated £110m revenue across Scotland (Referred to in this Briefing as non-discretionary changes).
In practice, eight councils (Aberdeen City, Inverclyde, North Lanarkshire, Renfrewshire, South Lanarkshire, Stirling, West Dunbartonshire and West Lothian) did not increase the Band D Council Tax rate. Twenty one councils opted to implement the full 3% increase, and the remaining three councils opted for increases on 2% or 2.5%.
It is important to note that, whilst these changes did improve the revenue raising capabilities of local authorities, Council tax is a relatively minor source of income for local authorities. In 2017-18, it is expected to raise £2,539m or just 22% of “Total Estimated Expenditure”.
The Council Tax contribution to Total Estimated Expenditure ranges from 10% for Eilean Siar and Shetland to 29% for Aberdeen City and Edinburgh. The biggest increase between 2016-17 and 2017-18 amounted to just 2% of Total Estimated Expenditure. Full figures for each local authority can be found in Annex E.
Findings: Analysis of local authorities’ savings plans 2017-18
Introduction
This part of the briefing analyses the savings plans of Scotland's councils. It is in five sections.
Section 1 analyses the current expenditure patterns of the councils against the Pro-Rich to Pro-Poor categorisation;
Section 2 analyses the savings patterns by these categories.
Section 3 assesses the rate of savings – the savings as a share of expenditure for each category of service.
Section 4 examines whether the rate of savings for service categories varies according to the extent of budget pressure experienced by councils.
Section 5 analyses changes in Council Tax, covering the effect of both national increases for Bands E-H and local decisions about Council Tax rises.
In the first three sections, the analysis is presented on a whole of local government basis, and then for local authorities grouped according to levels of deprivation, population density and population size. This was done by sorting the 32 local authorities into four groups of 8 by deprivation, by population density and by population. So, for example, the eight councils with the highest levels of deprivation form one group, and then the eight councils with the next highest levels of deprivation form the next group, etc.
The deprivation and population density groups are drawn from the Local Government Benchmarking Framework’s1 Family Groups. The population size group is based on the latest population figures for local authorities. Full details of the Councils in each group can be found in Annex B. The last section grouped councils by budgetary pressure.
The savings plans for 30 out of 32 councils were analysed to produce the findings in this briefing. West Dunbartonshire Council are using reserves to balance their 2017-18 budget, so no savings plan has been included in the analysis for this local authority. The available data for Shetland council was of insufficient detail to perform the analysis for inclusion in this briefing.
The chart below, based on information in the Service Classification section above, provides a colour coded reference point and examples for the following charts and graphs.
Section 1: Local authority expenditure
Overall local authority expenditure
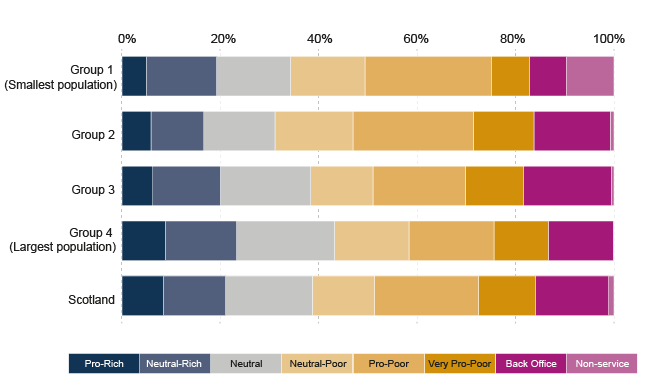
The figure below shows the distribution of local authority expenditure across the Pro-Rich/Pro-Poor framework.
The largest area of local government spending is on Pro-Poor services. Over two thirds of net expenditure (68%) is on Neutral-Poor, Pro-Poor and Very Pro-Poor services combined. 11% of expenditure is on the Neutral services used fairly evenly across the socio-economic spectrum. Only 2% of expenditure is on services which are Pro-Rich, and 6% on Neutral-Rich services.
This demonstrates that, as they attempt to make savings, councils will have little option but to make the majority of their savings from services which are used more by lower income groups.
When compared with local authority expenditure for 2016-17, there is little change in the level of expenditure on the different service categories across the Pro-Rich/Pro-Poor framework. The majority of changes in spending are less than half a percent; with the greatest change in Neutral-Poor services where expenditure decreased by 0.7% in 2017-18 compared with the previous year.
Local authority expenditure by deprivation group
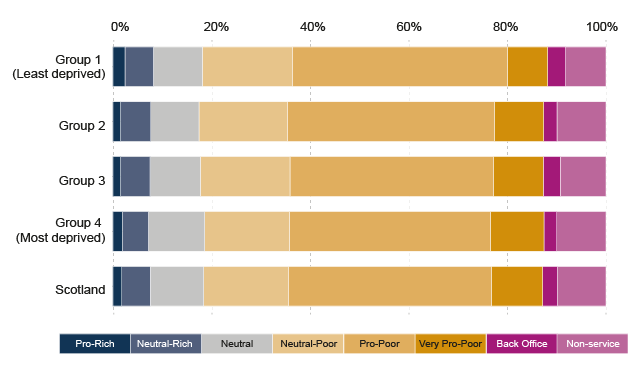
Figure 7 below shows the distribution of local authority expenditure by deprivation grouping. Group 1 covers the 8 local authorities experiencing the least deprivation and Group 4 the most deprived.
Expenditure patterns are similar across the deprivation groupings. The group of least deprived authorities are spending a slightly higher proportion of the budgets on Pro-Poor services (44% compared with 41%) but they are also spending less on Very Pro-Poor services.
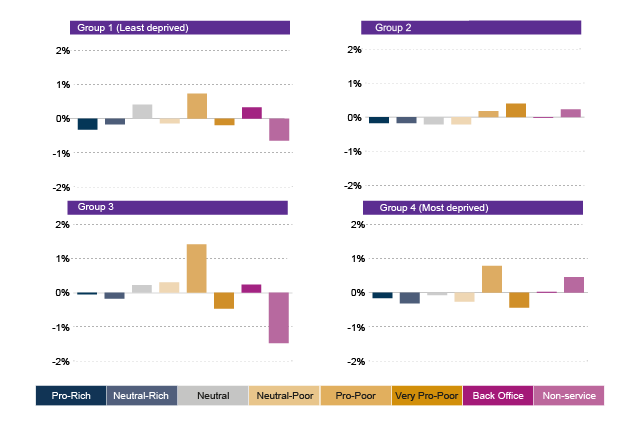
Expenditure by service type varies very little over time across the deprivation groups with the majority of changes under 2% points, as shown in Figure 8. There has been an increase in expenditure on Pro-Poor services for all deprivation groups, and the two more deprived groups of councils have increased spending more than the other two groups. Expenditure related to Pro-Rich services has decreased since last year with the least deprived group of councils making the greatest reduction (0.32% points)
Local authority expenditure by population density
When grouped by population density, there are few differences in the distribution of local authority expenditures. The least dense (most rural) group of councils are spending slightly more on Pro-Poor services than their counterparts in the three other groupings but expenditure on Very Pro-Poor services is lower. The Very Pro-Poor category includes housing services so this could be due to the housing profile of less densely populated councils.
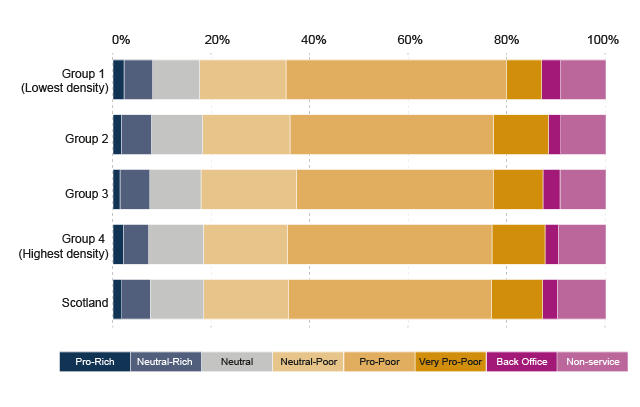
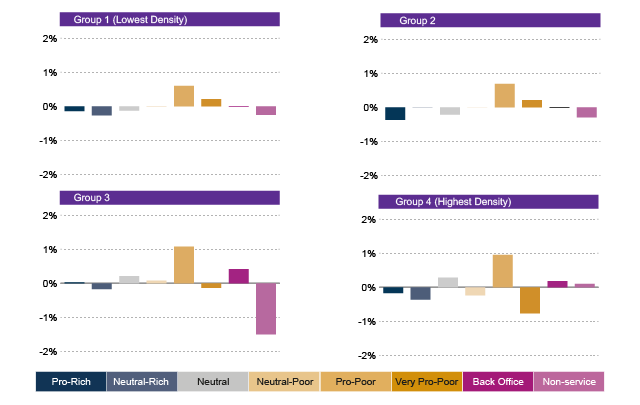
When comparing expenditure in 2016-17 with the 2017-18 figures (Figure 10), we found that the majority of changes in spending were around 1% point. Expenditure on Pro-Poor services has increased since last year and with the more densely populated local authorities making larger increases than the less densely populated councils. Changes in spending on Very Pro-Poor services differs according to population density. More densely populated councils have reduced expenditure on these services whereas the less densely populated groups have increased spending in this area.
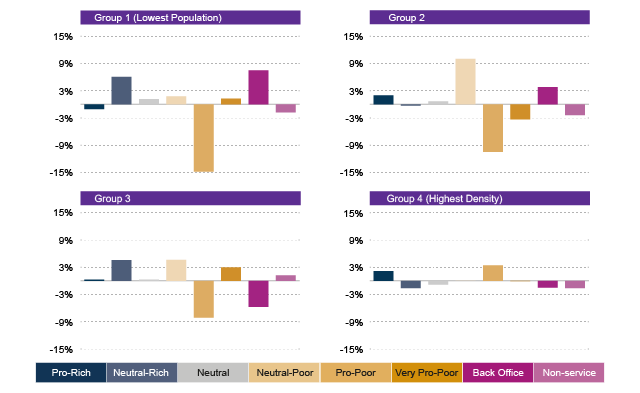
Local authority expenditure by population size
Similar to the other groupings already discussed, there are minimal differences in the distribution of expenditure when councils are grouped according to population size. The least populous local authorities are spending more than the others on Pro-Poor services but are also spending less on Very Pro-Poor services.
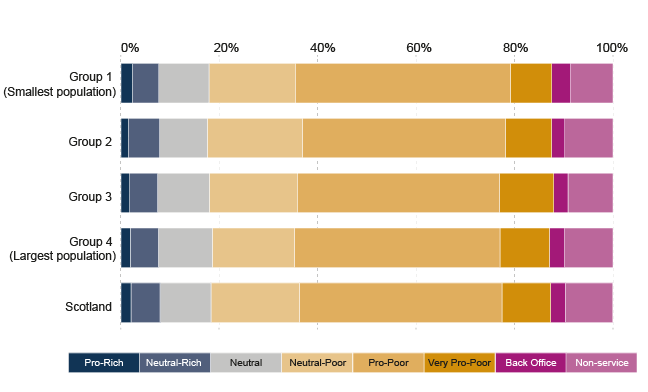
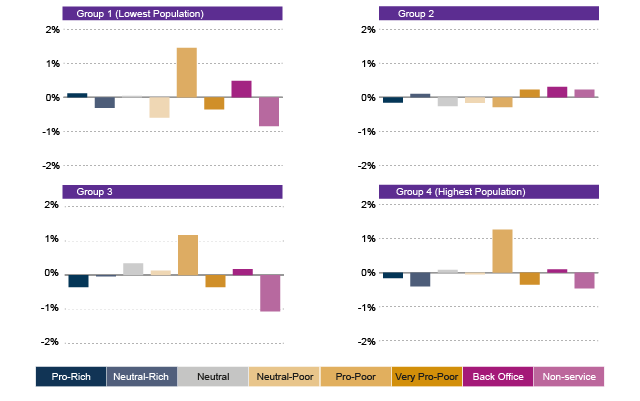
When looking at changes in expenditure between 2016-17 and 2017-18 there has been an increase in spending on Pro-Poor services for all but one of the population groups. The second smallest group of councils have decreased their expenditure in this service category. Conversely this is the only council group that has increased their spending on Very Pro-Poor services. Councils in three of the four population groups have decreased their spending on Pro-Rich services, only the councils with the smallest populations have increase their expenditure in this service area.
Section 2: Local authority savings plans
Overall local authority savings
This section looks at local authorities' savings for 2017-18 and how they are distributed across the different services. Figure 13 shows the overall distribution of savings for all Scottish local government.
As expected the bulk of savings are being made from the services which account for the bulk of councils’ expenditure and these are used more by lower income groups. Scottish local authorities are making 21% of their savings in 2017-18 from Pro-Poor services. When the savings made from Neutral Poor, Pro-Poor and Very Pro-Poor services are taken together, it shows that 45% of local authorities' savings are from services relied upon more by lower income groups.
Savings from Neutral services such as waste management are the next largest category after Pro-Poor at 18%. Councils are also making considerable cuts to back office services (15%). A smaller proportion of savings (8%) come from Pro-Rich services. Around a fifth of councils are making savings from 'non-service related' items, an average of 1%.
When compared with savings for 2016-17, there are changes in the proportion of savings by service category. In 2017-18 local authorities have reduced the share of savings made from Pro-Poor services by 6% points. The share of savings from Pro-Rich services has increased by 2% points while savings from Neutral and Neutral-Poor services have increased by 2% points and 4% points respectively.
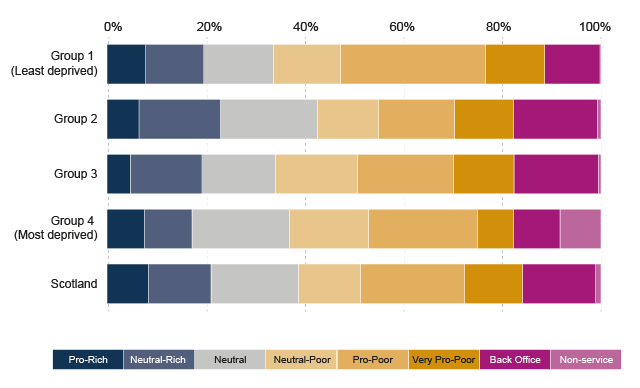
Local authority savings by deprivation
When grouped by deprivation level, as shown in Figure 14, it is clear that the group of least deprived councils are deriving the largest proportion of their savings from Pro-Poor services (29%). The most deprived group of councils are also making a high proportion of savings from these services (22%). The most deprived group are making the lowest savings from Very Pro-Poor services (7%).
It is also clear that the two central groups of councils are making a greater proportion of their savings from back office functions than the most and least deprived groups. The more deprived group of councils are making a higher proportion of their savings from 'non-service related' items than the other less deprived groups. This category includes debt management and contingency.
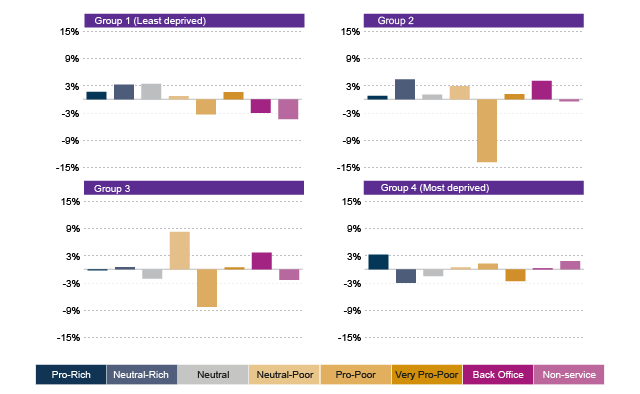
Comparing the 2017-18 distribution of savings to 2016-17, we found that three of the four groups have reduced the proportion of savings made from Pro-Poor services. The most deprived group of councils were the only group to make an increase in this category (1% point). It should be noted that the second least deprived group of councils had the largest decrease (14% points). The most deprived councils decreased the proportion of savings from Very Pro-Poor services (3% points) whereas all other groups made increases of under 2% points. There was a drop in the proportion of savings from back office functions for the least deprived councils and all groups apart from the most deprived saw a decrease in the proportion of savings from 'non-service related' items.
Local authority savings by population density
Grouping councils by population density, as in Figure 16, shows that all local authorities regardless of grouping are making the highest proportion of their savings from Pro-Poor services. For the group of councils with the second lowest population density this amounts to nearly a quarter of their savings. The more densely populated local authorities are making a higher pro portion of their savings from Very Pro-Poor services. The most densely populated councils are making the greatest proportion of Pro-Rich savings (9%).
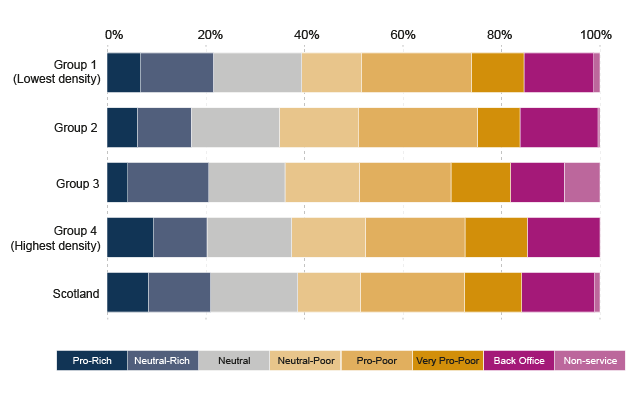
When compared to 2016-17 savings, all council groups apart from the most densely populated have decreased the proportion of savings made from Pro-Poor services. The group with the lowest population density saw the greatest decrease (15% points). There has also been an increase in the proportion of savings from Neutral-Poor services across all four density groupings. The two groups with higher population densities have decreased the proportion of savings from back office functions.
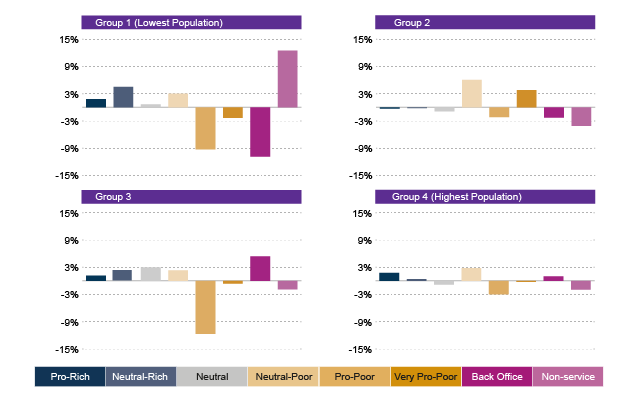
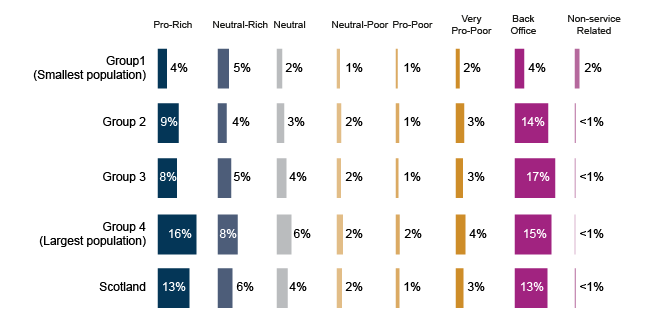
Local authority savings by population size
When local authorities are grouped by population size, as shown in Figure 18, it is clear that as population size increases the proportion of savings from Pro-Poor services decreases. Unlike the 3 groups of smaller councils the group with the largest populations has not made the largest proportion of savings from Pro-Poor services instead they have made a fifth of their savings from Neutral services. Local authorities with the smallest populations are making 10% of their savings from 'non-service related' items such as debt management compared with a figure of around 1% for all other council groups.
When compared to the 2016-17 distribution of savings we found that regardless of population size all four groups saw a decrease in the proportion of savings made from Pro-Poor services. The second largest group of councils saw the greatest decrease (12% points). The proportion of savings from Neutral-Poor services has increased across the board with the second smallest group of councils increasing their savings by 6% points in this service category. There was a difference in approach to back office functions with the smaller councils decreasing the proportion of savings made in this area compared with larger councils increasing savings through back office.
Section 3: Local authority savings as share of expenditure
Overall local authority savings as a share of expenditure
In this section, the two previous sets of data are combined to show how the levels of savings compare to levels of expenditure. The Scotland-wide results are shown in Figure 20 below.
This measure is important in that it shows the “rate of savings” planned for each service category. However, the analysis shown in the previous section - the proportion of the overall savings required by councils coming from Pro-Rich to Pro-Poor service categories - is also important. It draws attention to the scale of savings being made, and therefore to the loss of resource to these categories of council services.
The difference in the two measures is clear when we look at Pro-Poor services. The analysis in the previous section showed that, without exception, Pro-Poor savings make up the largest absolute element of savings plans.
But when this is calculated as a percentage of the overall expenditure on Pro-Poor services, it shows that Pro-Poor services are only being reduced by 1%.
It also shows that, while savings from Pro-Rich services make a small contribution to overall savings, the level of planned expenditure on Pro-Rich services will be reduced by 13% in 2017-18.
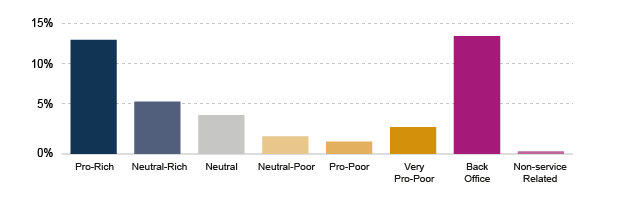
When we compared savings as a share of expenditure for 2017-18 with the 2016-17 figures, we found that for the majority of service categories there have seen a change in the rate of savings of around 1% points. The only exception to this were back office functions which have decreased savings by 4% points.
Although there are only two years of data informing the analysis, there are tentative signs of a move to a more progressive approach when we look at the change in the rate of savings by particular service classifications. Overall the rate of savings from Pro-Rich services is unchanged but the rate of savings from Pro-Poor and Very Pro-Poor services have seen a slight decrease (about 1% point). Neutral and Neutral-Minus services have also seen slight decreases of a similar scale. The biggest change is in back office where the savings rate has fallen by 4% points. As already stated this is based solely on the analysis of 2016-17 to 2017-18 data and subject to a number of factors, such as where individual councils are in their financial planning cycle and changes to funding.
Local authority savings by expenditure and deprivation group
The least deprived group of councils are making the highest rate of savings from Pro-Rich services (11%) compared with the other three groups. Across all deprivation groups, local authorities are making the highest rate of savings from back office functions but the rate varies. The most deprived and least deprived groups of councils are saving 11% but for the second most deprived group the rate is higher (15%).
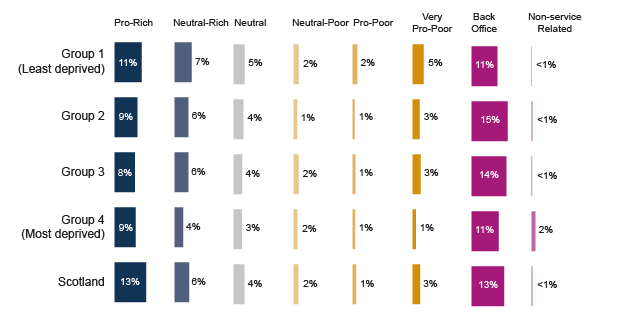
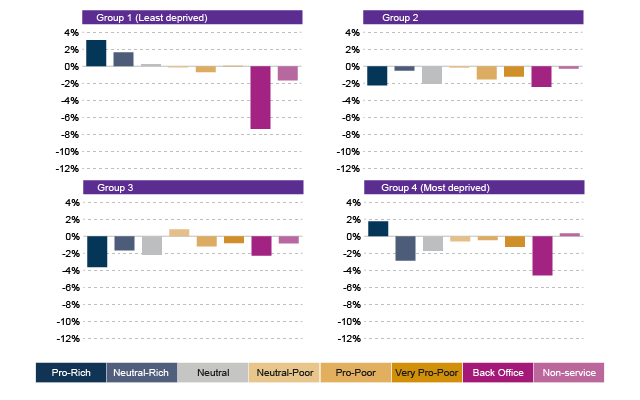
Comparing savings as a share of expenditure for 2017-18 with the 2016-17 data we found that the largest changes in the rate of savings occurred mainly in the back office function category. All councils regardless of deprivation grouping reduced the rate of savings in this area; the least deprived group of councils had the greatest decrease (7% points). This reduction was not uniform across the deprivation grouping as the second most deprived group of councils reduced their back office savings to a lesser degree (2% points) than their counterparts in the most deprived council areas (5% points).
The rate of savings made from Pro-Rich services increased within the most and least deprived groups and decreased for the other two groups.
Most and least deprived groups tended to move towards a slightly more progressive approach (increasing the rate of savings from Pro-Rich services but reducing savings rates elsewhere). In the other two groups, the Pro-Rich services saw the savings rates reduced.
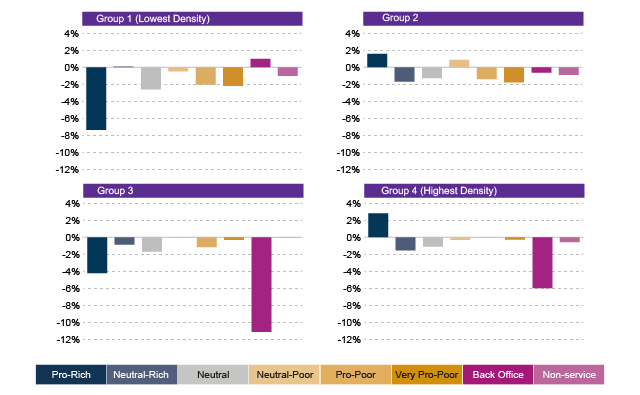
Local authority savings by expenditure and population density group
When grouping local authorities by population density, as in Figure 23, three of the four groups are making the highest rate of savings from back office functions. The exception is the second most densely populated group of councils that are making 6% savings in this area compared with the most densely populated councils that are making 19%. Councils with the highest population density are also making the greatest proportion of Pro-Rich savings (14%) compared with the other less densely populated groups.
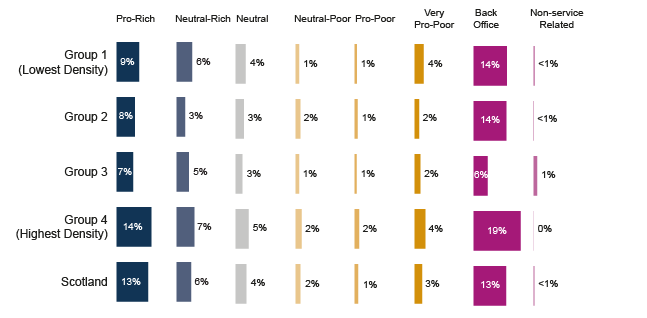
When comparing the two years of savings data we found that council areas with a higher population density are making the greater reductions in the rate of savings from back office functions. The most dense group are increasing the rate of savings from Pro-Rich services at the same time. The group of councils with the lowest population density have decreased the rate of savings across almost all services categories with the greatest rate of reduction from Pro-Rich services
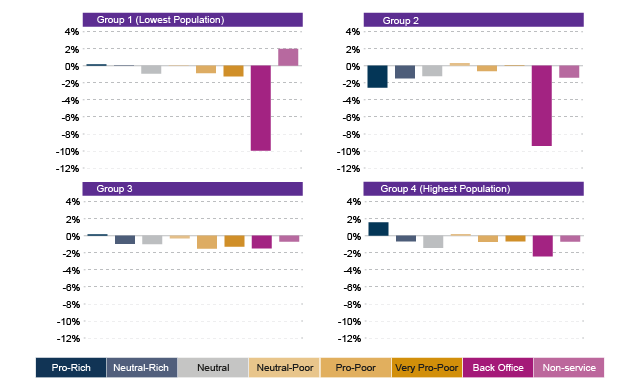
Local authority savings by expenditure and population size group
Overall councils with the smallest populations are saving less as a percentage of expenditure across all service types compared with all the other groups with larger populations, as shown in Figure 25. The largest councils are saving the highest percentage across all service categories apart from back office functions. The variation with regard to Pro-Rich services is notable. The largest councils are reducing expenditure by 16%, in the smallest the rate of reduction is 4%.
When comparing the rate of savings from 2016-17 with those for 2017-18 we found that, again, the greatest changes in rate of savings was for back office functions, with the two lower population groups making reductions of 8-10% points. Councils across all groupings have reduced the rate of savings from Pro-Poor services by 1-2% points. It is only the largest councils which have increased the rate of savings from Pro-Rich services.
Section 4: Budget pressure
Analysis in this section produces an overall measure of “budget pressure” for each council. This is done by calculating each council's total savings as a percentage of total expenditure. So, the higher percentage that total savings make up of total expenditure, the higher the “budget pressure”. Councils are then ranked from highest to lowest, and placed into four groups, two of seven and two of eight accordingly. The data is presented for front-line service areas only and excludes back office and non-service related savings. Figure 27 below shows the savings as a share of expenditure, by these budget pressure groups.
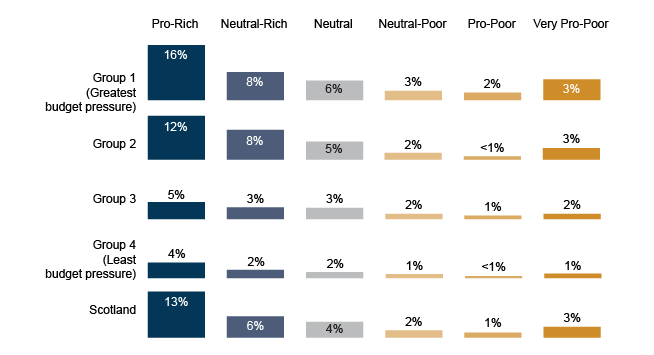
This analysis shows that in general there is a common relationship between service classification and rates of cuts. The highest rate of savings are made from Pro-Rich services and the rate decreases progressively until the Pro-Poor category and rises again for Very Pro-Poor services.
However the level of cut within the service categories clearly varies, and this variation is related to the degree of budget pressure experienced by the councils. So for example, both Very Pro-Poor and Pro-Rich services are being reduced at a greater rate in authorities with the most budget pressure than in the rest.
When this was compared to 2016-17 data we found a similar pattern in the rate of savings with a higher level of savings from Pro-Rich and Very Pro-Poor services and a dip in the rate for service in between for both years. However for 2016-17 the service classification with the lowest cut by budget pressure was Neutral Poor but this year it has shifted to the right to Pro-Poor services.
Section 5: Changes to Council Tax
In this last section, we examine how changes in Council Tax have affected the different local authorities.
As discussed above, there were two kinds of change:
An increase in multiplier rates for Bands E-H designed to make the tax more progressive. These were applied to all local authorities and we therefore label them non-discretionary changes.
Permission for authorities to raise Council Tax rates by up to 3% and which we therefore label discretionary changes.
Changes by deprivation
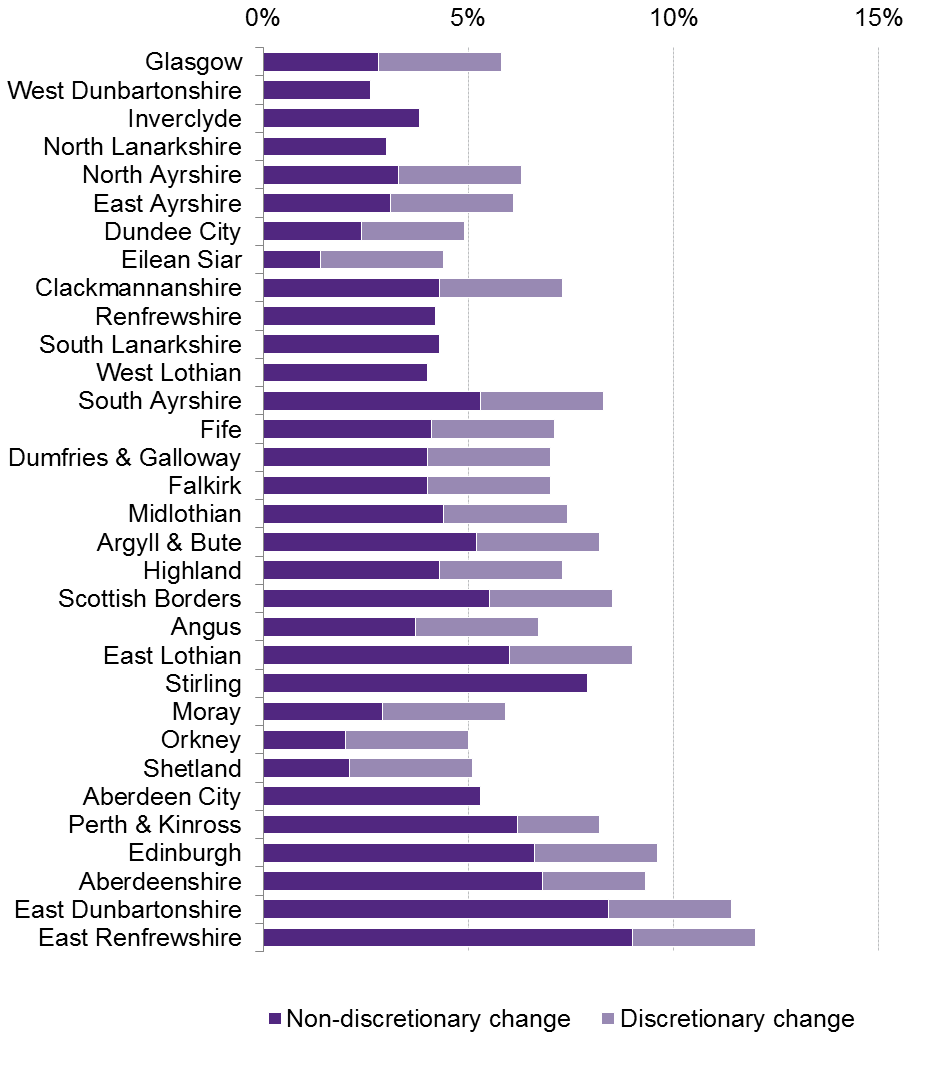
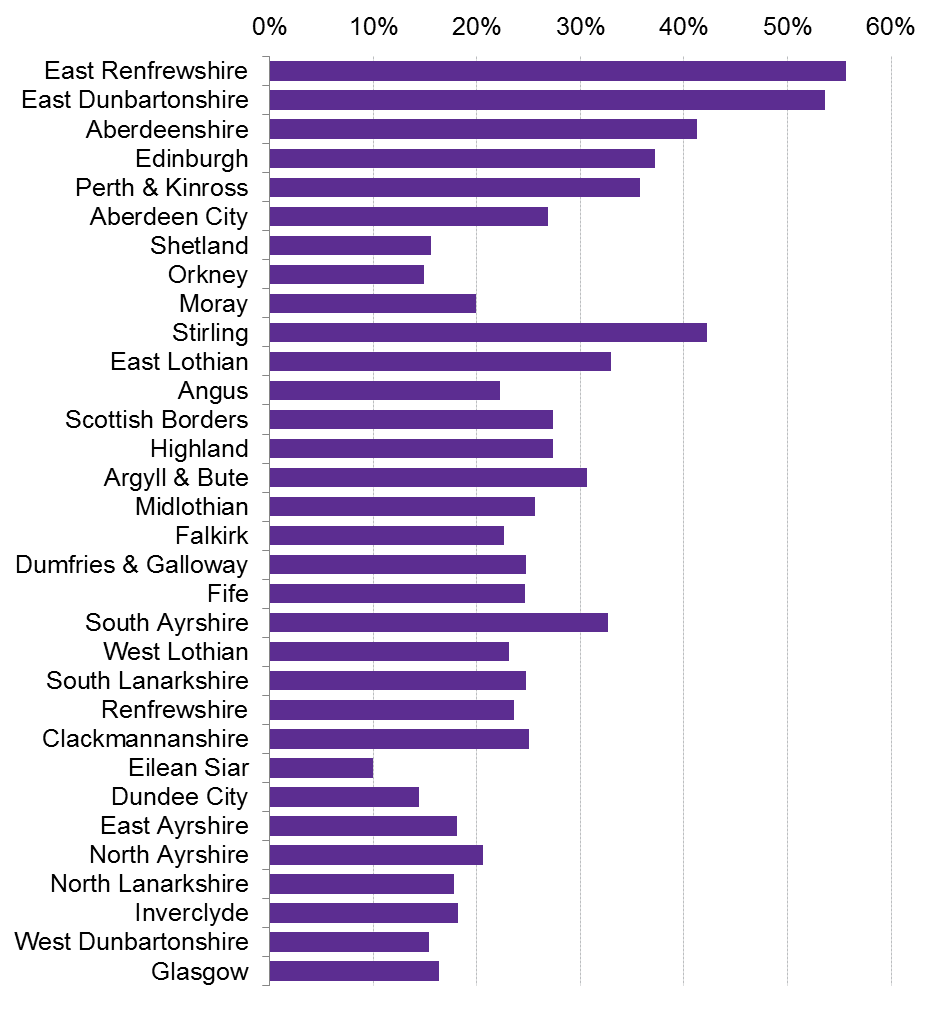
This section discusses the effect of Council Tax changes by level of deprivation. Figure 28 below ranks all local authorities by level of deprivation (least deprived first), and shows the percentage increase in Council Tax income resulting from non-discretionary and discretionary changes, as well as the total increase. It also shows the proportion of properties in Bands E-H.
The first point to note is that the non-discretionary changes were more important than discretionary changes. The average non-discretionary change is 4.5% but discretionary changes averaged 2.2%. There is also a much greater range of increases due to non-discretionary changes. They range from 1.4% to 9% whereas discretionary changes were limited to a maximum of 3%.
The second point is that the least deprived authorities saw greater increases in income from Council Tax from these changes, and the reason is that they benefited more from the non-discretionary changes. In the least deprived group, the average increase through non-discretionary changes was 5.8% but it was just 2.8% for the most deprived. There was much less difference in changes through discretionary increases (2.4% and 1.8% respectively).
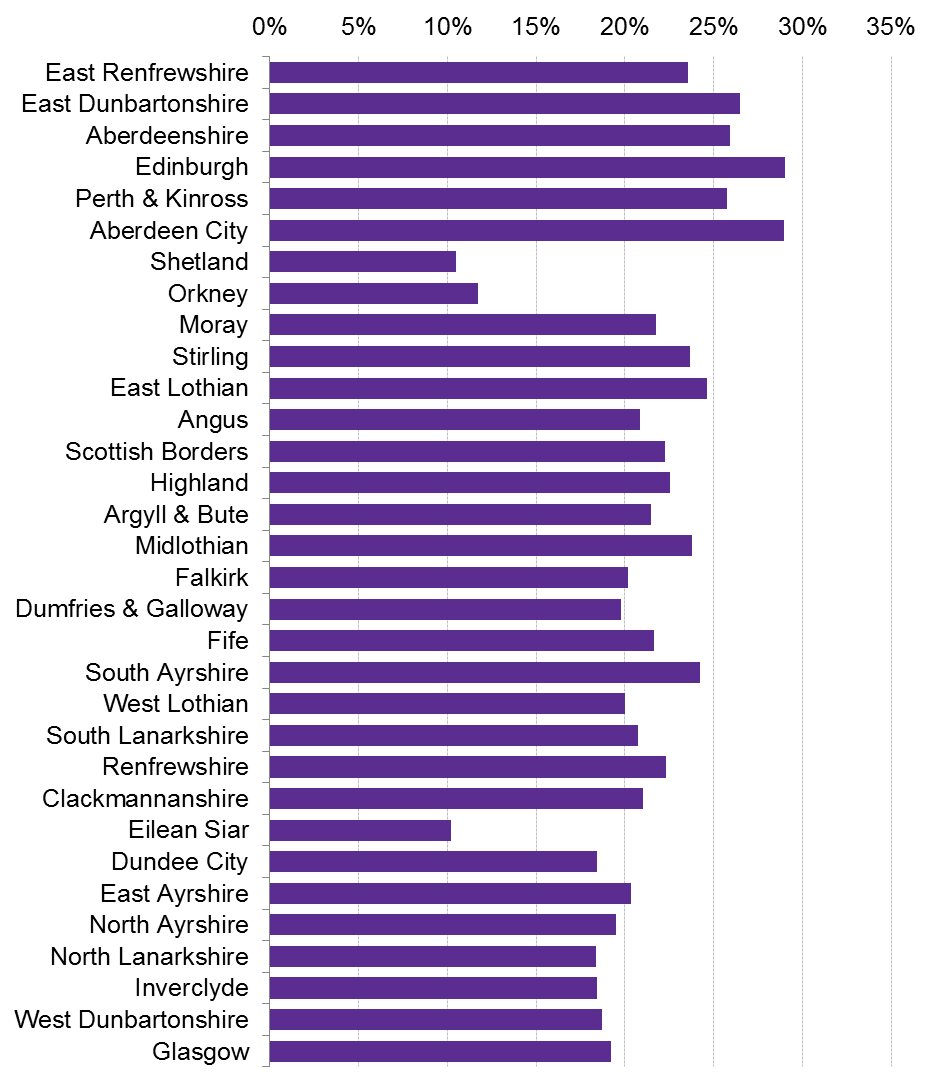
The reason that the non-discretionary changes produce larger increases in income for less deprived authorities is that they have, on average, a far higher proportion of properties in Bands E-H. Figure 29 shows these proportions for each local authority, ordered as previously from least to most deprived. In the least deprived group, an average of 35% of dwellings were in these bands but in the most deprived, the average was just 16%.
There are some exceptions to this general pattern. The three island authorities have much lower house prices on average (and did so in 1991, the time of the last revaluation), regardless of levels of deprivation. As a result, they too saw much smaller gains in income from the non-discretionary changes.
As noted above, the additional Council Tax Revenue from changes in 2017-18 makes up only a small part of total revenue or Total Estimated Expenditure, and this damps down the effects of these changes. For Scotland as a whole, the average impact is just 1.2%.
On the other hand, Council Tax income as a whole makes up a large proportion of Total Estimated Expenditure in the least deprived authorities (23% compared with 18%). This combines with the uneven impact of the non-discretionary changes to provide the less deprived authorities with a greater gain (Figure 30). For the least deprived group, the gain was equivalent to 1.8% of Total Estimated Expenditure while for the most deprived, the gain was just 0.8%.
Changes by service classification
Change in the distribution of savings across the Pro-Rich to Pro-Poor service classification between 2016-17 and 2017-18 was analysed for each council to assess if this change was related to that council’s level of increase in Council Tax income. On the basis of the current data we cannot conclude that the extra revenue from Council Tax is having an impact on the distribution of savings across the Pro-Poor to Pro-Rich spectrum. A reason for this may be that local authorities’ financial planning cycles are over a longer period than the two years of data used in the analysis. It should also be borne in mind that the changes to Council Tax have just been implemented over the last 12 months and how this extra resource is reflected in a council’s financial planning will evolve as the changes bed in. Further details of this aspect of the analysis are available on request from SPICe.
Individual local authorities
The tables in this section provide the 2017-18 data on individual local authorities, for reference.
| Area | Pro-Rich | Neutral-Rich | Neutral | Neutral-Poor | Pro-Poor | Very Pro-Poor | Back Office | Non-service related |
|---|---|---|---|---|---|---|---|---|
| Aberdeen City | 3% | 6% | 12% | 15% | 42% | 12% | 3% | 8% |
| Aberdeenshire | 2% | 5% | 11% | 19% | 46% | 7% | 4% | 8% |
| Angus | 1% | 7% | 9% | 19% | 39% | 12% | 4% | 10% |
| Argyll & Bute | 2% | 6% | 12% | 16% | 42% | 6% | 4% | 12% |
| Clackmannanshire | 1% | 4% | 11% | 18% | 38% | 12% | 4% | 12% |
| Dumfries & Galloway | 1% | 6% | 9% | 19% | 41% | 9% | 4% | 11% |
| Dundee City | 2% | 4% | 11% | 16% | 40% | 15% | 2% | 10% |
| East Ayrshire | 2% | 5% | 10% | 17% | 40% | 13% | 1% | 11% |
| East Dunbartonshire | 2% | 5% | 10% | 23% | 40% | 7% | 3% | 11% |
| East Lothian | 1% | 7% | 10% | 17% | 42% | 9% | 2% | 11% |
| East Renfrewshire | 2% | 7% | 9% | 24% | 39% | 6% | 2% | 10% |
| Edinburgh | 2% | 7% | 9% | 24% | 39% | 6% | 2% | 10% |
| Eilean Siar | 3% | 5% | 10% | 16% | 43% | 5% | 4% | 15% |
| Falkirk | 2% | 5% | 10% | 18% | 44% | 9% | 2% | 10% |
| Fife | 2% | 6% | 9% | 17% | 43% | 13% | 3% | 7% |
| Glasgow | 2% | 6% | 15% | 13% | 34% | 15% | 2% | 13% |
| Highland | 1% | 5% | 9% | 18% | 42% | 10% | 3% | 12% |
| Inverclyde | 1% | 4% | 13% | 20% | 38% | 10% | 4% | 10% |
| Midlothian | 2% | 6% | 10% | 18% | 43% | 12% | 3% | 7% |
| Moray | 1% | 5% | 8% | 18% | 42% | 13% | 3% | 9% |
| North Ayrshire | 2% | 6% | 12% | 18% | 40% | 12% | 3% | 8% |
| North Lanarkshire | 2% | 6% | 10% | 19% | 46% | 6% | 3% | 7% |
| Orkney | 2% | 7% | 9% | 19% | 47% | 5% | 7% | 4% |
| Perth & Kinross | 2% | 7% | 11% | 19% | 41% | 9% | 2% | 9% |
| Renfrewshire | 1% | 7% | 10% | 19% | 39% | 11% | 4% | 7% |
| Scottish Borders | 2% | 7% | 9% | 18% | 46% | 8% | 2% | 9% |
| Shetland | 5% | 6% | 7% | 15% | 52% | 7% | 4% | 3% |
| South Ayrshire | 2% | 6% | 11% | 17% | 42% | 10% | 4% | 9% |
| South Lanarkshire | 1% | 7% | 11% | 20% | 41% | 7% | 3% | 11% |
| Stirling | 1% | 6% | 11% | 20% | 40% | 9% | 2% | 10% |
| West Dunbartonshire | 1% | 5% | 10% | 19% | 46% | 11% | 1% | 6% |
| West Lothian | 1% | 6% | 10% | 18% | 43% | 10% | 4% | 7% |
| Scotland | 2% | 6% | 11% | 17% | 41% | 10% | 3% | 10% |
| Area | Pro-Rich | Neutral-Rich | Neutral | Neutral-Poor | Pro-Poor | Very Pro-Poor | Back Office | Non-service related |
|---|---|---|---|---|---|---|---|---|
| Aberdeen City | 12% | 12% | 24% | 11% | 12% | 19% | 10% | 0% |
| Aberdeenshire | 6% | 26% | 20% | 13% | 9% | 13% | 12% | 1% |
| Angus | 5% | 11% | 22% | 29% | 6% | 15% | 12% | 0% |
| Argyll & Bute | 7% | 15% | 20% | 7% | 37% | 6% | 8% | 0% |
| Clackmannanshire | 0% | 8% | 18% | 28% | 38% | 5% | 2% | 0% |
| Dumfries & Galloway | 2% | 9% | 9% | 10% | 20% | 19% | 28% | 4% |
| Dundee City | 17% | 10% | 24% | 7% | 11% | 16% | 15% | 0% |
| East Ayrshire | 8% | 8% | 28% | 21% | 16% | 1% | 18% | 0% |
| East Dunbartonshire | 1% | 5% | 5% | 16% | 41% | 13% | 19% | 0% |
| East Lothian | 6% | 15% | 13% | 8% | 29% | 16% | 13% | 0% |
| East Renfrewshire | 6% | 7% | 13% | 10% | 47% | 14% | 3% | 0% |
| Edinburgh | 11% | 8% | 14% | 8% | 34% | 11% | 13% | 0% |
| Eilean Siar | 2% | 4% | 11% | 16% | 61% | 5% | 0% | 0% |
| Falkirk | 4% | 16% | 16% | 10% | 11% | 15% | 28% | 0% |
| Fife | 8% | 9% | 14% | 20% | 21% | 11% | 15% | 0% |
| Glasgow | 12% | 8% | 18% | 9% | 27% | 9% | 16% | 0% |
| Highland | 6% | 13% | 33% | 3% | 13% | 10% | 23% | 0% |
| Inverclyde | 2% | 8% | 9% | 2% | 7% | 7% | 7% | 58% |
| Midlothian | 4% | 32% | 14% | 14% | 7% | 14% | 15% | 0% |
| Moray | 4% | 9% | 13% | 5% | 47% | 4% | 19% | 0% |
| North Ayrshire | 3% | 12% | 25% | 11% | 36% | 6% | 8% | 0% |
| North Lanarkshire | 8% | 15% | 18% | 44% | 6% | 7% | 2% | 0% |
| Orkney | 12% | 13% | 12% | 20% | 26% | 7% | 10% | 0% |
| Perth & Kinross | 5% | 8% | 8% | 14% | 51% | 6% | 9% | 0% |
| Renfrewshire | 3% | 27% | 12% | 5% | 5% | 20% | 27% | 0% |
| Scottish Borders | 10% | 18% | 14% | 13% | 12% | 14% | 16% | 3% |
| Shetland | 0% | 0% | 0% | 0% | 0% | 0% | 0% | 0% |
| South Ayrshire | 6% | 8% | 14% | 27% | 22% | 8% | 15% | 0% |
| South Lanarkshire | 7% | 23% | 16% | 13% | 16% | 10% | 15% | 0% |
| Stirling | 6% | 9% | 14% | 14% | 26% | 14% | 15% | 3% |
| West Dunbartonshire | 0% | 0% | 0% | 0% | 0% | 0% | 0% | 0% |
| West Lothian | 6% | 16% | 19% | 19% | 22% | 12% | 7% | 0% |
| Scotland | 8% | 12% | 17% | 12% | 22% | 11% | 15% | 1% |
| Area | Pro-Rich | Neutral-Rich | Neutral | Neutral-Poor | Pro-Poor | Very Pro-Poor | Back Office | Non-service related |
|---|---|---|---|---|---|---|---|---|
| Aberdeen City | 24% | 14% | 14% | 5% | 2% | 10% | 20% | 0% |
| Aberdeenshire | 12% | 16% | 6% | 2% | 1% | 6% | 10% | 1% |
| Angus | 8% | 2% | 3% | 2% | 0% | 2% | 4% | 0% |
| Argyll & Bute | 8% | 6% | 4% | 1% | 1% | 2% | 5% | 0% |
| Clackmannanshire | 0% | 2% | 2% | 2% | 1% | 1% | 1% | 0% |
| Dumfries & Galloway | 7% | 6% | 3% | 2% | 2% | 7% | 27% | 1% |
| Dundee City | 17% | 5% | 5% | 1% | 1% | 3% | 15% | 0% |
| East Ayrshire | 6% | 3% | 5% | 2% | 1% | 0% | 26% | 0% |
| East Dunbartonshire | 2% | 3% | 2% | 2% | 3% | 6% | 18% | 0% |
| East Lothian | 4% | 2% | 1% | 0% | 1% | 2% | 5% | 0% |
| East Renfrewshire | 6% | 2% | 2% | 1% | 2% | 4% | 3% | 0% |
| Edinburgh | 22% | 8% | 5% | 2% | 3% | 4% | 14% | 0% |
| Eilean Siar | 1% | 1% | 1% | 1% | 1% | 1% | 0% | 0% |
| Falkirk | 6% | 12% | 6% | 2% | 1% | 6% | 41% | 0% |
| Fife | 14% | 5% | 5% | 4% | 2% | 3% | 17% | 0% |
| Glasgow | 25% | 5% | 4% | 3% | 3% | 2% | 28% | 0% |
| Highland | 8% | 5% | 8% | 0% | 1% | 2% | 18% | 0% |
| Inverclyde | 3% | 3% | 1% | 0% | 0% | 2% | 3% | 11% |
| Midlothian | 3% | 13% | 3% | 2% | 0% | 3% | 12% | 0% |
| Moray | 5% | 3% | 3% | 1% | 0% | 0% | 12% | 0% |
| North Ayrshire | 4% | 5% | 5% | 1% | 1% | 1% | 6% | 0% |
| North Lanarkshire | 4% | 3% | 2% | 2% | 0% | 1% | 1% | 0% |
| Orkney | 6% | 2% | 1% | 1% | 1% | 1% | 2% | 0% |
| Perth & Kinross | 6% | 3% | 2% | 2% | 2% | 1% | 8% | 0% |
| Renfrewshire | 2% | 4% | 1% | 0% | 0% | 2% | 6% | 0% |
| Scottish Borders | 23% | 9% | 6% | 3% | 1% | 6% | 34% | 1% |
| Shetland | 0% | 0% | 0% | 0% | 0% | 0% | 0% | 0% |
| South Ayrshire | 5% | 2% | 2% | 3% | 1% | 1% | 7% | 0% |
| South Lanarkshire | 17% | 9% | 4% | 2% | 1% | 4% | 13% | 0% |
| Stirling | 16% | 6% | 5% | 3% | 3% | 6% | 27% | 1% |
| West Dunbartonshire | 0% | 0% | 0% | 0% | 0% | 0% | 0% | 0% |
| West Lothian | 15% | 6% | 5% | 2% | 1% | 3% | 4% | 0% |
| Scotland | 13% | 6% | 4% | 2% | 1% | 3% | 13% | 0% |
Annex A – Pro-Rich and Pro-Poor classification
| Service Heading | Service | Pattern of use/ benefit | |
|---|---|---|---|
| 1 | Education | Pre-primary education | Neutral |
| 2 | Education | Primary education | Pro-Poor |
| 3 | Education | Secondary education | Neutral-Poor |
| 4 | Education | Special education | Pro-Poor |
| 5 | Education | Community Learning | Pro-Rich |
| 6 | Education | Other non-school funding | Neutral-Poor |
| 7 | Cultural and related services | Museums and galleries | Pro-Rich |
| 8 | Cultural and related services | Other cultural and heritage services | Pro-Rich |
| 9 | Cultural and related services | Promotional events | Neutral-Rich |
| 10 | Cultural and related services | Other tourism | Neutral-Rich |
| 11 | Cultural and related services | Countryside recreation and management | Neutral-Rich |
| 12 | Cultural and related services | Sport facilities | Neutral-Rich |
| 13 | Cultural and related services | Community parks and open spaces | Neutral-Rich |
| 14 | Cultural and related services | Other recreation and sport | Neutral-Rich |
| 15 | Cultural and related services | Library Service | Neutral-Poor |
| 16 | Social work | Service Strategy | Pro-Poor |
| 17 | Social work | Children's Panel | Very Pro-Poor |
| 18 | Social work | Children and families | Very Pro-Poor |
| 19 | Social work | Older persons | Pro-Poor |
| 20 | Social work | Adults with physical or sensory disabilities | Pro-Poor |
| 21 | Social work | Adults with learning disabilities | Pro-Poor |
| 22 | Social work | Adults with mental health needs | Pro-Poor |
| 23 | Social work | Adults with other needs | Pro-Poor |
| 24 | Social work | Criminal justice social work services | Pro-Poor |
| 25 | Roads and transport | Road construction | Neutral-Rich |
| 26 | Roads and transport | Winter maintenance | Neutral-Rich |
| 27 | Roads and transport | Maintenance & repairs | Neutral-Rich |
| 28 | Roads and transport | Road lighting | Neutral-Rich |
| 29 | Roads and transport | School crossing patrols | Neutral-Rich |
| 30 | Roads and transport | Road Safety and Traffic Calming | Neutral-Rich |
| 31 | Roads and transport | Other network and traffic management | Neutral-Rich |
| 32 | Roads and transport | Parking | Pro-Rich |
| 33 | Roads and transport | Local authority public transport | Pro-Poor |
| 34 | Roads and transport | Non-LA public transport: Concessionary fares | Pro-Poor |
| 35 | Roads and transport | Non-LA public transport: Support to operators and voluntary groups | Pro-Poor |
| 36 | Roads and transport | Non-LA public transport: Co-ordination | Back Office |
| 37 | Environmental services | Trading Standards - Citizens Advice | Very Pro-Poor |
| 38 | Environmental services | Trading Standards - Other (Consumer Protection) | Neutral |
| 39 | Environmental services | Waste Management - Waste Collection | Neutral |
| 40 | Environmental services | Waste Management - Waste Disposal | Neutral |
| 41 | Environmental services | Waste Management - Other | Neutral |
| 42 | Environmental services | Other - Cemetery, cremation and mortuary services | Neutral |
| 43 | Environmental services | Other - Coast Protection | Neutral |
| 44 | Environmental services | Other - Flood defence and land drainage | Neutral |
| 45 | Environmental services | Other - Environmental Health | Neutral |
| 46 | Planning and economic development | Planning: Building control | Pro-Rich |
| 47 | Planning and economic development | Planning: Development control | Pro-Rich |
| 48 | Planning and economic development | Planning: Policy | Pro-Rich |
| 49 | Planning and economic development | Planning: Environmental initiatives | Neutral |
| 50 | Planning and economic development | Economic development | Neutral |
| 51 | Non-HRA Housing | Administration of Housing Advances | Very Pro-Poor |
| 52 | Non-HRA Housing | Renovation and Improvement Grants (excl admin costs) | Very Pro-Poor |
| 53 | Non-HRA Housing | Administration of Renovation and Improvement Grants | Very Pro-Poor |
| 54 | Non-HRA Housing | Other Private Sector Housing Renewal | Very Pro-Poor |
| 55 | Non-HRA Housing | Housing Benefits: Rent Allowance | Very Pro-Poor |
| 56 | Non-HRA Housing | Housing Benefits: Rent Rebate | Very Pro-Poor |
| 57 | Non-HRA Housing | Homelessness | Very Pro-Poor |
| 58 | Non-HRA Housing | Housing Support Services | Very Pro-Poor |
| 59 | Non-HRA Housing | Welfare Services | Very Pro-Poor |
| 60 | Non-HRA Housing | Other non-HRA Housing (excl. admin of Housing Benefits) | Very Pro-Poor |
| 61 | Central services | Council Tax Collection | Back Office |
| 62 | Central services | Non-Domestic Rates Collection | Back Office |
| 63 | Central services | Administration of Council Tax Reduction & Housing Benefit | Very Pro-Poor |
| 64 | Central services | Emergency Planning | Neutral |
| 65 | Central services | Licensing | Neutral |
| 66 | Central services | Conducting Elections | Neutral |
| 67 | Central services | Registration of Electors | Neutral |
| 68 | Central services | Non-Domestic Lands Valuation | Back Office |
| 69 | Central services | Council Tax Valuation | Back Office |
| 70 | Central services | Non-Road Lighting | Neutral-Rich |
| 71 | Central services | General Grants, Bequests & Donations | Pro-Poor |
| 72 | Central services | Registration of Births, Deaths & Marriages | Neutral |
| 73 | Central services | Corporate and Democratic Core | Back Office |
| 74 | Central services | Equal Pay/Single Status (prior year cost/provision only) | Back Office |
| 75 | Central services | Non Distributed Costs | Back Office |
| 76 | Central services | Miscellaneous | Back Office |
| 77 | Other Expenditure | Surplus(-)/Deficit(+) on trading operations not already included | Non-service Related |
| 78 | Other Expenditure | Capital expenditure charged to the General Fund | Non-service Related |
| 79 | Other Expenditure | Interest and Investment income (record a credit as a negative value) | Non-service Related |
| 80 | Other Expenditure | Statutory repayment of debt - Loans fund | Non-service Related |
| 81 | Other Expenditure | Statutory repayment of debt - Credit arrangements (Finance leases / PPP/PFI) | Non-service Related |
| 82 | Other Expenditure | Interest payable and similar charges | Non-service Related |
| 83 | Other Expenditure | Premiums and discounts | Non-service Related |
| 84 | Other Expenditure | Debt Management Expenses | Non-service Related |
| 85 | Other Expenditure | Contingency | Non-service Related |
Annex B – Local authority groupings
| Benchmarking Group | Local Authority | Mean SIMD Percentile (2012) |
|---|---|---|
| Group 1 (Least deprived) | East Renfrewshire | 76.2 |
| East Dunbartonshire | 71.9 | |
| Aberdeenshire | 70.7 | |
| Edinburgh | 64.8 | |
| Perth & Kinross | 64.2 | |
| Aberdeen City | 62.5 | |
| Shetland | 61.9 | |
| Orkney | 60.3 | |
| Group 2 | Moray | 60.8 |
| Stirling | 59.7 | |
| East Lothian | 59.2 | |
| Angus | 57.7 | |
| Scottish Borders | 57.4 | |
| Highland | 54.0 | |
| Argyll & Bute | 53.4 | |
| Midlothian | 53.2 | |
| Group 3 | Falkirk | 52.0 |
| Dumfries & Galloway | 51.9 | |
| Fife | 51.7 | |
| South Ayrshire | 50.2 | |
| West Lothian | 49.8 | |
| South Lanarkshire | 48.9 | |
| Renfrewshire | 47.6 | |
| Clackmannanshire | 46.0 | |
| Group 4 (Most deprived) | Eilean Siar | 43.4 |
| Dundee | 41.2 | |
| East Ayrshire | 40.5 | |
| North Ayrshire | 39.3 | |
| North Lanarkshire | 38.2 | |
| Inverclyde | 37.7 | |
| West Dunbartonshire | 34.1 | |
| Glasgow | 32.5 |
| Benchmarking Group | Local Authority | Mean Population Dispersion |
|---|---|---|
| Group 1 (Most dispersed) | Eilean Siar | 34.5 |
| Argyll & Bute | 25.8 | |
| Shetland | 23.4 | |
| Highland | 19.3 | |
| Orkney | 18.8 | |
| Scottish Borders | 10.6 | |
| Dumfries & Galloway | 9.8 | |
| Aberdeenshire | 9.1 | |
| Group 2 | Perth & Kinross | 8.0 |
| Stirling | 5.0 | |
| Moray | 4.7 | |
| South Ayrshire | 3.9 | |
| East Ayrshire | 3.6 | |
| East Lothian | 3.0 | |
| North Ayrshire | 2.3 | |
| Fife | 2.1 | |
| Group 3 | Angus | 2.0 |
| Clackmannanshire | 2.0 | |
| Midlothian | 1.3 | |
| South Lanarkshire | 1.0 | |
| Inverclyde | 0.9 | |
| Renfrewshire | 0.8 | |
| West Lothian | 0.8 | |
| East Renfrewshire | 0.7 | |
| Group 4 (Least dispersed) | North Lanarkshire | 0.7 |
| Falkirk | 0.6 | |
| East Dunbartonshire | 0.5 | |
| Aberdeen City | 0.4 | |
| Edinburgh | 0.1 | |
| West Dunbartonshire | 0.1 | |
| Dundee | 0.0 | |
| Glasgow | 0.0 |
| Benchmarking Group | Local Authority | Population |
|---|---|---|
| Group 1 (Lowest population) | Orkney Islands | 21,670 |
| Shetland Islands | 23,200 | |
| Eilean Siar | 27,070 | |
| Clackmannanshire | 51,360 | |
| Inverclyde | 79,500 | |
| Argyll & Bute | 86,890 | |
| Midlothian | 87,390 | |
| West Dunbartonshire | 89,590 | |
| Group 2 | Stirling | 92,830 |
| East Renfrewshire | 92,940 | |
| Moray | 95,510 | |
| East Lothian | 103,050 | |
| East Dunbartonshire | 106,960 | |
| South Ayrshire | 112,400 | |
| Scottish Borders | 114,030 | |
| Angus | 116,900 | |
| Group 3 | East Ayrshire | 122,060 |
| North Ayrshire | 136,130 | |
| Dundee City | 148,210 | |
| Dumfries & Galloway | 149,670 | |
| Perth & Kinross | 149,930 | |
| Falkirk | 158,460 | |
| Renfrewshire | 174,560 | |
| West Lothian | 178,550 | |
| Group 4 (Highest population) | Aberdeen City | 230,350 |
| Highland | 234,110 | |
| Aberdeenshire | 261,960 | |
| South Lanarkshire | 316,230 | |
| North Lanarkshire | 338,260 | |
| Fife | 368,080 | |
| Edinburgh, City of | 498,810 | |
| Glasgow City | 606,340 |
| Budget pressure group | Local authority | Budget pressure (savings as percentage of expenditure) |
|---|---|---|
| Group 1 (greatest budget pressure) | Aberdeen City | 6.5% |
| Edinburgh | 4.0% | |
| Stirling | 3.9% | |
| Dumfries & Galloway | 3.7% | |
| Scottish Borders | 3.6% | |
| Glasgow | 3.6% | |
| Falkirk | 3.6% | |
| East Dunbartonshire | 3.2% | |
| Group 2 | Aberdeenshire | 3.1% |
| Fife | 3.1% | |
| South Lanarkshire | 2.8% | |
| West Lothian | 2.4% | |
| Dundee City | 2.3% | |
| Midlothian | 2.2% | |
| Highland | 2.1% | |
| Group 3 | North Ayrshire | 2.1% |
| Inverclyde | 2.0% | |
| East Ayrshire | 1.8% | |
| Argyll & Bute | 1.8% | |
| East Renfrewshire | 1.8% | |
| South Ayrshire | 1.7% | |
| Clackmannanshire | 1.3% | |
| Group 4 (least budget pressure) | Angus | 1.3% |
| North Lanarkshire | 1.1% | |
| Moray | 1.0% | |
| Orkney | 1.0% | |
| East Lothian | 1.0% | |
| Eilean Siar | 0.9% | |
| Renfrewshire | 0.9% | |
| Perth & Kinross | 0.7% |
Annex C – Local Authority Budget Documents
Note - those local authority budget documents that are not hyperlinked in the table above were provided direct to SPICe.
Annex D - Methodology – worked example
The following savings plans are a typical example of the type of information contained in local authority budget documents. The following five savings proposals are concerned with changes to a mixture of cultural and recreational services including library services.
| Code | Portfolio | Service | Proposal | Saving (£000s) |
| 1 | Education & Leisure Services | Library | Library services refocused to increase use of e-facilities (see Library Service Review) | 30 |
| 2 | Education & Leisure Services | Library | Library services refocused to introduce self-service provision (see Library Service Review) | 25 |
| 3 | Education & Leisure Services | Library | Revised management structure (see Library Service Review) | 10 |
| 4 | Education & Leisure Services | Leisure | Community halls – review all usage of community halls. Consider options for community transfer or closure | 70 |
| 5 | Education & Leisure Services | Leisure | Reduction on senior citizens concession for leisure services | 20 |
The first three savings relate to libraries and are summed to give the total for library services. This figure (£65,000) is then entered into the appropriate space in the analysis spreadsheet. The process is then repeated for the other two savings which concern changes to community halls and leisure services for the elderly. The table below is an excerpt from an analysis spreadsheet showing how the summary data would appear. Note how each service has been allocated a Pro-Rich, Pro-Poor or Neutral code. This process is repeated for each of the council’s savings plans across all service headings to produce an analysis spreadsheet containing all relevant data for that local authority.
| STANDARD CLASSIFICATION | |||||
| No | Service Heading | Service | Code | Pattern of use/ benefit | Savings (£000s) |
| 7 | Cultural & related services | Museums and galleries | -2 | Pro-Rich | 0 |
| 8 | Cultural & related services | Other cultural and heritage services | -2 | Pro-Rich | 0 |
| 9 | Cultural & related services | Library service | 1 | Neutral-Poor | 65 |
| 10 | Cultural & related services | Tourism | -1 | Neutral-Rich | 0 |
| 11 | Cultural & related services | Countryside recreation and management | -1 | Neutral-Rich | 0 |
| 12 | Cultural & related services | Sport facilities (including swimming pools and golf courses) | -1 | Neutral-Rich | 0 |
| 13 | Cultural & related services | Community parks and open spaces | -1 | Neutral-Rich | 0 |
| 14 | Cultural & related services | Other recreation and sport | -1 | Neutral-Rich | 90 |
Annex E - Council Tax revenue as a % of Total Estimated Expenditure, 2016-17 to 2017-18
| 2016-17 | 2017-18 | ||||||
|---|---|---|---|---|---|---|---|
| £m | 2016-17 Total Estimated Expenditure | Est CT revenue - 2016-17 multipliers | CT Revenue as a % of Total Estimated Expenditure | 2017-18 Total Estimated Expenditure | Est CT Revenue taking into account end of CT freeze + multiplier changes | CT Revenue as a % of Total Estimated Expenditure | % Change |
| Eilean Siar | 106.9 | 10.2 | 10% | 104.5 | 10.6 | 10% | 1% |
| Shetland | 90.3 | 8.8 | 10% | 88.5 | 9.3 | 10% | 1% |
| Orkney | 75.3 | 8.4 | 11% | 75.0 | 8.8 | 12% | 1% |
| North Lanarkshire | 714.1 | 127.8 | 18% | 717.1 | 131.6 | 18% | 0% |
| Dundee | 331.1 | 59.0 | 18% | 335.9 | 61.9 | 18% | 1% |
| Inverclyde | 190.0 | 33.8 | 18% | 190.1 | 35.1 | 18% | 1% |
| West Dunbartonshire | 216.5 | 39.8 | 18% | 218.2 | 40.8 | 19% | 0% |
| Glasgow | 1422.8 | 260.4 | 18% | 1436.2 | 275.7 | 19% | 1% |
| North Ayrshire | 314.9 | 58.4 | 19% | 318.7 | 62.1 | 19% | 1% |
| Dumfries & Galloway | 338.1 | 62.7 | 19% | 338.9 | 67.1 | 20% | 1% |
| West Lothian | 364.5 | 71.1 | 20% | 369.4 | 73.9 | 20% | 1% |
| Falkirk | 327.9 | 62.2 | 19% | 330.7 | 66.7 | 20% | 1% |
| East Ayrshire | 262.9 | 50.8 | 19% | 265.0 | 53.9 | 20% | 1% |
| South Lanarkshire | 664.9 | 133.1 | 20% | 669.3 | 138.9 | 21% | 1% |
| Angus | 239.1 | 46.9 | 20% | 240.0 | 50.0 | 21% | 1% |
| Clackmannanshire | 111.8 | 22.1 | 20% | 112.8 | 23.7 | 21% | 1% |
| Argyll & Bute | 233.2 | 46.1 | 20% | 232.2 | 49.9 | 21% | 2% |
| Fife | 752.8 | 153.9 | 20% | 762.5 | 165.1 | 22% | 1% |
| Moray | 187.9 | 38.6 | 21% | 188.1 | 40.9 | 22% | 1% |
| Scottish Borders | 247.1 | 50.8 | 21% | 248.3 | 55.2 | 22% | 2% |
| Renfrewshire | 367.6 | 79.5 | 22% | 370.7 | 82.8 | 22% | 1% |
| Highland | 530.4 | 112.0 | 21% | 533.3 | 120.4 | 23% | 1% |
| East Renfrewshire | 214.4 | 45.6 | 21% | 217.4 | 51.2 | 24% | 2% |
| Stirling | 198.5 | 44.5 | 22% | 203.0 | 48.1 | 24% | 1% |
| Midlothian | 182.8 | 41.2 | 23% | 186.3 | 44.3 | 24% | 1% |
| South Ayrshire | 242.6 | 54.6 | 23% | 244.4 | 59.2 | 24% | 2% |
| East Lothian | 208.0 | 47.6 | 23% | 211.2 | 52.0 | 25% | 2% |
| Perth and Kinross | 302.8 | 73.0 | 24% | 307.2 | 79.1 | 26% | 2% |
| Aberdeenshire | 511.6 | 122.4 | 24% | 517.2 | 134.0 | 26% | 2% |
| East Dunbartonshire | 227.9 | 54.7 | 24% | 230.4 | 61.1 | 27% | 2% |
| Aberdeen | 402.0 | 112.1 | 28% | 407.0 | 118.0 | 29% | 1% |
| Edinburgh | 903.4 | 243.7 | 27% | 922.2 | 267.6 | 29% | 2% |
| Scotland | 11484.0 | 2375.6 | 21% | 11591.8 | 2539.0 | 22% | 1% |
About the authors
Maria Gannon is Research Associate in Urban Studies at the School of Social and Political Sciences, University of Glasgow.
Ailsa Burn-Murdoch is a Senior Researcher in the Financial Scrutiny Unit in SPICe.
Andrew Aiton is Data Manager in the Financial Scrutiny Unit in SPICe.
Nick Bailey is Professor of Urban Studies at the School of Social and Political Sciences, University of Glasgow.
Glen Bramley is Professor of Urban Studies based in the Institute for Social Policy, Housing, Environment and Real Estate, Heriot Watt University, Edinburgh.
Allan Campbell is Head of the Financial Scrutiny Unit in SPICe.
Kayleigh Finnigan is a Creative Digital Media Apprentice in SPICe.
Laura Gilman is an Enquiries Officer in SPICe.
Annette Hastings is Professor of Urban Studies at the School of Social and Political Sciences, University of Glasgow.
Acknowledgements
The authors are grateful to the Joseph Rowntree Foundation which supported an earlier programme of work which underpins this Briefing. They are also grateful to the University of Glasgow's ESRC Impact Acceleration Account and to SPICe for the co-funding of the research and writing of this Briefing. The authors would also like to thank the Improvement Service for sharing their benchmarking family groupings.
Sources
Gannon, M., Campbell, A., Bailey, N., Hastings, A., Bramley, G., & Aiton, A. (2016, October 31). The social impact of the 2016-17 local government budget. Retrieved from <a href="http://www.parliament.scot/ResearchBriefingsAndFactsheets/S5/SB_16-84_The_social_impact_of_the_2016-17_local_government_budget.pdf" target="_blank">http://www.parliament.scot/ResearchBriefingsAndFactsheets/S5/SB_16-84_The_social_impact_of_the_2016-17_local_government_budget.pdf</a> [accessed 23 November 2017]
Hastings, A., Bailey, N., Besemer, K., Bramley, G., Gannon, M., & Watkins, D. (2013, November). Coping with the cuts? Local government and poorer communities. Retrieved from <a href="https://www.jrf.org.uk/sites/default/files/jrf/migrated/files/local-government-communities-full.pdf" target="_blank">https://www.jrf.org.uk/sites/default/files/jrf/migrated/files/local-government-communities-full.pdf</a> [accessed 4 December 2017]
Hastings, A., Bailey, N., Bramley, G., Gannon, M., & Watkins, D. (2015, March 10). The cost of the cuts: the impact on local government and poorer communities. Retrieved from <a href="https://www.jrf.org.uk/report/cost-cuts-impact-local-government-and-poorer-communities" target="_blank">https://www.jrf.org.uk/report/cost-cuts-impact-local-government-and-poorer-communities</a> [accessed 4 December 2017]
Hastings, A., Bailey, N., Bramley, G., Gannon, M., & Watkins, D. (2015, October 7). The cost of the cuts: a social impact tool for local authorities. Retrieved from <a href="https://www.jrf.org.uk/report/cost-cuts-social-impact-tool-local-authorities" target="_blank">https://www.jrf.org.uk/report/cost-cuts-social-impact-tool-local-authorities</a> [accessed 4 December 2017]
Scottish Government. (2017). Provisional Outturn & Budget Estimate (POBE) Statistics. Retrieved from <a href="http://www.gov.scot/Topics/Statistics/Browse/Local-Government-Finance/POBEStats" target="_blank">http://www.gov.scot/Topics/Statistics/Browse/Local-Government-Finance/POBEStats</a> [accessed 4 December 2017]
Burn-Murdoch, A. (2017, June 21). Local Government Finance: Facts and Figures 2010-11 to 2017-18. Retrieved from <a href="https://digitalpublications.parliament.scot/ResearchBriefings/Report/2017/6/21/Local-Government-Finance--facts-and-figures-2010-11-to-2017-18" target="_blank">https://digitalpublications.parliament.scot/ResearchBriefings/Report/2017/6/21/Local-Government-Finance--facts-and-figures-2010-11-to-2017-18</a> [accessed 20 November 2017]
Financial Scrutiny Unit. (2016, December 19). SB 16-103 Scottish Government Draft Budget 2017-18. Retrieved from <a href="http://www.scottish.parliament.uk/ResearchBriefingsAndFactsheets/S5/SB_16-103_Draft_Budget_2017-18.pdf" target="_blank">http://www.scottish.parliament.uk/ResearchBriefingsAndFactsheets/S5/SB_16-103_Draft_Budget_2017-18.pdf</a> [accessed 4 December 2017]
Scottish Parliament Local Government and Communities Committee. (2017, January 27). Report on the Scottish Government’s Draft Budget 2017-18. Retrieved from <a href="http://www.parliament.scot/S5_Local_Gov/Reports/LGCS052017R02.pdf" target="_blank">http://www.parliament.scot/S5_Local_Gov/Reports/LGCS052017R02.pdf</a> [accessed 15 June 2017]
Scottish Government. (2017, March 10). Local Government Finance Scotland Order 2017. Retrieved from <a href="http://www.gov.scot/Topics/Government/local-government/17999/11203/2017LGFOrder" target="_blank">http://www.gov.scot/Topics/Government/local-government/17999/11203/2017LGFOrder</a> [accessed 4 December 2017]
Scottish Government. (2016, April 27). Local Government Finance (Scotland) Order 2016. Retrieved from <a href="http://www.gov.scot/Topics/Government/local-government/17999/11203/financecircular12016" target="_blank">http://www.gov.scot/Topics/Government/local-government/17999/11203/financecircular12016</a> [accessed 4 December 2017]
CoSLA. (2017, January). MSP Briefing - January 2017. Retrieved from <a href="http://www.cosla.gov.uk/msp-briefing-january-2017" target="_blank">http://www.cosla.gov.uk/msp-briefing-january-2017</a> [accessed 4 December 2017]
CoSLA. (2017, November). Submission to the Local Government and Communities Committee: Fair Funding for Essential Services. Retrieved from <a href="http://www.parliament.scot/S5_Local_Gov/Inquiries/20171113_Budget_COSLA.pdf" target="_blank">http://www.parliament.scot/S5_Local_Gov/Inquiries/20171113_Budget_COSLA.pdf</a> [accessed 23 November 2017]
Accounts Commission. (2017, March 7). Local government in Scotland: Performance and challenges 2017. Retrieved from <a href="http://www.audit-scotland.gov.uk/report/local-government-in-scotland-performance-and-challenges-2017" target="_blank">http://www.audit-scotland.gov.uk/report/local-government-in-scotland-performance-and-challenges-2017</a> [accessed 13 June 2017]
Improvement Service. (2017). Local Government Benchmarking Framework. Retrieved from <a href="http://www.improvementservice.org.uk/benchmarking/" target="_blank">http://www.improvementservice.org.uk/benchmarking/</a> [accessed 4 December 2017]