Earnings in Scotland: 2017
The Office for National Statistics released the Annual Survey of Hours and Earnings (ASHE) 2017 provisional results on 26 October 2017. This briefing provides an overview of earnings in Scotland.
Executive Summary
About the Annual Survey of Hours and Earnings (ASHE) Data
The data in this briefing are ASHE 2017 provisional results, published by the Office of National Statistics (ONS). The survey provides a range of earnings statistics for employees across the UK. ASHE provides data for hourly, weekly and annual income for all, part-time and full-time employees. It does not cover the self-employed. ASHE is based on a 1% sample of employee jobs taken from the Pay As You Earn (PAYE) records of Her Majesty Revenue and Customs (HMRC) in April 2017.1
Key points about the data:
Where figures are adjusted for inflation, the April 2017 Consumer Price Inflation (CPI) figure, 2.6%, has been used. CPI is appropriate in this instance as it is used for uprating pensions, wages and some benefits and can aid in the understanding of the impact of inflation on family budgets.
Because of the potential for sampling errors for smaller groups, including local areas and small industries, there is a wider margin of error with some of the data than for Scotland as a whole.
Unless otherwise stated, the median estimate has been used rather than the mean, as it provides a better indication of ‘typical’ pay. Median values split the top 50 per cent from the bottom 50 per cent, meaning it is less likely to be skewed by the relatively small number of very high earners.
"Full-time" is defined as employees working 30 paid hours per week or more (or 25 or more for the teaching professions).
Methodological changes in 2004, 2006 and 2011 resulted in discontinuities in the ASHE time series, therefore care should be taken when making comparisons with earlier years.
What does the typical salary look like in Scotland?
This section looks at what annual salaries for all employees, both full-time and part-time, look like in Scotland, compared to the other regions and nations of the UK. The ASHE analysis for annual earnings relates to employees who have been in the same job for more than one year. 1
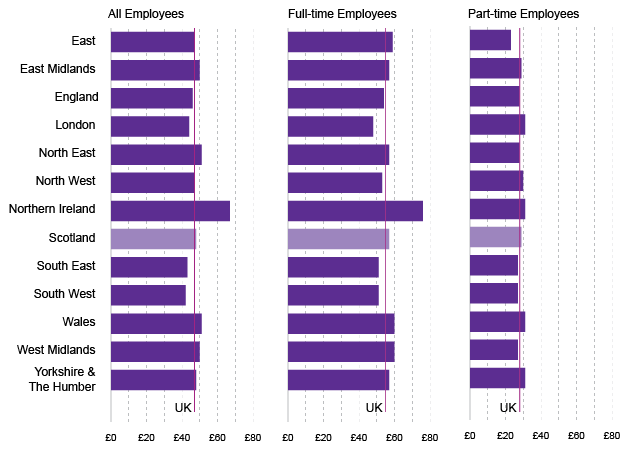
Figure 1: Gross annual pay for all employees across the nations and regions of the UK - 2017
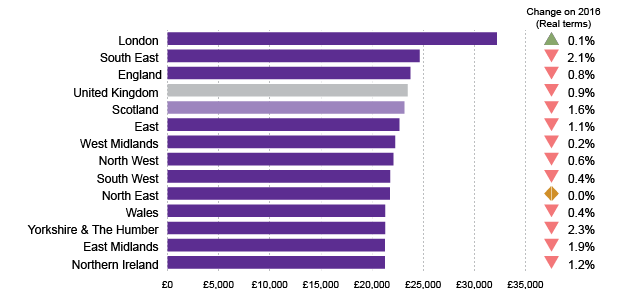
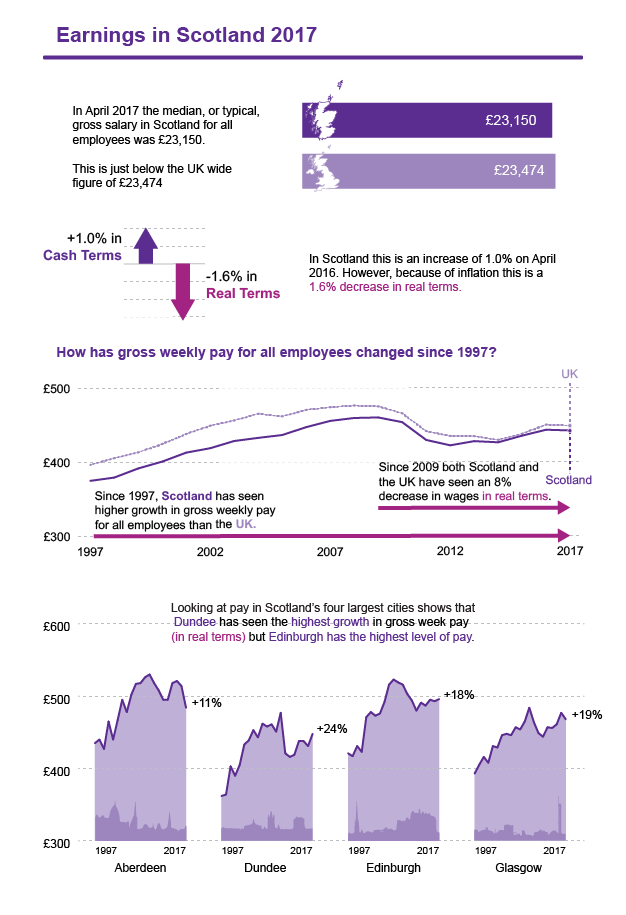
In April 2017 the median, or typical, gross salary in Scotland for all employees was £23,150. This is just below the UK wide figure (£23,474) and is the highest outside London and the South East, but lower than the overall England figure.
Over the year salaries for all employees in Scotland grew by 1.0%, which was a 1.6% fall in real terms. This was the fourth lowest increase of the UK regions and nations. Only London saw an above inflation increase in salaries.
What does the typical full-time salary look like in Scotland?
Figure 2: Gross annual pay for full-time employees across the nations and regions of the UK - 2017
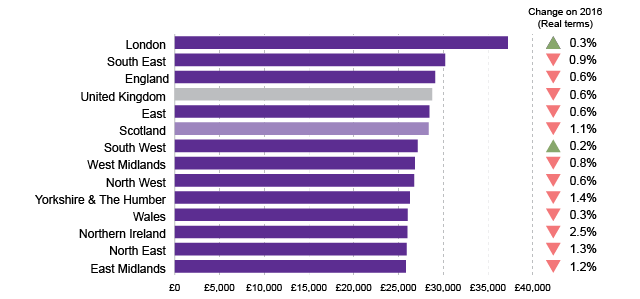
In Scotland 74% of people work full-time. Men make up the majority (61%) of those working full-time. In April 2017 the median, or typical, gross full-time salary in Scotland was £28,354. This is just below the UK wide figure (£28,758) and is the highest outside London and the South East, but lower than the overall England figure.
Over the year salaries for full-time employees in Scotland grew by 1.5%, which was a 1.1% fall in real terms. This was the fifth lowest increase of the UK regions and nations. Only London and the South West saw an above inflation increase in full-time salaries.
What does the typical part-time salary look like in Scotland?
Figure 3: Gross annual pay for part-time employees across the nations and regions of the UK - 2017
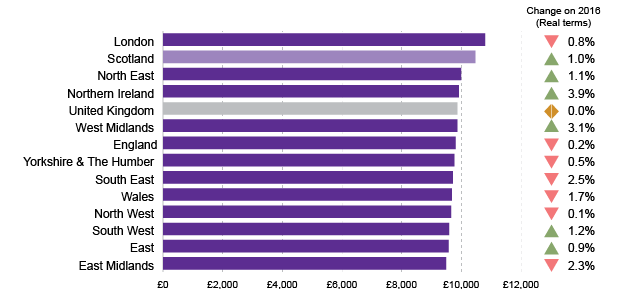
In Scotland 26% of people work part-time. Women make up the majority (78%) of those working part-time. In April 2017 the median, or typical, gross part-time salary in Scotland was £10,474. This is the highest outside London.
Over the year salaries for part-time employees in Scotland grew by 3.6%, which was a 1.0% increase in real terms. This was the fifth highest increase of the UK regions and nations. Northern Ireland saw the largest increase at 3.9% in real terms, while the South East saw the largest decrease at 2.5% in real terms.
What does typical weekly pay look like in Scotland?
Unlike salaries, the analysis of weekly pay doesn't require a person to have been in the same job for a year. It relates to employees whose earnings for the survey pay period were not affected by absence.
This section looks at what weekly pay for all employees, both full-time and part-time, looks like in Scotland compared to the other regions and nations of the UK.
Figure 4: Gross weekly pay for all employees across the nations and regions of the UK - 2017
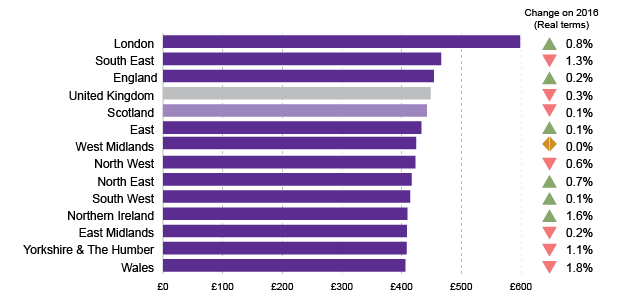
In April 2017 the median, or typical, gross weekly pay in Scotland for all employees was £442. This is just below the UK wide figure (£449) and is the highest outside London and the South East, but lower than the overall England figure.
Over the year gross weekly pay for all employees in Scotland grew by 2.5%, which was a 0.1% fall in real terms. This was the sixth lowest increase of the UK regions and nations. Northern Ireland saw the largest increase in real terms at 1.6%, while Wales saw the largest decrease in real terms (-1.8%).
Figure 5: Annual growth in gross weekly pay for all employees in Scotland in cash and real terms between 2016 and 2017
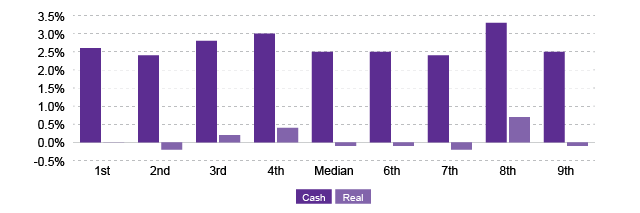
ASHE provides data on earnings by deciles. Deciles split data into ten groups of equal size then ranks them. In this case, the 1st group has the lowest income and 9th has the highest.
Over the year weekly pay at all levels increased in cash terms, with the 8th decile seeing the largest increase. Looking at the figures in real terms shows that only the, 3rd, 4th and 8th decile saw a real terms increase, with the biggest real terms decrease coming in the 2nd and 3rd decile.
What does typical full-time weekly pay look like in Scotland?
Figure 6: Gross weekly pay for full-time employees across the nations and regions of the UK - 2017
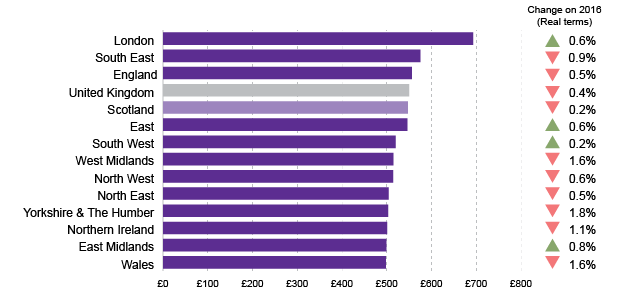
In Scotland 74% of people work full-time. Men make up the majority (61%) of those working full-time. In April 2017 the median, or typical, gross full-time weekly pay in Scotland was £547. This is just below the UK wide figure (£550) and is the highest outside London and the South East, but lower than the overall England figure.
Over the year, gross weekly pay for full-time employees in Scotland grew by 2.4%, which was 0.2% decrease in real terms. This was the fifth highest increase of the UK regions and nations. Only the East Midland, East England, London and the South West saw an above inflation increase in full-time weekly pay.
What does typical part-time weekly pay look like in Scotland?
Figure 7: Gross weekly pay for part-time employees in across the nations and regions of the UK - 2017
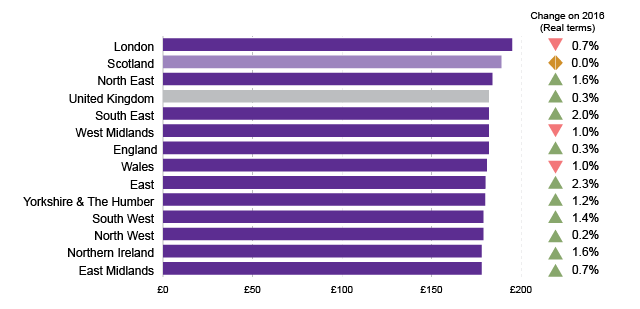
In Scotland 26% of people work part-time. Women make up the majority (78%) of those working part-time. In April 2017 the median, or typical, gross weekly part-time salary in Scotland was £189. This is the highest outside London.
Over the year gross weekly pay for part-time employees in Scotland grew by 2.6%, which means wages saw no growth in real terms. This was the fourth lowest increase of the UK regions and nations. The East of England saw the highest increase at 2.3% in real terms, while Wales saw the largest real terms decrease at 1.0%.
How has pay changed over the last twenty years?
This section looks at how wages in Scotland and the UK have changed over the last 20 years. ASHE provides figures on gross weekly pay from 1997 to 2017.
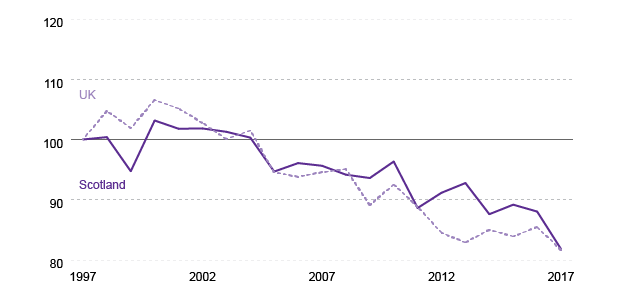
Figure 8: Gross weekly pay in cash and real terms for Scotland and the UK between 1997 and 2017
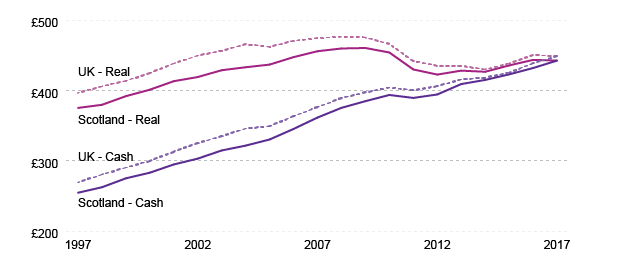
In 1997 the typical gross weekly pay for all employees in Scotland was £254. By April 2017 it had grown to £449. This represents a 74% increase, while over the same period the UK overall saw a 67% increase. Despite Scotland experiencing stronger growth in wages, it still sits behind the UK. But the gap has reduced from 7% in 2004 to 1% in 2017.
While Scotland and the UK have both seen almost constant grow in wages in cash terms since 1997, apart from a small decrease between 2010 and 2011, looking at the figures in real terms tell a different story:
The UK wide figure saw constant growth between 1997 and 2008, while growth continued in Scotland until 2009.
Wages fell by 8% between 2009 and 2012 in Scotland and the UK as a whole. Since then wages have remained at around 95% of the level of 2009 wages in Scotland and 92% for the UK.
Figure 9: Gross weekly pay for all employees in Scotland and the UK in real terms indexed to 1997 by quartile
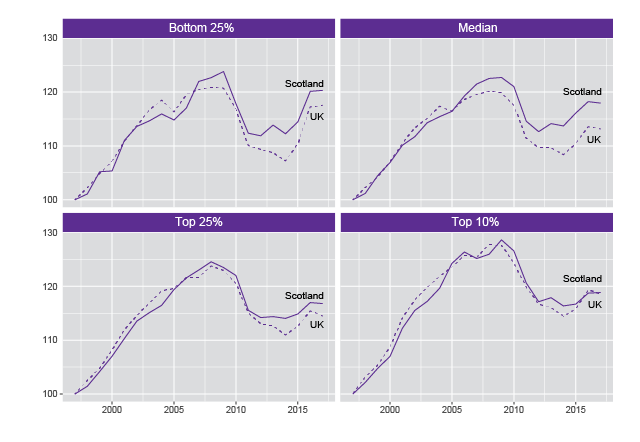
Figure 9 shows how the typical gross weekly wage for all employees in Scotland and the UK hase grown across different income levels. Wages in figure 9 have been indexed to the 1997 figure in real terms at 2017 prices.
Across all income levels Scotland saw higher growth than the UK between 1997 and 2017.
Between 1997 and 2009, when wages peaked in real terms, Scotland saw higher growth than the UK across all levels.
Wages across all levels are currently below 2009 levels in real terms, although for the bottom 25% wages in Scotland have fallen slightly further in real terms than across the UK, 2.8% compared to 2.6%.
Despite seeing stronger growth, wages in Scotland are still below the UK levels, with the widest gap in the top 10% (7% lower).
Public and private sector pay
The reasons for the differences in private and public sector pay levels are complex "because of the different jobs and characteristics of the people within each sector".1 In order to address some of these issues, hourly pay excluding overtime is used for comparing the public and private sector. This helps to control for the difference in the length of the working week.
Figure 10: Hourly pay excluding overtime by sector in Scotland and the UK - 2017
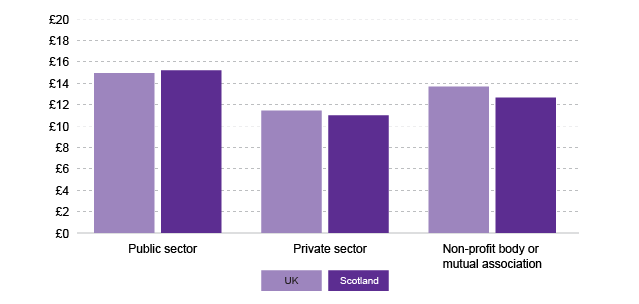
Public sector pay in Scotland is slightly higher than the UK, £15.19 per hour compared to £14.93 per hour. Private sector pay is lower the UK, £11.44 per hour in the UK and £10.99 per hour in Scotland.
Figure 11: Real terms growth in hourly pay excluding overtime by sector in Scotland between 2016 and 2017
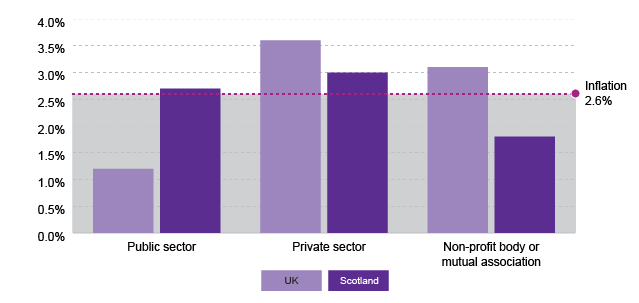
Growth in public sector pay in Scotland was higher than the UK (2.7% compared to 2.1%) with Scotland seeing a slight increase above inflation (0.1%) while the UK saw a 0.4% decrease. Private sector pay across the UK was higher than in Scotland, but both saw an above inflation increase.
Figure 12: Real terms growth in the hourly pay excluding overtime in the public and private sector in Scotland by decile between 2016 and 2017
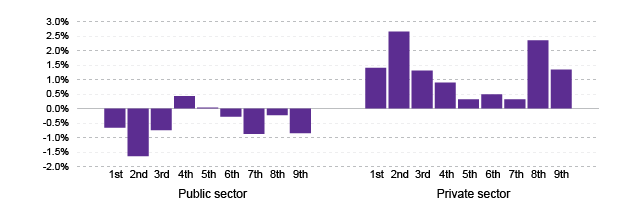
Looking at the growth in income across the public and private sector in real terms show a stark contrast between the two. Across every level of pay between 2016 and 2017, private sector income in Scotland increased while in the public sector only the 4th and 5th decile saw increases.
Which industries in Scotland pay the most?
This section looks at pay by industry in Scotland, using median hourly pay excluding overtime for all employees, in order to control for different working patterns and working weeks across the industries.
Figure 13: Hourly pay excluding overtime by industry in Scotland - 2017
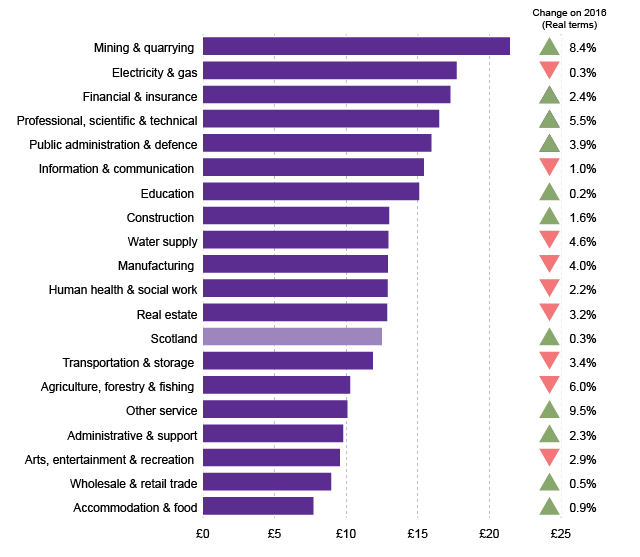
The “mining and quarrying” industry (which includes the offshore oil and gas sector) has the highest median hourly rate excluding overtime at £21.43. It also saw the second highest increase in pay between 2016 and 2017 (8.4% in real terms). The “Other Service” industry category saw the largest increase (9.5%). "Other services" include membership organisations, the repair of computers and personal and household goods and a variety of personal service activities such as hairdressing or funeral related activities.
The “accommodation and food services” industry has the lowest rate despite seeing an above inflation increase in earnings over the year of, 0.9% in real terms. “Accommodation and food” is the only industry to have a median wage below the living wage rate at the time of the survey, of £8.45 an hour.
Which occupations in Scotland pay the most?
This section looks at pay by occupation in Scotland, using median hourly pay excluding overtime, for all employees in order to control for different working patterns and working weeks across the occupations.
Figure 14: Change in hourly pay excluding overtime by occupation in Scotland - 2016 to 2017
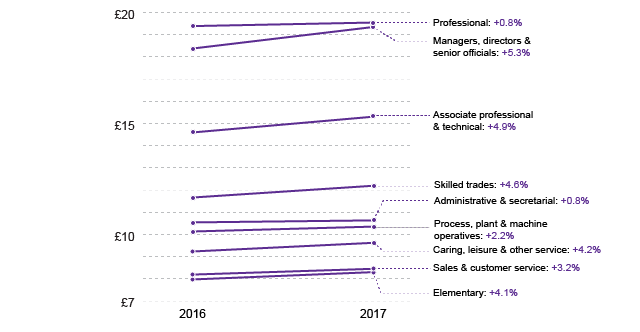
“Professional occupations” in Scotland (including engineers, IT and health professionals) have the highest hourly rates of pay, at £19.54 an hour excluding overtime. “Sales and customer services” and “elementary occupations” (for example bar staff, cleaners and farm workers), both have median hourly rates at or below the living wage rate at the time of the survey, of £8.45 an hour.
"Caring, leisure and other service" has seen an above inflation increase of 4.2%. This could be explained by the introduction of the "Living Wage Commitment’, which came into effect on 1st October 2016. This was a commitment from the Scottish Government to pay the Living Wage to all care workers providing direct care and support to adults in care homes, care at home, and housing support.1
Which local authority area in Scotland has the highest pay?
This section looks at pay by local authority area in Scotland based on place of work, using median hourly pay excluding overtime for all employees, in order to control for different structural differences in local authority economies.
Figure 15: Hourly pay excluding overtime by place of work in Scotland - 2017
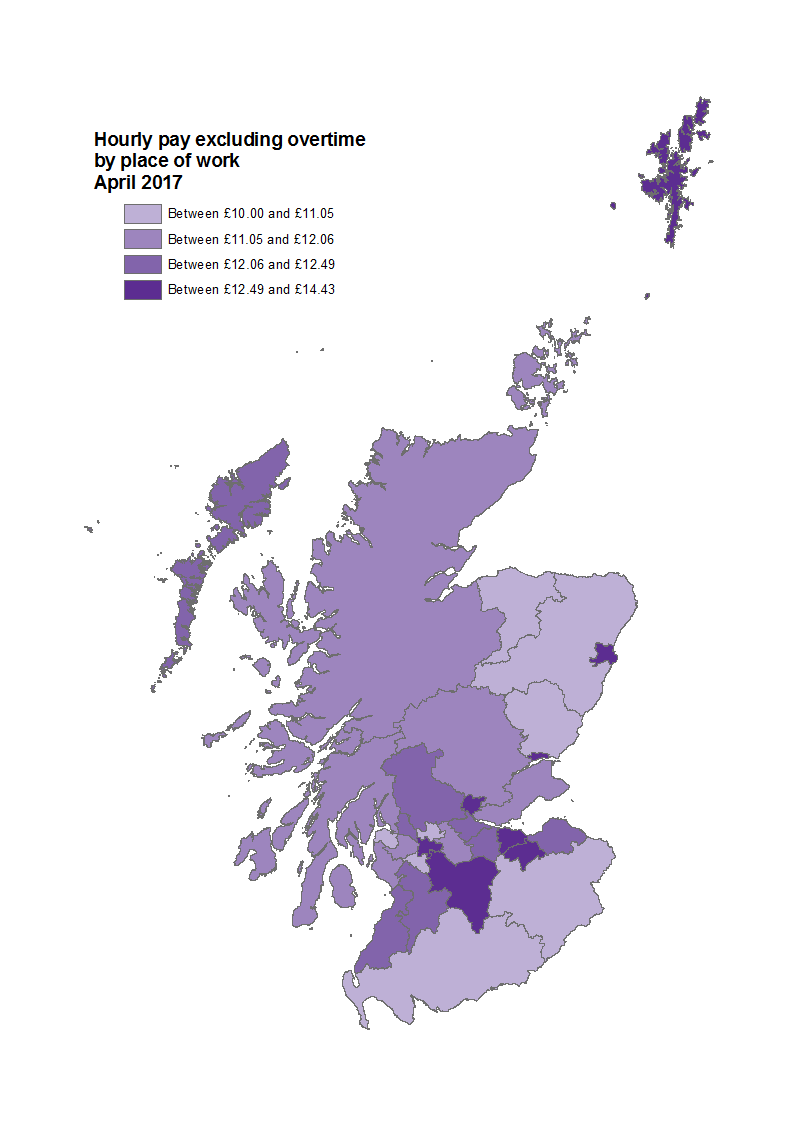
Edinburgh has the highest workplace income in Scotland at £14.43 while East Renfrewshire has the lowest at £10.00. The data for the map can be found in the annex.
Figure 16: Real terms workplace gross weekly pay by local authority - 1997 to 2017 (2017 prices)
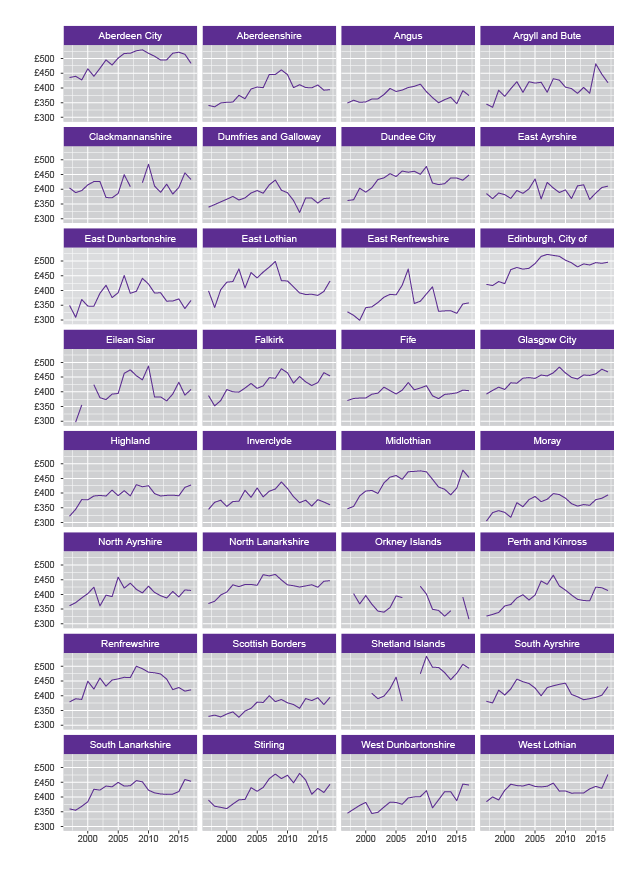
Figure 16 shows workplace gross weekly pay by local authority from 1997 to 2017:
The Highland council area has seen the strongest growth in real terms wages across Scotland between 1997 and 2017 at 33%.
Inverclyde has seen the weakest growth in real terms wages across Scotland between 1997 and 2017 at 4%.
Dundee has seen the highest growth of Scotland's four largest cities between 1997 to 2017, increasing by 24%.
Wages have struggled to get back to peak levels across Scotland, with only 9 of the 32 local authorities at or above 2009 levels in real terms.
Since 2015 wages in Aberdeen have fallen by 7% in real terms and Aberdeen has fallen from first to third in terms of workplace income.
The size of the population of the local authority also affects how precise the data is. The smaller the population the less precise the data.
Overtime pay
Overtime pay is the amount paid to an employee as a result of working overtime hours.1
As not everyone works overtime the sample size is smaller and can be less reliable, especially in regions with smaller populations such as Northern Ireland.
Figure 17: Overtime pay across the nations and regions of the UK for all, full-time and part-time employees - 2017
Northern Ireland has the highest overtime pay for all and full-time employees while London has the highest for part-time employees. Scotland sits sixth across the board.
Figure 18: Overtime pay in Scotland and the UK in real terms indexed to 1997
From 1997 to 2004, overtime pay remained saw little growth in real term in both Scotland and the UK. Since 2004 it has declined by 20% in the UK and by 18% in Scotland.
Annex
| Local Authority | Hourly pay - Excluding overtime | Annual Growth - cash terms | Annual Growth - real terms |
|---|---|---|---|
| Aberdeen City | £13.47 | -3.5% | -6.1% |
| Aberdeenshire | £10.80 | -1.8% | -4.4% |
| Angus | £10.76 | -1.7% | -4.3% |
| Argyll and Bute | £11.50 | -0.2% | -2.8% |
| City of Edinburgh | £14.43 | 5.5% | 2.9% |
| Clackmannanshire | £12.56 | 2.2% | -0.4% |
| Dumfries and Galloway | £10.07 | 0.7% | -1.9% |
| Dundee City | £12.86 | 5.2% | 2.6% |
| East Ayrshire | £12.08 | 7.1% | 4.5% |
| East Dunbartonshire | £11.05 | 3.7% | 1.1% |
| East Lothian | £12.11 | 6.1% | 3.5% |
| East Renfrewshire | £10.00 | 0.0% | -2.6% |
| Falkirk | £12.26 | 0.9% | -1.7% |
| Fife | £11.54 | 0.9% | -1.7% |
| Glasgow City | £13.41 | 4.4% | 1.8% |
| Highland | £12.06 | 3.0% | 0.4% |
| Inverclyde | £10.02 | -12.7% | -15.3% |
| Midlothian | £12.52 | -2.0% | -4.6% |
| Moray | £10.66 | -0.7% | -3.3% |
| Na h-Eileanan Siar | £12.25 | 3.8% | 1.2% |
| North Ayrshire | £11.67 | 2.7% | 0.1% |
| North Lanarkshire | £11.75 | 2.3% | -0.3% |
| Orkney Islands | £11.75 | 2.6% | 0.0% |
| Perth and Kinross | £11.46 | 1.8% | -0.8% |
| Renfrewshire | £11.95 | 3.9% | 1.3% |
| Scottish Borders | £10.99 | 4.7% | 2.1% |
| Shetland Islands | £13.20 | 1.0% | -1.6% |
| South Ayrshire | £12.15 | 7.4% | 4.8% |
| South Lanarkshire | £13.00 | 0.2% | -2.4% |
| Stirling | £12.17 | 1.4% | -1.2% |
| West Dunbartonshire | £12.49 | -0.9% | -3.5% |
| West Lothian | £12.45 | 10.5% | 7.9% |
Sources
Office for National Statistics. (2017, October 26). Annual Survey of Hours and Earnings: 2017 provisional and 2016 revised results. Retrieved from <a href="https://www.ons.gov.uk/employmentandlabourmarket/peopleinwork/earningsandworkinghours/bulletins/annualsurveyofhoursandearnings/2017provisionaland2016revisedresults#main-points" target="_blank">https://www.ons.gov.uk/employmentandlabourmarket/peopleinwork/earningsandworkinghours/bulletins/annualsurveyofhoursandearnings/2017provisionaland2016revisedresults#main-points</a> [accessed 08 November 2017]
Office for National Statistics. (2014, September 9). Annual Survey of Hours and Earnings, Low Pay and Annual Survey of Hours and Earnings Pension Results QMI. Retrieved from <a href="https://www.ons.gov.uk/employmentandlabourmarket/peopleinwork/earningsandworkinghours/qmis/annualsurveyofhoursandearningslowpayandannualsurveyofhoursandearningspensionresultsqmi" target="_blank">https://www.ons.gov.uk/employmentandlabourmarket/peopleinwork/earningsandworkinghours/qmis/annualsurveyofhoursandearningslowpayandannualsurveyofhoursandearningspensionresultsqmi</a> [accessed 27 October 2017]
Office for National Statistics. (2014, November 19). Public and Private Sector Earnings - November 2014. Retrieved from <a href="http://webarchive.nationalarchives.gov.uk/20160107090910/http://www.ons.gov.uk/ons/dcp171776_383355.pdf" target="_blank">http://webarchive.nationalarchives.gov.uk/20160107090910/http://www.ons.gov.uk/ons/dcp171776_383355.pdf</a> [accessed 01 November 2017]
Self Directed Support Scotland. (2017, February 17). Implementation of Scottish National Living Wage for Care Workers and PA’s. Retrieved from <a href="http://www.sdsscotland.org.uk/implementation-scottish-national-living-wage-care-workers-pas/" target="_blank">http://www.sdsscotland.org.uk/implementation-scottish-national-living-wage-care-workers-pas/</a> [accessed 06 November 2017]
Office for National Statistics. (2017, October 26). Guide to interpreting Annual Survey of Hours and Earnings (ASHE) estimates. Retrieved from <a href="https://www.ons.gov.uk/employmentandlabourmarket/peopleinwork/earningsandworkinghours/methodologies/guidetointerpretingannualsurveyofhoursandearningsasheestimates#what-do-the-different-components-of-pay-mean" target="_blank">https://www.ons.gov.uk/employmentandlabourmarket/peopleinwork/earningsandworkinghours/methodologies/guidetointerpretingannualsurveyofhoursandearningsasheestimates#what-do-the-different-components-of-pay-mean</a> [accessed 8 November 2017]