Labour Market update: November 2017
This briefing provides an overview of the Scottish labour market from the latest regional labour market statistics from the Office for National Statistics (ONS).
Executive Summary
The unemployment rate in Scotland increased over the quarter to 4.0%. Despite the increase over the quarter in Scotland it is still one of the lowest rates since comparable records began in 1992. The increase in the unemployment rate was due to an increase in male unemployment, while women saw a decrease.
The employment rate was unchanged over the quarter but increased by 1.6 percentage points over the year.
Over the quarter the economic inactivity rate in Scotland fell by 0.1 percentage point whilst the UK's increased by 0.3 percentage points. Both now sit at 21.6%.
| Overall | Men | Women | ||||
|---|---|---|---|---|---|---|
| Rate (%) | Change over the qtr (% pts) | Rate (%) | Change over the qtr (% pts) | Rate (%) | Change over the qtr (% pts) | |
| Unemployment | 4.0% | +0.1 | 4.5% | +0.3 | 3.4% | -0.2 |
| Employment | 75.2% | 0.0 | 78.5% | -0.7 | 72.1% | +0.7 |
| Economic Inactivity | 21.6% | -0.1 | 17.7% | +0.3 | 25.4% | -0.6 |
What are the labour market measurements?
The International Labour Organisation provides the official definition of labour market statistics.
What is unemployment?
Level: Any individual aged 16 and over without a job who has been actively seeking work within the last four weeks and is available to start work within the next two weeks.
Rate: Number of unemployed individuals as a proportion of the total number of economically active people, which includes both the unemployed and those in work.
What is employment?
Level: Any individual aged 16 and over who is undertaking one hour or more a week of paid work.
Rate: Number of people in employment expressed as a percentage of all people aged 16-64.
What is economic inactivity?
Level: Any individual aged 16 to 64 who is not in employment, has not looked for work in the last four weeks, and is unable to start work within the next two weeks.
Rate: Number of people economically inactive expressed as a percentage of all people aged 16-64.
The main reasons for economic inactivity are:
being a student and not having or looking for a job
looking after the family and/or home
being sick (temporary and long-term)
being retired
being discouraged
You can find out more in formation on labour market statistics in the SPICe Labour market statistic briefing.
Unemployment
The number of unemployed people in Scotland increased by 2,000 over the quarter but fell by 20,000 over the year.
The unemployment rate for the UK is 4.3% and has not been this low since 1975. The rate in Scotland sits at 4.0%. Despite the increase over the quarter in Scotland it is still one of the lowest rates on record.
| Level ('000) | Quarter change ('000) | Year change ('000) | Rate (%) | Quarter change (% pts) | Year change (% pts) | |
|---|---|---|---|---|---|---|
| Scotland | 109 | +2 | -20 | 4.0% | +0.1 | -0.8 |
| UK | 1,425 | -59 | -181 | 4.3% | -0.2 | -0.6 |
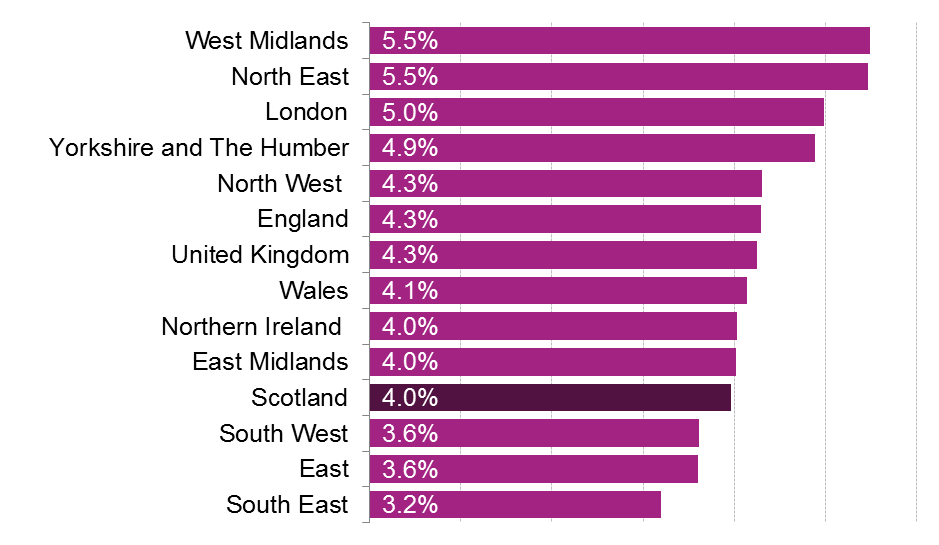
Looking at unemployment across the UK, Scotland has the 4th lowest unemployment rate of the nations and regions of the UK. The South East has the lowest rate at 3.2%, while the North East and West Midlands have the highest, both at 5.5%.
Unemployment by gender
Over the quarter in Scotland, the increase in the unemployment level was due to the number of unemployed men increasing by 4,000, while the number of women fell by 2,000.
Despite the increase in male employment level, the rate is still one of the lowest on record since comparable records began in 1992.
The unemployment rate for women is the lowest since comparable records began in 1992.
| Level ('000) | Quarter change ('000) | Year Change ('000) | Rate (%) | Quarter change (% pts) | Year change (% pts) | ||
|---|---|---|---|---|---|---|---|
| Scotland | Men | 64 | +4 | -8 | 4.5% | +0.3 | -0.6 |
| Women | 45 | -2 | -12 | 3.4% | -0.2 | -0.9 | |
| UK | Men | 770 | -48 | -109 | 4.3% | -0.2 | -0.6 |
| Women | 654 | -12 | -73 | 4.2% | -0.1 | -0.5 |
Unemployment by age
As this data is not seasonally adjusted it is compared with the same quarter in previous years.
The youth unemployment rate in Scotland is now at the lowest rates seen since comparable records began in 2001, when comparing the same quarter.
The unemployment rate for 25-34 year olds is the lowest since comparable records began in 2001, when comparing the same quarter.
Looking across the age groups, the youth unemployment rate is the only age group where Scotland significantly deviates from the UK (3.8 percentage points lower).
| Age group | Scotland | UK | |
|---|---|---|---|
| 16-24 | Rate | 9.4% | 13.2% |
| Year change (% pts) | -2.6 | -1.2 | |
| 25-34 | Rate | 4.0% | 3.8% |
| Year change (% pts) | -0.1 | -0.7 | |
| 35-49 | Rate | 3.0% | 2.8% |
| Year change (% pts) | -0.4 | -0.4 | |
| 50-64 | Rate | 3.6% | 3.0% |
| Year change (% pts) | -1.0 | -0.3 |
Employment
The number of people aged 16 and over in employment in Scotland increased by 2,000 over the quarter and 46,000 over the year.
The employment rate in Scotland was unchanged over the quarter while the UK saw a slight decrease of 0.1 percentage point.
Scotland's employment rate remains the highest since comparable records began in 1992.
| Level ('000) | Quarter change ('000) | Year change ('000) | Rate (%) | Quarter change (% pts) | Year change (% pts) | |
|---|---|---|---|---|---|---|
| Scotland | 2,652 | +2 | +46 | 75.2% | 0.0 | +1.6 |
| UK | 32,059 | +14 | +279 | 75.0% | -0.1 | +0.6 |
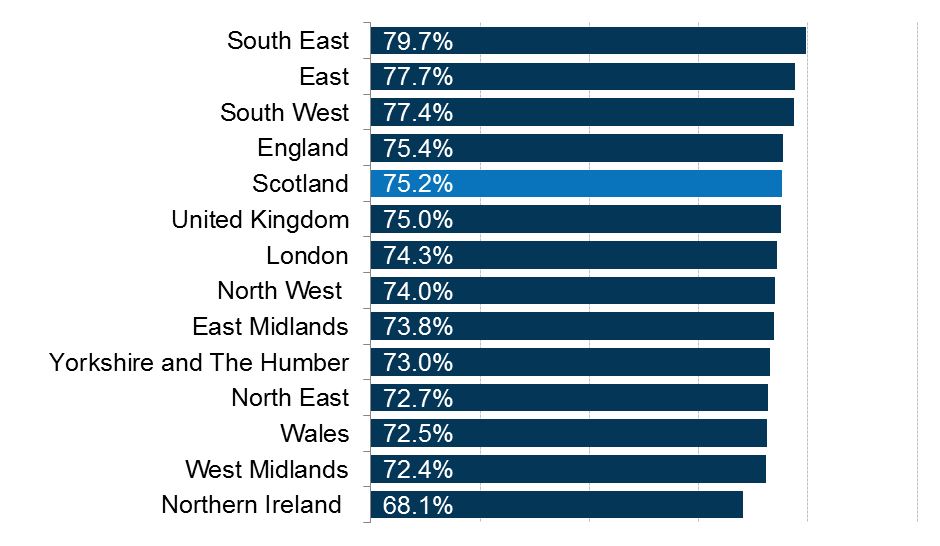
Looking at employment across the UK, Scotland has the 5th highest employment rate of the nations and regions of the UK. The South East has the highest rate at 79.7%, while Northern Ireland has the lowest at 68.1%.
Employment by gender
Employment levels and rates are higher for men than for women at both the Scottish and UK levels.
The employment level in Scotland increased by 2,000 over the quarter as 9,000 more women entered employment while 7,000 men left employment.
The male employment rate, at 78.5%, is one of the highest on record but is still below the pre-recession peak of 80.3% (Apr-Jun 2007) and is below the UK male employment rate. The female employment rate however is higher in Scotland than in the UK.
| Level ('000) | Quarter change ('000) | Year change ('000) | Rate (%) | Quarter change (% pts) | Year change (% pts) | ||
|---|---|---|---|---|---|---|---|
| Scotland | Men | 1,362 | -7 | +22 | 78.5% | -0.7 | +1.4 |
| Women | 1,290 | +9 | +24 | 72.1% | +0.7 | +1.8 | |
| UK | Men | 16,984 | -37 | +81 | 79.5% | -0.3 | +0.3 |
| Women | 15,075 | +23 | +198 | 70.6% | +0.1 | +0.9 |
Employment by age
As this data is not seasonally adjusted it is compared with the same quarter in previous years.
The employment rate for 25-34 year olds is the highest since comparable records began in 2001, when comparing the same quarter.
The employment rate for 50-64 year olds is the highest since comparable records began in 2001, when comparing the same quarter.
Looking across the age groups, the youth employment rate is the only age group where Scotland significantly deviates from the UK (5.9 percentage points higher).
| Age group | Scotland | UK | |
|---|---|---|---|
| 16-24 | Rate (%) | 61.2% | 55.3% |
| Year change (% pts) | +1.2 | -0.6 | |
| 25-34 | Rate (%) | 82.9% | 83.6% |
| Year change (% pts) | +2.2 | +1.6 | |
| 35-49 | Rate (%) | 82.3% | 84.3% |
| Year Change (% pts) | 0.0 | +0.6 | |
| 50-64 | Rate (%) | 71.5% | 71.2% |
| Year Change (% pts) | +3.1 | +0.4 |
Economic inactivity
The number of people economically inactive in Scotland decreased by 5,000 over the quarter and 35,000 over the year, which is one of the biggest annual decreases since comparable records began in 1992.
Over the quarter the economic inactivity rate in Scotland fell by 0.1 percentage point whilst the UK's increased by 0.3 percentage points.
| Level ('000) | Quarter change ('000) | Year change ('000) | Rate (%) | Quarter change (% pts) | Year change (% pts) | |
|---|---|---|---|---|---|---|
| Scotland | 738 | -5 | -35 | 21.6% | -0.1 | -1.0 |
| UK | 8,883 | +117 | -20 | 21.6% | +0.3 | -0.1 |
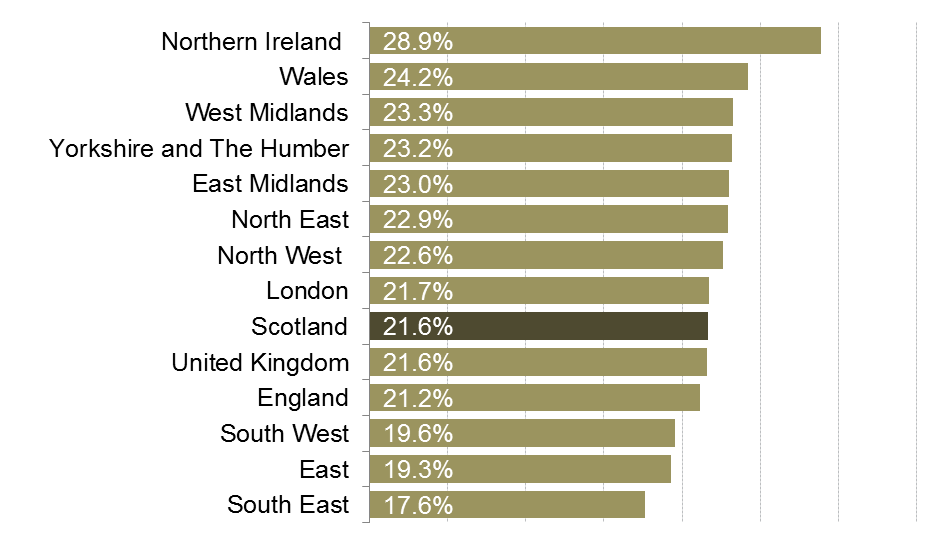
Looking at economic inactivity across the UK, the Scottish rate is around the UK average. Northern Ireland has the highest rate at 28.9%, while the South East has the lowest at 17.6%.
Economic inactivity by gender
Economic inactivity rates are higher for women than for men.
The number of economically inactive people in Scotland decreased over the quarter, due to 11,000 women leaving economic inactivity. However, 6,000 men became economically inactive.
Over the year 15,000 men in Scotland left inactivity, which is one of the biggest annual decreases since comparable records began in 1992.
Despite the increase in the inactivity rate for women it is still 2.0 percentage points higher than Jan-Mar 2015 (23.4%) when it was at its lowest since comparable records began in 1992.
| Level ('000) | Quarter change ('000) | Year change ('000) | Rate (%) | Quarter change (% pts) | Year change (% pts) | ||
|---|---|---|---|---|---|---|---|
| Scotland | Men | 295 | +6 | -15 | 17.7% | +0.3 | -0.9 |
| Women | 443 | -11 | -19 | 25.4% | -0.6 | -1.1 | |
| UK | Men | 3,445 | +120 | +72 | 16.8% | +0.6 | +0.3 |
| Women | 5,437 | -2 | -92 | 26.3% | 0.0 | -0.5 |
Economic inactivity by age
As this data is not seasonally adjusted it is compared with the same quarter in previous years.
The economic inactivity rate for 16-24 year olds is the highest since comparable records began in 2001, when comparing the same quarter.
The economic inactivity rate for 50-64 year olds is the lowest since comparable records began in 2001, when comparing the same quarter, fall by 13.1 percentage points since 2001.
Looking across the age groups, the youth inactivity rate is the only age group where Scotland significantly deviates from the UK (3.8 percentage points lower).
| Age Group | Scotland | UK | |
|---|---|---|---|
| 16-24 | Rate (%) | 32.5% | 36.3% |
| Year change (% pts) | +0.6 | +1.5 | |
| 25-34 | Rate (%) | 13.7% | 13.1% |
| Year change (% pts) | -2.2 | -1.0 | |
| 35-49 | Rate (%) | 15.2% | 13.2% |
| Year change (% pts) | +0.3 | -0.2 | |
| 50-64 | Rate (%) | 25.9% | 26.6% |
| Year change (% pts) | -2.4 | -0.2 |
Claimant Count
The Claimant Count figures presented here are the experimental statistics from the ONS for Jobseekers Allowance, plus Universal Credit claimants who are out of work.
Under Universal Credit a broader span of claimants are required to look for work than under Jobseekers Allowance. As Universal Credit Full Service is rolled out in particular areas, the number of people recorded as being on the Claimant Count is therefore likely to rise.
This is not an official measure of unemployment, but it does provide accurate information on the labour market at a local level.
Scotland and UK comparison
The seasonally adjusted claimant count rate for October in Scotland was unchanged over the quarter and year.
The Scottish claimant count rate is higher than the UK rate.
| Level | Month Change | Year Change | Rate (%) | Month Change (% pts) | Year Change (% pts) | |
|---|---|---|---|---|---|---|
| Scotland | 80,300 | 0 | +100 | 2.3% | 0.0 | 0.0 |
| UK | 806,100 | +1,100 | +23,800 | 1.9% | 0.0 | 0.0 |
Constituency data: Employment rate
The constituency data for Scotland comes from the Annual Population Survey (APS). The APS datasets are produced quarterly, with each dataset containing 12 months of data.
The latest APS data is for Jul 2016-Jun 2017.
The Orkney Islands have the highest employment rate at 87.0% while Glasgow Kelvin has the lowest at 60.0%. Edinburgh Southern saw the biggest increase over the year, while Airdrie and Shotts saw the largest decrease.
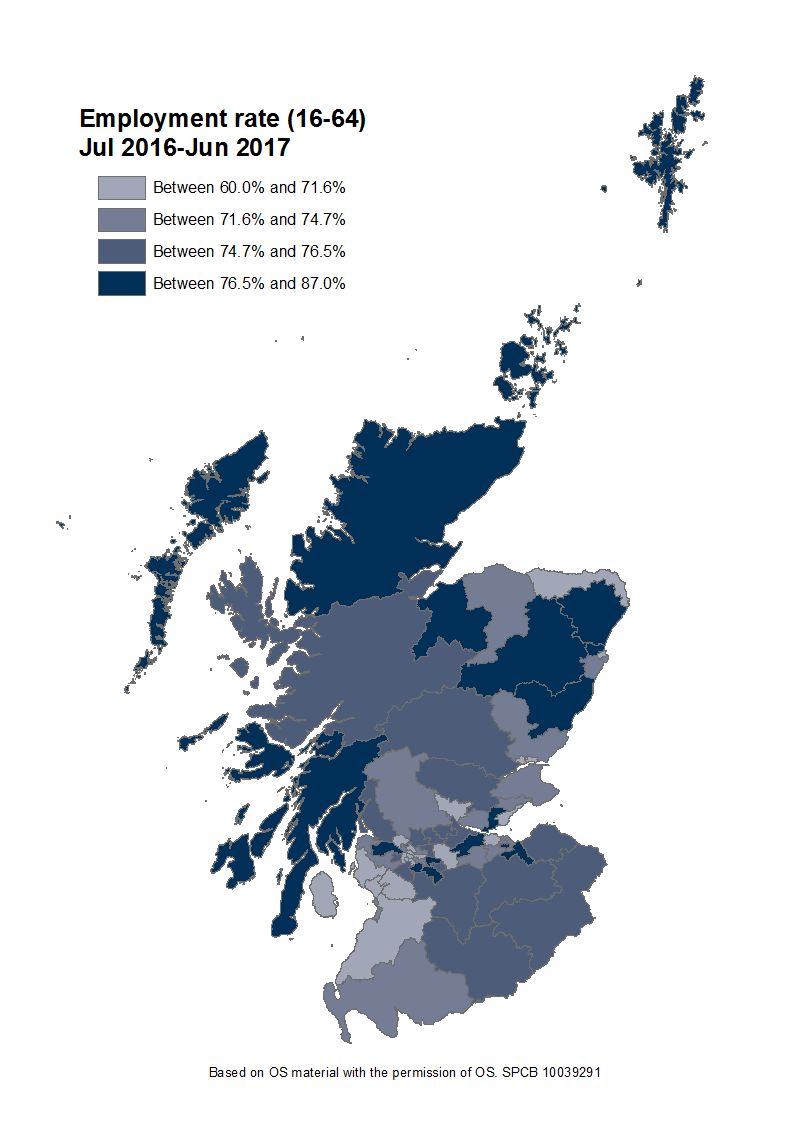
Find out the latest labour market data for your constituency.
Guest Indicator: Self-Employment
This section looks at self-employment figures from the APS.
The ONS classifies self-employment as people who in their main employment work on their own account, whether or not they have employees. As the data comes from the APS the following data is based on self-reported self employment. Scotland has the 2nd lowest proportion of workers who are self-employed across the UK.
Figure 5: Self-employment rates across the regions and nations of the UK - Jul 2016-Jun 2017 (16+)
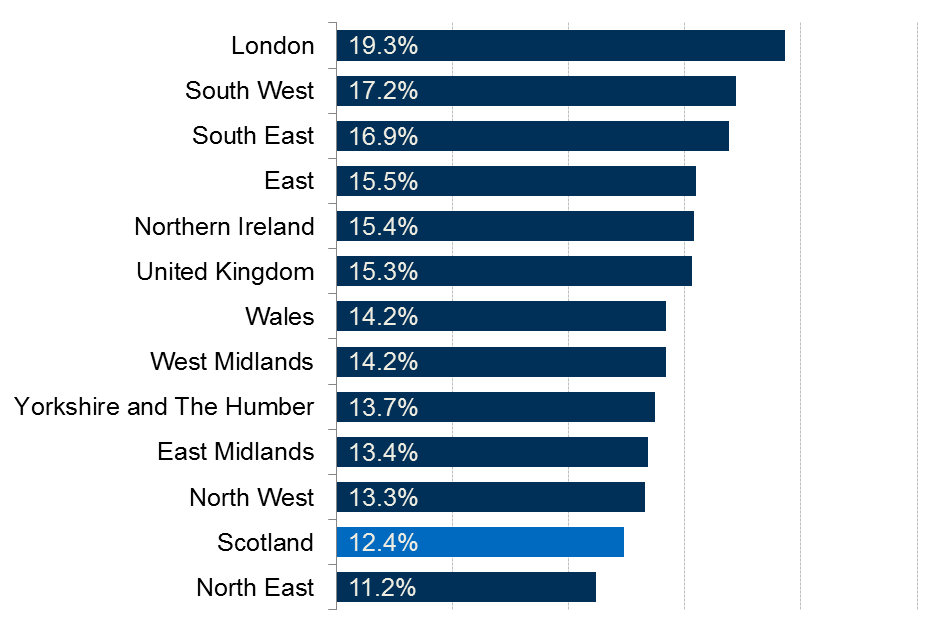
The latest figures, Jul 2016-Jun 2017, show that 12.4% of total employment in Scotland is accounted for by self-employment. This is below the UK average of 15.3%. London has the highest proportion at 19.3% while the North East has the lowest at 11.2%.
Figure 6: Growth in the number of self-employed worker across the regions and nations of the UK - Jul 2004-Jun 2005 to Jul 2016-Jun 2017 (16+)
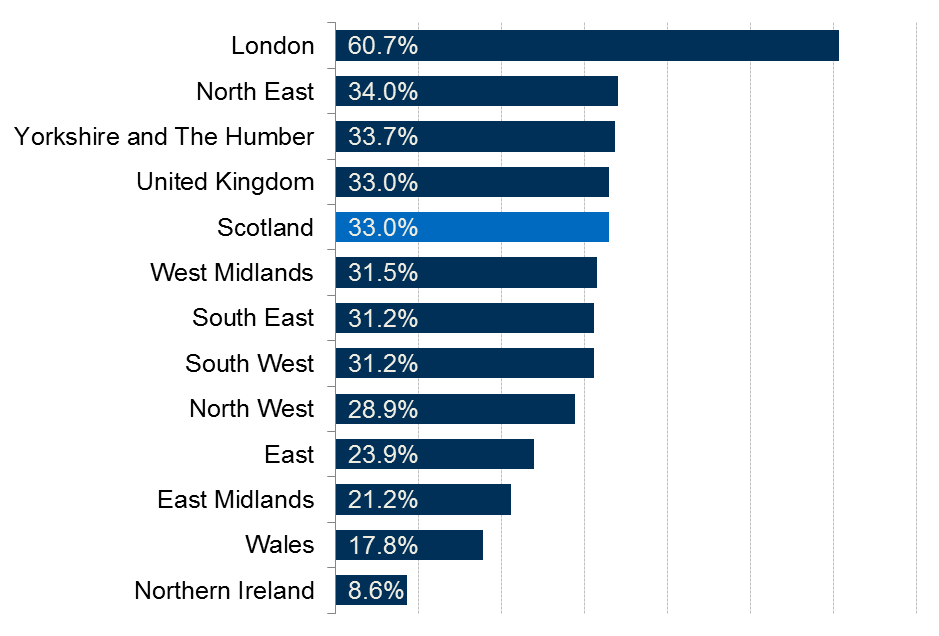
Since Jul 2004-Jun 2005 in Scotland there has been a 33% increase in the number of people who are self-employed which is in line with the UK average. London has seen the biggest increase at 60.7% while Northern Ireland has seen the lowest at 8.6%.
Figure 7: Growth in the number of self-employed worker by gender - Jul 2004-Jun 2005 to Jul 2016-Jun 2017 (16+)
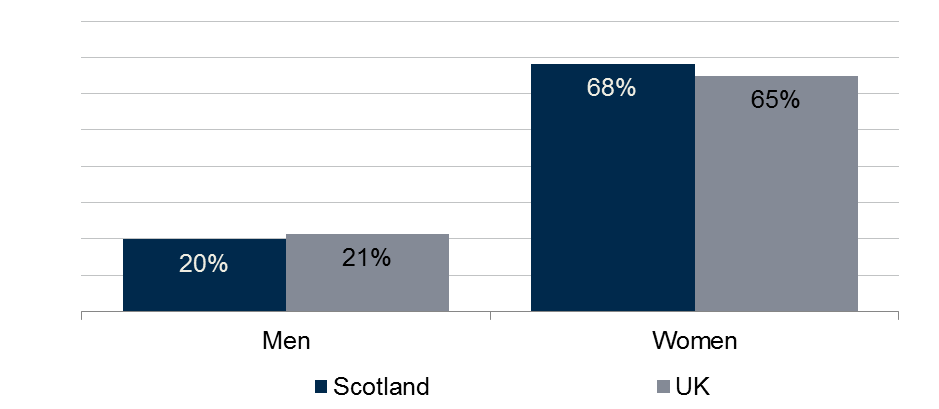
In Scotland women make up 34% of those that as self-employed which is around the same as in the UK (33%). The number of self-employed women in Scotland has increased by 68% between Jul 2004-Jun 2005 and Jul 2016-Jun 2017, higher than the UK. Between Jul 2004-Jun 2005 and Jul 2016-Jun 2017, Scotland has seen a higher increase in the number of self-employed women than the UK as a whole.
Figure 8: Proportion of the increase in total female employment between Jun 2005 and Jul 2016-Jun 2017 which has come from self-employment (16+)
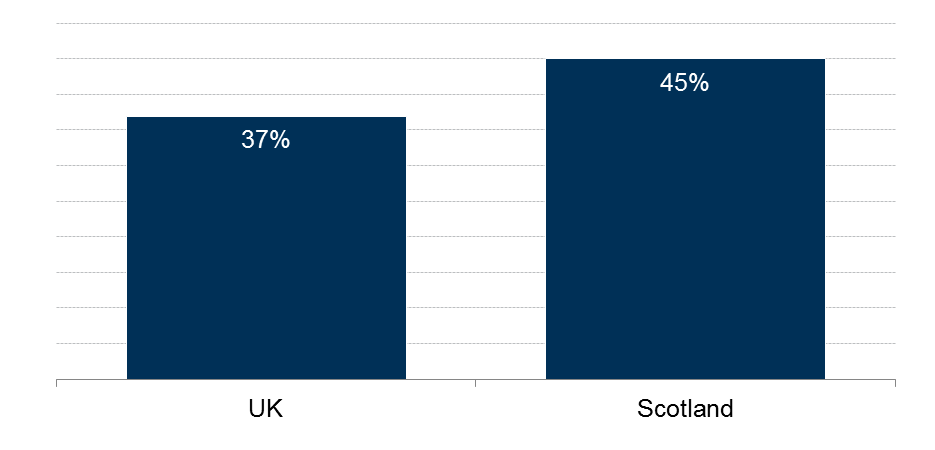
In Scotland self-employment accounts for 45% of the increase in the number of women entering employment between Jul 2004-Jun 2005 and Jul 2016-Jun 2017 compared to 37% in the UK as a whole.