Labour Market update: October 2017
This briefing provides an overview of the Scottish labour market from the latest regional labour market statistics from the Office for National Statistics (ONS).
Executive Summary
Unemployment in Scotland increased over the quarter. However there were contrasting trends by gender. The number of unemployed women fell by 1,000, while the number of unemployed men increased by 10,000.
The employment rate in Scotland increased by 1.2 percentage points over the quarter and is now the highest since comparable records began in 1992. The majority (70%) of the increase in the employment level came from women finding work.
Over the quarter the economic inactivity rate in Scotland fell by 1.4 percentage points which is the largest decrease since comparable records began.
| Overall | Men | Women | ||||
|---|---|---|---|---|---|---|
| Rate | Change over the qtr (% pts) | Rate | Change over the qtr (% pts) | Rate | Change over the qtr (% pts) | |
| Unemployment | 4.1% | +0.3 | 4.7% | +0.6 | 3.4% | -0.1 |
| Employment | 75.3% | +1.2 | 78.7% | +0.9 | 72.0% | +1.4 |
| Economic Inactivity | 21.5% | -1.4 | 17.5% | -1.3 | 25.4% | -1.4 |
What are the labour market measurements?
The International Labour Organisation provides the official definition of labour market statistics.
What is Unemployment?
Level: Any individual aged 16 and over without a job who has been actively seeking work within the last four weeks and is available to start work within the next two weeks
Rate: Number of unemployed individuals as a proportion of the total number of economically active people, which includes both the unemployed and those in work.
What is Employment?
Level: Any individual aged 16 and over who is undertaking one hour or more a week of paid work
Rate: Number of people in employment expressed as a percentage of all people aged 16-64
What is Economic Inactivity?
Level: Any individual aged 16 to 64 who is not in employment, has not looked for work in the last four weeks, and is unable to start work within the next two weeks.
Rate: Number of people economically inactive expressed as a percentage of all people aged 16-64
The main reasons for economic inactivity are:
Being a student and not having or looking for a job
Looking after the family and/or home
Being sick (temporary and long-term)
Being retired
Being discouraged
You can find out more in formation on labour market statistics in the SPICe Labour market statistics briefing.
Unemployment
The number of unemployed people in Scotland increased by 9,000 over the quarter but fell by 15,000 over the year.
The unemployment rate for the UK has fallen to 4.3% and was the joint lowest since 1975.
Despite the rise over the quarter the rate in Scotland sits at 4.1%, which is one of the lowest rates on record. Over the year, the rate fell by 0.6 percentage points.
| Level ('000) | Quarter change ('000) | Year change ('000) | Rate | Quarter change (% pts) | Year change (% pts) | |
|---|---|---|---|---|---|---|
| Scotland | 113 | +9 | -15 | 4.1% | +0.3 | -0.6 |
| UK | 1,443 | -52 | -215 | 4.3% | -0.2 | -0.7 |
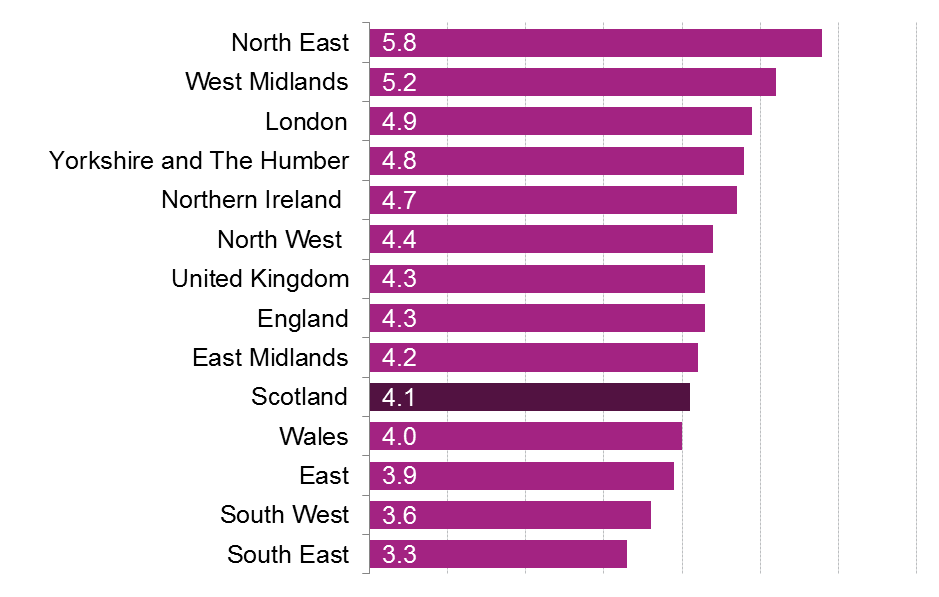
Looking at unemployment across the UK, Scotland has the 5th lowest unemployment rate of the nations and regions of the UK. The South East has the lowest rate at 3.3%, while the North East has the highest at 5.8%.
Unemployment by Gender
Over the quarter the increase in unemployment was due to an increase in the number of unemployed men, while the number of unemployed woman fell. This is the first increase in the number of unemployed men in Scotland since Dec-Feb 2016.
The unemployment rate for women in Scotland (3.4%) is lower than the UK wide rate for women, while the rate for men is higher. (4.7% versus 4.2%)
| Level ('000) | Quarter change ('000) | Year Change ('000) | Rate | Quarter change (% pts) | Year change (% pts) | ||
|---|---|---|---|---|---|---|---|
| Scotland | Men | 68 | +10 | -5 | 4.7% | +0.6 | -0.4 |
| Women | 45 | -1 | -10 | 3.4% | -0.1 | -0.8 | |
| UK | Men | 775 | -56 | -118 | 4.4% | -0.3 | -0.6 |
| Women | 668 | +4 | -98 | 4.2% | 0.0 | -0.7 |
Unemployment by age
As this data is not seasonally adjusted it is compared with the same quarter in previous years.
The youth unemployment rate (16-24) in Scotland is now at the lowest rate since comparable records began in 2001, when comparing the same quarter.
Looking across the age groups, the youth unemployment rate is the only age group where Scotland significantly deviates from the UK (2.7 percentage points lower).
| Age group | Scotland | UK | |
|---|---|---|---|
| 16-24 | Rate | 10.6% | 13.3% |
| Year change (% pts) | -1.6 | -1.6 | |
| 25-34 | Rate | 3.8% | 3.7% |
| Year change (% pts) | +0.5 | -0.7 | |
| 35-49 | Rate | 2.8% | 2.9% |
| Year change (% pts) | -0.4 | -0.5 | |
| 50-64 | Rate | 3.2% | 3.0% |
| Year change (% pts) | -1.4 | -0.3 |
Employment
The number of people aged 16 and over in employment in Scotland increased by 35,000 over the quarter and 40,000 over the year.
The employment rate in Scotland increased by 1.2 percentage points over the quarter and is now the highest since comparable records began in 1992. The annual increase in the rate is the largest since 2013.
The UK employment rate is the highest since comparable records began in 1971.
| Level ('000) | Quarter change ('000) | Year change ('000) | Rate | Quarter change (% pts) | Year change (% pts) | |
|---|---|---|---|---|---|---|
| Scotland | 2,655 | +35 | +40 | 75.3% | +1.2 | +1.4 |
| UK | 32,105 | +94 | +317 | 75.1% | +0.2 | +0.7 |
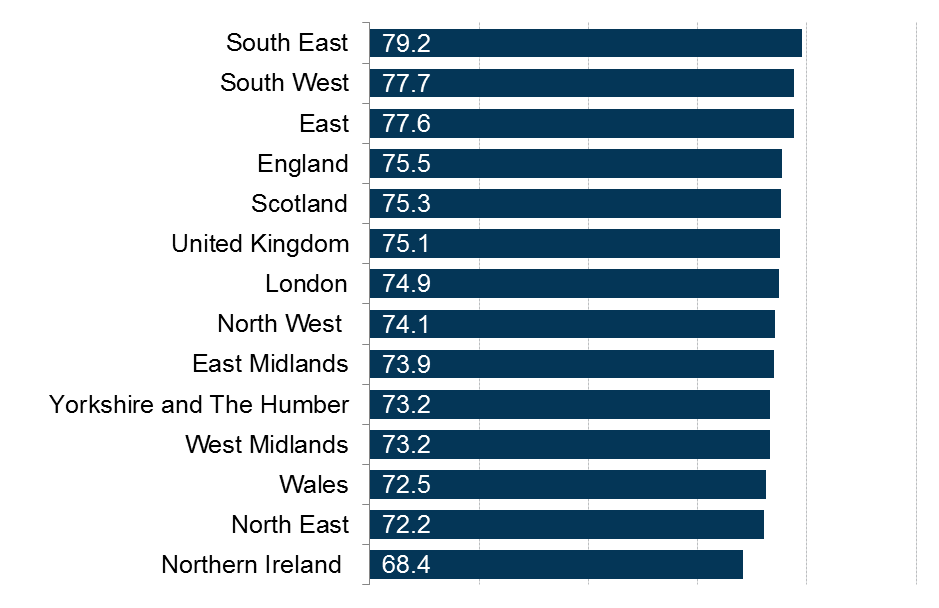
Looking at employment across the UK, Scotland has the 5th highest employment rate of the nations and regions of the UK. The South East has the highest rate at 79.2%, while Northern Ireland has the lowest at 68.4%.
Employment by Gender
Employment levels and rates are higher for men than for women at both the Scottish and UK level.
The employment level in Scotland increased mainly due to an extra 24,000 women entering employment, while an extra 12,000 men found work
The employment rate for women in Scotland is currently one of the highest on record, however the rate for men in still below the pre-recession peak of 80.3%
The UK saw an overall increase in employment of 317,000 people over the year, mainly due to 246,000 extra women finding work.
| Level ('000) | Quarter change ('000) | Year change ('000) | Rate | Quarter change (% pts) | Year change (% pts) | ||
|---|---|---|---|---|---|---|---|
| Scotland | Men | 1,361 | +12 | +14 | 78.7% | +0.9 | +1.1 |
| Women | 1,294 | +24 | +26 | 72.0% | +1.4 | +1.6 | |
| UK | Men | 17,005 | +16 | +71 | 79.6% | +0.1 | +0.2 |
| Women | 15,099 | +78 | +246 | 70.7% | +0.3 | +1.1 |
Employment by Age
As this data is not seasonally adjusted it is compared with the same quarter in previous years.
The 3.2 percentage point increase in the employment rate for 50-64 year olds is the biggest since 2003 (Jun-Aug 2002 to Jun-Aug 2003: +3.5 percentage points). The employment rate, for this age group, is now the highest since comparable record began in 2001 , when comparing the same quarter.
Looking across the age groups, the youth employment rate is the only age group where Scotland significantly deviates from the UK (5.2 percentage points higher).
| Age group | Scotland | UK | |
|---|---|---|---|
| 16-24 | Rate | 60.9% | 55.7% |
| Year change (% pts) | +0.1 | -0.1 | |
| 25-34 | Rate | 82.7% | 83.6% |
| Year change (% pts) | +1.1 | +1.5 | |
| 35-49 | Rate | 83.2% | 84.6% |
| Year Change (% pts) | +0.4 | +0.7 | |
| 50-64 | Rate | 71.6% | 71.1% |
| Year Change (% pts) | +3.2 | +0.4 |
Economic Inactivity
The number of people economically inactive in Scotland fell by 47,000 over the quarter and 29,000 over the year.
Over the quarter the economic inactivity rate in Scotland fell by 1.4 percentage points, which is the largest decrease since comparable records began.
| Level ('000) | Quarter change ('000) | Year change ('000) | Rate | Quarter change (% pts) | Year change (% pts) | |
|---|---|---|---|---|---|---|
| Scotland | 735 | -47 | -29 | 21.5% | -1.4 | -0.8 |
| UK | 8,812 | -17 | -13 | 21.4% | -0.1 | -0.1 |
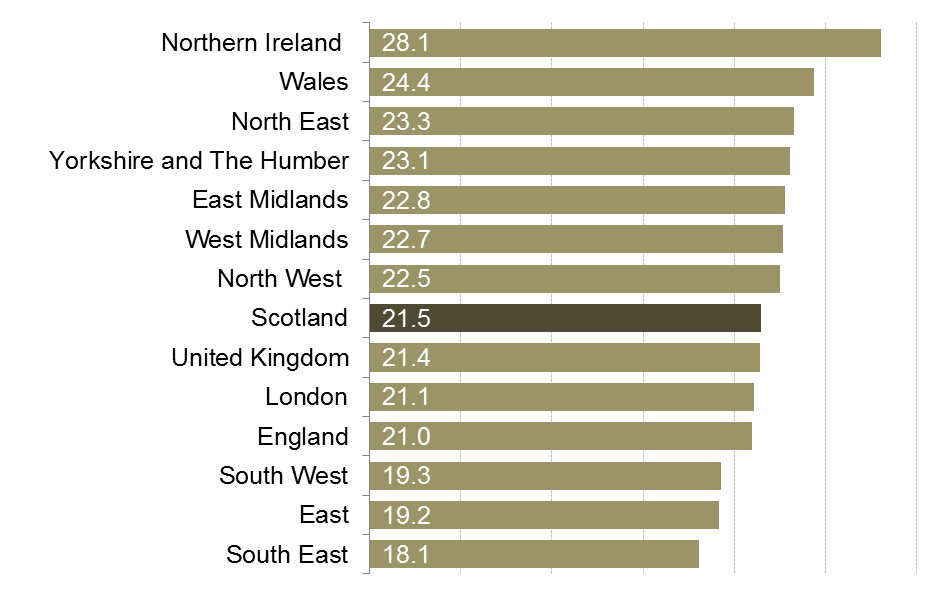
Looking at economic inactivity across the UK, the Scottish rate is around the UK average. Northern Ireland has the highest rate at 28.1%, while the South East has the lowest at 18.1%.
Economic Inactivity by Gender
Economic inactivity rates are higher for women than for men.
The number of economically inactive people in Scotland decreased over the quarter as 25,000 woman and 22,000 men left economic inactivity.
Since Dec-Feb 2017, when the male inactivity rate was at its highest in Scotland, the rate has decreased by 2.0 percentage points.
The fall in the female inactivity rate in Scotland is the largest since Jun-Aug 2013.
| Level ('000) | Quarter change ('000) | Year change ('000) | Rate | Quarter change (% pts) | Year change (% pts) | ||
|---|---|---|---|---|---|---|---|
| Scotland | Men | 291 | -22 | -11 | 17.5% | -1.3 | -0.6 |
| Women | 444 | -25 | -18 | 25.4% | -1.4 | -1.0 | |
| UK | Men | 3,410 | +51 | +93 | 16.7% | +0.2 | +0.5 |
| Women | 5,403 | -68 | -106 | 26.1% | -0.3 | -0.6 |
Economic Inactivity by Age
As this data is not seasonally adjusted it is compared with the same quarter in previous years.
The youth economic inactivity rate (16-24) in Scotland (31.9%) is at its highest since comparable record began in 2001, when comparing the same quarter.
The economic inactivity rate for 50-64 year old (26.1%) is at its lowest since comparable record began in 2001, when comparing the same quarter.
| Age Group | Scotland | UK | |
|---|---|---|---|
| 16-24 | Rate | 31.9% | 35.7% |
| Year change (% pts) | +1.1 | +1.4 | |
| 25-34 | Rate | 14.0% | 13.1% |
| Year change (% pts) | -1.6 | -0.9 | |
| 35-49 | Rate | 14.4% | 12.9% |
| Year change (% pts) | -0.1 | -0.3 | |
| 50-64 | Rate | 26.1% | 26.7% |
| Year change (% pts) | -2.3 | -0.2 |
Claimant Count
The Claimant Count figures presented here are the experimental statistics from the ONS for Jobseekers Allowance, plus Universal Credit claimants who are out of work.
Under Universal Credit a broader span of claimants are required to look for work than under Jobseekers Allowance. As Universal Credit Full Service is rolled out in particular areas, the number of people recorded as being on the Claimant Count is therefore likely to rise.
This is not an official measure of unemployment, but it does provide accurate information on the labour market at a local level.
Scotland and UK comparison
The seasonally adjusted claimant count rate for September in Scotland was unchanged over the month and year.
There was no change over the quarter or year in the claimant count rate in the UK.
The Scottish claimant count rate is higher than the UK rate (2.3% versus 1.9%).
| Level | Month Change | Year Change | Rate | Month Change (% pts) | Year Change (% pts) | |
|---|---|---|---|---|---|---|
| Scotland | 80,500 | +600 | +700 | 2.3% | 0.0 | 0.0 |
| UK | 804,100 | +1,700 | +25,700 | 1.9% | 0.0 | 0.0 |
Constituency data: Unemployment Rate
The constituency data for Scotland comes from the Annual Population Survey (APS). The APS datasets are produced quarterly, with each dataset containing 12 months of data. The latest APS data is for July 2016 to June 2017.
Kirkcaldy has the highest unemployment rate at 10.6%, while Argyll and Bute has the lowest at 1.6%.
Kirkcaldy saw the biggest increase over the year, while Glasgow Maryhill and Springburn saw the largest decrease.
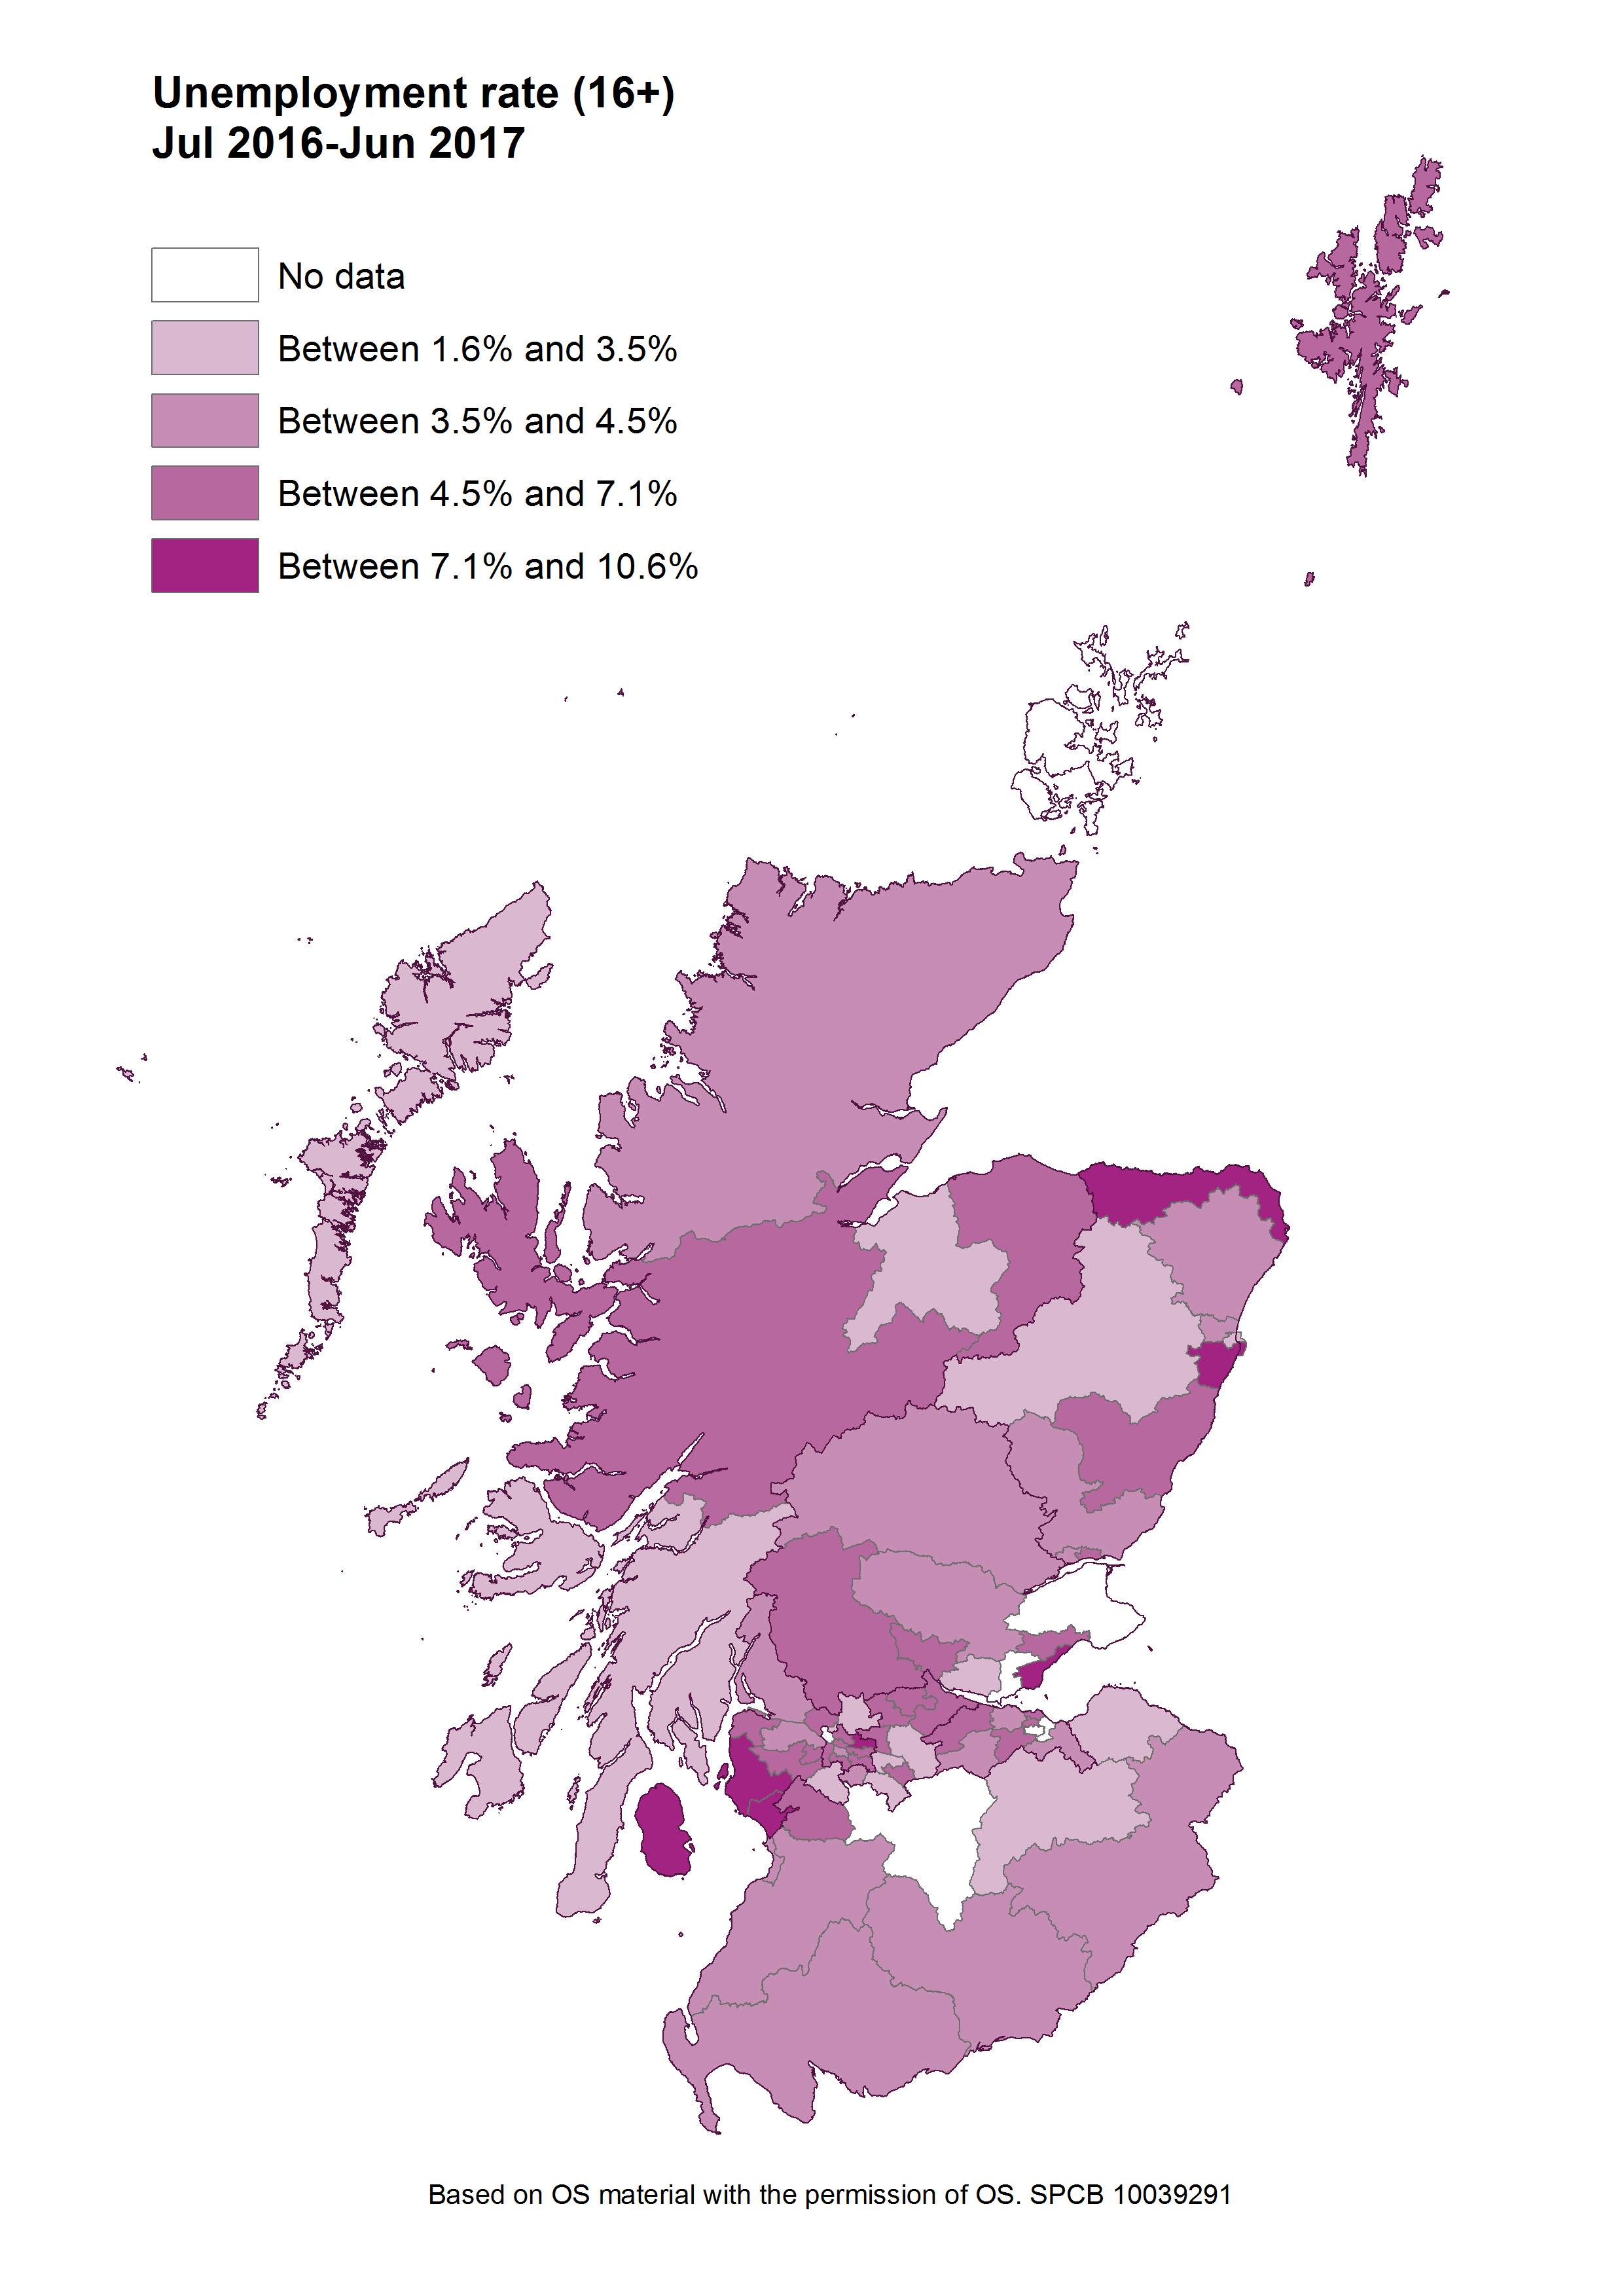
Find out the latest labour market data for your constituency.
Guest Indicator: Inactivity in Scotland
This quarter has seen a large decrease in economical inactivity on the previous quarter. However it still accounts for over 25% of those aged 16-64 in Scotland and has done since Dec-Feb 2016. This section examines in more detail what inactivity in Scotland looks likes.
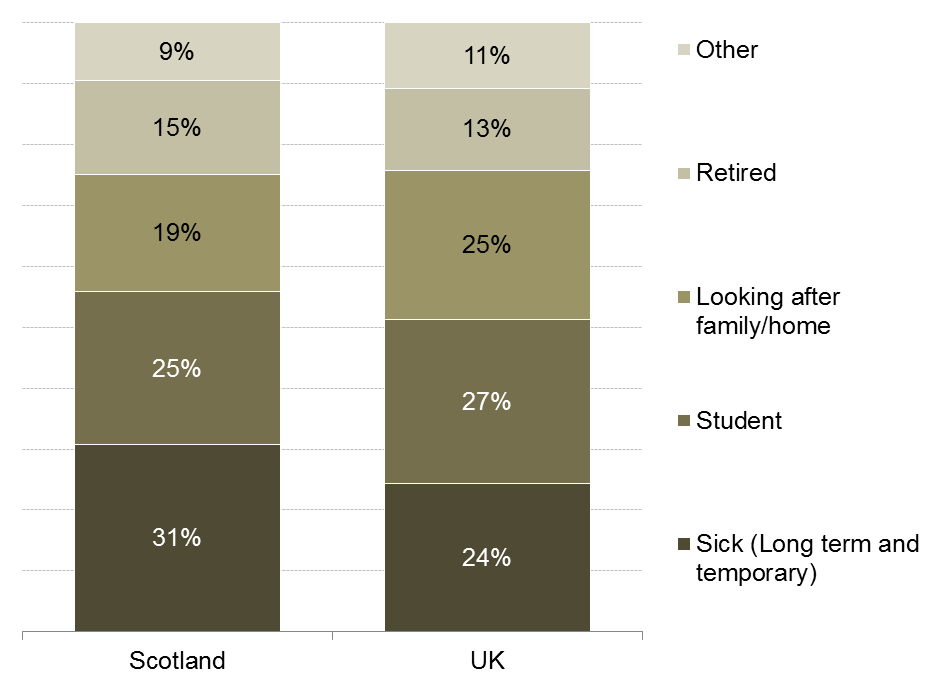
In Scotland people who are inactive are more likely to be sick, both long term and temporary, than the UK wide figure. While for the UK as a whole people are more likely to be looking after the family/home or studying.
Figure 5: Comparison between Scotland and the UK for reasons for inactivity - July 2016 to June 2017
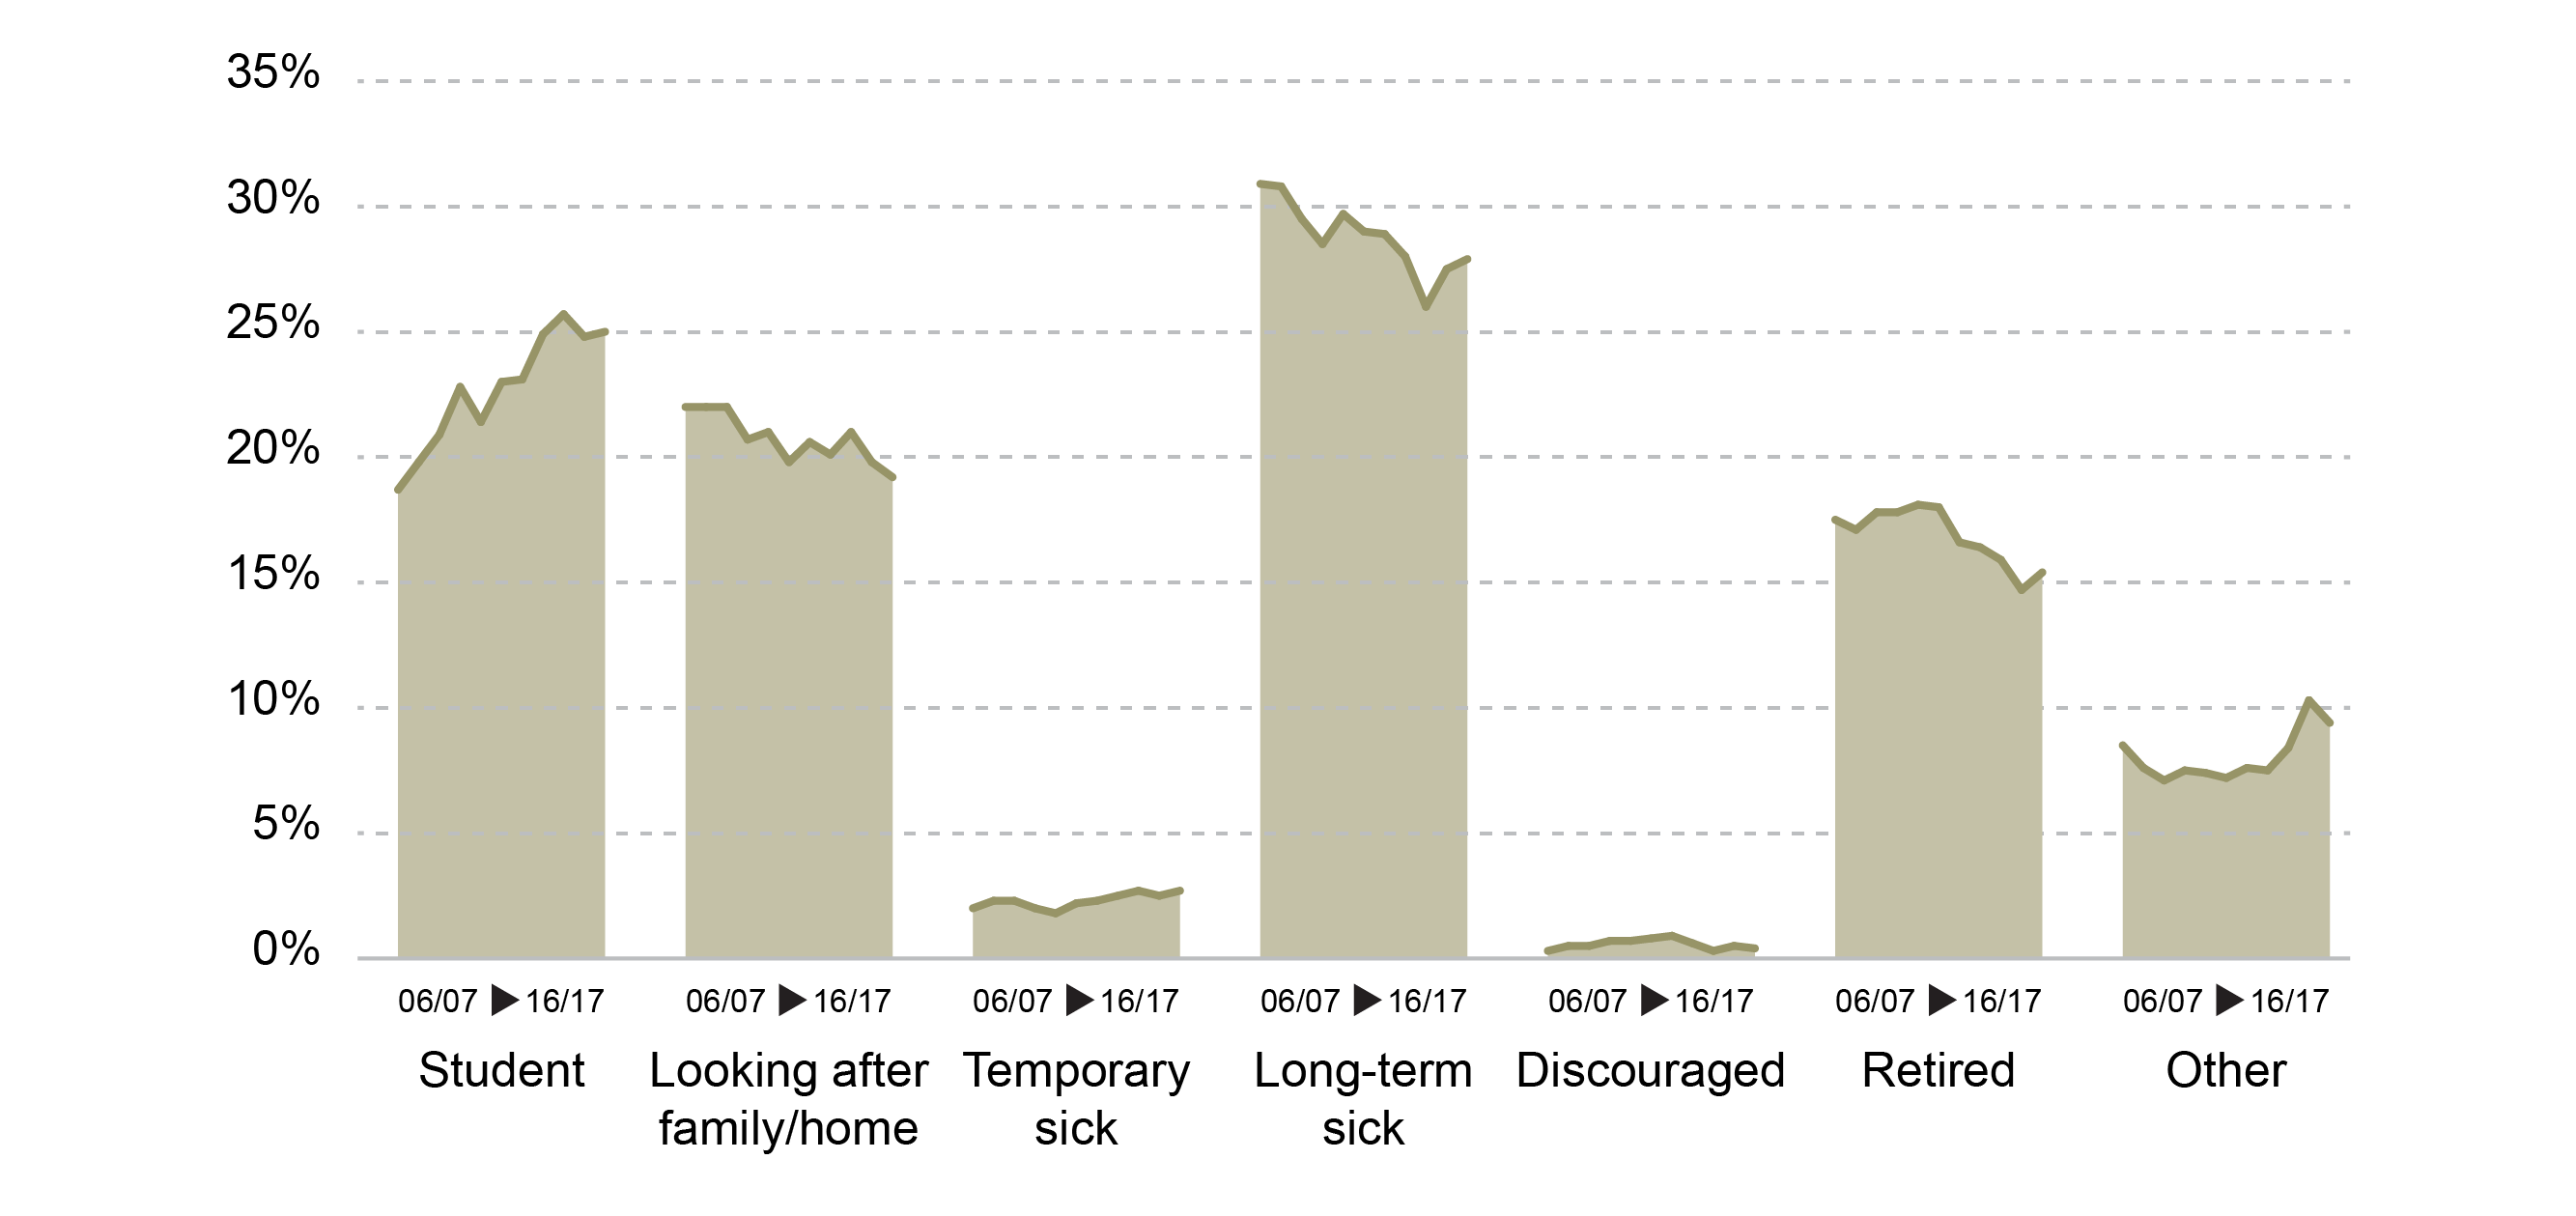
While long-term sickness has been the most common reason for economic inactivity in Scotland for the past 10 year, it has fallen by 2.9 percentage points, or 11,00 people over the period.
The biggest increase has come from people who are students, seeing a 5.2% increase and now accounting from 25% of all people who are economically inactive in Scotland, over the past 10 years. This is an increase of 49,000 people
Figure 6: Change in proportion on those inactive in Scotland by reason - July 2006 to June 2007 July - 2016 to June 2017
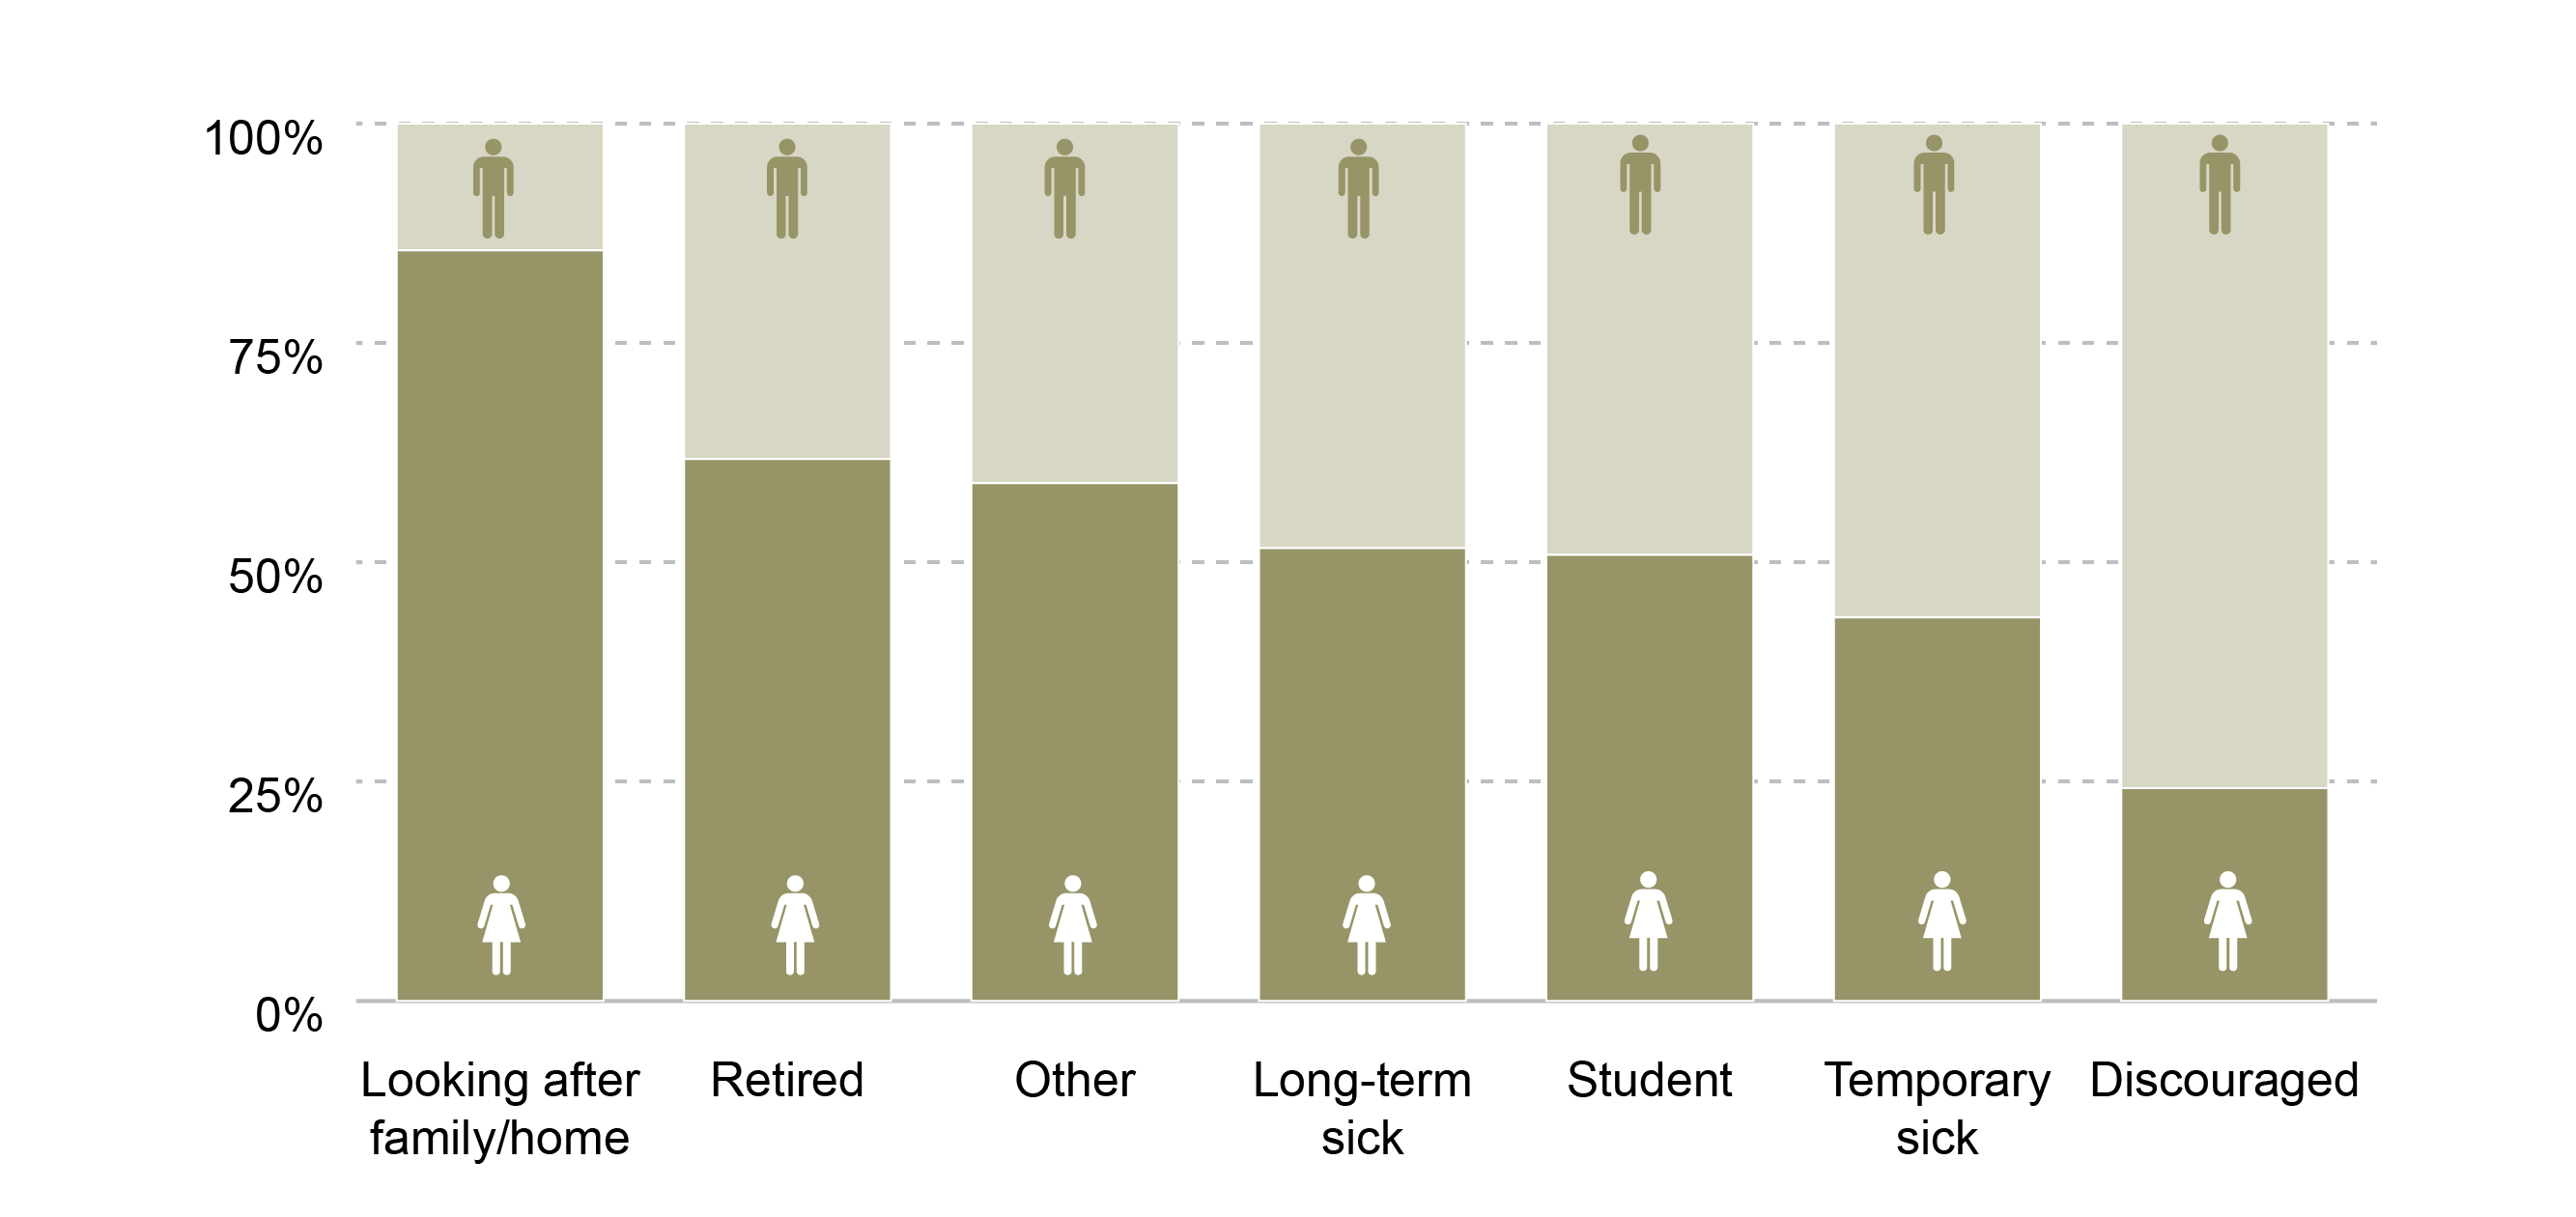
While women are more likely to be inactive than men there is a gender split for each reason.
85 % of those looking after the family/home are women, although this has decreased slightly over the past 10 years.
Men make up the majority of those who are temporally sick or discouraged , but these categories account for a small proportion of the total number of people who are inactive.
Figure 7: Gender spilt of inactive by reason in Scotland - July 2016 to June 2017