Scotland's Employment by Industry and Geography
This paper provides an overview of employment in Scotland by industry sector and geography. Topics covered include: trends in other regions of Great Britain, nature of full-time and part-time employment, changing industry employment structure, local authority and Scottish Parliamentary Constituency employment, and the the contribution of both the public and private sectors to Scottish employment.
Executive Summary
Employment in Scotland totalled 2.6 million in 2016, an increase of 1% on the previous year. This represented the highest employment count in the available data series (2009 to 2016). Over the 7-year period to 2016, Scotland had the second lowest rate of employment growth across Great Britain at 3%, with only the North East having a lower rate at 2%.
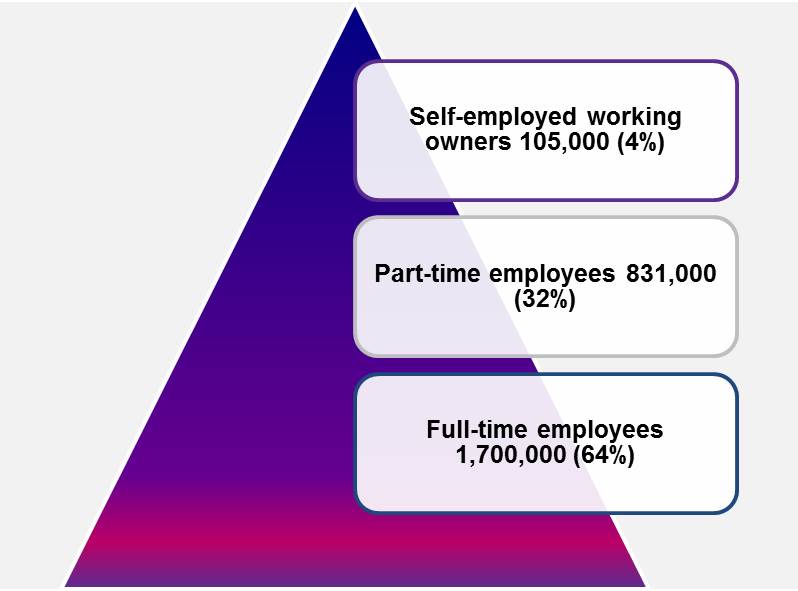
The majority (64%) of those in employment were full-time employees. Just under a third (32%) were part-time and the remaining 4% were self-employed working owners. In the 7-year period to 2016, in absolute terms there has been an additional 70,000 people in part-time employment. However, part-time employment as a proportion of all employment has only changed marginally from 31% to 32% over the period in question.
Health was the largest industry (16% of all employment) in terms of contribution to Scottish employment. Other industries with large employment bases were: retail (9%), accommodation & food services (7%), business administration & support services (7%), education (7%), manufacturing (7%), and professional, scientific & technical (7%).
Sports activities and amusement and recreation activities created an additional 10,000 jobs over the year to 2016. This main drivers of employment growth within this category were activities of sport clubs and operation of sports facilities.
Employment in food and beverage serving activities declined by 18,000 between 2015 and 2016. The majority (12,000) of this decline related to restaurants and mobile food services. And the remaining 6,000 to beverage activity employment.
The top three local authority areas for employment were: Glasgow City (16.7% of all Scottish employment), City of Edinburgh (13.2%), and Aberdeen City (7.1%). On the other end of the scale, Orkney Islands and Na h-Eileanan Siar both had the smallest proportions of employment at 0.4%.
Glasgow Kelvin was the largest parliamentary constituency with 8% of total Scottish employment.
One in four people in Scotland worked in the public sector in 2016. Employment in Scotland's public sector has declined by 10% (approximately -70,000) since 2009. Over the same period private sector employment grew by 7% (+134,500). Scotland had the second highest level of public sector employment amongst the regions of Great Britain in 2016
Introduction
Overview
This paper provides an overview of employment in Scotland by industry sector and geography, over the period 2009 to 2016.
The analysis looks at trends in other regions of Great Britain, and the nature of full-time and part-time employment in Scotland. Amongst other things, it shows since 2009, Scotland had the second lowest rate of employment growth across Great Britain at 3%. Please note that the Labour Force Survey is the preferred source of employment headline statistics, whereas the Business Register and Employment Survey (BRES) is the primary source for detailed geography and industry estimates.
It looks at employment in Scotland by industry categories, showing for example that the health sector is the largest industry (contributing 16% to total Scottish employment). It explores the short and longer terms trends, in terms of the changing employment structure in Scotland's economy.
It analyses local authority and Scottish parliamentary constituency geographies by employment. It shows that Glasgow City local authority had the largest density of employment (17% of total employment) and Glasgow Kelvin (8% of total) was the largest constituency.
The final section of the paper examines the contribution of both the public and private sectors to Scottish employment. It shows one in four people work in the public sector.
What data sources are used?
The analysis in this paper is based on the Business Register and Employment Survey (BRES)1. BRES is the official Office for National Statistics (ONS) source of employee and employment estimates by detailed geography and industry. It is also used to update structural information on the Inter-Departmental Business Register, the main sampling frame for business surveys used to produce UK official statistics. The survey collects employment information from businesses across the whole of the Great Britain economy for each site that they operate.
ONS states that:
...due to the survey’s large sample size (approximately 80,000 businesses), BRES is able to produce good quality estimates for detailed breakdowns by industry and geography. Indeed, no other ONS survey of regional and sub-regional employment data can provide the same level of industry detail. Furthermore, being a business survey, the quality of this industry data is very good and is recommended in preference to industry data from household surveys such as the Annual Population Survey.
The analysis focuses on Scotland's employment over the period 2009 to 2016. This time period reflects data availability, as comparable data from this data source begins in 2009.
Methodology notes for interpretation
The employment data in BRES is the number of employees added to the number of working owners (for example, sole proprietors and partners). BRES does not cover the very small businesses neither registered for VAT nor PAYE, which make up a small part of the economy.
Employment is defined as employees plus working owners. Thus, the data includes self-employed workers as long as they are registered for VAT or PAYE schemes. Self-employed people who are not registered for these, along with HM armed forces and government supported trainees are not included.
Employees are defined as anyone aged 16 years or over that is paid directly from the payroll, in return for carrying out a full-time or part-time job or being on a training scheme. Full-time is defined as working more than 30 hours per week and part-time defined as working 30 hours or less.
The data used in this paper are rounded to prevent disclosure. Differences may exist in totals across tables due to ONS rounding of estimates and disclosure methods used.
In 2015, the ONS made a strategic decision to include business units with a single PAYE code for which no VAT data are available. Prior to 2015, such units were excluded from the sampling frame and therefore not estimated for in ONS outputs. This improvement in coverage is estimated to have increased the business survey population by around 100,000 businesses.
This increase in business population has led to an increase in the estimate of the number of employment and employees. However, the overall impact that including the PAYE units has had on BRES total employment estimates is minimal - at a Scotland level 0.8%. The main broad industry category in Scotland that has been impacted by the change is arts, entertainment, recreation & other services, where employment increased by 7% when comparing the new and old methodology (2015 data is available under both methodologies). Thus, this should be borne in mind when considering long term changes in estimates from this sector.
Scottish employment trends
This section explores Scotland's employment over the period 2009 to 2016. This time period was chosen, as the data source used begins in 2009. The analysis looks at trends in other regions of Great Britain and the nature of full-time and part-time employment in Scotland.
Employment overtime
Employment in Scotland totalled 2.6 million in 2016, an increase of 1% on the previous year. This represents the highest employment count in the available data series. Over the seven year period to 2016, the greatest decline in employment was witnessed over 2010 to 2012. Employment levels have been increasing at a slow but steady rate since 2013 (see Figure 1).
Total employment in Scotland has increased by 3% since 2009. However, using 2010 as the base-year, results in a growth rate of 6% in employment. This illustrates the impact different reference points can have in data analysis.
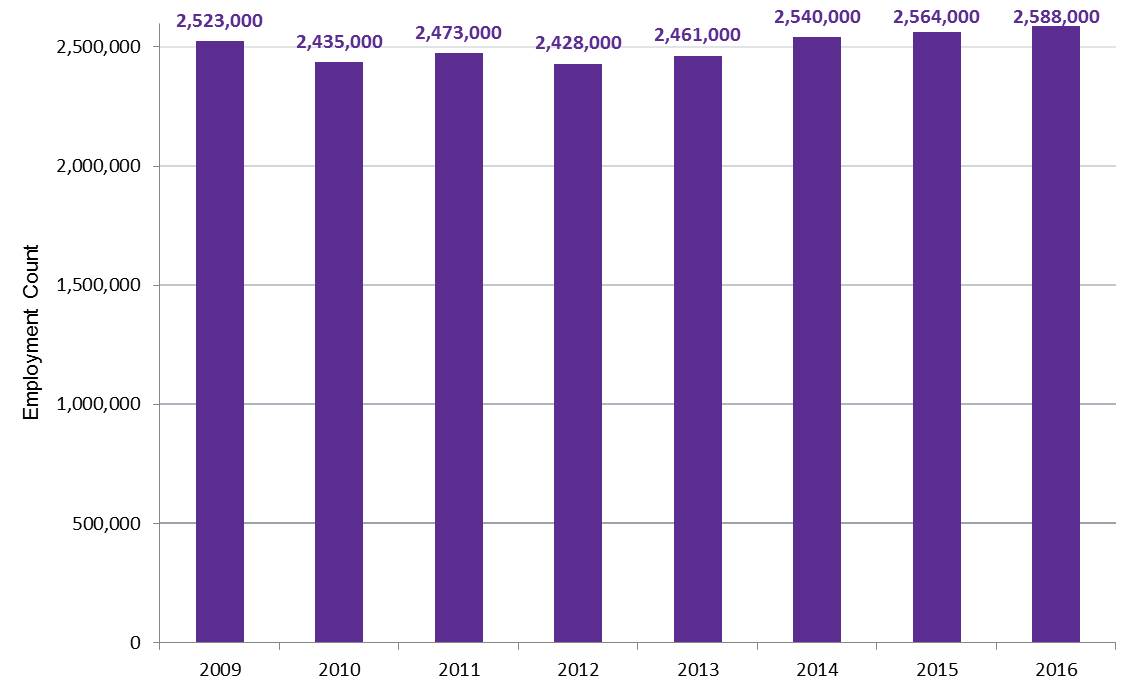
Source: Nomis - Official Labour Market Statistics, Office of National Statistics (ONS). (2017, October 2). Business Register and Employment Survey (BRES). Retrieved from https://www.nomisweb.co.uk/ [accessed 03 October 2017]
Regional comparison
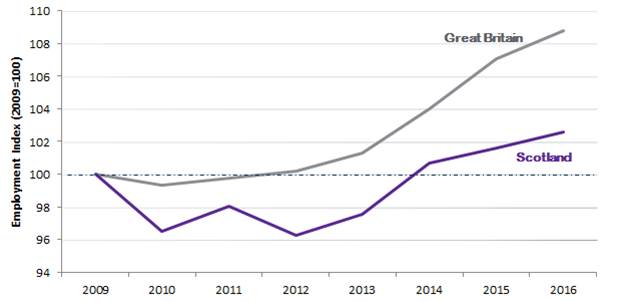
In 2016, employment in Great Britain reached 30.3 million, representing an increase of 2% on the previous year. Figure 2 shows employment in Great Britain increased at a faster pace relative to Scotland. The total number of jobs in Great Britain increased by 9% since 2009, relative to 3% at a Scotland level. However, across Great Britain there were significant regional variations, as illustrated in Figure 4.
Source: Nomis - Official Labour Market Statistics, Office of National Statistics (ONS). (2017, October 2). Business Register and Employment Survey (BRES). Retrieved from https://www.nomisweb.co.uk/ [accessed 03 October 2017]
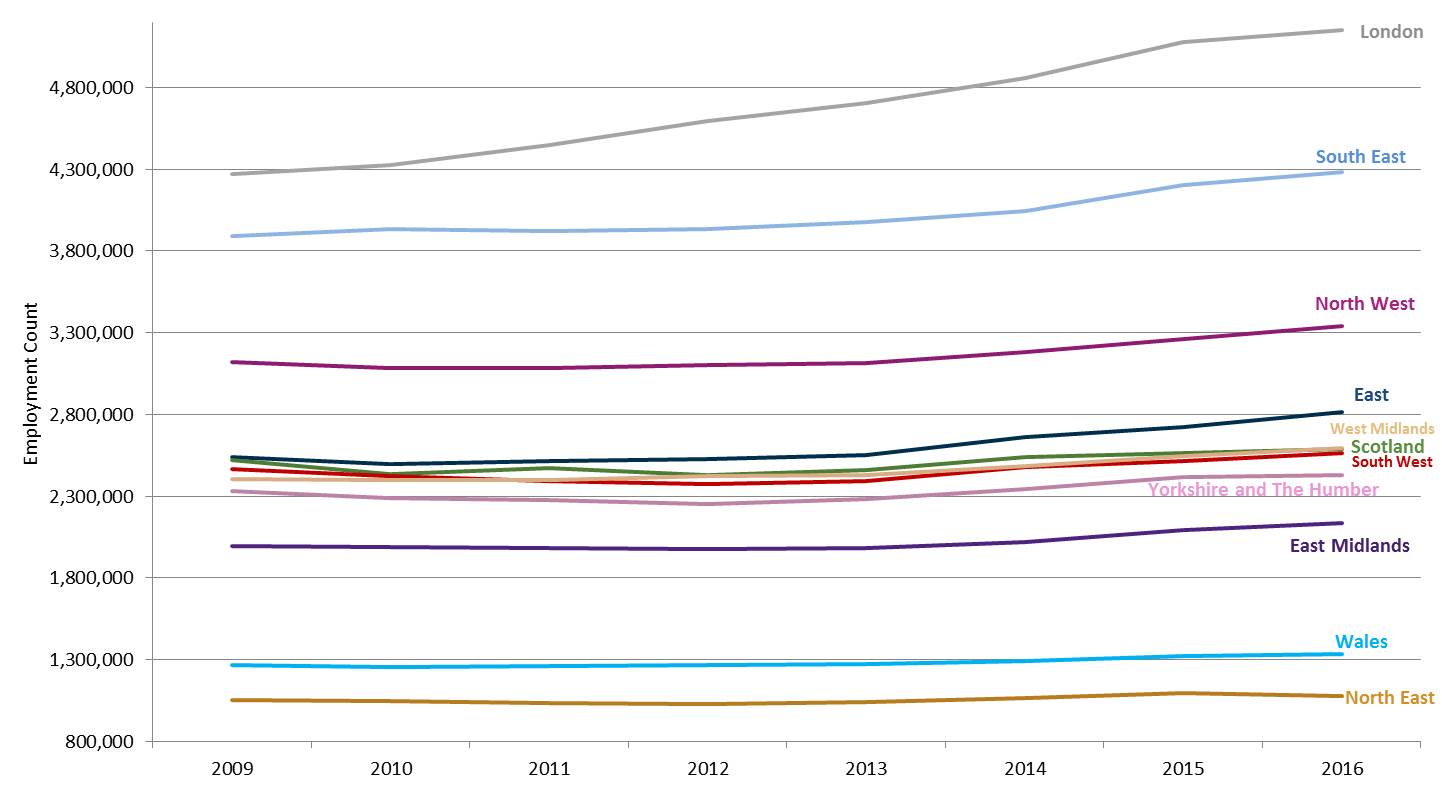
Figure 3 shows the scale of employment, over the period 2009 to 2016, in each of Great Britain's regions. The London region was the largest in terms of employment at 5.2 million and the North East was the smallest at 1.1 million. The scale of employment in Scotland (2.6 million) was similar to that of the West Midlands (which just surpassed Scotland) and the South West (which was marginally lower). Scotland and the East had similar proportions of employment in 2009. However, in 2016 the East surpassed Scotland by 227,000 jobs.
Source: Nomis - Official Labour Market Statistics, Office of National Statistics (ONS). (2017, October 2). Business Register and Employment Survey (BRES). Retrieved from https://www.nomisweb.co.uk/ [accessed 03 October 2017]
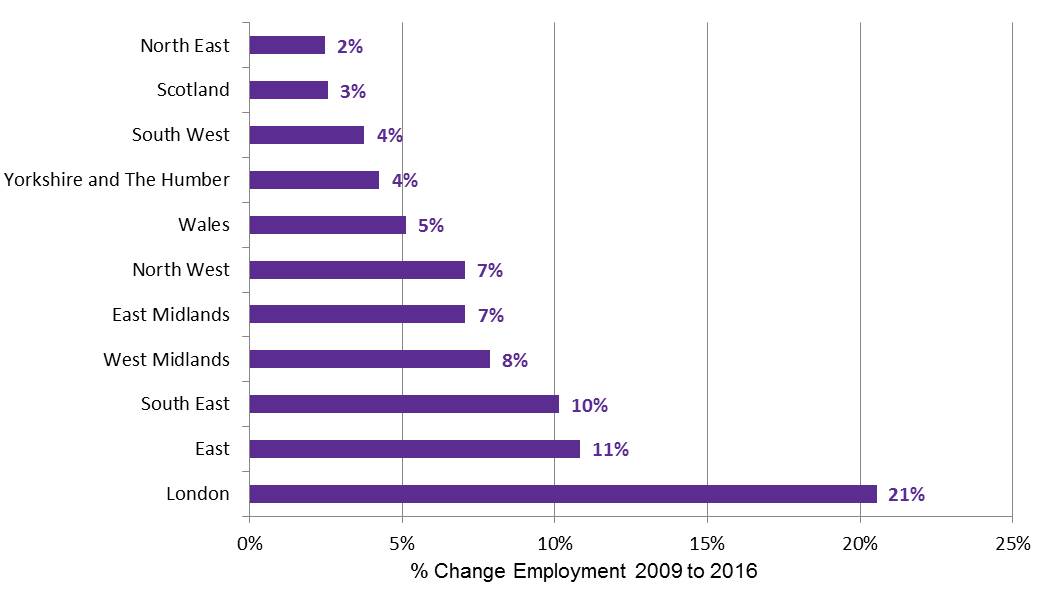
The rate of growth in jobs across Great Britain's regions has been varied with marked contrasts (see Figure 4). In the seven year period to 2016, employment in London grew by 21%, whereas the North East increased by just 2%. Scotland had the second lowest rate of employment growth at 3%.
Source: Nomis - Official Labour Market Statistics, Office of National Statistics (ONS). (2017, October 2). Business Register and Employment Survey (BRES). Retrieved from https://www.nomisweb.co.uk/ [accessed 03 October 2017]
Full-time and part-time trends
The majority (64%) of those in employment in Scotland were full-time employees. Just under a third (32%) were part-time and the remaining 4% were self-employed working owners.
In the 7-year period to 2016, in absolute terms there has been an additional 70,000 people in part-time employment. However, part-time employment as a proportion of all employment has only changed marginally from 31% to 32% over the period in question. Part-time employment is defined as working 30 hours or less. It is not possible to explore changes in the number of hours worked in part-time employment within the BRES data series.
Source: Nomis - Official Labour Market Statistics, Office of National Statistics (ONS). (2017, October 2). Business Register and Employment Survey (BRES). Retrieved from https://www.nomisweb.co.uk/ [accessed 03 October 2017]
Employment by industry
This section looks at employment in Scotland by industry categories. It explores the short and longer terms trends of the changing employment structure in Scotland's economy.
Industry overview
Table 1 shows total employment in Scotland by broad industry category. Health was the largest industry (16% of all employment) in terms of contribution to Scottish employment. Other industries with large employment bases were: retail (245,000), accommodation & food services (190,000), business administration & support services (188,000), education (188,000), manufacturing (180,000), and professional, scientific & technical (178,000). The smallest industry was property contributing 2% to total Scottish employment.
| Employment 2016 | % of total employment | One-year change (2015 to 2016) | Seven-year change (2009 to 2016) | |
|---|---|---|---|---|
| Agriculture, forestry & fishing | 76,000 | 3% | 1% | -6% |
| Mining, quarrying & utilities | 68,000 | 3% | -3% | 10% |
| Manufacturing | 180,000 | 7% | -1% | -6% |
| Construction | 141,000 | 5% | 1% | -4% |
| Motor trades | 49,000 | 2% | 7% | 11% |
| Wholesale | 77,000 | 3% | -3% | -1% |
| Retail | 245,000 | 9% | 0% | -2% |
| Transport & storage (inc postal) | 108,000 | 4% | 3% | 2% |
| Accommodation & food services | 190,000 | 7% | -10% | 4% |
| Information & communication | 74,000 | 3% | 17% | 12% |
| Financial & insurance | 86,000 | 3% | 0% | -9% |
| Property | 39,000 | 2% | 15% | 22% |
| Professional, scientific & technical | 178,000 | 7% | 4% | 9% |
| Business administration & support services | 188,000 | 7% | 1% | 3% |
| Public administration & defence | 154,000 | 6% | 5% | 1% |
| Education | 188,000 | 7% | -3% | -4% |
| Health | 411,000 | 16% | -1% | 6% |
| Arts, entertainment, recreation & other services | 136,000 | 5% | 20% | 27% |
| Scotland total | 2,588,000 | 100% | 1% | 3% |
Source: Nomis - Official Labour Market Statistics, Office of National Statistics (ONS). (2017, October 2). Business Register and Employment Survey (BRES). Retrieved from https://www.nomisweb.co.uk/ [accessed 03 October 2017]
In the year to 2016, arts, entertainment, recreation & other services was the fastest growing industry (20%) when considering employment. Completing the top three were information & communication (17%) and property (15%). Over the year accommodation & food services saw the greatest decline in employment (-10%).
In the seven year period, the largest employment increases were in arts, entertainment, recreation & other services (27%)i, property (22%), information & communication (12%), motor trades (11%), and mining, quarrying & utilities (10%).
Table 1 explores broad industry categories, which can often misrepresent some of the detail within employment changes. Thus, Table 2 and Table 3 consider sector changes in employment in more detail by exploring 2-digit SIC categories. Table 2 examines short term employment trends over the year to 2016 and Table 3 longer term trends over a 7-year period.
Short term trends
The primary short term Scottish employment trends, related to employment growth were:
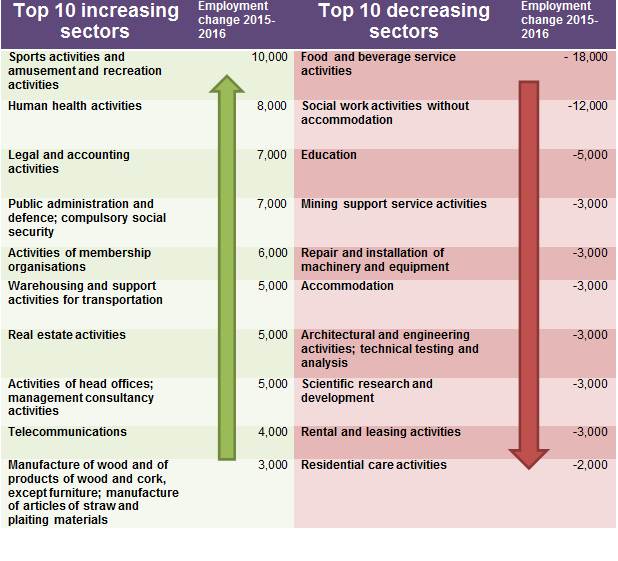
Sports activities and amusement and recreation activities created an additional 10,000 jobs over the year to 2016. This main drivers of employment growth within this category were activities of sport clubs (employment increase of 5,000) and operation of sports facilities (3,000 increase).
Human health activities employed an additional 8,000 individuals (this includes hospitals, GPs, and dental practices).
Other sectors reporting high volumes of employment growth were legal and accounting activities (all this growth related to legal activities as employment in accountancy declined), public administration and defence (the majority of this growth was in general public administration), and activities of membership organisations (drivers of growth were business and employers membership organisations and professional membership organisations).
Growth in activities of head offices; management consultancy activities are important for economic impact as the sector has a relatively higher GVA per employee ratio.
Source: Nomis - Official Labour Market Statistics, Office of National Statistics (ONS). (2017, October 2). Business Register and Employment Survey (BRES). Retrieved from https://www.nomisweb.co.uk/ [accessed 03 October 2017]
Elements of the economy with employment decline, over the year to 2016, were:
Employment in food and beverage serving activities declined by 18,000. The majority (12,000) of this decline related to restaurants and mobile food services. And the remaining 6,000 to beverage activity employment.
Social work activities without accommodation declined by 12,000. Employment related to child day-car, elderly and disabled remained stable over the year. It was the sub-category other social work activities without accommodation n.e.c. that related to the decline.
The decrease in mining support service activities, repair and installation of machinery and equipment, and architectural and engineering activities; technical testing and analysis reflected the decline in the North East's oil and gas industry and its ripple effects in the wider Scottish supply chain.
It is important to bear in mind with short term trends that these only cover a 12 moth period. Thus, it is difficult to predict whether movements in employment direction will continue or are likely to be spurious movements. Hence, it is essential to also look at longer term trends to see structural change in employment within Scotland's economy.
Long term trends
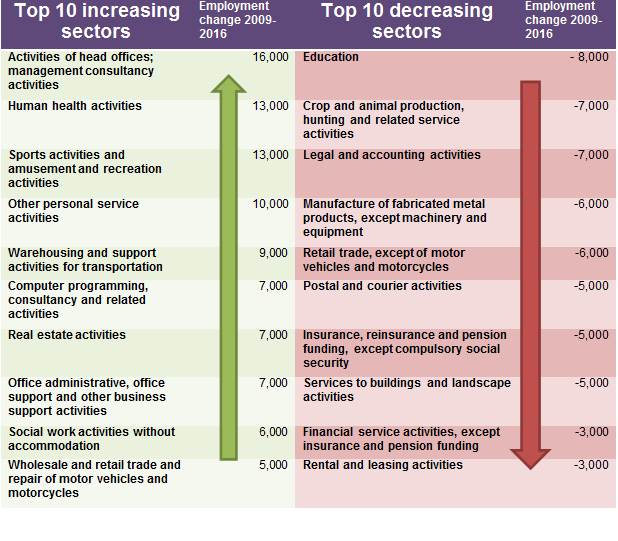
Looking over a 7-year period demonstrates longer term structural changes in Scottish employment (see Table 3). The following sectors showed relatively large growth.
Activities of head offices; management consultancy activities employed an additional 16,000 people in Scotland since 2009. As mentioned previously this sector is important for economic impact as it has a relatively higher GVA per employee ratio.
Human health activities (which includes hospitals, GPs, and dental practices) and sports activities and amusement and recreation activities (which includes sports club activities and operation of sports facilities) have been areas of strong employment growth.
Growth in other personal service activitiesi was significantly driven by hairdressing and beautician activities (8,000 increase in employment). Employment has remained relatively stable within the other elements of this category, which include funeral activities and dry-cleaners.
Source: Nomis - Official Labour Market Statistics, Office of National Statistics (ONS). (2017, October 2). Business Register and Employment Survey (BRES). Retrieved from https://www.nomisweb.co.uk/ [accessed 03 October 2017]
Since 2009 the following economy sectors have experienced decreases in employment.
The education sector has seen the greatest decline in terms of employment. The post-secondary non-tertiary education was the main driver of decline (6,000 decrease in employment) and there were minor declines in primary and secondary education.
Decreases in crop and animal production, hunting and related service activities employment reflect wider structural changes in the agricultural sector.
Some areas of employment decline can be linked to changes in the financial sector following the financial crisis and UK recession of 2008/09 . These are accounting activities, insurance, reinsurance and pension funding, and financial services.
Manufacture of fabricated metal products employment decreased. The most notable elements within this decrease were machining (-2,000) and metal structure manufacturing (-1,000).
It is worth noting over the 7-year period in question, the scale of employment increases and decreases by sector were not perhaps as substantial as would be expected. This reflects the total ratio of employment growth across Scotland's economy at 3% between 2009 and 2016.
Local geographies
This section provides an overview of Scotland's employment by local authority and parliamentary constituency. The data source used begins in 2009, thus this analysis has focussed on 1-year and 7-year growth rates. Please note that local authority and parliamentary constituency figures exclude farm agriculture employment due to data availability. Thus, totals will differ from the high level Scotland figures reported elsewhere in this report, which include farm agriculture.
Local authority insights
Table 4 provides a breakdown of employment by local authority in 2016.
The top five local authority areas for employment volumes in descending order were: Glasgow City (16.7% of all Scottish employment), City of Edinburgh (13.2%), Aberdeen City (7.1%), Fife (5.4%), and North Lanarkshire (5.2%).
On the other end of the scale, Orkney Islands and Na h-Eileanan Siar both had the smallest proportions of employment at 0.4%, followed by Shetland Islands (0.6%), Clackmannanshire (0.7%),and East Renfrewshire (0.9%).
Between 2015 and 2016, the majority of local authority areas saw an increase or no change in employment.
However, eight of Scotland's 32 local authority areas experienced decreases in employment between 2015 and 2016: Aberdeenshire (-5,000) Aberdeen City (- 2,000), West Dunbartonshire (-2,000), with the remainder all declining by approximately 1,000 (Fife, North Lanarkshire, Renfrewshire, Angus, Shetland Islands).
In absolute terms, the local authority areas that experienced the greatest increases were: Glasgow City (13,000 increase in employment), City of Edinburgh (8,000), Dundee (3,000), and Falkirk (3,000).
The seven-year growth rate for local authority employment was positive or no change in all but nine local authorities.
In absolute terms, local authorities with significant employment increases since 2009 were City of Edinburgh (additional employment of 18,850), Aberdeenshire (12,750), Highland (10,000), and Falkirk (9,300).
The nine areas with employment decreases were West Lothian (-3,675), West Dunbartonshire (-2,875), Angus (-1,900), Aberdeen City (-1,775), South Lanarkshire (-1,475), South Ayrshire (-1,075), Glasgow City (-990), Shetland Islands (-825), and Na h-Eileanan Siar (-350).
Given the current destabilised economic climate in the north east region of Scotland, it would have perhaps been thought this would be more evident in the employment figures. Much of the employment lost in the region was created over the 7-year period in question. Thus, declines in employment are more noticeable in the short term 1-year figures rather than the longer term 7-year figures.
| Employment 2016 | % of total Scottish employment | One-year change (2015 to 2016) | Seven-year change (2009 to 2016) | |
|---|---|---|---|---|
| Aberdeen City | 178,825 | 7% | -3% | -1% |
| Aberdeenshire | 106,950 | 4% | -2% | 14% |
| Angus | 33,550 | 1% | -3% | -5% |
| Argyll and Bute | 39,225 | 2% | 3% | 3% |
| Clackmannanshire | 15,090 | 1% | 0% | 2% |
| Dumfries and Galloway | 59,900 | 2% | 2% | 5% |
| Dundee City | 77,380 | 3% | 4% | 0% |
| East Ayrshire | 41,775 | 2% | 2% | 1% |
| East Dunbartonshire | 26,685 | 1% | 0% | 10% |
| East Lothian | 29,175 | 1% | 3% | 10% |
| East Renfrewshire | 21,505 | 1% | 5% | 8% |
| Edinburgh, City of | 333,300 | 13% | 2% | 6% |
| Eilean Siar | 10,900 | 0.4% | 0% | -3% |
| Falkirk | 66,210 | 3% | 5% | 16% |
| Fife | 135,950 | 5% | -1% | 3% |
| Glasgow City | 418,050 | 17% | 3% | -0.2% |
| Highland | 117,150 | 5% | 1% | 10% |
| Inverclyde | 31,100 | 1% | 3% | 8% |
| Midlothian | 31,125 | 1% | 3% | 13% |
| Moray | 37,000 | 1% | 0% | 3% |
| North Ayrshire | 41,825 | 2% | 2% | 2% |
| North Lanarkshire | 130,550 | 5% | -1% | 2% |
| Orkney Islands | 10,675 | 0.4% | 10% | 1% |
| Perth and Kinross | 65,600 | 3% | 0% | 4% |
| Renfrewshire | 84,575 | 3% | -1% | 8% |
| Scottish Borders | 43,400 | 2% | 2% | 5% |
| Shetland Islands | 14,125 | 1% | -7% | -6% |
| South Ayrshire | 47,150 | 2% | 2% | -2% |
| South Lanarkshire | 118,450 | 5% | 1% | -1% |
| Stirling | 47,200 | 2% | 2% | 2% |
| West Dunbartonshire | 30,230 | 1% | -6% | -9% |
| West Lothian | 77,200 | 3% | 0% | -5% |
Source: Nomis - Official Labour Market Statistics, Office of National Statistics (ONS). (2017, October 2). Business Register and Employment Survey (BRES). Retrieved from https://www.nomisweb.co.uk/ [accessed 03 October 2017]
Parliamentary constituency insights
Table 5 provides a breakdown of employment by parliamentary constituency.
The top five constituencies for employment in 2016 were: Glasgow Kelvin (8% of total Scottish employment), Edinburgh Central (6%), Aberdeen Central (4%), Dundee City West (2%) and Inverness and Nairn (2%) . In contrast, the areas with the lowest share of employment were: Orkney Islands (0.4%), Na h- Eileanan an Iar (0.4%), Glasgow Cathcart (1%), Shetland Islands (1%), and Renfrewshire South (1%).
In the year to 2016, there was mixed performance in terms of employment growth across constituencies. Employment grew in 35 constituencies, in 22 constituencies there was little or no change, and there were decreases across 16 constituencies.
Constituencies with the largest absolute increases were: Glasgow Kelvin (+12,000), Edinburgh Central (+3,000), Aberdeen Central (+2,000), Greenock and Inverclyde (+2,000), and Hamilton, Larkhall and Stonehouse (+2,000)
Constituencies with the most significant absolute decreases were: Aberdeen Donside (-4,000), Aberdeen South and North Kincardine (-4,000), Paisley (-3,000), North East Fife (-2,000), Glasgow Pollock (-2,000), Aberdeenshire West (-2,000), and Almond Valley (-2,000).
Again over a longer term period there has been a mixed performance across constituency employment. Since 2009, 43 constituencies have increased employment, 9 have had little or no change, 21 have experienced employment declines.
Constituencies with the largest absolute increases were: Edinburgh Pentlands (+17,000), Edinburgh Central (+12,000), Hamilton, Larkhall and Stonehouse (+9,000), and Falkirk West (+7,000).
Constituencies with the most significant absolute decreases were: Glasgow South-side (-8,000), Edinburgh Western (-6,000), Glasgow Cathcart (-5,000), and Edinburgh Northern & Leith (-5,000).
| Employment 2016 | % of total Scottish employment | One-year change (2015 to 2016) | Seven-year change (2009 to 2016) | |
|---|---|---|---|---|
| Aberdeen Central | 92,000 | 3.6% | 2% | 5% |
| Aberdeen Donside | 53,000 | 2.1% | -7% | -5% |
| Aberdeen South and North Kincardine | 42,000 | 1.7% | -9% | -5% |
| Aberdeenshire East | 28,000 | 1.1% | 4% | 17% |
| Aberdeenshire West | 34,000 | 1.3% | -6% | 17% |
| Airdrie and Shotts | 21,000 | 0.8% | -5% | -9% |
| Almond Valley | 48,000 | 1.9% | -4% | 2% |
| Angus North and Mearns | 26,000 | 1.0% | 0% | 4% |
| Angus South | 18,000 | 0.7% | 0% | 0% |
| Argyll and Bute | 27,000 | 1.1% | -4% | -7% |
| Ayr | 32,000 | 1.3% | 3% | -11% |
| Banffshire and Buchan Coast | 31,000 | 1.2% | 0% | 3% |
| Caithness, Sutherland and Ross | 29,000 | 1.1% | 4% | 4% |
| Carrick, Cumnock and Doon Valley | 24,000 | 1.0% | -4% | 14% |
| Clackmannanshire and Dunblane | 22,000 | 0.9% | 0% | 5% |
| Clydebank and Milngavie | 23,000 | 0.9% | 0% | 5% |
| Clydesdale | 20,000 | 0.8% | 0% | 0% |
| Coatbridge and Chryston | 24,000 | 1.0% | 4% | 4% |
| Cowdenbeath | 22,000 | 0.9% | 5% | 5% |
| Cumbernauld and Kilsyth | 32,000 | 1.3% | -3% | 23% |
| Cunninghame North | 19,000 | 0.8% | 0% | 6% |
| Cunninghame South | 24,000 | 1.0% | 9% | 9% |
| Dumbarton | 25,000 | 1.0% | 0% | -4% |
| Dumfriesshire | 38,000 | 1.5% | 3% | 6% |
| Dundee City East | 22,000 | 0.9% | 0% | 5% |
| Dundee City West | 55,000 | 2.2% | 4% | -2% |
| Dunfermline | 32,000 | 1.3% | 3% | 3% |
| East Kilbride | 35,000 | 1.4% | 6% | -3% |
| East Lothian | 21,000 | 0.8% | 0% | 5% |
| Eastwood | 16,000 | 0.6% | 14% | 14% |
| Edinburgh Central | 148,000 | 5.9% | 2% | 9% |
| Edinburgh Eastern | 31,000 | 1.2% | 3% | 7% |
| Edinburgh Northern and Leith | 40,000 | 1.6% | 0% | -11% |
| Edinburgh Pentlands | 38,000 | 1.5% | 6% | 81% |
| Edinburgh Southern | 32,000 | 1.3% | 3% | 0% |
| Edinburgh Western | 45,000 | 1.8% | 5% | -12% |
| Na h-Eileanan an Iar | 11,000 | 0.4% | 0% | 0% |
| Ettrick, Roxburgh and Berwickshire | 24,000 | 1.0% | 0% | -11% |
| Falkirk East | 25,000 | 1.0% | 4% | 0% |
| Falkirk West | 40,000 | 1.6% | 3% | 21% |
| Galloway and West Dumfries | 23,000 | 0.9% | 0% | 5% |
| Glasgow Anniesland | 27,000 | 1.1% | 4% | 29% |
| Glasgow Cathcart | 13,000 | 0.5% | -7% | -28% |
| Glasgow Kelvin | 201,000 | 8.0% | 6% | 3% |
| Glasgow Maryhill and Springburn | 34,000 | 1.3% | 0% | -8% |
| Glasgow Pollok | 40,000 | 1.6% | -5% | 3% |
| Glasgow Provan | 20,000 | 0.8% | 0% | 5% |
| Glasgow Shettleston | 35,000 | 1.4% | -3% | 9% |
| Glasgow Southside | 49,000 | 1.9% | 2% | -14% |
| Greenock and Inverclyde | 30,000 | 1.2% | 7% | 7% |
| Hamilton, Larkhall and Stonehouse | 26,000 | 1.0% | 8% | 53% |
| Inverness and Nairn | 55,000 | 2.2% | 2% | 12% |
| Kilmarnock and Irvine Valley | 33,000 | 1.3% | 3% | 3% |
| Kirkcaldy | 26,000 | 1.0% | 0% | 0% |
| Linlithgow | 29,000 | 1.1% | 4% | -12% |
| Mid Fife and Glenrothes | 33,000 | 1.3% | 0% | 6% |
| Midlothian North and Musselburgh | 33,000 | 1.3% | 3% | 18% |
| Midlothian South, Tweeddale and Lauderdale | 25,000 | 1.0% | 4% | 19% |
| Moray | 33,000 | 1.3% | 3% | 3% |
| Motherwell and Wishaw | 25,000 | 1.0% | -4% | -14% |
| North East Fife | 24,000 | 1.0% | -8% | 0% |
| Orkney Islands | 11,000 | 0.4% | 10% | 0% |
| Paisley | 38,000 | 1.5% | -7% | -7% |
| Perthshire North | 33,000 | 1.3% | 0% | 10% |
| Perthshire South and Kinrossshire | 31,000 | 1.2% | 0% | -6% |
| Renfrewshire North and West | 38,000 | 1.5% | 3% | 19% |
| Renfrewshire South | 15,000 | 0.6% | 0% | 7% |
| Rutherglen | 22,000 | 0.9% | -4% | -15% |
| Shetland Islands | 14,000 | 0.6% | -7% | -7% |
| Skye, Lochaber and Badenoch | 32,000 | 1.3% | 3% | 7% |
| Stirling | 40,000 | 1.6% | 3% | 0% |
| Strathkelvin and Bearsden | 21,000 | 0.8% | 0% | 11% |
| Uddingston and Bellshill | 47,000 | 1.9% | 2% | -2% |
Source: Nomis - Official Labour Market Statistics, Office of National Statistics (ONS). (2017, October 2). Business Register and Employment Survey (BRES). Retrieved from https://www.nomisweb.co.uk/ [accessed 03 October 2017]
Table 5 presents high level parliamentary constituency employment data. Please note more detailed breakdowns of this data are available by broad sector for each parliamentary constituency area. MSPs or their staff should get in touch with SPICe, if they have an interest in this detailed data.
Public and private sector employment
This section examines the contribution of both the public and private sectors to Scottish employment.
Scottish public and private sector employment trends
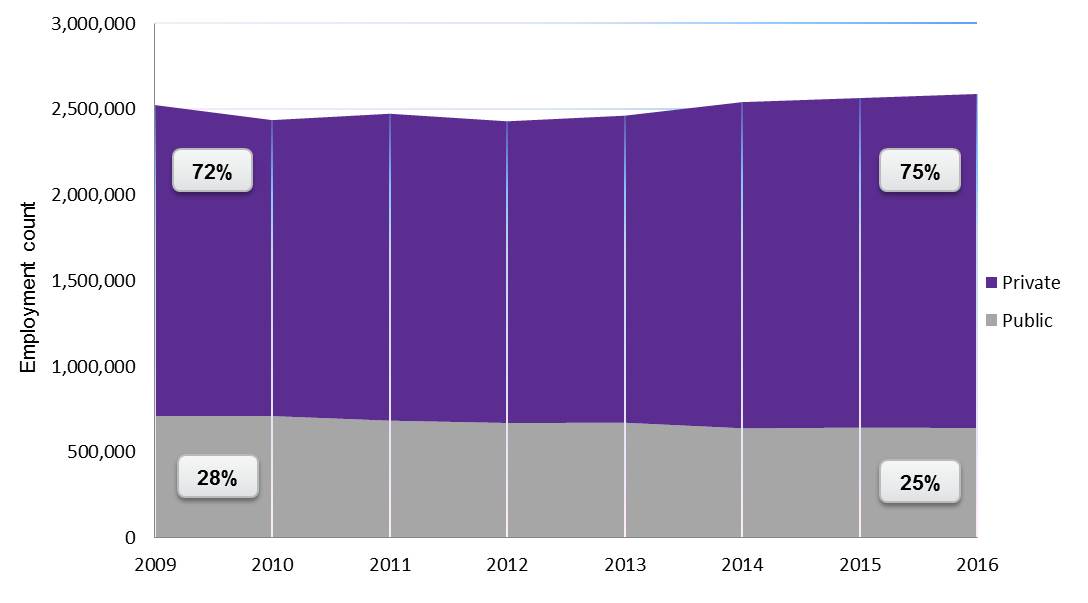
One in four people in Scotland worked in the public sector in 2016. This represented employment of 640,250 across Scotland's public sector. Employment in Scotland's public sector has declined by 10% (approximately -70,000) since 2009. Over the same period private sector employment grew by 7% (+134,500). Private sector employment as a proportion of total employment has increased overtime, from 72% in 2009 to 75% in 2016.
Source: Nomis - Official Labour Market Statistics, Office of National Statistics (ONS). (2017, October 2). Business Register and Employment Survey (BRES). Retrieved from https://www.nomisweb.co.uk/ [accessed 03 October 2017]
Please note that it is not possible with the BRES dataset used here to analyse public sector employment by devolved or reserved dimensions. This type of detail can be ascertained from the Public Sector Employment (PSE) Statistics, which are the preferred source of Scotland level estimates. However, the PSE cannot provide the same level of lower level geography detail got from BRES.
Public and private sector employment regional comparison
Scotland, with one in four people in the public sector, had the second highest level of public sector employment amongst the regions of Great Britain in 2016 (see Figure 7). On this measure Scotland was surpassed only by Wales, where 26% of total employment was in the public sector. London and the South East had the highest levels of private sector employment.
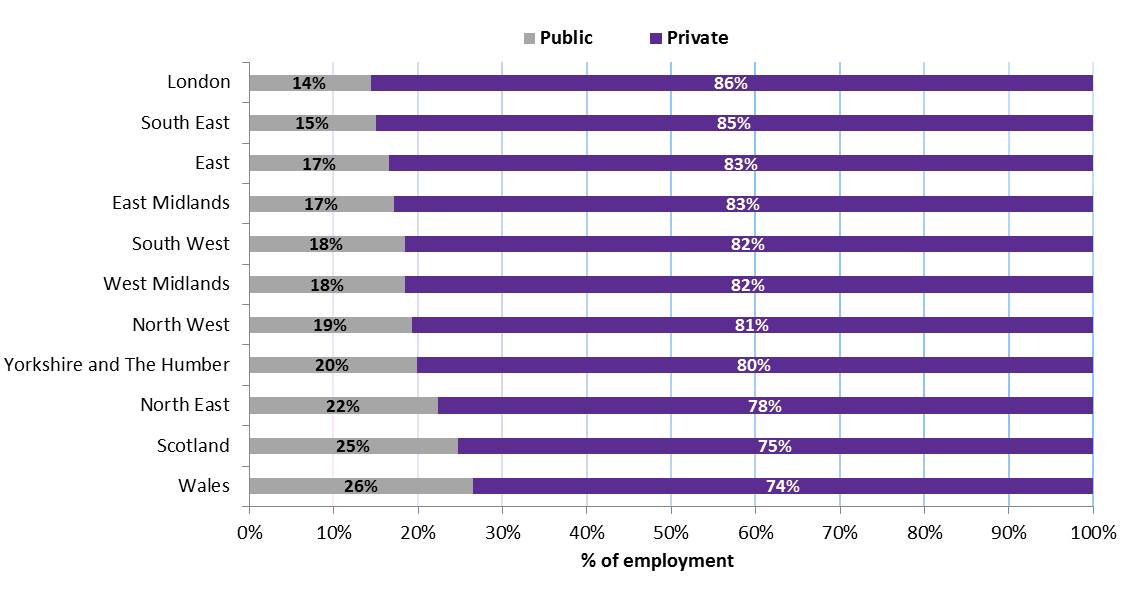
Source: Nomis - Official Labour Market Statistics, Office of National Statistics (ONS). (2017, October 2). Business Register and Employment Survey (BRES). Retrieved from https://www.nomisweb.co.uk/ [accessed 03 October 2017]
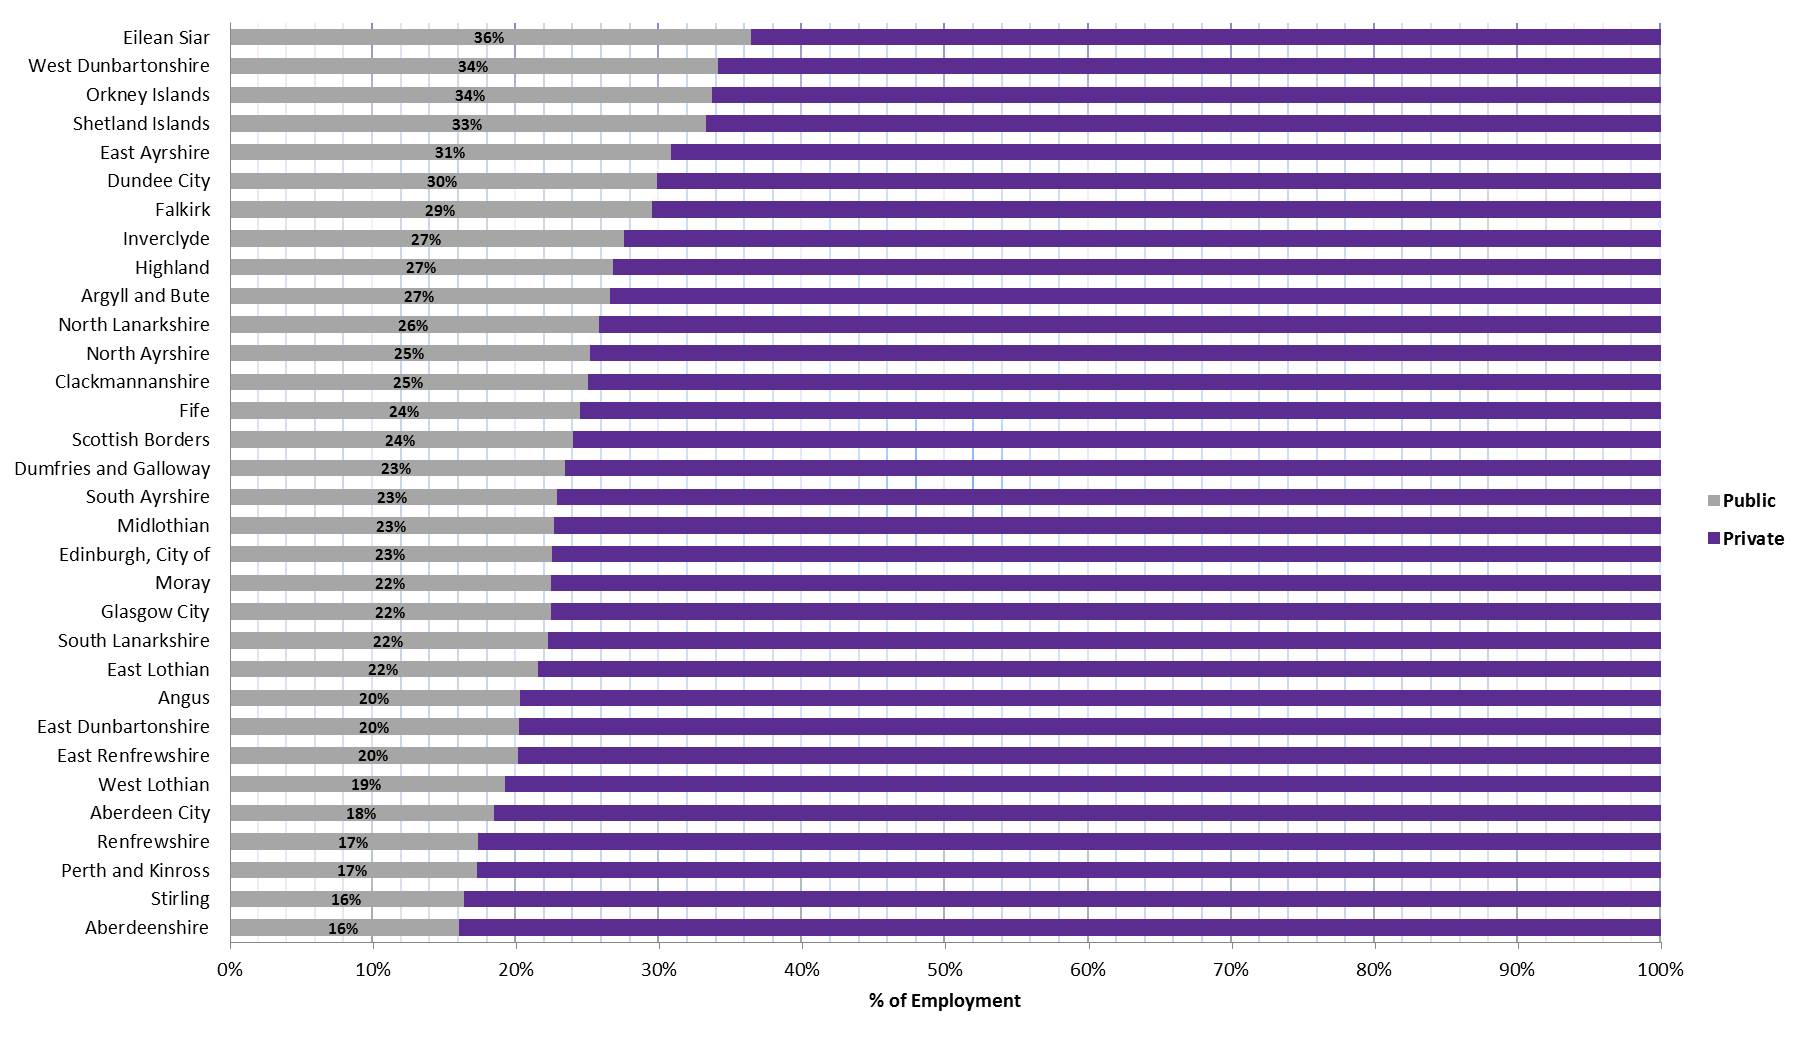
Public and private sector employment local authority comparison
The split between public and private sector employment was varied across Scotland's local authorities in 2016, as shown in Figure 8.
Aberdeenshire (84% private sector employment), Stirling (84%), Perth & Kinross (83%), Renfrewshire(83%), and Aberdeen City (82%) were the top-5 local authority areas in terms of private sector employment.
In contrast, Eilean Siar (36% public sector employment), West Dunbartonshire (34%), Orkney Islands (34%), Shetland Islands (33%), and East Ayrshire (31%) were the local authority areas with the highest density of public sector employment.
Souce: Nomis - Official Labour Market Statistics, Office of National Statistics (ONS). (2017, October 2). Business Register and Employment Survey (BRES). Retrieved from https://www.nomisweb.co.uk/ [accessed 03 October 2017]
Sources
Office of National Statistics. (2017, October 2). UK business register and employment survey (BRES): provisional results 2016, revised results 2015. Retrieved from <a href="https://www.ons.gov.uk/employmentandlabourmarket/peopleinwork/employmentandemployeetypes/bulletins/businessregisterandemploymentsurveybresprovisionalresults/provisionalresults2016revisedresults2015" target="_blank">https://www.ons.gov.uk/employmentandlabourmarket/peopleinwork/employmentandemployeetypes/bulletins/businessregisterandemploymentsurveybresprovisionalresults/provisionalresults2016revisedresults2015</a> [accessed 4 October 2017]
Nomis - Official Labour Market Statistics, Office of National Statistics (ONS). (2017, October 2). Business Register and Employment Survey (BRES). Retrieved from <a href="https://www.nomisweb.co.uk/" target="_blank">https://www.nomisweb.co.uk/</a> [accessed 03 October 2017]