How can we reduce obesity in Scotland?
This briefing was prepared by Kate Grant (University of Edinburgh) during an RCUK Policy Placement. The briefing looks at reducing obesity in Scotland, compares the policy recommendations made by several organisations and explores 25 policy areas in more detail.
Executive Summary
Most people in Scotland are overweight: 2 out of every 3 adults and 1 out of every 4 children. People with a healthy weight are now in the minority. Obesity trends are affected by age, gender and socio-economic status.
Obesity can have serious health consequences, such as cancer, type 2 diabetes, strokes and many other debilitating conditions. Overall, obesity can reduce average lifespan by up to 10 years.
In Scotland, obesity costs the NHS an estimated £600 million per year. It significantly reduces Scottish productivity and the size of the Scottish economy.
At a simple level, obesity may be seen as the result of an ‘energy imbalance’ where energy consumed (diet) exceeds energy expended (physical activity).
Diet in Scotland
Overall, the Scottish diet is less healthy than would be ideal. Compared to the Scottish Dietary Goals, people in Scotland eat and drink too many calories, too much sugar and fat. Conversely, Scots do not eat enough fruit, vegetables, fibre and oily fish.
Scottish consumption of “discretionary” food and drink — biscuits, cakes, pastries, confectionery and sugar sweetened drinks — is concerning. Food Standards Scotland recommends reducing the population-level consumption of these products by 50%.
Figures show that Scotland likes fast food, quick service bakeries and takeaways. The five most visited brands are McDonalds, Greggs, Tesco, Asda and Morrisons. Amongst the most popular purchases are chips, fries, cakes, biscuits, pastries and regular cola.
Physical activity in Scotland
In 2015, one third of adults did not meet the recommended levels of physical activity. People spend a good proportion of their free time being sedentary. On average, adults spend 5 – 6 hours being sedentary, depending on whether it is a weekday or a weekend. This excludes time spent at work. Similarly, children spend 3 – 4.5 hours being sedentary. This excludes time at school or nursery.
What causes obesity: more than just diet versus exercise?
Obesity does appear, however, to be more complex than a simple energy imbalance between diet and exercise. Research has shown that over 100 different variables affect obesity levels, including: biology, individual psychology, economics, jobs, urban planning, land use, education, culture, social customs, food production, trade, access to food, marketing and advertising.
To illustrate this, the most deprived spend twice as much of their income on food compared to the most affluent: 17% versus 8% of total income. Healthier food products are more expensive, according to some studies. In the UK (in 2012), 1,000 calories from unhealthy food products was estimated to cost £2.50, compared to £7.49 for healthy food products. Fruit and vegetables had the highest cost per 1,000 calories. Therefore, various economic factors might influence whether people buy healthier items.
A number of high profile publications — from academic experts to doctors — have argued that there is an "obesogenic environment" in many developed countries, including the UK. In other words, many aspects of modern living encourage obesity-promoting behaviours.
Obesity policy in Scotland
Policy to tackle obesity is a mixture of EU, UK and Scottish measures. At a Scottish level, the Obesity Route Map (2010) is the central policy statement. The Scottish Public Health Network reviewed the Route Map in 2015, suggesting it represented a reasonable response to the challenge but also identifying areas where further action is needed. A new strategy is currently being developed.
What policy interventions have been recommended?
What policy interventions should be used and how they should be applied, has been vigorously debated. Recurring themes emerge from this debate:
To what degree is obesity a personal responsibility or a societal responsibility?
What combination of treatment interventions and preventative interventions would be most effective?
In what cases should voluntary agreements with industry be used and when is government regulation more effective?
How can effective policy be developed with sometimes ‘imperfect’ knowledge?
Different policy options may be preferred, depending on the point of view taken in these four areas.
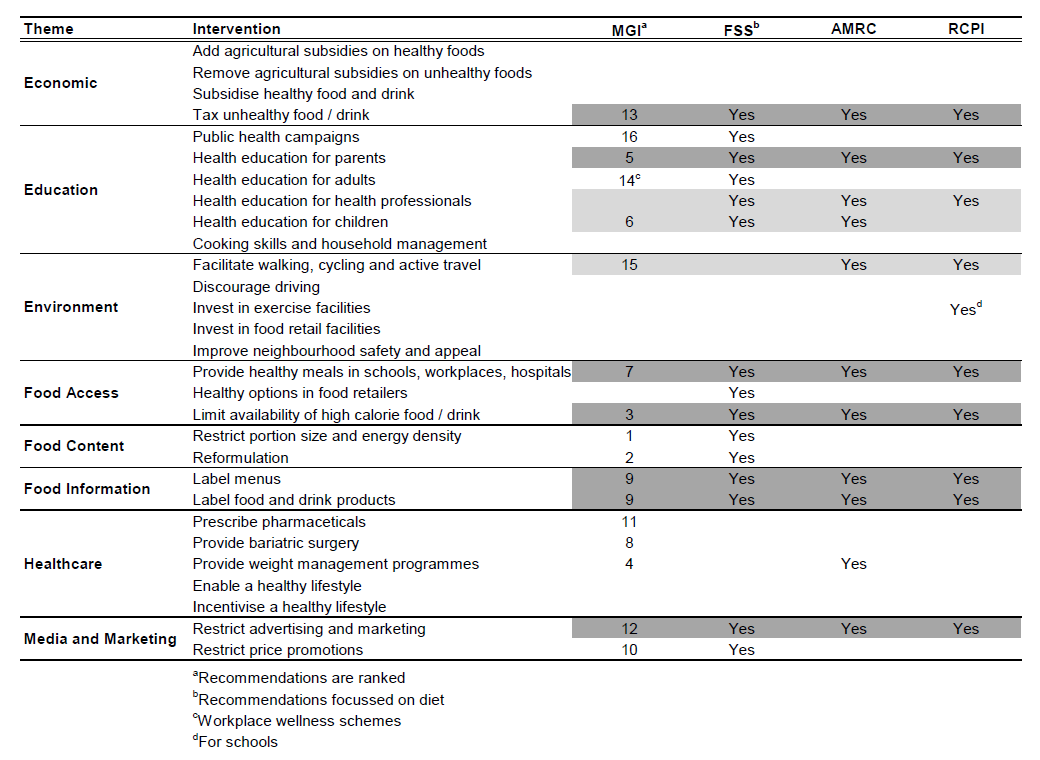
Several organisations have recommended policy interventions for reducing obesity in Scotland or the British Isles. This briefing reviews recommendations from four: McKinsey Global Institute (2014); Food Standards Scotland (2016); Academy of Medical Royal Colleges (2013); Royal College of Physicians of Ireland (2014).
Potential interventions areas, highlighted by three or more of these organisations, include:
Taxing unhealthy food and drink products
Restricting advertising and marketing of unhealthy food or drink
Change the built environment to facilitate active travel
Providing health education for parents and children
Providing healthy meals in schools, workplaces and hospitals
Limiting the availability of unhealthy food and drink
Better labelling of food, drink and meals
However, all organisations emphasise that there is no single ‘magic cure’ for obesity. They all advocate a broad, multi-component approach.
To support this briefing, SPICe conducted a survey of Scottish academics to ask them, in their opinion, what policy interventions would most reduce obesity in Scotland? The survey was carried in May and June 2017. The results should be interpreted with caution: they give a flavour of the respondents’ views and are not an assessment of the weight of evidence.
Amongst the most popular initiatives identified by academics were:
Encouraging walking, cycling and active travel
Reducing the relative price of healthy food through agricultural subsidies
Free or subsidised healthy school meals
Reformulation of food and drink products through government regulations
Providing health, diet and exercise education for children
However, the central finding is the wide spread of support for interventions. This reinforces the fact that there is no single ‘cure’ for obesity. Scottish academics support a broad range of policy interventions.
What are the potential policy interventions?
This briefing has distilled possible policy interventions into 25 areas (groups of related policy interventions). Possible policy interventions were derived from the comprehensive list of interventions presented in the McKinsey Global Institute (2014). A short summary is provided for each policy area.
The 25 policy areas are show in the table below.
| Theme | Intervention Areas |
|---|---|
| Economic | Taxing unhealthy food and drink |
| Subsidising healthy food and drink | |
| Removing agricultural subsidies from unhealthy food | |
| Adding agricultural subsidies to healthy food | |
| Education | Public health campaigns |
| Providing health education | |
| Providing household management education | |
| Environment | Facilitate walking and cycling |
| Discourage car usage | |
| Neighbourhood safety and appeal | |
| Exercise facilities | |
| Food facilities | |
| Food access and availability | Access to healthy meals |
| Layout and contents of retailers | |
| Food content | Reformulation |
| Energy and portion size | |
| Food information | Labelling food and drink products |
| Labelling menus | |
| Healthcare | Surgery and pharmaceuticals |
| Weight management programmes | |
| Enabling a healthy lifestyle | |
| Incentivising a healthy lifestyle | |
| Media and marketing | Advertising |
| Price promotions | |
| Other promotional activity |
Obesity in Scotland
What is obesity?
Obesity is a medical condition. It occurs when someone accumulates excess body fat to the point where their health may be negatively affected.1
In adults, obesity is diagnosed using two measurements: the Body Mass Index (BMI) and waist circumference. BMI is an approximate measure of total body fat. It is calculated from a person's weight and height. Waist circumference is used to assess distribution of body fat.1
Diagnosing obesity in children is more difficult because they are still growing. Age and gender-specific BMI ranges are used to identify children at risk of being overweight or obese.1
The table below shows how BMI measurements translate into different categories.
For the rest of this briefing, the term 'overweight' means having a BMI over 25. 'Obese' means having a BMI over 30.
| BMI (kg per m2) | Definition |
|---|---|
| Less than 18.5 | Underweight |
| 18.5 - 24.9 | Normal weight |
| 25 - 29.9 | Overweight |
| 30 - 34.9 | Obese (class I) |
| 35 - 39.9 | Obese (class II) |
| More than 40 | Obese (class III) |
From Table 1 in SIGN (2010)Scottish Intercollegiate Guidelines Network. (2010). Management of Obesity: A national clinical guideline. Scottish Intercollegiate Guidelines Network.
Obesity statistics
Obesity in Scotland
Most people in Scotland are overweight: 2 out of every 3 adults and 1 out of every 4 children. People with a healthy weight are now in the minority.1
The statistics behind Scotland's obesity crisis are covered in more detail in a recent (2015) SPICe briefing.2
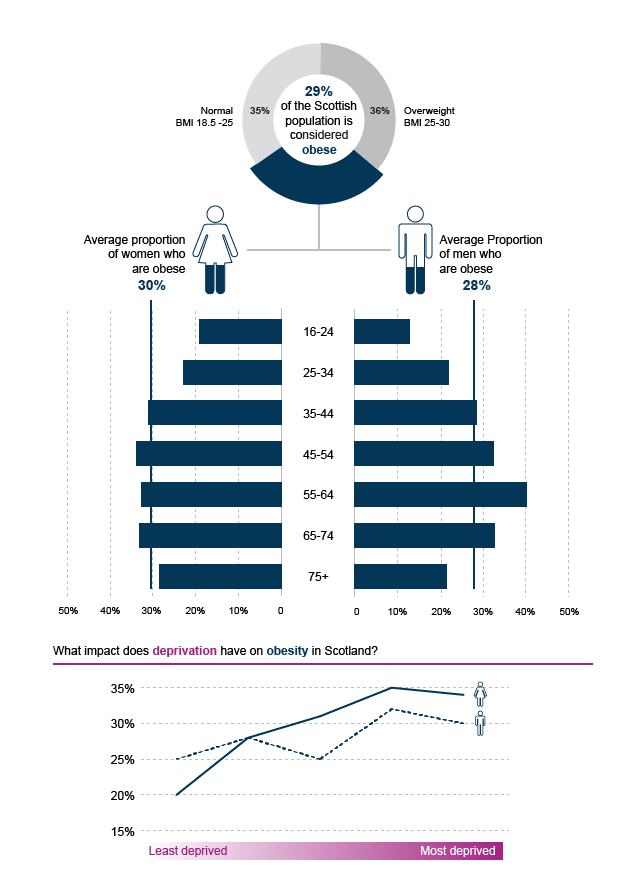
Briefly, the number of obese or overweight adults increased steadily between 1995 and 2008. Since then, the rate of increase has levelled off. In 2015, 65% of all adults were overweight or obese and 29% of all adults were obese.2
The number of children at risk of being overweight or obese has fluctuated since 1995. In 2015, 28% of children were at risk of being overweight and 15% were at risk of being obese.2
Effect of age, gender, region and socio-economic status
Being overweight is influenced by several factors: gender, age, region, income and education.2
Overall, men are more likely to be overweight, but women are more likely to be obese.
Young people are less likely to be overweight or obese. As people get older, overweight and obesity levels rise, with 55-74 years being the highest risk age group.1
In most developed countries, including Scotland, lower socio-economic status groups have a higher risk of obesity. There are several ways to measure socio-economic status: household income, area deprivation, occupation or educational achievement. But this 'inverse' relationship can usually be seen, regardless of the measurement used.1 8 9
Women from low socio-economic groups are often affected by obesity more acutely. In Scotland, 32% of women are obese in the most deprived areas, compared to 20% of women in the least deprived areas. For men, 30% obese in the most deprived areas, compared to 25% in the least deprived areas. 2 1 9
Finally, health board statistics show regional variations in obesity risk. Between 2008 and 2015, adult obesity was higher than the Scottish national average (29%) in:13
Fife (31%)
Lanarkshire (33%)
Shetland (33.2%)
Ayrshire & Arran (34%)
Orkney (36%)
Western Isles (36%)
Many of these regions have an older than average population.
How does Scotland compare with other countries?
England, Ireland, Scotland and Wales collect obesity statistics in different ways. This can make it difficult to compare between the countries. Nevertheless, the data suggests that Scotland has a slightly higher proportion of overweight and obese adults than the other UK countries.14 2 16
The Organisation for Economic Cooperation and Development (OECD) collects obesity statistics on its member countries. These are generally more developed countries. On average, 19.5% of adults in the OECD area are obese, compared with 26.9% of adults in the UK. This makes the UK the sixth most obese country out of the 35 OECD countries.16 If counted separately, Scotland would be the fifth most obese country in OECD area.
Finally, at a global scale, there are far more overweight people than malnourished people: 2,100 million people versus 840 million people respectively.8
Future trends
By 2030, the Scottish Government predicts that 40% of adults will be obese and many more overweight, even with current health improvement efforts. They also estimated (in 2010) that the direct cost to NHS Scotland would almost double.19
A Foresight project looked at possible obesity trends in the UK by 2050. Their model predicted that 90% of men and 85% of women could be overweight, whilst 60% of men and 50% of women could be obese.20
Reversing obesity levels looks difficult. No single country managed to reduce obesity prevalence between 2000 and 2013.8 Obesity prevalence has stabilised in a few countries. However in 2017, the OECD said there was no clear sign, in any country, of a reversal in obesity levels.16
What is the impact of obesity?
Health impact
Just being overweight reduces the average lifespan by 2 - 4 years. Being obese can reduce it by up to 10 years.1
Obesity has multiple health consequences: type II diabetes, hypertension, cardiovascular disease, strokes, musclo-skeletal problems, mental well-being. According to Cancer Research UK, just being overweight causes 13 types of cancer, including two of the most common cancers: breast and bowel cancer. In the UK, being overweight is the biggest single preventable cause of cancer after smoking.1 3 4
Many obesity-related health issues are costly to treat. Most are also chronic conditions, so they require lifelong medical support.1
On the other hand, moderate weight loss — which is defined as losing 5 to 10% of body weight over one year — reduces risk of death from most causes, including cancer and type II diabetes.6
Economic impact
Treating obesity costs NHS Scotland a substantial £0.6 billion, according to one estimate. In addition, there are considerable indirect costs to the Scottish economy, because obesity reduces average working life, productivity and well-being. In total, obesity is estimated to cost Scotland between £0.9 billion and £4.6 billion per year.1
Data from McKinsey Global Institute suggests that the global economic impact of obesity is roughly £1500 billion ($2000 billion), or about 3% of global GDP. The McKinsey Global Institute calculated that obesity is the "second-largest human-generated burden", just behind smoking, but greater than war, violence, terrorism, alcohol, drug use, climate change or road traffic accidents.8 To give an illustration of scale, Scottish onshore GDP was around £150 billion in 2016,9 so 3% of this would translate into approximately £5 billion.
What causes obesity?
Obesity is influenced by highly complex factors: genetics, evolution, biology, psychology, society and economics.
But central to obesity is a simple energy balance: the balance between energy intake and energy expenditure. Or, the amount of calories eaten versus the amount of calories burned by activity.
People are naturally inclined towards a 'positive' energy balance i.e. to consume more energy than they require.
For most of human history, humans have had to cope with hunger, rather than abundance. Like any other animal, humans have evolved to find and use energy as efficiently as possible. Most animals have an instinct to seek out energy rich food. If food is abundant, most will over-consume. Excess energy is stored as fat. This fat is burned up during lean periods, when food is scarce.
Modern life is very different. Not only is food readily available, calorie-dense food is often cheap and low effort to prepare. Technology is taking over many tasks that would once have required physical labour: from housework, to transport, to jobs. Taking exercise is now a choice that requires time, effort and, to a certain extent, access to facilities.
Unfortunately, the human instinct to over-consume is not suppressed when food is abundant. Neither is there an instinct to burn off extra calories. So this inclination towards a positive energy balance is exacerbated by the modern environment. Extra energy gradually adds up over time, resulting in weight gain.
Some experts call this an "obesogenic environment". The UK government's Foresight project analysed the factors which feed into this obesogenic environment. They identified more than 100 variables that directly or indirectly affect obesity. The complexity of this system is shown in the Figure below.1
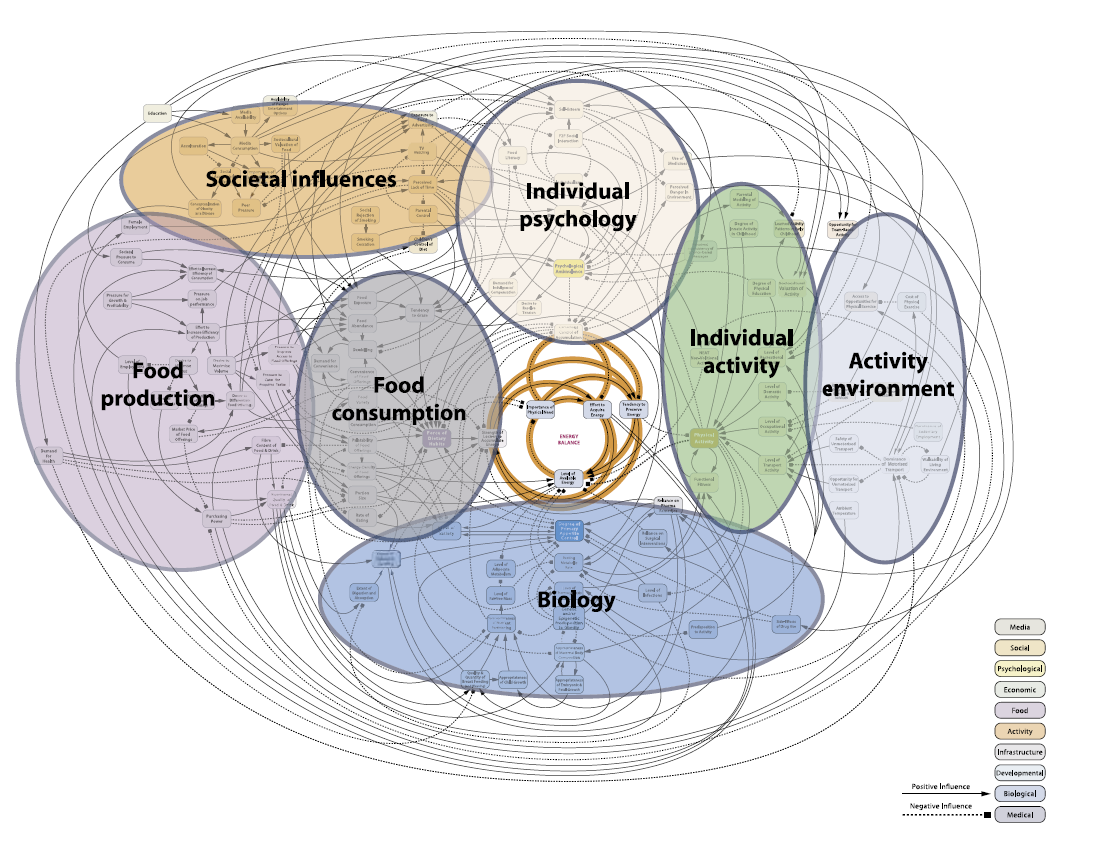
Dobbs, R., Sawers, C., Thompson, F., Manyika, J., Woetzal, J., Child, P., … Spatharou, A. (2014). Overcoming obesity: An initial economic analysis. McKinsey Global Institute.
This complex diagram can be viewed in more detail online here. A breakdown and explanation of this diagram can be viewed here. 3 4
The Foresight report suggests that, whilst obesity can be seen as an 'energy balance' between diet and physical activity, complex factors influence what people choose to eat and how active they can be.
Diet and obesity
Food and drink play a key role in understanding obesity. Diet determines total energy intake i.e. the number of calories consumed.
Definition of healthy food and drink
This briefing will refer to 'unhealthy food or drink products’ and ‘unhealthy diets’. For food or drink products, we defined unhealthy as being high in fat, sugar, salt or energy density.
For fat, sugar and salt, we defined high as exceeding the thresholds set by the Food Standards Scotland and the Food Standards Agency. Both organisations use these thresholds to determine whether food or drink product is high in fat, sugar or salt. They are shown in the Table below.
All expressed in number of grams per 100 grams.
| Nutrient | Low | Medium | High | |
|---|---|---|---|---|
| Fat | Total | Less than 3g | 3g to 17.5g | More than 17.5g |
| Saturated | Less than 1.5g | 1.5g to 5g | More than 5g | |
| Sugar | In food | Less than 5g | 5g to 22.5g | More than 22.5g |
| In drink | Less than 2.5g | 2.5g to 11.5g | More than 11.25g | |
| Salt | Salt | Less than 0.3g | 0.3g to 1.5g | More than 1.5g |
http://www.foodstandards.gov.scot/nutrition-healthy-eating
For energy density, we defined high as exceeding the recommended upper limit of the Scottish Dietary Goal for energy density. This is shown in the Table below.
| Scottish Dietary Goal | |
|---|---|
| Average Energy Density of Overall Diet: | 125 kcal per 100 g |
Food Standards Scotland. (2015). The Scottish Diet: It Needs to Change. Food Standards Scotland.
However, there is a difference between unhealthy food or drink products and an unhealthy diet. Overall diet is the sum of all the food and drink that someone consumes. It is possible to have an overall healthy diet, despite having the occasional unhealthy treat. It is possible to have an overall unhealthy diet by over-consuming food or drink products. Food Standards Scotland publishes advice on what a healthy diet looks like in their ‘Eatwell Guide’.2 In this briefing, an unhealthy diet is defined as not meeting these guidelines.
How healthy is the average Scottish diet?
Overall, Scotland has an unhealthy diet. The healthiness of the Scottish diet is monitored nationally, using the Scottish Dietary Goals. These were first established in 1996 and recently revised in March 2016.3 Recommendations cover:
Total energy intake
Average energy density
Fruit and vegetables
Oily fish
Red meat
Fats
Free sugars
Salt
Fibre
Total carbohydrate
Unfortunately, Scotland has made no progress towards the Scottish Dietary Goals since 2001.
People eat (or drink) too many calories, too much sugar, too much fat and too much salt. Simultaneously, people do not eat enough fruit, vegetables, fibre or oily fish.1
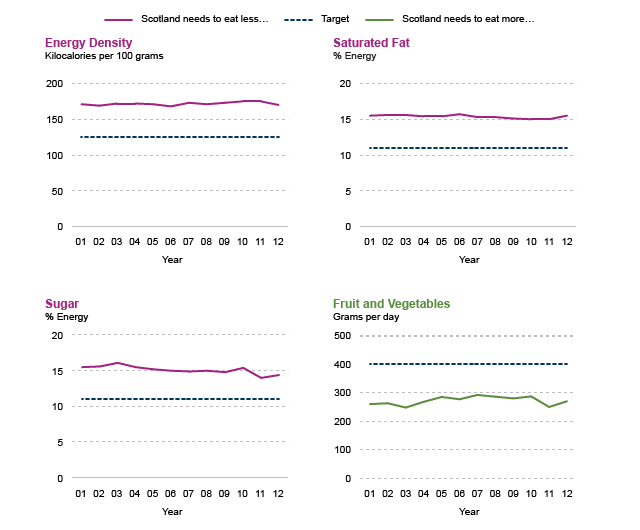
Food Standards Scotland. (2015). The Scottish Diet: It Needs to Change. Food Standards Scotland.
What are people eating at home?
Food Standards Scotland (FSS) monitors the Scottish diet. Their analysis shows that Scotland eats too much discretionary food and drink. Biscuits, cakes, pastries and confectionery are all found in the top 10 of items bought. These are often high in sugar, fat and energy. Scotland also gets too much sugar from sugar-sweetened soft drinks.6
FSS recommends that Scotland needs to significantly reduce its intake of discretionary food by an estimated 50%.6
Socio-economic status affects what people eat at home. Households in the most deprived areas get a higher proportion of their total calories from confectionery, soft drinks and bread. Households from the least deprived areas get a higher proportion of their total calories from starchy carbohydrates, oil-rich fish, fruit and vegetables. (But also cakes and pastries!).6
There are also strong seasonal patterns, particularly at Christmas and Easter. In the 12 weeks before Christmas, there is a 10% increase in food and drink purchases. That includes a 20% increase in snack purchases, 32% increase in cake & pastry purchases and 54% increase in confectionery purchases. If eaten, that is equivalent to an extra 9000 calories, or a 1 kg gain in weight for every person in Scotland.6
Price promotions may influence type of food that people buy. In Scotland, around 40% of all take home food and drink is bought on price promotion. Discretionary food and drink are more frequently bought on promotion. In Scotland, around 50% of discretionary products were bought on promotion, compared to around 30% of staple or healthy products. FSS points to evidence that suggests other marketing strategies —advertising and product placement — may also encourage this.6
What are people eating away from home?
Food service (eating out of the home) is an important industry in Scotland. Restaurants, cafés, fast food outlets and retailers selling ‘meal-deals’ are all classified as food service establishments.11
In 2015, 948 million visits were made to food service establishments. Recent figures suggest that the Scottish food service industry is growing, and growing faster than the rest of the UK. People in the UK, including Scotland, visit food service outlets more frequently than other European countries (except Italy which has a very strong coffee sector).11
The food service industry therefore forms an important part of the Scottish diet. In 2015, the UK population got 11% of its total energy intake from eating out.13 Evidence from FSS shows that food and drink consumed away from the home is skewed towards less healthy options.14
In Scotland, quick service restaurants receive the largest proportion of visits. These are establishments that serve food quickly, often have minimal table service and include the typical fast food outlets. Compared to the UK, Scotland has a higher proportion of visits to quick service fish and chips, quick service bakery and quick service ethnic foods. The top five brands in 2015 were McDonald’s, Greggs, Tesco, Asda and Morrisons.11
In Scotland, many of the top food and beverage items consumed out of the home are less healthy. The most commonly bought items are chips or fries, cakes, biscuits, pastries and regular cola. Children (0-12 years) have unhealthy food and drink more frequently than adults.11
In 2015, only 4% of Scottish people said they ate out because they wanted a "healthy meal". This has declined since 2012.11
What is the cost of a healthy diet?
The ‘affordability’ of a healthy diet has been subject to some debate. Several studies have attempted to estimate this, but findings depend on precisely what factors are being compared.
Some studies have compared the cost of a healthy diet with an unhealthy diet. One UK modelling study found little difference between cost of the recommended ‘Eatwell Guide’ diet and the average UK diet: £5.99 versus £6.02 per adult per day. Although the study predicted that more money would be spent on fruit and vegetables, it found this cost should be balanced out by less money being spent on meat and other proteins. This suggests that, in theory, a healthy diet should be no more expensive than the average UK diet.18 In contrast, an international review found that an unhealthy diet could be up to $1.54 (£1.15) cheaper per 2000 calories than a healthy diet. Over a year that could save $560 (£420).19
Meanwhile, other studies have compared the costs of food and drink products. For example, a UK study found 1000 calories from unhealthy food products cost £2.50 in 2012. In contrast, 1,000 calories from healthy food products cost £7.49. Fruit and vegetables had the highest cost per 1,000 calories. Crucially, they found a growing price gap between healthy and unhealthy products.20
‘Affordability’ may differ depending on what units are used for making comparisons. Some have compared the price per 1000 calories whilst others compare the price per kilogram. It is also worth noting that many studies do not incorporate cooking costs when comparing diets.
Regardless, in the UK, deprived households use a greater proportion of their income to buy food. In 2016, the most deprived spent twice as much of their income on food compared to the most affluent: 17% versus 8% of income.21 This suggests the most deprived may be more sensitive to any differences in affordability.
Physical activity and obesity
Physical activity also plays a role in understanding obesity, as it determines total energy expenditure.
The National Institute for Health and Care Excellence (NICE) recommends that people aim to:
Do at least 150 minutes of moderate aerobic physical activity in a week
Or, do at least 75 minutes of vigorous aerobic physical activity in a week
Or, do an equivalent combination of the two.1
In 2015, 63% of adults in Scotland met these guidelines. There has been no significant change in activity levels since 2012.
Effect of age, gender and deprivation
Men are more likely than women to meet the guidelines: 67% compared to 59% of women in 2015.
Younger adults are more likely to meet the guidelines and activity steadily declines with age. People aged 16 - 24 years are the most active, with 75% meeting the guidelines in 2015. Adults over 75 years are the least active, with 31% meeting recommendations.
There appears to be an interaction between age and gender. As they get older, women are increasingly less likely to meet the guidelines compared to men in the same age category.
Deprivation reduces adult activity levels. In 2015, adults in the least deprived areas of Scotland were relatively active, with 71% meeting guidelines. But activity declines steadily with increasing deprivation. In the most deprived areas of Scotland, 50% of adults meet the guidelines. This pattern can be observed in both men and women.2
Sedentary activity
Sedentary activity is the opposite of physical activity. It is the amount of leisure time spent sitting, perhaps whilst eating, reading, watching TV or studying. Generally, people use less energy when sedentary.
On average in 2015, adults spent 5 hours on weekdays and 6 hours on weekend days being sedentary. This excludes time at work. Children were sedentary for just over 3 hours on weekdays and 4.5 hours on weekend days. This excludes time at school or nursery.3
Current obesity policy
Who is responsible for obesity policy in Scotland?
Policy to tackle obesity is spread across a variety of policy areas. This covers a mixture of devolved and reserved legislative competencies. This is likely to become more complicated and changeable as a result of the Brexit process.
Examples of largely devolved areas include: health, education, sport, agriculture, transport, planning and local government. Examples largely reserved areas include: consumer law, trade, social security and benefits.
Many policy interventions have been proposed in order to tackle obesity. This briefing will discuss the rationale and evidence behind 25 of these proposals. In each case, further work may be needed to identify the exact split between devolved and reserved responsibilities.
Overview of current obesity policy in Scotland
In 2008 Scotland's obesity strategy was launched. Called 'Healthy Eating, Active Living' (HEAL) it was in effect for 3 years.1
In 2010, the Scottish Government launched the Obesity Route Map (ORM), which was intended to strengthen the focus on obesity prevention.2 3 An accompanying Action Plan was released a year later, translating the ORM into 62 actions.2 5 Actions fell into four themes:
Energy consumption: actions to reduce exposure to high calorie food and reduce the number of calories eaten.
Energy expenditure: actions to increase opportunities for 'active travel', exercise and minimise sedentary behaviour.
Early years: actions to teach or encourage healthy habits from a young age.
Working lives: actions to encourage organisations to be responsible for the health of their employees.
The Joint Obesity Ministerial Group was set up in 2010 to monitor the Obesity Route Map.
In addition to the Action Plan, an analytic framework was developed.6 Sixteen key indicators have been used to monitor the impact of the ORM. Scotland's performance against these indicators is described in the most recent statistical bulletin.7 This is also described in the recent SPICe briefing on obesity.3
The Scottish Public Health Network (ScotPHN) recently reviewed the ORM and its progress (2015).9 With regards to the ORM actions, they found that:
Actions focussed on prevention rather than treatment.
A few actions successfully reached their milestones. Most actions showed progress towards their milestones.
Slightly more actions focussed on physical activity, compared to diet.
Many actions depended on individual behaviour and people choosing to opt into health initiatives.
The distribution of interventions was skewed towards "socio-cultural" measures (which they defined as attitudes, beliefs and values) and "physical environment" measures (which they defined as buildings, amenities and facilities).
There was less emphasis on "legislative" or "economic" measures. 10 9
ScotPHN identified issues with leadership. They said the ORM lacked central drive from the Joint Obesity Ministerial Group. Stakeholders were not systematically assigned actions to carry out. Rather, they were responsible for identifying actions to progress themselves.9
ScotPHN also identified issues with monitoring. This was often carried out by the lead agencies, which sometimes lacked the mechanisms necessary for effective monitoring. Some actions were monitored for a short time only. ScotPHN found limited information and evaluation, meaning it is hard to identify actions worth scaling up.9
Where next for obesity policy?
Scottish Government is planning to release a new obesity strategy in Winter 2017.
Tackling obesity in Scotland
The remainder of the briefing looks at how policy interventions could be used to reduce obesity levels in Scotland.
The first section explores four common themes in the debate surrounding obesity and how it ‘should’ be tackled.
Several organisations have recommended policy interventions for reducing obesity in Scotland or the British Isles. The second section reviews these publications and their recommendations.
In addition to producing this briefing, SPICe has conducted a survey of Scottish academics to ask them, in their opinion, what policy interventions would most reduce obesity in Scotland? The key results from this survey are also summarised in the second section.
Finally, the briefing takes a closer look at 25 policy areas which could be used to reduce obesity in Scotland.
What are the common areas of debate?
Four common themes emerge from the debate surrounding obesity and how best to tackle it. These are:
To what degree is obesity a personal responsibility or a societal responsibility?
What combination of treatment interventions and preventative interventions would be most effective?
In what cases should voluntary agreements with industry be used and when is government regulation more effective?
How can effective policy be developed with sometimes ‘imperfect’ knowledge?
The following four sections will explore the debate around each of these questions.
Personal or societal responsibility?
What causes obesity: personal choice or the environment?
A number of high profile publications — from academic experts to doctors — agree that there is an "obesogenic environment" in many developed countries, including the UK.1 2 3 4 5
Obesogenic is a term used to describe environments — places — which encourage obesity-promoting behaviours. For example, in many towns and cities, food and drink is easy to find, particularly calorie-dense, but nutrition-poor items. These products are often quick to eat, as they require minimal preparation or cooking. They may also be cheaper than healthier options. Meanwhile, jobs are increasingly sedentary. Transport in the UK is heavily reliant on car use. Technology has taken over many tasks that would once have required physical labour. Taking exercise is now a choice that requires time, effort and, to a certain extent, access to facilities.
This leads to an interesting question: to what extent are obesity rates influenced by factors outside of personal control? For example, the economy, structure of the job market, layout of streets and residential areas, urban planning, land use, education, societal customs, trade, marketing and advertising. Consequently, to what extent is obesity a personal responsibility or a societal responsibility?
Different policy options may be preferred, depending on the point-of-view taken in this debate.
Examples of interventions that treat obesity more as personal responsibility include: labelling food, weight management programmes and education. In general terms, they rely more on people consciously making — or learning to make — healthier choices.
Examples of interventions that treat obesity more as societal responsibility include: reformulation, restricting car use or making unhealthy food less accessible. In general terms, they aim to make healthier choices require less 'effort' (or make less healthy choices require greater 'effort').
Prevention or treatment?
Treatment interventions aim to help people reduce their weight. Examples of treatment-focussed interventions include, weight loss surgery, pharmaceuticals, diet and exercise programmes.
Prevention interventions aim to stop people from gaining weight. Examples of prevention-focussed interventions include: reducing calories in food, providing healthy school meals, encouraging walking or cycling.
The Scottish Government's obesity policy, the Obesity Route Map, was designed to have a greater focus on preventing obesity:
We need to redress the balance and ... spend more on prevention, leading to the need for less to be spent on treatment of the effects of obesity in years to come.
The Scottish Government. (2010). Overweight and Obesity in Scotland: A Route Map Towards Healthy Weight. The Scottish Government.
Others have argued that treatment and prevention should not be divorced from each other.
Treatment should not be divorced from prevention. The maintenance of weight loss and the prevention of weight regain is a critical yet under-researched component of treatment.
Butland, B., Jebb, S., Kopelman, P., McPherson, K., Mardell, J., & Parry, V. (2007). Tackling Obesities: Future Choices. Foresight Reviews.
Working with industry: voluntary approaches or government regulation?
Actions taken by the food and drink industry may have an effect on obesity trends for example relating to: the composition of food, drink and meals, portion sizing, package labelling, menu labelling, marketing, advertising, promotional activities and the location of facilities.
Examples of voluntary approaches
Businesses have been encouraged to undertake voluntary actions in order to support healthy choices. The UK Government has encouraged this through their 'Responsibility Deal' and the Scottish Government has encouraged this through their 'Supporting Healthy Choices Framework'. Examples of pledges include reducing salt content, removing artificial trans fats from products and providing calorie information. 1 2 3
More recently, greater focus has been directed specifically at reformulation. Reformulation involves altering food or drink products to limit the amount of sugar, fat, salt or calories.
Public Health England published sugar reduction guidelines in March 2017, to encourage manufacturers to reduce sugar by 20% by 2020 in 9 product groups:4
Breakfast cereals
Yogurts
Biscuits
Cakes
Morning goods
Puddings
Ice creams, lollies and sorbets
Confectionery
Sweet spreads
PHE set an interim target for industry: a 5% reduction in sugar content by August 2017. A report on progress towards these targets is due in March 2018. This will be followed by calorie and fat reduction guidelines in late 2017 and early 2018.4 6
Successes of a voluntary approach
Scottish food businesses have become involved with voluntary actions. For example, Food and Drink Federation Scotland is a trade association, representing food and drink manufacturers in Scotland. FDF Scotland participates in the Supporting Healthy Choices Framework. It has produced guidance for Scottish small and medium-sized enterprises (SMEs) on reformulation, encouraged front-of-pack nutrition labelling and has set up a reformulation common interest group.7
Voluntary reformulation programmes seem to have reduced salt consumption. In 2006, the Food Standards Agency launched a voluntary, but structured reformulation programme. This set industry targets and target deadlines, starting from 2006. The UK government ran a concurrent public awareness campaign starting from 2003. Between 2005 and 2011, there was a 5% reduction in the salt content of British households’ groceries. The Institute for Fiscal Studies found that this reduction was "entirely attributable" to product reformulation. The awareness campaign had little impact and, in general, consumers actually switched to higher salt products. This suggests that reformulation can successfully alter diets without relying on consumer behaviour.8
There is also evidence that some manufacturers are responding to sugar content guidelines. In March 2017, Nestle UK announced plans to reduce the sugar content in its products by 10%. This includes famous brands such as Kit Kat, Yorkie and Aero.9
Drawbacks of a voluntary approach
Reducing calorie, sugar and fat content has shown more mixed progress in Scotland. A Food Standards Scotland report looked at the nutritional content of products which were purchased by consumers to eat at home. Between 2010 and 2015, there was little change in total calories, sugars, fats and saturated fats, whether measured in total volume or on a per capita basis. 10
Durand et al. (2015) interviewed 50 industry partners of the UK Government Responsibility Deal. Many felt that the voluntary approach created an ‘uneven playing field’ between partners and non-partners.11 Firstly, not all businesses signed up to the deal. Secondly, of the businesses that did sign up, not all followed through on their promised actions. Some businesses felt that they had invested in changing, but received no substantial benefits, whilst there were no consequences for not taking part. By participating, some felt that they ended up at a competitive disadvantage. 11 13 14
For this reason, Food Standards Scotland has proposed that consideration should be given to government regulations that may create a more "level playing field".14
Examples of government regulation
The UK government is expecting to introduce a levy on the soft drinks industry from April 2018. The levy was announced in the 2016 Budget and legislation will be introduced in the Finance Bill 2017. The levy will be applied to producers and importers of sugar-added soft drinks. The rate will vary according to sugar content: a lower rate will be applied to drinks with more than 5g in 100ml and a higher rate applied to drinks with more than 8g per 100ml.16
Manufacturers and retailers — such as Lucozade, Ribena and Tesco — have announced plans to reduce the total sugar content of their products. The Chancellor of the Exchequer has reduced the forecast revenue from the levy, because of reformulation action taken by industry.17
However, some groups have called for government regulation to be considered in other areas, beyond reformulation.
"The evidence on voluntary approaches overall is not good, as is demonstrated by the poor response from industry to Supporting Healthy Choices.
On the basis of a lack of progress based on voluntary measures, it would appear that regulation may be warranted. Areas identified for exploration on this basis are as follows:
Price and promotions
Advertising and marketing
Portion size and reduction of calorie dense foods
Reformulation
Taxation of high sugar products including sugar sweetened beverages
Control of the built environment at a local level through licensing and/or planning conditions"
Food Standards Scotland (2016)14
What do the general public think?
Food Standards Scotland has been asking Scottish consumers what they think about introducing government regulations in two areas: reformulation and taxes.19
Reformulation: Three-quarters (75%) support government regulated reformulation.
Taxes: Around half (53%) are in favour of taxes on sugary drinks. Slightly less people are in favour of taxing other unhealthy food and drink categories. However, support for taxes increased to 59% if taxes meant that the price of healthy food would decrease.
More generally, public acceptance of government interventions can depend on several factors. One review article in BMC Public Health (2013) examined public attitudes towards tobacco, alcohol, diet and physical activity interventions. It drew on studies undertaken in Europe, North America, Australia and New Zealand. Public acceptance was often related to:20
Target behaviour: Tackling smoking was often more popular than alcohol or diet. However, public attitudes did change over time and were influenced by new legislation or campaigns.
Type of intervention: Less intrusive interventions were preferred. Once interventions had been implemented, they often became more accepted. Interventions targeting children and young people attracted the most support.
Personal characteristics: Support for government interventions was often higher in groups who did not engage in the target behaviour. Overall, women and older people were more likely to support restrictive interventions.20
How to deal with imperfect evidence?
Ideally, obesity interventions would be chosen based on a background of strong evidence.
Unfortunately, it is not possible to gather a 'perfect' evidence base for many of the proposed interventions. For example, no experiment can really test how changing a country's agricultural policy would affect diet.
There are problems even where there is a lot of evidence. 'Randomised Control Trials' (RCTs)i are considered to be a 'gold-standard' method of testing interventions. For example, RCTs have been used to test pharmaceuticals2.
However, many RCTs take place in relatively simple and controlled experimental settings. They do not guarantee significant results in the complex mess of the real world.
Finally, there are interventions supported by a strong body of evidence. However, no single intervention appears sufficient to reverse the obesity epidemic. Many experts have warned that there is no 'silver bullet' for curing obesity. Many different interventions have been proposed across a range of areas. Each intervention has a different potential and has been tested to different degrees. This makes prioritising interventions difficult. 3 4 5 6
The McKinsey Global Institute argues that waiting for perfect evidence is not pragmatic:
"More investment is required, especially in understanding the effectiveness of intervention measures when they are applied as part of a comprehensive program. But society should also be prepared to experiment with possible interventions. In many intervention areas, impact data from high-quality, randomized control trials are not possible to gather. So, rather than waiting for such data, the relevant sectors of society should be pragmatic with a bias toward action, especially where the risks of intervening are low, using trial and error to flesh out their understanding of potential solutions."
McKinsey Global Institute Report (2014)4
This leaves several important questions for policy makers. How much evidence is necessary to choose an intervention? At what point is it appropriate to act on the evidence for an intervention? What combination of interventions has the best chance of working?
What policy interventions have been recommended?
Several organisations have published recommendations for tackling obesity in the UK or Ireland.
Recommendations from the McKinsey Global Institute
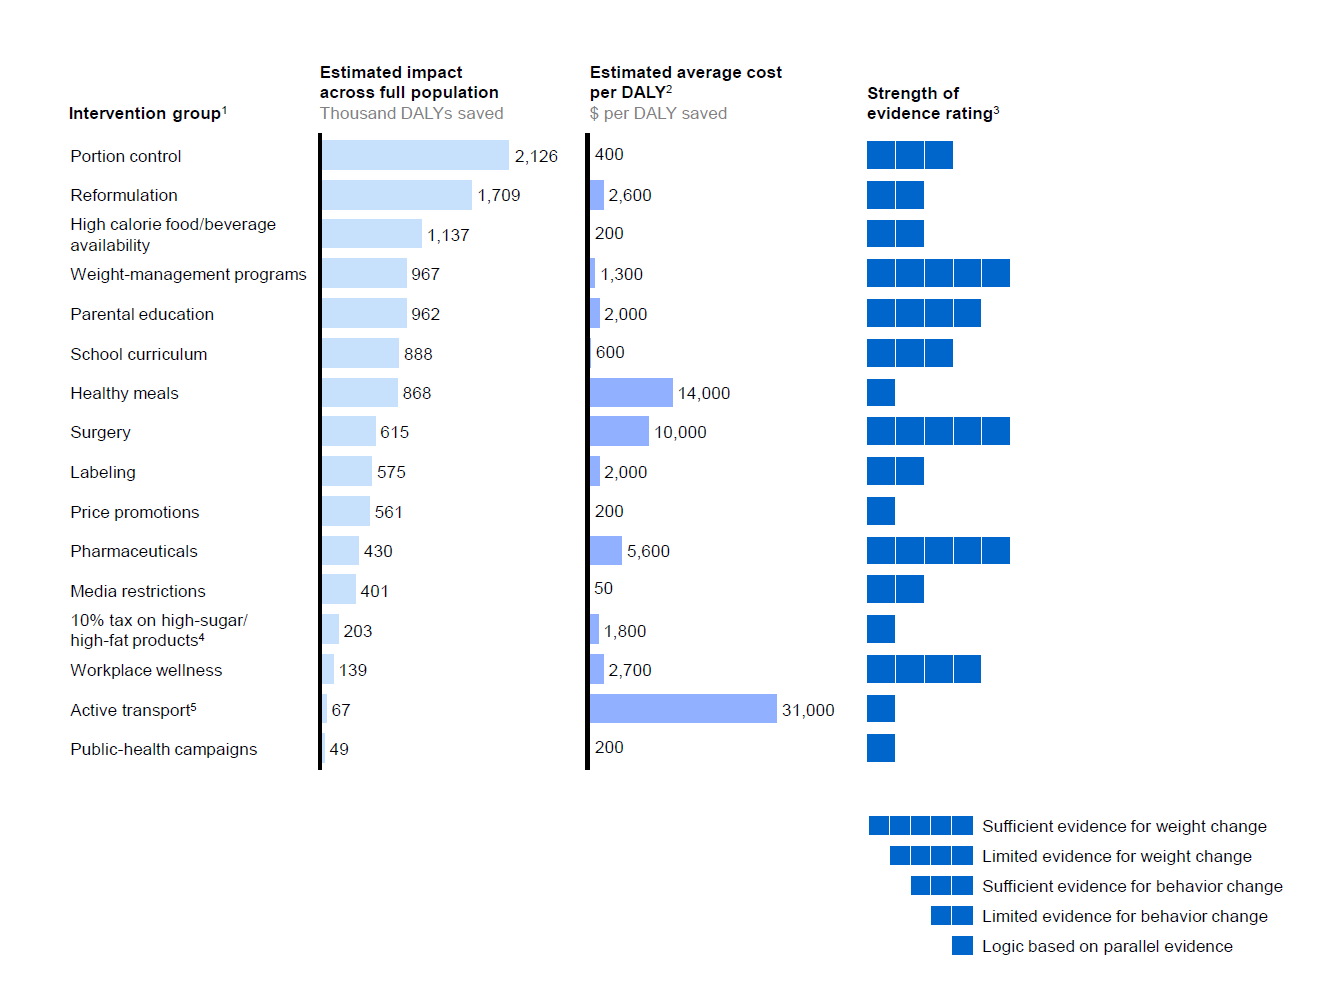
A recent high-profile report by the McKinsey Global Institute1 identified potential policy interventions. It also estimated their impact and cost-effectiveness. The authors identified 74 possible interventions. These interventions were being either used or piloted somewhere in the world, for example by central governments, local governments, employers, schools, health-care systems or the food industry.
The McKinsey Global Institute assessed interventions in three ways: they estimated the number of 'Disability Adjusted Life Years'i (DALYs) saved, cost-effectiveness and the strength of the evidence.
When ranked by DALYs saved, their top 10 interventions were:
Reducing portion sizes
Reformulation
Reducing the availability of high calorie food and drink.
Weight management programmes
Parental education
School curriculum
Providing healthy meals
Surgery
Labelling
Restricting price promotions
For each intervention, the Mckinsey Global Institute calculated DALYs saved, cost per DALY and the strength of the supporting evidence.
McKinsey Global Institute Dobbs, R., Sawers, C., Thompson, F., Manyika, J., Woetzal, J., Child, P., … Spatharou, A. (2014). Overcoming obesity: An initial economic analysis. McKinsey Global Institute.
This report assessed cost-effectiveness using the following definition from the World Health Organisation (WHO):
Highly cost-effective: Interventions which cost less than 1 x per capita GDP per DALY saved. In the UK, that is roughly equivalent to less than £22,500 ($30,000) per DALY saved.
Cost-effective: Interventions cost 1 - 3 x per capita GDP per DALY saved. In the UK, that is roughly equivalent to £22,500 to £67,500 ($30,000 to $90,000) per DALY saved.
Not cost-effective: Any intervention which costs more than 3 x per capita GDP. In the UK, that is roughly equivalent to more than £67,500 ($90,000) per DALY saved.
They found that most of the interventions they assessed were either 'highly cost-effective' or 'cost-effective'. This is shown in the figure above.
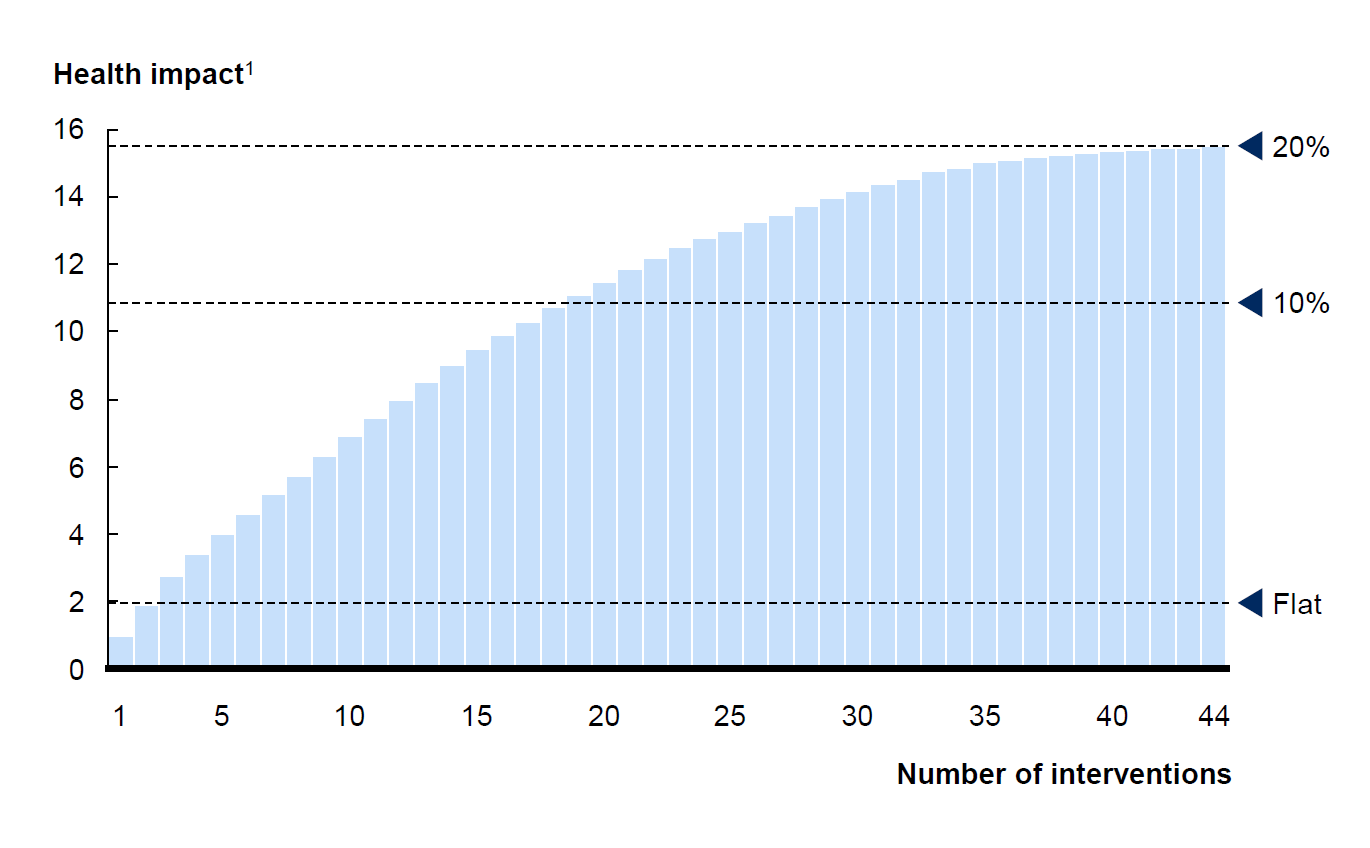
They also found that no single intervention could reverse obesity levels. Around 18 interventions were necessary to reduce the number of overweight or obese people by 10%. Around 40 interventions were necessary to reduce the number of overweight or obese people by 20%. They therefore recommend taking a broad approach to tackling obesity and implementing as many as interventions as possible:
No single solution creates sufficient impact to reverse obesity: only a comprehensive, systemic program of multiple interventions is likely to be effective. Our analysis suggests that any single intervention is likely to have only a small impact at the aggregate level.
If the United Kingdom were to deploy all the interventions that we have been able to size at reasonable scale, the research finds that it could reverse rising obesity and bring about 20 percent of overweight and obese individuals—or roughly the population of Austria—back into the normal weight category within five to ten years (Exhibit E2). This would have an estimated economic benefit of around $25 billion a year, including a saving of about $1.2 billion a year for the UK NHS.
Dobbs, R., Sawers, C., Thompson, F., Manyika, J., Woetzal, J., Child, P., … Spatharou, A. (2014). Overcoming obesity: An initial economic analysis. McKinsey Global Institute.
Health impact is expressed in million DALYs saved over full lifetime of 2014 UK population, taking into account health benefits accrued later in life. The dashed lines show the impact equivalent to a 10% and 20% reduction in overweight people.
McKinsey Global InstituteDobbs, R., Sawers, C., Thompson, F., Manyika, J., Woetzal, J., Child, P., … Spatharou, A. (2014). Overcoming obesity: An initial economic analysis. McKinsey Global Institute.
Recommendations from Food Standards Scotland
Food Standards Scotland (FSS) was established by the Food (Scotland) Act 2015. It is a 'non-ministerial department' of the Scottish Government. It is responsible for food safety, standards, labelling and inspection in Scotland. It also provides evidence-based diet and nutrition advice for Ministers, Scottish government and consumers.1
In 2016, FSS set out a number of proposals designed to specifically improve the Scottish diet (see Annex A on page 19 of their report). These proposals cover the following areas:
Price and promotions
Portion size reductions
Advertising and marketing
Reformulation
Taxation
Empowering consumers
Public information campaigns
Education on diabetes
Affordability and acceptability of a healthy diet
Provision of consistent dietary messaging
Recommendations from the healthcare profession
The medical profession have also published recommendations on tackling obesity in the UK and Ireland.
The Academy of Medical Royal Colleges (AMRC) published recommendations for tackling obesity in 2013.1
The first four recommendations are targeted specifically at the healthcare profession:
Education for healthcare professionals
Provide weight management services
Introduce nutritional standards in hospitals
Increase support for new parents
However, the remaining recommendations are directed at the government or its partner agencies. The recommendations explicitly aim to tackle the obesogenic environment and make the healthy options the easy option.
Introduce nutritional standards in schools
Restrict fast-food outlets near schools
Restrict advertising of food high in saturated fats, sugar and salt
Introduce a sugary drink tax
Introduce a traffic light labelling system
Change the built environment to facilitate active travel
Similarly, in 2014 the Royal College of Physicians of Ireland (RCPI) published recommendations on tackling obesity in Ireland.2 They recommended the following public policy measures:
Monitor the location of fast-food outlets
Restrict advertising of food high in saturated fats, sugar and salt
Monitor marketing activity on food and drink products targeting children
Introduce a sugary drink tax
Introduce a front-of-packet traffic light labelling system
Change the built environment to facilitate active travel
Results from a survey of Scottish academia
To support this briefing, SPICe conducted a survey of Scottish academics. More detailed information on this survey in included in Appendix A.
What was the aim of the survey?
In the opinion of Scotland's academics, what interventions would most reduce obesity levels in Scotland?
Background to the survey
The survey was based on the interventions listed in the McKinsey Global Institute report. Their catalogue of 74 possible interventions was shortened to 62 interventions, by condensing similar interventions together or removing interventions that were not relevant to a Scottish or UK context.
How was it carried out?
The survey was carried in May and June 2017. Academics working on obesity or related areas in Scotland were contacted. In total, 37 academics responded.
Academics were asked, in their opinion, which interventions they thought would most reduce obesity in Scotland.
They had 100 points to split between interventions in any way they liked. For example:
They could give 1 intervention all 100 points, if they thought that investing in a single intervention would be the best way of reducing obesity in Scotland.
They could select 50 interventions and give each one 2 points, if they thought that a broad approach would most reduce obesity in Scotland.
Or, they could do anything in between these extremes.
Results
The results should be interpreted with caution: they give a flavour of the respondents’ views and are not an assessment of the weight of evidence.
The 10 most popular interventions are shown in the table below.
| Interventions Receiving the Most Points | Total Points | % All Points |
|---|---|---|
| Facilitate walking and cycling | 267 | 7% |
| Reduce relative price of healthy food or drink by adding agricultural subsidies | 201 | 5% |
| Provide free or subsidised healthy school meals | 153 | 4% |
| Reformulation of food or drink products through government regulations | 151 | 4% |
| Provide health, diet and exercise education for children | 151 | 4% |
| Introduce levies on manufacturers or retailers of unhealthy food or drink | 143 | 4% |
| Restrict promotions on unhealthy food or drink through government regulation | 114 | 3% |
| Restrict advertising of unhealthy food or drink across all media through government regulation | 111 | 3% |
| Prescribe coupons for healthy food | 108 | 3% |
| Increase relative price of unhealthy food or drink through tax | 104 | 3% |
However, the central finding is the wide spread of support for interventions. This reinforces the fact that there is no single ‘cure’ for obesity. Scottish academics support a broad range of policy interventions.
Comparing recommendations
When making policy recommendations, each organisation has had a slightly different focus, used slightly different approaches or phrased policy interventions in slightly different ways.
Despite this, some policy interventions seem to be recommended by multiple organisations, although in some case, they may be phrased in different ways or specify slightly different details. For example, the AMRC recommends introducing a traffic light labelling system, whilst the RCPI recommends introducing a front-of-pack traffic light labelling system.
The table below gives a broad comparison of policy intervention areas recommended by different organisations. Potential areas highlighted by three or more sources include:
Taxing unhealthy food or drink products
Restricting advertising and marketing of unhealthy food or drink
Changing the built environment to facilitate active travel
Providing health education for parents, children and healthcare professionals
Providing healthy meals in schools, workplaces and hospitals
Limiting the availability of unhealthy food and drink
Better labelling of food, drink and meals
Exploring potential policy interventions
The remainder of the briefing explores potential policy interventions in more detail. Interventions are drawn from the McKinsey Global Institute report, which catalogued 74 possible interventions. They chose interventions that were being used or piloted somewhere in the world, for example by central governments, local governments, employers, schools, health-care systems or the food industry. The full list is available in Table E1 of the McKinsey report.1
This list of interventions was distilled down into 25 intervention groups: collections of similar interventions. These might tackle a similar aspect of obesity, be implemented in a similar way or have a similar aim. The 25 intervention groups are shown in the table below.
These 25 intervention groups can also be organised into 8 'themes': environmental, economic, media and marketing, food information, food content, healthcare and education. This is shown in the table below.
| Theme | Intervention Areas |
|---|---|
| Economic | Taxing unhealthy food and drink |
| Subsidising healthy food and drink | |
| Removing agricultural subsidies from unhealthy food | |
| Adding agricultural subsidies to healthy food | |
| Education | Public health campaigns |
| Providing health education | |
| Providing household management education | |
| Environment | Facilitate walking and cycling |
| Discourage car usage | |
| Neighbourhood safety and appeal | |
| Exercise facilities | |
| Food facilities | |
| Food access and availability | Access to healthy meals |
| Layout and contents of retailers | |
| Food content | Reformulation |
| Energy and portion size | |
| Food information | Labelling food and drink products |
| Labelling menus | |
| Healthcare | Surgery and pharmaceuticals |
| Weight management programmes | |
| Enabling a healthy lifestyle | |
| Incentivising a healthy lifestyle | |
| Media and marketing | Advertising |
| Price promotions | |
| Other promotional activity |
The following sections explore available background and evidence for each potential intervention group. The information for each intervention group is arranged in a table, formatted as follows:
| Aim | What is the aim of this group of interventions? |
| Current situation in Scotland | Summary and statistics about the current situation in Scotland. |
| Example interventions | List of example interventions. These are not recommendations, but examples of interventions that have been proposed. This is also not an exhaustive list. |
| Evidence that it will improve health? | Effect on healthy choices:Has SPICe identified evidence that these interventions would encourage healthy choices, such as reducing energy intake, choosing to eat more fruit and vegetables, or doing more exercise? Is this likely to have a small or large effect?Where is this evidence from: reviews or primary studies? Effect on obesity: Has SPICe identified evidence that these interventions reduce weight or BMI, either at the individual or population level? Is this likely to have a small or large effect?Where is this evidence from: reviews or primary studies? |
| Intervention currently in use? | Is this intervention currently being used in Scotland, the UK or elsewhere? |
Assessing the evidence
In the ideal world, there would be good experimental evidence that reduces obesity. Unfortunately, it may not always be feasible to measure change in population obesity. It may be easier to obtain data on energy intake, vegetable consumption, or exercise duration. Hence, two questions were used to assess the evidence behind interventions:
Is there evidence that the intervention encourages healthy choices?
Is there evidence that the intervention reduces obesity levels?
Evidence may come from:
Reviews: Reviews analyse the outcomes of multiple trials or experiments. Reviews can indicate if there is general consensus that an intervention works, or does not work.
Primary studies: A primary study reports the outcome of a single trial or experiment.
This system is based on the method used by the McKinsey Global Institute report.1
Generally, evidence from a review is considered more convincing than evidence from a primary study. However, a review based on multiple, poor-quality trials should be used with appropriate caution. Similarly, a high-quality randomised controlled trial (RCT) may be considered good evidence.
The evidence included in the following sections was identified between May and July 2017, whilst this briefing was being produced, and given the amount of research in this area may well not be comprehensive.
Economic interventions
Taxing unhealthy food and drink
| Aim | To discourage overconsumption of food and drink. |
| Current situation in Scotland | Scotland needs to reduce its intake of discretionary food and drink by 50%. That includes soft drinks, confectionery, biscuits, cakes, pastries and savoury snacks.1Increasing the price of unhealthy food and drink may discourage people from buying these items. The UK government will be introducing a levy on the soft drinks industry in 2018. It will be applied to producers and importers. There will be a lower rate for drinks with a total sugar content over 5 g per 100 ml and a higher rate for drinks over 8 g per 100 ml.2 |
| Example interventions | Tax products according to less healthy ingredients, such as: fat, saturated fat, added sugar, salt or energy density.Industry levy on products according to less healthy ingredients, such as: fat, saturated fat, added sugar, salt or energy density. |
| Evidence that it will improve health? | Healthy Choices: Evidence from ReviewsGeneral consensus that price disincentives would have a small, but significant, effect on sales. One review found that a 10% increase in price would decrease consumption of unhealthy food and drink by 6%.3Obesity: Evidence from ReviewsSo far, there is slight evidence to suggest that taxes or levies may change population weight, but the extent of weight loss is less clear. There is some suggestion that children, adolescents and people from low socio-economic groups are more sensitive to price changes.4 3 6 |
| Interventions currently being used? | Yes: Used already by several countries: USA, Mexico, Hungary, Finland, Norway and France.7 UK will be introducing a sugar levy in 2018. |
Subsidising healthy food and drink
| Aim | To encourage consumption of healthy food and drink products by lowering their price. |
| Current situation in Scotland | Scotland does not eat enough fruit, vegetables, fibre or fish. Deprived households use a greater proportion of their income to buy food: 17% spent by the most deprived versus 8% spent by the most affluent in the UK in 2015.1Some evidence that less healthy products and less healthy diets are cheaper.2 There also seems to be a growing price gap between less healthy and more healthy products.3 |
| Example interventions | Subsidise healthy food and drink for all.Or, subsidise healthy food and drink for target sub-groups. |
| Evidence that it will improve health? | Healthy Choices: Evidence from ReviewsEvidence of a small, but significant, effect on sales. One review found that a 10% decrease in price increased consumption of healthy food and drink by 12%. They estimated that subsidies had a slightly larger effect on dietary patterns than taxing unhealthy food.4Obesity: Evidence from ReviewsOne review found that a reduction in fruit or vegetable price reduced BMI. 4 |
Removing agricultural subsidies from unhealthy food
| Aim | To make unhealthy food more expensive by removing agricultural support. |
| Current situation in Scotland | Currently, farmers and producers receive subsidies from the European Union, via the Common Agricultural Policy (CAP). The CAP has two pillars of funding. Under Pillar 1, called the Direct Payments Scheme, farmers receive a basic income. Under Pillar 2, the Rural Development Programme, achieving environmental and rural development objectives is rewarded.1 2No information identified on how this funding is distributed according to different types of agricultural produce. |
| Example interventions | Reduce, phase out or remove subsidies for production of the following:3
|
| Evidence that it will improve health? | Healthy ChoicesNo studies identified. ObesityNo studies identified. |
Adding agricultural subsidies to healthy food
| Aim | To make healthy food cheaper by giving agricultural support to farmers. |
| Current situation in Scotland | Currently, farmers and producers receive subsidies from the European Union, via the Common Agricultural Policy (CAP). The CAP has two pillars of funding. Under Pillar 1, called the Direct Payments Scheme, farmers receive a basic income. Under Pillar 2, the Rural Development Programme, achieving environmental and rural development objectives is rewarded.1 2No information identified on how this funding is distributed according to different types of agricultural produce. |
| Example interventions | Introduce or increase subsidies for:3
|
| Evidence that it will improve health? | Healthy ChoicesNo studies identified. ObesityNo studies identified. |
Education interventions
Public health campaigns
| Aim | To help people understand how to maintain a healthy weight. |
| Current situation in Scotland | Most people in Scotland (84%) feel that they have clear advice on what makes a healthy diet. Most agree (85%) that an unhealthy diet can lead to health problems.On average, people in Scotland recognise 8 out of 11 healthy eating messages, based on the Eatwell Guide. However, people admit to following only 2 of these consistently:
|
| Example interventions | Run national public health campaignsRun local public health campaignsEffective public health media campaigns:3
|
| Evidence that it will improve health? | Healthy Choices: Evidence from ReviewsCampaigns can affect population behaviour in the short term. In general, large-scale campaigns can cause 9% more people to adopt the promoted behaviour. Greater behavioural change is seen when the action is required by law. Although this seems modest, campaigns can result in significant population health gain, because of the scale of these projects.4 Shifting public attitudes can be an important outcome. Behaviours may be perceived as less acceptable; this has been happening with smoking and drink-driving.5Campaigns can also have unintended consequences. Concerns have been raised about potential negative effects around body image.6Obesity: Evidence from Reviews Campaigns so far have not generally been effective at causing weight loss or weight loss maintenance, particularly in the long-term. Community campaigns are not necessarily more effective than national campaigns. The more successful campaigns have generally been targeted children, whose behaviour can be more easily modified.6 |
| Intervention currently being used? | Yes. Campaigns used to promote healthy diets, exercise and weight loss. Also used in wider health or societal issues: smoking, cancer screening, alcohol and drug use, drink driving. |
Providing health education
| Aim | To help people understand how to maintain a healthy weight. |
| Current situation in Scotland | Health education is currently available to schoolchildren in Scotland, under the national Curriculum for Excellence.1 |
| Example interventions | Provide health, diet and exercise education for adultsProvide health, diet and exercise education for parents Provide health, diet and exercise education for children |
| Evidence that it will improve health? | Obesity: Evidence from ReviewsFor children:
|
Providing household management education
| Aim | To help people understand how to prepare healthy meals and manage a household budget. |
| Current situation in Scotland | Food prepared at home is usually less energy dense, so limited cooking skills may be a barrier to a healthy diet. People who lack cooking skills may rely on more convenience foods. In the UK, 63% of people cook a main meal at least 5 times per week, whilst 84% live in a household with a 'main food provider' who cooks a main meal at least 5 times per week. Cooking skills are affected by gender, age socio-economic status. Men, the young (19 - 34 years) and people from low socio-economic groups are the least confident cooks.1No statistics identified on budgeting and household management skills in Scotland or the UK. |
| Example interventions | Provide cooking classesProvide budgeting and household management classes |
| Evidence that it will improve health? | Healthy Choices: Evidence from ReviewsMixed evidence that providing cooking education for adults improves diet quality. However, one review warned that many studies in this area were low quality, so the results should be interpreted with caution.2Some evidence that children with greater food literacy have healthier diets.3 However, mixed evidence that providing cooking education for children improves diet.4 Similarly, many studies were low quality. Reviews warn that many studies in this area are low quality, so the results should be interpreted with caution.No studies identified showing that providing household management classes improves diet.ObesityNo studies identified. |
Environmental interventions
Facilitate walking and cycling
| Aim | To enable more people to use cycling and walking facilities: for exercise, for leisure and for travelling (known as "active transport"). |
| Current situation in Scotland | Scotland does not meet recommended levels of physical activity.1 Active transport is used for less than a quarter of journeys. In 2015, walking accounted for a fifth of all journeys (22%), whilst cycling accounted for 1% of all journeys. Children and young adults were more likely to use active transport: 49% of children in full-time education walked to school and 1% cycled. Commuters were less likely to use active travel: 14% of adults walked and 2% cycled to work. Most journeys in Scotland tend to be short. In 2015, a quarter (23%) of all journeys were under 1 km long and a further quarter (25%) were 1 - 3 km.23The Scottish Government promotes cycling through its Cycling Action Plan4 and walking through its National Walking Strategy.5 |
| Example interventions | Invest in walking and cycling facilities.Incorporate active travel into all future planning.Plan active travel routes to link up 'destinations': homes, schools, shops, workplaces and leisure facilities.Make active travel routes feel physically safe from traffic.Ensure active travel infrastructure is well-maintained and well lit so it is accessible, regardless of gender, age or ability.Recognise that walkers and cyclists have different needs. |
| Evidence that it will improve health? | Healthy Choices: Evidence from ReviewsLiving in areas with good walking or cycling facilities can result in people doing more physical activity and choosing 'active travel' over cars. 6 7 8 9 10Obesity: Evidence from Review and Primary StudiesFew studies look at the effect of active travel on obesity.11 Active transport does seem to have multiple health benefits12, especially cycling13. |
| Interventions currently being used? | Yes: In the 1970s, cycling levels were low across Europe. The Netherlands, Denmark and Germany invested heavily in active transport facilities in the mid-1970s. Currently, they have high levels of active travel. For example, in the Netherlands, 28% of all journeys are made by bike and 18% by foot. It has an obesity rate of 13%, less than half that of Scotland.14 15 16 |
Discourage car use
| Aim | To encourage people to walk or cycle, rather than use their car. |
| Current situation in Scotland | Most journeys in Scotland tend to be short. In 2015, a quarter (23%) of all journeys were under 1 km long and a further quarter (25%) were 1 - 3 km.Yet active transport is used for less than a quarter of all journeys. In 2015, walking accounted for a fifth of all journeys (22%), whilst cycling accounted for 1% of all journeys. 1 2 |
| Example interventions | Discourage car use. This could include:
|
| Evidence that it will improve health? | Healthy Choices:No studies identified.Obesity: No studies identified. |
| Intervention currently being used? | Yes. By many Dutch, Danish and German cities. Since the 1970s, parking supply was deliberately reduced, speed limited around residential and active travel infrastructure, travel routes limited and car‐free zones introduced. Because good quality active travel facilities are generally available, this can mean that active travel is more convenient. In the Netherlands, 28% of all journeys are made by bike and 18% by foot. It has an obesity rate of 13%, less than half that of Scotland. 3 4One review suggests that British urban areas have more large roads and more car parking than the typical Dutch, Danish or German city. Car‐free zones are less common in the UK. Traffic calming is less widespread and speed limits are generally higher. Cycling facilities are also of an "inferior quality".3 |
Neighbourhood safety and appeal
| Aim | To encourage more people to do exercise, walk and cycle in their own neighbourhood. |
| Current situation in Scotland | It has been suggested that physical activity is affected by people's perception of road safety, neighbourhood safety and appeal. Road safety:
|
| Example interventions | Provide safe routes for walking, cycling, exercise and leisure.Reducing the speed, volume of traffic and air pollution around these routes. Improve the perception of neighbourhood safety:
|
| Evidence that it will improve health? | Healthy Choices: Evidence from ReviewsActive transport increases with better local infrastructure and traffic safety. 7 8Neighbourhood disorder, littering, vandalism and poor appearance appear to reduce physical activity.7 8Neighbourhood maintenance, street lighting and access to green space appears positively associated with physical activity.7 813Obesity: Evidence from Primary StudiesOne study found safety from traffic is correlated with lower population weight.14Two studies found high neighbourhood crime levels or disorder are associated with high BMI levels.14 16Neighbourhood aesthetics do not appear to influence obesity.16 |
Exercise facilities
| Aim | To encourage more people to do exercise, walk and cycle in their own neighbourhood. |
| Current situation in Scotland | The Scottish population does not meet recommended levels of physical activity. 1 No statistics identified on the number or distribution of exercise facilities in Scotland. |
| Example interventions | Increase the number of exercise facilitiesIncrease physical exercise facilities in deprived or high-obesity areasInvest in school facilitiesInvest in community-owned facilities |
| Evidence that it will improve health? | Healthy Choices: Evidence from Primary StudiesSome studies suggest that travel distance to the nearest exercise facilities - such as a gym, sports centre or swimming pool - is related to activity levels.Access to facilities, rather than distance may be more important factor. Poor access is caused by: poor transport options, lack of financial resources, age, medical problems, or sense of not 'belonging' at facilities.Choosing to use exercise facilities may be partly influenced by attitude. 2 3 4Obesity: Evidence from Primary StudiesSome evidence that nearby facilities may reduce the BMI of the local population.26 |
Food facilities
| Aim | To improve diet by increasing the number of facilities where healthy food can be purchased. |
| Current situation in Scotland | The US has 'food deserts': areas with nowhere to buy affordable, healthy food. These occur more frequently in more deprived areas.1No evidence of food deserts in the UK or in Scotland.13456But there may be more fast food retailers in deprived areas. The concentration of fast food outlets in poor areas appears to have increased over time. 4 |
| Example interventions | Increase the number of food shops.Increase availability of food shops in deprived or high-obesity areas.Limit or reduce the number of fast food retailers.Limit or reduce the number of fast food retailers in deprived or high-obesity areas.Limit or reduce the number of fast food retailers near schools. |
| Evidence that it will improve health? | Healthy Choices: Evidence from ReviewsIn the UK, the number of food retailers does not appear to be correlated with deprivation. For example, in Glasgow, the most deprived areas actually had the most food retailers per 1,000 people in 2009. Physical proximity to food retailers does not seem to be correlated with a healthy diet.1 3 4 5 6Healthy food choices do seem to be available from food retailers within deprived urban areas. But there is some evidence that healthier food — particularly fruit and vegetables — may be more expensive, lower quality or less varied in these areas.1 14Obesity: Evidence from Reviews or Primary LiteratureNo evidence of food deserts in Scotland, the UK or most of Europe, therefore little evidence of impact on obesity.13456 Even in the US, few studies have examined how living in a food desert affects health and obesity.20However, in the UK, there is evidence of fast food venues in deprived areas.4 Physical proximity to more fast food retailers, but not full-service restaurants, does seem to predict local obesity trends.2223 |
| Interventions currently being used? | Yes: Several US cities and states have introduced interventions to tackle food deserts.20 |
Food access and availability interventions
Access to Healthy Meals
| Aim | To encourage a healthy diet by improving access to and availability of healthy meals in schools, higher education establishments and workplaces. |
| Current situation in Scotland | School and higher education establishments form a major part of students' food environment. Similarly the workplace is forms the major part of employees' food environment.1 This makes these populations a 'captive audience'.Public schools in Scotland are required to have a "health-promoting" environment under the Schools (Health Promotion and Nutrition) (Scotland) Act 2007.2There are minimum nutritional standards for the food and drink available in Scottish public schools. These are set by the Nutritional Requirements for Food and Drink in Schools (Scotland) Regulations 2008 3 The Scottish Government provides free school meals for all children 4-7 years old. Children up to 18 years are eligible for free school meals if they come from families receiving income support.4 Under EU law, food in workplaces and higher education establishments must be safe to eat, accurately labelled and traceable (The General Food Law Regulation (EC) 178/2002).5 However, the food environment is not currently regulated. |
| Example interventions | Provide free or subsidised healthy school meals Increase choice of healthy options in schoolsReduce access to unhealthy food in schoolsDisplay healthy foods more prominently in school canteensProvide free or subsidised healthy meals in the workplaceIncrease choice of healthy options in the workplaceReduce access to unhealthy food in the workplaceDisplay healthy foods more prominently in work canteens |
| Evidence that it will improve health? | Healthy Choices: Evidence from ReviewsEvidence that interventions in the school and higher education food environment increases healthy choices.6 7 In the workplace, combining food environment and education interventions, seems to improve employee diet.8Obesity: Evidence from ReviewsSmall number of studies suggest that interventions in the school food environment decreases BMI.6 Little evidence that workplace interventions affect BMI, particularly over the long-term.8 |
Layout and contents of food retailers
| Aim | Re-balance shop contents in favour of healthy product so that making healthy diet choices easier. |
| Current situation in Scotland | Food retailers decide on their layout, stock and promotional activities. Only alcohol and tobacco are currently regulated.According to Food Standards Scotland, store layout, product placement and display can be used to influence food and drink purchases. Certain locations are considered 'hot-spots': aisle ends, checkouts, 'dump bins', entrance displays and shelving at eye level. In-store promotional material — banners, flyers, sponsored shelf units and shelf unit decorations — can draw attention to specific products.1 |
| Example interventions | Shops allocate more space to healthy food and drink.Shops stock a greater proportion of healthy food and drink.Shops display healthy food and drink more prominently, such as end-of-aisle and check-out displays.Restrict prominent displays of unhealthy food and drink in shops, such as end-of-aisle and check-out displays. |
| Evidence that it will improve health? | Healthy Choices: Evidence from ReviewsWithin shops, low availability of healthy food is associated with less healthy dietary choices. Some evidence that reducing the presence of unhealthy food, rather than just increasing access to healthy food, is a more effective strategy.2Obesity: Evidence from Primary Studies One study found that within stores, the availability of energy-dense snack foods, — measured by cumulative shelf-space — was modestly associated with the average neighbourhood BMI. They did not find that fruit and vegetable shelf-space was correlated with neighbourhood BMI.3 |
Food content interventions
Reformulation
| Aim | Encourage food and drink manufacturers to make their products less unhealthy by altering the recipe to reduce the calorie, sugar, fat or salt content.Encourage out-of-home venues to make their meals less unhealthy by altering the recipe to reduce the calorie, sugar, fat or salt content. |
| Current situation in Scotland | The UK Department of Health introduced the Public Health Responsibility Deal in 2012. Scotland published the Supporting Healthy Choices Framework in 2014. Both encouraged food businesses to reduce salt, fat and calorie content through reformulation. The Scottish framework also encourages sugar reduction. 1 2 In March 2017, Public Health England (PHE) published guidelines to encourage manufacturers to reduce sugar content of certain food products by 20% by 2020. This will be followed by calorie and fat reduction guidelines in late 2017 and early 2018.3 4Reformulation is not currently regulated. |
| Example interventions | Reformulation of food and drink products through government regulationsReformulation of meals in food outlets through government regulationsReformulation of food and drink products through industry self-regulationReformulation of meals in food outlets through industry self-regulation |
| Evidence that it will improve health? | Healthy Choices: Primary StudiesReformulation can change population diet. Between 2005 and 2011, the Institute for Fiscal Studies estimated there was a 5% reduction in the salt content of British households’ groceries. They found that this was "entirely attributable" to product reformulation. 5 One primary study found that total salt intake decreased by around 15 %.6Progress on calorie, sugar and fat content has been more mixed. Food Standards Scotland and Kantar WorldPanel found that, between 2010 and 2015, fewer people were purchasing fat from savoury pies, pastries and sausages. Similarly, fewer people were purchasing sugar from regular soft drinks. Despite this, there was little change in overall diet at the population level. When buying food and drink for consumption at home, total calories, sugars, fats, and saturated fats — whether measured in volume or on a per capita basis — did not change between 2010 and 2015. The authors suggest that fats and sugars are being obtained from or recycled into different products. 7Obesity:No studies identified. |
| Interventions currently being used? | Yes: Both the UK and Scotland have voluntary reformulation programmes. |
Energy and portion size
| Aim | Encourage food and drink manufacturers to limit the portion size and calorie content.Encourage out-of-home food venues to limit the portion size and calorie content of meals. |
| Current situation in Scotland | The UK Department of Health introduced the Public Health Responsibility Deal in 2012. This contained a voluntary 'Calorie Reduction Pledge'. By May 2016, around 36 food manufacturers had signed up to this pledge. 1 2Scotland has the Supporting Healthy Choices Framework. It invites food industry and catering to reduce portion sizes.3 A number of organisations have submitted supporting statements and action plans to the Scottish Government. However, no progress has been reported since 2015. In late 2017, Public Health England will begin work on a calorie reduction program, aimed primarily at food categories not covered by its sugar reduction programme.4 |
| Example interventions | Limit the calorie content of food, drink and meals through government regulations.Limit the calorie content of food, drink and meals through industry self-regulation. |
| Evidence that it will improve health? | Healthy Choices: Evidence from ReviewsIncreasing portion sizes can increase energy intake in the short term. Larger portions, packages or tableware items have a small-to-moderate effects on consumption.5 6Obesity: Evidence from ReviewsNo studies identified that show a link between portion size and obesity. This may be because of difficulties conducting high quality experiments.7 |
| Interventions currently being used? | Yes: Both the UK and Scotland have voluntary reformulation programmes. |
Food information interventions
Labelling food and drink products
| Aim | To provide consumers with clear information so that they can make healthier choices. |
| Current situation in Scotland | Food labelling is currently regulated at European level.1 Back-of-pack labelling is mandatory. This should give consumers information on ingredients and nutrition.Around 75% of businesses in the UK have also adopted voluntary front-of-pack labelling, which can be presented in the more "engaging" traffic light format.In the UK, 76% of adults say they understood the traffic light labelling system. But when tested, the majority only answered 1 out of 5 questions correctly.2 |
| Example interventions | Provide “plain” labelling of nutritional information on all food and drink products through government regulations.Provide “engaging” labelling of nutritional information all food and drink products through government regulations.Provide “plain” labelling of nutritional information on all food and drink products through industry self-regulation.Provide “engaging” labelling of nutritional information all food and drink products through industry self-regulation.Provide aggregate nutritional information on basket contents in shops. |
| Evidence that it will improve health? | Healthy Choices: Evidence from ReviewsFood labelling does seem to change food choices. Labelling increases the number of people selecting healthier food options by about 18%.3However, food labelling may only marginally decrease calorie intake, by about 4%, but results are not statistically significant.3ObesityNo studies identified |
| Interventions currently being used? | Yes: Many countries, including EU countries, already regulate and enforce nutritional information on food labelling. |
Labelling menus
| Aim | To provide information to people eating away from home, so that they can make more informed dietary choices. |
| Current situation in Scotland | More people are eating away from home than ever. In this context, food is often served in disproportionately large portion sizes and can be high in calories, fat, salt or sugar. 1 2 Currently, menu labelling is not regulated. Both the Scottish and UK government have voluntary schemes which encourage businesses to provide calorie information in out-of-home settings. 3 4 |
| Example interventions | Require nutritional labelling on menus through government regulation.Require nutritional labelling on menus through industry self-regulation.Provide aggregate nutritional information on meal choices. |
| Evidence that it will improve health? | Healthy Choices: Evidence from ReviewsMenu labelling can reduce energy ordered and consumed. Calories ordered in real-world settings is decreased by 78 on average.5ObesityNo studies identified. |
| Interventions currently being used? | Yes: Menu labelling legislation was adopted in the US from 2010. More recently, regulations have been expanded to require calorie labelling for cinemas and vending machines.2Both the Scottish and UK government have voluntary schemes which encourage menu labelling. 3 4 Critics argue that a mandatory scheme would be more effective.2 |
Healthcare interventions
Surgery and pharmaceuticals
| Aim | To help overweight people lose weight through prescribing pharmaceuticals or surgery. |
| Current situation in Scotland | Weight-loss drugs (Orlistat) are available on the NHS. It restricts fat absorption in the gut, reducing the number of calories taken up by the body.Surgery is available through the NHS. There are different types of surgery: gastric bypass, sleeve gastrectomy, gastric band. People with a BMI over 40 are considered for surgery, or where obesity-related health problems are present, with a BMI over 30. Surgery is only offered after all non-surgical methods have been tried.The NHS performed around ~6000 procedures in 2013. This is less than 1% of patients who qualify (BMI greater than 40). In comparison, Sweden performs 6 times as many procedures per 100,000 people, yet has lower levels of obesity than the UK.1 |
| Example interventions | Increase provision of weight-loss drugs.Increase provision of gastric-banding or gastric-bypass surgery |
| Evidence that it will improve health? | Obesity: Evidence from ReviewRandomised controlled trials show pharmaceuticals induce weight loss of ~5% of original body mass. This is generally maintained while the drug is taken. Unfortunately, discontinuation of the drug can lead to weight regain.2On average, 3 years after surgery, patients lose 60% of their excess body weight.1 |
| Intervention currently being used? | Yes. Orlistat is available on the NHS. It is also available over-the-counter at a lower dose which is less effective. The NHS performs weight-loss surgery. 1 |
Weight management programmes
| Aim | To help overweight people lose weight through weight management programmes. |
| Current situation in Scotland | NHS-based weight loss programmes are available, but evidence suggests that commercial programmes are more successful.In some areas, the NHS will pay for patients to attend 12 weeks of commercial weight loss programmes.There are well-known commercial weight loss programmes available in Scotland, such as Weight Watchers and Slimming World.However, participation is a problem. In Scotland, over 5,000 overweight and obese patients were asked to take part in an NHS weight-loss programme. A third attended the first session. Men are less likely to attend than women.1 |
| Example interventions | Provide individual-based weight loss programmesProvide group-based weight loss programmesProvide weight loss programmes targeted at adultsProvide weight loss programmes targeted at childrenProvide weight loss programmes targeted at pregnant or new mothersProvide weight loss programmes targeted at parents |
| Evidence that it will improve health? | Obesity: Evidence from ReviewsPeople attending weight management programmes lose 3% of their body weight on average. Overall, a quarter of participants lose more than 5% of their body weight.1Diet-focused programmes are better at initial weight reduction. Exercise programmes are better at long-term weight maintenance. Combining diet and exercise is most effective for weight loss and has multiple health benefits beyond weight loss.Multi-component and structured interventions are more effective than single-focus or self-directed interventions.After the initial weight loss period, weight maintenance is key to long-term benefits.3 4 5 |
| Intervention currently being used? | Yes. Weight loss programmes are available through the NHS and commercially. |
Enabling healthy lifestyle
| Aim | To increase the number of people making healthy lifestyle choices, such as taking more exercise or eating more fruit and vegetables. |
| Current situation in Scotland | The Scottish population does not eat enough fruit and vegetables, fibre and oily fish to meet recommended levels.1 The Scottish population does not meet recommended levels of physical activity.2 People with a lower socio-economic status are less likely to meet diet and physical activity recommendations.1 4 2The UK government aims to enable a healthy diet in target groups. The Healthy Start Scheme prescribes food vouchers to low income households with young children. With vouchers, people can buy fresh fruit and vegetables, plain frozen fruit and vegetables, milk and infant formula milk.6 Both the Scottish and UK government aim to enable physical activity in target groups through the healthcare system. Primary care practitioners can refer patients to physical activity schemes.7 |
| Example interventions | Prescribe coupons for healthy foodPrescribe physical activities or access to exercise facilities |
| Evidence that it will improve health? | Healthy Choices: Evidence from ReviewsFood coupons can increase healthy food and drink consumption. The UK Healthy Start Scheme increased sales of fruit and vegetables by 15%. That is equivalent to two-thirds of a portion of fruit/vegetables per household per day.8 Vouchers can sometimes be used to reduce household food expenditure in order to save money for other things.9 10Exercise referral schemes show a small increase in the number of people who say they achieve the recommended level of physical activity.11 Obesity: Mixed EvidenceNo studies identified showing that food coupons are linked to weight loss. One review found that exercise referral schemes tend not to lead to weight loss over the long-term.11 |
| Intervention currently being used? | Yes: The UK Healthy Start Scheme provides food vouchers to low income households with young children.6 Primary care practitioners can refer patients to physical activity schemes.7 |
Incentivising a healthy lifestyle
| Aim | To encourage people to make healthy lifestyle choices, by providing rewards. |
| Current situation in Scotland | The Scottish population does not eat fruit and vegetables, fibre and oily fish to meet recommended levels.1 The Scottish population does not meet recommended levels of physical activity.2 |
| Example interventions | Provide material rewards for successful weight loss.Provide material rewards to encourage healthier dietary choices.Provide material rewards to encourage more physical activity.Provide material incentives, such as food discounts, to facilitate healthier dietary choices.Provide material incentives, such as subsidised gym memberships, to facilitate more physical activity. |
| Evidence that it will improve health? | Healthy Choices: Mixed EvidencePrimary studies have found that providing rewards can increase the amount of healthy food consumed.3 4 Providing discounts may also increase the amount of healthy food sold. 5 However, the evidence is from small or short-term studies.Reviews show financial rewards or incentives may increase physical activity during the intervention period. Evidence they result in long-term (> 1 year) behaviour change is lacking. 6 7 8Obesity: Mixed EvidenceReviews show that rewarding successful weight loss can decrease BMI during interventions. Whilst there may be weight loss during the intervention period, reviews found no significant effect on weight loss 12 - 18 months later.9 10 11Focusing specifically on schemes that reward healthy dietary choices, primary studies found little evidence that they result in weight loss, particularly in the longer term. 3 4 5Focusing specifically on schemes that reward physical activity, reviews found some evidence that they result in weight loss during the intervention period. Evidence they result in long-term (> 1 year) weight loss is missing. 6 7 8 |
| Intervention currently being used? | Financial incentive schemes have been used to encourage people to stop smoking, drinking alcohol and taking drugs. However, their use in obesity prevention is relatively recent.11 |
Media and marketing interventions
Advertising
| Aim | To prevent advertising from prompting consumption of unhealthy food and drink. |
| Current situation in Scotland | The UK food industry spends almost a third of its advertising budget on promoting unhealthy food and drink products: £256 million out of £780 million in 2014.1In the wider UK advertising industry, more money is spent on online advertising compared to TV advertising: £6,300 million versus £4,600 million in 2013.1 The Committee of Advertising Practice (CAP) sets the UK Advertising Codes, one code for broadcast media and another for non-broadcast media.3 4 The Advertising Standards Agency (ASA) enforces these codes. This system is a mix of industry self-regulation and co-regulation.5Existing regulations aim to protect children from TV adverts for unhealthy food or drink. Since 2007, TV adverts for high fat, sugar and salt products cannot be shown during children's programmes.3 However, children may see adverts during other programmes. A nutrient profiling model is used to decide whether food and drink could only be advertised.3 Public Health England criticised this profiling model for not being stringent enough.8 New rules are currently being introduced to protect children online. From 1st July 2017, the advertising of high fat, salt or sugar food or drink products to children using non-broadcast media will be banned. This includes print, cinema, online or social media.9 |
| Example interventions | Restrict all advertising of unhealthy food and drink on TV through government regulation.Restrict all advertising of unhealthy food and drink on TV through industry self-regulation.Restrict all advertising of unhealthy food and drink across all media through government regulation.Restrict all advertising of unhealthy food and drink across all media through industry self-regulation.Restrict within-store advertising of unhealthy food and drink.Restrict marketing on product packaging, for example, the use of characters from children's entertainment or celebrities. |
| Evidence that it will improve health? | Healthy Choices: Evidence from ReviewsEvidence of relationship between food marketing and children's food choices. Evidence base strongest for children aged 3 - 12 years.10 Evidence for adults is mixed.11Obesity: No Studies IdentifiedNo studies identified. Models predict that limiting TV advertising cause a small but significant fall in childhood obesity in the US.12 |
| Interventions currently being used? | Yes: In the UK, TV adverts for unhealthy food and drink should not be shown during children's programmes. New rules are being introduced to protect children online. 3 4 9Whilst advertisers cannot make unfounded nutritional claims, advertising codes do not prevent adults from seeing advertising. 16 3 4 |
Price promotions
| Aim | To re-balance price promotions in favour of healthier food and drink. |
| Current situation in Scotland | In Scotland, 40% of all food and drink purchases are made on price promotion.1Discretionary food and drink is more frequently purchased on promotion (around 50% of sales) compared to staple or healthy categories (around 30% of sales).1Currently the use of price promotions on unhealthy food or drink is partly regulated. False or misleading price promotions are prohibited under Consumer Protection from Unfair Trading Regulations 2008 and enforced by Trading Standards Scotland and the Competition and Markets Authority.3 ASA/CAP regulate the use of price promotions in adverts. This is a mix of industry self-regulation and co-regulation. When featured in advertising, promotions must be used with a "due sense of responsibility." Promotions on unhealthy food and drink must not be used in adverts that are shown during children's programmes. 4 5 However, they do not regulate the promotions themselves. |
| Example interventions | Restrict promotions on unhealthy food and drink through government regulation.Restrict promotions on unhealthy food and drink through industry self-regulation.Encourage promotions on healthy food and drink. |
| Evidence that it will improve health? | Healthy Choices: Evidence from Reviews or Primary StudiesPromotions increase food and drink sales, especially over the short-term. 6 One primary study suggests this sales "uplift" may be greater for unhealthy products, compared to healthy products.7Promotions also seem to cause a short-term increase in food and drink consumption. 6ObesityNo studies identified |
Other promotional strategies
| Aim | To re-balance promotional activity within stores in favour of healthier food and drink. |
| Current situation in Scotland | According to Food Standards Scotland, store layout, product placement and display can be used to influence food and drink purchases. Certain locations are considered 'hot-spots': aisle ends, checkouts, 'dump bins', entrance displays and shelving at eye level. In-store promotional material — banners, flyers, sponsored shelf units and shelf unit decorations — can draw attention to specific products.1 Currently, there is no regulation covering product placement in stores, with the exception of alcohol and tobacco. Some retailers have taken voluntary actions, such as healthier checkout displays, but implementation is patchy, especially in smaller stores.1 |
| Example interventions | Restrict in-store advertising of unhealthy food and drink.Restrict prominent displays of unhealthy food and drink in shops.Restrict super-size packets of unhealthy food.In-store promotion of healthy choices, such as advertising of healthy products or motivational signs.Display healthy food and drink more prominently in shops, such as end-of-aisle and check-out displays.In-store provision of educational material, such as recipes for cheap, quick and nutritious meals.Use shelf labelling to highlight healthy choices.Use shelf labelling to warn about unhealthy products. |
| Evidence that it will improve health? | Healthy Choices: Evidence from ReviewsExcess energy consumption is associated with large portion or package sizes, particularly for energy dense products.3Putting products in prominent or “early trip” locations increases sales.3Healthy checkout aisles can be helpful for reducing unhealthy impulse purchases.3There is some evidence that reducing the presence of unhealthy food, rather than just increasing access to healthy food, is a more effective at promoting healthy dietary choices.3ObesityNo studies identified |
Appendix A: Survey Information
Survey of Scottish Academics
To support this briefing, SPICe conducted a survey of academics working on obesity in Scotland.
Methods
What was the aim of the survey?
In the opinion of Scotland's academics, what interventions would most reduce obesity levels in Scotland?
Background to the survey
A recent high-profile report by the McKinsey Global Institute identified potential policy interventions. It also estimated their impact and cost-effectiveness.1
The McKinsey Global Institute report created a catalogue of 74 possible interventions. These interventions were either being used or piloted somewhere in the world, for example by central governments, local governments, employers, schools, health-care systems or the food industry. The full list is available in Table E1 of the report.1
This list was shortened to around 60 interventions, by condensing similar interventions together or removing interventions that were not relevant to a Scottish or UK context.
This was used as the basis for the survey.
How was it carried out?
Academics were asked, in their opinion, which interventions they thought would most reduce obesity in Scotland.
They had 100 points to split between interventions in any way they liked. For example:
They could give 1 intervention all 100 points, if they thought that investing in a single intervention would be the best way of reducing obesity in Scotland.
They could select 50 interventions and give each one 2 points, if they thought that a broad approach would most reduce obesity in Scotland.
Or, they could do anything in between these extremes.
Who answered the survey?
We asked academics working in Scotland on obesity, health and related areas to respond. We had 36 responses in total.
Academics from many of Scotland's universities responded: University of Edinburgh, University of Glasgow, University of Aberdeen, University of St Andrews, University of Dundee, University of Stirling, University of Strathclyde, Queen Margaret University, Glasgow Caledonian University, Heriott-Watt University and the Rowett Institute. There was also one respondent from the University of Oxford.

Academics came from a diverse range of backgrounds: biomedical sciences, public health, nutrition, sports science, psychology, sociology, economics, urban planning, technology, and medicine.
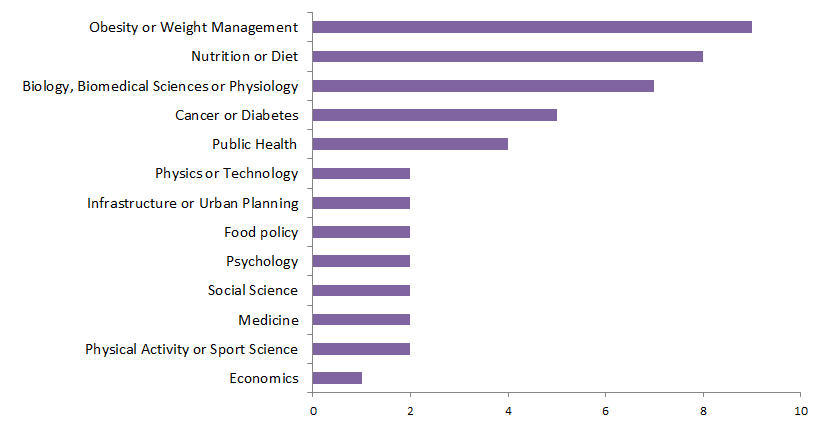
What are the limitations of the survey design?
Previous surveys3 found that researchers can give different answers to the following questions:
What interventions are most likely to work based on their expert opinion?
What interventions have the strongest available evidence?
It is difficult to test all obesity interventions to the same level. Some interventions, such as surgery or drugs, are easier to research, so there is much more evidence available. However, just because an intervention is difficult to research, it does not necessarily mean that it lacks potential.
For this reason, SPICe decided to focus on the first question. We asked Scottish academics about their opinion. We did not ask them to assess the strength of the available evidence.
Consequently, the following survey results reflect the opinion of Scottish academics.
Results
The full results are available in Appendix A of this report.
What are the limitations of the survey results?
The survey results reflect the expert opinion of academics.
We approached academics working on obesity and related research areas. We had 37 responses, but we were unable to assess what proportion of eligible academics responded. Therefore, we are unable to say whether this is a representative sample of academics.
This survey was based on a condensed list of interventions from the McKinsey Global Institute report on obesity. The survey did not contain all the possible interventions that might work in Scotland.
Many policy interventions have been proposed in order to tackle obesity. This briefing does not advise whether interventions are likely to be within the devolved competence of the Scottish Parliament.
Similarly, this briefing does not consider how these interventions could be implemented in Scotland.
What were the top ten interventions?
Academics were asked to give more points to interventions that, in their opinion, would most reduce obesity in Scotland.
The 10 interventions that received the most points from academics are shown in the table below.
| Interventions Receiving the Most Points | Total Points | % All Points |
|---|---|---|
| Facilitate walking and cycling | 267 | 7% |
| Reduce relative price of healthy food / drink by adding agricultural subsidies | 201 | 5% |
| Provide free or subsidised healthy school meals | 153 | 4% |
| Reformulation of food / drink products through government regulations | 151 | 4% |
| Provide health, diet and exercise education for children | 151 | 4% |
| Introduce levies on manufacturers or retailers of unhealthy food / drink | 143 | 4% |
| Restrict promotions on unhealthy food / drink through government regulation | 114 | 3% |
| Restrict advertising of unhealthy food / drink across all media through government regulation | 111 | 3% |
| Prescribe coupons for healthy food | 108 | 3% |
| Increase relative price of unhealthy food / drink through tax | 104 | 3% |
The key finding: many different interventions are needed
Even though some interventions received far more points than others, they still only received a small percentage of the available points:
The top ranked intervention ('Facilitating walking and cycling') only received 7% of all the available points.
The top 10 interventions received 41% of all available points.
The top 30 interventions received 80% of all available points.
On average, academics invested their points into 14 interventions.
This indicates that academics are choosing a diverse set of interventions. Whilst they seem to believe that some interventions have greater potential than others, there is no one miracle cure for obesity.
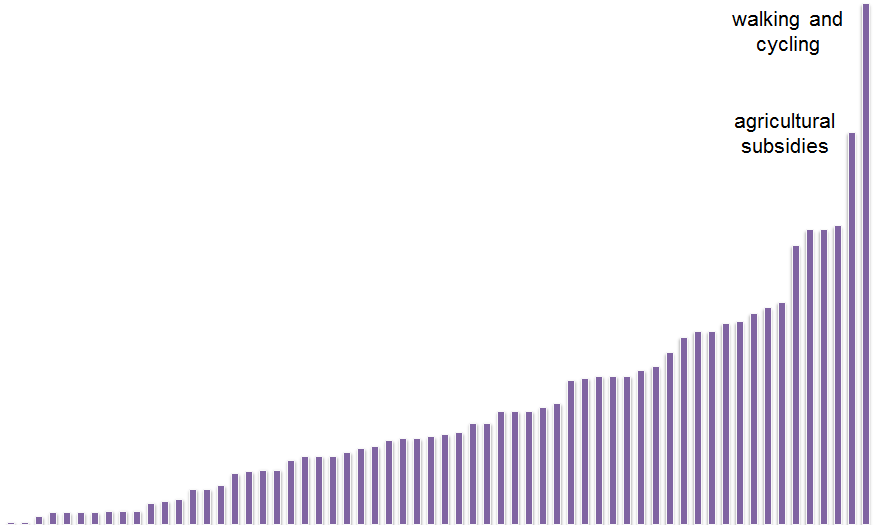
Full results
| Theme | Group | Intervention | Total Points | % Points | Intervention Ranked by Points |
|---|---|---|---|---|---|
| Environment | Facilitate Walking and Cycling | Urban redesign to facilitate and encourage walking and cycling | 267 | 7% | 1 |
| Discourage Car Usage | Disincentivise driving | 60 | 2% | 24 | |
| Neighbourhood Safety and Appeal | Increase appeal of neighbourhoods | 47 | 1% | 30 | |
| Increase safety of neighbourhoods | 35 | 1% | 39 | ||
| Exercise Facilities | Invest in physical exercise facilities for schools | 75 | 2% | 21 | |
| Invest in physical exercise facilities for communities | 99 | 3% | 12 | ||
| Increase availability of physical exercise facilities in deprived or high-obesity areas | 76 | 2% | 18 | ||
| Food Facilities | Increase availability of food shops in deprived or high-obesity areas | 103 | 3% | 11 | |
| Economic | Taxing Unhealthy Food and Drink | Introduce levies on manufacturers or retailers of unhealthy food / drink | 143 | 4% | 6 |
| Increase relative price of unhealthy food / drink through tax | 104 | 3% | 10 | ||
| Subsidising Healthy Food and Drink | Reduce relative price of healthy food / drink for a target group through personal subsidies | 28 | 1% | 43 | |
| Removing Agricultural Subsidies from Unhealthy Food | Increase relative price of unhealthy food / drink by removing agricultural subsidies | 6 | 0% | 56 | |
| Adding Agricultural Subsidies to Healthy Food | Reduce relative price of healthy food / drink by adding agricultural subsidies | 201 | 5% | 2 | |
| Media and Marketing | Advertising | Restrict advertising of unhealthy food / drink on TV through government regulation | 96 | 3% | 14 |
| Restrict advertising of unhealthy food / drink on TV through industry self-regulation | 20 | 1% | 47 | ||
| Restrict advertising of unhealthy food / drink across all media through government regulation | 111 | 3% | 8 | ||
| Restrict advertising of unhealthy food / drink across all media through industry self-regulation | 27 | 1% | 45 | ||
| Price Promotions | Restrict promotions on unhealthy food / drink through government regulation | 114 | 3% | 7 | |
| Restrict promotions on unhealthy food / drink through industry self-regulation | 4 | 0% | 60 | ||
| Food Information | Labelling Food and Drink Products | Require “plain” labelling of nutritional information on all food / drink products through government regulations | 43 | 1% | 35 |
| Require “plain” labelling of nutritional information on all food / drink products through industry self-regulation | 7 | 0% | 53 | ||
| Require “engaging” labelling of nutritional information all food / drink products through government regulations | 40 | 1% | 36 | ||
| Require “engaging” labelling of nutritional information all food / drink products through industry self-regulation | 7 | 0% | 53 | ||
| Provide aggregate nutritional information on meal choices | 6 | 0% | 56 | ||
| Provide aggregate nutritional information on basket contents in shops | 6 | 0% | 56 | ||
| Labelling Menus | Require nutritional labelling on menus through government regulations | 18 | 0% | 48 | |
| Require nutritional labelling on menus through industry self-regulation | 0 | 0% | 63 | ||
| Food Content | Reformulation | Reformulation of food / drink products through government regulations | 151 | 4% | 4 |
| Reformulation of food / drink products through industry self-regulation | 26 | 1% | 46 | ||
| Reformulation of meals in food outlets through government regulations | 76 | 2% | 18 | ||
| Reformulation of meals in food outlets through industry self-regulation | 11 | 0% | 52 | ||
| Energy and Portion Size | Limit calorie content of food / drinks / meals through government regulations | 52 | 1% | 28 | |
| Limit calorie content of food / drinks / meals through industry self-regulation | 6 | 0% | 56 | ||
| Food Access and Availability | Access to Healthy Meals | Free or subsidised healthy school meals | 153 | 4% | 3 |
| Free or subsidised healthy meals in the workplace | 74 | 2% | 22 | ||
| Increase choice of healthy options in schools | 33 | 1% | 42 | ||
| Increase choice of healthy options in the workplace | 45 | 1% | 32 | ||
| Reduce access to unhealthy food in schools | 99 | 3% | 12 | ||
| Reduce access to unhealthy food in the workplace | 46 | 1% | 31 | ||
| Display healthy foods more prominently in school canteens | 18 | 0% | 48 | ||
| Display healthy foods more prominently in work canteens | 12 | 0% | 51 | ||
| Layout and Contents of Retailers | Display healthy foods more prominently in shops | 28 | 1% | 43 | |
| Shops allocate more space to healthy products | 13 | 0% | 50 | ||
| Shops stock a greater proportion of healthy products | 44 | 1% | 33 | ||
| Healthcare | Surgery and Pharmaceuticals | Provide weight-loss drugs | 1 | 0% | 61 |
| Provide gastric-banding or gastric-bypass surgery | 81 | 2% | 16 | ||
| Weight Management Programmes | Provide individual-based weight loss programmes | 76 | 2% | 18 | |
| Provide group-based weight loss programmes | 35 | 1% | 39 | ||
| Provide weight loss programmes targeted at adults | 39 | 1% | 37 | ||
| Provide weight loss programmes targeted at children | 44 | 1% | 33 | ||
| Provide weight loss programmes targeted at pregnant or new mothers | 7 | 0% | 53 | ||
| Enabling a Healthy Lifestyle | Prescribe coupons for healthy food | 108 | 3% | 9 | |
| Prescribe physical activities or access to exercise facilities | 58 | 2% | 25 | ||
| Incentivising a Healthy Lifestyle | Provide material rewards for improvements in health | 58 | 2% | 25 | |
| Provide material incentives to facilitate healthy behaviours | 35 | 1% | 39 | ||
| Education | Public Health Campaigns | Run national public-health campaigns | 52 | 1% | 28 |
| Run local public-health campaigns | 62 | 2% | 23 | ||
| Providing Health Education | Provide health, diet and exercise education for adults | 88 | 2% | 15 | |
| Provide health, diet and exercise education for parents | 58 | 2% | 25 | ||
| Provide health, diet and exercise education for children | 151 | 4% | 4 | ||
| Providing Household Management Education | Provide cooking classes | 79 | 2% | 17 | |
| Provide budgeting and household management classes | 37 | 1% | 38 | ||
| Other | Other | Other - please specify in the box below | 1 | 0% | 61 |
Sources
Scottish Intercollegiate Guidelines Network. (2010). Management of Obesity: A national clinical guideline. Scottish Intercollegiate Guidelines Network.
Scottish Government. (2016). Obesity Indicators: Monitoring Progress for the Prevention of Obesity Route Map - December 2016 Report. Statistical Bulletin, Health and Social Care, Scottish Government.
Castle, A. (2015). Obesity in Scotland. Scottish Parliament Information Centre (SPICe) Briefings.
Dobbs, R., Sawers, C., Thompson, F., Manyika, J., Woetzal, J., Child, P., … Spatharou, A. (2014). Overcoming obesity: An initial economic analysis. McKinsey Global Institute.
Loring, B., & Robertson, A. (2014). Obesity and Inequities: Guidance for Addressing Inequities in Overweight and Obesity. World Health Organisation.
Scottish Government. (2016). Scottish Health Survey: Health Board Results 2012 - 2015. Health and Social Care, The Scottish Government.
Baker, C. (2017). Obesity Statistics: Briefing Paper Number 3336. House of Commons Library.
OECD. (2017). Obesity Update 2017. OECD.
The Scottish Government. (2010). Overweight and Obesity in Scotland: A Route Map Towards Healthy Weight. The Scottish Government.
McPherson, K., Marsh, T., & Brown, M. (2007). Tackling Obesities: Future Choices – Modelling Future Trends in Obesity & Their Impact on Health. Foresight.
Cancer Research UK. (2016, July 22). How being overweight causes cancer. Retrieved from <a href="http://www.cancerresearchuk.org/about-cancer/causes-of-cancer/bodyweight-and-cancer/how-being-overweight-causes-cancer" target="_blank">http://www.cancerresearchuk.org/about-cancer/causes-of-cancer/bodyweight-and-cancer/how-being-overweight-causes-cancer</a> [accessed 20 June 2017]
Cancer Research UK. (2017, June 5). Our policy on diet and obesity. Retrieved from <a href="http://www.cancerresearchuk.org/about-us/we-develop-policy/our-policy-on-preventing-cancer/our-policy-on-obesity-and-diet" target="_blank">http://www.cancerresearchuk.org/about-us/we-develop-policy/our-policy-on-preventing-cancer/our-policy-on-obesity-and-diet</a> [accessed 22 June 2017]
Scottish Government. (10, May 2017). Quarterly National Accounts Scotland. Retrieved from <a href="http://www.gov.scot/Topics/Statistics/Browse/Economy/QNA2016Q4" target="_blank">http://www.gov.scot/Topics/Statistics/Browse/Economy/QNA2016Q4</a> [accessed 2017 July 24]
Foresight, UK Government. (2007). Obesity System Map. Retrieved from <a href="https://www.gov.uk/government/uploads/system/uploads/attachment_data/file/296290/obesity-map-full-hi-res.pdf" target="_blank">https://www.gov.uk/government/uploads/system/uploads/attachment_data/file/296290/obesity-map-full-hi-res.pdf</a> [accessed 20 June 2017]
Vandenbroeck, P., Goossens, J., & Clemens, M. (2007). Tackling Obesities: Future Choices – Obesity System Atlas. Foresight, Government Office for Science.
Food Standards Scotland. (2015). The Scottish Diet: It Needs to Change. Food Standards Scotland.
Food Standards Scotland. (2017). The Eatwell Guide Booklet. Food Standards Scotland.
Scottish Government. (2016). Revised Dietary Goals for Scotland - March 2016. Scottish Government.
McDonald, A., & Milne, A. (2016). Foods and drinks purchased into the home in Scotland using data from Kantar WorldPanel. Food Standards Scotland.
NPD Group and Food Standards Scotland. (2017). An overview of the out of home market in Scotland. Food Standards Scotland.
DEFRA. (2017). Family Food 2015. National Statistics Publication for the Department for Environment, Food and Rural Affairs (DEFRA).
Food Standards Scotland. (2016). Diet and nutritiuon: update on setting the direction for the Scottish diet. Food Standards Scotland.
Scarborough, P., Kaur, A., Cobiac, L., Owens, P., Parlesak, A., Sweeney, K., … Rayner, M. (2016). Eatwell Guide: modelling the dietary and cost implications of incorporating new sugar and fibre guidelines. BMJ Open, 6(12). doi: 10.1136/bmjopen-2016-013182
Rao, M., Afshin, A., Singh, G., & Mozaffarian, D. (2013). Do healthier foods and diet patterns cost more than less healthy options? A systematic review and meta-analysis. British Medical Journal, 3, 004277. doi: 10.1136/bmjopen-2013-004277
Jones, N.R.V., Conklin, A.I., Suhrcke, M., & Monsivais, P. (2014). The Growing Price Gap between More and Less Healthy Foods: Analysis of a Novel Longitudinal UK Dataset. PLoS ONE, 9(10). doi: 10.1371/journal.pone.0109343
Office for National Statistics. (2017). Statistical bulletin: Family spending in the UK: financial year ending March 2016. Office for National Statistics.
NICE. (2013). Physical activity: brief advice for adults in primary care. Public health guideline PH44. National Institute for Health and Care Excellence (NICE).
Brown, L., Campbell-Jack, D., Gray, L., Hovald, P., Kirkpatrick, G., Knudsen, L., … Rose, J. (2016). The Scottish Health Survey: 2015 Edition. National Statistics Publication for Scotland.
The Scottish Government. (2008). Healthy Eating, Active Living: An action plan to improve diet, increase physical activity and tackle obesity (2008-2011). The Scottish Government.
The Scottish Government. (2011). Obesity Route Map - Action Plan. The Scottish Government.
Scottish Government. (2011). Prevention of Obesity Route Map: Analytic Framework. Scottish Government.
Kerr, A. (2015). Review of the Obesity Route Map (ORM). Scottish Public Health Network (ScotPHN).
Mooney, J.D., Jepson, R., Frank, J., & Geddes, R. (2015). Obesity Prevention in Scotland: A Policy Analysis Using the ANGELO Framework. Obesity Facts: The European Journal of Obesity, 8, 273-281. doi: 10.1159/000438500
Academy of Medical Royal Colleges. (2013). Measuring Up. The Medical Profession’s Prescription for the Nation’s Obesity Crisis. Academy of Medical Royal Colleges.
Butland, B., Jebb, S., Kopelman, P., McPherson, K., Mardell, J., & Parry, V. (2007). Tackling Obesities: Future Choices. Foresight Reviews.
Kleinert, S., & Horton, R. (2015). Rethinking and Reframing Obesity. The Lancet, 385(9985), 2326-2328. doi: 10.1016/S0140-6736(15)60163-5
Townshend, T., & Lake, A. (2017). Obesogenic environments: current evidence of the built and food environments. Perspectives in Public Health, 137(1). doi: 10.1177/1757913916679860
Department of Health. (2015). Public Health Responsibility Deal. Retrieved from <a href="https://responsibilitydeal.dh.gov.uk/" target="_blank">https://responsibilitydeal.dh.gov.uk/</a> [accessed 2017 June 22]
Department of Health. (2012). Public Health Responsibility Deal collective pledges. Retrieved from <a href="https://responsibilitydeal.dh.gov.uk/publichealthresponsibilitydealcollectivepledges/" target="_blank">https://responsibilitydeal.dh.gov.uk/publichealthresponsibilitydealcollectivepledges/</a> [accessed 2017 May 4]
Scottish Government. (2014). Supporting Healthy Choices: A Framework for Voluntary Action. Scottish Government.
Tedstone, A., Targett, V., Owtram, G., Pyne, V., Allen, R., Bathrellou, K., … Swan, G. (2017). Sugar Reduction: Achieving the 20%. Public Health England.
Public Health England. (2017). Sugar reduction and wider reformulation programme: interim review. Public Health England.
Food and Drink Federation Scotland. (2017). Health and Wellbeing. Retrieved from <a href="http://www.fdfscotland.org.uk/sfdf/priorities_food_health.aspx" target="_blank">http://www.fdfscotland.org.uk/sfdf/priorities_food_health.aspx</a> [accessed 24 July 2017]
Griffith, R., O’Connell, M., & Smith, K. (2014). The importance of product reformulation versus consumer choice in improving diet quality. Institute for Fiscal Studies.
BBC. (2017, March 8). Kit Kat sugar content to be cut by 10%, says Nestle. Retrieved from <a href="http://www.bbc.co.uk/news/uk-39201985" target="_blank">http://www.bbc.co.uk/news/uk-39201985</a> [accessed 30 June 2017]
Durand, M.A., Petticrew, M., Goulding, L., Eastmure, E., Knai, C., & Mays, N. (2015). An evaluation of the Public Health Responsibility Deal:Informants’ experiences and views of the development,implementation and achievements of a pledge-based,public–private partnership to improve population healthin England. Health Policy, 119, 1506-1514. doi: 10.1016/j.healthpol.2015.08.013
Knai, C., Petticrew, M., Durand, M.A., Eastmure, E., James, L., Mehrotra, A., … Mays, N. (2015). Has a public–private partnership resulted in action on healthier diets in England? An analysis of the Public Health Responsibility Deal food pledges. Food Policy, 54, 1-10. doi: 10.1016/j.foodpol.2015.04.002
Food Standards Scotland. (2016). Diet and nutrition: proposals for setting the direction of the Scottish diet. Food Standards Scotland.
UK Government. (2016, December). Soft Drinks Industry Levy. Retrieved from <a href="https://www.gov.uk/government/publications/soft-drinks-industry-levy/soft-drinks-industry-levy" target="_blank">https://www.gov.uk/government/publications/soft-drinks-industry-levy/soft-drinks-industry-levy</a> [accessed 27 June 2017]
Barber, S., Baker, C., & Foster, D. (2017). The Soft Drinks Industry Levy. Commons Briefing papers CBP-7876. House of Commons Library.
Food Standards Scotland. (2016). Food in Scotland Consumer Tracking Survey: Wave 2. Food Standards Scotland.
Diepeveen, S., Ling, T., Suhrcke, M., Roland, M., & Marteau, T.M. (2013). Public acceptability of government intervention to change health-related behaviours: a systematic review and narrative synthesis. BMC Public Health, 13(756). doi: 10.1186/1471-2458-13-756
NICE Glossary. (2017). Retrieved from <a href="https://www.nice.org.uk/glossary" target="_blank">https://www.nice.org.uk/glossary</a> [accessed 22 June 2017]
Yanovski, S.Z., & Yanovski, J.A. (2014). Long-term Drug Treatment for Obesity: A Systematic and Clinical Review. JAMA, 311(1), 74-86. doi: 10.1001/jama.2013.281361
Royal College of Physicians of Ireland. (2014). The Race We Don’t Want to Win: Tackling Ireland’s Obesity Epidemic. Royal College of Physicians of Ireland.
Food Standards Scotland. (2015). Nutrition remit. Retrieved from <a href="http://www.foodstandards.gov.scot/nutrition-healthy-eating/nutrition-remit" target="_blank">http://www.foodstandards.gov.scot/nutrition-healthy-eating/nutrition-remit</a> [accessed 3 July 2017]
Afshin, A., Peñalvo, J.L., Del Gobbo, L., Silva, J., Michaelson, M., O'Flaherty, M., … Mozaffarian, D. (2017). The prospective impact of food pricing on improving dietary consumption: A systematic review and meta-analysis. PLOS, 12(3), 0172277. doi: 10.1371/journal.pone.0172277
Powell, L.M., Chriqui, J.F., Khan, T., Wada, R., & Chaloupka, F.J. (2012). Assessing the potential effectiveness of food and beverage taxes and subsidies for improving public health: a systematic review of prices, demand and body weight outcomes. Obesity Reviews, 14(2), 110-128. doi: 10.1111/obr.12002
Powell, L.M., & Chaloupka, F.J. (2009). Food Prices and Obesity: Evidence and Policy Implications for Taxes and Subsidies. The Milbank Quarterly, 87(1), 229-257. doi: 10.1111/j.1468-0009.2009.00554.x
Cornelsen, L., Green, R., Turner, R., Dangour, A.D., Shankar, B., Mazzocchi, M., … Smith, R.D. (2014). What Happens to Patterns of Food Consumption when Food Prices Change? Evidence from A Systematic Review and Meta-Analysis of Food Price Elasticities. Health Economics. doi: 10.1002/hec.3107
DEFRA. (2014). An introduction to the new Common Agricultural Policy schemes in England. DEFRA.
Scottish Government. (2014). The new Common Agricultural Policy in Scotland. An introduction to what it means for you. Scottish Government.
Birt, C. (2007). A CAP on Health? The impact of the EU Common Agricultural Policy on public health. Faculty of Public Health.
Abroms, L.C., & Maibach, E.W. (2008). The Effectiveness of Mass Communication to Change Public Behavior. Annual Reviews of Public Health, 29, 219-234. doi: 10.1146/annurev.publhealth.29.020907.090824
Snyder, L., Hamilton, M.A., Mitchell, E.W., Kiwanuka-Tondo, J., Fleming-Milici, F., & Proctor, D. (2004). A meta-analysis of the effect of mediated health communication campaigns on behavior change in the United States.. Journal of Health Communication, 9(1), 71-96. doi: 10.1080/10810730490271548
Maio, G.R., Manstead, A.S.R., Verplanken, B., Stroebe, W., Abraham, C., Sheeran, P., … Conner, M. (2007). Tackling Obesities: Future Choices – Lifestyle Change – Evidence Review. Foresight, Government Office for Science.
Walls, H.L., Peeters, A., Proietto, J., & McNeil, J.J. (2011). Public health campaigns and obesity - a critique. BMC Public Health, 11(136). doi: 10.1186/1471-2458-11-136
Education Scotland. (2016). Curriculum for Excellence. Retrieved from <a href="https://education.gov.scot/scottish-education-system/policy-for-scottish-education/policy-drivers/cfe-(building-from-the-statement-appendix-incl-btc1-5)/What%20is%20Curriculum%20for%20Excellence?" target="_blank">https://education.gov.scot/scottish-education-system/policy-for-scottish-education/policy-drivers/cfe-(building-from-the-statement-appendix-incl-btc1-5)/What%20is%20Curriculum%20for%20Excellence?</a> [accessed 27 June 2017]
Sbruzzi, G., Eibel, B., Barbiero, S.M., Petkowicz, R.O., Ribeiro, R.A., Cesa, C.C., … Pellanda, L.C. (2013). Educational interventions in childhood obesity: A systematic review with meta-analysis of randomized clinical trials. Preventive Medicine, 56(5), 254-264. doi: 10.1016/j.ypmed.2013.02.024
Khambalia, A.Z., Dickinson, S., Hardy, L.L., Gill, T., & Baur, L.A. (2012). A synthesis of existing systematic reviews and meta-analyses of school-based behavioural interventions for controlling and preventing obesity. Obesity Reviews, 13(3), 214-233. doi: 10.1111/j.1467-789X.2011.00947.x
Skouteris, H., McCabe, M., Swinburn, B., Newgreen, V., Sacher, P., & Chadwick, P. (2011). Parental influence and obesity prevention in pre-schoolers: a systematic review of interventions. Obesity Reviews, 12(5), 315-328. doi: 10.1111/j.1467-789X.2010.00751.x
Golley, R.K., Hendrie, G.A., Slater, A., & Corsini, N. (2010). Interventions that involve parents to improve children’s weight-related nutrition intake and activity patterns – what nutrition and activity targets and behaviour change techniques are associated with intervention effectiveness?. Obesity Reviews, 12, 114-130. doi: 10.1111/j.1467-789X.2010.00745.x
Adams, J., Goffe, L., Adamson, A.J., Halligan, J., O’Brien, N., Purves, R., … White, M. (2015). Prevalence and socio-demographic correlates of cooking skills in UK adults: cross-sectional analysis of data from the UK National Diet and Nutrition Survey. International Journal of Behavioral Nutrition and Physical Activity, 12(99). doi: 10.1186/s12966-015-0261-x
Reicks, M., Trofholz, A.C., Stang, J.S., & Laska, M.N. (2014). Impact of Cooking and Home Food Preparation Interventions Among Adults: Outcomes and Implications for Future Programs. Journal of Nutrition Education and Behavior, 46(4), 259-276. doi: 10.1016/j.jneb.2014.02.001
Vaitkeviciute, R., Ball, L.E., & Harris, N. (2015). The relationship between food literacy and dietary intake in adolescents: a systematic review. Public Health Nutrition, 18(4), 649-658. doi: 10.1017/S1368980014000962
Hersch, D., Perdue, L., Ambroz, T., & Boucher, J.L. (2014). The Impact of Cooking Classes on Food-Related Preferences, Attitudes, and Behaviors of School-Aged Children: A Systematic Review of the Evidence, 2003–2014. Prevention of Chronic Diseases, 11. doi: 10.5888/pcd11.140267
Scottish Transport. (2017). Scottish Transport Statistics. No 35: 2016 Edition. Chapter 11: Personal and Cross-Modal Travel. Scottish Transport.
Cycling Scotland. (2015). Annual Cycling Monitoring Report. Cycling Scotland.
Transport Scotland. (2017). Cycling Action Plan for Scotland 2017-2020. Cycling as a form of transport. Transport Scotland.
Scottish Government. (2014). Let’s Get Scotland Walking. The National Walking Strategy. Scottish Government.
de Vet, E., de Ridder, D.T.D., & de Wit, J.B.F. (2010). Environmental correlates of physical activity and dietary behaviours among young people: a systematic review of reviews. Obesity Reviews, 12(5), 130-142. doi: 10.1111/j.1467-789X.2010.00784.x
Mackenbach, J.D., Rutter, H., Compernolle, S., Glonti, K., Oppert, J.M., Charreire, H., … Lakerveld, J. (2014). Obesogenic environments: a systematic review of the association between the physical environment and adult weight status, the SPOTLIGHT project. BMC Public Health, 14(233). doi: 10.1186/1471-2458-14-233
Cerin, E., Nathan, A., van Cauwenberg, J., Barnett, D.W., & Barnett, A. (2017). The neighbourhood physical environment and active travel in older adults: a systematic review and meta-analysis. International Journal of Behavioral Nutrition and Physical Activity, 14(15). doi: 10.1186/s12966-017-0471-5
De Bourdeaudhuij, I., Van Dyck, D., Salvo, D., Davey, R., Reis, R.S., Schofield, G., … Cerin, E. (2015). International study of perceived neighbourhood environmental attributes and Body Mass Index: IPEN Adult study in 12 countries. International Journal of Behavioral Nutrition and Physical Activity. doi: 10.1186/s12966-015-0228-y
Glazier, R.H., Creatore, M.I., Weyman, J.T., Fazli, G., Matheson, F.I., Gozdyra, P., … Booth, G.L. (2014). Density, Destinations or Both? A Comparison of Measures of Walkability in Relation to Transportation Behaviors, Obesity and Diabetes in Toronto, Canada. PLOS ONE, 9(1), 85295. doi: 10.1371/journal.pone.0085295
Saunders, L.E., Green, J.M., Petticrew, M.P., Steinbach, R., & Roberts, H. (2013). What Are the Health Benefits of Active Travel? A Systematic Review of Trials and Cohort Studies. PLoS ONE. doi: https://doi.org/10.1371/journal.pone.0069912
Mueller, N., Rojas-Rueda, D., Cole-Hunter, T., de Nazelle, A., Dons, E., Gerike, R., … Nieuwenhuijsen, M. (n.d.) Health impact assessment of active transportation: A systematic review. Preventive Medicine, 76, 103-114. doi: 10.1016/j.ypmed.2015.04.010
Celis-Morales, C.A., Lyall, D.M., Welsh, P., Anderson, J., Steell, L., Guo, Y., … Gill, J.M.R. (2017). Association between active commuting and incident cardiovascular disease, cancer, and mortality: prospective cohort study. British Medical Journal, 357, 1456. doi: 10.1136/bmj.j1456
Pucher, J., & Buehler, R. (2008). Making Cycling Irresistible: Lessons from The Netherlands, Denmark and Germany. Transport Reviews, 28(4), 495-528. doi: 10.1080/01441640701806612
Statistics Netherlands. (2016). Transport and Mobility 2016. Statistics Netherlands.
Transport Scotland. (2016). Reported Road Casualties Scotland 2015. Transport Scotland.
Scottish Government. (2016, November). Safety of the Neighbourhood for Walking. Retrieved from <a href="http://www.gov.scot/About/Performance/scotPerforms/partnerstories/Outcomes-Framework/Wellbeing-Reslilience-Communities/Safety-Neighbourhood-Walking" target="_blank">http://www.gov.scot/About/Performance/scotPerforms/partnerstories/Outcomes-Framework/Wellbeing-Reslilience-Communities/Safety-Neighbourhood-Walking</a> [accessed 27 June 2017]
Scottish Government. (2014). Scottish Crime and Justice Survey 2012-13. Section 6: Public Perceptions of Crime. Scottish Government.
Scottish Government. (2016). Scotland’s People Annual Report: Results from the 2015 Scottish Household Survey. A National Statistics publication for Scotland.
Lee, A.C.K., & Maheswaran, R. (2010). The health benefits of urban green spaces: a review of the evidence. Journal of Public Health, 23(2), 212-222. doi: 10.1093/pubmed/fdq068
Stafford, M., Cummins, S., Ellaway, A., Sacker, A., Wiggins, R.D., & Macintyre, S. (2007). Pathways to obesity: Identifying local, modifiable determinants of physical activity and diet. Social Science & Medicine, 65(9), 1882-1897. doi: 10.1016/j.socscimed.2007.05.042
Ellaway, A., Lamb, K.E., Ferguson, N.S., & Ogilvie, D. (2016). Associations between access to recreational physical activity facilities and body mass index in Scottish adults. BMC Public Health, 16(756). doi: 10.1186/s12889-016-3444-8
Panter, J.R., & Jones, A.P. (2008). Associations between physical activity, perceptions of the neighbourhood environment and access to facilities in an English city. Social Science & Medicine, 67(11), 1917-1923.
Halonen, J.I., Stenholm, S., Kivimäki, M., Pentti, J., Subramanian, S.V., Kawachi, I., … Vahtera, J. (2015). Is change in availability of sports facilities associated with change in physical activity? A prospective cohort study. Preventive Medicine, 73, 10-14. doi: 10.1016/j.ypmed.2015.01.012
Giles-Corti, B., Macintyre, S., Clarkson, J.P., Pikora, T., & Donovan, R.J. (2003). Environmental and lifestyle factors associated with overweight and obesity in Perth, Australia.. American Journal of Health Promotion, 18(1), 93-102.
Beaulac, J., Kristjansson, E., & Cummins, S. (2009). A Systematic Review of Food Deserts, 1966-2007. Preventing Chronic Disease, 6(3).
White, M., Bunting, J., Williams, L., Raybould, S., Adamson, A., & Mathers, J. (2004). Do ‘food deserts’ exist? A multi-level, geographical analysis of the relationship between retail food access, socioeconomic position and dietary intake. Report to the Food Standards Agency.
McGuire, E.R., Burgoine, T., & Monsivais, P. (2015). Area deprivation and the food environment over time: A repeated cross-sectional study on takeaway outlet density and supermarket presence in Norfolk, UK, 1990–2008. Health & Place, 33, 142-147.
Macdonald, L., Ellaway, A., Ball, K., & Macintrye, S. (2011). Is proximity to a food retail store associated with diet and BMI in Glasgow, Scotland?. BMC Public Health, 11(464). doi: 10.1186/1471-2458-11-464
Macdonald, L., Ellaway, A., & Macintyre, S. (2009). The food retail environment and area deprivation in Glasgow City, UK. International Journal of Behavioral Nutrition and Physical Activity, 6(52). doi: 10.1186/1479-5868-6-52
Cummins, S., Smith, D.M., Taylor, M., Dawson, J., Marshall, D., Sparks, L., … Anderson, A.S. (2009). Variations in fresh fruit and vegetable quality by store type, urban-rural setting and neighbourhood deprivation in Scotland. Public Health Nutrition. doi: 10.1017/S1368980009004984
Walker, R.E., Keane, C.R., & Burke, J.G. (2010). Disparities and access to healthy food in the United States: A review of food deserts literature. Health & Place, 16(5), 876-884. doi: 10.1016/j.healthplace.2010.04.013
Currie, J., DellaVigna, S., Moretti, E., & Pathania, V. (2010). The Effect of Fast Food Restaurants on Obesity and Weight Gain. American Economic Journal: Economic Policy, 2(3), 32-63. doi: 10.1257/pol.2.3.32
Chandon, P., & Wansinl, B. (2012). Does food marketing need to make us fat? A review and solutions. Nutrition Reviews, 70(10), 571-593. doi: 10.1111/j.1753-4887.2012.00518.x
Burgoine, T., & Monsivais, P. (2013). Characterising food environment exposure at home, at work, and along commuting journeys using data on adults in the UK. International Journal of Behavioral Nutrition and Physical Activity, 10(85). doi: 10.1186/1479-5868-10-85
Schools (Health Promotion and Nutrition) (Scotland) Act 2007. (2007). Retrieved from <a href="http://www.legislation.gov.uk/asp/2007/15/crossheading/health-promotion" target="_blank">http://www.legislation.gov.uk/asp/2007/15/crossheading/health-promotion</a> [accessed 27 June 27]
The Nutritional Requirements for Food and Drink in Schools (Scotland) Regulations 2008. (2008). Retrieved from <a href="http://www.legislation.gov.uk/ssi/2008/265/contents/made" target="_blank">http://www.legislation.gov.uk/ssi/2008/265/contents/made</a> [accessed 27 June 2017]
Scottish Government. (2016, June). Free School Lunches. Retrieved from <a href="http://www.gov.scot/Topics/Education/Schools/HLivi/schoolmeals/FreeSchoolMeals" target="_blank">http://www.gov.scot/Topics/Education/Schools/HLivi/schoolmeals/FreeSchoolMeals</a> [accessed 27 June 2017]
Food Standards Agency. (n.d.) Food Law. Retrieved from <a href="https://www.food.gov.uk/enforcement/regulation/foodlaw" target="_blank">https://www.food.gov.uk/enforcement/regulation/foodlaw</a> [accessed 27 June 2017]
Driessen, C.E., Cameron, A.J., Thornton, E., Lai, S.K., & Barnett, L.M. (2014). Effect of changes to the school food environment on eating behaviours and/or body weight in children: a systematic review. Obesity Reviews, 15(12), 968-982. doi: 10.1111/obr.12224
Roy, R., Kelly, B., Rangan, A., & Allman-Farinelli, M. (2015). Food Environment Interventions to Improve the Dietary Behavior of Young Adults in Tertiary Education Settings: A Systematic Literature Review. Journal of the Academy of Nutrition and Dietetics, 115(10), 1647-1681. doi: 10.1016/j.jand.2015.06.380
Ni Mhurchu, C., Aston, L.M., & Jebb, S.A. (2010). Effects of worksite health promotion interventions on employee diets: a systematic review. BMC Public Health, 10(62). doi: 10.1186/1471-2458-10-62
Sparks, L., & Burt, S. (2017). Identifying and Understanding the Factors that can Transform the Retail Environment to Enable Healthier Purchasing by Consumers. Report for Food Standards Scotland.
Glanz, K., Bader, M.D.M., & Iyer, S. (2012). Retail Grocery Store Marketing Strategies and Obesity: An Integrative Review. American Journal of Preventive Medicine, 42(5), 503-512. doi: 10.1016/j.amepre.2012.01.013
Rose, D., Hutchinson, P.L., Bodor, J.N., Swalm, C.M., Farley, T.A., Cohen, D.A., … Rice, J.C. (2009). Neighborhood Food Environments and Body Mass Index. The Importance of In-Store Contents. American Journal of Preventive Medicine, 37(3), 214-219. doi: 10.1016/j.amepre.2009.04.024
He, F.J., Brinsden, H.C., & MacGregor, G.A. (2014). Salt reduction in the United Kingdom: a successful experiment in public health. Journal of Human Hypertension, 28(6), 345-352. doi: 10.1038/jhh.2013.105
Hollands, G.J., Shemilt, I., Marteau, T.M., Jebb, S.A., Lewis, H.B., Wei, Y., … Ogilvie, D. (2015). Portion, package or tableware size for changing selection and consumption of food, alcohol and tobacco. Cochrane Database of Systematic Reviews, (9). doi: 10.1002/14651858.CD011045.pub2
Marteau, T.M., Hollands, G.J., Shemilt, I., & Jebb, S.A. (2015). Downsizing: policy options to reduce portion sizes to help tackle obesity. BMJ, 351. doi: 10.1136/bmj.h5863
Livingstone, M.B.E., & Pourshahidi, L.K. (2014). Portion Size and Obesity. Advances in Nutrition, 5, 829-834. doi: 10.3945/?an.114.007104
European Commision. (2017, June). Food Labelling Legislation. Retrieved from <a href="https://ec.europa.eu/food/safety/labelling_nutrition/labelling_legislation_en" target="_blank">https://ec.europa.eu/food/safety/labelling_nutrition/labelling_legislation_en</a> [accessed 27 June 2017]
The Chartered Institute of Marketing. (2014). Consumer confusion over food labelling.. The Chartered Institute of Marketing.
Cecchini, M., & Warin, L. (2016). Impact of food labelling systems on food choices and eating behaviours: a systematic review and meta-analysis of randomized studies. Obesity Reviews, 17(3), 201-210. doi: 10.1111/obr.12364
Thomas, E. (2016). Food for thought: obstacles to menu labelling in restaurants and cafeterias. Public Health Nutrition, 19(12), 2185-2189. doi: 10.1017/S1368980015002256
Littlewood, J.A., Lourenço, S., Iversen, C.L., & Hansen, G.L. (2015). Menu labelling is effective in reducing energy ordered and consumed: a systematic review and meta-analysis of recent studies. Public Health Nutrition, 19(12), 2106-2121. doi: 10.1017/S1368980015003468
Robinson, L., & Border, P. (2015). Obesity Treatments. The Parliamentary Office of Science and Technology.
Mooney, J., Haw, S., & Frank, J. (2011). Policy Interventions to Tackle the Obesogenic Environment Focusing on adults of working age in Scotland. Scottish Collaboration for Public Health Research and Policy.
The UK Healthy Start Scheme. (2014). Retrieved from <a href="https://www.healthystart.nhs.uk/" target="_blank">https://www.healthystart.nhs.uk/</a> [accessed 26 June 2017]
Griffith, R., von Hinke, S., & Smith, S. (2015). Getting a healthy start: The effectiveness of targeted benefits for improving dietary choices. Health, Econometrics and Data Group, University of York.
Ohly, H., Crossland, N., Dykes, F., Lowe, N., & Hall-Moran, V. (2016). A realist review to explore how low-income pregnant women use food vouchers from the UK’s Healthy Start programme. British Medical Journal. doi: 10.1136/bmjopen-2016-013731
Browne, S., Dundas, R., & Wright, D. (2016). Assessment of the Healthy Start Voucher scheme: a qualitative study of the perspectives of low income mothers. The Lancet, 388(2). doi: 10.1016/S0140-6736(16)32248-6
Campbell, F., Holmes, M., Everson-Hock, E., Davis, S., Buckley Woods, H., Anokye, N., … Kaltenthaler, E. (2015). A systematic review and economic evaluation of exercise referral schemes in primary care: a short report. Health Technology Assessment, 19(60). doi: 10.3310/hta19600
List, J.A., & Samek, A.S. (2015). The behavioralist as nutritionist: Leveraging behavioral economics to improve child food choice and consumption. Journal of Health Economics, 39, 135-146. doi: 10.1016/j.jhealeco.2014.11.002
Just, D.R., & Price, J. (2013). Using Incentives to Encourage Healthy Eating in Children. Journal of Human Resources, 48(4), 855-872. doi: 10.1353/jhr.2013.0029
Ni Mhurchu, C., Blakely, T., Jiang, Y., Eyles, H.C., & Rodgers, A. (2010). Effects of price discounts and tailored nutrition education on supermarket purchases: a randomized controlled trial. American Journal of Clinical Nutrition, 91(3), 736-747. doi: 10.3945/ajcn.2009.28742
Molema, C.C.M., Wendel-Vos, G.C.W., Puijk, L., Jensen, J.D., Schuit, A.J., & de Wit, G.A. (2016). A systematic review of financial incentives given in the healthcare setting; do they effectively improve physical activity levels?. BMC Sports Science, Medicine and Rehabilitation, 8(15). doi: 10.1186/s13102-016-0041-1
Mitchell, M.S., Goodman, J.M., Alter, D.A., John, L.K., Oh, P.I., Pakosh, M.T., … Faulkner, G.E. (2013). Financial Incentives for Exercise Adherence in Adults: Systematic Review and Meta-Analysis. American Journal of Preventative Medicine, 45(5), 658-667. doi: 10.1016/j.amepre.2013.06.017
Strohacker, K., Galarraga, O., & Williams, D.M. (2014). The Impact of Incentives on Exercise Behavior: A Systematic Review of Randomized Controlled Trials. Annals of Behavioral Medicine, 48(1), 92-99. doi: 10.1007/s12160-013-9577-4
Paul-Ebhohimhen, V., & Avenell, A. (2008). Systematic review of the use of financial incentives in treatments for obesity and overweight. Obesity Reviews, 9(4), 355-367. doi: 10.1111/j.1467-789X.2007.00409.x
Volpp, K.G., John, L.K., Troxel, A.B., Norton, L., Fassbender, J., & Loewenstein, G. (2008). Financial Incentive–Based Approaches for Weight Loss: A Randomized Trial. JAMA, 300(22), 2631-2637. doi: 10.1001/jama.2008.804
Marteau, T.M., Ashcroft, R.E., & Oliver, A. (2009). Using financial incentives to achieve healthy behaviour. The British Medical Journal, 338, 1415. doi: 10.1136/bmj.b1415
Obesity Action Scotland. (2016). Advertising, Marketing and Obesity. Obesity Action Scotland.
Advertising Standards Agency and Committee of Advertising Practice. (2017). The UK Code of Broadcast Advertising. Part 13: Food, Food Supplements and Associated Health or Nutritional Claims. Advertising Standards Agency and Committee of Advertising Practice.
Advertising Standards Agency and Committee of Advertising Practice. (2017). The UK Code of Non-Broadcast Advertising. Section 15: Food, Food Supplements and Associated Health or Nutritional Claims.. Advertising Standards Agency and Committee of Advertising Practice.
Advertising Standards Authority and Committee of Advertising Practice. (2017). About ASA and CAP. Retrieved from <a href="https://www.asa.org.uk/about-asa-and-cap/about-regulation/about-the-asa-and-cap.html" target="_blank">https://www.asa.org.uk/about-asa-and-cap/about-regulation/about-the-asa-and-cap.html</a> [accessed 27 June 2017]
Tedstone, A., Targett, V., & Allen, R. (2015). Sugar Reduction. The evidence for action. Public Health England.
Committee of Advertising Practice. (2016). CAP Consultation: food and soft drink advertising to children. Regulatory statement. Committee of Advertising Practice.
Norman, J., Kelly, B., Boyland, E., & McMahon, A.T. (2016). The Impact of Marketing and Advertising on Food Behaviours: Evaluating the Evidence for a Causal Relationship. Current Nutrition Reports, 5(3), 139-149. doi: 10.1007/s13668-016-0166-6
Boyland, E.J., Nolan, S., Kelly, B., Tudur-Smith, C., Jones, A., Halford, J.C.G., … Robinson, E. (2016). Advertising as a cue to consume: a systematic review and meta-analysis of the effects of acute exposure to unhealthy food and nonalcoholic beverage advertising on intake in children and adults. American Society for Nutrition. doi: 10.3945/?ajcn.115.120022
Veerman, J.L., Van Beeck, E.F., Barendregt, J.J., & Mackenbach, J.P. (2009). By how much would limiting TV food advertising reduce childhood obesity?. European Journal of Public Health, 19(4), 365-369. doi: 10.1093/eurpub/ckp039
Chartered Trading Standards Institute. (2016). Guidance for Traders on Pricing Practices. Chartered Trading Standards Institute for the Department of Business, Energy and Industrial Strategy (BEIS).
Hawkes, C. (2009). Sales promotions and food consumption. Nutrition Reviews, 67(6), 333-342. doi: 10.1007/s13668-016-0172-8
Nakamura, R., Suhrcke, M., Jebb, S.A., Pechey, R., Almiron-Roig, E., & Marteau, T.M. (2015). Price promotions on healthier compared with less healthy foods: a hierarchical regression analysis of the impact on sales and social patterning of responses to promotions in Great Britain. American Journal of Clinical Nutrition, 101(4), 808-816. doi: 10.3945/?ajcn.114.094227
Smith, K.E., & Eltanani, M.K. (2014). What kinds of policies to reduce health inequalities in the UK do researchers support?. Journal of Public Health, 37(1), 6-17. doi: 10.1093/pubmed/fdu057