Diversity Monitoring and Pay Gaps Report 2022/23
We collect data for analysis and reporting each year. This is to ensure our policies and working practices are meeting our aims for an inclusive workplace and a diverse workforce.
Diversity Monitoring and Pay Gaps Report 2022/23
Introduction
Introduction
This report provides the evidence base for our Session 6 People and Culture Strategy diversity aims and meets our duties under the Equality Act 2010.
The data used in this report to analyse our pay gaps and staff diversity was collected at 31 March 2023. The recruitment and workforce reporting data is for the period 1 April 2022 to 31 March 2023.
Data tables are available for download here (42KB Excel document)
People and Culture Strategy Priority
Creating a diverse, respectful and inclusive working environment
We want working life to be a positive experience for everyone. Where all colleagues feel safe and able to raise concerns and potential risks, knowing that they will be supported and heard. We will speak out against injustices even when it doesn’t feel easy and keep focus on those affected. We will continue to work towards our goal of building a diverse organisation. One that reflects wider Scottish society.
Our aims are for:
- An inclusive, welcoming, and vibrant culture in which we all feel valued, respected, and engaged.
- Increased diversity at all levels.
- Colleagues feel they have a voice which is heard.
Strategic Intentions over the next five years
The scale of ambitious change we are looking to achieve, in transforming the culture and behaviours of the organisation, will take time to develop and embed. We will keep engaging with our colleagues to adapt and evolve our plans as we go, making sure the initiatives have maximum impact.
Our actions to achieve this will be underpinned by our Values and Behaviours Framework.
Ro-ràdh
Tha an aithisg seo a’ lìbhrigeadh bunait fianais airson ar n-amasan a thaobh iomadachd ann an Ro-innleachd Daoine is Cultar Seisean 6 agus a’ coileanadh ar dleastanasan fo Achd na Co-ionannachd 2010.
Chaidh an dàta a chleachd sinn san aithisg seo gus anailis a dhèanamh air na beàrnan pàighidh agus iomadachd luchd-obrach againn a chruinneachadh air 31 Màrt 2023. Buinidh an dàta aithris fastaidh is luchd-obrach ris an ùine 1 Giblean 2022 gu 31 Màrt 2023.
Prìomhachas Ro-innleachd Daoine is Cultair
A’ cruthachadh àrainneachd obrach a tha eadar-mheasgte, spèiseil agus in-ghabhalach
Tha sinn airson gum fiosraich a h-uile duine beatha obrach a tha adhartach. Far a bheil co-oibrichean uile a’ faireachdainn sàbhailte agus comasach air draghan agus cunnartan a thogail, agus fios aca gum faigh iad taic agus èisteachd. Bruidhnidh sinn a-mach an-aghaidh ana-ceartas eadhon nuair nach eil e furasta agus cumaidh sinn aire air an fheadhainn air a bheil buaidh. Leanaidh sinn oirnn ag obair a dh’ionnsaigh ar n-amais airson buidheann eadar-mheasgte a thogail. Tè a tha a’ nochdadh comann-sòisealta na h-Alba san fharsaingeachd.
Is iad na h-amasan againn:
- Cultar in-ghabhalach, aoigheil agus beothail anns a bheil sinn uile a’ faireachdainn gu bheil luach annainn, spèis ga thoirt dhuinn agus com-pàirt againn ann.
- Barrachd iomadachd aig gach ìre.
- Co-oibrichean a' faireachdainn gu bheil guth aca agus gun tèid an cluinntinn.
Rùintean Ro-innleachdail thar nan còig bliadhna a tha romhainn
Bheir meud an atharrachaidh àrd-amasaich a tha sinn airson a choileanadh, ann a bhith ag atharrachadh cultar agus giùlan na buidhne, ùine ga leasachadh agus ga stèidheachadh. Mar a thèid sinn air adhart, cumaidh sinn oirnn a’ conaltradh le ar co-obraichean gus dèanamh cinnteach gu bheil ar planaichean an-còmhnaidh freagarrach agus gum bi a’ bhuaidh as motha aig ar n-oidhirpean.
Bidh na gnìomhan againn gus seo a choileanadh bonntaichte air an Fhrèam-obrach Luachan is Giùlain againn.
How did we do this year?
How did we do this year?
Our actions for 2022/23:
1. Following on from the commitments made to the Equalities and Human Rights Committee (Session 5) we will continue to work on the actions to address the underrepresentation of Minority Ethnic people in our workforce and within our senior leadership roles.
We will develop a self-assessment tool to identify gaps in our approach to tackling racism We will follow this up with a diversity and inclusion culture audit from an external provider.
- Update: We commissioned an inclusion maturity assessment from an external provider. The work was conducted in February/March 2023. The findings and recommendations of the review have been communicated with our stakeholder groups and mapped to the People and Culture Strategy Delivery Plan.
We will develop a Race Strategy to tackle barriers in the workplace, including pay disparities.
- Update: The Race Strategy is included Year 3 and 4 (2024/5) People & Culture Strategy Delivery Plan.
Continue with our programmes to support the career development of Minority Ethnic colleagues.
- Updates: We developed a Minority Ethnic one year internship programme for three colleagues that was started in August 2022. Participants have been supported with career development opportunities.
- We continued to provide support to the ME Emerging Leaders Programme for our existing staff members. Through this programme we supported colleagues to pursue roles that match their skills, qualities and experience. Some of the participants have moved into permanent promoted roles since participating in the programme.
- A review of the Programme has been conducted and findings will inform the design of future programmes.
Review our recruitment and selection practices for inclusiveness, reach and impact.
- Update: This year we had our practices by our external auditors assessed using their inclusion maturity model. This review included our recruitment and selection practices. Recommendations have been mapped to People and Culture Strategy Delivery Plan. Our Recruiting for Excellence policy was reviewed in the past year. The use of positive action to attract specific groups is embedded into the revised policy. Quarterly workforce reports to Leadership Team provide an update on the impact of our inclusive recruitment approach.
Continue to use positive action to increase diversity in our staff group.
- Updates: Our recruitment marketing activities have used inclusive, targeted methods over the past year. Engaging with external groups who can support us in our aims.
- In this recruitment year there has been an increase in the proportion of applications and successful appointments to Minority Ethnic, LGB+ (Lesbian, Gay, Bisexual and +) and non-binary candidates.
2. Take action in response to the results of our staff survey and progress our commitments in the Positive About Mental Health and Wellbeing delivery plan.
- Updates: A small project team has been established in the People and Culture group to review our wellbeing activities. Our Positive About Mental Health and Wellbeing policy is there to make sure that our workplace promotes good mental health and wellbeing for all colleagues. The project team will update and lead on the implementation plan that supports the policy. The intention is that all colleagues will understand what it means to contribute to a workplace that promotes wellbeing and what our personal responsibilities are.
- Some good groundwork has been put in place already, for example, the Parliament has started working with a new provider, for counselling support and wellbeing support interventions.
3. In progressing the New Ways Of Working programme, we will seek to remove barriers and optimise the potential for positive impact on diverse groups.
- Update: The New Ways of Working Programme has embedded diversity impact analysis throughout including through extensive consultation with different groups and making decisions based on feedback.
4. We will conduct a pay structure review building in the analysis from pay gap data from this and previous reports.
- Update: The Pay Reform review was concluded for the end of March 2023. We redesigned our pay structure and reviewed our job classification framework. We have a transparent pay structure and clear criteria and robust processes for evaluating roles. Comment on the impact on our diversity pay gaps is included at the relevant section of this report.
5. We will review our data collection and reporting to see if it is still fit for purpose and culturally appropriate. This work will build on the previous discussions and decisions held by our Diversity & Inclusion Board. We will reflect on the Scottish Government’s Chief Statistician’s guidance on data gathering and reporting on gender and sex.
- Updates: We concluded the review of the diversity monitoring questions we use in our recruitment and with our staff group.
- The review took in the recommendations of the Chief Statistician on data gathering for protected groups.
- We continue to engage with our staff group about why we ask the questions, where and how we use their responses and how the question format has been decided.
6. Our Engagement team will promote and raise awareness of our policies, diversity networks, support for staff, development programmes.
- Update: The Internal Communication Strategy was launched in December 2022. The five priorities identified are:
- provide opportunities for people to stay informed, involved and connected
- inspire excellence
- promote a culture of inclusion and diversity
- help people look after their wellbeing at work
- support leaders to be visible, effective and have impact.
7. We will engage with Network steering groups on proposals to support them to continue to function and sustain themselves.
- Update: The review of operating arrangements and support for Diversity Networks and development of proposals for improvement is due for completion by end October 2023.
Our approach to collecting the data
Our approach to collecting the data
To ensure our policies and working practices are meeting our aims for an inclusive workplace and a diverse workforce we collect data about our staff group for analysis. Our approach to how we collect the data is aligned to our values rooted in respect and inclusion.
This report aims to comply with the Equality Act 2010 (Specific Duties and Public Authorities) Regulations 20171. In particular, it responds to the requirement to:
- publish information to demonstrate its compliance with the duty imposed by section 149(1) of the (Equality) Act
- publish gender pay gap information.
The data was collected from people management systems. Information about Age, Sex, Maternity/Paternity is provided from the payroll system The diversity information recorded in the Self-service system allows staff to self-declare. From this system the diversity monitoring questions that people have responded to, and that have been used in this report, are: Disability, Ethnicity, Religion or Belief, Sexual Orientation, Trans status, Gender Identification and Non-binary identification.
In addition questions about caring responsibilities and marital status are asked. They have not been included in this report
In 2022 we committed to conduct a review of the diversity monitoring questions we ask our staff. This review of the questions we use and the alignment with those as used in the Scottish Census 2022 and Chief Statistician’s guidance on Sex, gender identity, trans status - data collection has been completed.
We will continue to encourage our staff group at the earliest opportunity to update their information and help them understand why it is important to us.
Our data collection and reporting will be kept under review for fit to supporting our data informed decision making, inclusive language and meeting our legislative duties.
Our people
Our people
Data tables are available here - see sheet 1 Our People (42KB Excel document)
The declaration rate from the staff group is between the range of 67% to 99% (excluding prefer not to say responses) across the different protected characteristics and groups held in the system. The response rate including prefer not to say responses is 73 to 99%.
See table 1A
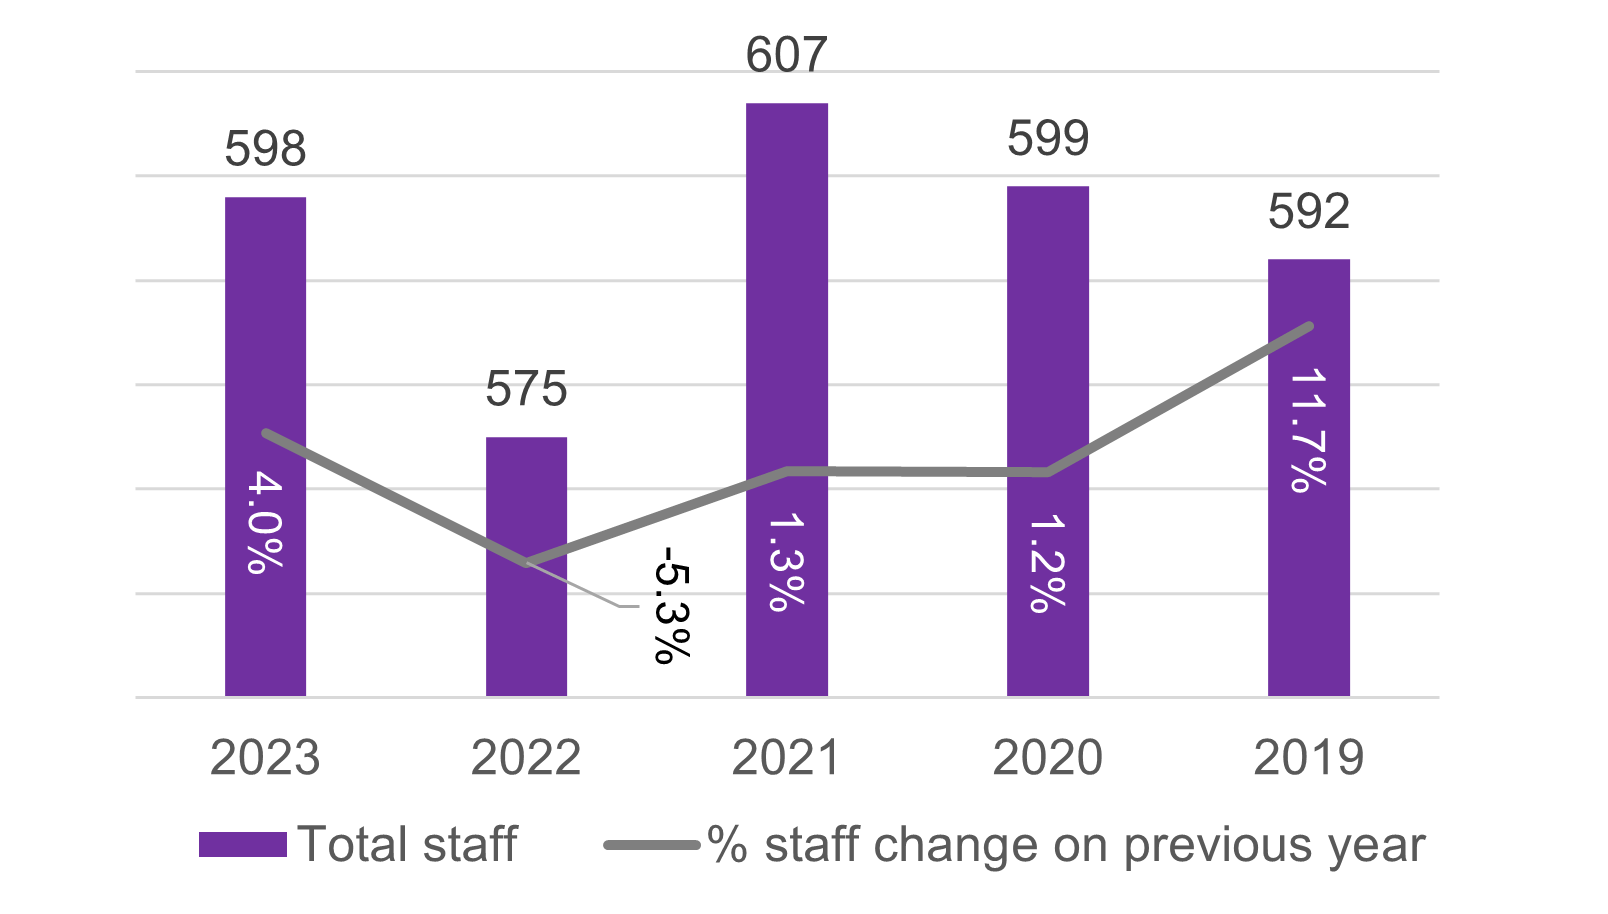
Working Pattern (Full time/part time) - see table 1B
This year the proportion of all staff on part-time contracts is 19.9%, this is a decrease of 2.2% from 22.1% in the previous year.
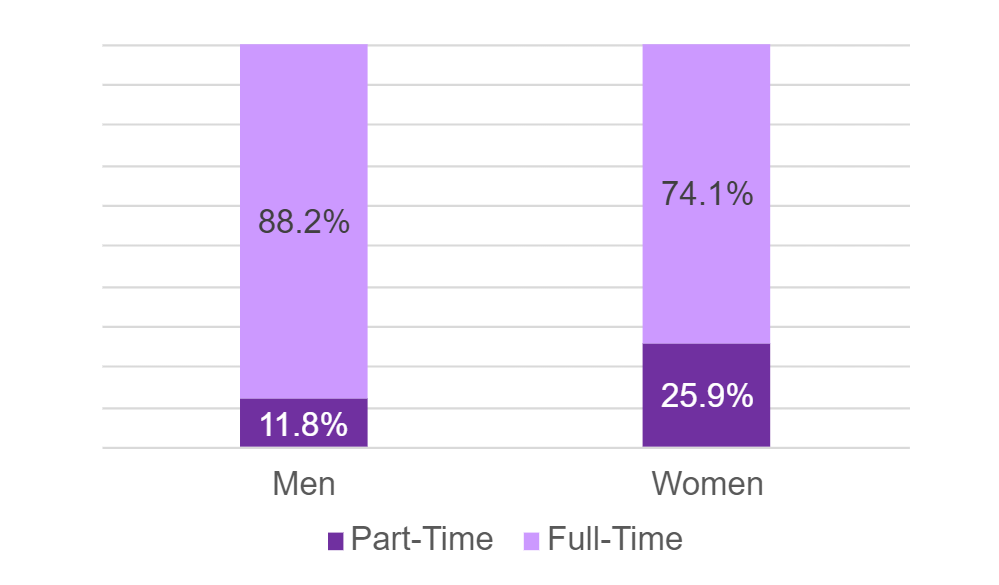
The number of men on part-time contracts decreased from 33 to 30. This accounts for 11.8% of men working for the Parliamentary Service and a decrease from 13% in the previous year.
The proportion of women working part-time contracts has also decreased from 29.2% to 25.9%. This is a decrease of 5.3% from 94 women in 2022 to 89 this year.
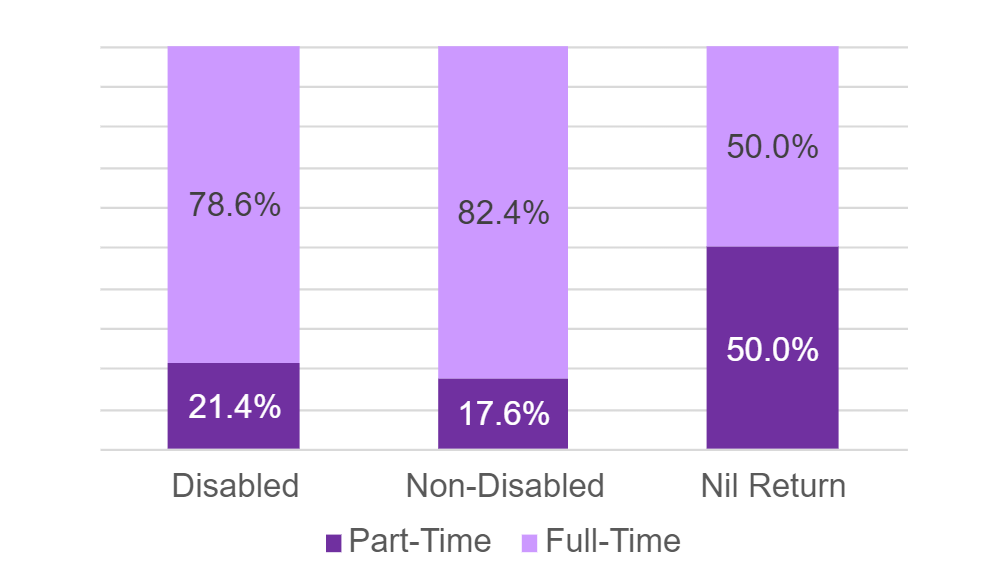
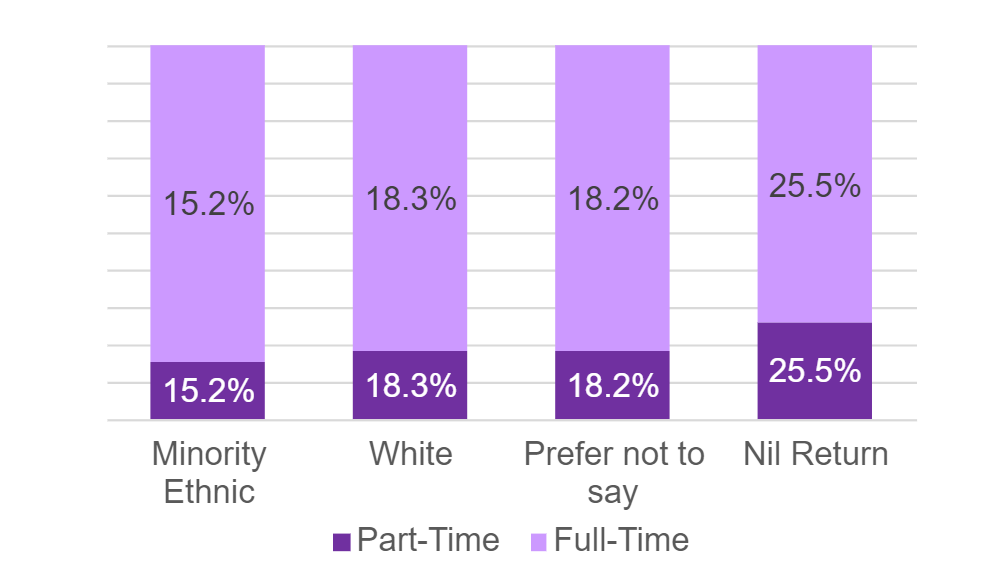
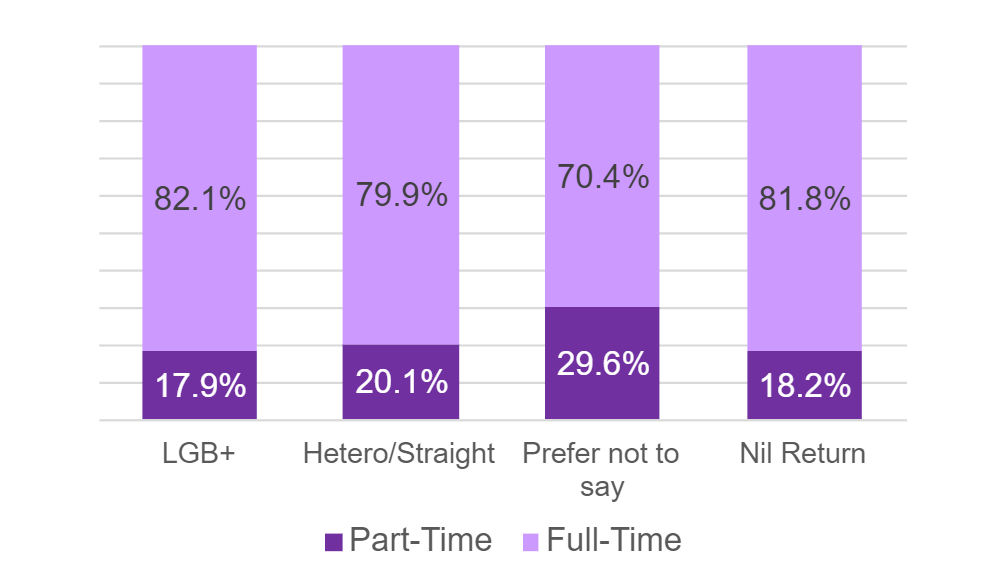
In a reversal of last year’s results, Disabled staff are slightly more likely to work part- time than the whole staff group (21.5% compared to 19.9%) this year. Minority Ethnic (ME) staff are much less likely to work part-time – 15.2% of ME staff work part-time and 17.9% of LGB+ staff.
The reason for the declining proportion of staff working part-time over successive years may be attributed to changes in working practice with the introduction of new ways of working, which has meant that a significant proportion of staff work in a hybrid way, or other external factors. This will require investigation.
Sex
Disability
Ethnicity
LGB+
Sex - see table 1C
Leadership Group (Grade 7 and above)
Senior Managers (Grade 6 and above)
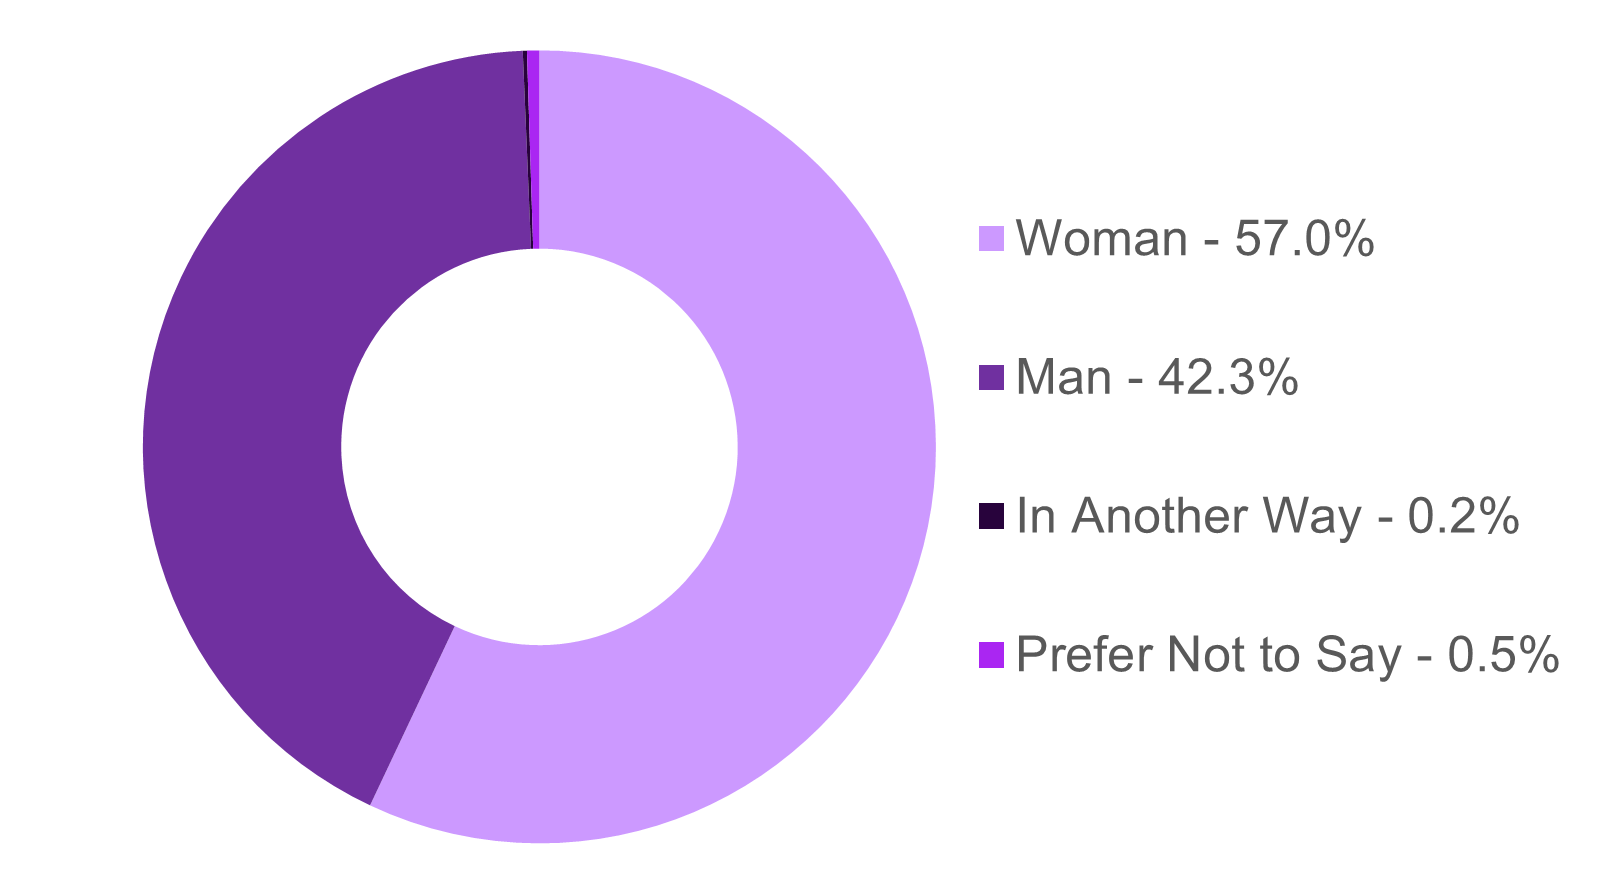
Gender Identification - see table 1D
In this reporting year there have been responses where staff members have described their gender identification as 'in another way' to either man or woman or identified as non-binary.
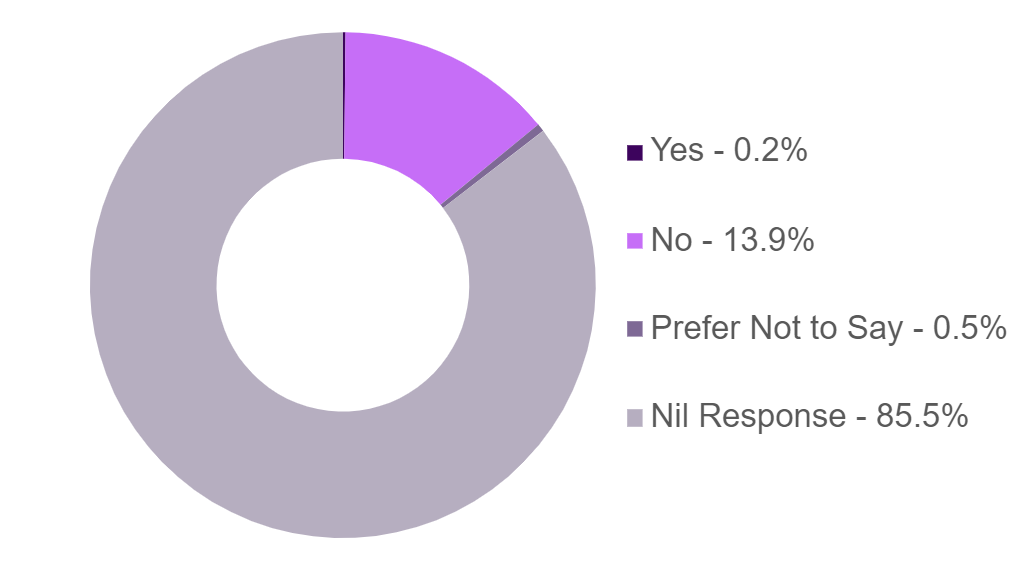
Non-binary - see table 1E
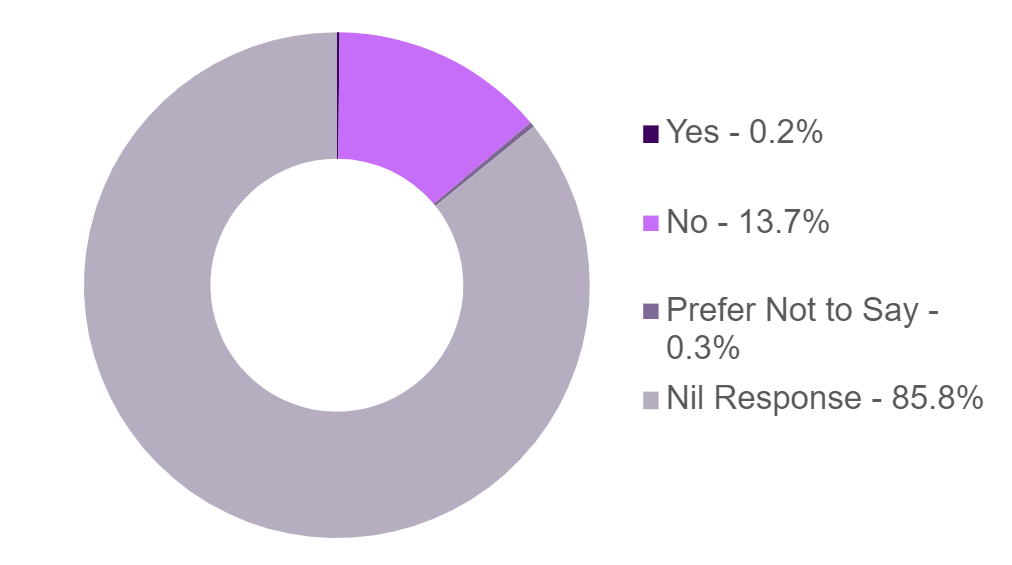
Trans - see table 1F
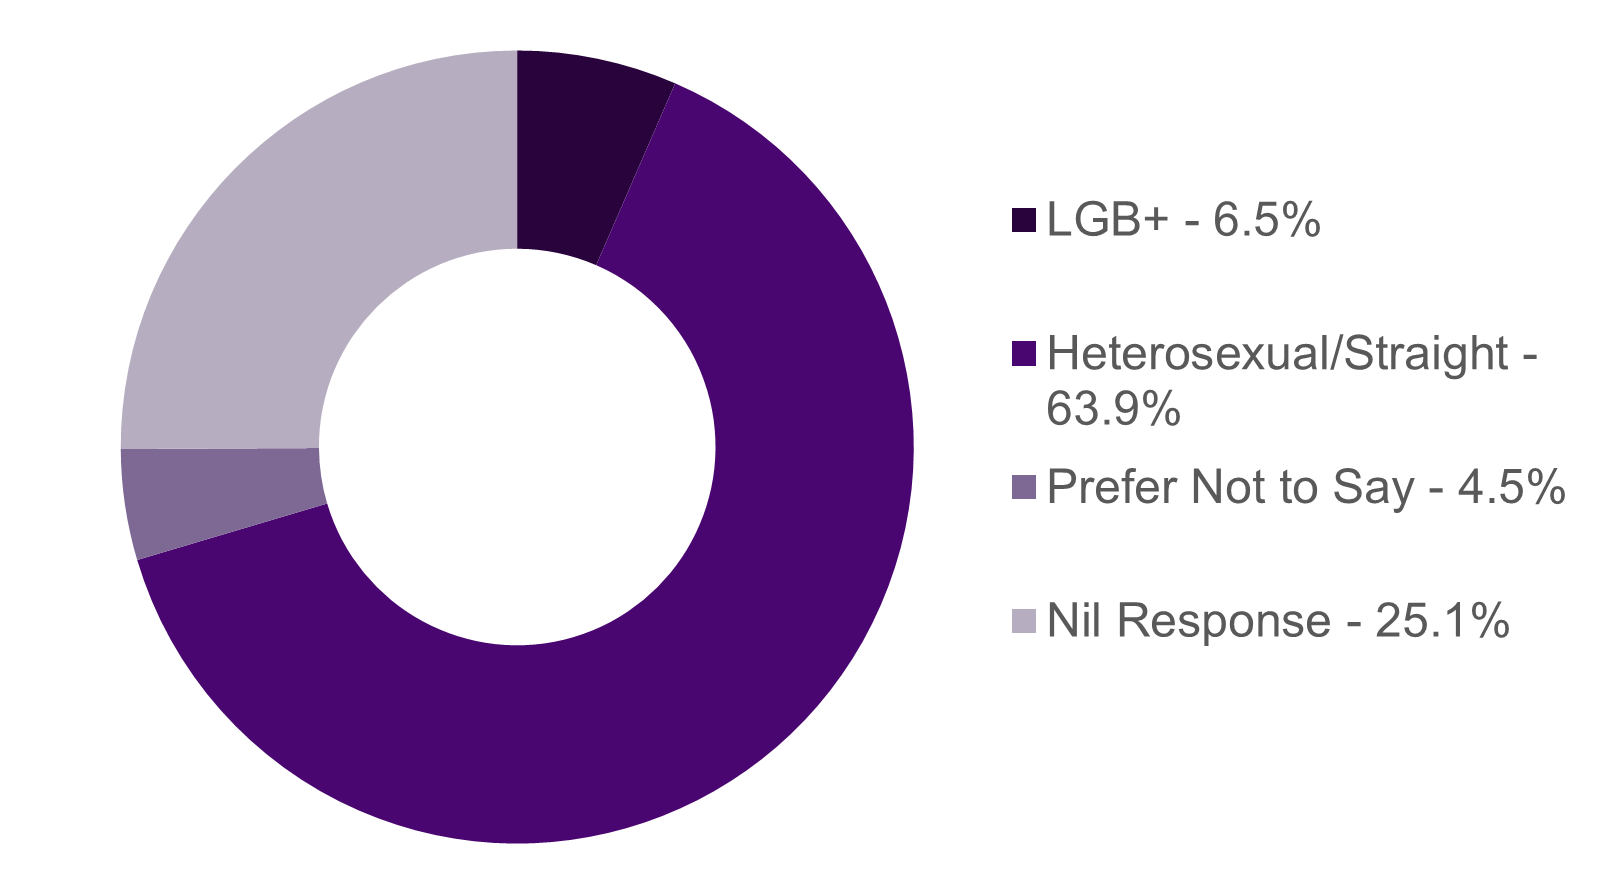
LGB+ - see table 1G
Minority Ethnic - see table 1H
Disability - see table 1I
A system change from previous year means that nil- responses are counted as ‘No’.
Age - see table 1J
Median age = 46 years
Religion or Belief - see table 1K
Pregnancy and Maternity - see table 1L
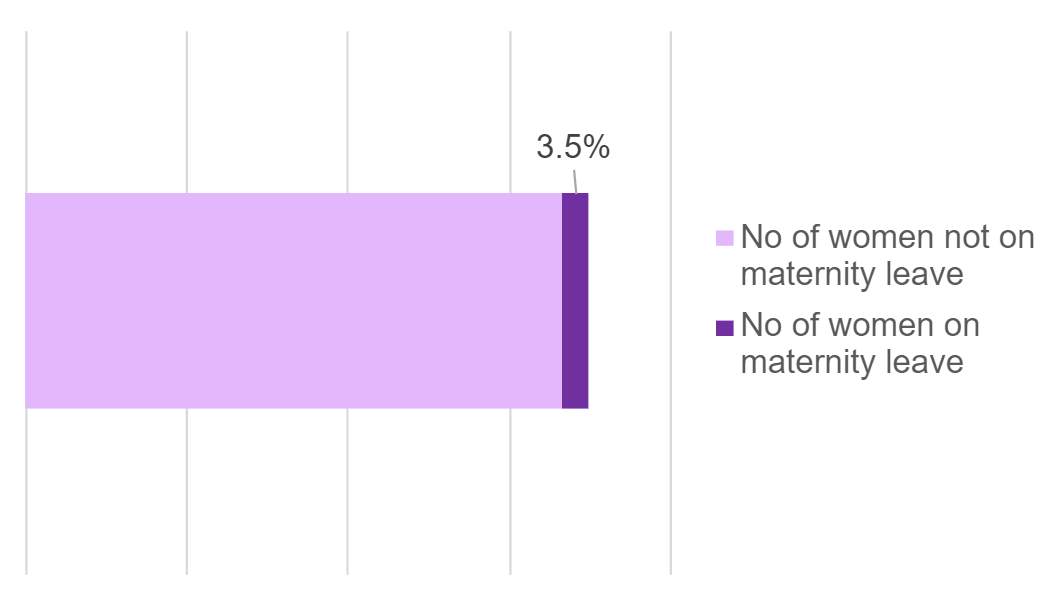
Return to Work and Working Pattern - see table 1M
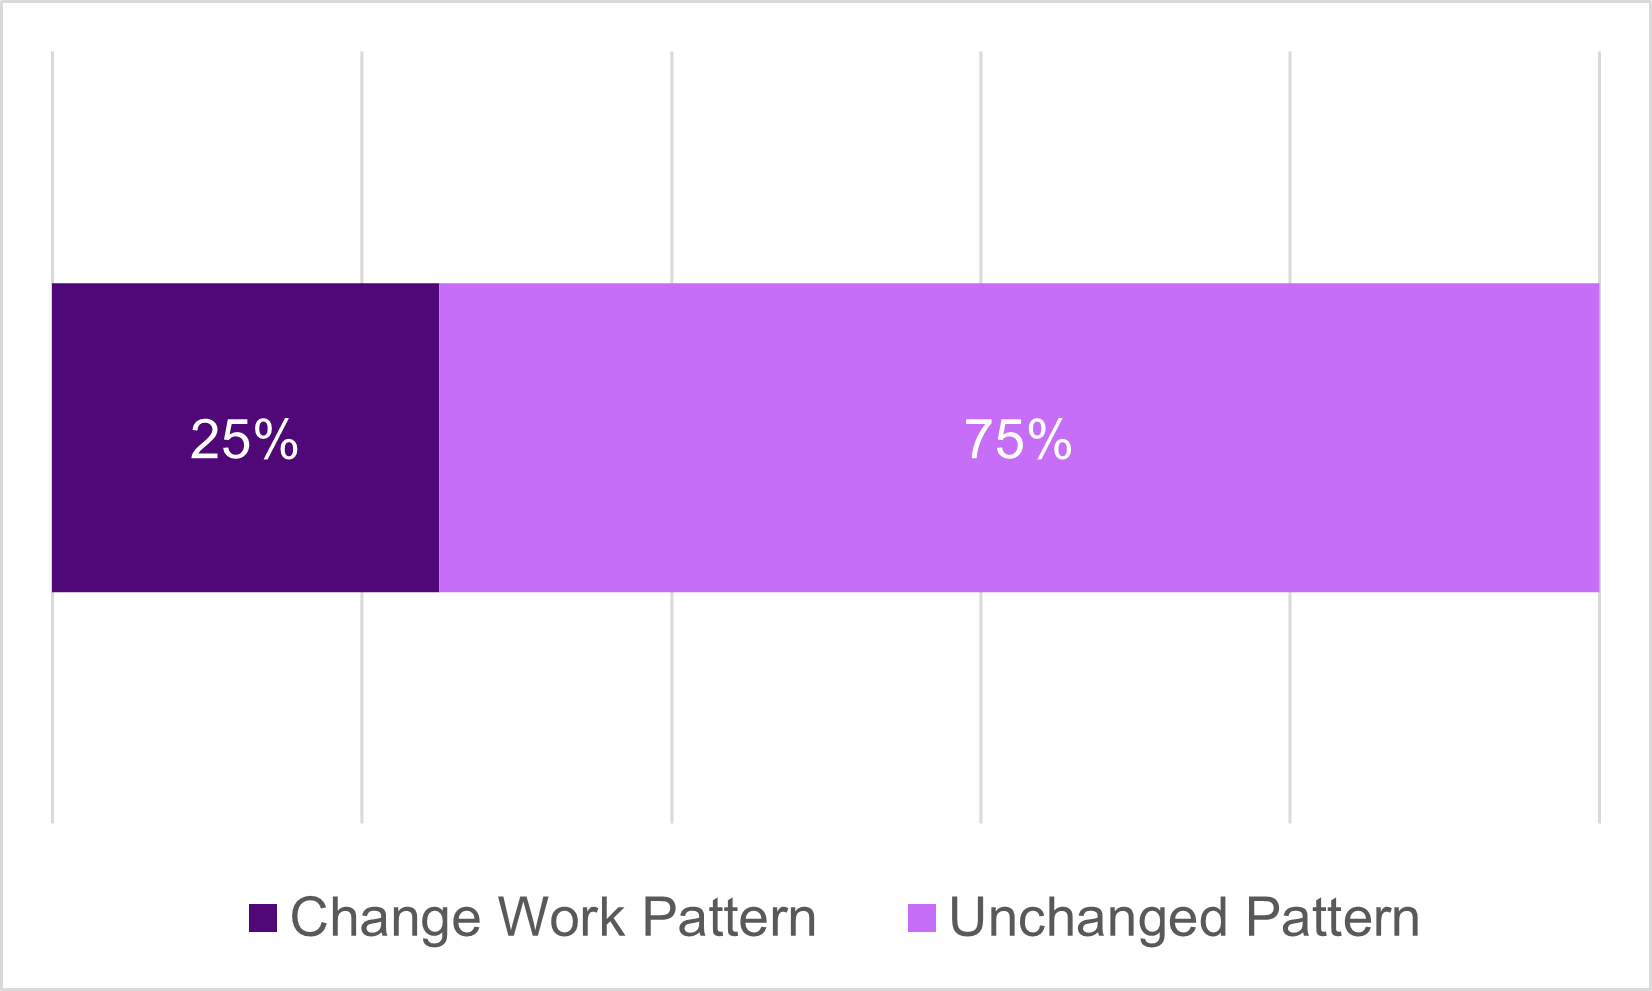
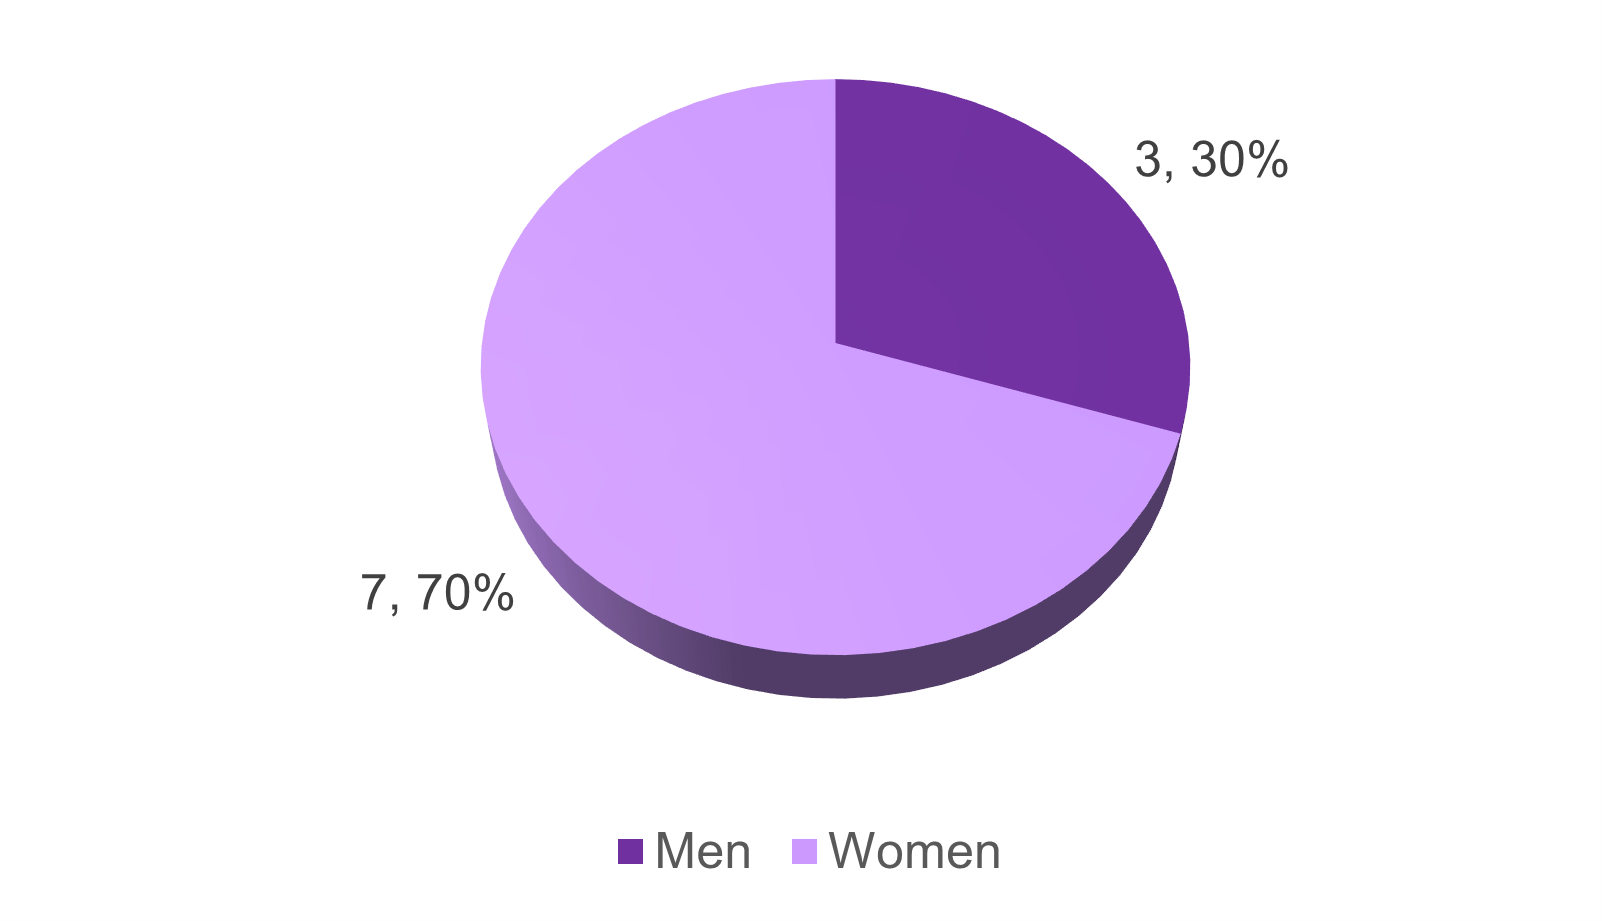
The number of women on maternity leave decreased by 37% this year from 19 to 12. Twelve women returned from maternity leave. Nine made no changes to their working pattern (75%), all of those who changed their working pattern (3 women) reduced their hours.
This is very similar to the previous year, in which eleven women returned three reduced their working hours.
Paternity Leave - see table 1N
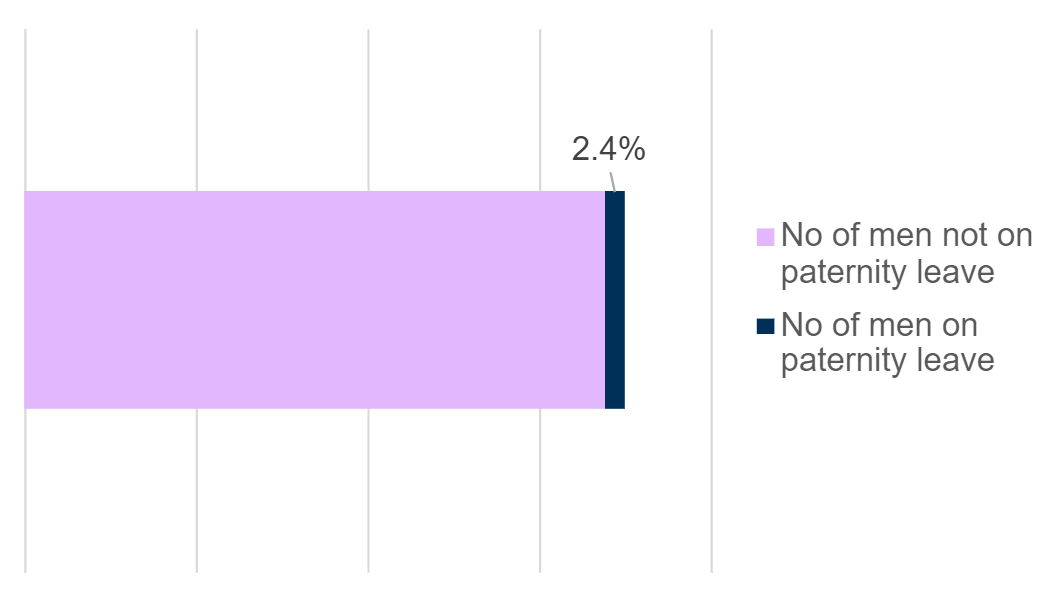
The number of men taking paternity leave decreased by 46% from 11 to 6.
Shared Parental Leave
| Total no. of staff | No. of staff on SPL | %age of staff on SPL | |
|---|---|---|---|
| Women | 344 | 2 | 0.6% |
| Men | 254 | 1 | 0.4% |
Three members of staff took shared parent leave this year. In the previous year there were no members of staff using SPL.
Family Care Leave
| No. of staff | No. of staff on FCL | %age of staff on FCL | |
|---|---|---|---|
| Women | 344 | 5 | 1.5% |
| Men | 254 | 1 | 0.4% |
Family Care Leave was taken by 6 members of staff this year and increase of 100% on the previous year (3 women and no men).
How do we compare? - see table 1O
For comparative purposes we have used the Scottish Government Equality Evidence Finder to use the most recently available data.
We include the following White groups as minority ethnic groups -; Polish, Gypsy / Traveller, Roma and Showman / Showwoman.
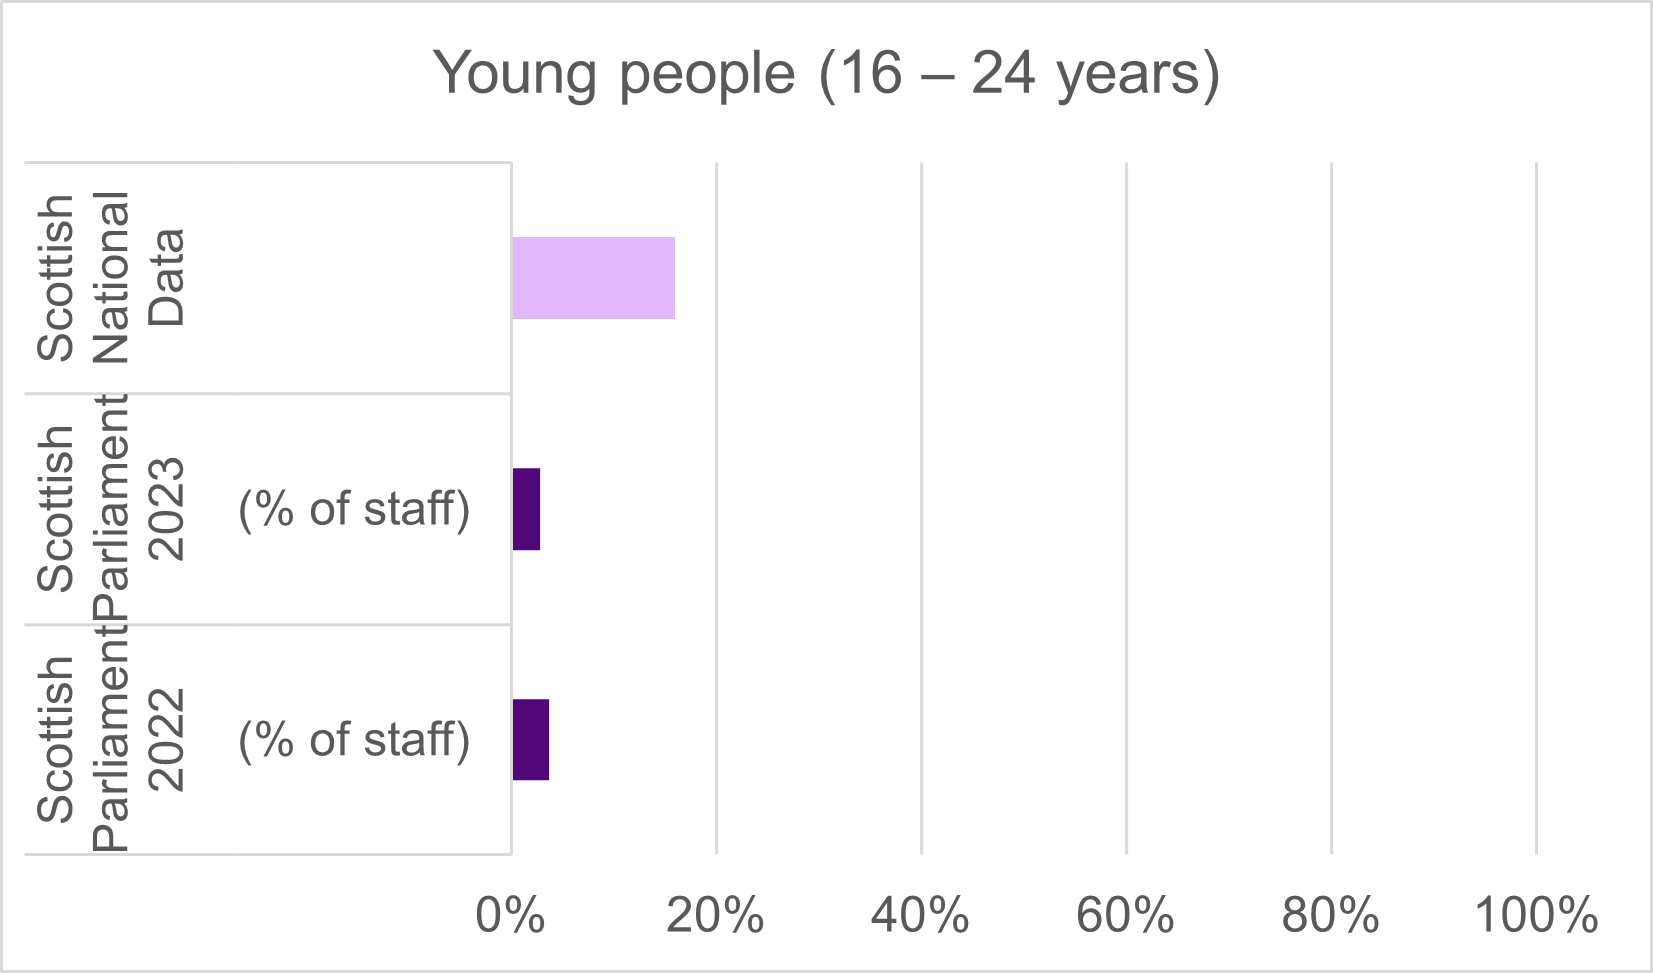
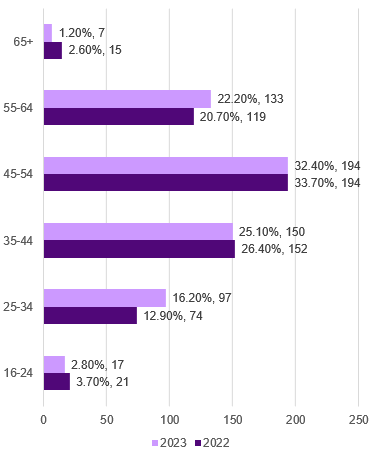
Age - the median age fell back to 46 years this year (was 47 years). The age group with the greatest percentage change was the 65+ group. This change was mostly related to staff changes in a specific business area. With a decrease of 53.3%. The 25-34 age group had the greatest percentage increase (31.1%) from the previous year.
Young people - the number of young people in our staff group decreased to 17 from 21 the previous year.
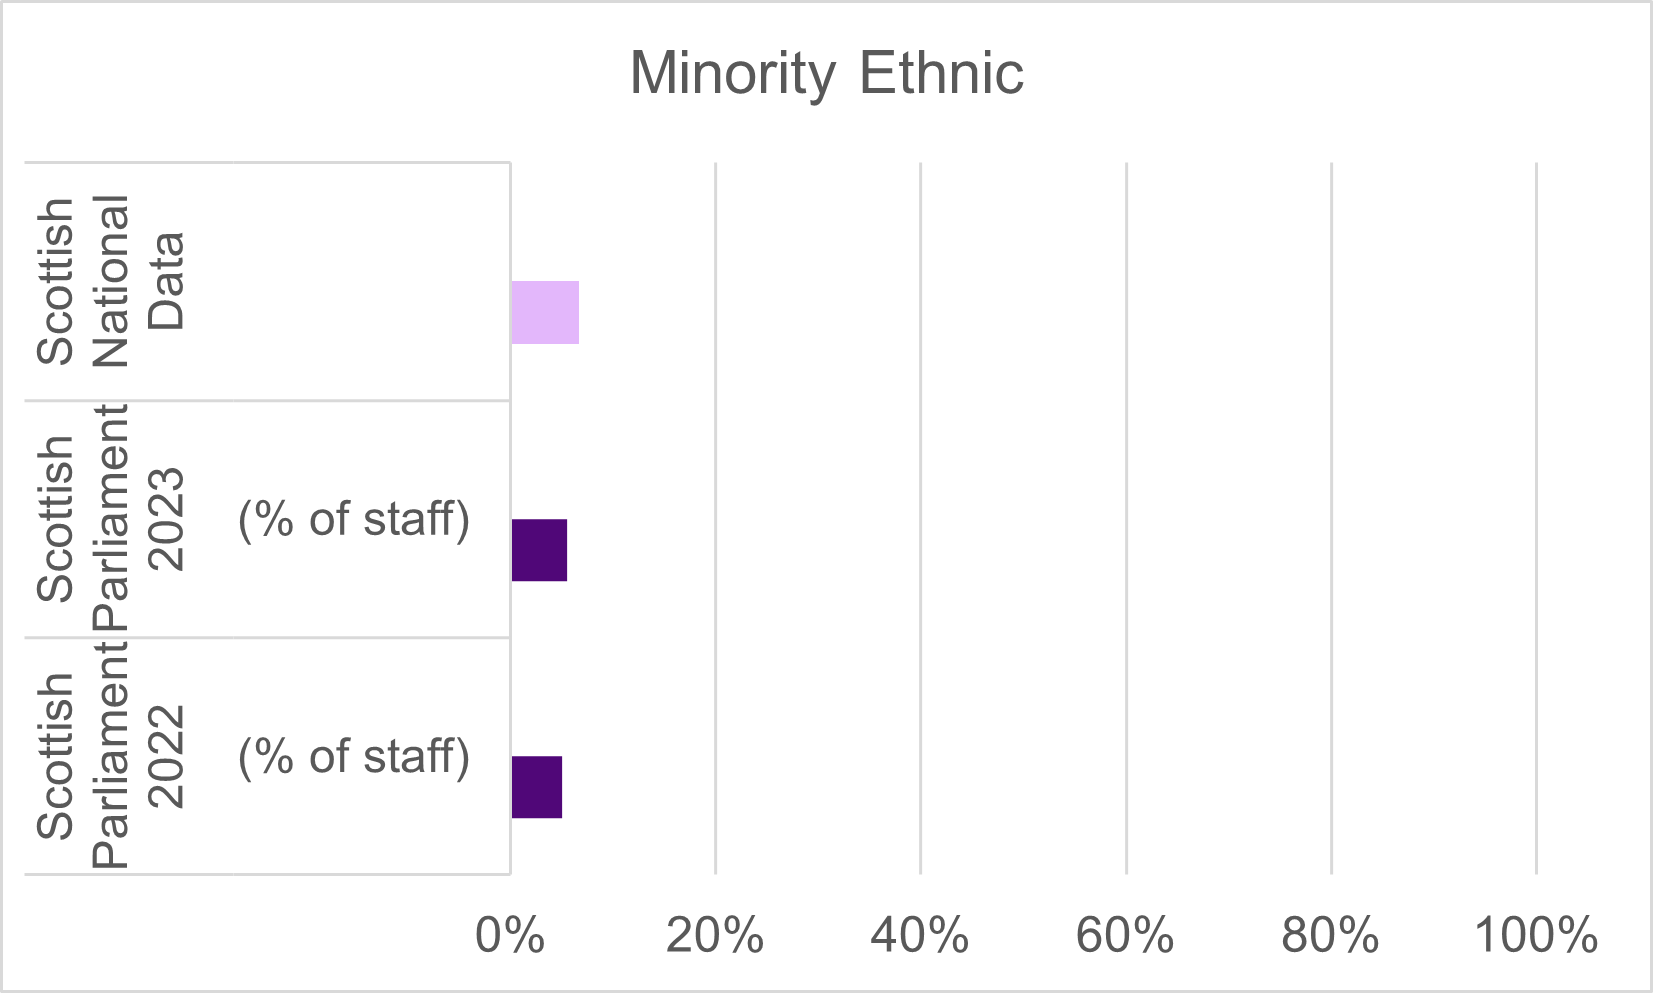
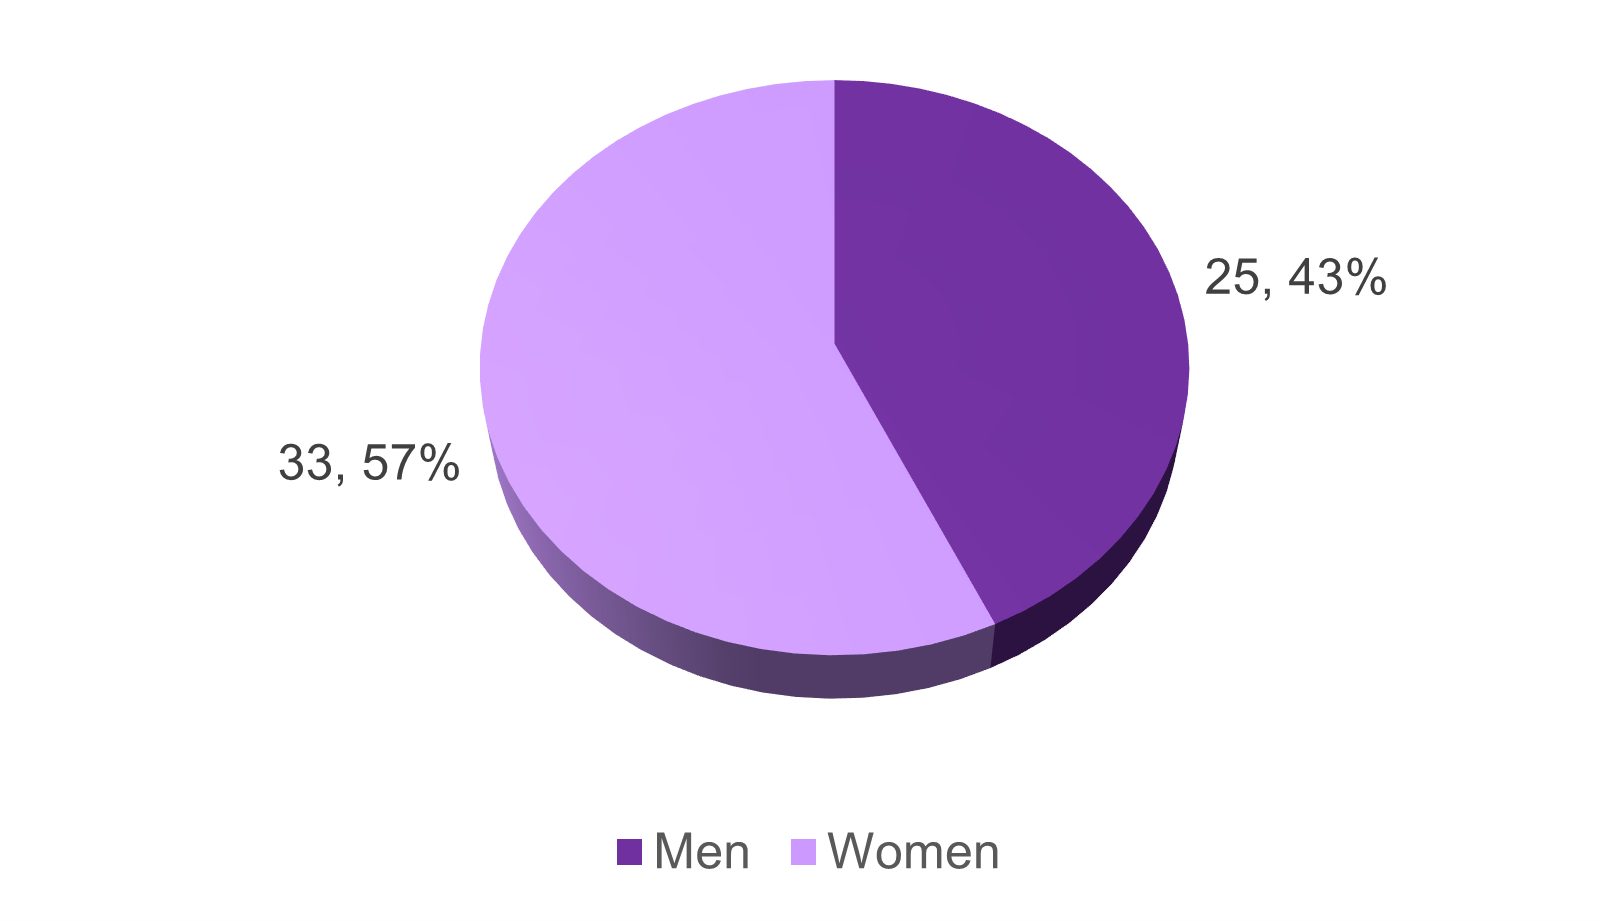
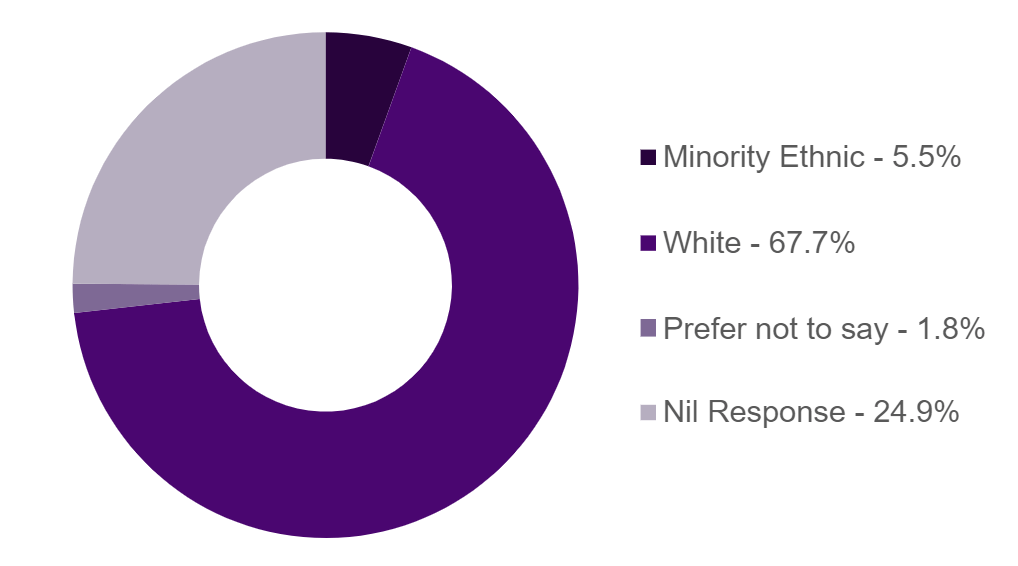
Minority Ethnic - the number of people describing themselves as ME increased from 29 to 33. Increasing the representation in the staff group by 0.5% to 5.5%.
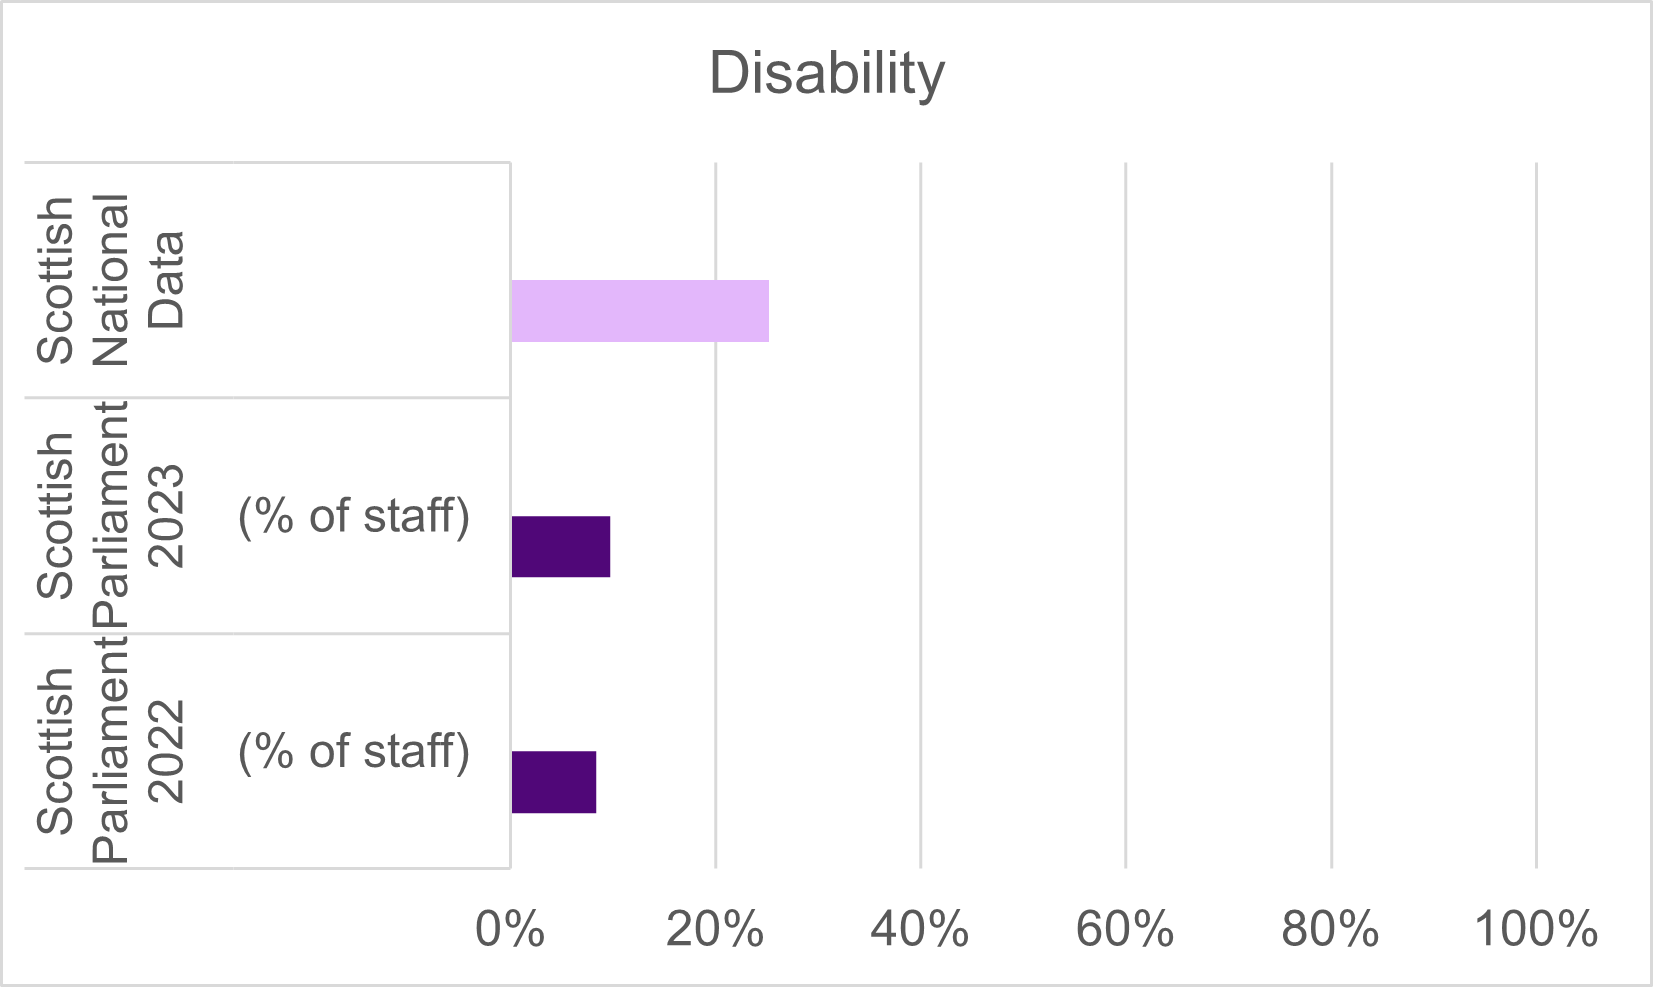
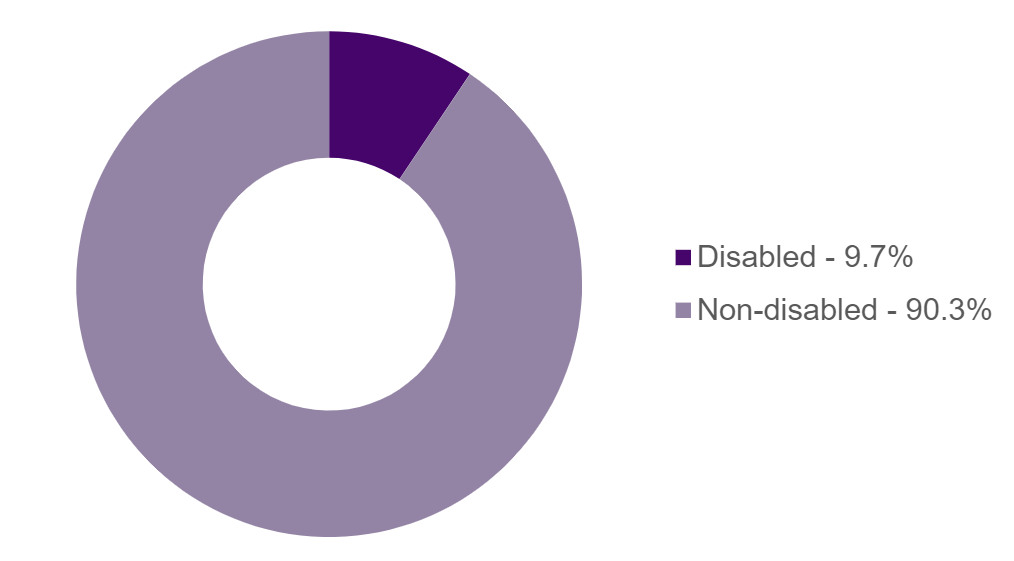
Disability - 56 people declared a disability this year (previously 48). The representation in the staff group increased by 1.4% to 9.7%.
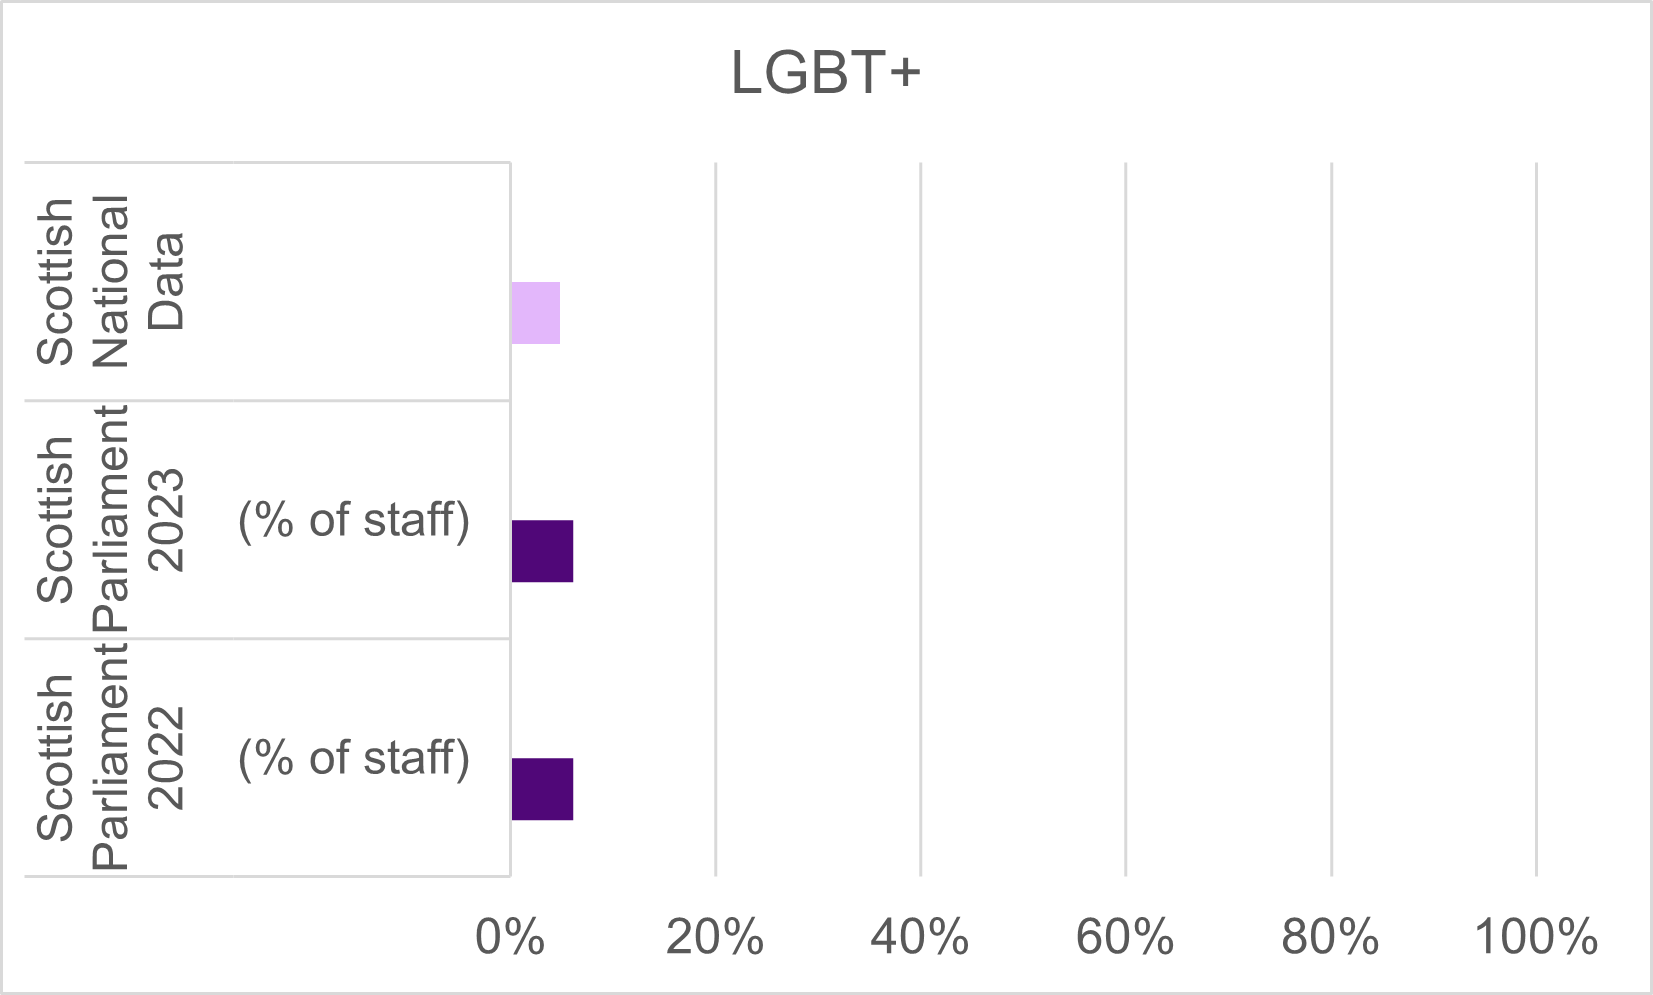
LGBT+ - The representation of LGBT+ people in the staff group has slightly increased this year from 6.1% to 6.7%.
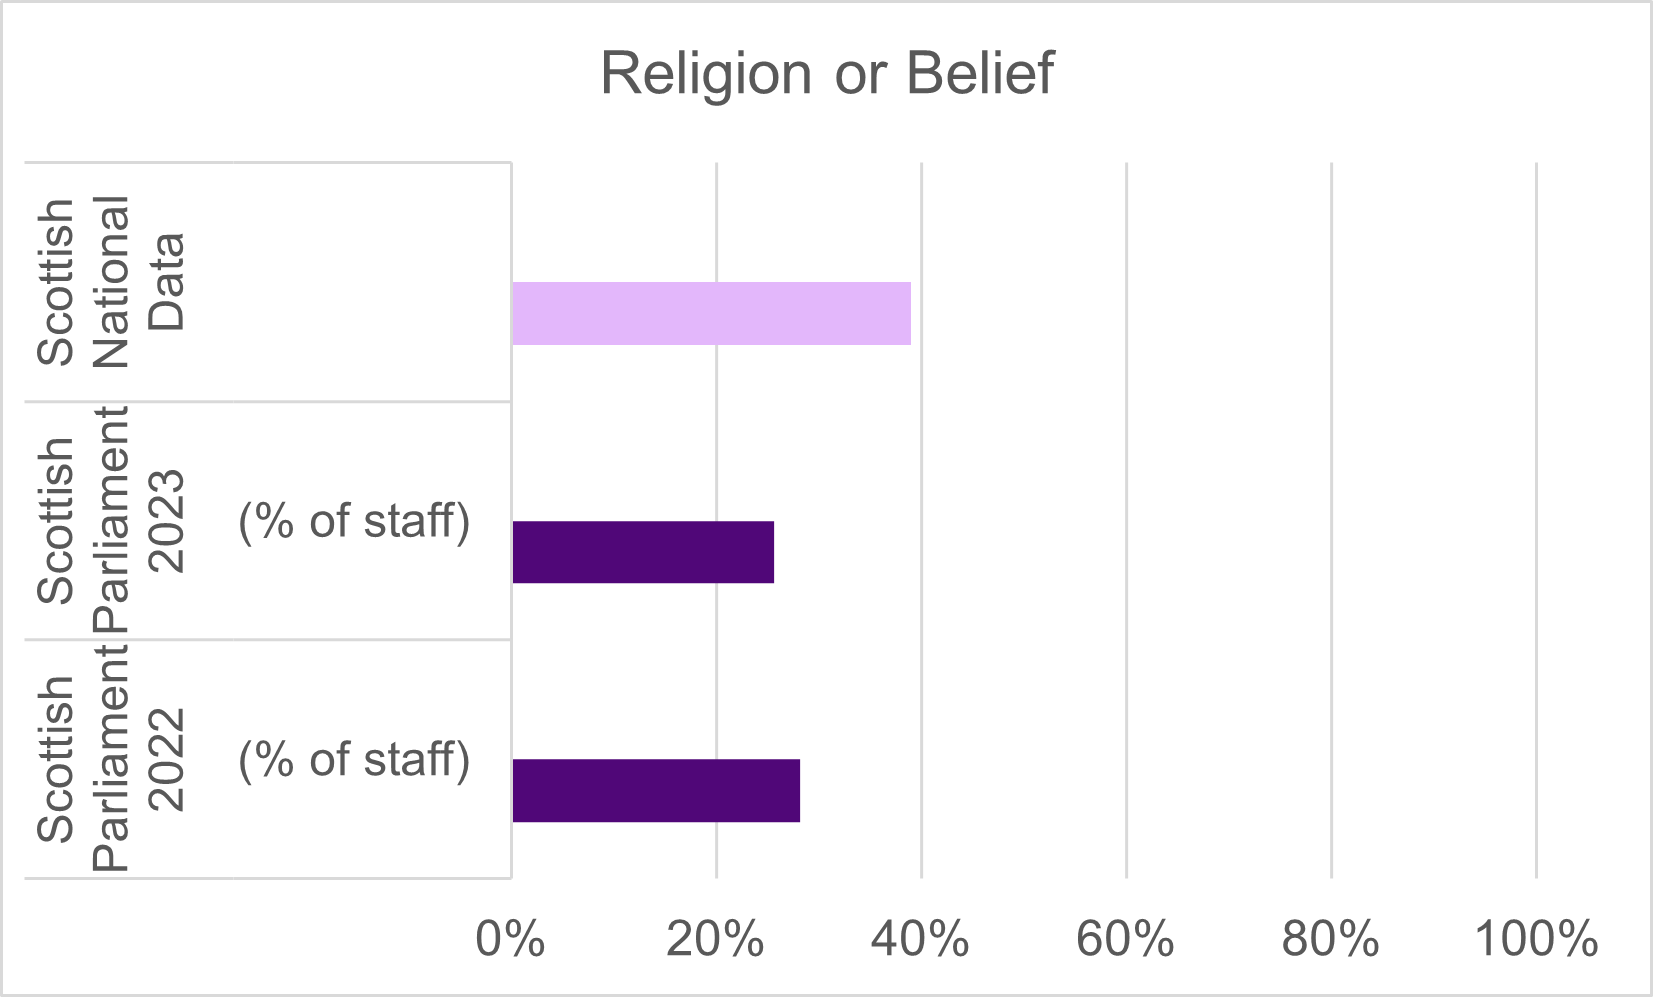
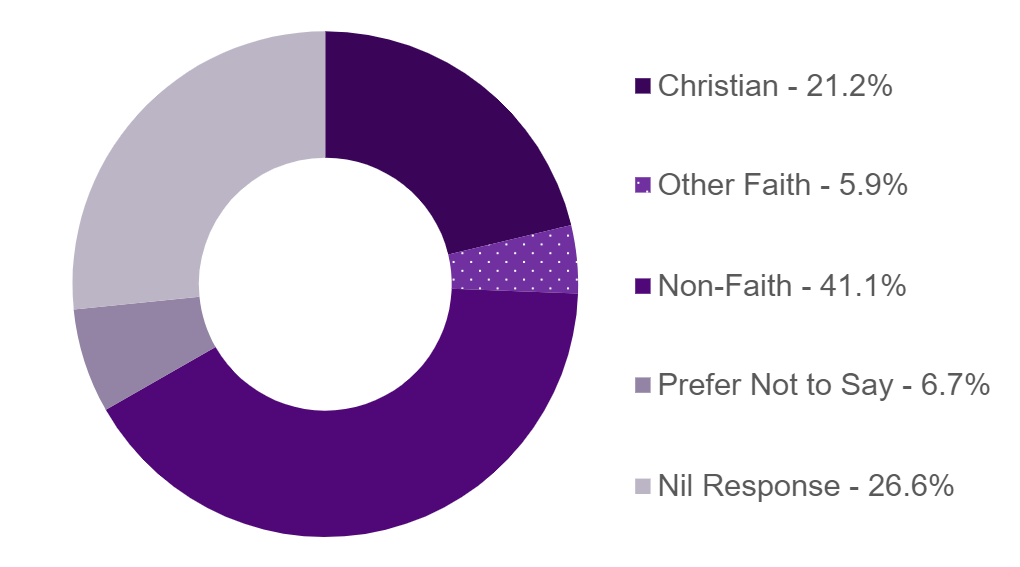
Religion or Belief - The proportion of staff declaring a religion or belief decreased by 2.6% from the previous year (28.2%). Whilst there was a slight reduction in the number of people declaring a religion (from 162 to 153), it is the Nil response category that saw the greatest change (111 to 159).
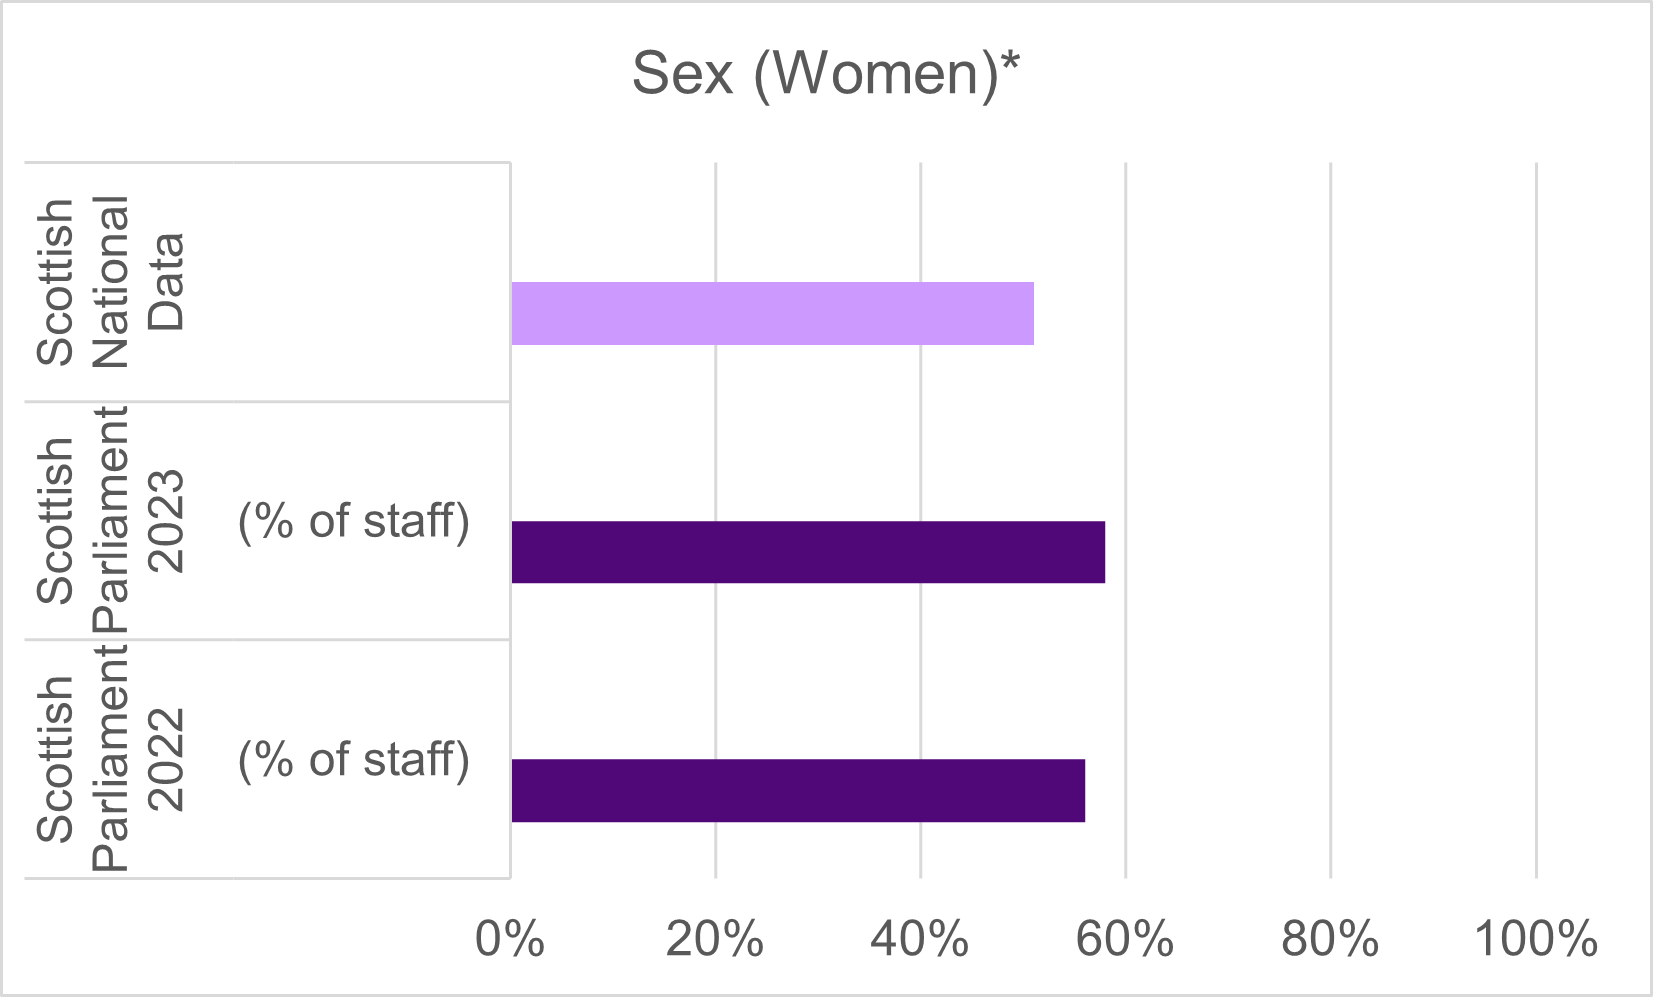
Sex (women) - the proportion of women increased by 2% on the previous year. When compared to population data this is an over-representation of 7.2%.
Recruiting a diverse workforce
Recruiting a diverse workforce
Data tables are available here - see sheet 2 Recruiting a Diverse Wkfce (42KB Excel document)
It is our aim to have a staff group that is representative of the people of Scotland. To help us in attracting groups that are under-represented in our workforce we will use positive action. We analyse our recruitment data for the effectiveness of the actions we have taken and to understand where there may be barriers.
During the period, there were 107 appointments made. In the previous year there were 62 appointments. This is an increase of 73%. Overall, there were 1370 applications for posts during the period. This is a 180% increase from the previous reporting year (490 applications). The percentage increase in the number of applications (180%) compared to the percentage increase in the number of appointments (73%) is accompanied with a decrease in success rate at appointment for every characteristic.
In the reporting year there was a 22% increase (from 34% to 56%) in the proportion of roles advertised externally, to which internal and external applicants can apply.
Sex and gender identification - see table 2A
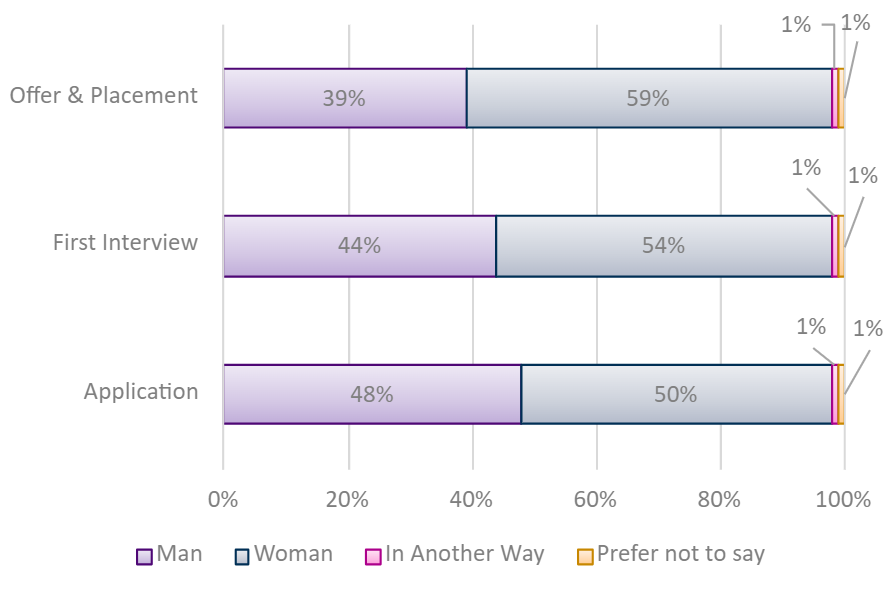
Applications from women were again 50% of all applications this year and 1% were from people who described their gender In Another Way to Man or Woman. The success rate at appointment for women was 9% compared to 17% last year. For men the success rate was 6%, compared to 8% last year.
Ethnicity - see table 2B
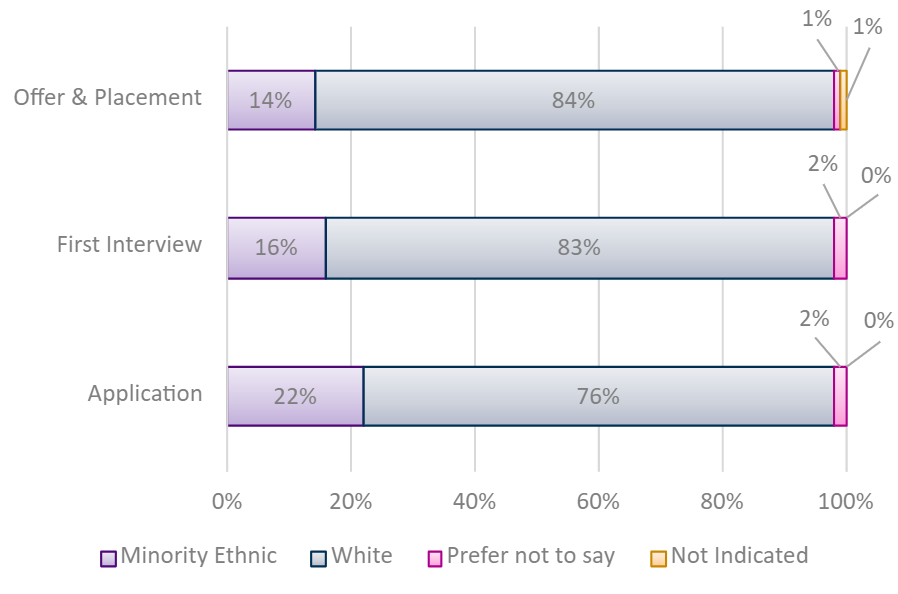
The proportion of applications from Minority Ethnic (ME) candidates increased again this year to 22%, a 4% increase from the previous year. The proportion of all appointments to ME candidates increased to 14% compared to 11% in the previous year. The success rate at appointment for ME candidates was lower this year at 5% compared to 8% previously. The equivalent rate for White candidates was 9%, this was 14% in 2022. The success rate for candidates who preferred not to declare their ethnicity was 33%.
Disability - see table 2C
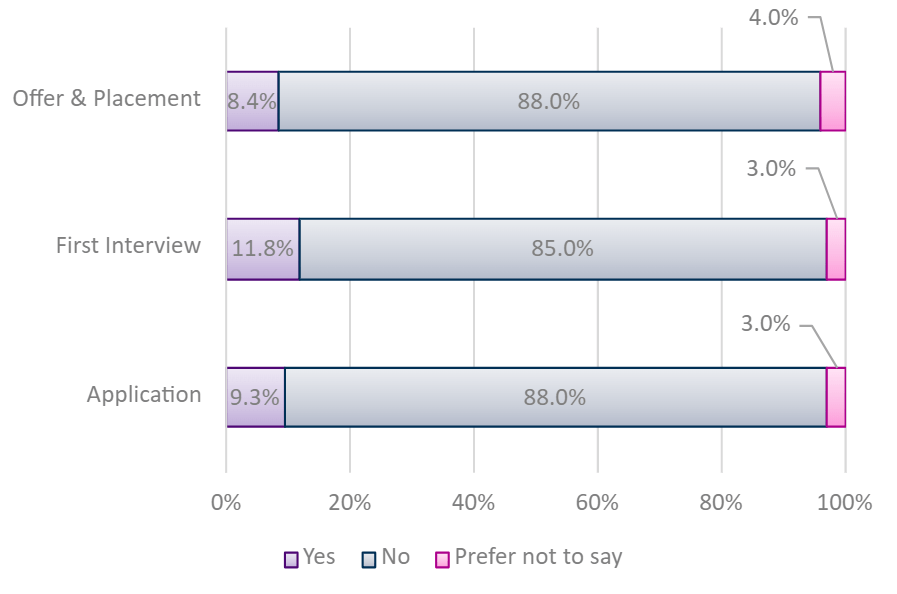
The proportion of applications from disabled candidates decreased to 9.3% from 12% in the previous year. The success rate at appointment was 7% compared to 8% for non-disabled candidates. In the previous year the difference in success rate between disabled candidates and non-disabled candidates was also 1%
LGB+ - see table 2D
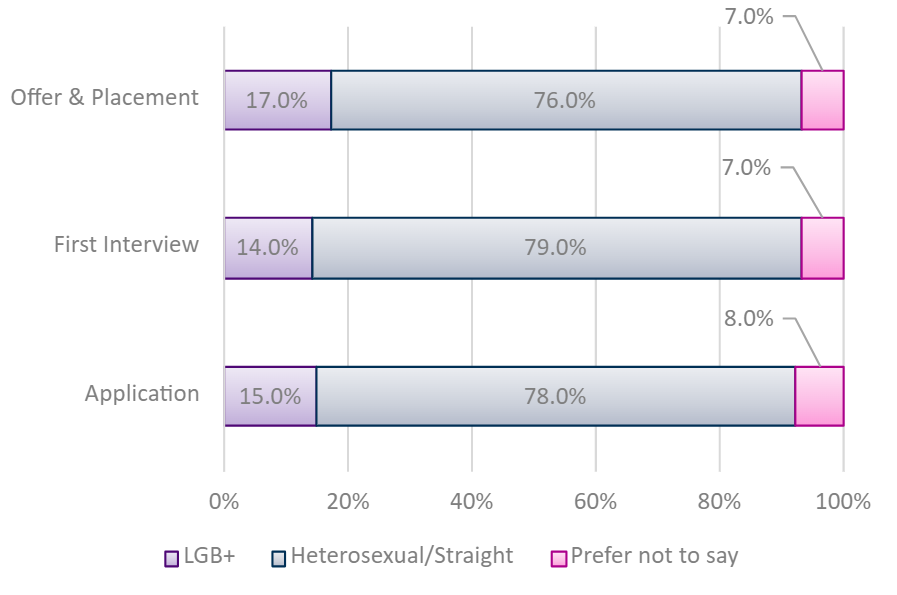
Applications from LGB+ people increased on the previous year from 13% to 15% of all applications. The success rate at appointment for LGB+ candidates was 9% compared to 8% for Heterosexual candidates.
Diversity pay gaps
Diversity pay gaps
This year, we have reported on the following pay gaps information:
- gender
- ethnicity
- disability
- LGB+ (sexual orientation)
Reporting on our diversity pay gaps is important to us in allowing us to identify where we need to improve and to plan accordingly.
Measuring the Ethnicity, Disability and LGB+ pay gaps is limited by the declaration rates from the staff group.
Method of Calculation
For the measures in this report the median and mean hourly rates of pay were calculated. The median pay is the middle point of the population and the mean pay, the arithmetic average of a population.
Quartiles
This measures the proportion of different groups in each quartile when divided into four groups ordered from lowest to highest pay. This demonstrates whether there is an overrepresentation of one group within lower or higher paid jobs.
Impact of pay reform review
In reviewing comparisons with prior years, consideration should be given to the pay reform process that has occurred during this reporting year (implemented from 1 February 2023). As a result of the strategic approach taken in 2022-23 to ensure retainment of talent and ongoing recruitment success, the agreed pay offer included enhancements that reformed the pay structure as well as delivering the usual pay award. We redesigned our pay structure and reviewed our job classification framework to remove possible systemic barriers and pay gaps.
The agreed pay reform delivered revisions to the pay structure, as follows:
- reducing the number of years it takes colleagues to reach the top of their grade
- increasing starting salaries to ensure reward on promotion
- ensuring each of the pay increases are of equal value during progression through grade points
- introducing a minimum of 5% between grades
This has resulted in some significant changes to the pay gap results when compared to the previous year.
Our current payscales are available on our website.
Gender Pay Gap
Gender Pay Gap (GPG)
Data tables are available here - see sheet 3 Gender Pay Gap (42KB Excel document)
The Gender Pay Gap is the difference between average hourly earnings (excluding overtime) of men and women as a proportion of average hourly earnings (excluding overtime) of men's earnings.
How do we compare?
The table below provides comparison datasets for UK and Scotland derived from the Office of National Statistics annual survey of hours and earnings (ASHE) median pay gap series.
| UK (2023) | Scotland (2023) | Scottish Public Sector (2023) | Scottish Parliament 2023 | |
|---|---|---|---|---|
| GPG - all staff | 14.3% | 8.7% | 3.7% | 0.0% |
| GPG - full-time staff | 7.7% | 1.7% | -2.6% | 16.1% |
| GPG - part-time staff | -3.3% | -10% |
2.2% | -25.2% |
Annual changes in Median GPG all staff
| 2023 | 2022 | 2021 | 2020 | 2019 |
|---|---|---|---|---|
| 0.0% | 11.20% | 7.60% | 2.40% | 0.90% |
Median and Mean gender pay gap in hourly pay (for all staff) - see table 3C
Gender, grade and working pattern
| Grade | Men F/T | Men P/T | Women F/T | Women P/T |
|---|---|---|---|---|
| 1 | 0 | 0 | 0 | 0 |
| 2 | 66 | 6 | 72 | 19 |
| 3 | 34 | 11 |
49 | 21 |
| 4 | 61 | 8 | 55 | 26 |
| 5 | 41 |
2 | 44 | 13 |
| 6 | 16 | 3 |
16 | 3 |
| 7 and above | 3 | 0 | 6 | 0 |
| Solicitors Office |
3 |
0 | 13 | 7 |
| 224 | 30 | 255 | 89 |
Gross pay for full time staff by gender - see table 3D
Gross pay for part-time staff by gender - see table 3E
The gender pay difference for all full-time staff based on gross hourly rate is £4.20, down from £5.09 in the prior year. This equates to a 16.1% pay gap, which has decreased from 21.7% in 2022, in line with the overall trend of reduction in pay gap. For full-time staff the median pay scale point for men is now top of grade 4 on the revised 2023 pay scale. This is in line with the result in prior year, where full-time male staff sat at the top of the original pay scale. For women working full time contracts the median point now sits at the bottom of the grade 4 scale points (revised scale), up from the top of grade 3 in prior year.
The gender pay gap for men and women in part-time employment has further reduced from -34.2% in 2021 and -29.2% last year to -25.2% in 2023, meaning the median pay for part time women remains higher than that of part time men. Thus, though the pay reform has had an effect on this rate, there is continued stabilisation of the gap from 2021 trend when there was a significant change from the previous GPG (2020) of -1.3%.
The median spine point for men is now the top of Grade 3 (revised scale) which has increased from mid-point of Grade 3 in 2022. In contrast women’s median spine point for part-time staff has further increased to the top of Grade 4 under the revised salary scale.
Median and Mean exceptional contribution award (ECA) pay gap - see table 3F
Proportion of men and women receiving an exceptional contribution award (ECA) payment
| Sex | Staff receiving ECA | % of ECA | % of men/women | % all staff | Total Staff |
|---|---|---|---|---|---|
| Men | 74 | 49.3% | 29.1% | 12.4% | 254 |
| Women | 76 | 50.7% | 22.1% | 12.7% | 344 |
| Total | 150 | 25.1% | 598 |
The SPCB does not have a ‘bonus culture’. The Exceptional Contribution Scheme provides for awards (ECAs) which are cash payments to reward staff for particularly demanding tasks. In this reporting year, there was a relatively significant rise in the provision of ECAs, as a result of the additional work performed in relation to a specific project.
As demonstrated in the table above, and in line with last year, women account for the majority of ECAs, though this year by a much smaller margin. It is also notable, that as a proportion of headcount women are less likely to receive an ECA than men in the staff group. The maximum value exceptional contribution payment was this year made to a man, though the maximum value awarded to a woman did not differ by a significant margin.
The gap in value of ECA (per tables) has seen a minor increase, with the mean rate this year sitting at 3.9% versus the percentage difference for 2022 which was reflected at 1.7%.
Proportion of men and women is each pay quartile - see table 3G
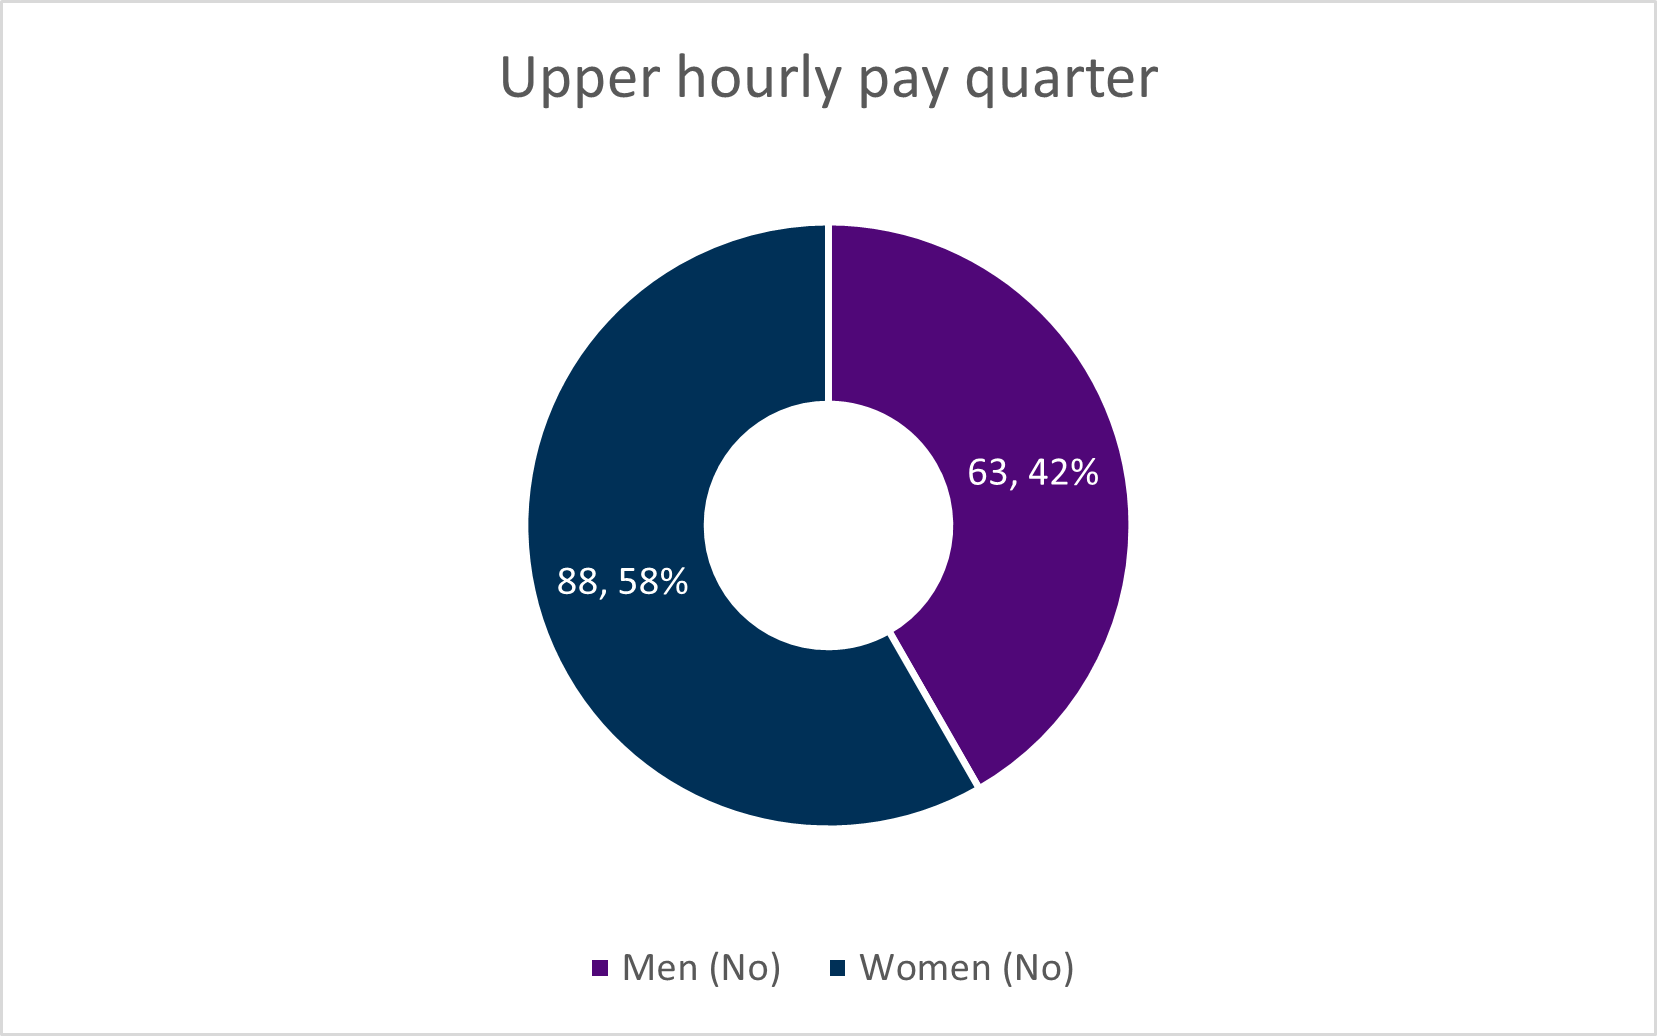
This measures the proportion of men and women in each group when divided into four equal groups ordered from lowest to highest pay. This demonstrates whether there is an overrepresentation of one gender within lower or higher paid jobs.
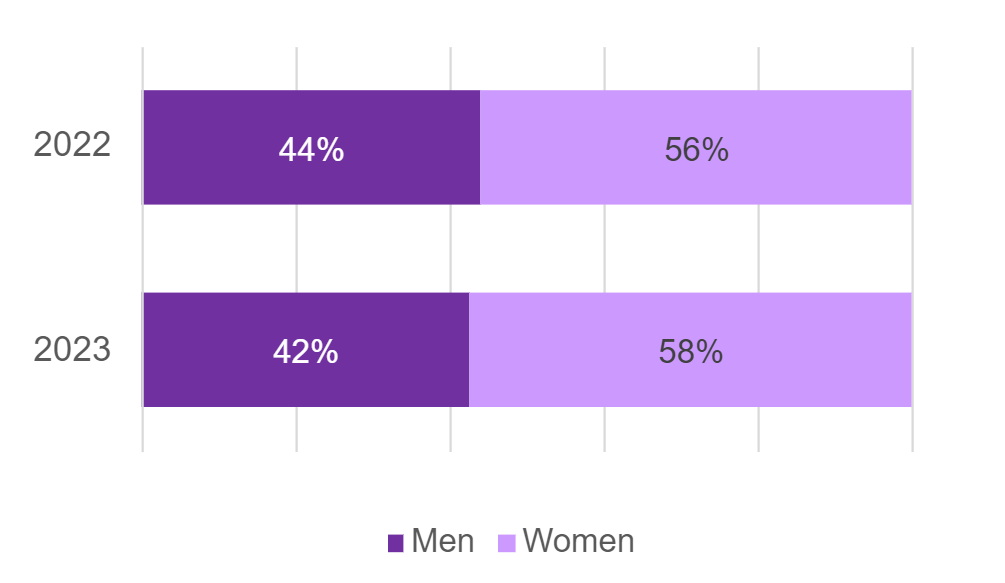
The current SPCB staffing ratio is now 42:58 (M:F). All quartiles are within 5% of this range, however the third quartile which predominantly represents grades 4 and 5 has the biggest variance on the organisational ratio.
Ethnicity Pay Gap
Ethnicity Pay Gap
Data tables are available here - see sheet 4 Ethnicity Pay Gap (42KB Excel document)
Our Ethnicity Pay Gap measures the average difference in pay between all staff who have identified as Minority Ethnic and those who have identified as a White ethnic group. We have placed our staff into two cohorts due to the relatively small dataset size.
We will keep this under review and aim to provide analysis on a more granular level as soon possible in the future.
In reporting on the Ethnicity Pay Gap we have considered UK Government calculating advice and have aligned with this where we have sufficient data to do so.
Annual changes in median Ethnicity Pay Gap
| 2022/23 | 2021/22 | 2020/21 | 2019/20 | 2018/19 |
|---|---|---|---|---|
| 20.1% | 30.1% | 27.6% | 21.3% | 21.6% |
Median and mean ethnicity pay gap in hourly pay (for all staff) - see table 4B
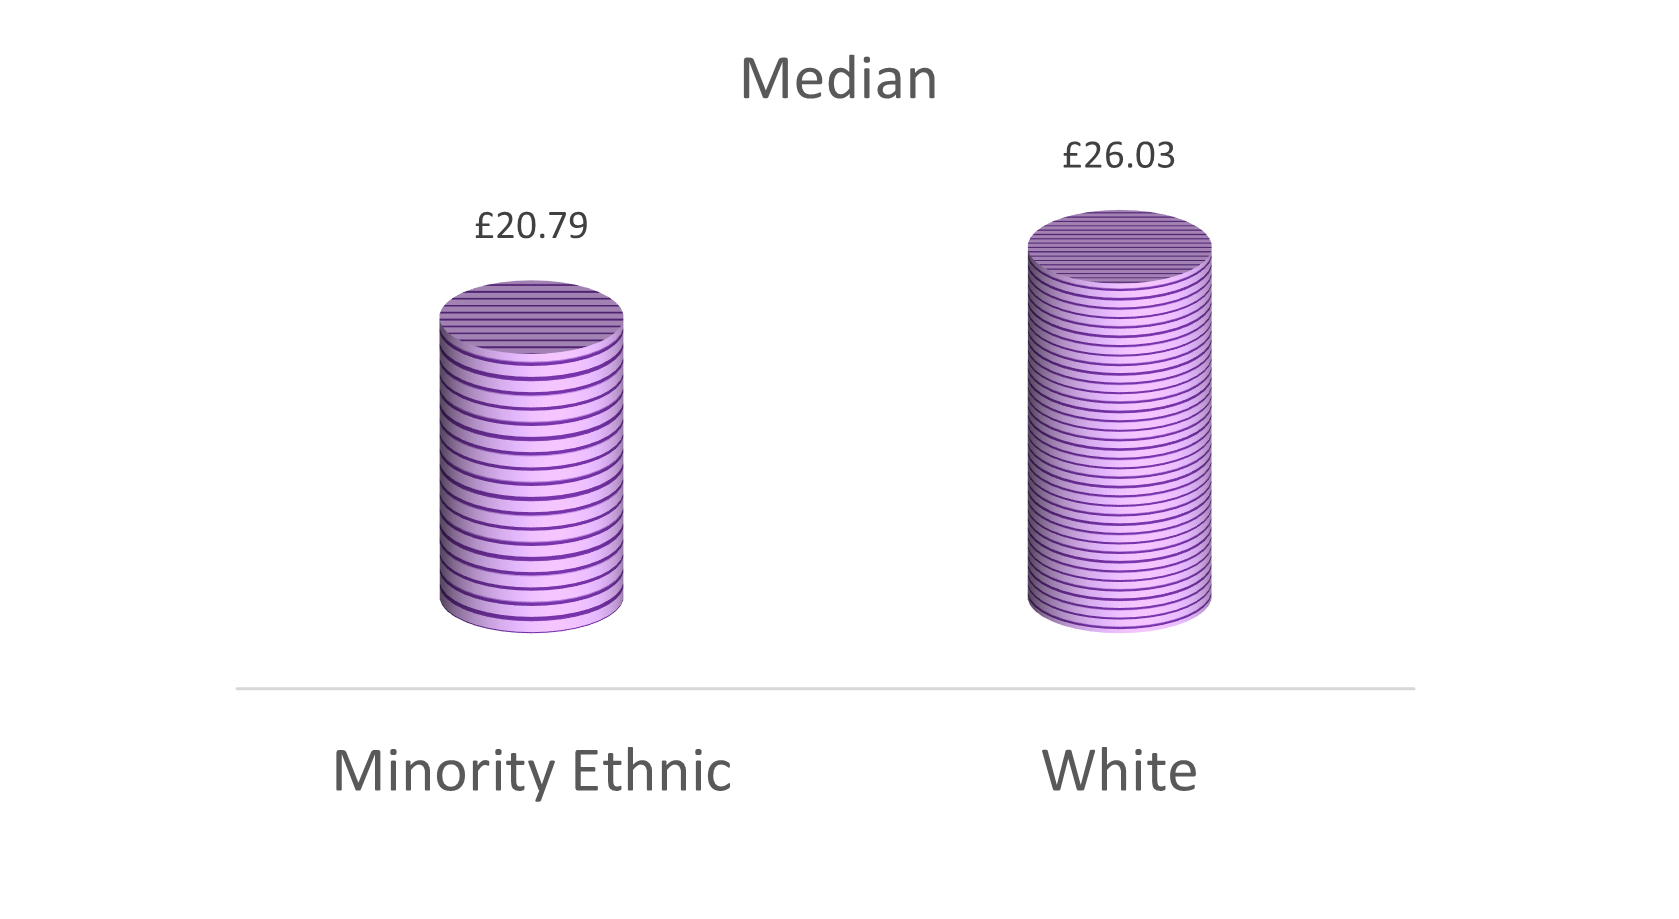
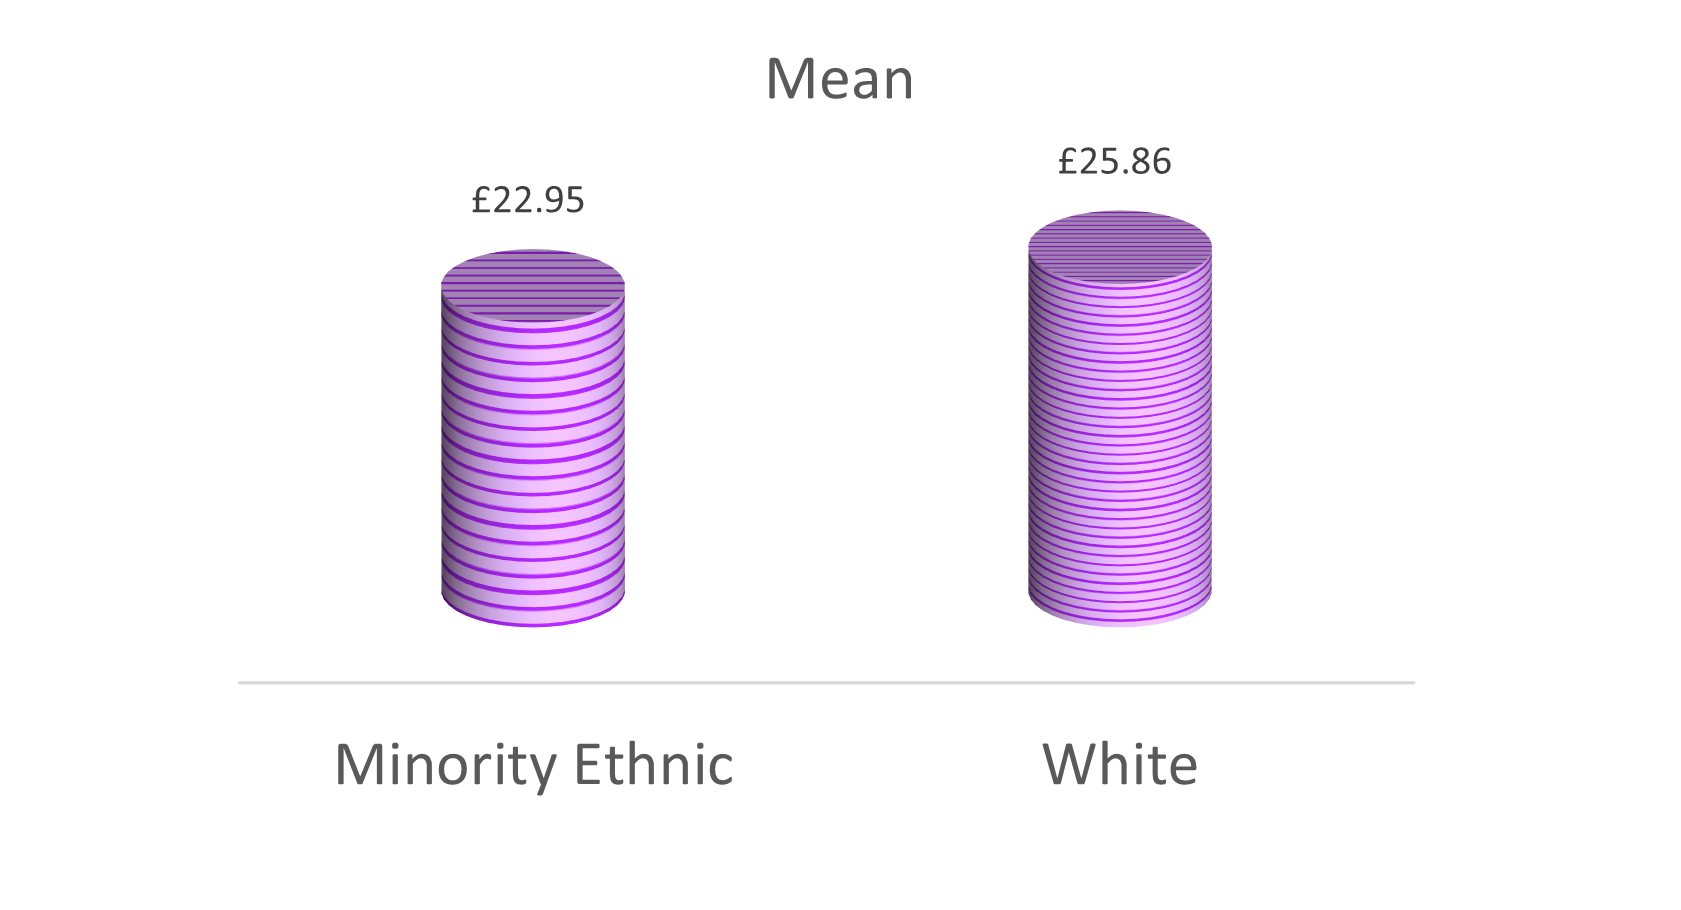
The ethnicity pay gap has decreased from 30.1% in 2022 to 20.1% in 2023. This is the lowest rate since the commencement of ethnicity pay gap reporting in 2019.
The median point for Minority Ethnic employees is mid-way between points 5 and 6 of the Grade 3 scale, which is close to the top of the grade. In 2021 the median point was Grade 2, point 6. The median point for White employee in 2021 was Grade 4, point 11. This year the median point for White employees is at the bottom of Grade 4 on the revised scale.
Ethnicity and pay quartiles - see table 4C
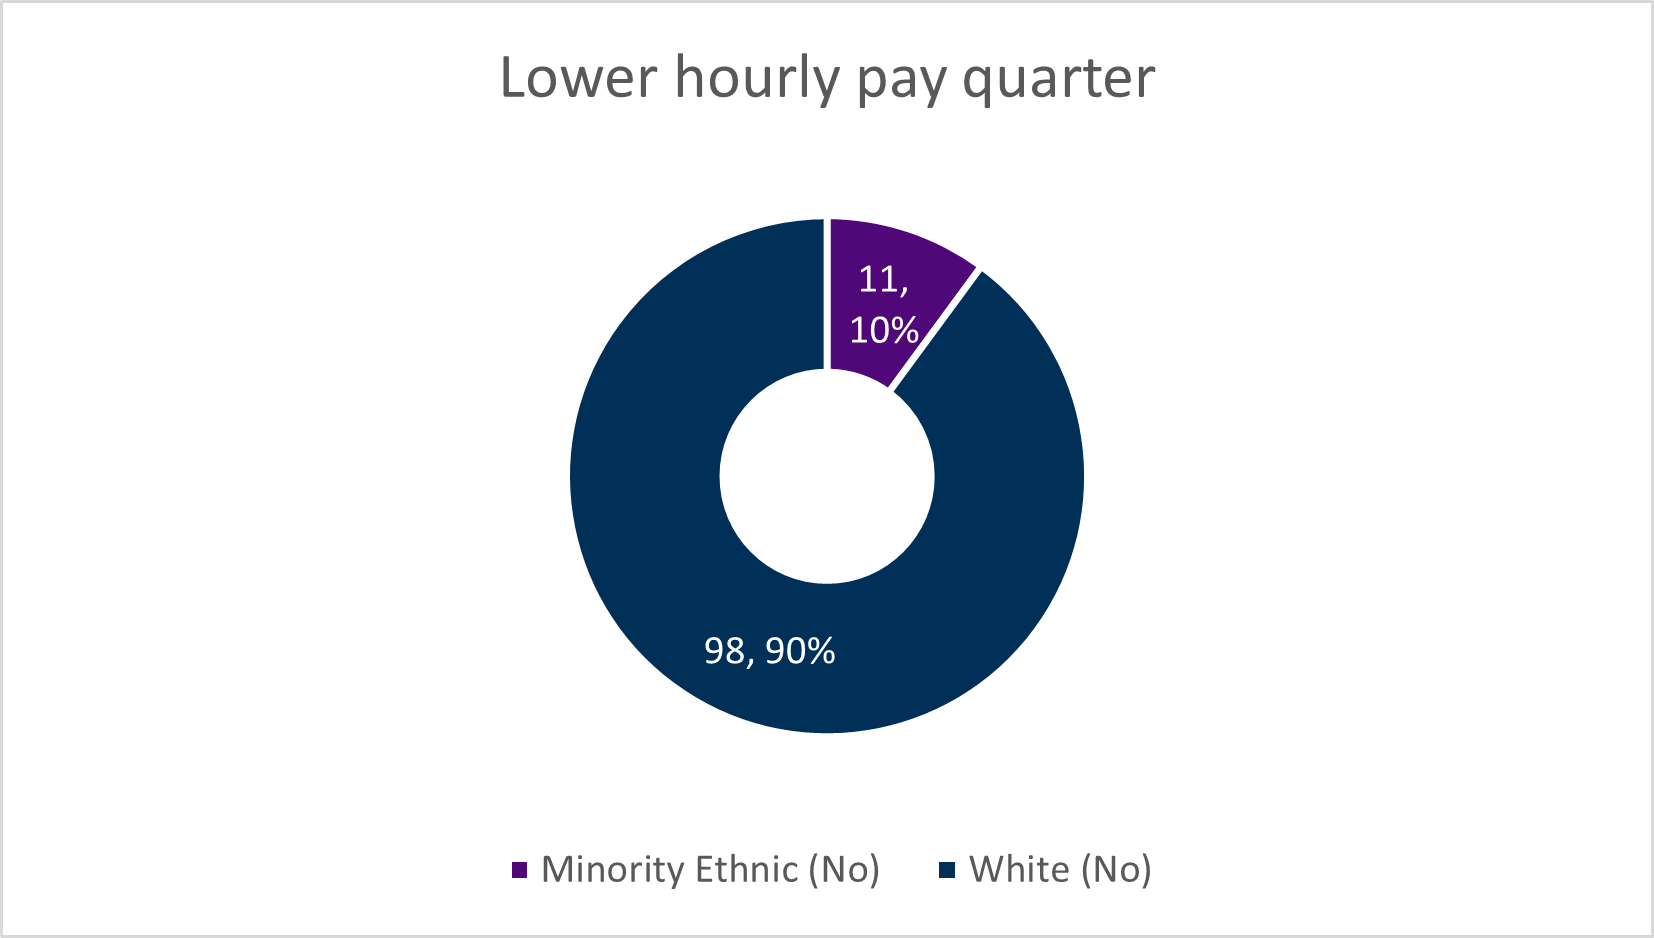
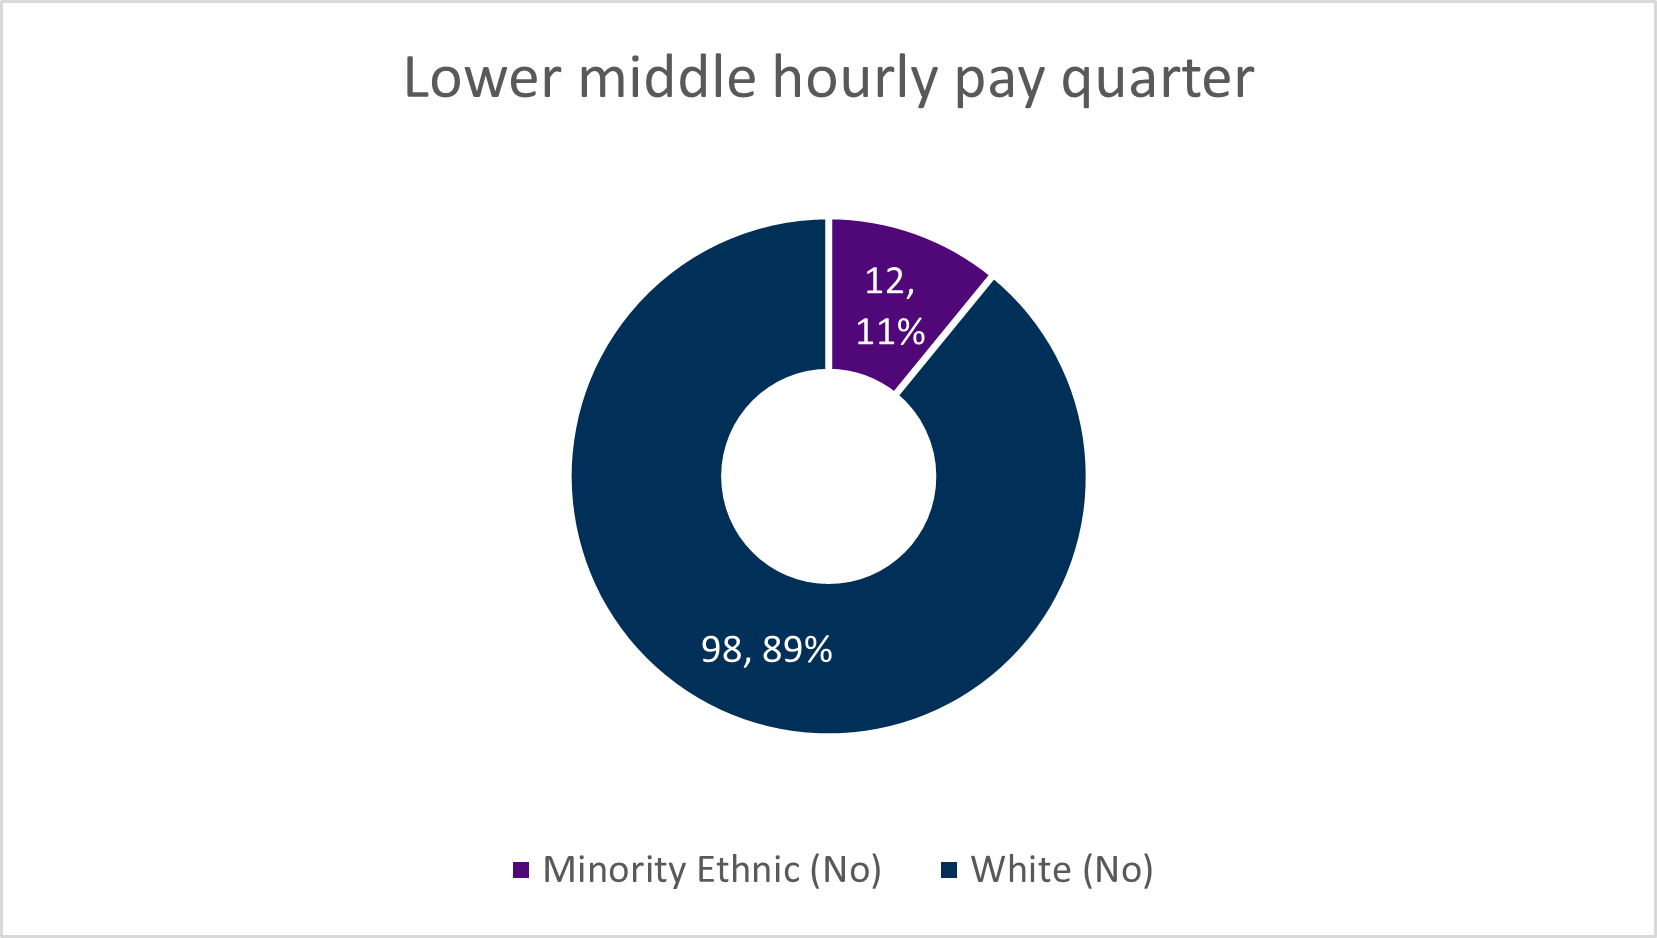
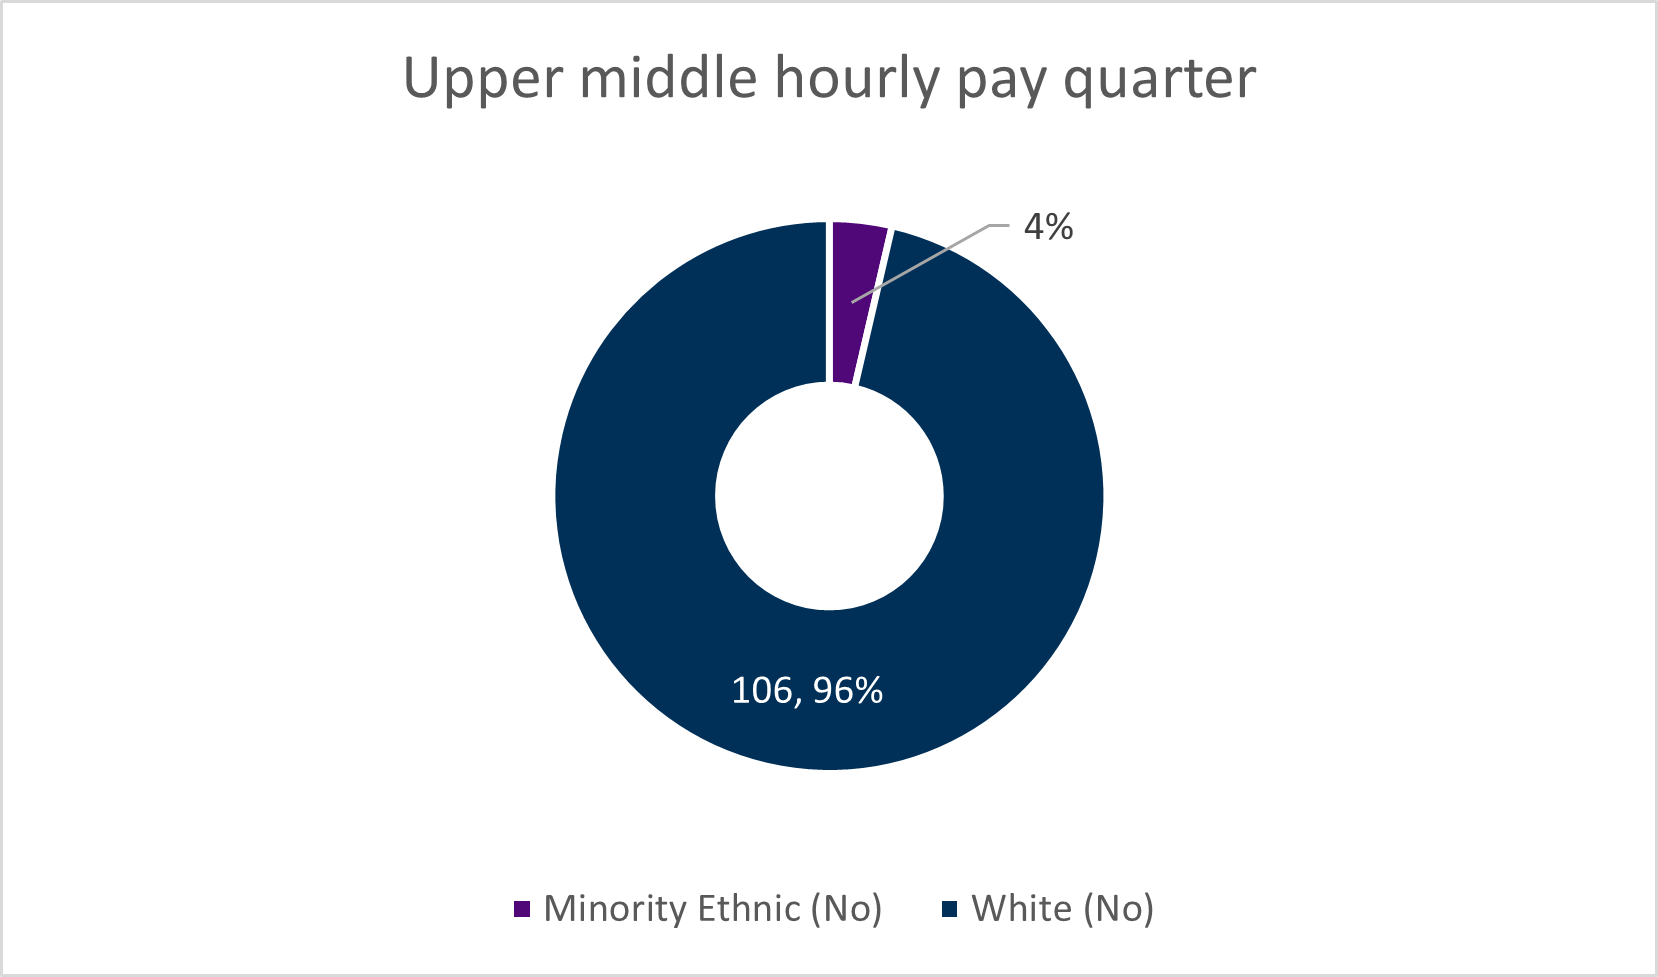
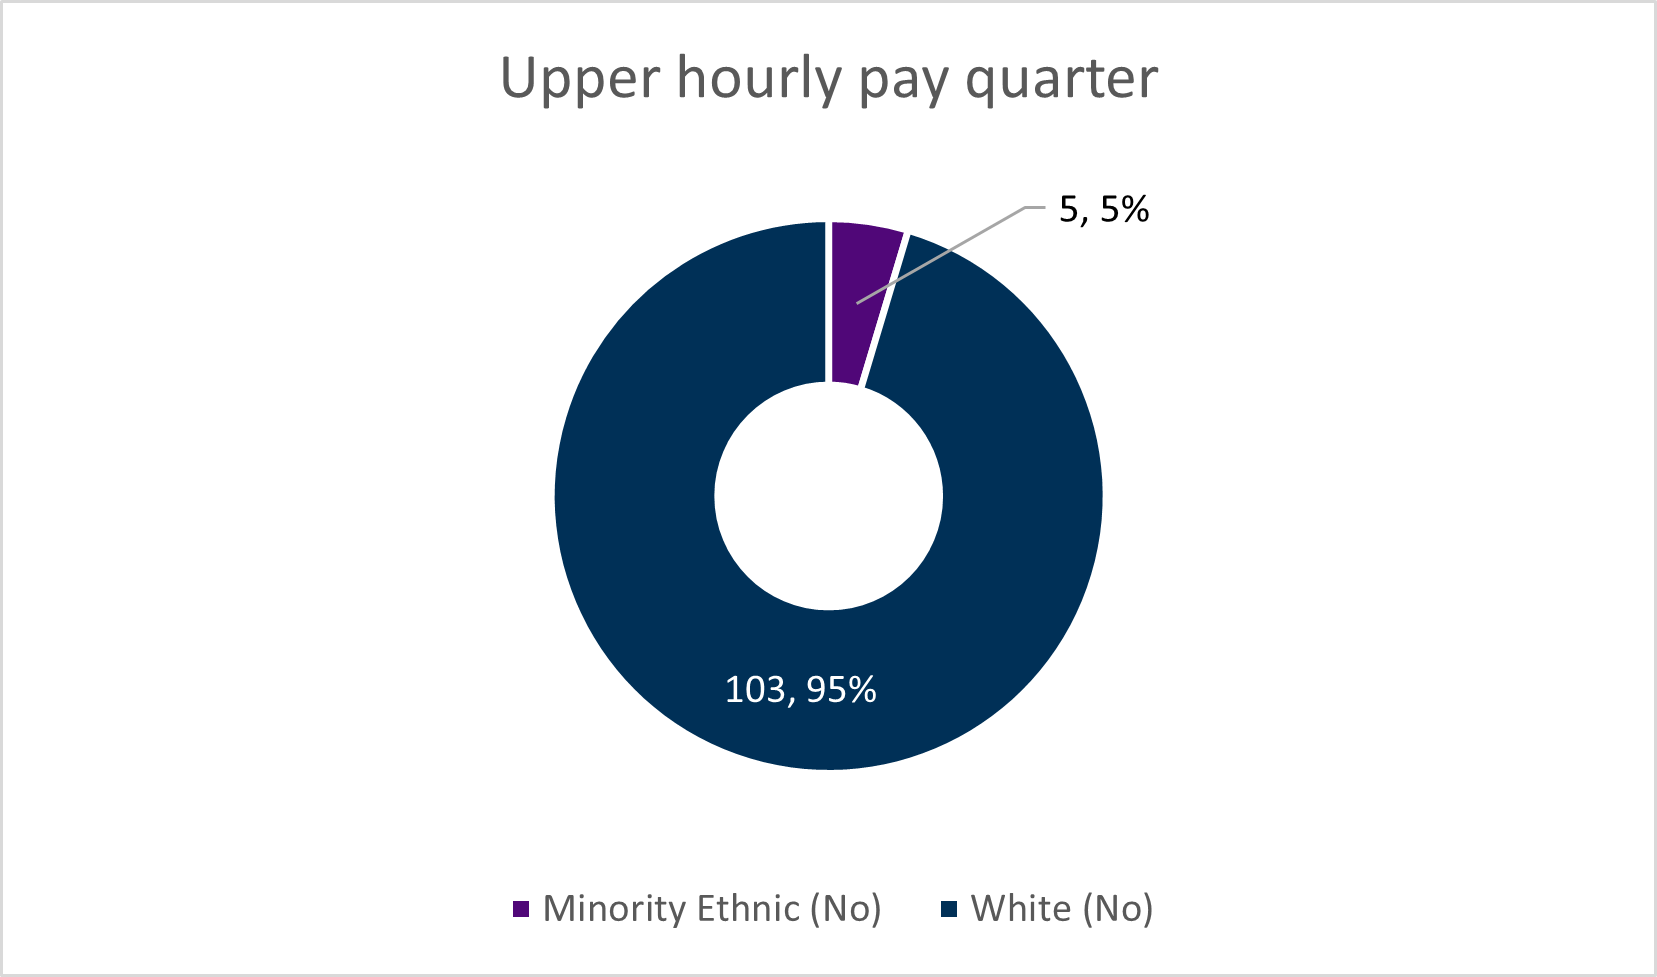
This measures the proportion of staff by ethnicity in each quartile when divided into four groups ordered from lowest to highest pay. This demonstrates whether there is an overrepresentation of one group within lower or higher paid jobs.
Based on the available data, there is a higher representation of Minority Ethnic staff in the lower two quartiles than the organisational ratio, which is consistent with 64% of Minority Ethnic staff being employed in grades 1-3.
Disability Pay Gap
Disability Pay Gap
Data tables are available here - see sheet 5 Disability Pay Gap (42KB Excel document)
The Disability Pay Gap measures the difference in pay between all staff who have declared a disability, and those staff who have not declared a disability.
There is not an agreed format for disability pay gap reporting at this time, we have therefore made the decision to align with some of the measures required for Gender Pay Gap reporting.
For comparison the most recently available disability pay gap information in Scotland reported by the Office for National Statistics (ONS) is 18.5% (ONS, 2021).
Annual changes in Median Disability Pay Gap
| 2022/23 | 2021/22 | 2020/21 | 2019/20 | 2018/19 |
|---|---|---|---|---|
| 4.8% | 13.4% | 7.6% | 2.4% | 0.9% |
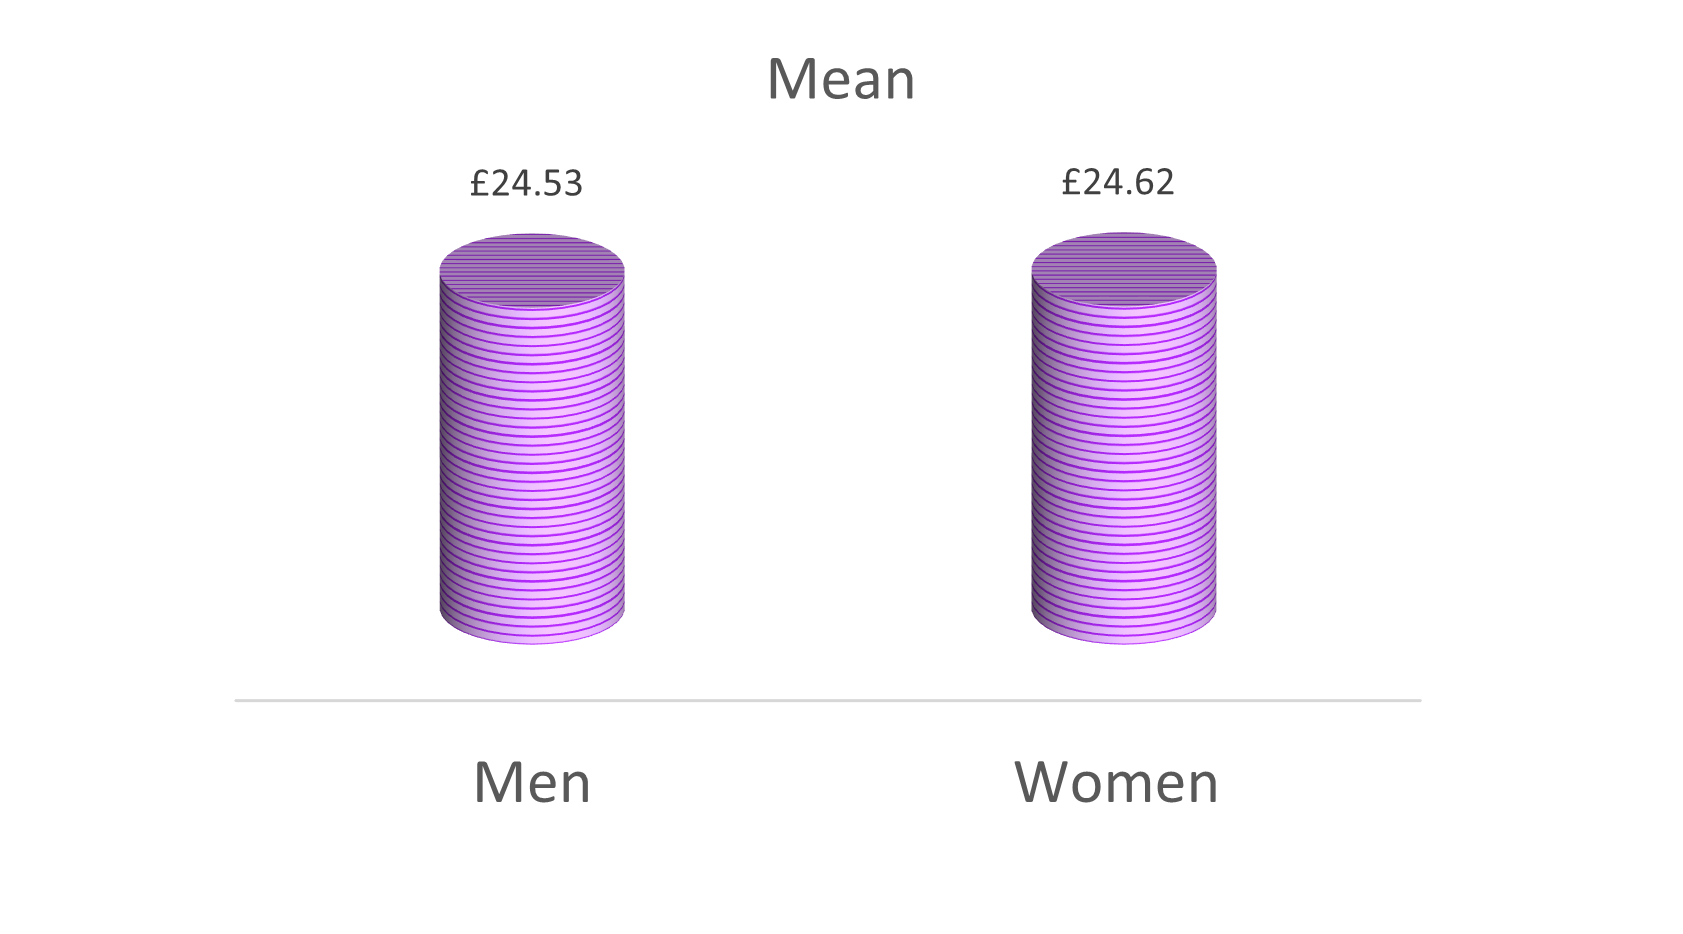
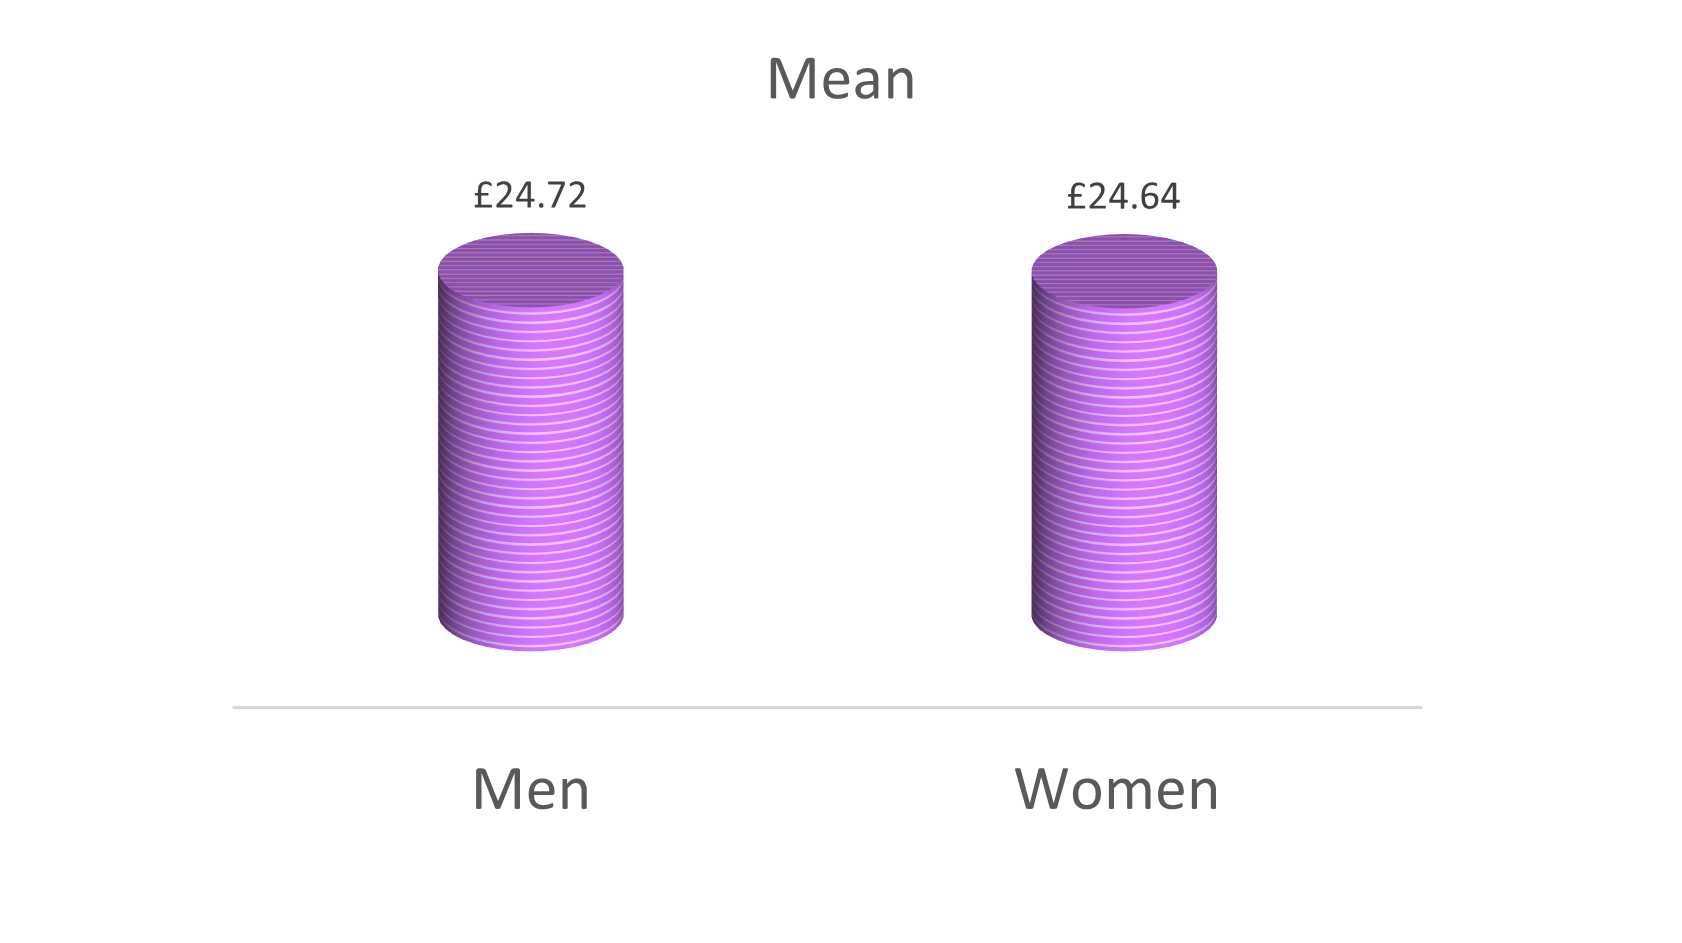
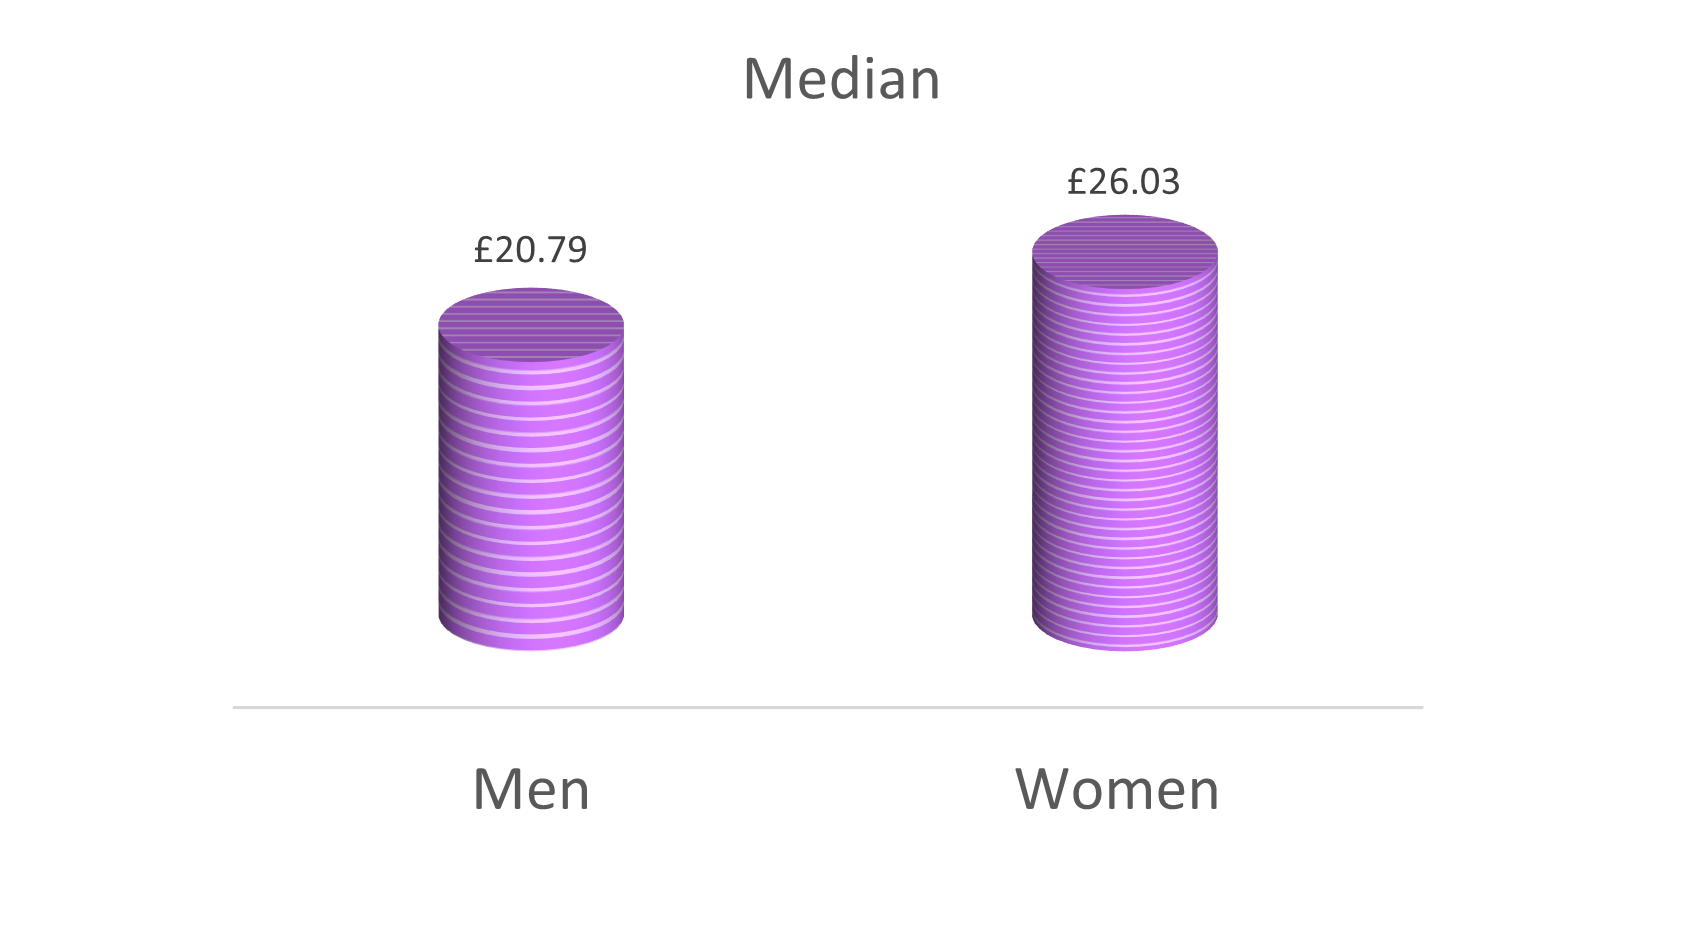
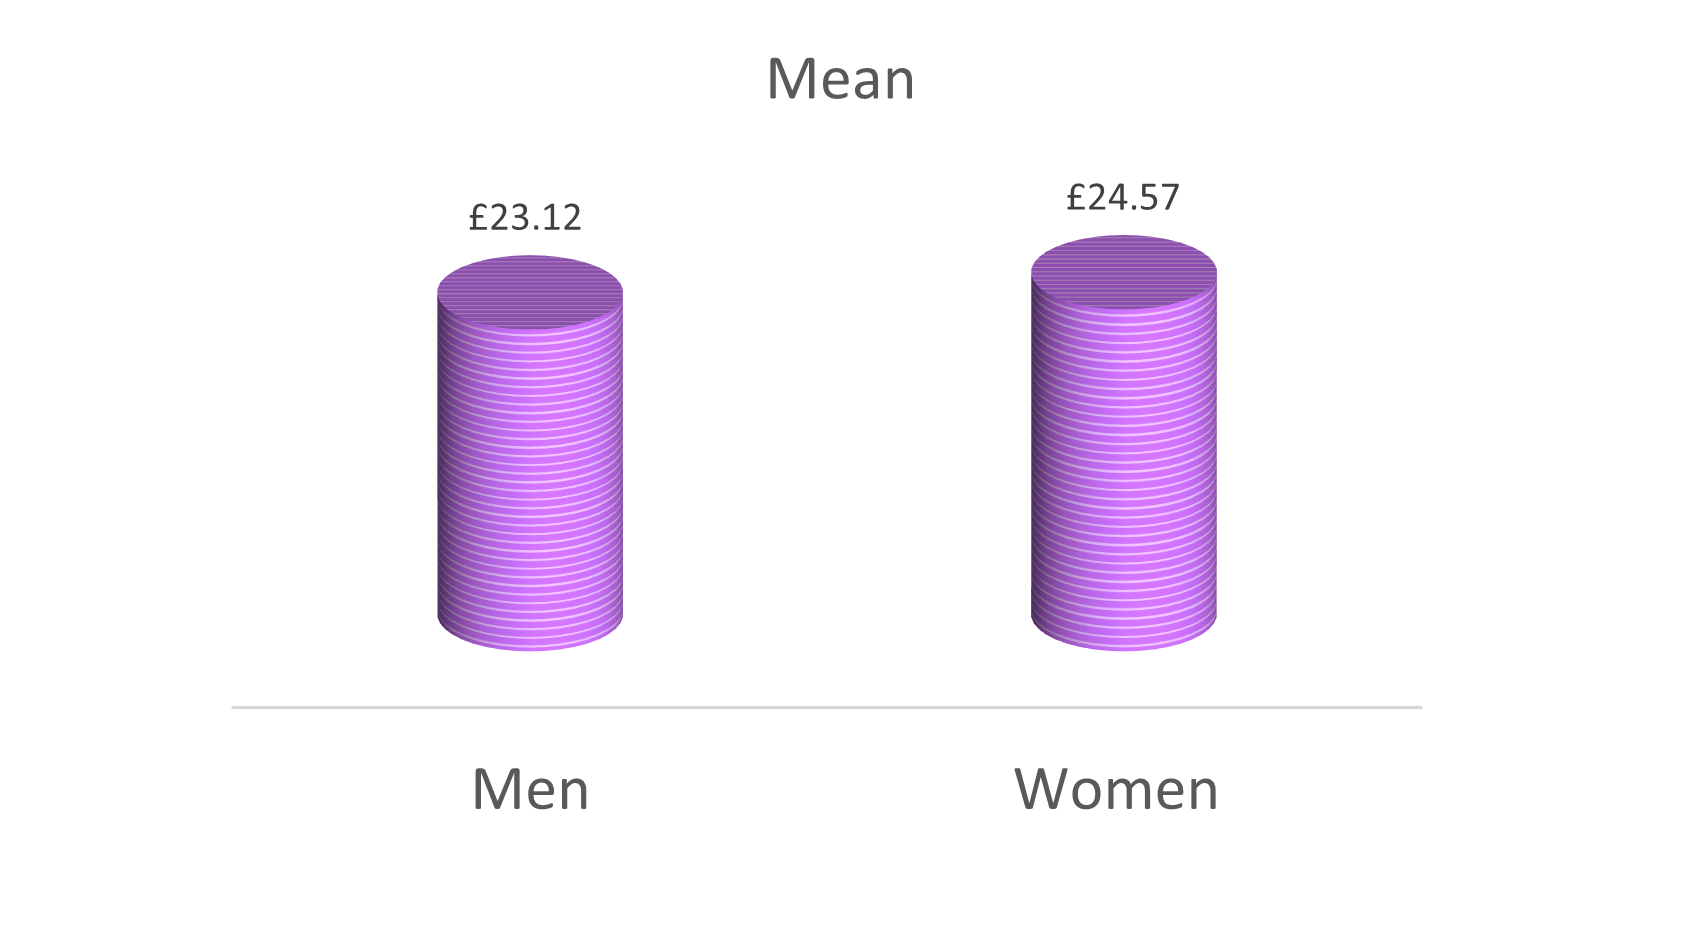
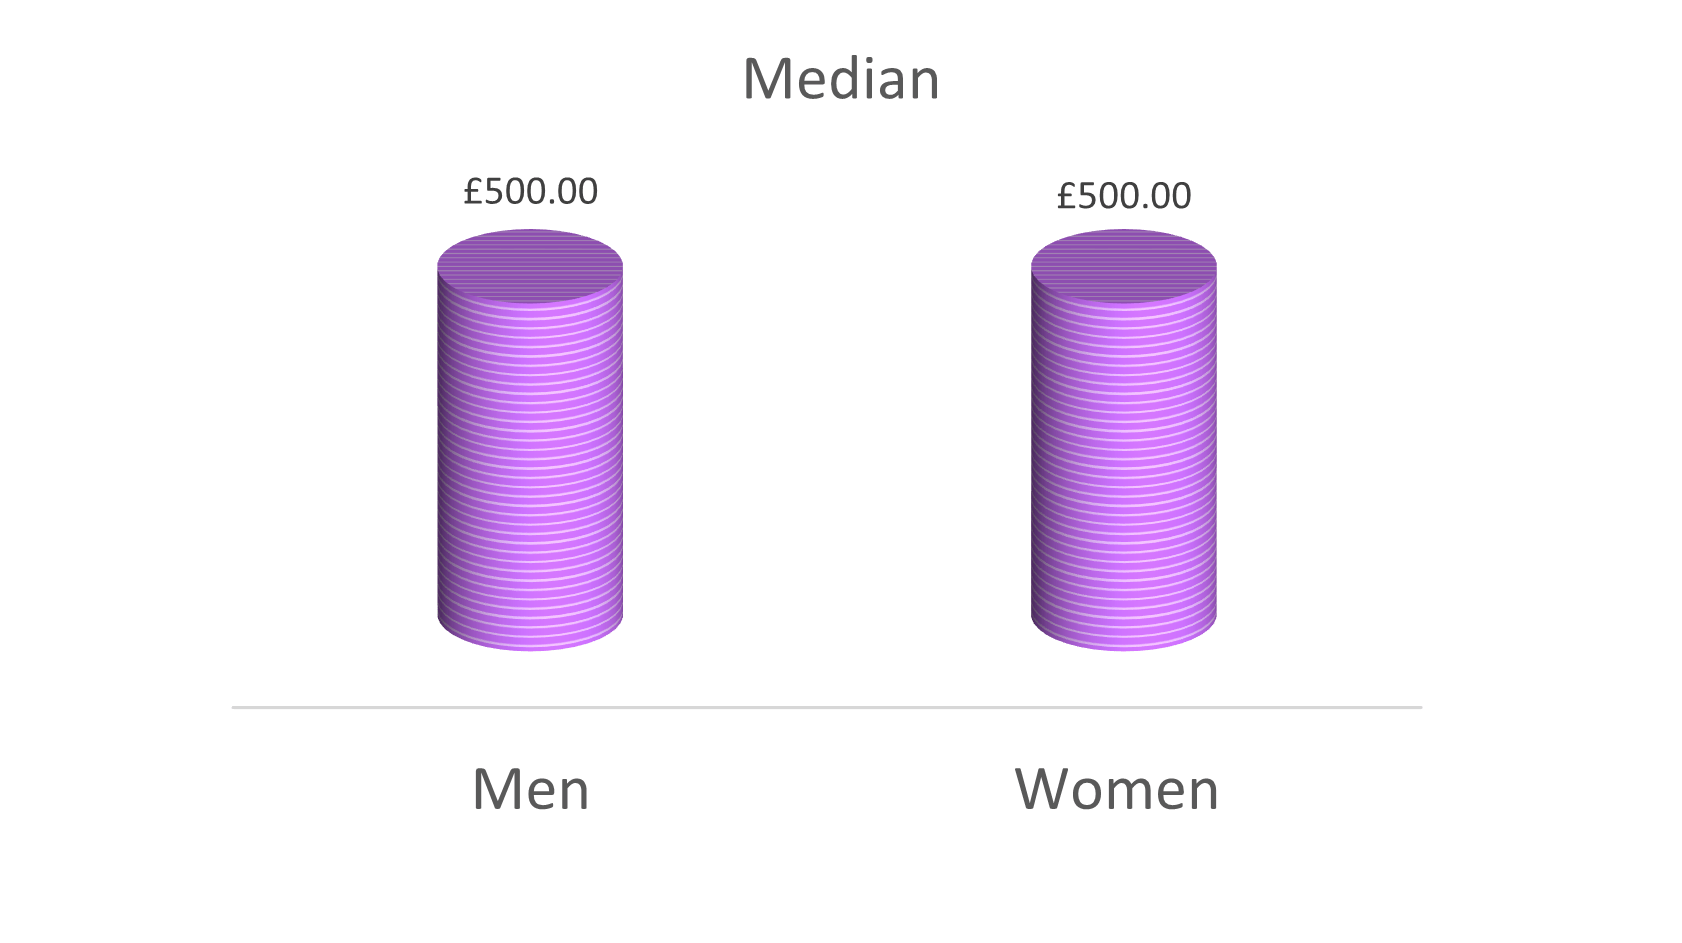
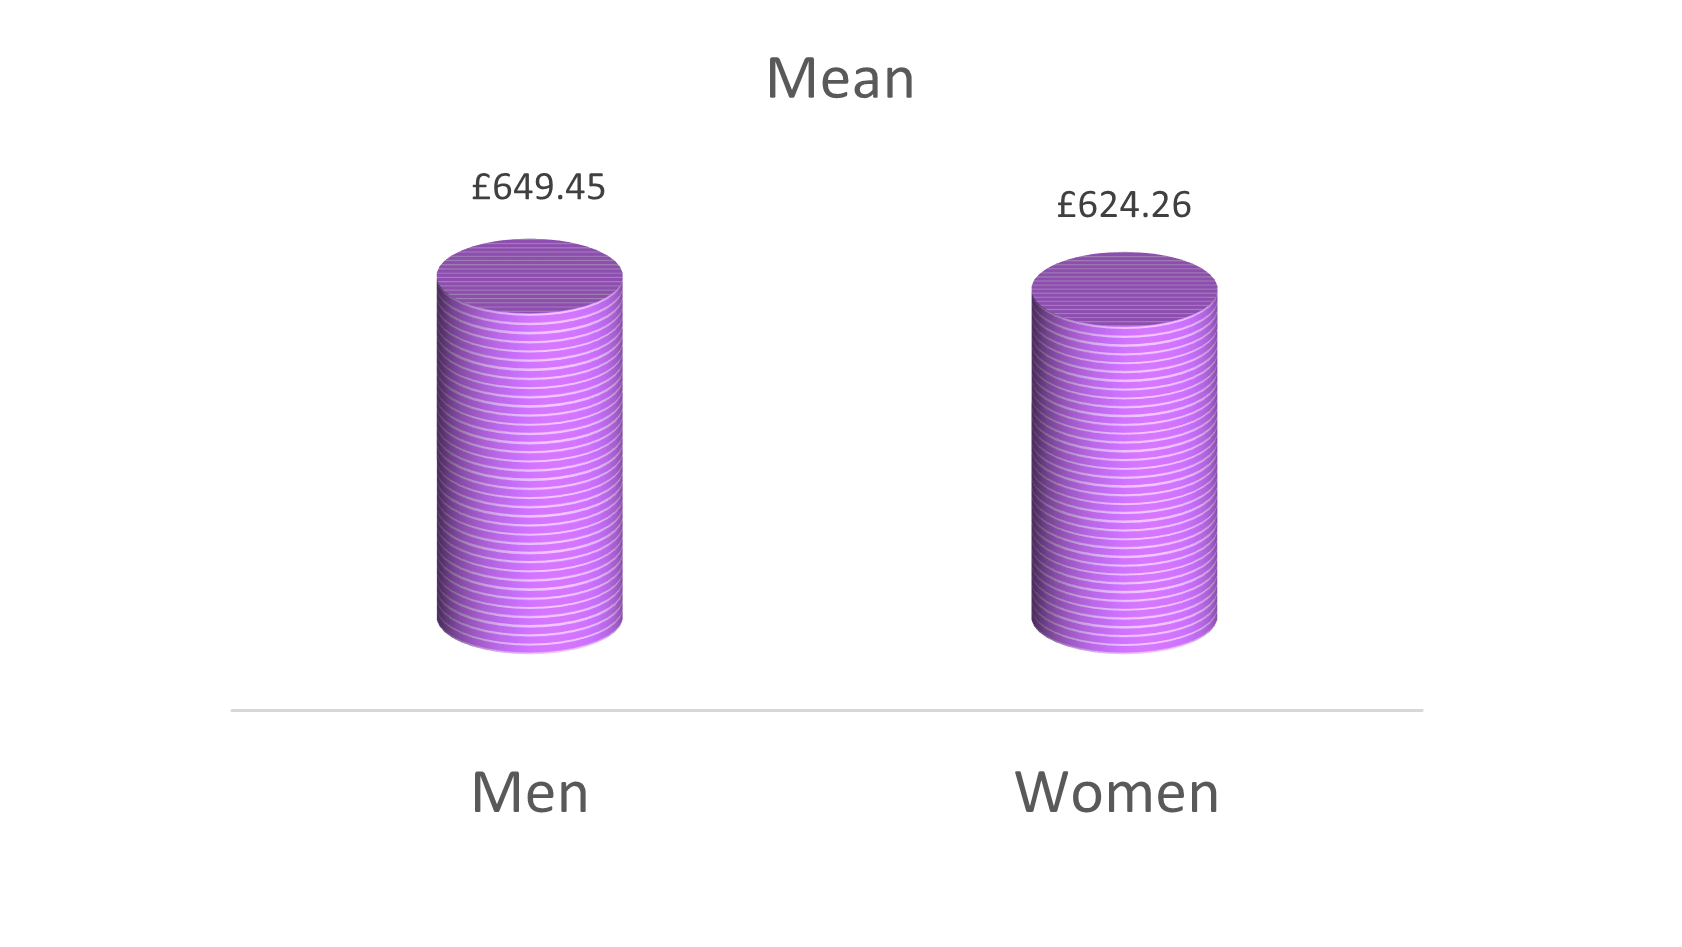
Median and Mean disability pay gap in hourly pay (for all staff) - see table 5B
.png)
.png)
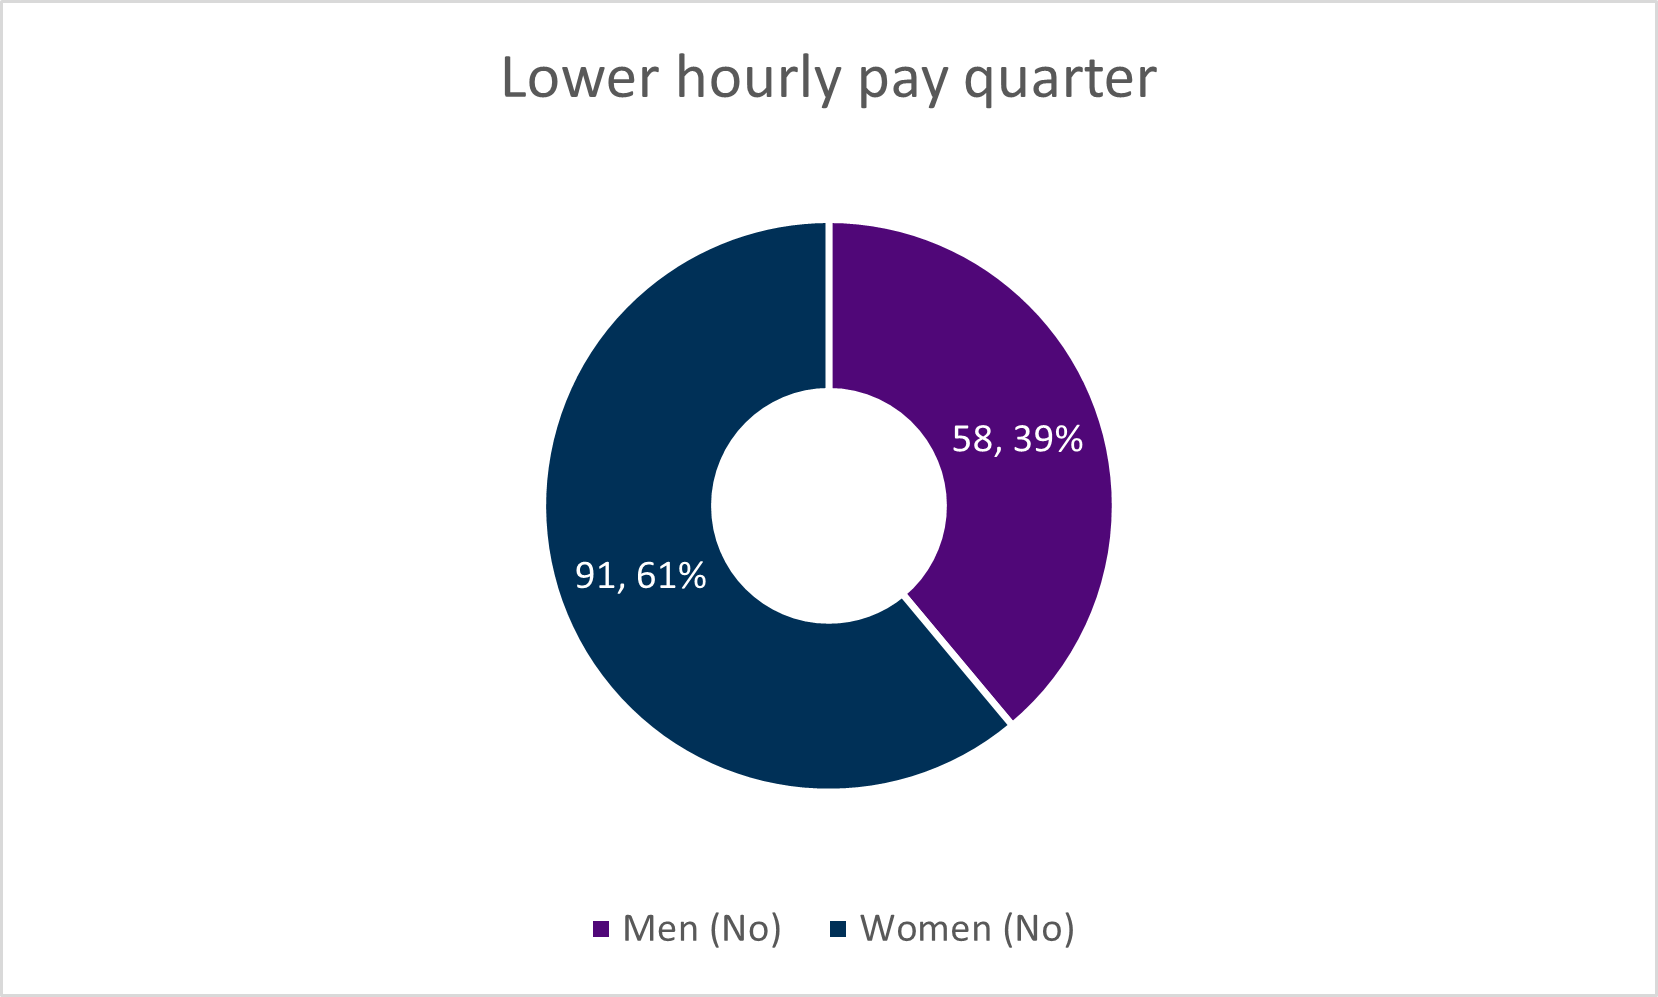
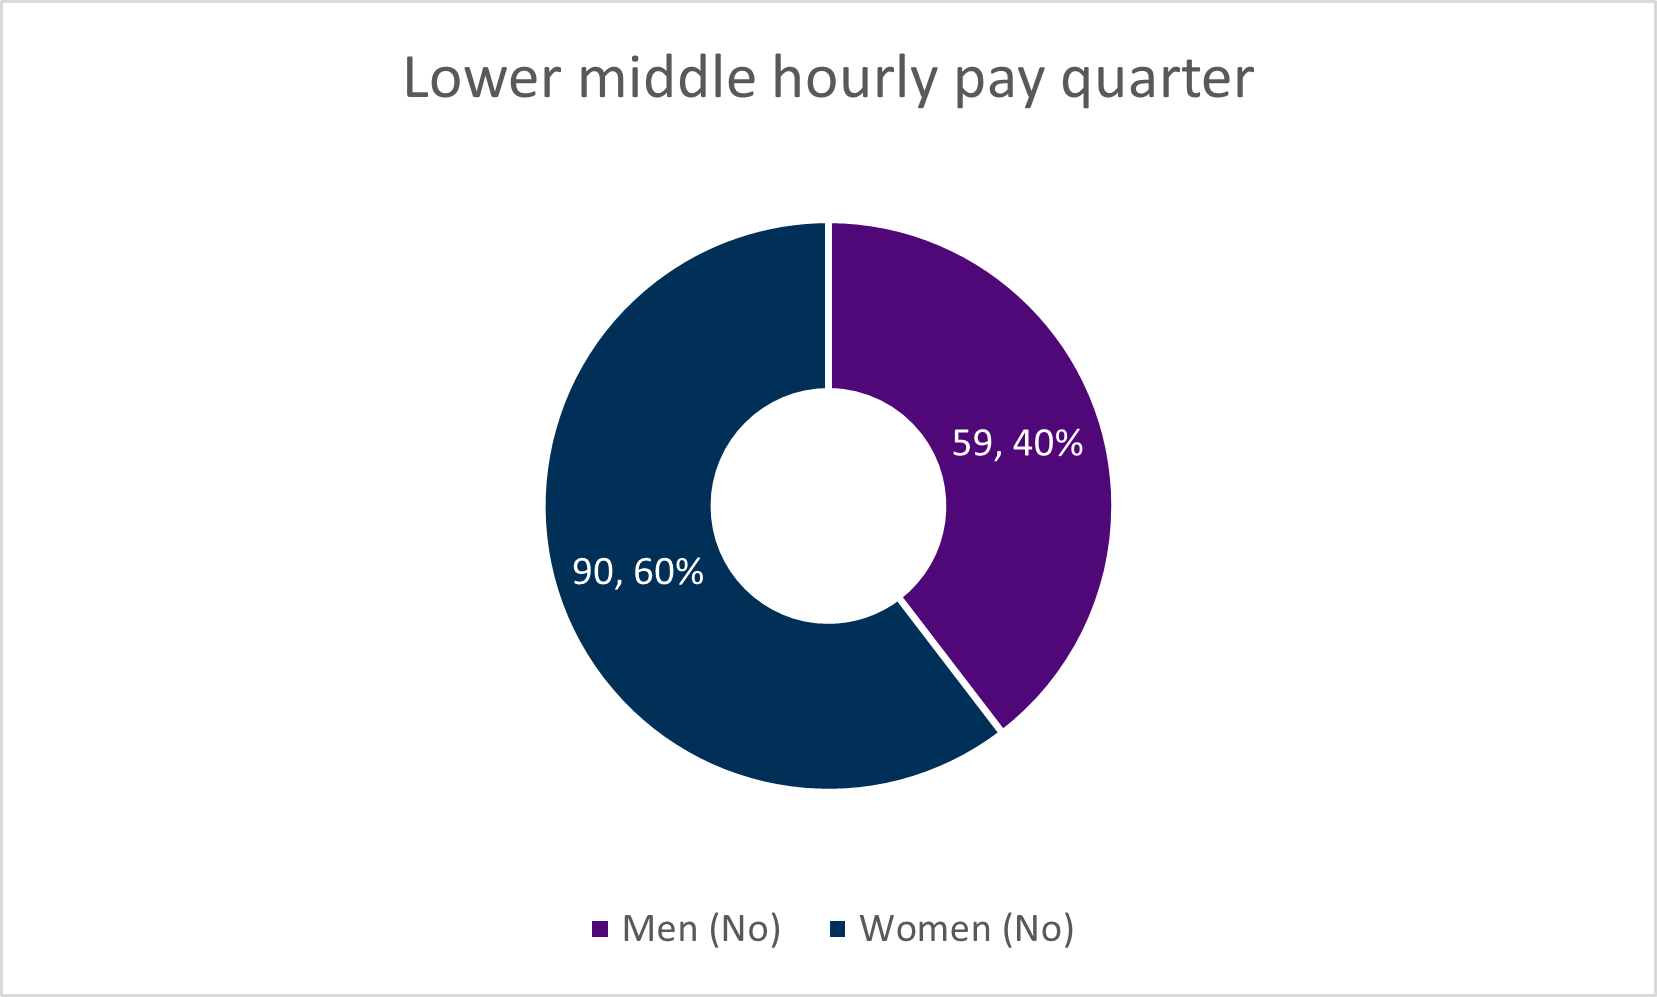
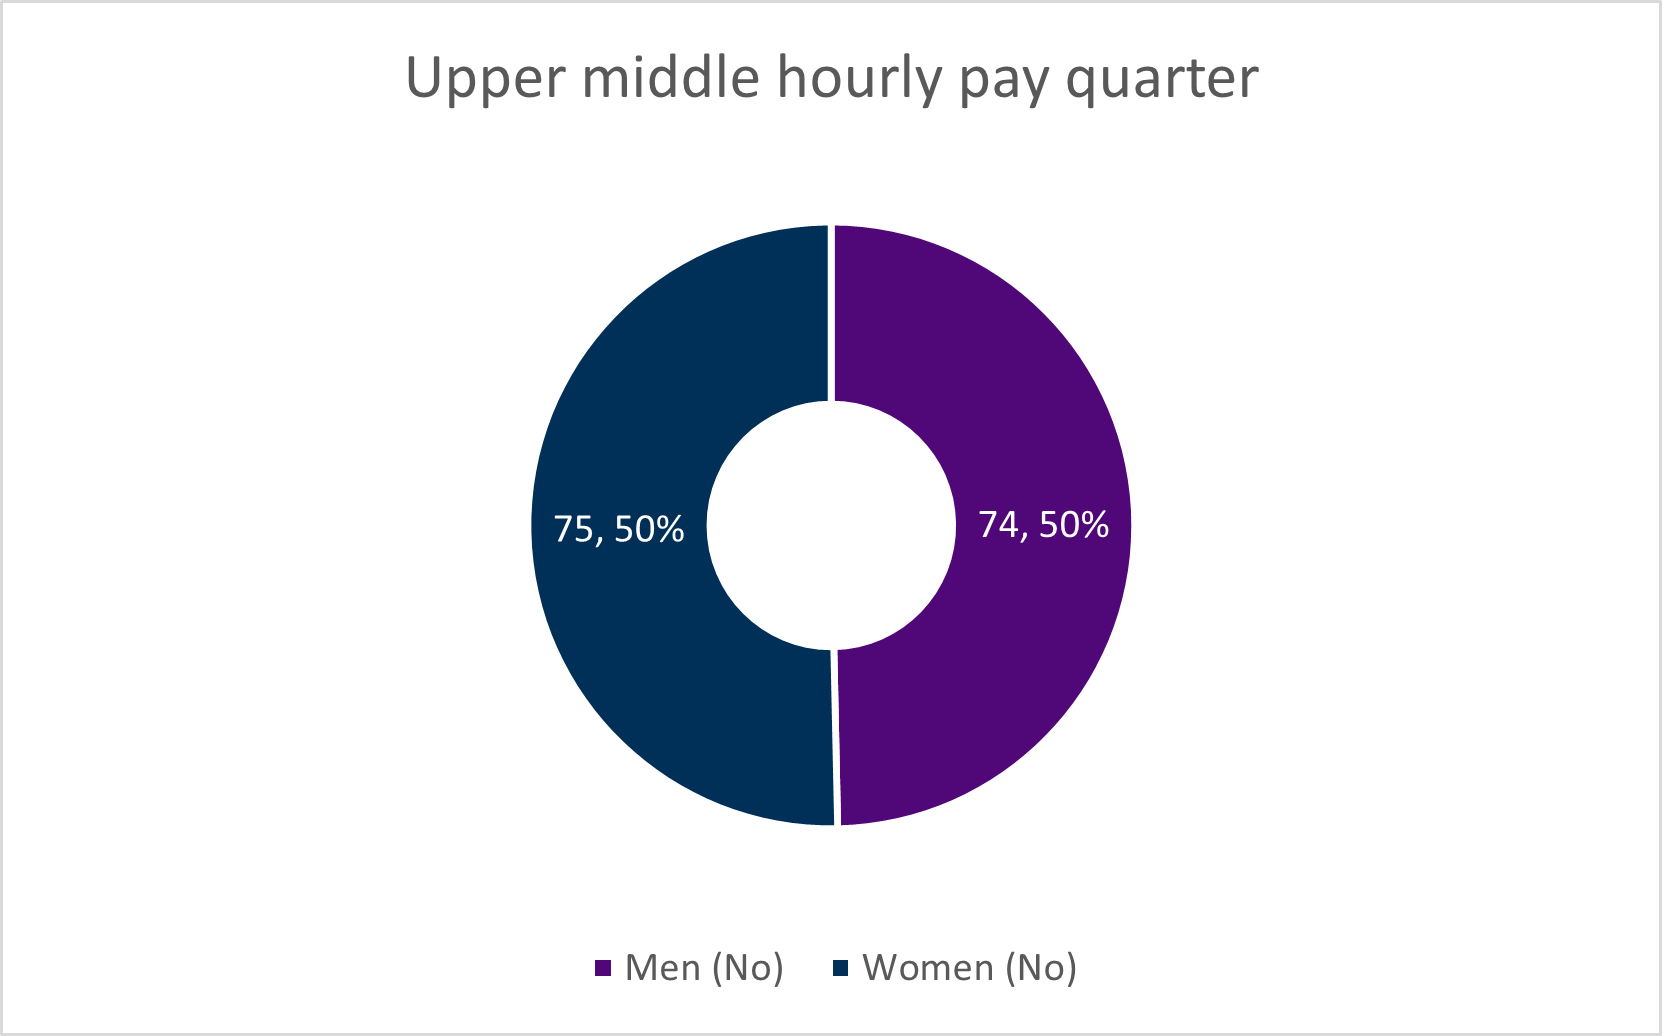
Disability and pay quartiles - see table 5C
.png)
.png)
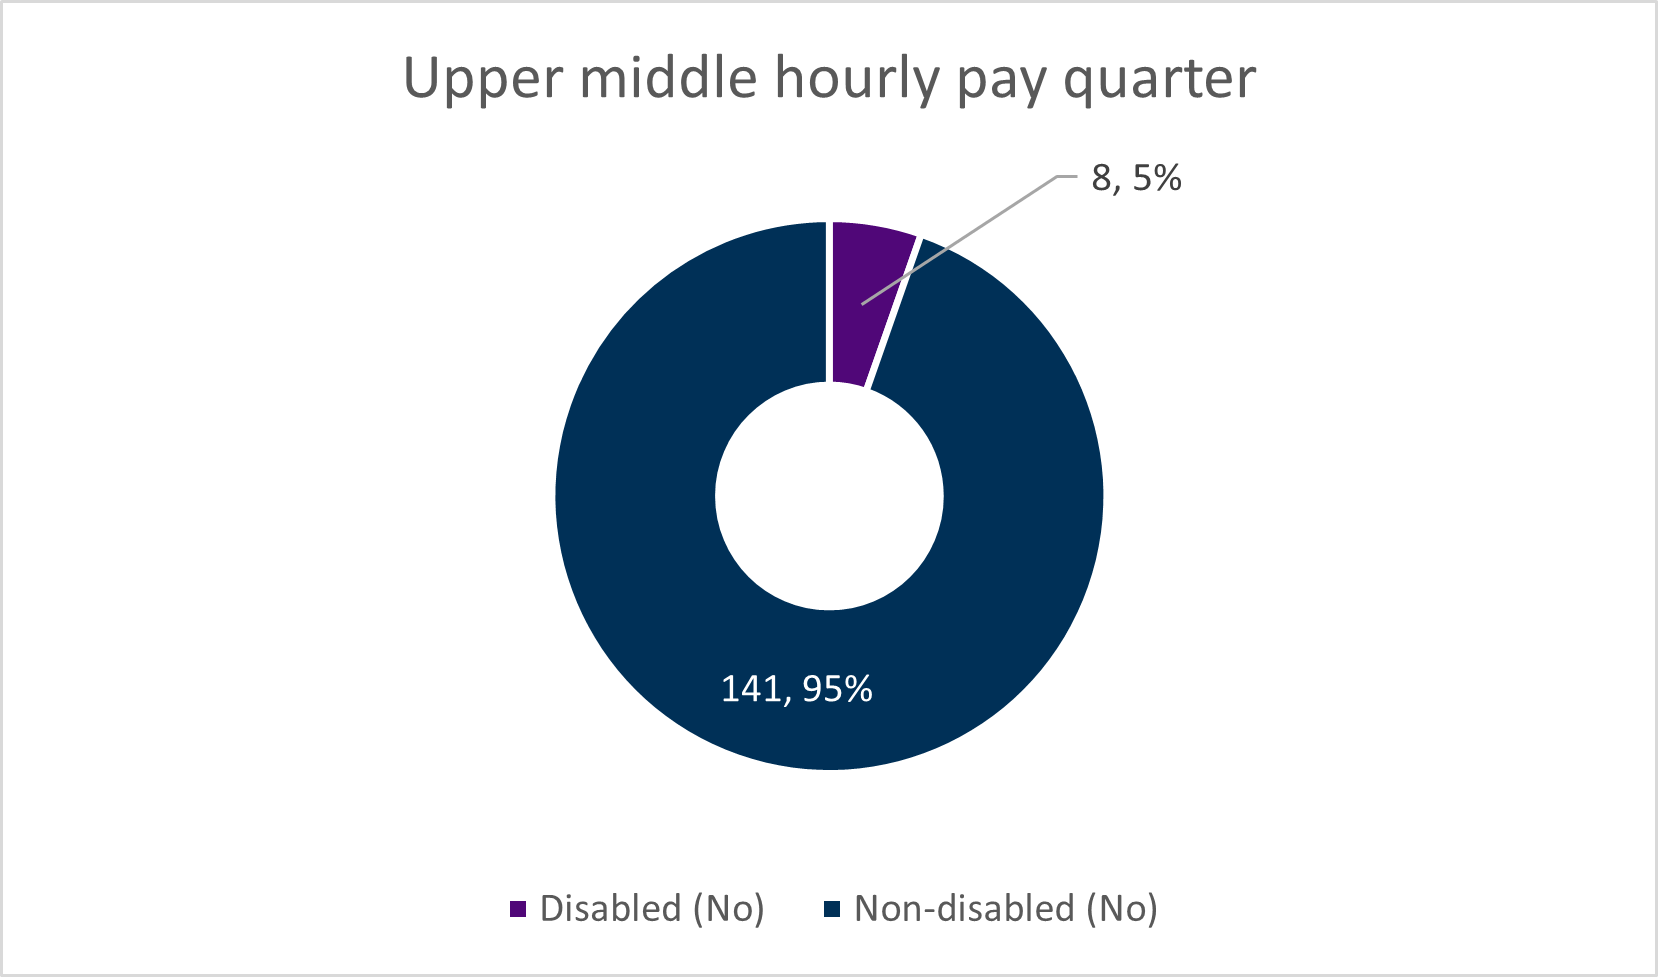
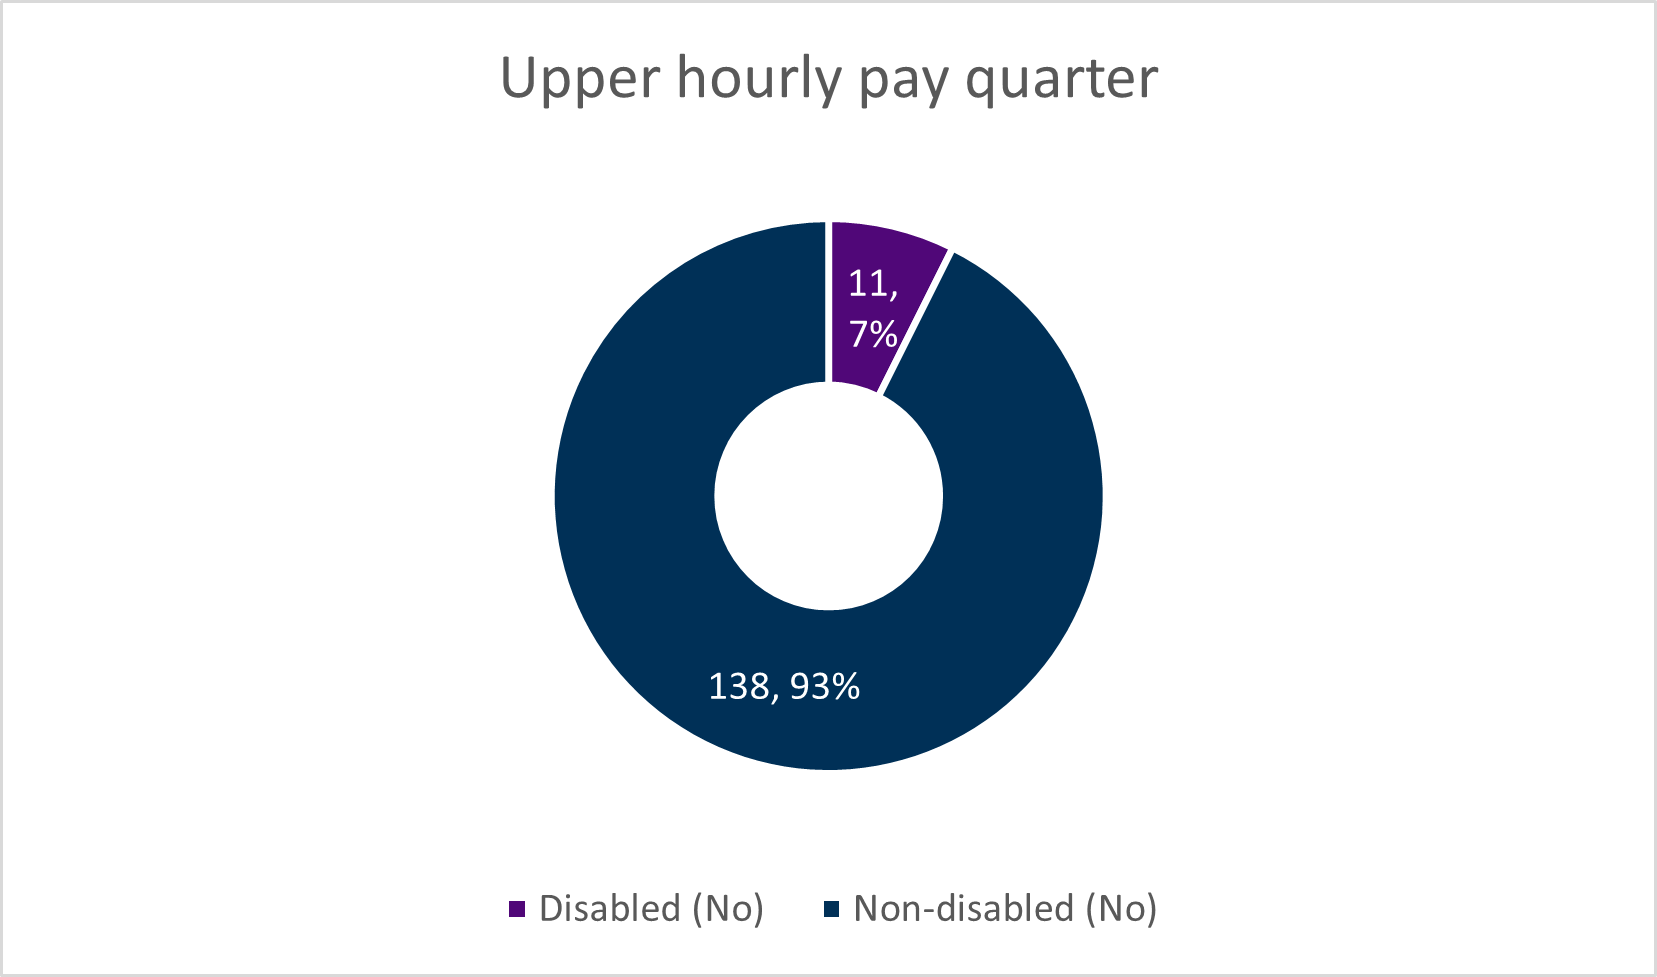
The representation of disabled people in the organisation on the available data is 9.7%, an increase from 8.3% in the previous year. Disabled people are under-represented in the upper middle and upper hourly pay quartiles.
LGB+ Pay Gap
LGB+ Pay Gap
Data tables are available here - see sheet 6 LGB+ Pay Gap (42KB Excel document)
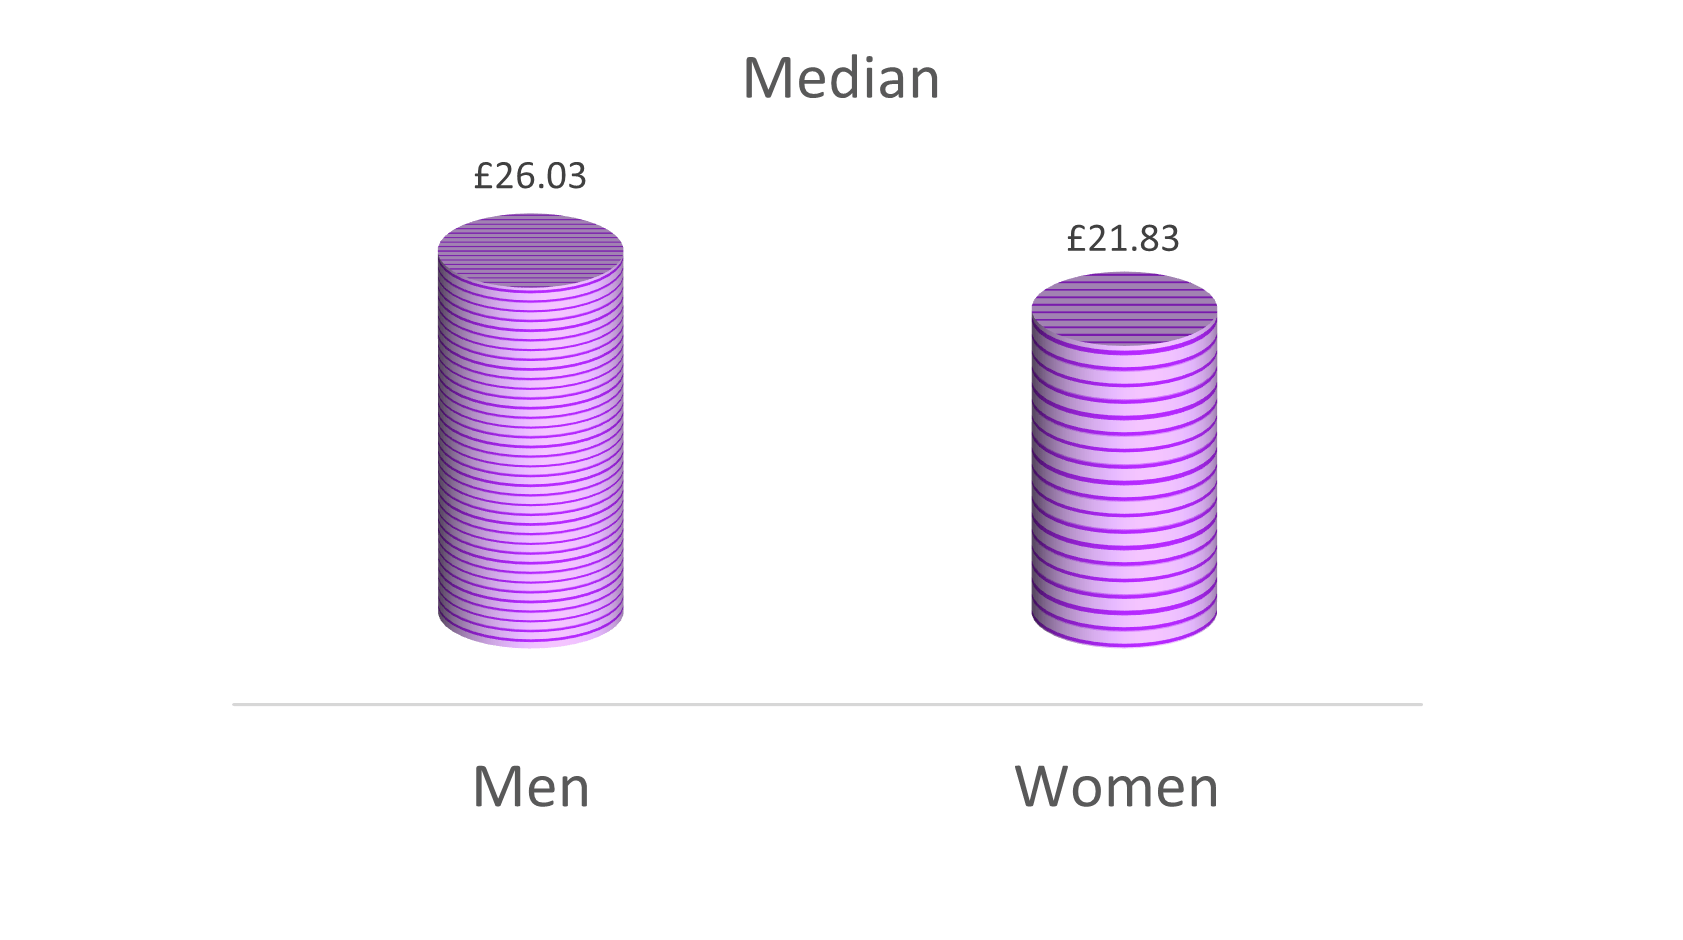
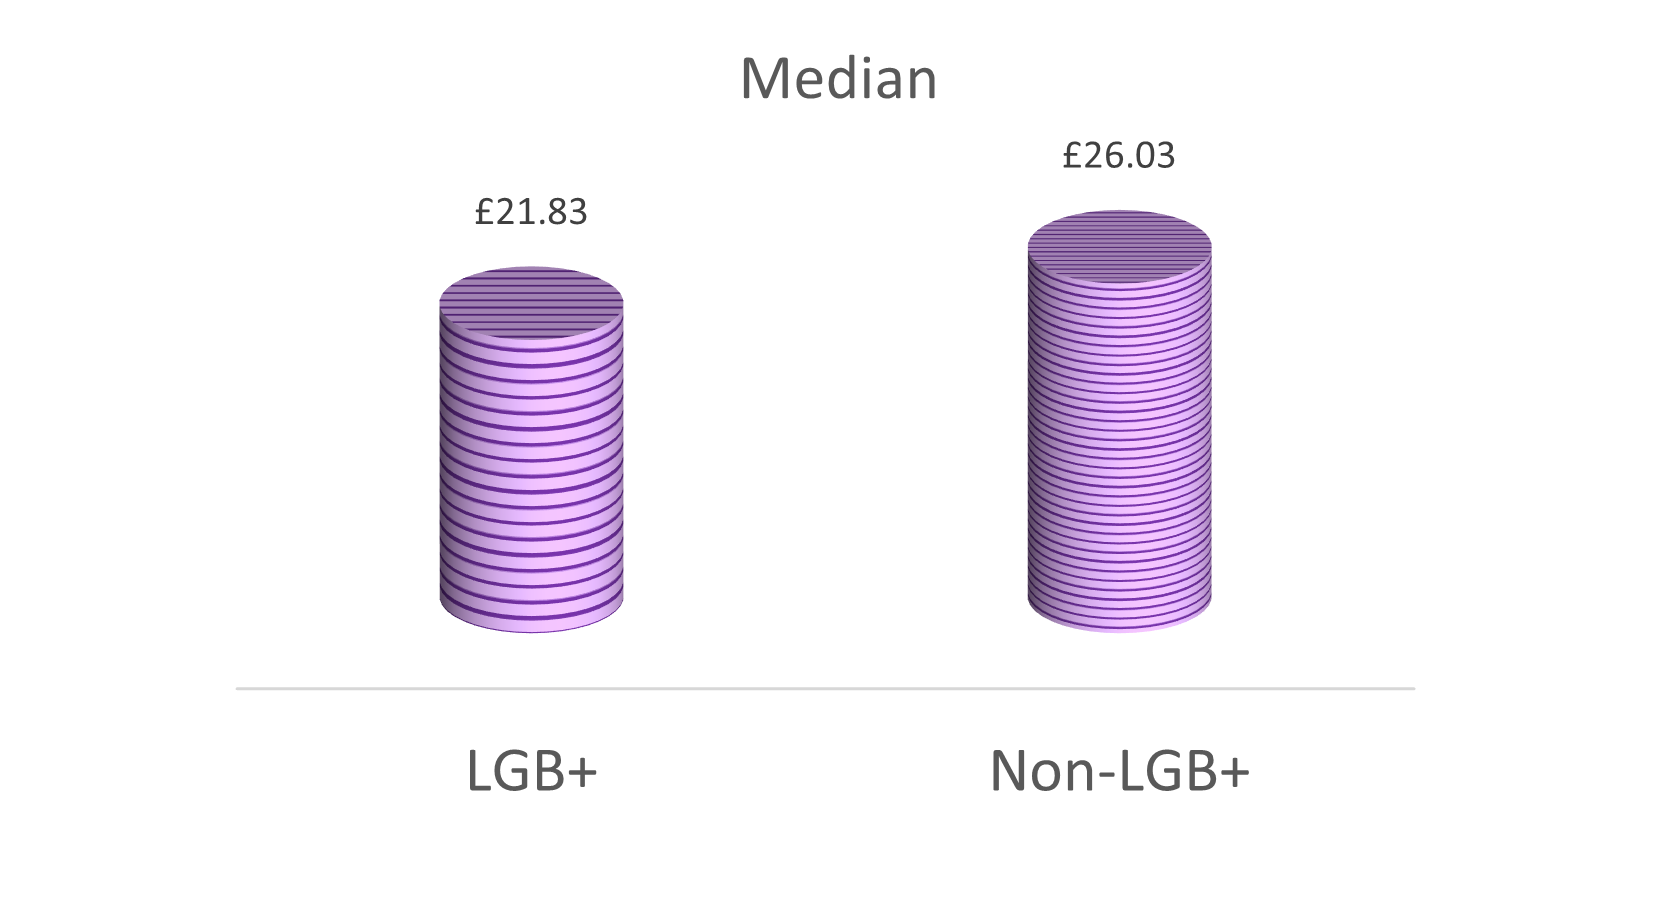
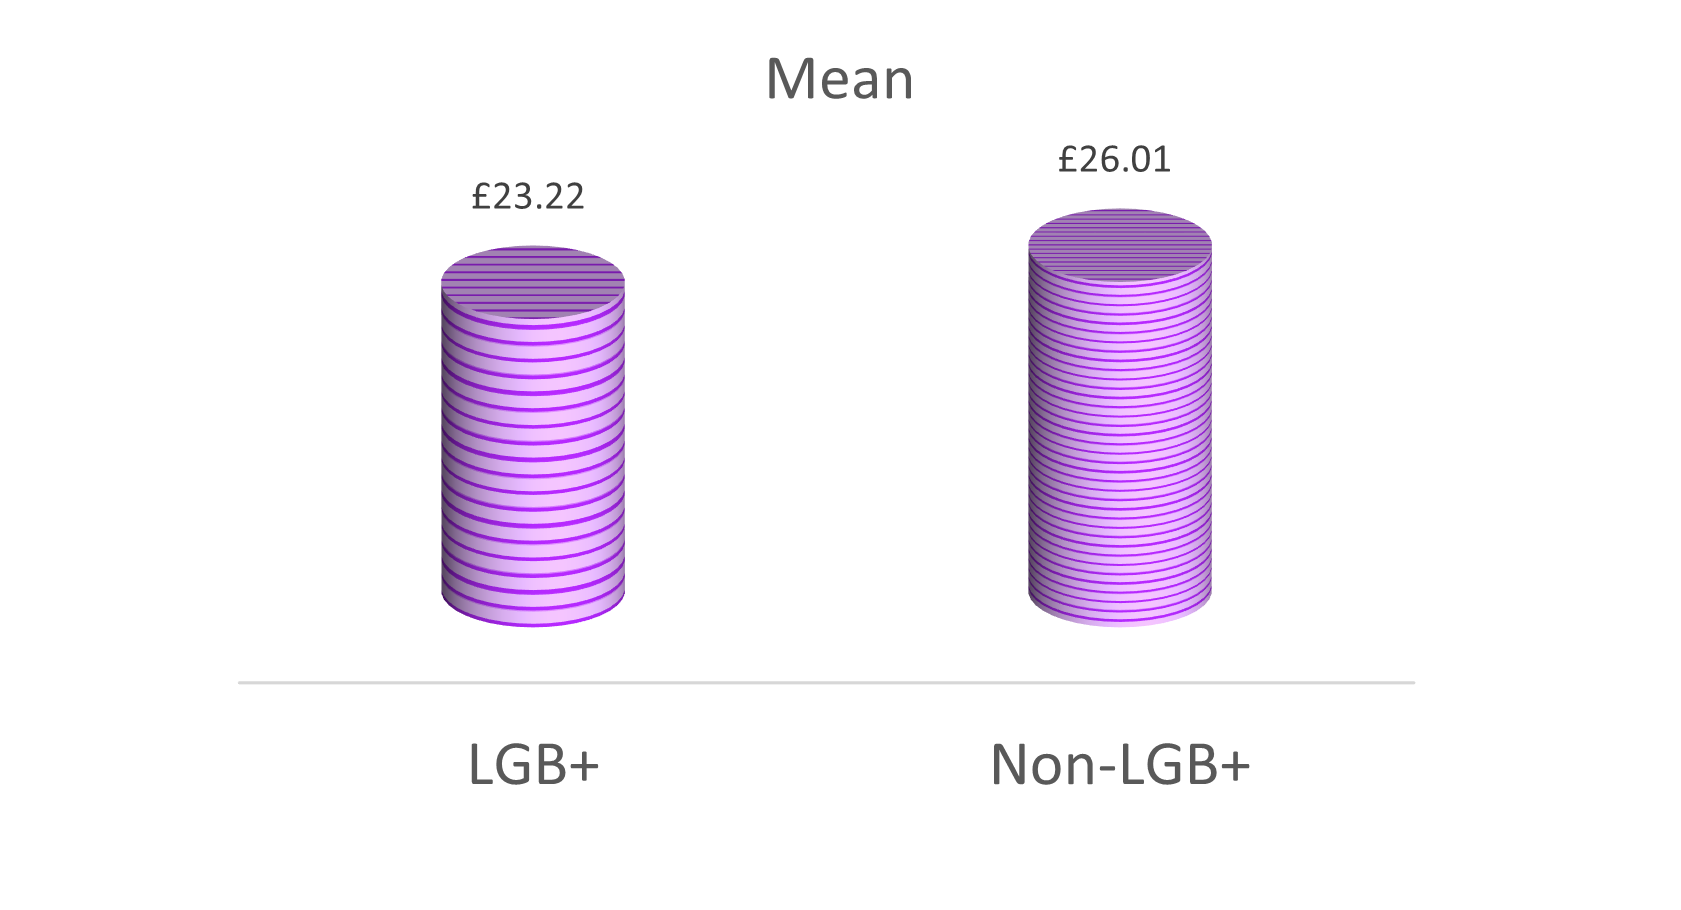
The high-level median LGB+ Pay Gap for SPCB staff (based on declaration rate of 74.9%) is 16.1% (up from 9.8% in 2022). Both staff groups being compared for the LGB+ pay gap have a median pay point within Grade 4, but at different scale points. In the reporting year the representation of LGBT+ people in the organisation has increased. The increase in the pay gap this year is attributable to new starts joining the organisation at the lowest pay scale within their grade in line with standard practice for all new starts.
There is not an agreed format for LGB+ pay gap reporting at this time, we have therefore made the decision to align the measures to those required for Gender Pay Gap reporting.
The data is limited by the LGB+ declaration rates from the staff group. As with the Ethnicity Pay gap we have placed our staff into two cohorts due to the relatively small dataset size.
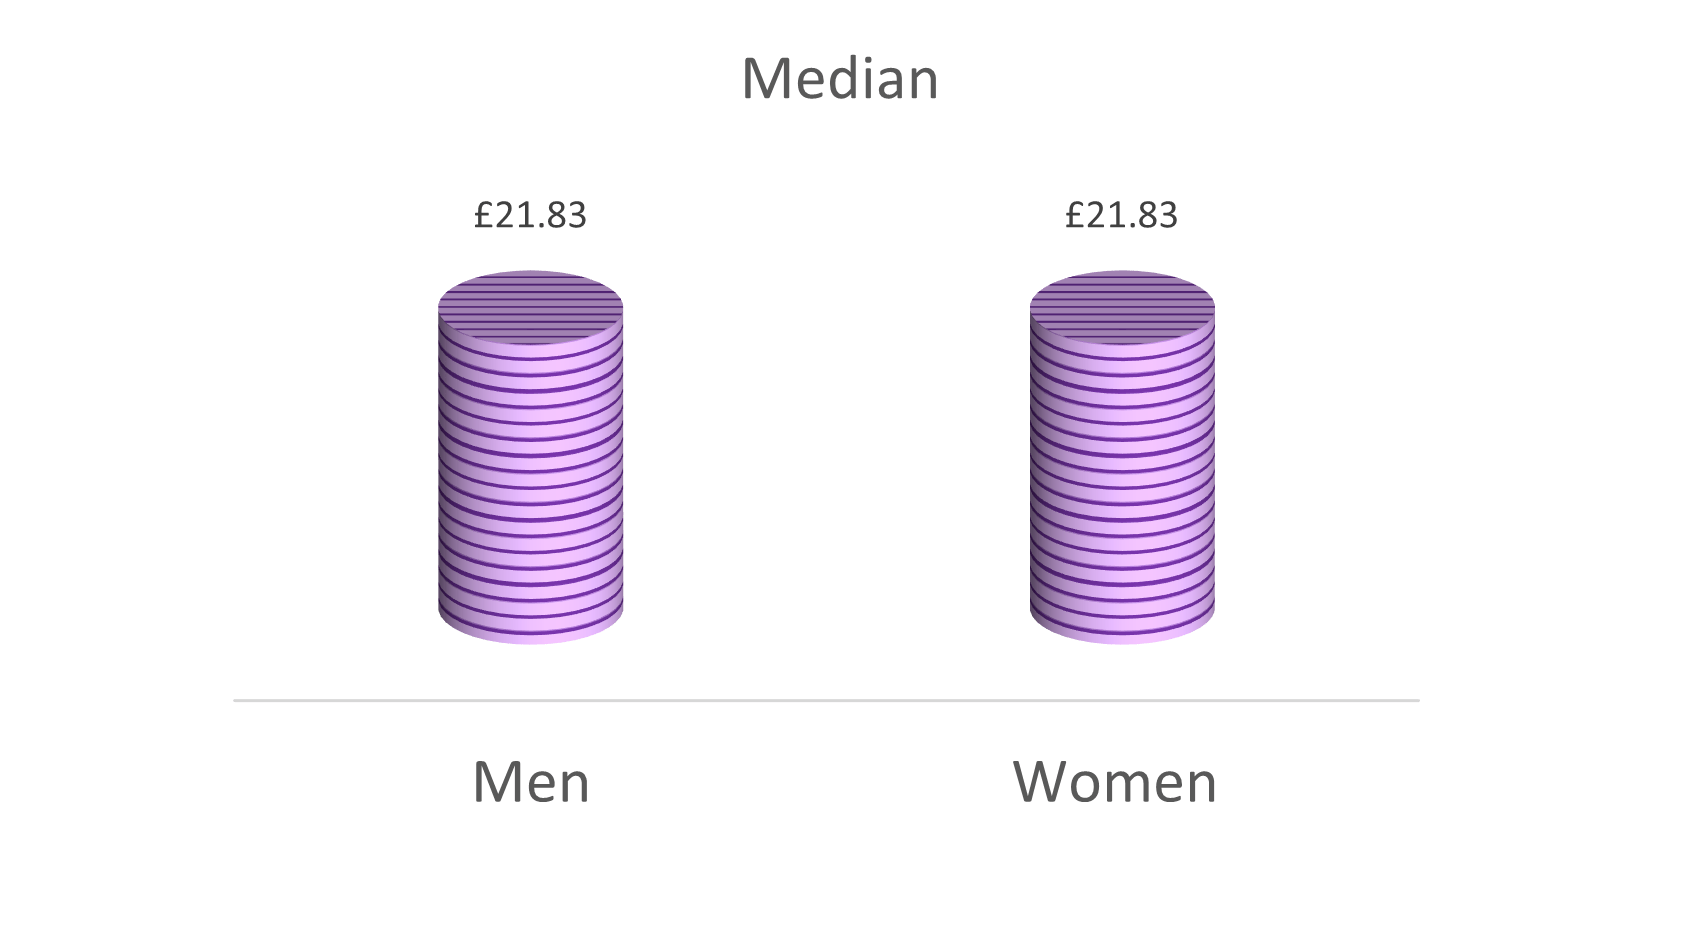
Median and Mean LGB+ pay gap in hourly pay (for all staff) - see table 6A
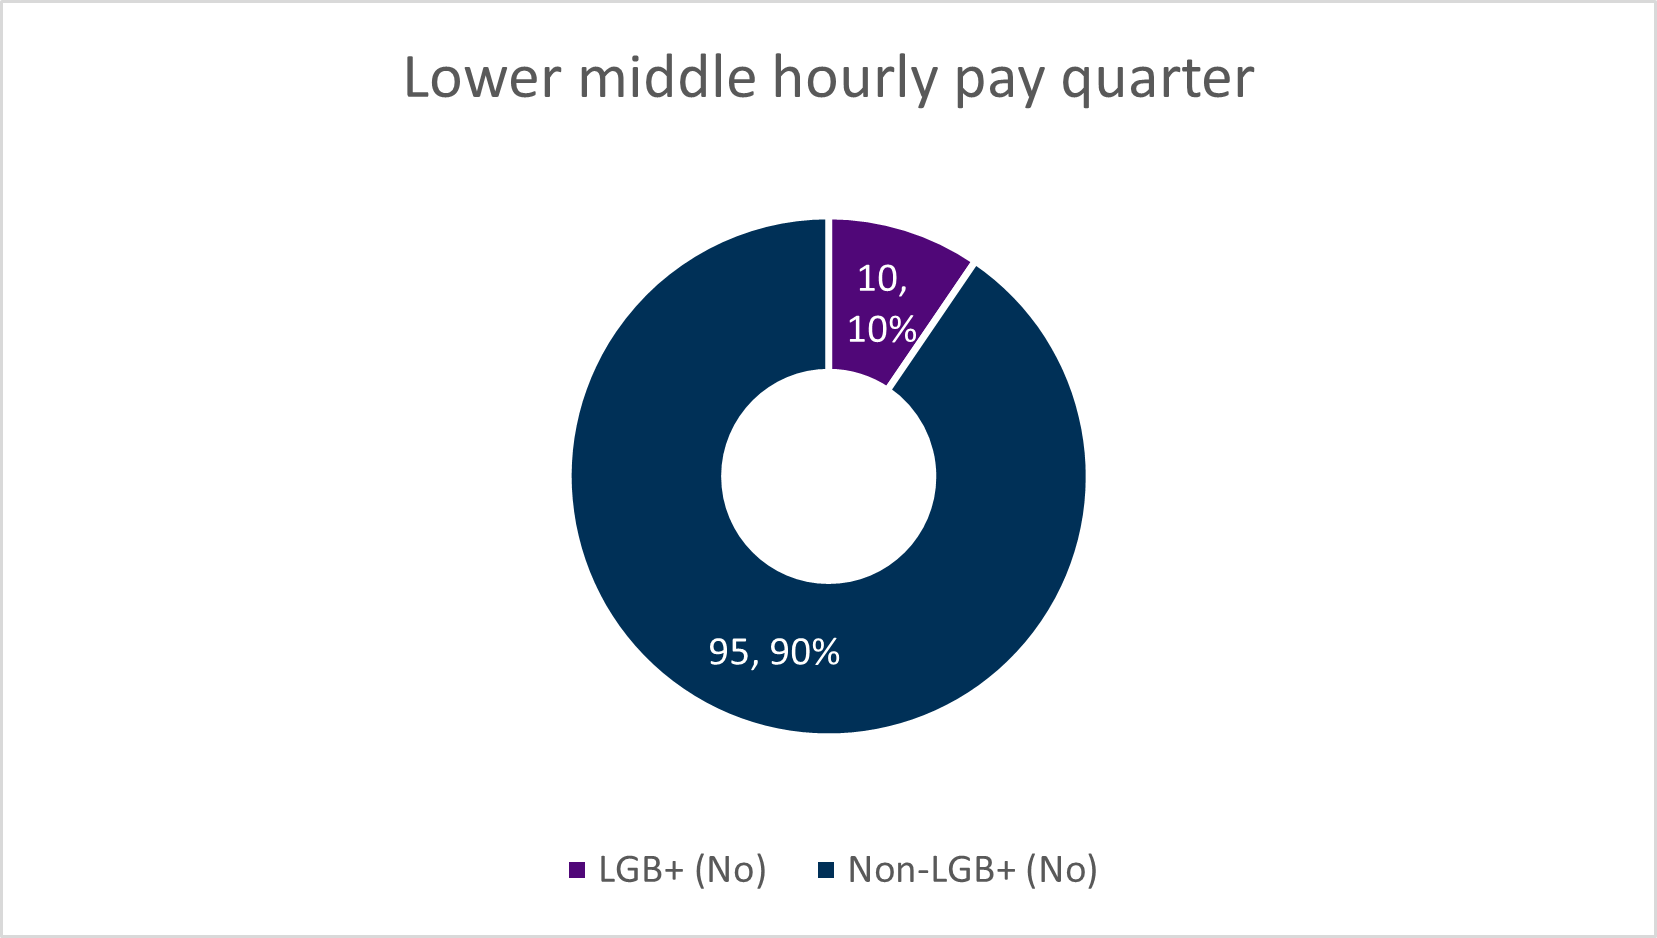
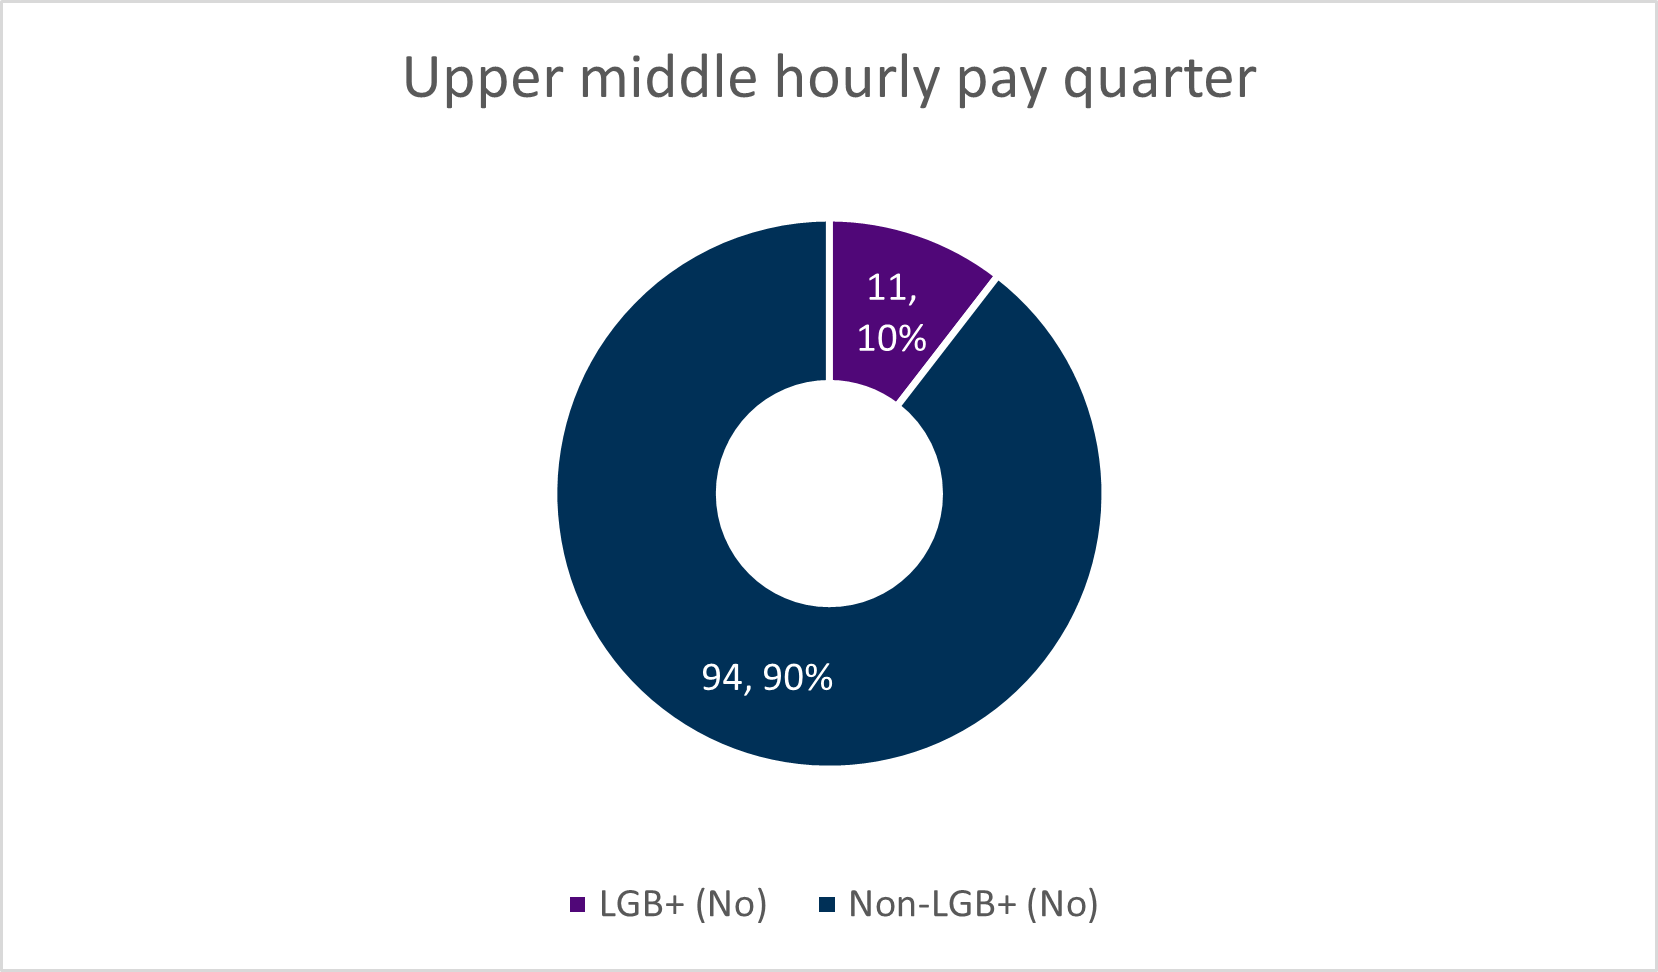
LGB+ and pay quartiles - see table 6B


Equal pay
Equal Pay
Equal Pay and the Gender Pay Gap are not the same. Equal pay means that men and women are paid the same amount for doing work of equal value unless any difference in pay can be justified.
Hourly pay breakdown by grade and gender
Median
| Grade | Women | Men | Difference | % difference |
|---|---|---|---|---|
| 1 | £0.00 | £0.00 | £0.00 | 0.0% |
| 2 | £16.28 | 16.28 | £0.00 | 0.0% |
| 3 | £20.79 | £20.79 |
£0.00 | 0.0% |
| 4 | £26.03 | £26.03 | £0.00 | 0.0% |
| 5 | £32.82 |
£32.82 | £0.00 | 0.0% |
| 6 | £41.41 | £41.41 |
£0.00 | 0.0% |
| 7 and above | £50.77 | £50.77 | £0.00 | 0.0% |
| Solicitors |
£36.03 |
£45.97 | £9.94 | 21.6% |
Mean
| Grade | Women | Men | Difference | % difference |
|---|---|---|---|---|
| 1 | £0.00 | £0.00 | £0.00 | 0.0% |
| 2 | £16.03 | £15.80 | -£0.23 | -1.4% |
| 3 | £19.72 | £19.87 |
£0.15 | 0.8% |
| 4 | £24.86 | £25.18 | £0.31 | 1.2% |
| 5 | £31.66 |
£31.76 | £0.09 | 0.3% |
| 6 | £40.50 | £40.65 |
£0.16 | 0.4% |
| 7 and above | £53.20 | £63.12 | £9.92 | 15.7% |
| Solicitors |
£35.26 |
£44.78 | £9.52 | 21.3% |
As demonstrated in the tables above the median hourly rate of pay for men and women is equal for all grades on the main SPCB pay scale.
In line with the findings last year, there is a difference in the hourly rate for solicitors where male staff are employed between points 48 and 55, on the revised scale, whereas a greater variance exists in the job roles of female staff. This is accounted for in the staffing ratio 14:86 of staff employed within the solicitor’s office (inclusive of a further increase, proportionately, in female staff and associate decrease in male staff this year).
The median point for male staff within the solicitor’s office remains at solicitor team leader level, whereas for female staff in the solicitor’s office the median point continues to fall at the solicitor grade level which demonstrates why the gap is greater in this office compared to the main pay grade scale.
Where men and women are employed in the same role at the same grade it can be demonstrated that they are paid equally.
Our future actions
Our future actions
Our future actions are set out in the Session 6 People and Culture Strategy Delivery Plan.
We review data on a regular basis to ensure the plan is supporting us to achieve our diversity and inclusion aims.
This year we also considered the recommendations made in the external inclusion maturity assessment and we were satisfied that we were able to map them to the Delivery Plan. The activities for Years 3 and 4 of the Plan are outlined below:
Developing effective leadership and culture change
- Ensure leadership is further distributed to build capacity and resilience to meet future challenges.
- LG visibly embed the values in their decision making so there is no gap between what they say and what they do.
- Develop approaches to enhancing leadership and management skills, with an emphasis on change management and preparing for the future of work.
- Encourage digital leadership within services.
- Respond to emerging leadership development needs from year 2.
Creating a diverse, respectful, and inclusive working environment
- Develop a Race Strategy to tackle barriers in the workplace, including pay disparities
- Review our recruitment reach and impact.
- Widen the scope and focus of diversity and inclusion activities through a more intersectional approach to promote and support all areas of diversity within the Parliament.
- Shift culture through allyship training for all
- Continue to use positive action to increase diversity.
- Set ambitious improvement targets, which are embedded into group planning and reporting processes.
Engaging and sustainable reward and recognition arrangements.
- Continue to monitor the market regularly to ensure that our pay remains competitive.
- Continue to review our benefits package to provide attractive features that help people feel valued.
Feeling informed, involved, engaged, and supported.
- Review impact and feedback on communication and engagement activity to inform future work.
- Develop our two-way communication methods to suit new ways of working
- Automate more of our people processes and continue to embrace technology.
- Develop managers to help enable manager self-service