Scotland's Business Base: Facts and Figures
GDP and employment have long been recognised as the major indicators of economic success. Yet, a key driver of these indicators, the business base, is often overlooked. To leverage economic success, it is important to understand the trends and characteristics related to Scotland's business base. This paper brings together and explores a range of data on Scotland's business base in 2020. It sets out a variety of evidence to aide understanding on all aspects of Scottish business stock, such as: industry sectors, size, ownership, survival rates, etc.
Summary
Please note that much of data used in this briefing relate to a snapshot of the business base taken in March 2020. Thus, no effects of the coronavirus (COVID-19) pandemic will be visible in these data. Once updated data become available (expected in late 2021) this briefing will provide a useful baseline of Scotland's pre-pandemic business base.
Business stock growing
There were 364,310 private sector businesses operating in Scotland, as at March 2020. Unregistered (not VAT or PAYE registered) and registered businesses have shown differing growth trends over the last two decades . The number of unregistered businesses has more than doubled over this time in Scotland (107% growth), while registered businesses have had a more steady rate of incline over the period (21% growth).
In 2020, Scotland represented 6.2% of the UK's total private sector business base. This was smaller relative to Scotland's UK population (16+) share of 8.4%.
Sector contribution
The two largest industry sectors, in terms of enterprise numbers, were ‘Professional, Scientific & Technical Activities’ (48,030 enterprises) and Construction (47,715 enterprises). Together, these sectors made up 26% of all private sector enterprises in Scotland's economy.
Scotland had a high specialisation and intensity in 'mining, quarrying, utilities' reflecting the oil and gas industry in the North East. Although the dominance of this sector has declined in recent years, for example in 2016 it had an intensity score (concentration of an industry in Scotland compared to the UK) of 1.8 compared to 0.9 in 2020.
Analysis of changes in the sector structure of the Scottish business base between 2010 and 2020 show that the structure of the business base is moving towards service orientated activities, reflecting global trends in developed economies.
Small business with no employees dominate the business base
Businesses with no employees – that is sole proprietors or partnerships comprising only the owner-managers or companies comprising only the employee director – accounted for 70% of all private sector enterprises in Scotland and 14% of employment. On the other end of the spectrum, 2,440 (0.7% of the total) businesses were large (250 or more employees) and accounted for 44% of employment.
Business births, deaths, and survival rates
The number of Scottish business births increased by 5% between 2018 and 2019 to 21,665, resulting in a birth rate of 11.8%. The 21,665 business births in 2019 were the second highest recorded since comparable records began. The number of Scottish business deaths increased by 7% from 18,120 to 19,415 between 2018 and 2019, resulting in a death rate of 10.6% compared with a rate of 10.1% in 2018.
The 1-year business survival rate in Scotland has decreased since 2014 but it has been relatively stable in the range of 90-91% over the years since. The Scotland 5-year survival rate for businesses born in 2014 and still active in 2018 was 42.3%.
Ownership of the Scottish business base
The majority of Scotland's private sector enterprises were Scotland-owned (97%). These indigenous enterprises contributed 65% of employment and 47% of turnover. Total non Scottish owned enterprises (rest of UK-owned and abroad-owned) represented 3% of enterprises, but accounted for 35% of employment and 53% of turnover.
The share of employment provided by abroad-owned enterprises was significantly greater than the proportion of abroad-owned enterprises . This illustrates the importance of international investment in job creation, although this dataset doesn't clarify the quality of the jobs created.
Local authority business stock, Glasgow on top
In terms of local authorities, Glasgow City (11% of all registered Scottish businesses) had the highest proportion of Scottish businesses. On the other end of the scale, both Na h-Eileanan Siar (0.7%) and Clackmannanshire (0.7%) had the lowest number of enterprises.
The ten year growth rate for local authority business stock was positive in all but three local authorities. Dumfries & Galloway saw business stock decrease by 2% and Argyll & Bute had a decrease of 1%. There was zero percent growth on the Orkney Islands, where stock rates plateaued.
All but two Scottish Parliament constituencies have seen business stock increase since 2010
The top five constituencies for Scottish business stock in 2020 were: Edinburgh Central (4.5% of local units), Glasgow Kelvin (4.5%), Aberdeen Central (2.5%), Aberdeenshire West (2.3%), and Skye, Lochaber and Badenoch (2.2%). In contrast, the areas with the lowest volume of business stock were: Na hEileanan an Iar (0.7%), Glasgow Anniesland (0.8%), Glasgow Provan (0.8%), Orkney islands (0.8%),and Glasgow Cathcart (0.8%).
All but two constituencies have seen business stock increase since 2010. The two constituencies with long-term declines in business stock were Ettrick, Roxburgh and Berwickshire, and Galloway and West Dumfries. Generally, rural constituencies have had relatively moderate growth, whereas urban areas, particularly cities, have seen significant growth.
Introduction
The two major indicators of economic success have often been viewed as GDP and employment. Yet, the key driver of these indicators, the business base of the economy in question, is often overlooked. Thus, to leverage economic success, it is important to understand the trends and characteristics related to a country's business base.
This paper brings together and explores a range of information and data on Scotland's business base. It sets out to understand, evidence, and communicate on all facets of Scottish business stock. This includes:
looking at trends over time in total business stock
understanding the contribution of different industry sectors to the business base
exploring businesses by size, employment and legal status
analysing the birth, death, and survival rates of Scottish business stock
looking at the characteristics of turnover and investment amongst the business base
examining trends in Scotland's business ownership
and understanding the business base by different geographical levels (local authority, parliamentary constituency, urban and rural).
Please note that much of data used in this briefing relate to a snapshot of the business base taken in March 2020. Thus, no effects of the coronavirus (COVID-19) pandemic will be visible in these data. Once updated data become available (expected in late 2021) this briefing will provide a useful baseline of Scotland's pre-pandemic business base.
Useful definitions and methodology notes
Data and information used in this paper's analysis focus on private sector enterprises rather than local units (unless otherwise stated).
An enterprise can be thought of as the overall business, made up of all the individual sites or workplaces. It is defined as the smallest combination of legal units (generally based on VAT and/or PAYE records) that has a certain degree of autonomy within an enterprise group. An enterprise may be a sole legal unit.
A local unit (or business site) is an individual site within an enterprise (e.g. a workshop, factory, warehouse, office, mine or depot) situated in a geographically identified place.
Private sector is defined as including the following enterprise types: companies (including building societies), sole proprietors, partnerships, public corporations/ nationalised bodies, and non-profit making bodies and mutual associations. Central and local government are excluded from the analysis. However, it is worth noting, if included then central and local government would represent 5% of business organisations, and provide approximately a fifth of employment in Scotland.
Much of the data analysed in this briefing, unless otherwise stated, comes from the Scottish Government publication 'Businesses in Scotland1'. The following methodological points should be noted when considering the analysis.
Data estimates were constructed using data from the Inter-Departmental Business Register (IDBR), the Annual Population Survey (annual version of the Labour Force Survey (LFS)), the Family Resources Survey(FRS) and Self Assessment(SA) data.
The IDBR provides the number of businesses registered for VAT and/or PAYE in Scotland.
A modeling procedure that combines data from the IDBR with estimates derived from the LFS, FRS and SA data is used to estimate the number of unregistered businesses.
Data estimates include all businesses that operate in Scotland regardless of where the business is based. This differs from UK-wide publications that tend to publish region/country results according to the registered office (base/head-quarter) of a business.
Businesses are counted only once in Scotland-level estimates or once in each of the local authority areas or rural/urban areas they operate in.
Please note, while the data and information sources used in this briefing paper are considered to be true and correct at the date of publication, changes to circumstances after the time of publication may impact on the accuracy of the data, such as annual updates to data sources.
Scottish private sector business base
Scottish business base stock - highest point in the current series
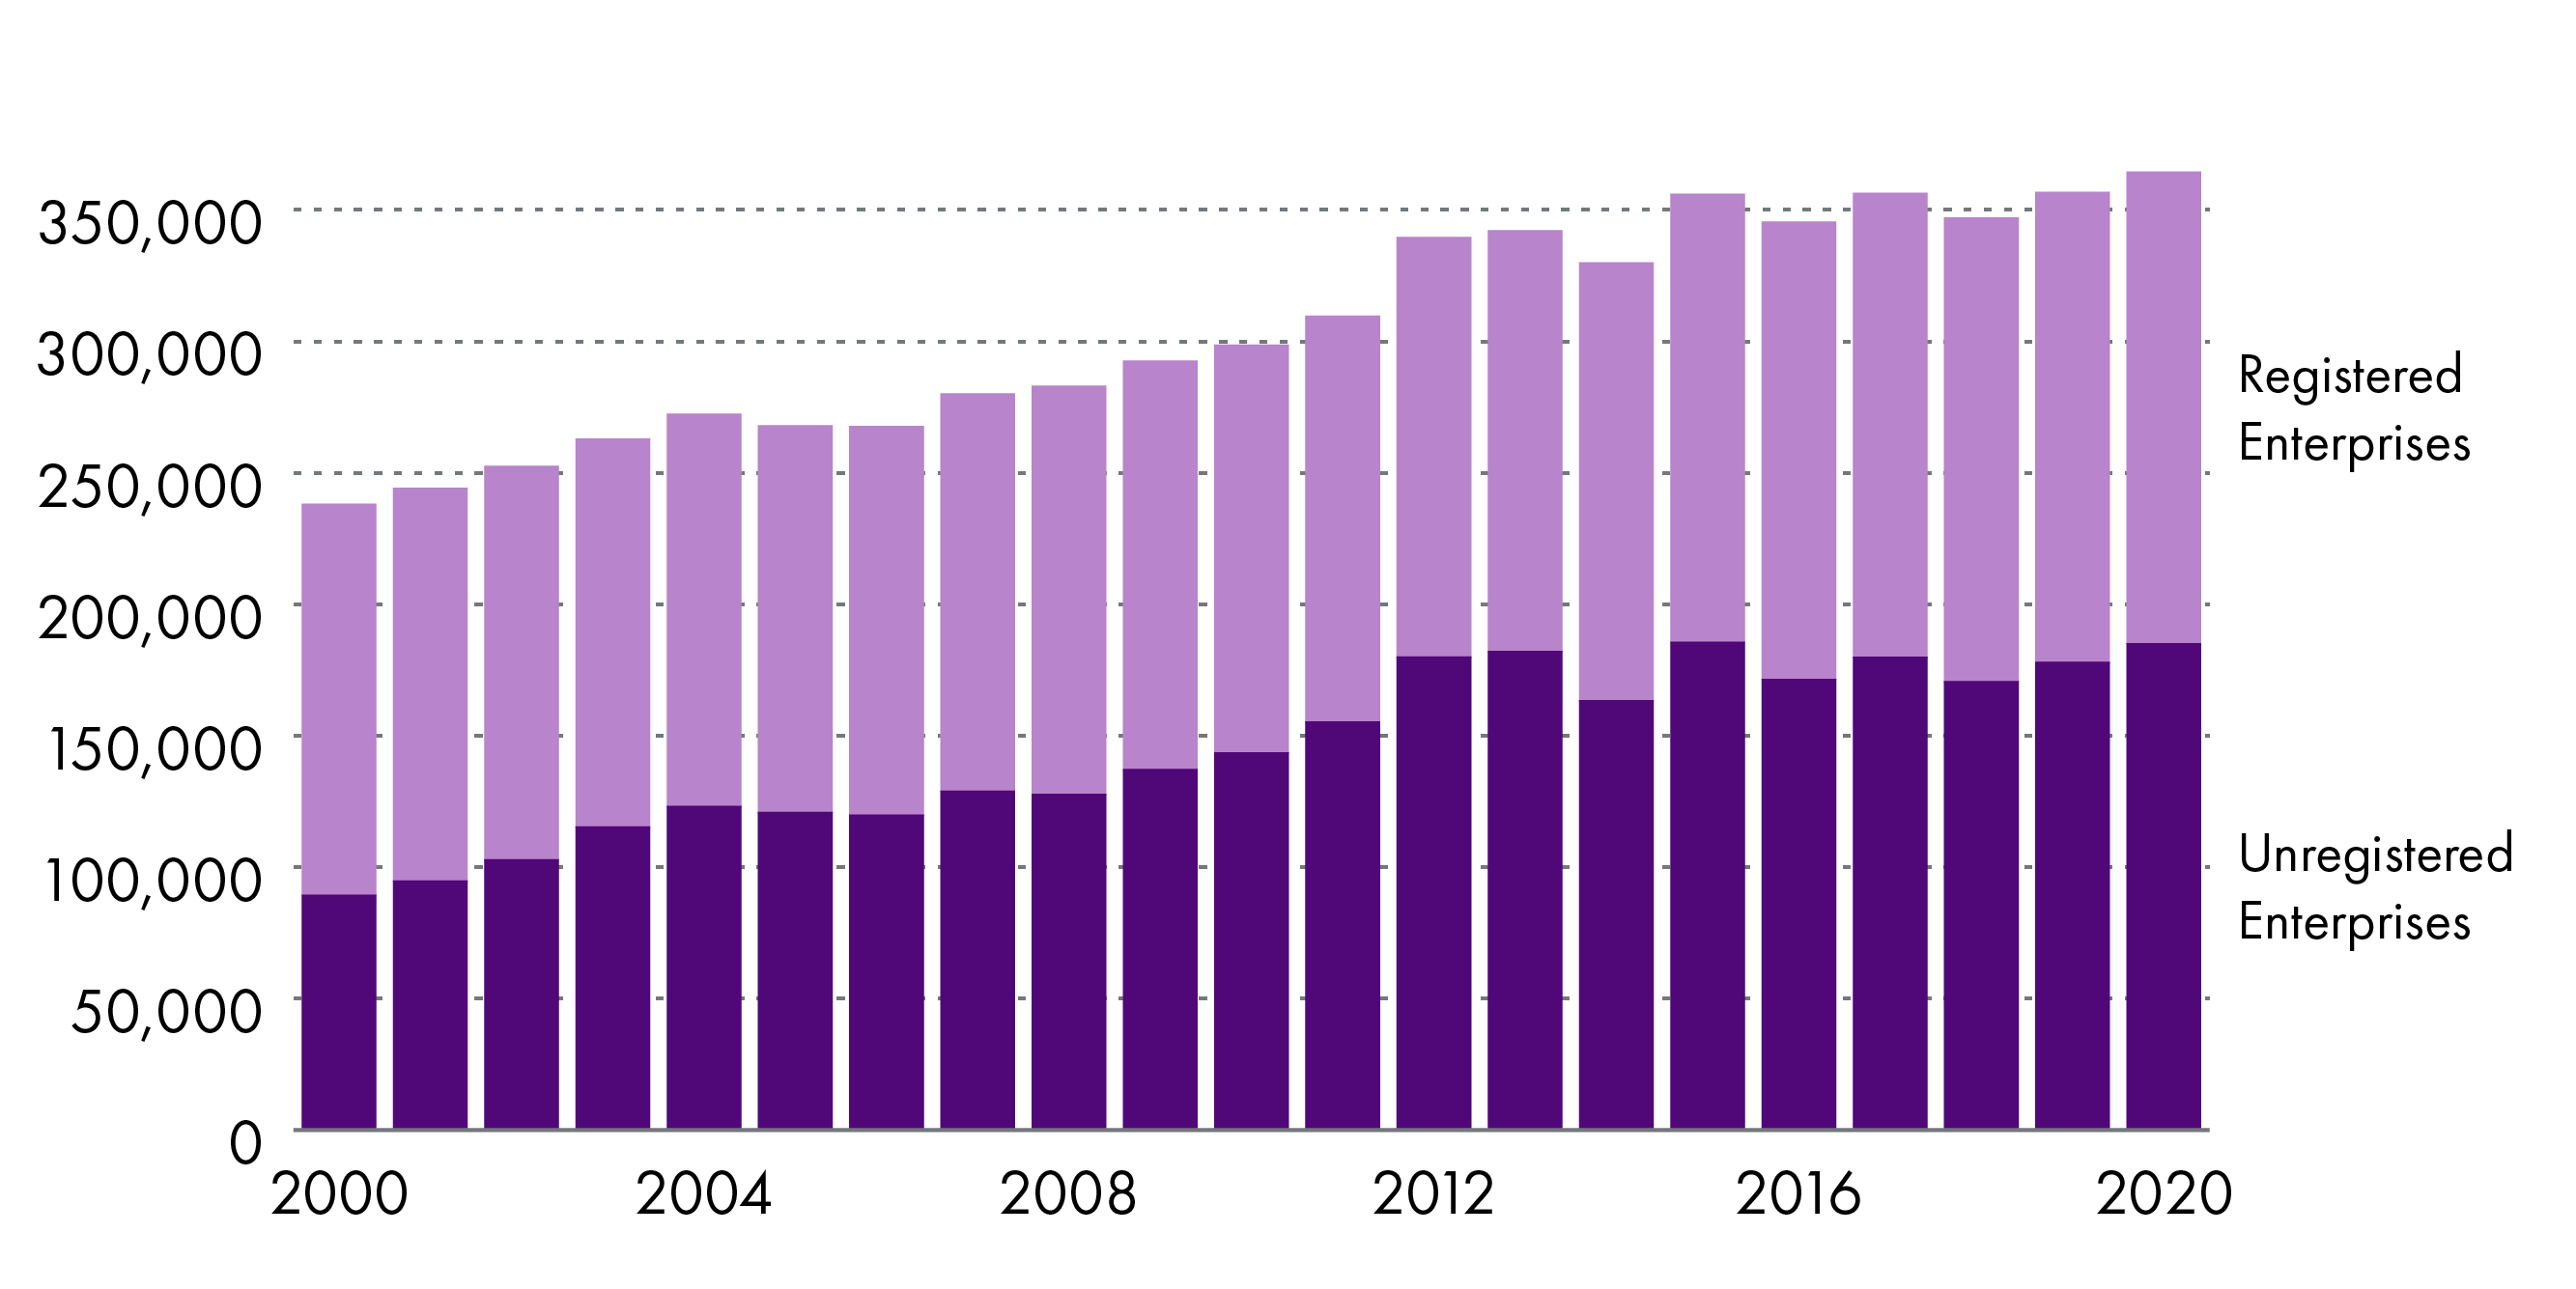
There were 364,310 private sector businesses (data excludes central and local government) operating in Scotland as at March 2020 - an increase of two percent on the previous year and the highest stock figure on record in the series (which goes back to 2000).
Unregistered businesses [these are sole proprietorships and partnerships that are not large enough to be VAT registered, i.e. have an annual turnover below the VAT threshold of£85,000 as at March 2020, and are not PAYE registered, i.e. do not employ others] accounted for approximately 184,850 enterprises (51% of the total). An increase of four percent on the previous year.
The number of VAT/PAYE registered businesses also increased but very marginally with 680 (+0.4%) additional businesses since 2019.
Scottish Government. (2020, November 11). Businesses in Scotland: 2020. Retrieved from https://www.gov.scot/publications/businesses-in-scotland-2020/ [accessed 16 August 2021]
Trends over the last 20 years
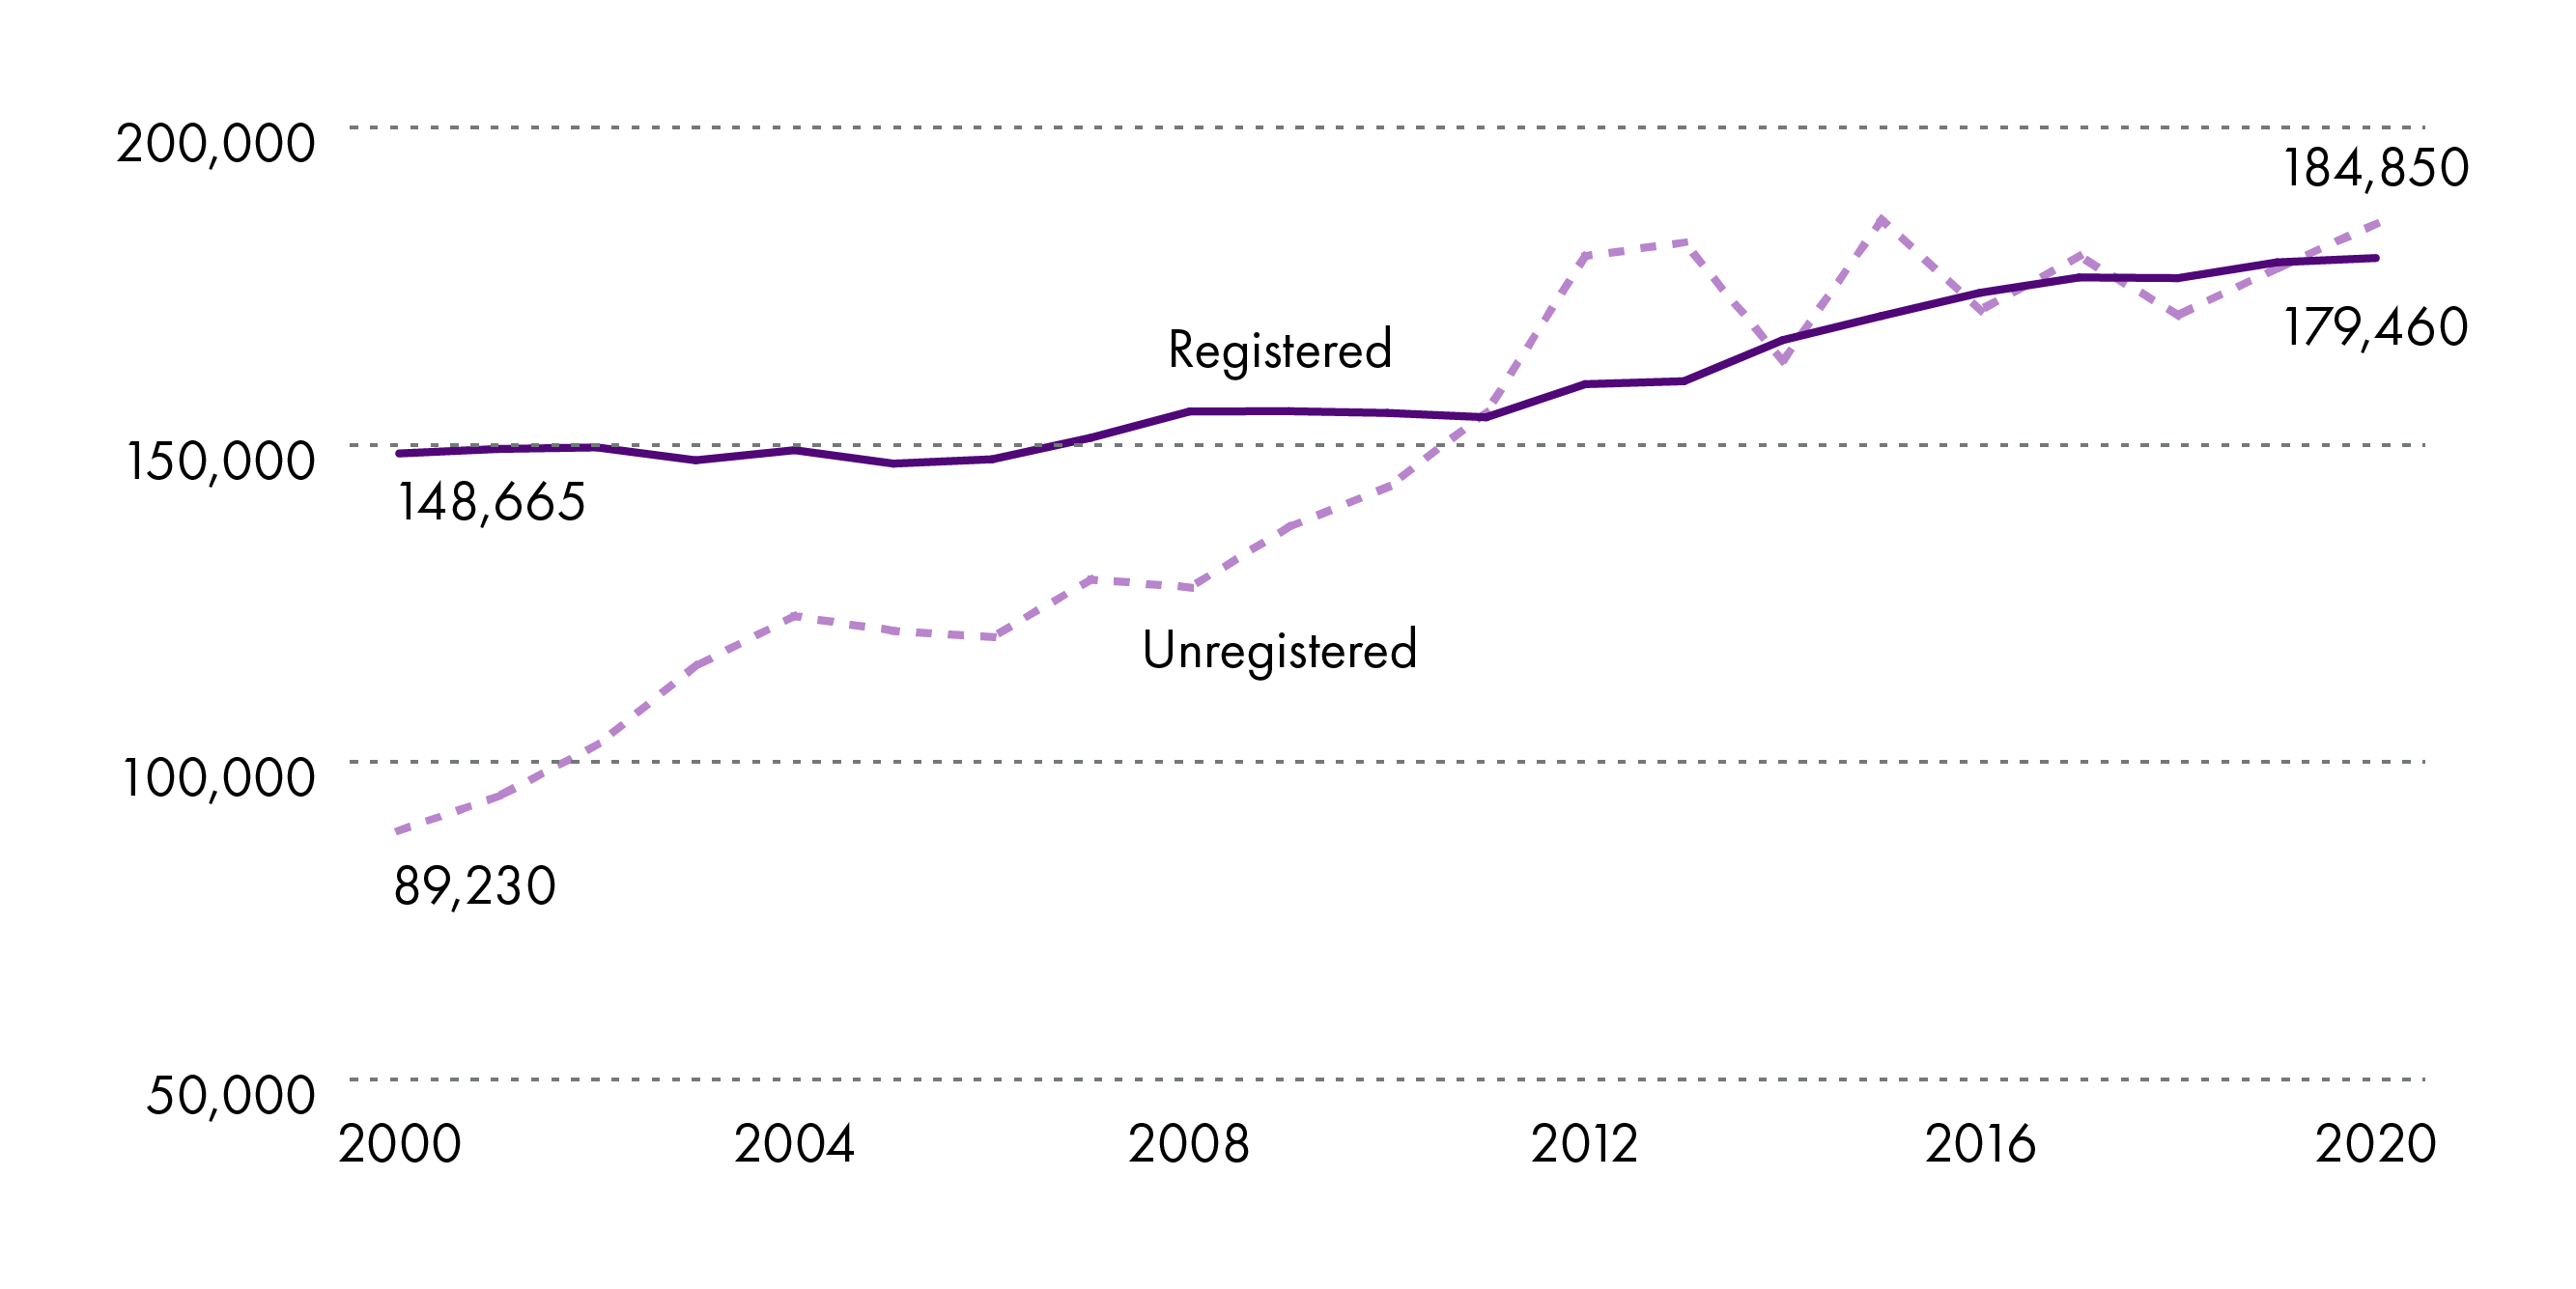
Unregistered and registered enterprises have shown differing growth trends over the last two decades (see Figure 2). The number of unregistered businesses has more than doubled over this time (107% growth), while registered businesses have had a more steady rate of incline over the period (21% growth).
Over 2000 to 2004, unregistered enterprises had a period of sustained growth. In the two years that followed (2005 & 2006) there was a moderate decline in numbers. Over the seven years, 2007 to 2013, there was a general trend of high growth with an additional 50,135 unregistered enterprises created in Scotland . Both 2014 and 2015 saw some erratic trends for unregistered enterprises. The year to 2014 saw a fall of 10% in business stock and in 2015 numbers peaked at 185,470 (an all time high in available data). The most recent five years of data for unregistered enterprises have continued to demonstrate a sporadic performance, albeit 2018 to 2020 has shown some steady growth.
The number of registered enterprises remained relatively stable over the years 2000 to 2006 (averaging 148,000). This was followed by a period of moderate growth between 2007 and 2010. There was a minor dip in numbers in the year to 2011 (decrease of 700 enterprises). There has been consistent moderate growth, over the most recent nine year period (2012 to 2020), with an additional 19,880 registered enterprises in Scotland.
Scottish Government. (2020, November 11). Businesses in Scotland: 2020. Retrieved from https://www.gov.scot/publications/businesses-in-scotland-2020/ [accessed 16 August 2021]
Business base performance relative to the UK
To ensure a like for like comparison, the data used in this section comes from the BEIS Business Population estimates 20201. This is because the methodology used in the Scottish Government statistics is different, in particular:
It includes all businesses that operate in Scotland regardless of where the business is based. This differs from UK-wide publications that tend to publish region/country results according to the registered office (base/head-quarter) of a business. The Businesses in Scotland publication goes wider than this by providing statistics on all businesses operating in Scotland, those based/head-quartered in Scotland and also all other businesses with a presence in Scotland.
In 2020, Scotland represented 6.2% of the UK's total private sector business base of 5.98 million enterprises (registered and unregistered).
This represented an under-performance relative to Scotland's UK population (16+) share of 8.4%.
However, the most recent data show that for the UK as a whole, the total number of private sector businesses increased by 2% between the start of 2019 and start of 2020. This compares to an increase of 11% for Scotland over the same period.
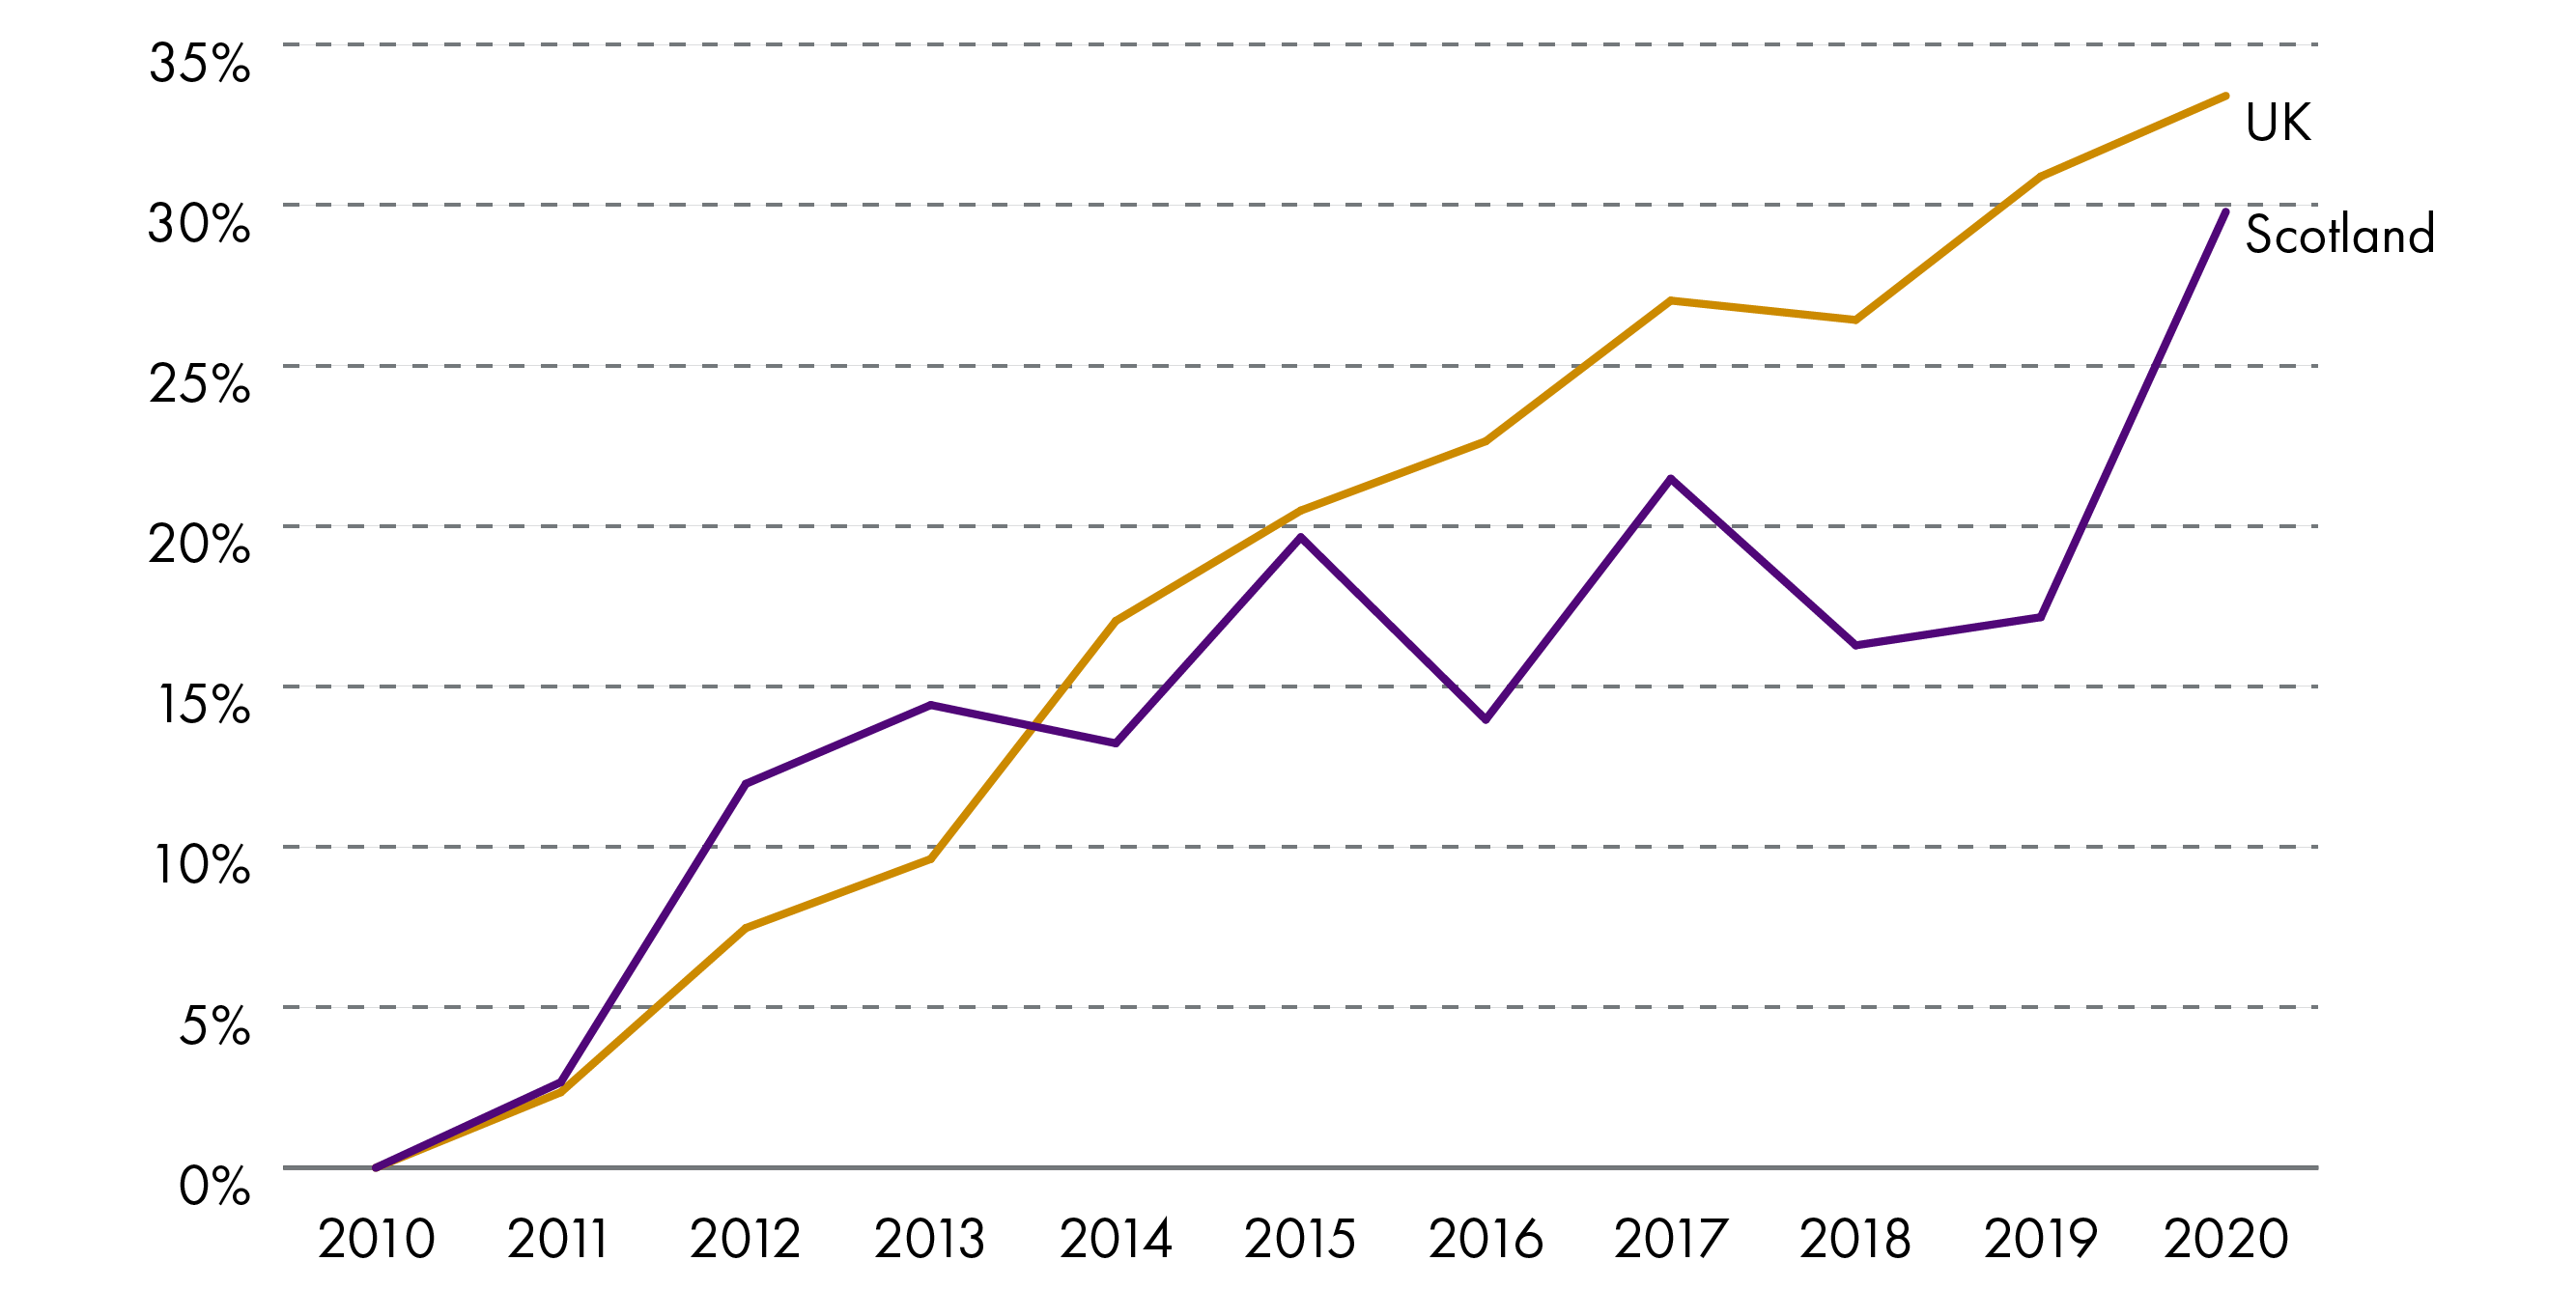
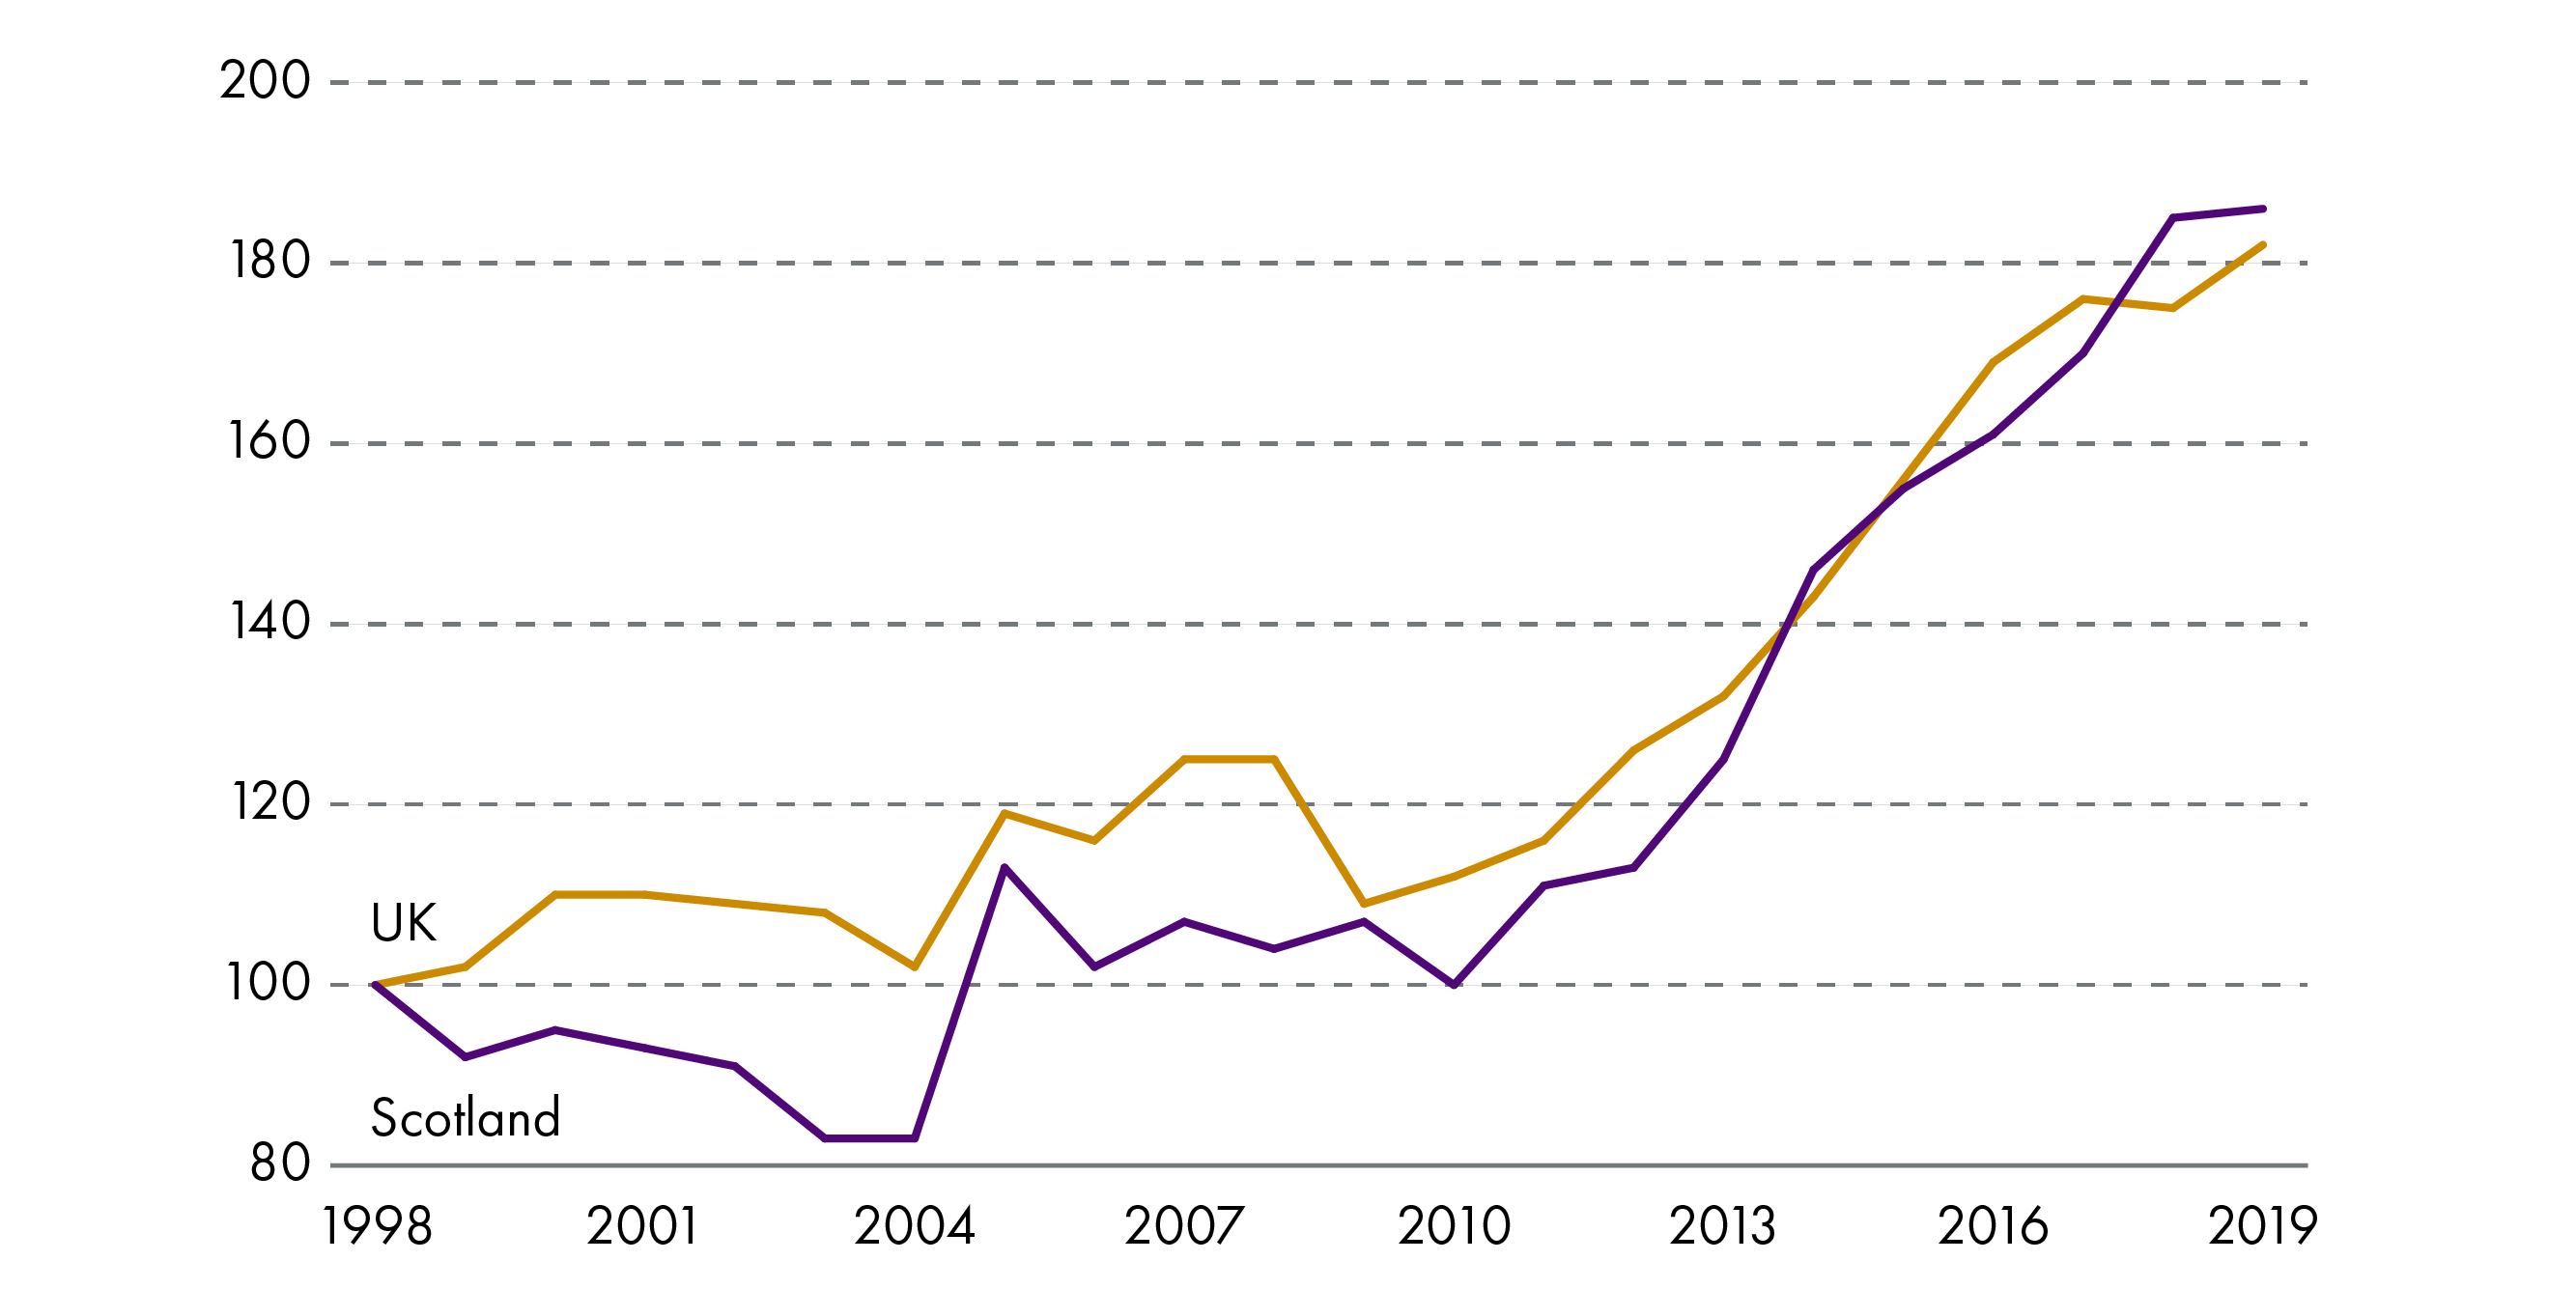
Since 2010 (see Figure 3) the UK's private sector business base has grown steadily, albeit with a period of stagnation in 2018. In comparison, trends in the Scottish private sector business base have been much more sporadic. In both 2010 and 2011, Scotland out performed the UK. However, this was followed by six years (2013-2018) of fits-and-starts of growth followed by decline. The two most recent years (2019 and 2020) show a significant upward growth trend, with the gap in the indexed growth rate between Scotland and UK narrowing markedly. However, it remains to be seen how COVID-19 will impact these trends.
Department for Business, Energy & Industrial Strategy (BEIS), UK Government . (2020, October 8). Business population estimates 2020. Retrieved from https://www.gov.uk/government/statistics/business-population-estimates-2020 [accessed 16 August 2021]
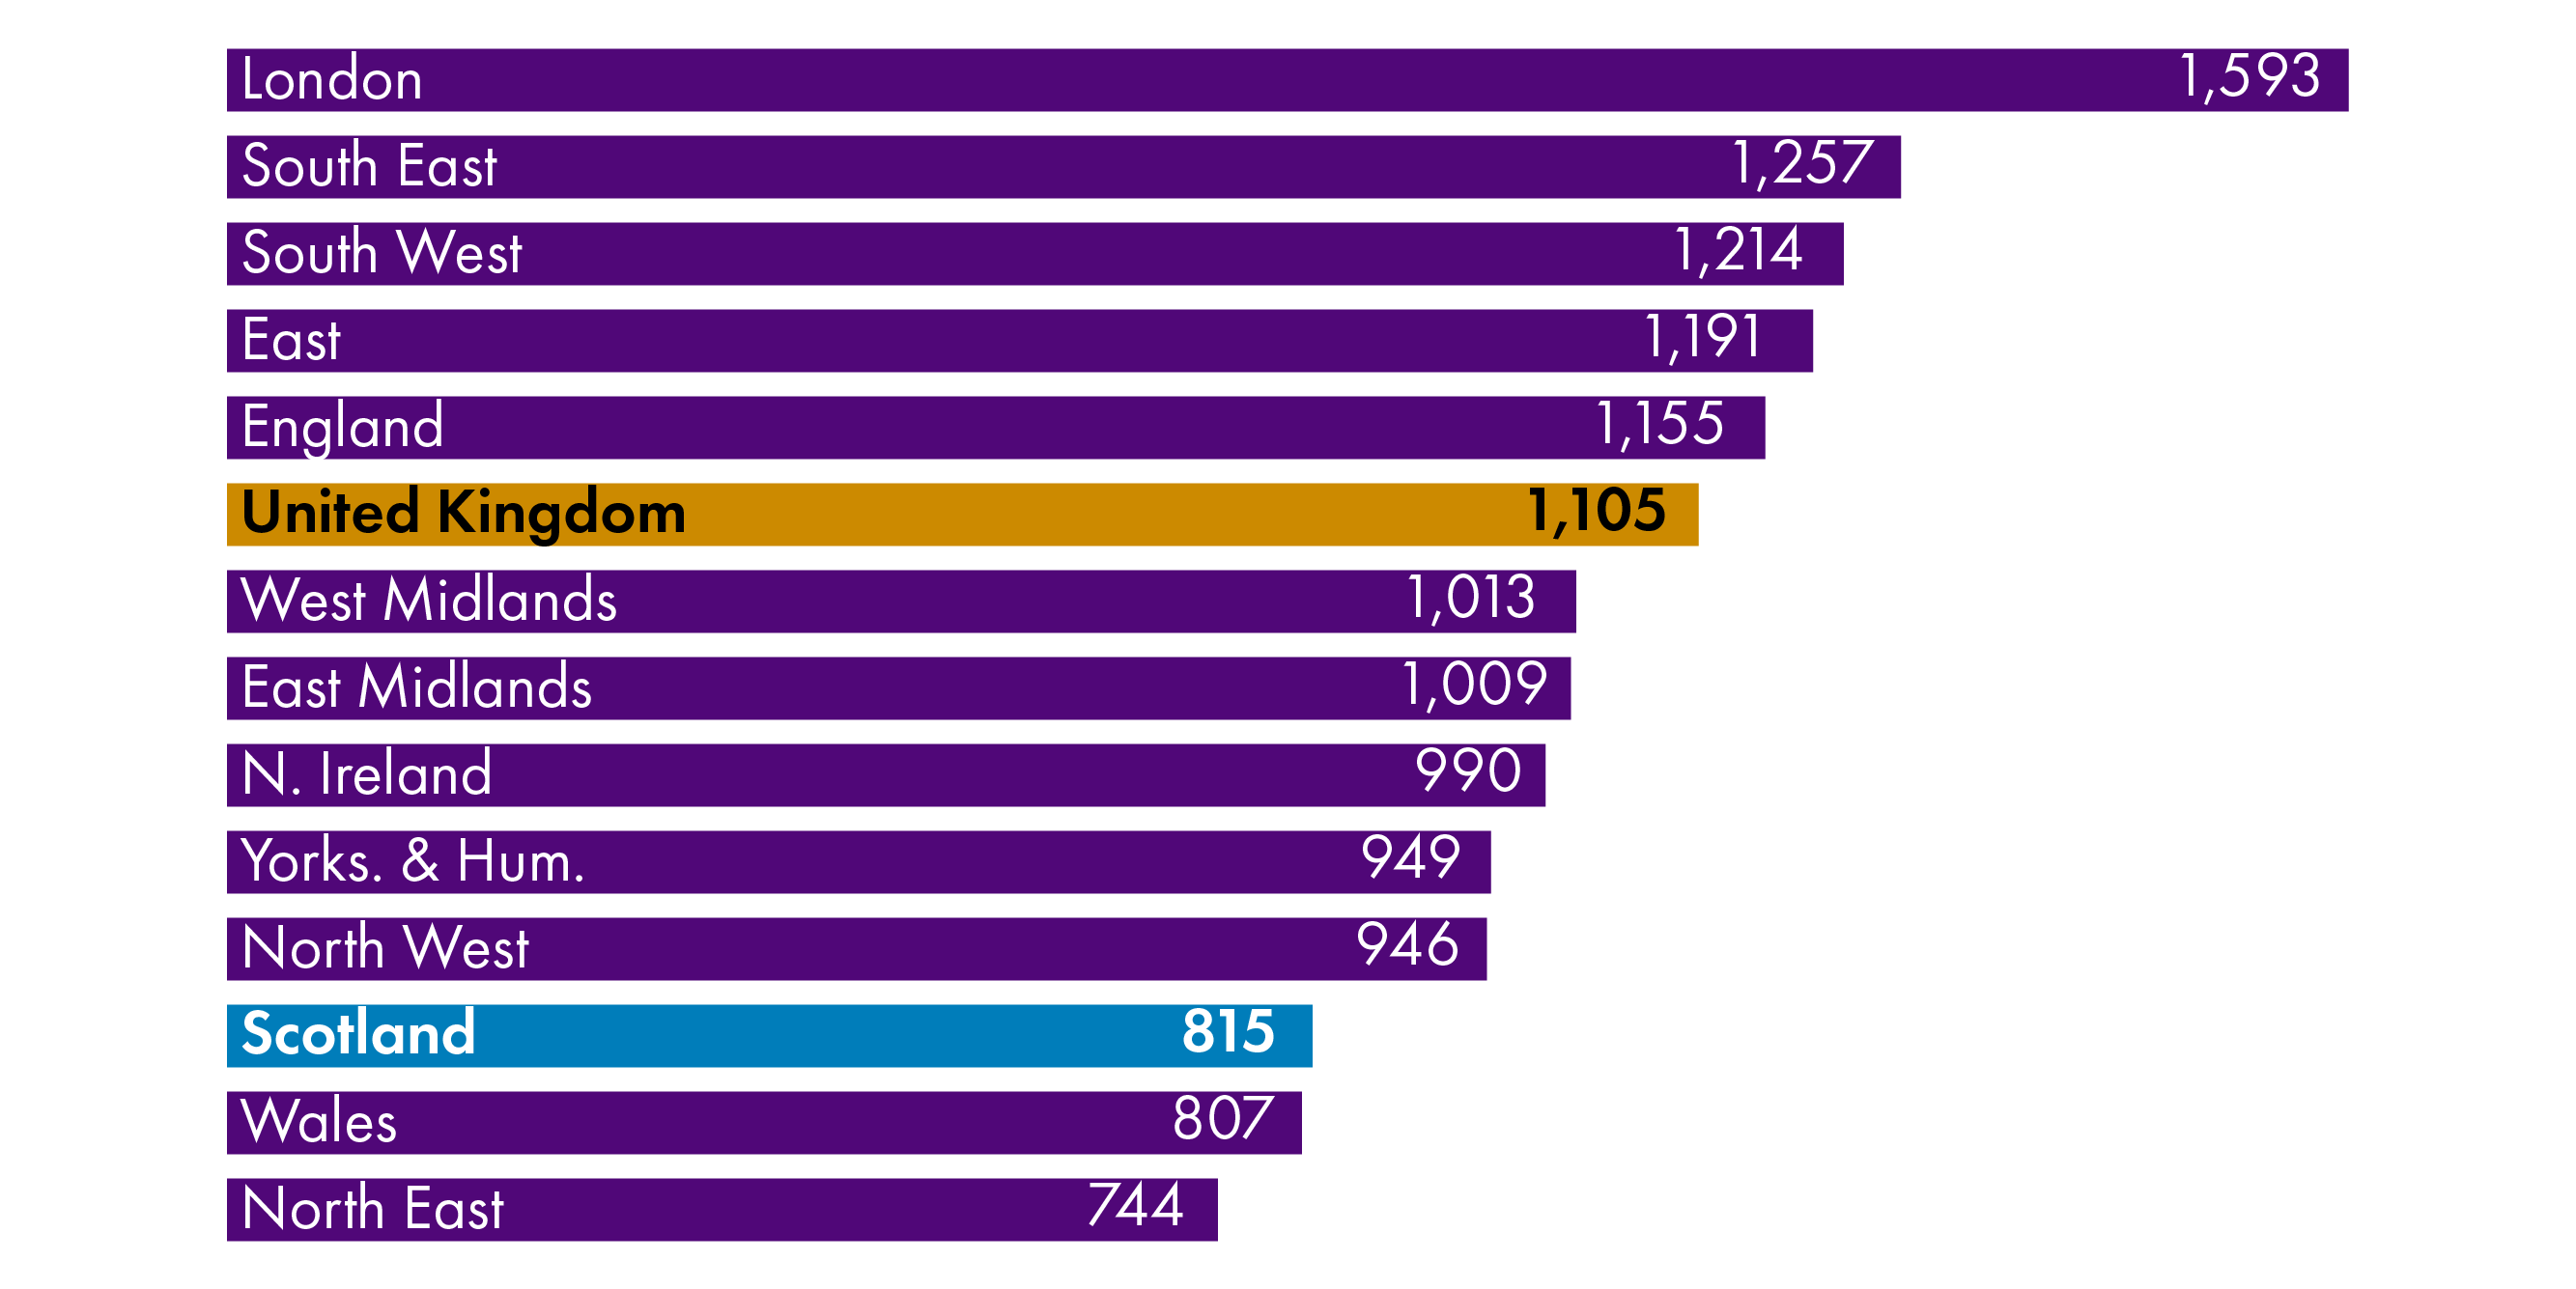
Scotland has a comparatively low business density rate relative to the UK average and other regions of the UK (see Figure 4). The number of businesses in Scotland per 10,000 resident adults was 815 in 2020. This was significantly below the business density rates in London, South East, South West, and East (of England). The North East and Wales were the only areas with a business density rate lower than Scotland.
Department for Business, Energy & Industrial Strategy (BEIS), UK Government . (2020, October 8). Business population estimates 2020. Retrieved from https://www.gov.uk/government/statistics/business-population-estimates-2020 [accessed 16 August 2021]
Business base by sector
Sector overview
As at March 2020, the two largest industry sectors, in terms of enterprise numbers, were ‘Professional, Scientific & Technical Activities’ (48,030 enterprises) and Construction (47,715 enterprises). Together, these sectors made up 26% of all private sector enterprises in Scotland's economy.
| Total | % of total | % change 2010-2020 | % change 2019-2020 | |
|---|---|---|---|---|
| Agriculture, Forestry and Fishing | 18,430 | 5% | -8% | 0% |
| Mining and quarrying, utilities | 5,200 | 1% | 188% | 23% |
| Manufacturing | 19,895 | 5% | 43% | 13% |
| Construction | 47,715 | 13% | 0% | -7% |
| Motor trade incl. vehicle repairs | 8,040 | 2% | 36% | 30% |
| Wholesale trade | 6,825 | 2% | -14% | -10% |
| Retail trade incl. fuel sales | 20,160 | 6% | -2% | 2% |
| Transportation and storage | 19,130 | 5% | -12% | -13% |
| Accommodation and food service activities | 19,865 | 5% | 16% | 2% |
| Information and communication | 18,665 | 5% | 63% | 8% |
| Financial and insurance activities | 3,230 | 1% | 19% | -24% |
| Real estate activities | 6,555 | 2% | 26% | -3% |
| Professional, scientific and technical activities | 48,030 | 13% | 34% | -6% |
| Administrative and support service activities | 28,620 | 8% | 57% | 1% |
| Education | 16,040 | 4% | 37% | 11% |
| Human health and social work activities | 23,335 | 6% | 3% | -7% |
| Arts, entertainment and recreation | 20,940 | 6% | 55% | 31% |
| Other service activities | 33,640 | 9% | 65% | 27% |
| Total | 364,310 | 100% | 22% | 2% |
Scottish Government. (2020, November 11). Businesses in Scotland: 2020. Retrieved from https://www.gov.scot/publications/businesses-in-scotland-2020/ [accessed 16 August 2021]Note: Figures rounded to the nearest five. Totals may not equal the sum of the constituent parts due to rounding.
In total, over the year to 2020, the number of enterprises in Scotland increased by 2%. However, relative performance by broad industry sector was more mixed.
The 'other service activities' sector demonstrated the largest growth in enterprise numbers in the year to 2020, growing from 26,480 to 33,640 (27%). 'Other services' includes areas like hairdressing and beauty treatments. Other notable sectors for growth were 'arts, entertainment and recreation' at 31% (+4,970 enterprises) and 'manufacturing' at 13% (+2,365 enterprises).
In the year to 2020 both the 'construction' and 'professional, scientific and technical activities' sectors witnessed the largest decline in absolute terms, at -3,795 and -3,295 respectively. 'Financial and insurance activities', 'transport and storage' also had noteworthy decreases in percentage terms, with falls of 24% and 13% respectively.
Looking at the ten year growth trends by sector, in Table 1, the majority of sectors have grown. Only 'construction' was at the same level of business stock in 2010 and 2020, and four sectors have a decreased business base (wholesale trade -14%, transport and storage -12%, agriculture food and forestry -8%, and retail trade -2%).
Sector changes over time
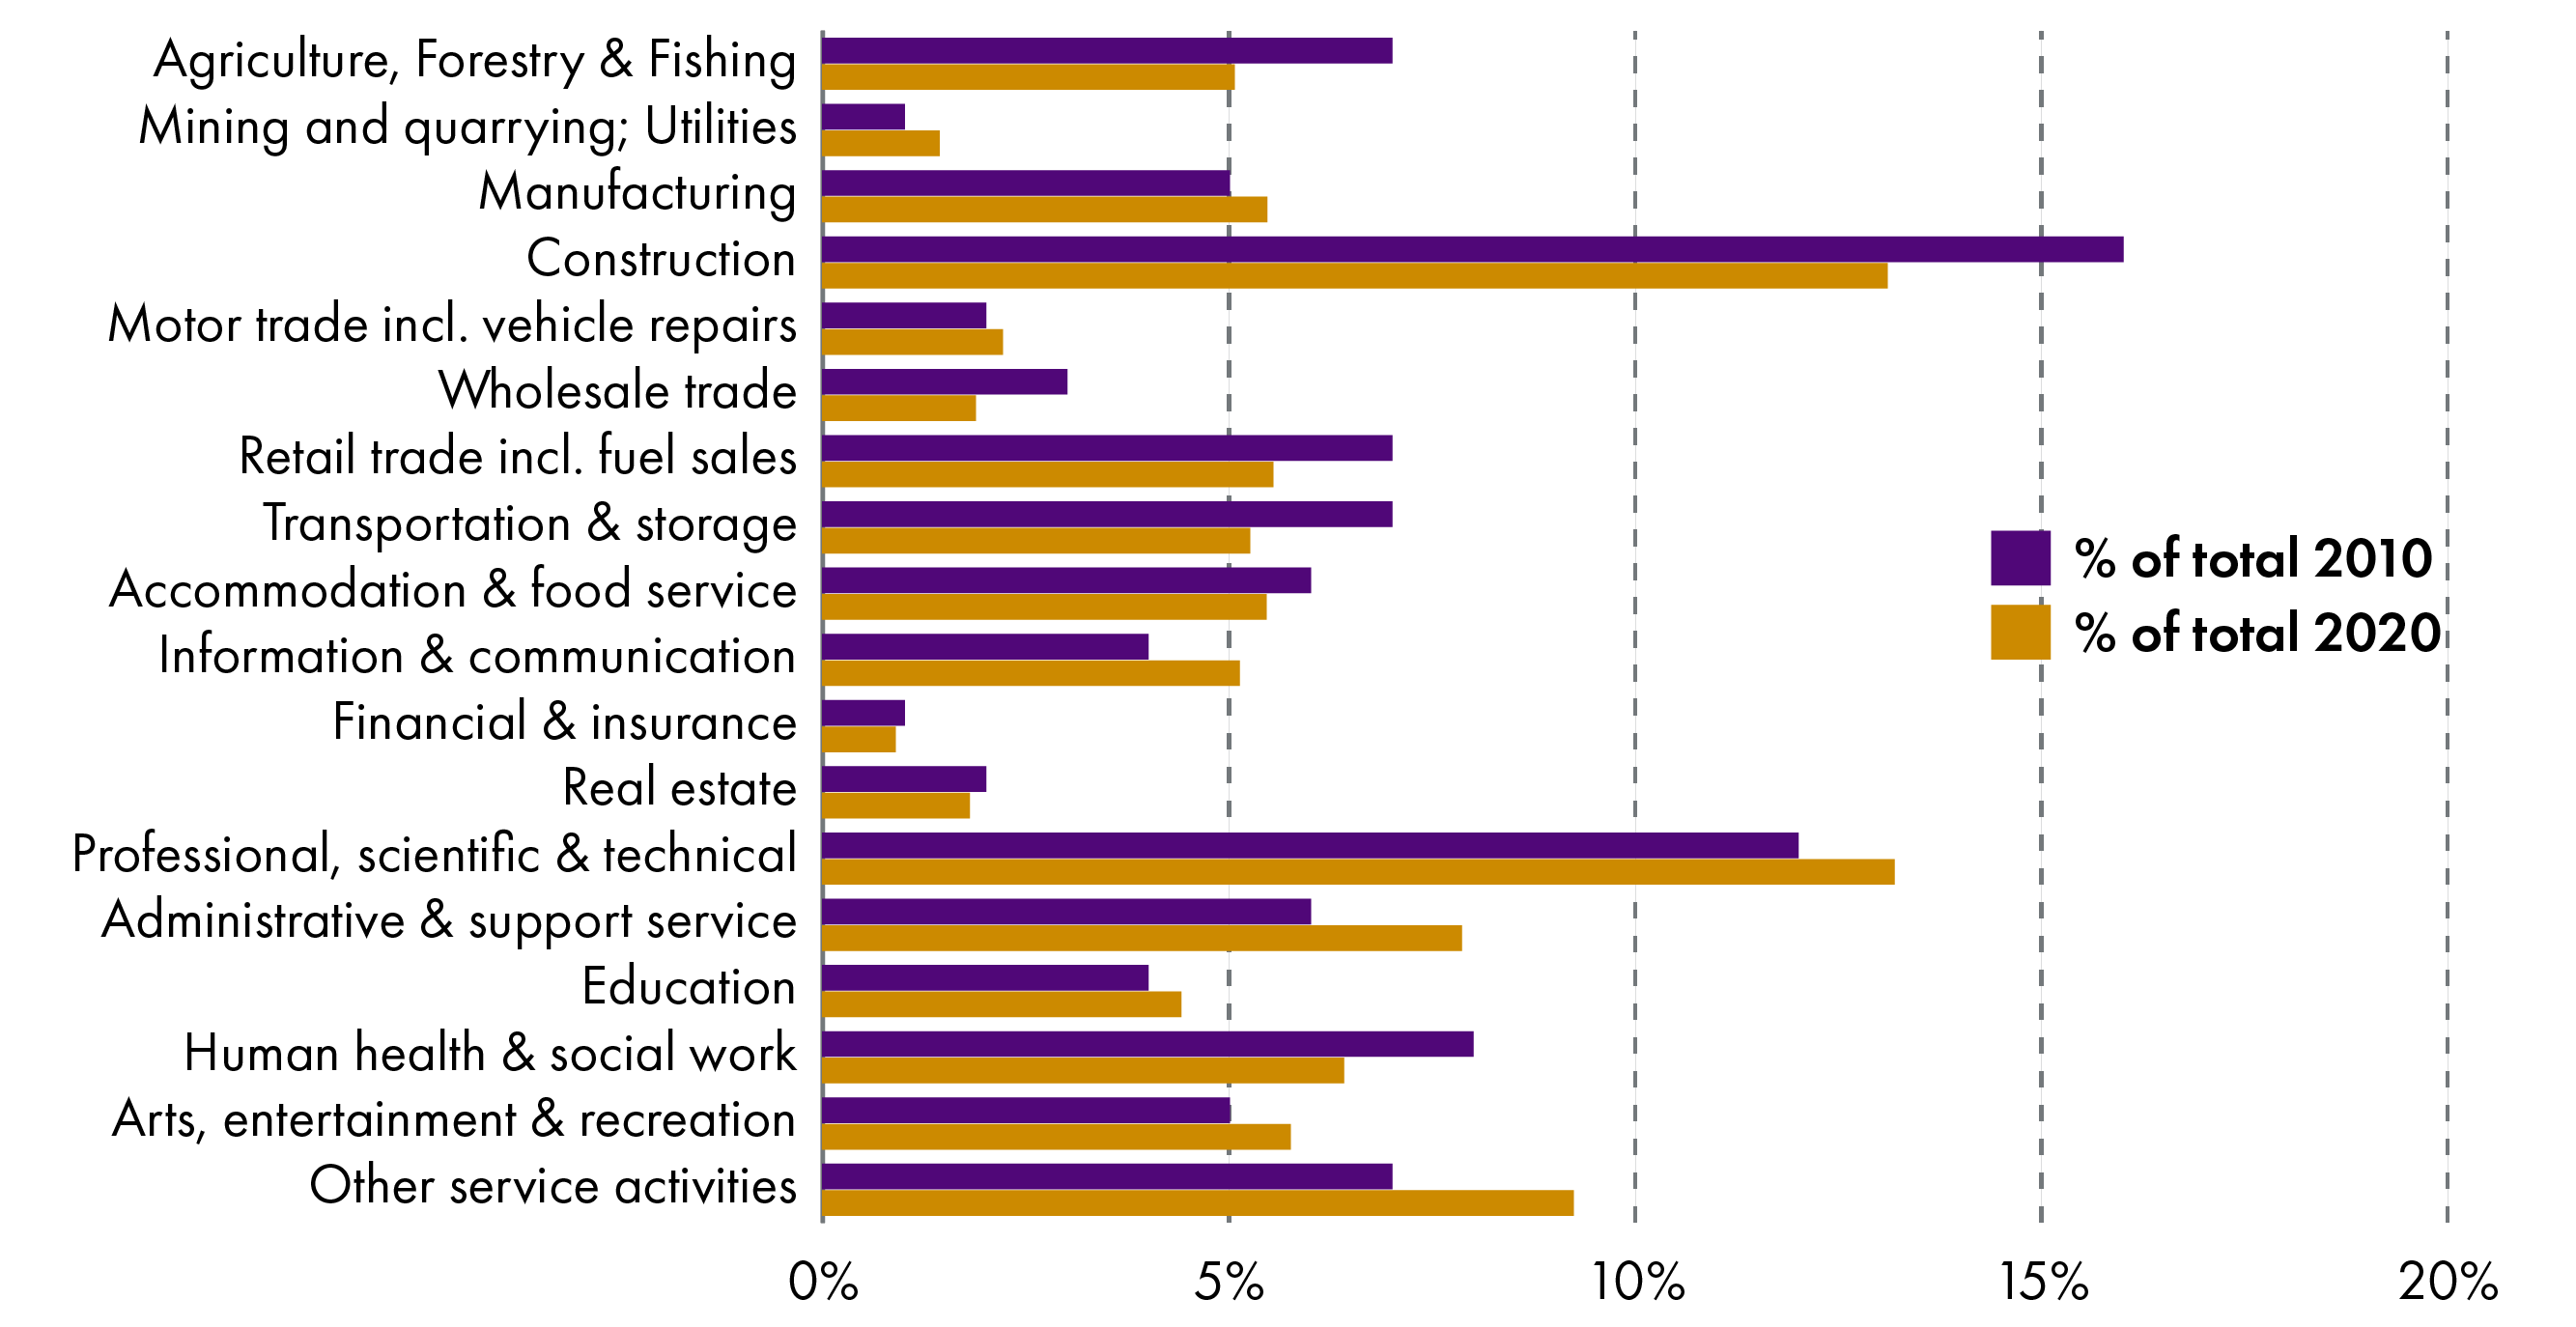
Figure 5 shows the sector structure of the private sector business base in both 2010 and 2020. It demonstrates that the structure of the economy's business base is moving towards service orientated activities, reflecting global trends in developed economies. There have been subtle changes in the structure of the economy:
agriculture, forestry & fishing has steadily declined from 7% of businesses in 2010 to just 5% in 2020 (it made up 11% of businesses in 2000)
the proportion of manufacturing firms in the economy has held constant (increasing very marginally)
construction, while still one of the largest sectors, has decreased slightly from 16% of the total stock in 2010 to 13% in 2020
service activities make up an increased proportion of the economy, including 'arts, entertainment, and recreation', 'other service activities', 'administration and support', and 'professional, scientific, and technical'.
Scottish Government. (2020, November 11). Businesses in Scotland: 2020. Retrieved from https://www.gov.scot/publications/businesses-in-scotland-2020/ [accessed 16 August 2021]
Sector intensity
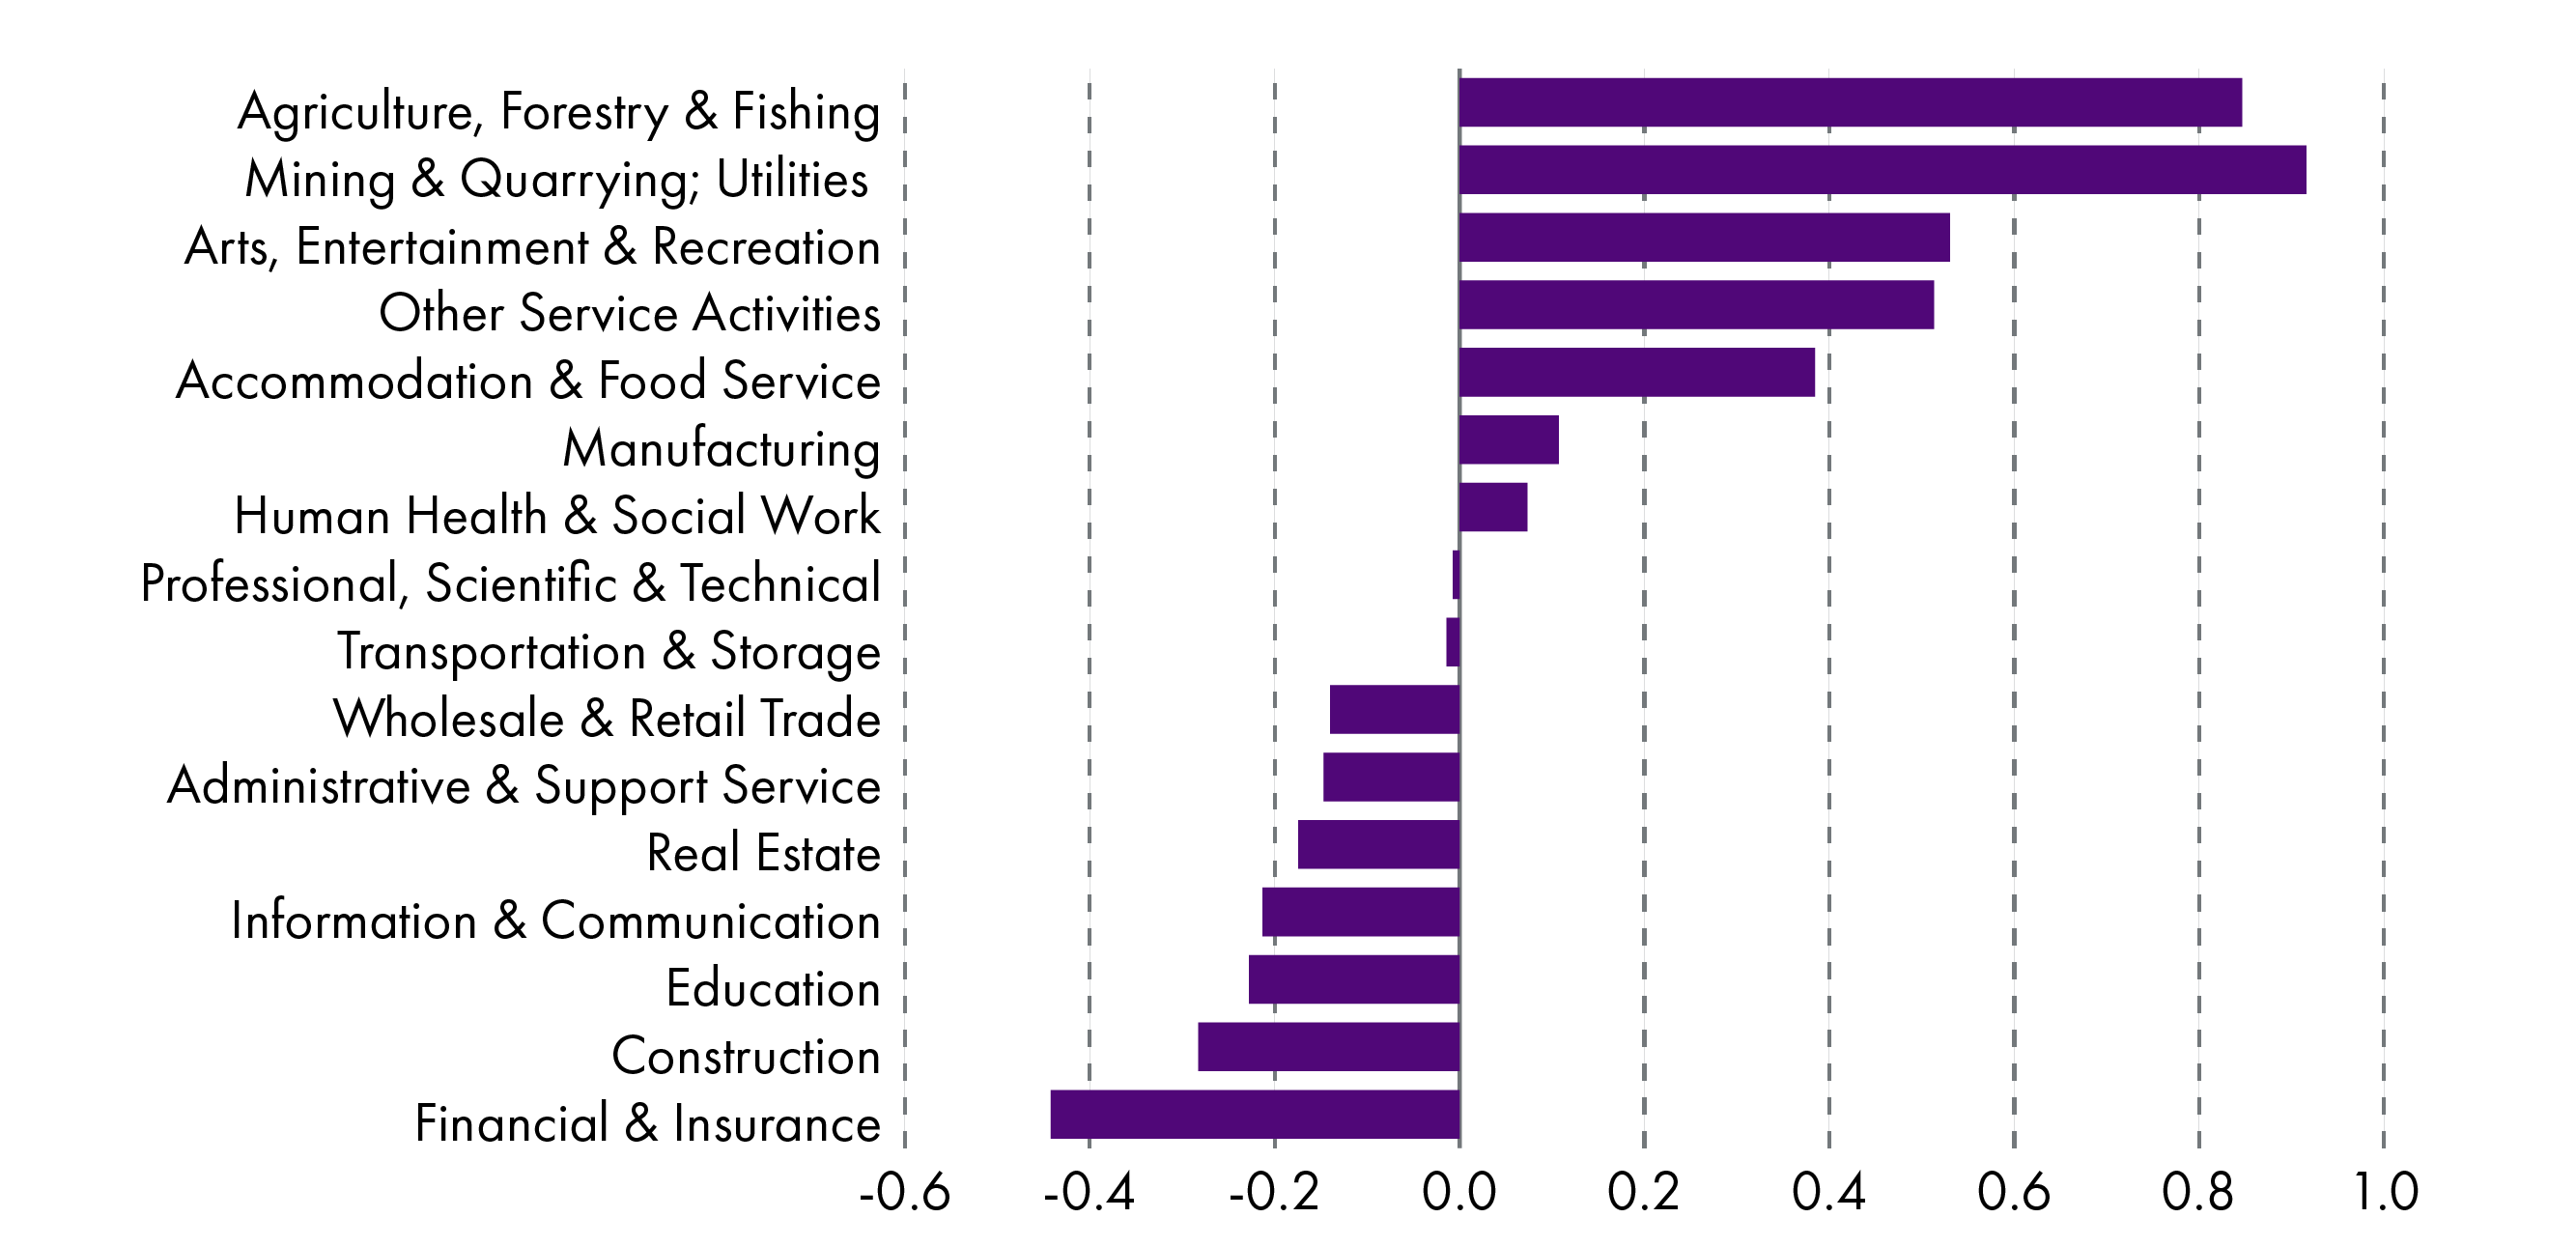
Figure 6 quantifies how concentrated a particular industry is in Scotland, as compared to the UK average as a whole. It reveals what makes the Scottish economy “unique” in comparison to the UK. A score greater than zero indicates specialisation in a sector (the higher the score the greater the level of specialisation) and a negative score shows a lower intensity of a sector in Scotland relative to the UK.
Scotland had a high specialisation and intensity in 'mining, quarrying, utilities' reflecting the oil and gas industry in the North East. Although the dominance of this sector has declined in recent years, for example in 2016 it had an intensity score of 1.8 compared to 0.9 in 2020.
Scotland's economy also had a high specialisation in 'agriculture, forestry, & fishing' relative to the UK, which is to be expected given Scotland's landscape characteristics.
Other areas of intensity, though more minor in the extent of the specialisation, were 'accommodation & food serving activities', 'arts, entertainment, and recreation', 'manufacturing', and 'other service activities'.
There were four sectors, in particular (greater than -0.2), that were relatively less intense in Scotland's business base compared to the UK economy. These were 'financial & insurance', 'construction', 'education', and 'information & communication'.
Department for Business, Energy & Industrial Strategy (BEIS), UK Government . (2020, October 8). Business population estimates 2020. Retrieved from https://www.gov.uk/government/statistics/business-population-estimates-2020 [accessed 16 August 2021]
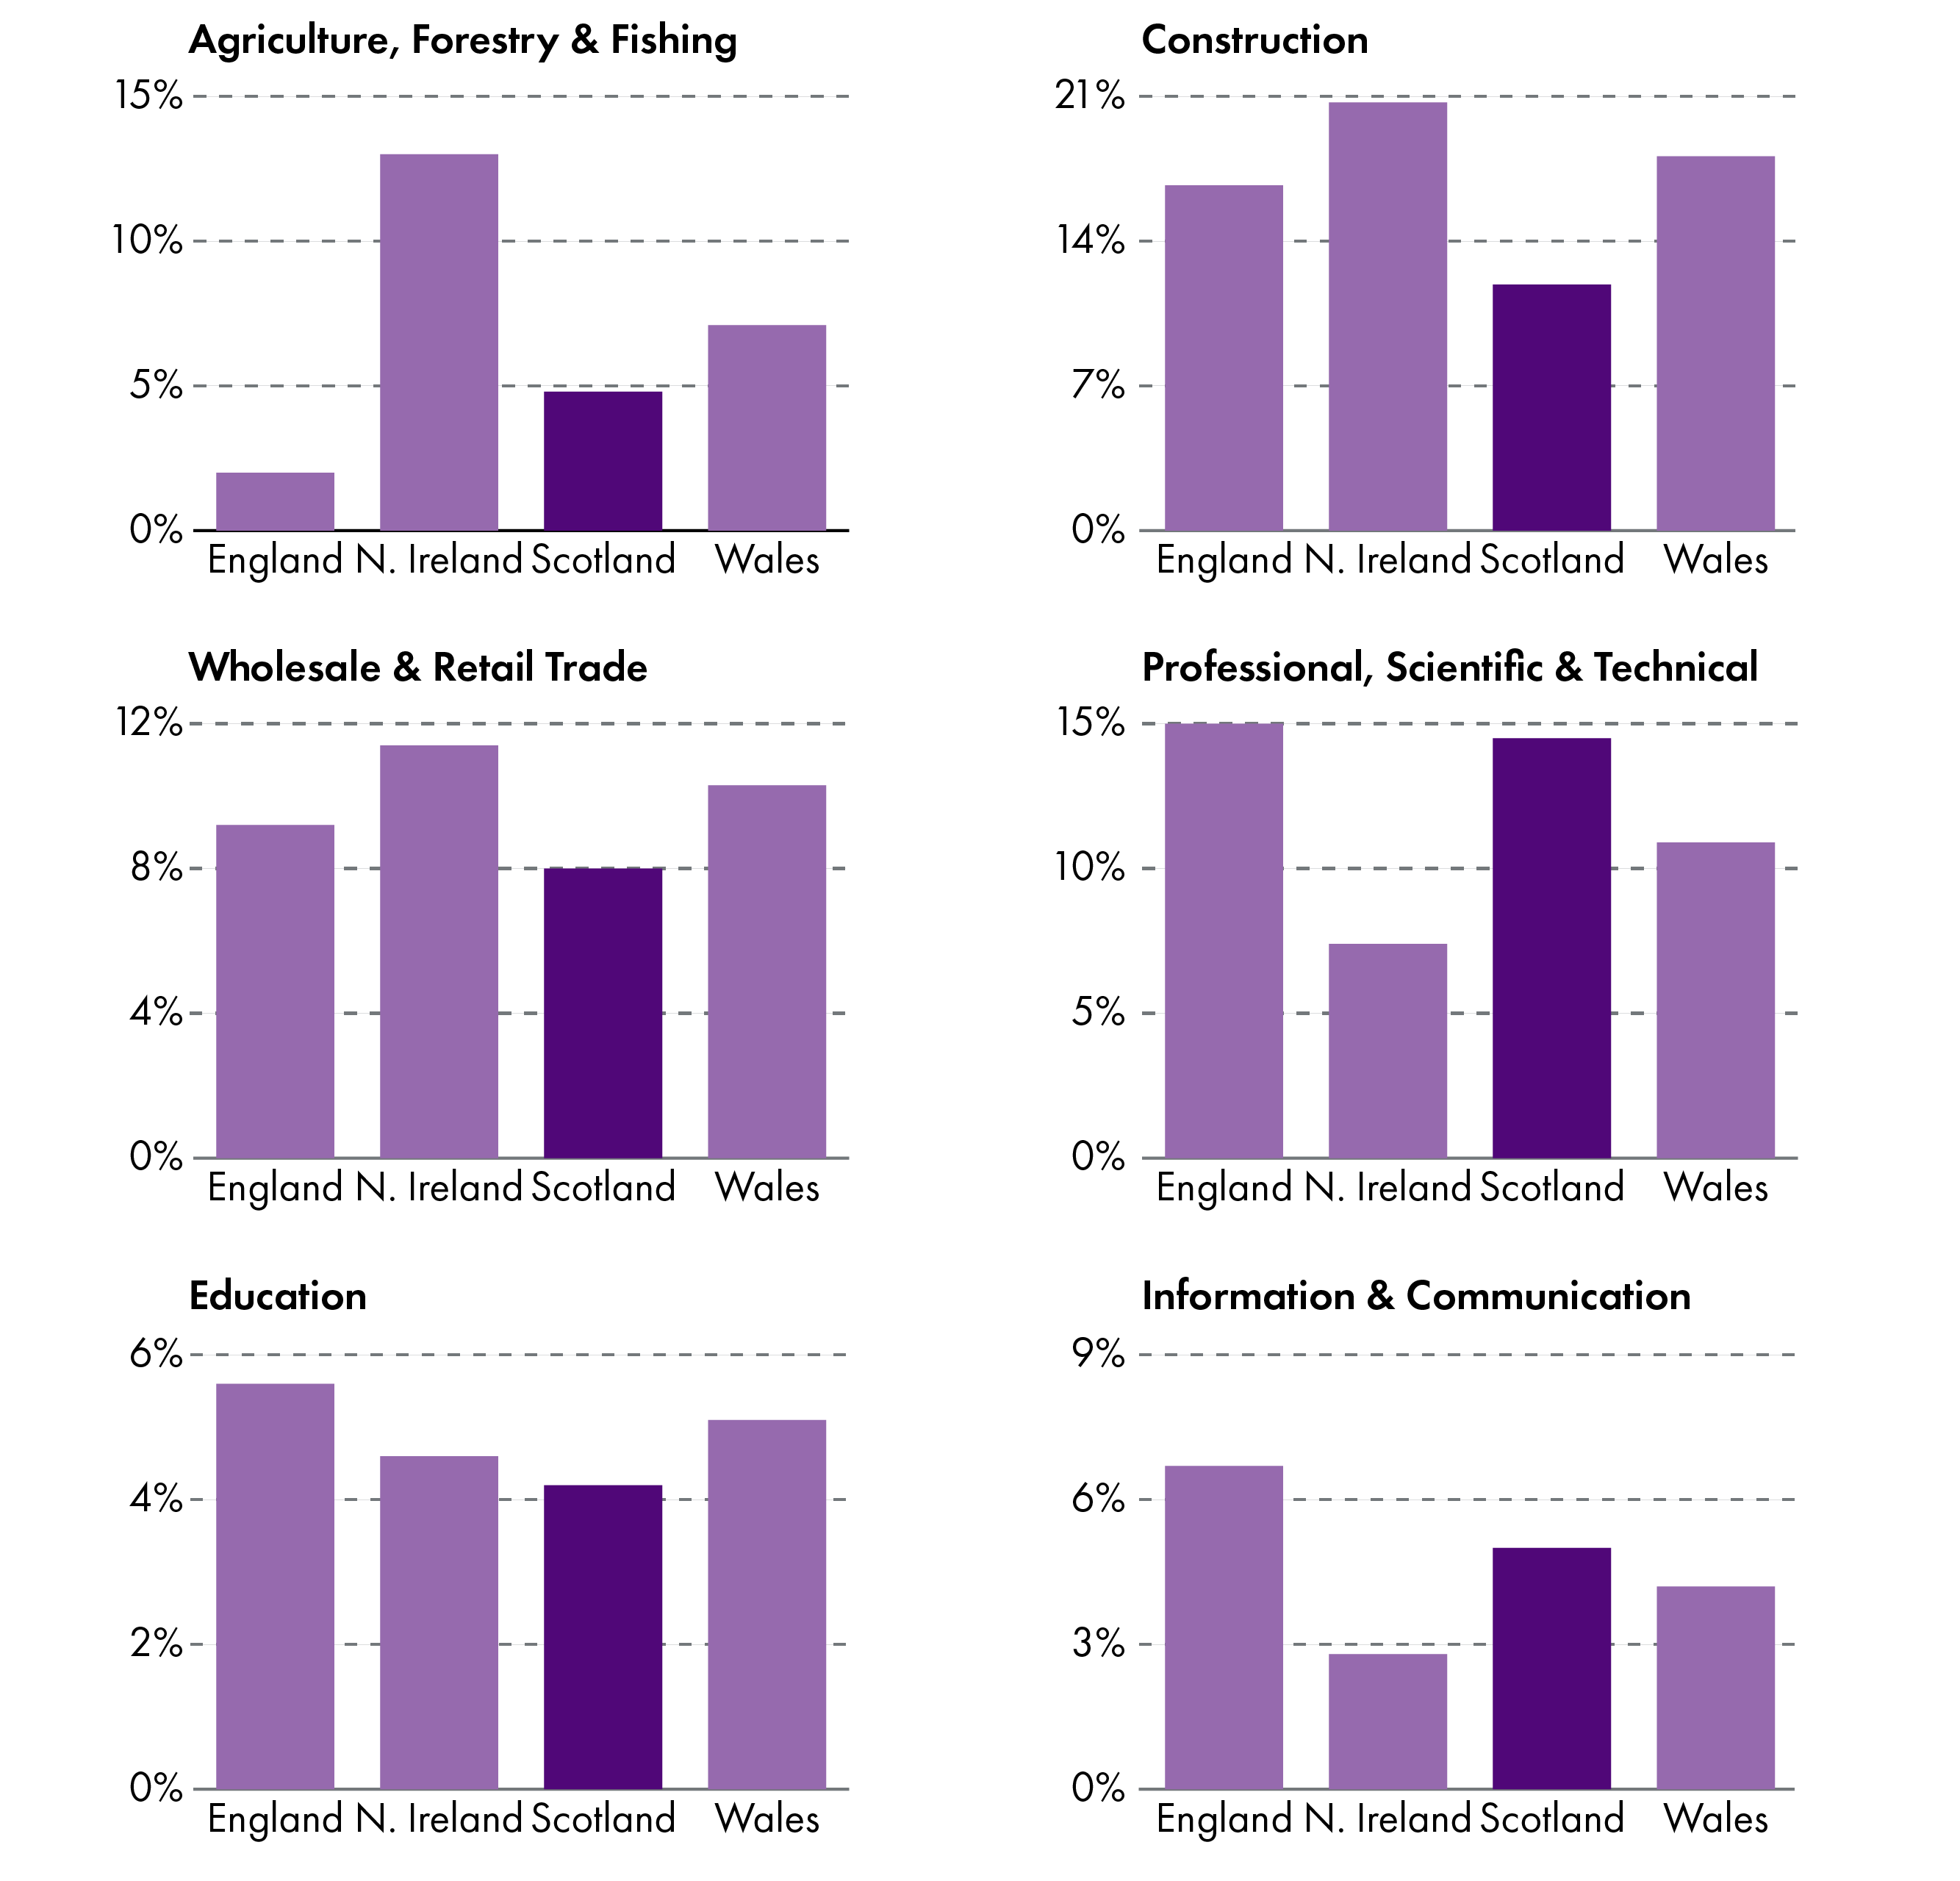
Figure 7 shows the business make up of selected sectors in the nations of the UK.
The high proportion of 'professional, scientific, and technical activities' in Scotland's business stock is clear.
Also notable is that despite the high specialisation in 'agriculture, forestry, & fishing' relative to the UK average, the proportion of 'agriculture, forestry, & fishing' in Scotland is lower than Northern Ireland and Wales.
Across the nations of the UK, Scotland has the lowest proportion of 'construction', 'wholesale and retail trade', and 'education' business stock.
Department for Business, Energy & Industrial Strategy (BEIS), UK Government . (2020, October 8). Business population estimates 2020. Retrieved from https://www.gov.uk/government/statistics/business-population-estimates-2020 [accessed 16 August 2021]Analysis based on BEIS statistics meaning sector proportions might not match sector proportions elsewhere in this briefing using Scottish Government statistics.
Growth sectors
Scotland's Economic Strategy, published in 2015, according to the Scottish Government, sets out a framework which establishes an economic environment that provides an opportunity for all companies - large or small, Scottish or international, new or old, or social enterprises - to be successful. It should be noted, at the time of writing, that a new economic strategy for Scotland was in development and is due to be published before the end of 2021.
The 2015 Strategy recognises that certain sectors of the economy offer particular opportunities for growth - in all or part of that sector - due to existing comparative advantages or through the potential to capitalise on Scotland's unique natural assets. These are sectors where Scotland typically has distinctive capabilities and businesses with the potential to be internationally successful. The Strategy identifies six growth sectors:
food &drink (including agriculture & fisheries)
creative industries (including digital)
sustainable tourism
energy (including renewables)
financial & business services
life sciences.
Growth sector contribution to business base
In 2020, there were 81,650 growth sector businesses in Scotland (registered enterprises - Growth Sector Database1 captures registered enterprises only). This represented 45% of all registered enterprises and 29% of all employment (in registered enterprises) in Scotland. In terms of volume of businesses, Financial and Business Services was the largest growth sector (28,480 enterprises) and Life Sciences the smallest (575 enterprises).
The proportion of growth sector businesses in the economy was relatively higher than the proportion of employment provided by growth sector businesses. This was due to the micro and small nature of many growth sector firms - 46% of growth sector firms had no employees and 51% were classed small (1-49 employees).
| No. of registered enterprises | % of all Scottish registered enterprises | Enterprise % change: 2008 to 2020 | % total Scottish employment (2019) | |
|---|---|---|---|---|
| Food and Drink | 17,500 | 10% | -1% | 5% |
| Financial and Business Services | 28,480 | 16% | 40% | 9% |
| Life Sciences | 575 | 0.3% | 31% | 1% |
| Energy (including Renewables) | 4,155 | 2% | 255% | 3% |
| Sustainable Tourism (Tourism related Industries) | 15,215 | 8% | 14% | 9% |
| Creative Industries (including Digital) | 15,730 | 9% | 52% | 3% |
| All | 81,650 | 45% | 29% | 29% |
Scottish Government . (2021, June 30). Growth sector statistics. Retrieved from https://www.gov.scot/publications/growth-sector-statistics/ [accessed 16 July 2021]Totals may not equal the sum of the constituent parts due to rounding
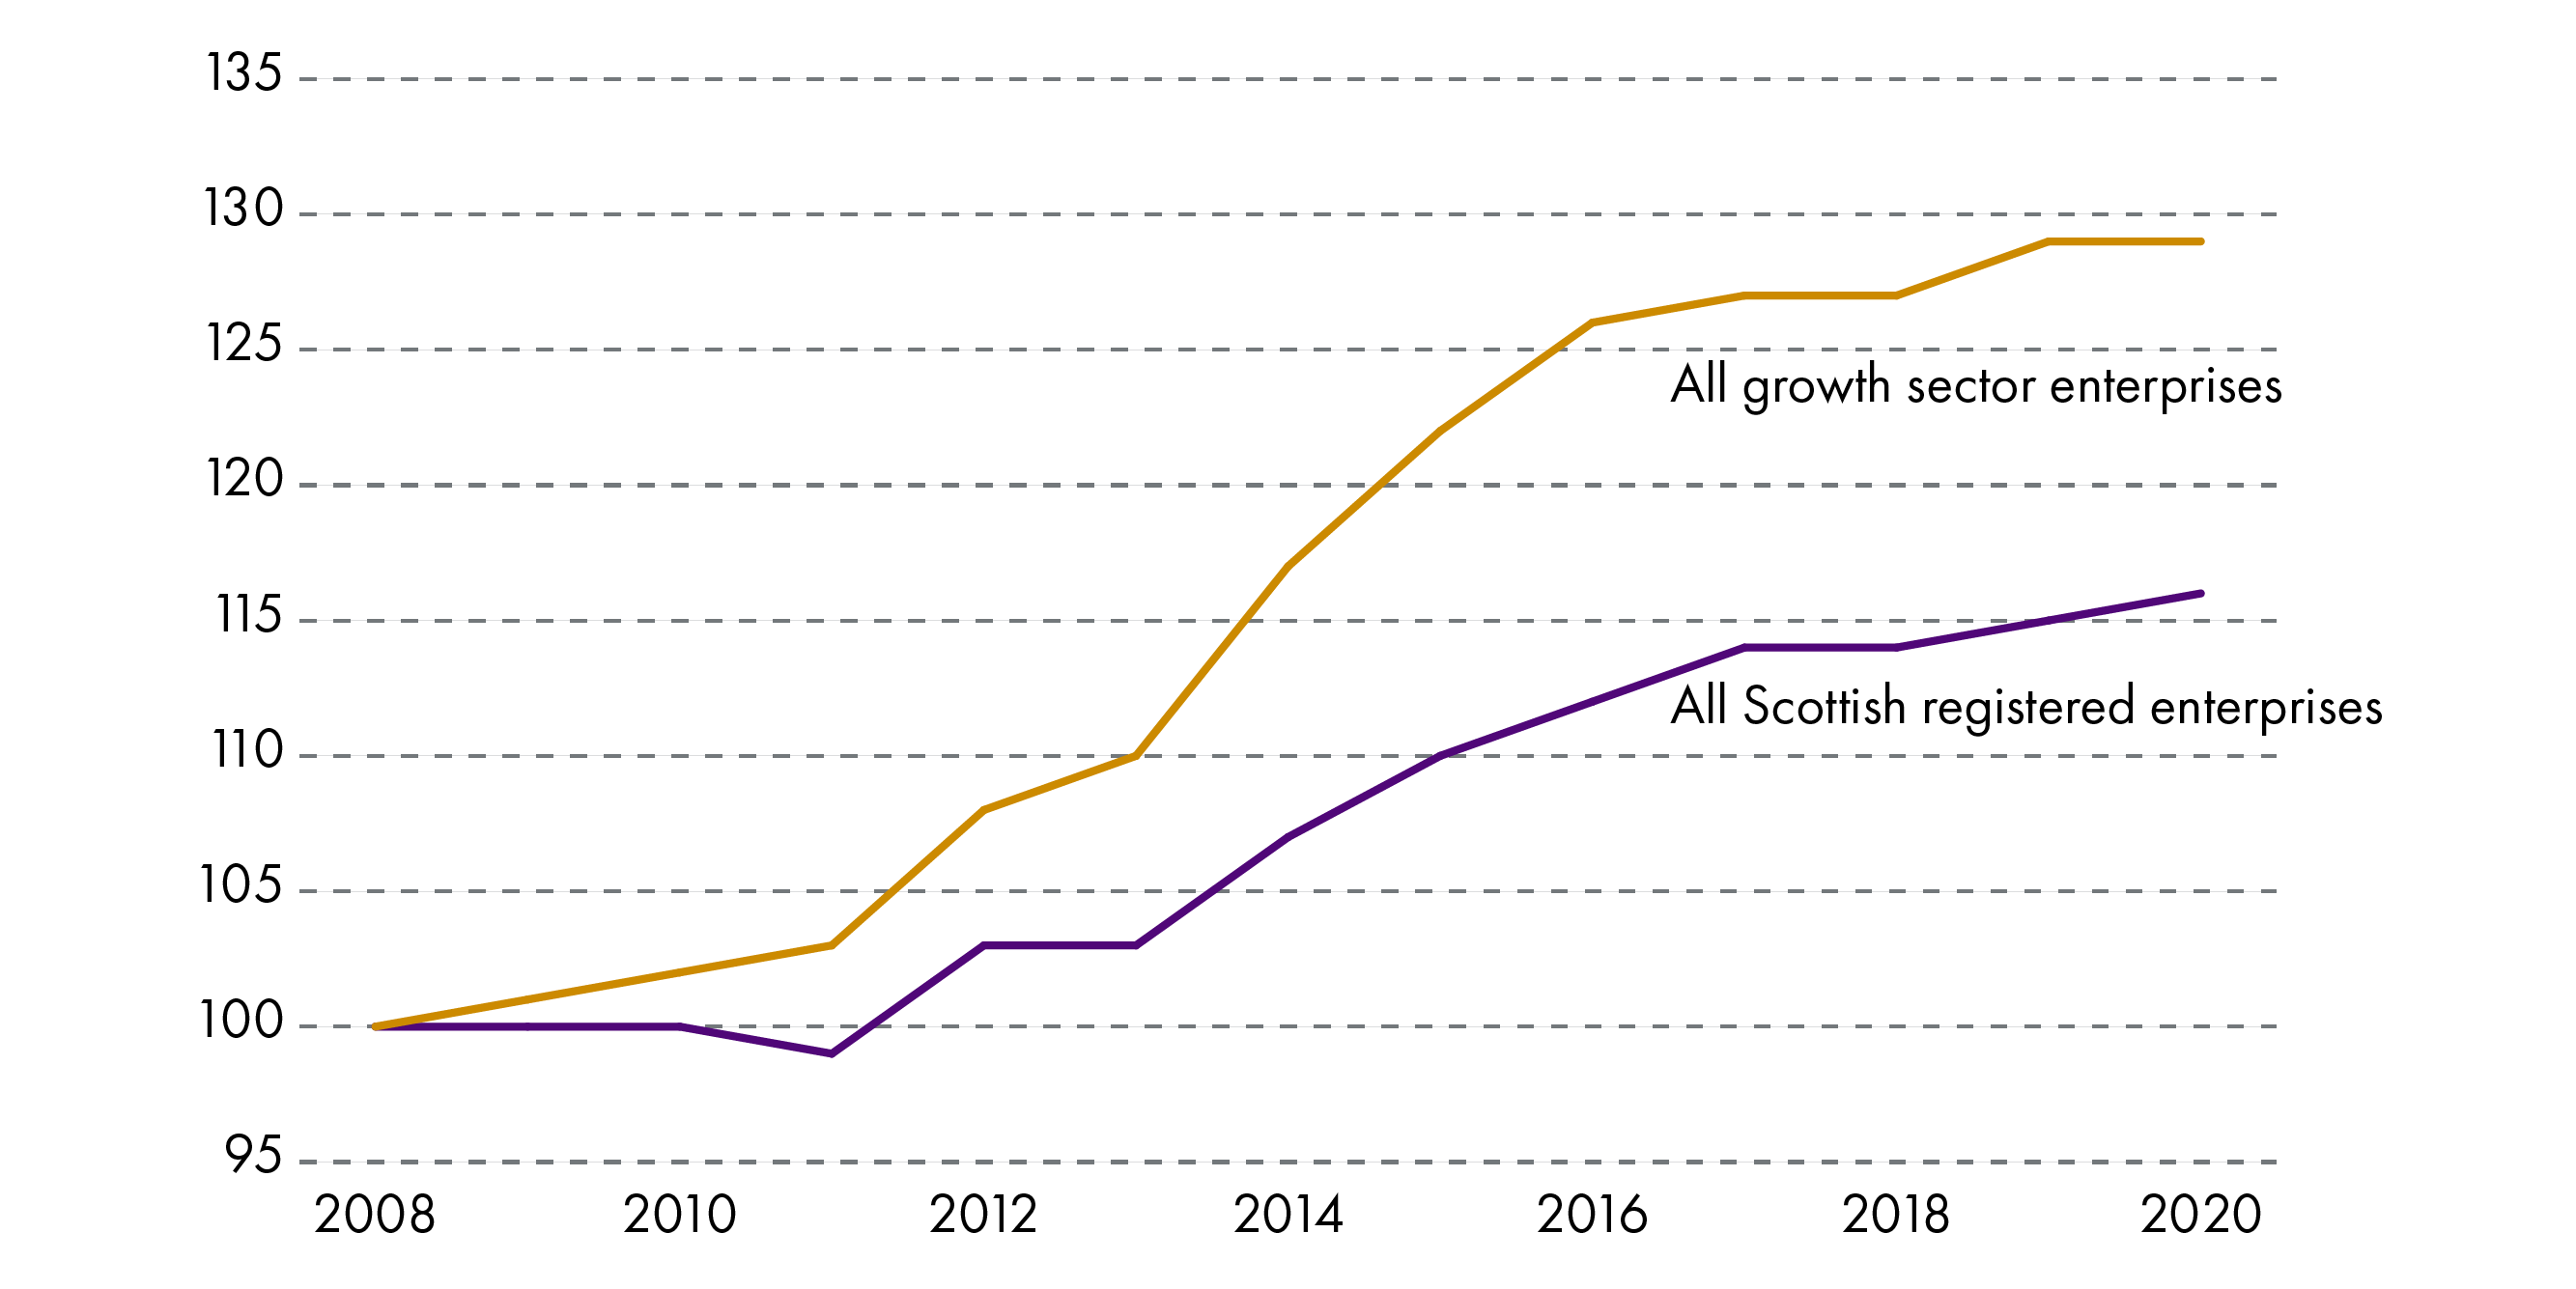
The volume of businesses, in those sectors classed as growth sectors, have grown at a much more accelerated rate than the Scottish rate for all businesses (see Figure 8). Since 2008 the number of growth sector businesses in the economy grew by 29%, compared to 16% for all registered Scottish businesses.
Apart from Food and Drink, the other five sectors classed as growth sectors have all increased their business base size since 2008 - in particular this growth was driven by Finance (additional 8,130 businesses) and Creative Industries/Digital (5,400 additional businesses).
This reflects the growth in the services side of the economy, as highlighted previously.
Scottish Government . (2021, June 30). Growth sector statistics. Retrieved from https://www.gov.scot/publications/growth-sector-statistics/ [accessed 16 July 2021]Registered enterprises only - those registered for VAT and/or PAYE.
Business base by size, employment and legal status
Size and employment structure
The Businesses in Scotland publication showed that of the 364,310 private sector enterprises operating in Scotland in 2020:
enterprises with no employees – that is sole proprietors or partnerships comprising only the owner-managers or companies comprising only the employee director – accounted for 70% of all private sector enterprises in Scotland and 14% of employment
103,085 (28%) were small (1-49 employees) representing 29% of total employment
4,055 (1.1%) were medium-sized (50 to 249 employees) and represented 13% of total employment in Scotland
2,440 (0.7%) were large (250 or more employees) and accounted for 44% of employment.
| No. of Enterprises | % of Total Enterprises | Enterprises change 2019-2020 | Enterprises change 2010-2020 | Total Scottish Employment | % of Total Employment | Employment change 2019-2020 | Employment change 2010-2020 | |
|---|---|---|---|---|---|---|---|---|
| 0 employee | 254,740 | 70% | 3% | 28% | 298,750 | 14% | 3% | 32% |
| 1-4 employees | 65,835 | 18% | 0% | 8% | 178,070 | 8% | -1% | 3% |
| 5-9 employees | 20,455 | 6% | -1% | 14% | 141,290 | 6% | -1% | 12% |
| 10-19 employees | 11,310 | 3% | 0% | 16% | 154,970 | 7% | 0% | 13% |
| 20-49 employees | 5,485 | 2% | 1% | 14% | 156,700 | 7% | 1% | 12% |
| 50-99 employees | 2,315 | 0.6% | 1% | 13% | 123,990 | 6% | 1% | 10% |
| 100-199 employees | 1,355 | 0.4% | 2% | 4% | 115,830 | 5% | 4% | 5% |
| 200-249 employees | 385 | 0.1% | 4% | 31% | 42,730 | 2% | -2% | 32% |
| 250-499 employees | 800 | 0.2% | -1% | 5% | 112,440 | 5% | -1% | 0% |
| 500+ employees | 1,640 | 0.5% | 1% | 9% | 853,350 | 39% | 0% | 3% |
| Total | 364,310 | 100% | 2% | 22% | 2,178,090 | 100% | 1% | 16% |
Scottish Government. (2020, November 11). Businesses in Scotland: 2020. Retrieved from https://www.gov.scot/publications/businesses-in-scotland-2020/ [accessed 16 August 2021]Note: Figures rounded to the nearest five. Totals may not equal the sum of the constituent parts due to rounding.
The Scottish Government Businesses in Scotland publication noted that:
Scotland has a different business base structure compared to that of the UK as a whole.........Scotland has a lower rate of small businesses (particularly those that do not employ others) but a higher rate of medium and large businesses compared to the UK as a whole. Large businesses account for a higher share of Scotland’s private sector employment (44%), compared to the UK as a whole (39%).
Notable is the contrast, in the proportion of small businesses (1-49 employees) in Scotland relative to other UK regions (see Figure 9). This category made up 25% of Scotland's business base. Wales is the only area with a higher proportion at 26%.
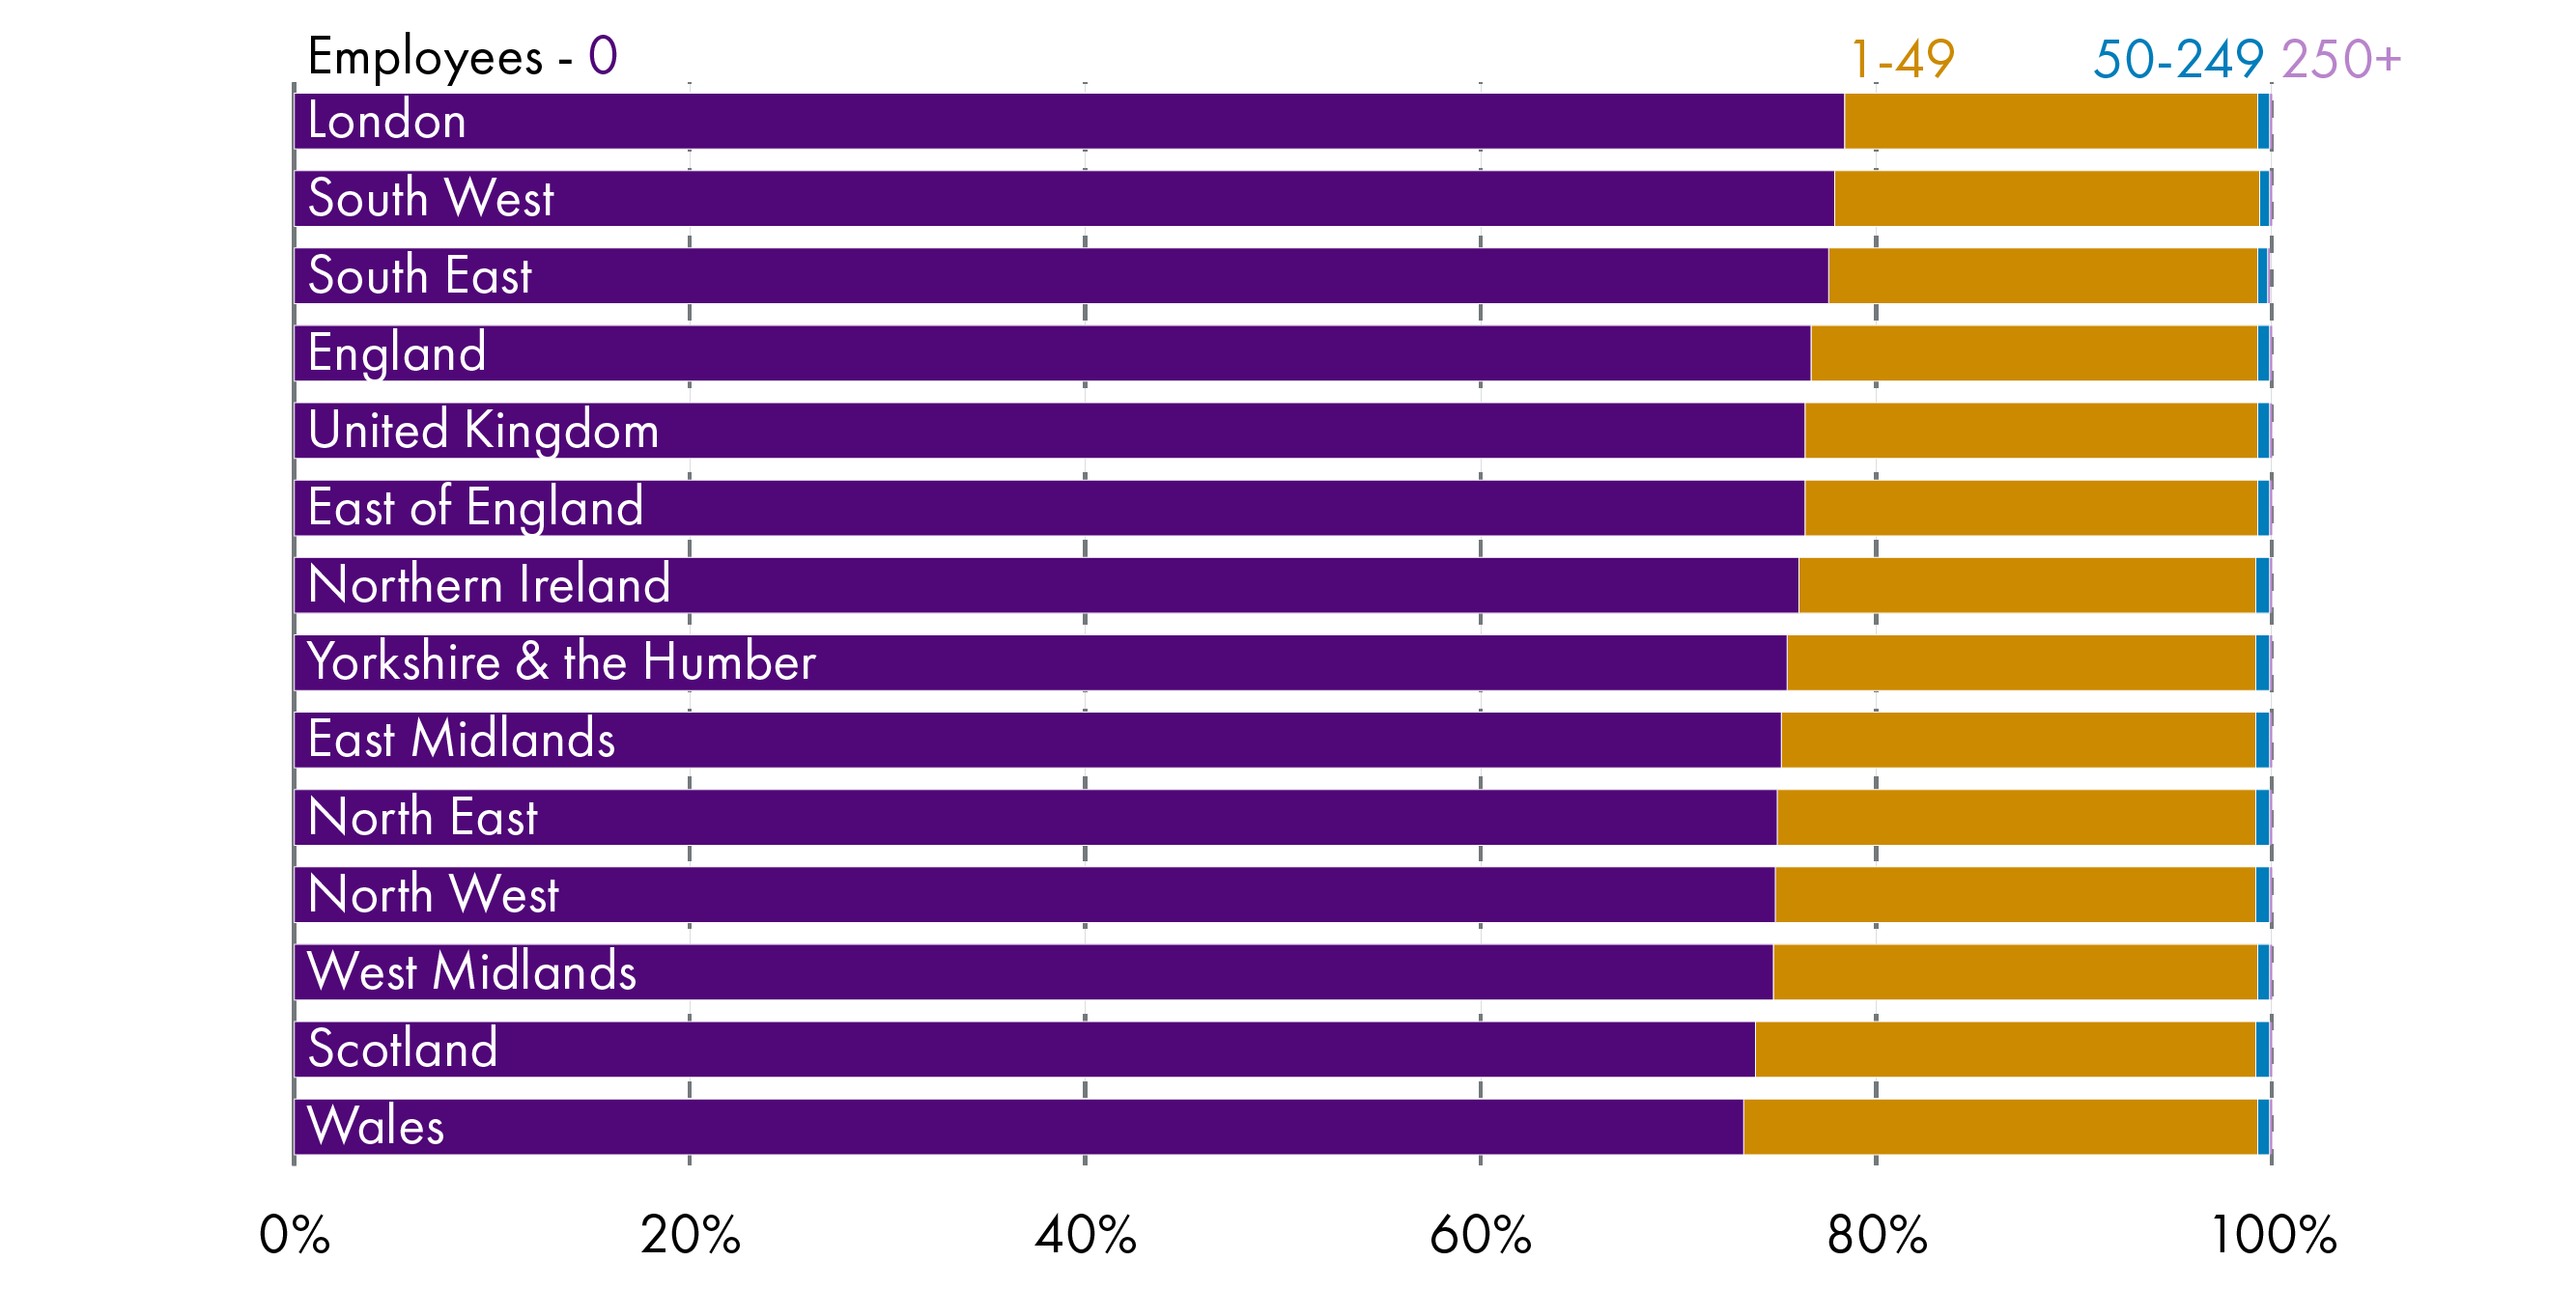
Department for Business, Energy & Industrial Strategy (BEIS), UK Government . (2020, October 8). Business population estimates 2020. Retrieved from https://www.gov.uk/government/statistics/business-population-estimates-2020 [accessed 16 August 2021]
Sectors by size
The sector profile of Scotland's business stock varies significantly by size (see Figure 10).
The sectors with the largest proportionate of enterprises with no employees were 'education' (91%) and 'arts, education & recreation' (85%). On the other end of the spectrum 'accommodation & food serving activities' (34%) and 'wholesale trade' (46%) had the fewest number of businesses with no employees.
The highest proportion of large enterprises (250+ employees) were in the 'finance and insurance'(4%), and 'wholesale trade' (3%). There were very few large enterprises in 'agriculture, forestry and fishing' (0.1%, 15 enterprises), 'other services' (0.1%), and 'real estate' and 'construction' also had lower proportions.
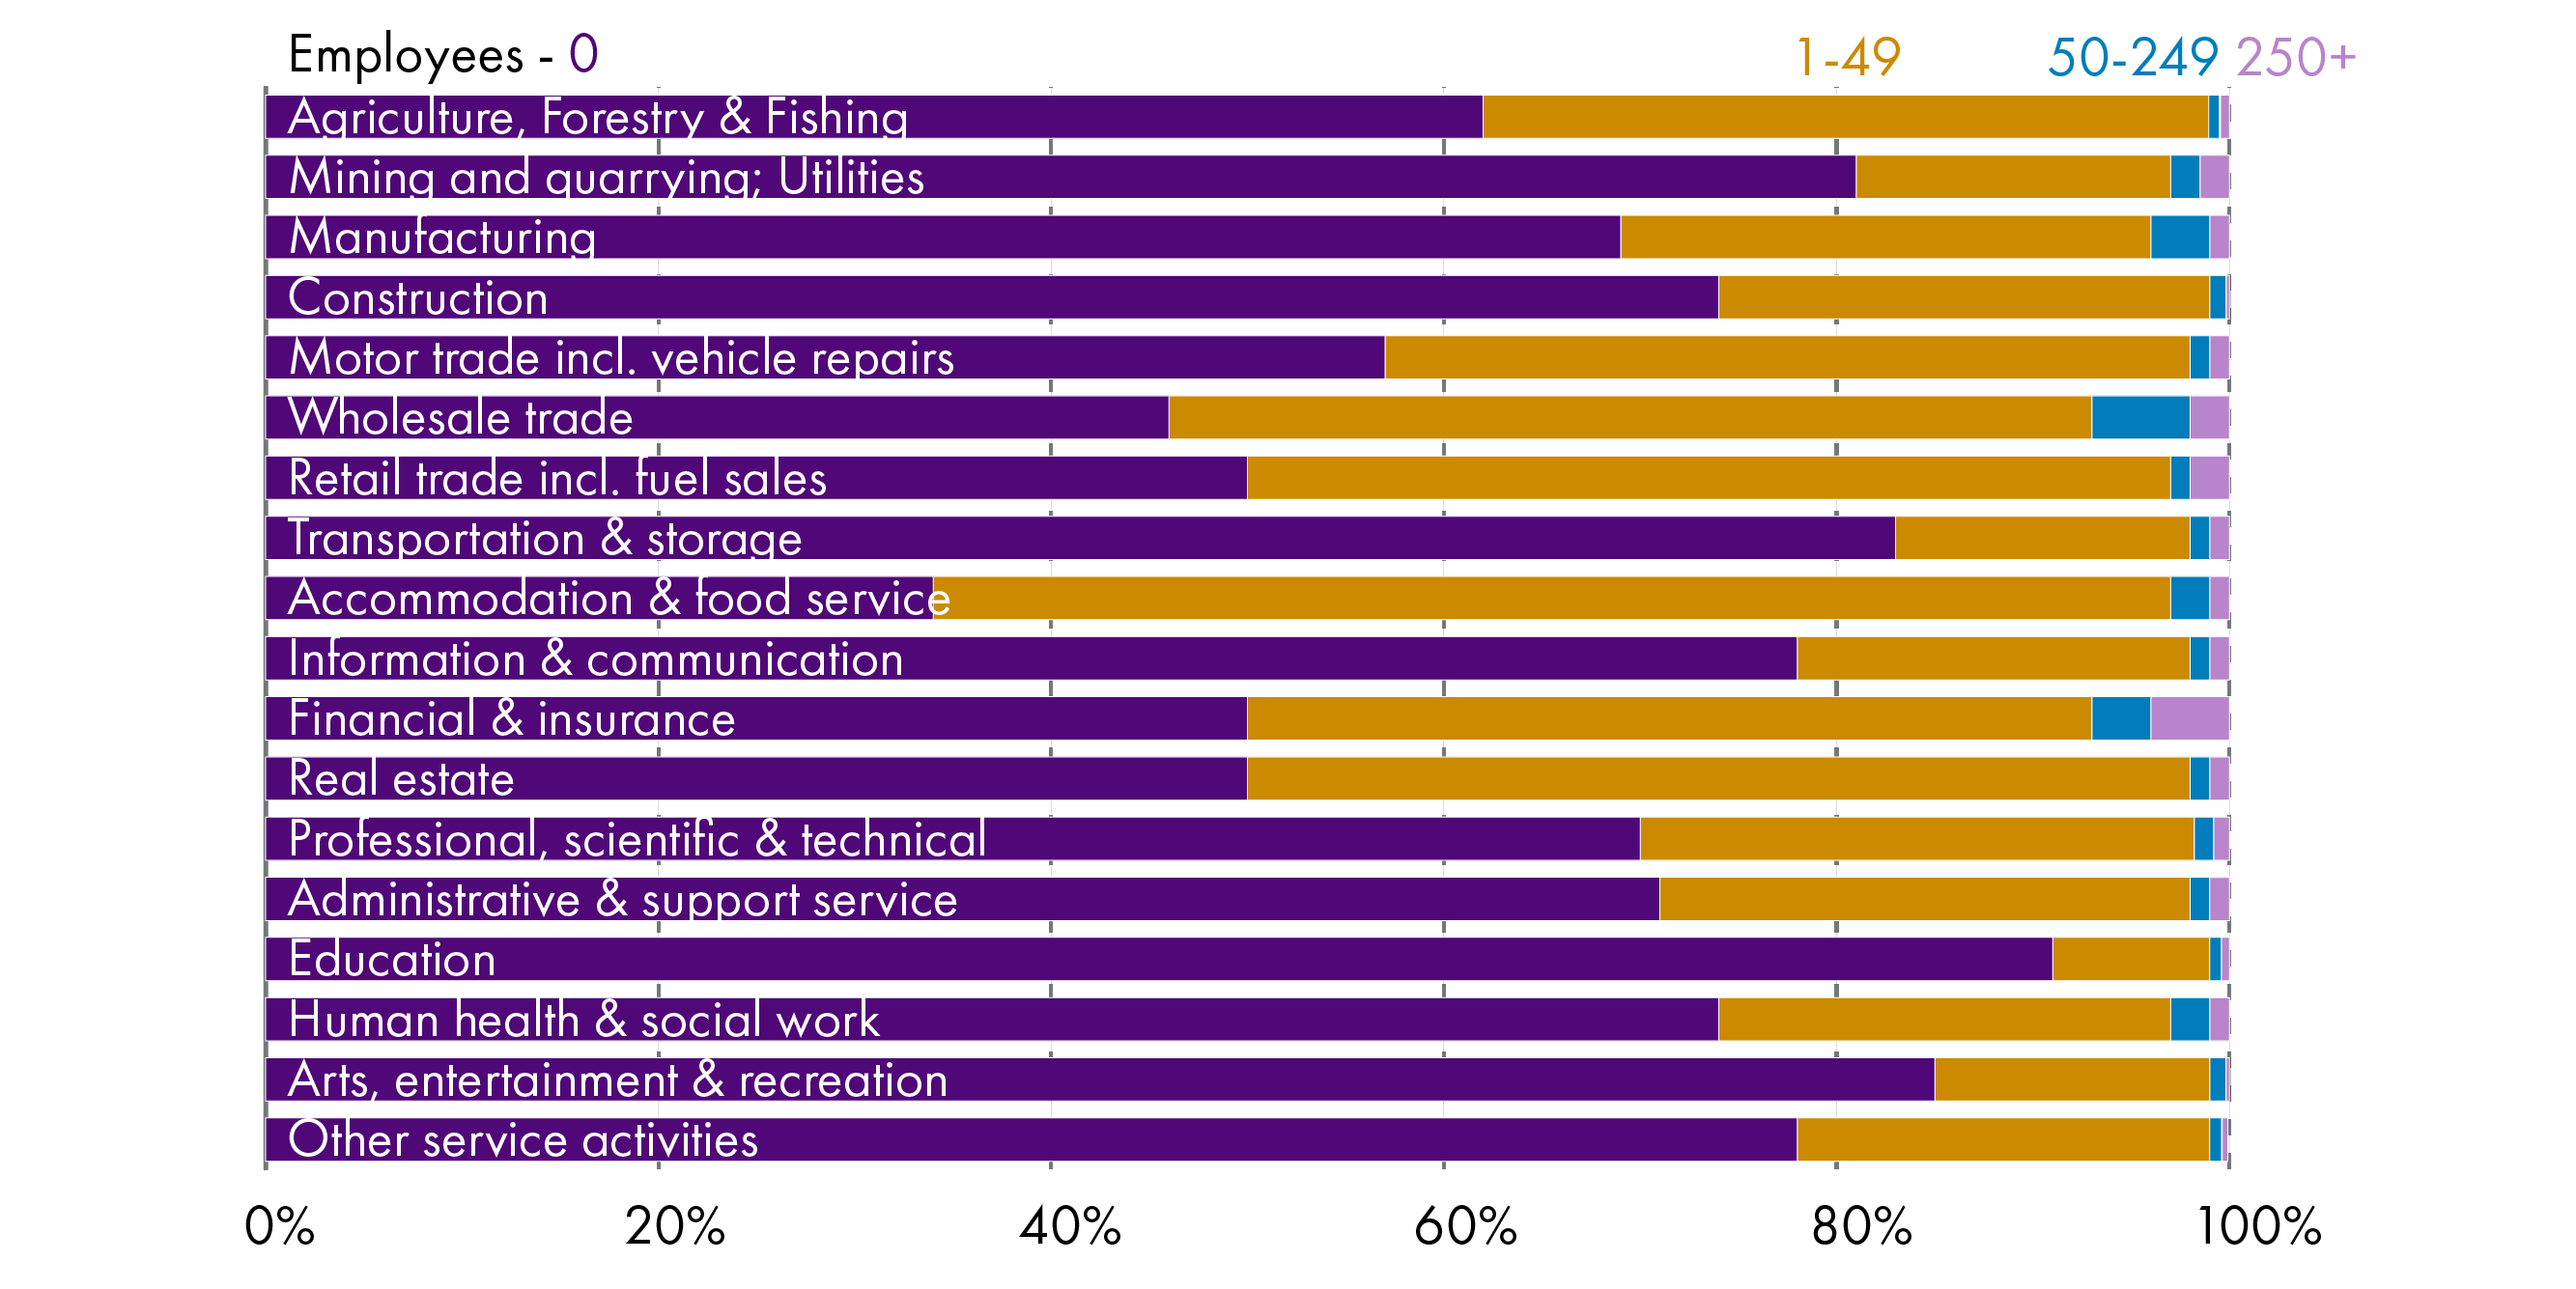
Scottish Government. (2020, November 11). Businesses in Scotland: 2020. Retrieved from https://www.gov.scot/publications/businesses-in-scotland-2020/ [accessed 16 August 2021]
Legal status
| Number of enterprises | % of enterprises | 2010 to 2020 % change enterprises | Total Scottish employment | % employment | % change employment 2010 to 2020 | |
|---|---|---|---|---|---|---|
| Companies (incl. Building Societies) | 120,230 | 33% | 56% | 1,552,380 | 71% | 18% |
| Sole proprietors | 32,510 | 9% | -26% | 90,420 | 4% | -28% |
| Partnerships | 18,790 | 5% | -29% | 109,050 | 5% | -30% |
| Public Corporation/ nationalised body | 30 | 0% | -54% | 19,840 | 1% | -72% |
| Non-profit making bodies and mutual associations | 7,895 | 2% | 2% | 185,810 | 9% | 10% |
| Unregistered businesses | 184,850 | 51% | 29% | 220,590 | 10% | 37% |
| Total | 364,310 | 100% | 22% | 2,178,090 | 100% | 16% |
Scottish Government. (2020, November 11). Businesses in Scotland: 2020. Retrieved from https://www.gov.scot/publications/businesses-in-scotland-2020/ [accessed 16 August 2021]Totals may not equal the sum of the constituent parts due to rounding. Central & Local Government are excluded.
Not including unregistered enterprises, companies made up the majority of registered enterprises (67%) in 2020. There has been sustained high growth in the number of companies over the last six years - growing by 56%. Recent years have witnessed a declining number of public corporations, partnerships, sole proprietors in the business base. Companies contributed the majority (71%) of Scotland's private sector employment base.
Birth, death and survival rates
Birth and death rates are calculated based on the concept of active businesses in a reference year. These are defined as businesses that had either turnover or employment at any time during the reference period.
New business registrations are referred to as business births and the birth rate is calculated using the number of births as a proportion of the active businesses.
Businesses that have ceased to trade (identified through de-registration of the administrative units, that is, VAT and Pay As You Earn (PAYE)) are referred to as business deaths and the death rate is calculated using the number of deaths as a proportion of the active businesses.
Business births and deaths
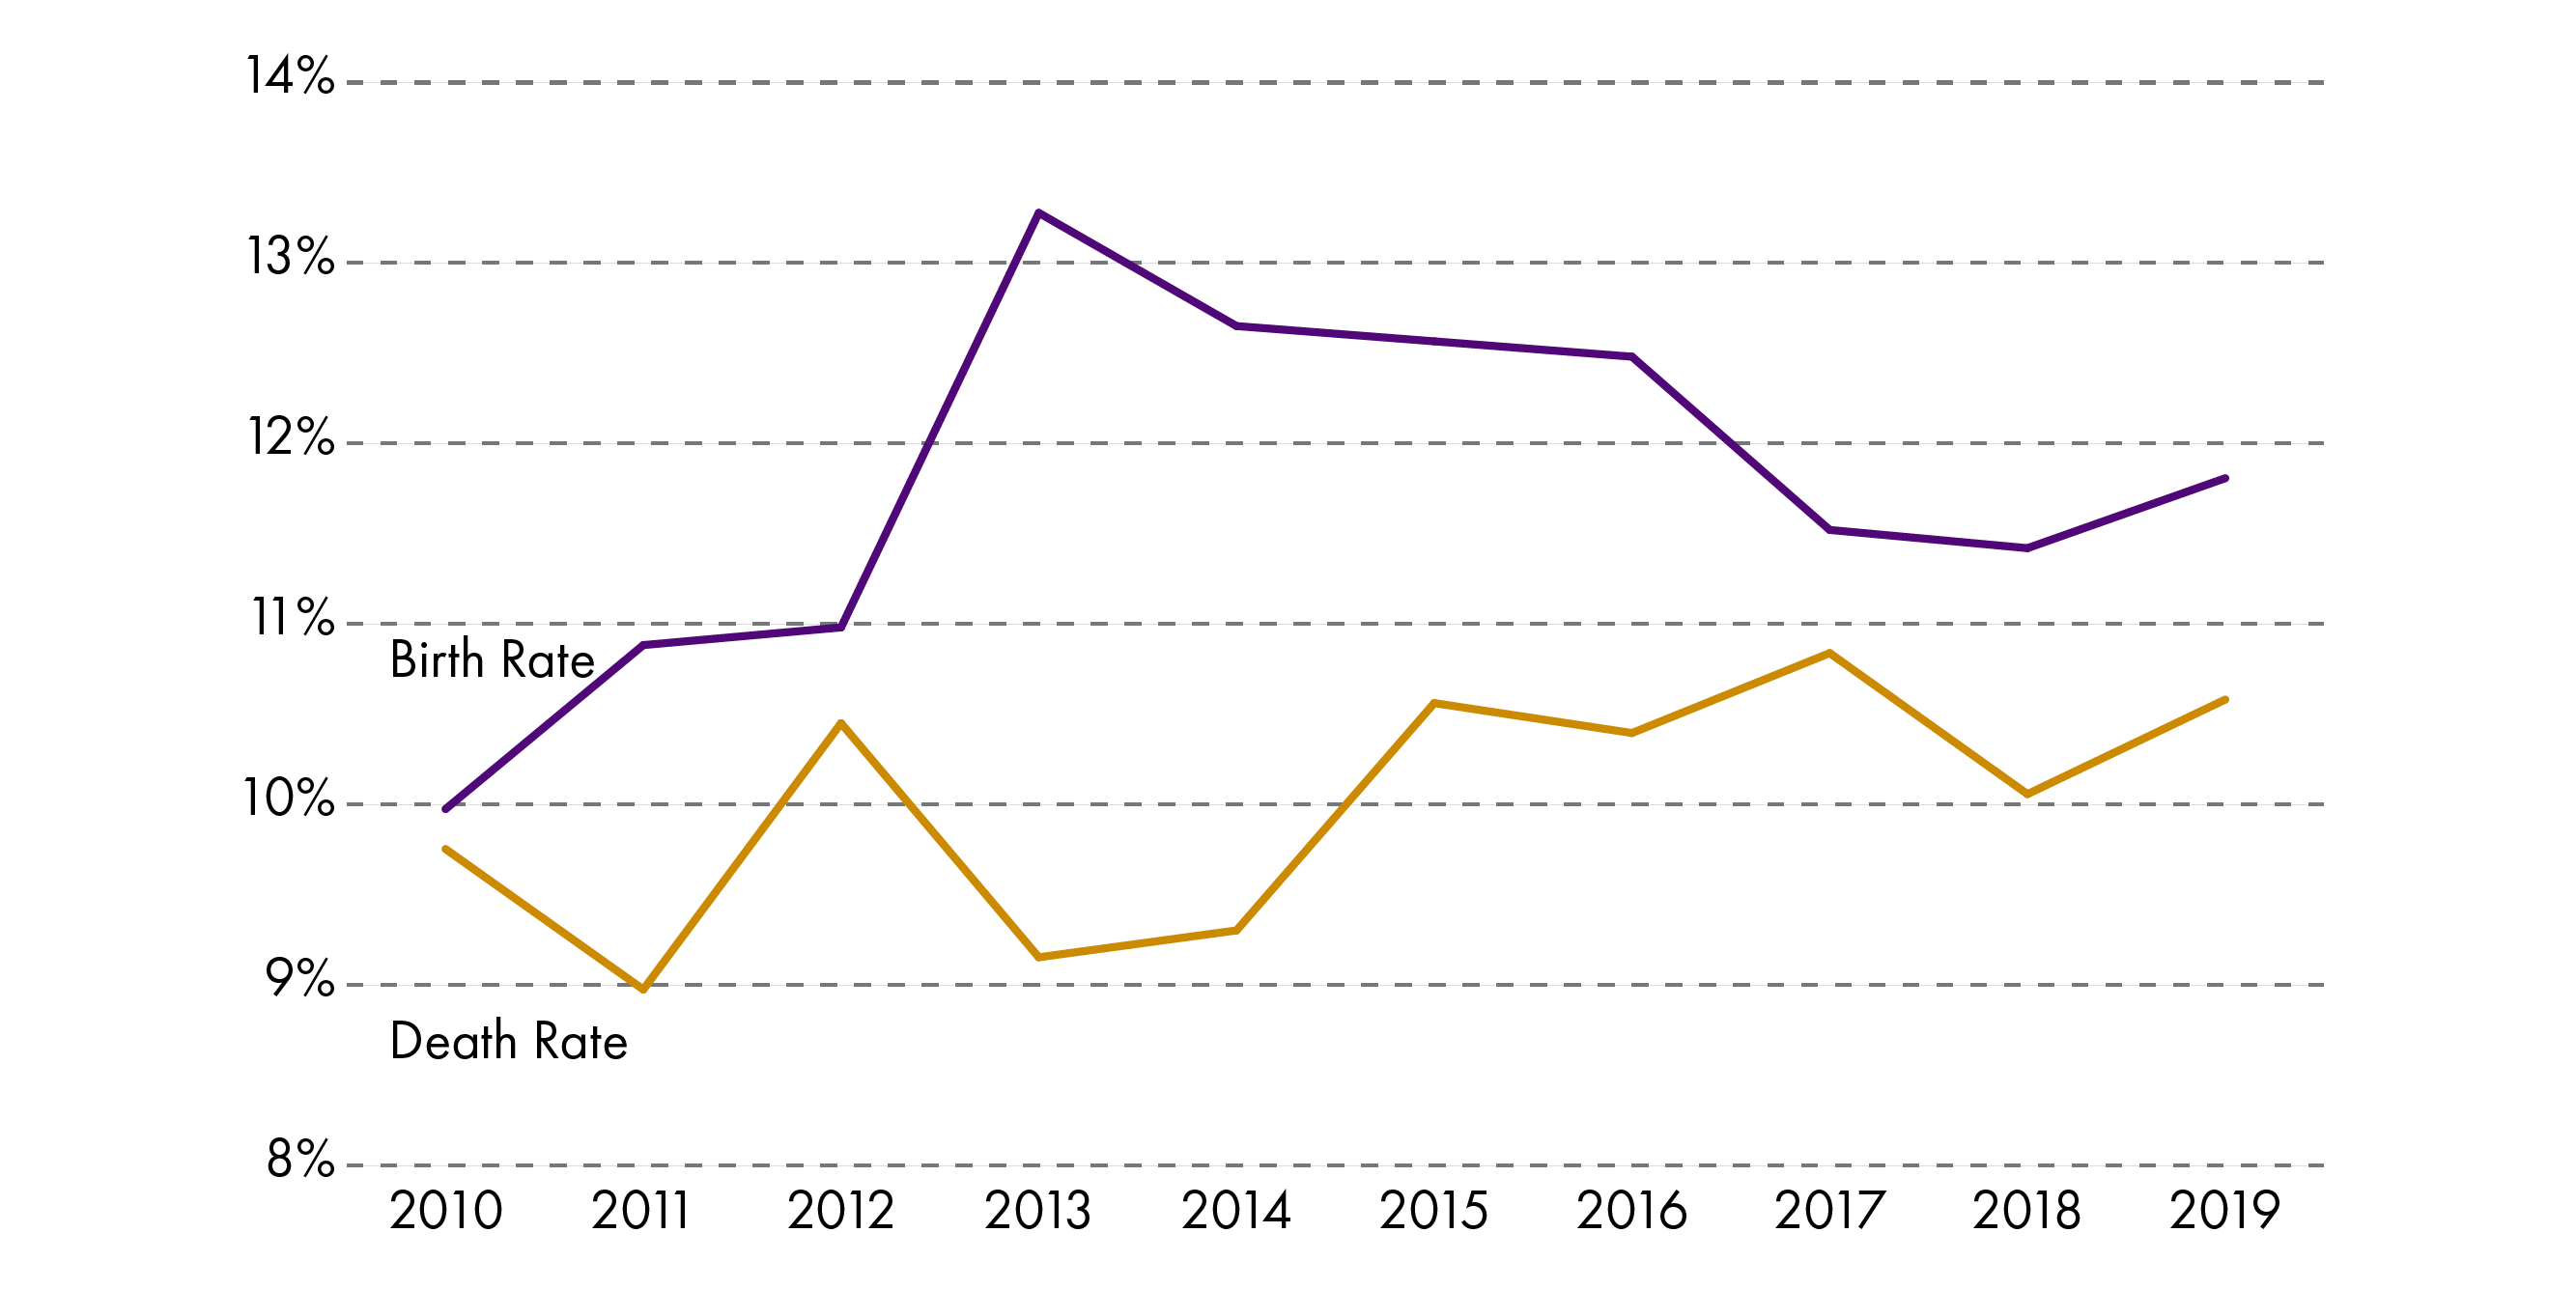
The number of Scottish business births increased by 5% between 2018 and 2019 to 21,665, resulting in a birth rate of 11.8%. The 21,665 business births in 2019 were the second highest recorded since comparable records began. The number of Scottish business deaths increased by 7% from 18,120 to 19,415 between 2018 and 2019, resulting in a death rate of 10.6% compared with a rate of 10.1% in 2018.
| Active Count | Birth Count | Birth Rate | Death Count | Death Rate | |
|---|---|---|---|---|---|
| 2010 | 155,695 | 15,530 | 10% | 15,185 | 10% |
| 2011 | 155,655 | 16,940 | 11% | 13,970 | 9% |
| 2012 | 158,320 | 17,385 | 11% | 16,545 | 10% |
| 2013 | 162,230 | 21,540 | 13% | 14,850 | 9% |
| 2014 | 167,860 | 21,235 | 12.7% | 15,615 | 9.3% |
| 2015 | 172,890 | 21,725 | 12.6% | 18,260 | 10.6% |
| 2016 | 178,435 | 22,270 | 12.5% | 18,550 | 10.4% |
| 2017 | 180,280 | 20,770 | 11.5% | 19,540 | 10.8% |
| 2018 | 180,165 | 20,575 | 11.4% | 18,120 | 10.1% |
| 2019 | 183,485 | 21,665 | 11.8% | 19,415 | 10.6% |
Office for National Statistics (ONS). (2020, November 17). Business demography, UK. Retrieved from https://www.ons.gov.uk/businessindustryandtrade/business/activitysizeandlocation/datasets/businessdemographyreferencetable [accessed 16 August 2021]
There was a narrow gap between birth and death rates over the 2010 to 2012 period, reflected the lag effect of the economic downturn of 2008 and 2009. The gap from 2013 onwards reflected a turnaround with strengthened economic indicators. However, since 2017 the gap has narrowed again (see Figure 11). In 2013, businesses were born at a rate which was 4.1 percentage points higher than the death rate, by 2019 this gap had fallen to 1.2 percentage points (comparatively a minor under-performance relative to the UK gap of 1.7 percentage points for 2019).
Office for National Statistics (ONS). (2020, November 17). Business demography, UK. Retrieved from https://www.ons.gov.uk/businessindustryandtrade/business/activitysizeandlocation/datasets/businessdemographyreferencetable [accessed 16 August 2021]
Across the UK nations and regions (see Figure 12), East (of England) had the highest business birth rate at 15.7%, followed by the East Midlands (15%) and West Midlands (13.2%). Northern Ireland had the lowest birth rate, at 10.4%. Scotland had the fourth lowest birth rate at 11.8% - below the UK average of 12.2%.
The region with the highest business death rate was East (of England) at 13.1%, followed by the North West and West Midlands both at 11.4%. Northern Ireland had the lowest death rate, at 9%. Scotland had a business death rate of 10.4% - just below the UK average of 10.5%.
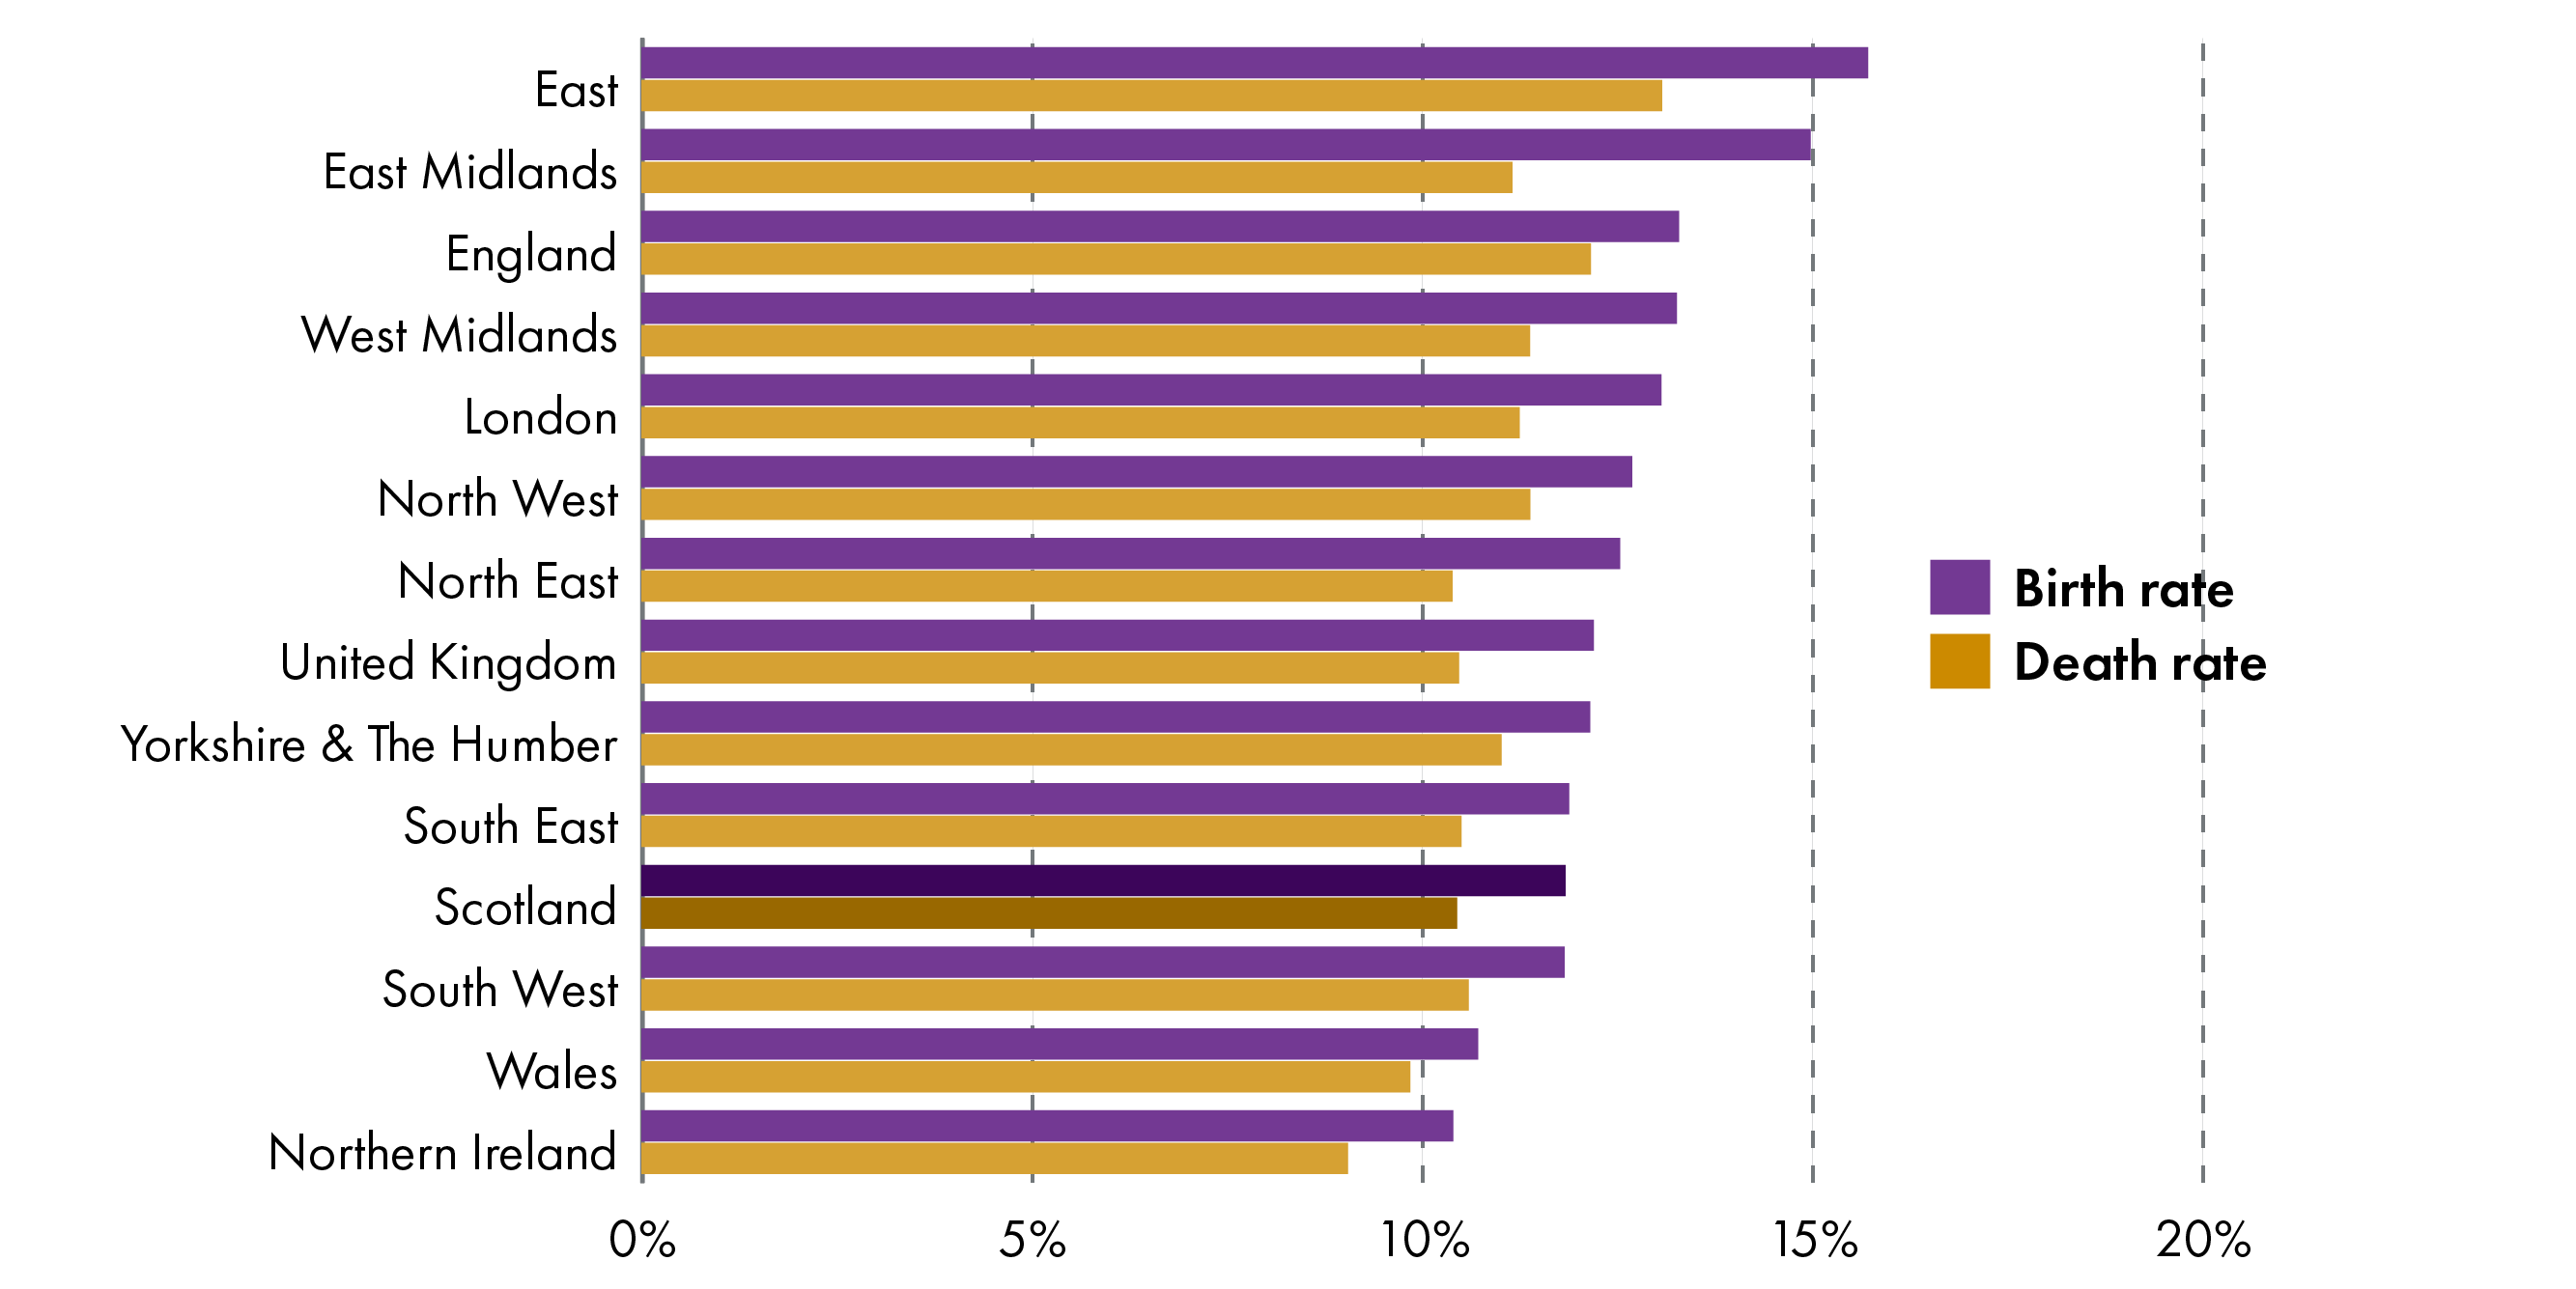
Office for National Statistics (ONS). (2020, November 17). Business demography, UK. Retrieved from https://www.ons.gov.uk/businessindustryandtrade/business/activitysizeandlocation/datasets/businessdemographyreferencetable [accessed 16 August 2021]
Survival rates
The 1-year business survival rate in Scotland has decreased since 2014 but it has been relatively stable in the range of 90-91% over the years since to 2018. The Scotland 5-year survival rate for businesses born in 2014 and still active in 2018 was 42.3%.
| Births 2014 | Births 2015 | Births 2016 | Births 2017 | Births 2018 | |
|---|---|---|---|---|---|
| 1-year survival | 92.4 | 90.1 | 91.7 | 90 | 90.9 |
| 2-year survival | 76.1 | 71.3 | 72.6 | 72 | |
| 3-year survival | 60.4 | 55.6 | 56.5 | ||
| 4-year survival | 49.0 | 46.1 | |||
| 5-year survival | 42.3 |
Office for National Statistics (ONS). (2020, November 17). Business demography, UK. Retrieved from https://www.ons.gov.uk/businessindustryandtrade/business/activitysizeandlocation/datasets/businessdemographyreferencetable [accessed 16 August 2021]
The highest 5-year survival rate, by region, was in the South West, at 45.0%, while the lowest was in London, at 39.2%. Scotland was ranked seventh out of the UK's 12 nations/regions for 5-year survival rates and third for the most recent 1-year survival rate (see Figure 13).
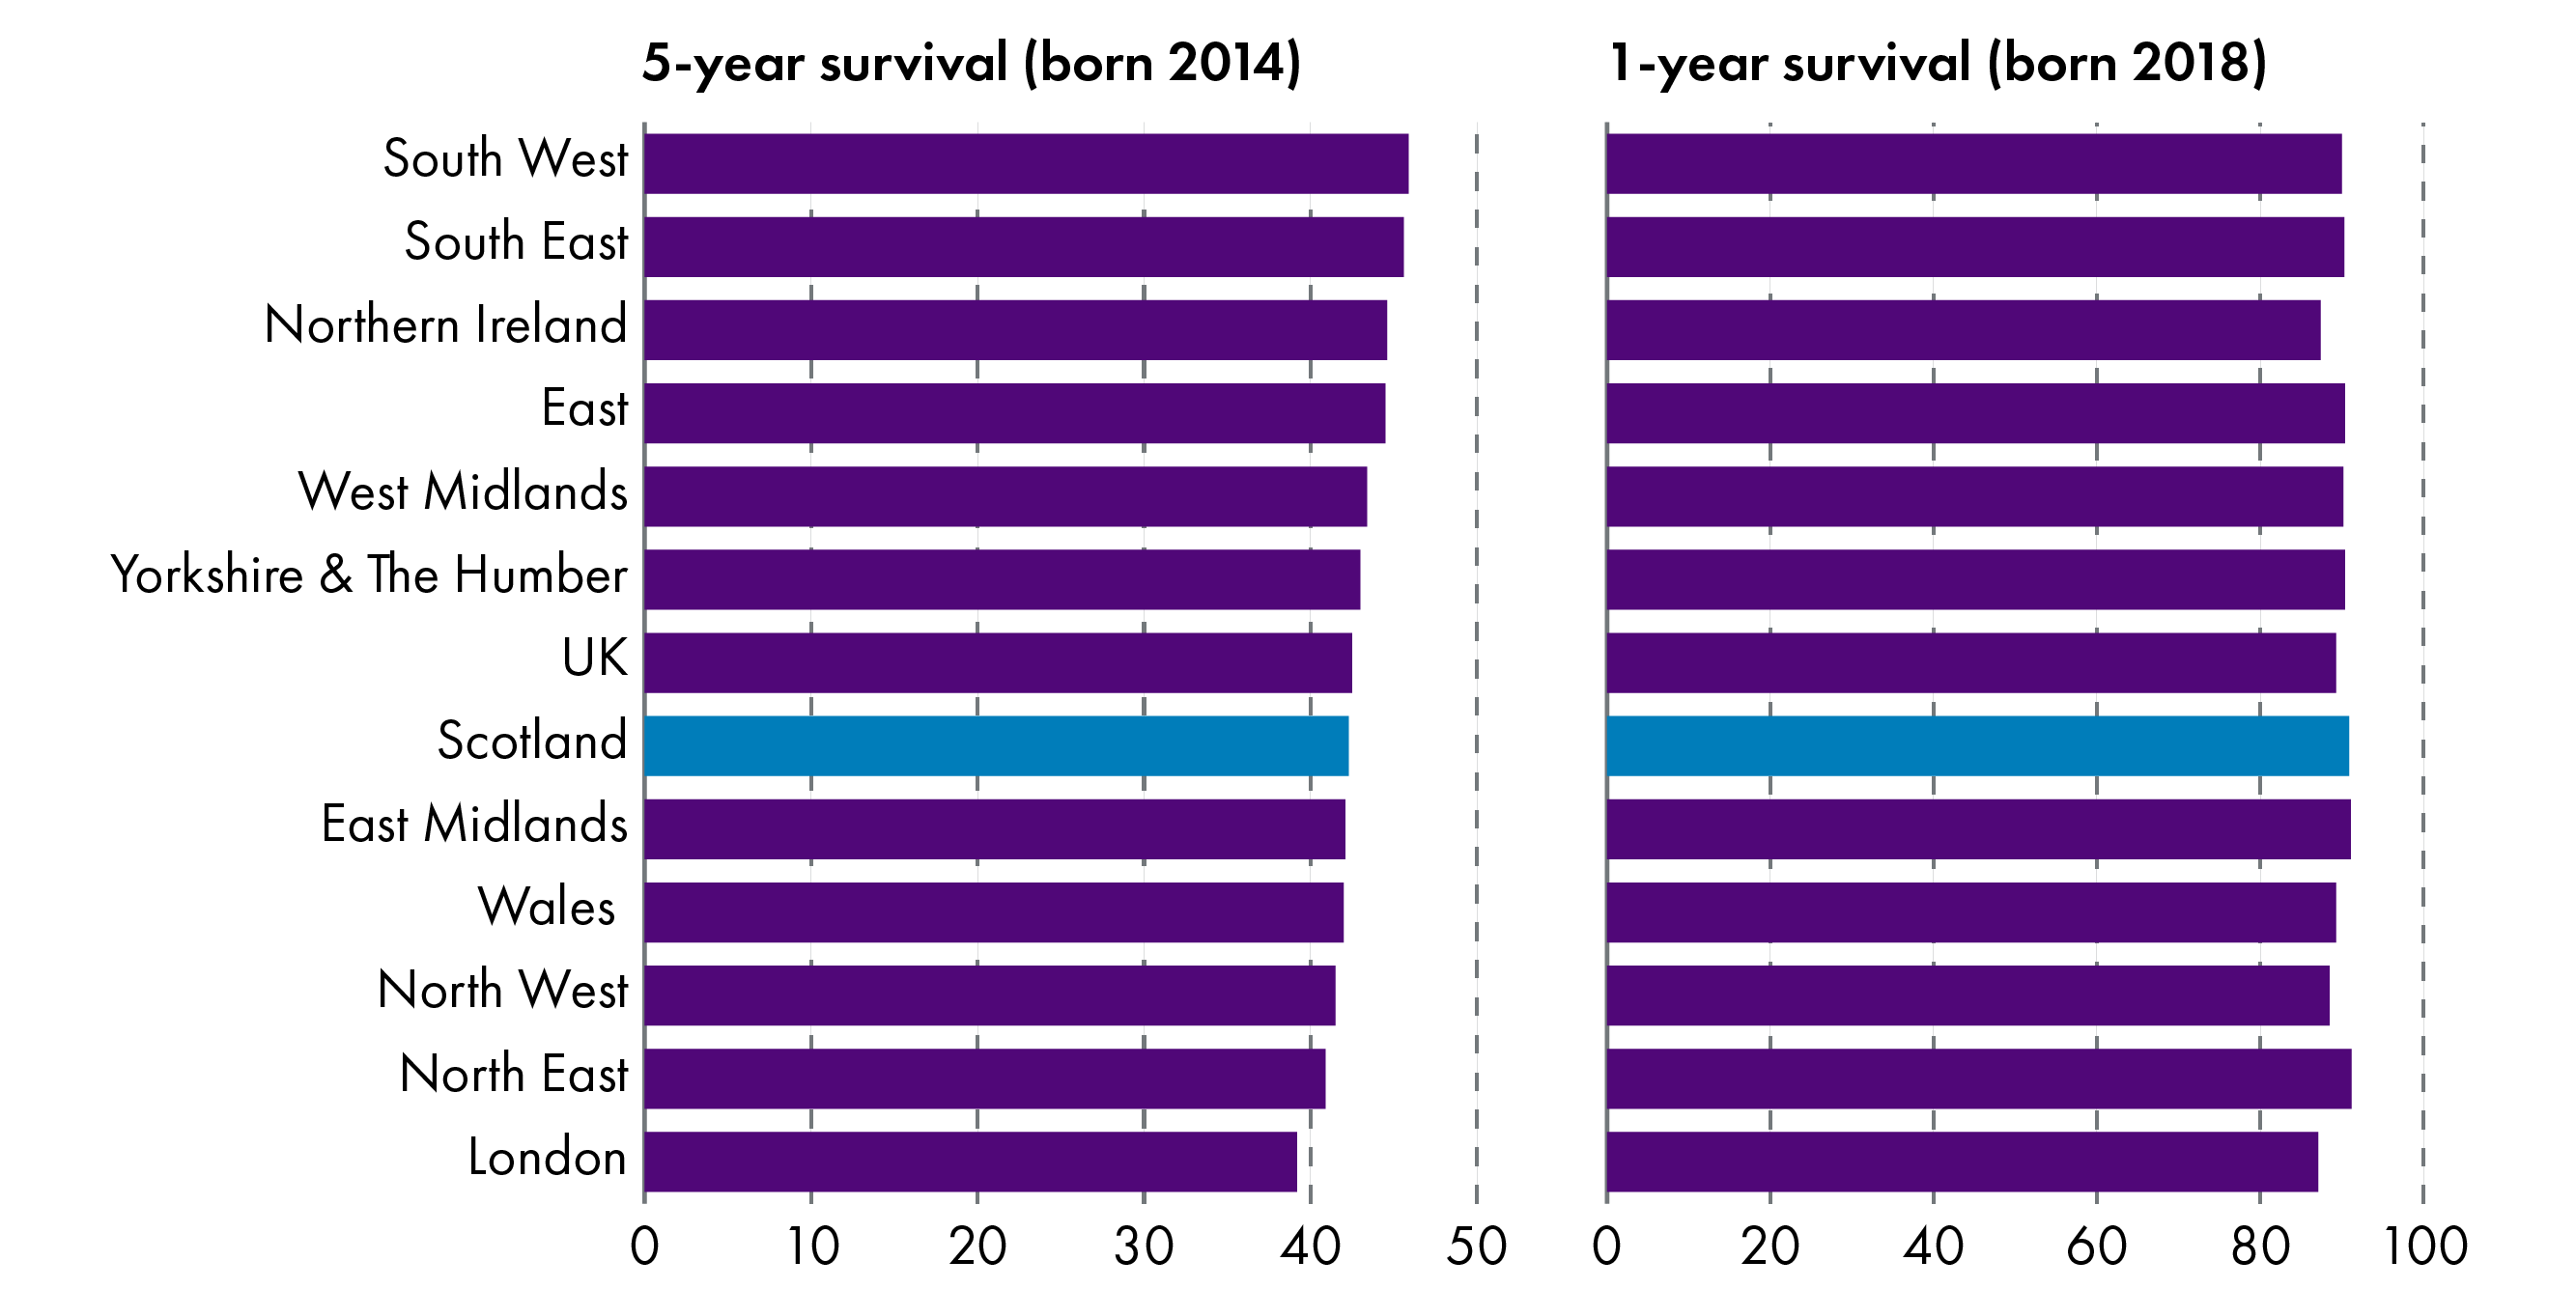
Office for National Statistics (ONS). (2020, November 17). Business demography, UK. Retrieved from https://www.ons.gov.uk/businessindustryandtrade/business/activitysizeandlocation/datasets/businessdemographyreferencetable [accessed 16 August 2021]
Turnover and investment
Business turnover profile
Total private sector turnover generated by Scotland's 364,310 businesses (registered and unregistered) was £291.3 billion (2020). The relationship between business size and turnover was inverse in nature (see Figure 14) - small businesses represented 98% of the business base but just 27% of turnover, whereas large businesses made up 0.7% of the business base, generating 59% of all turnover.
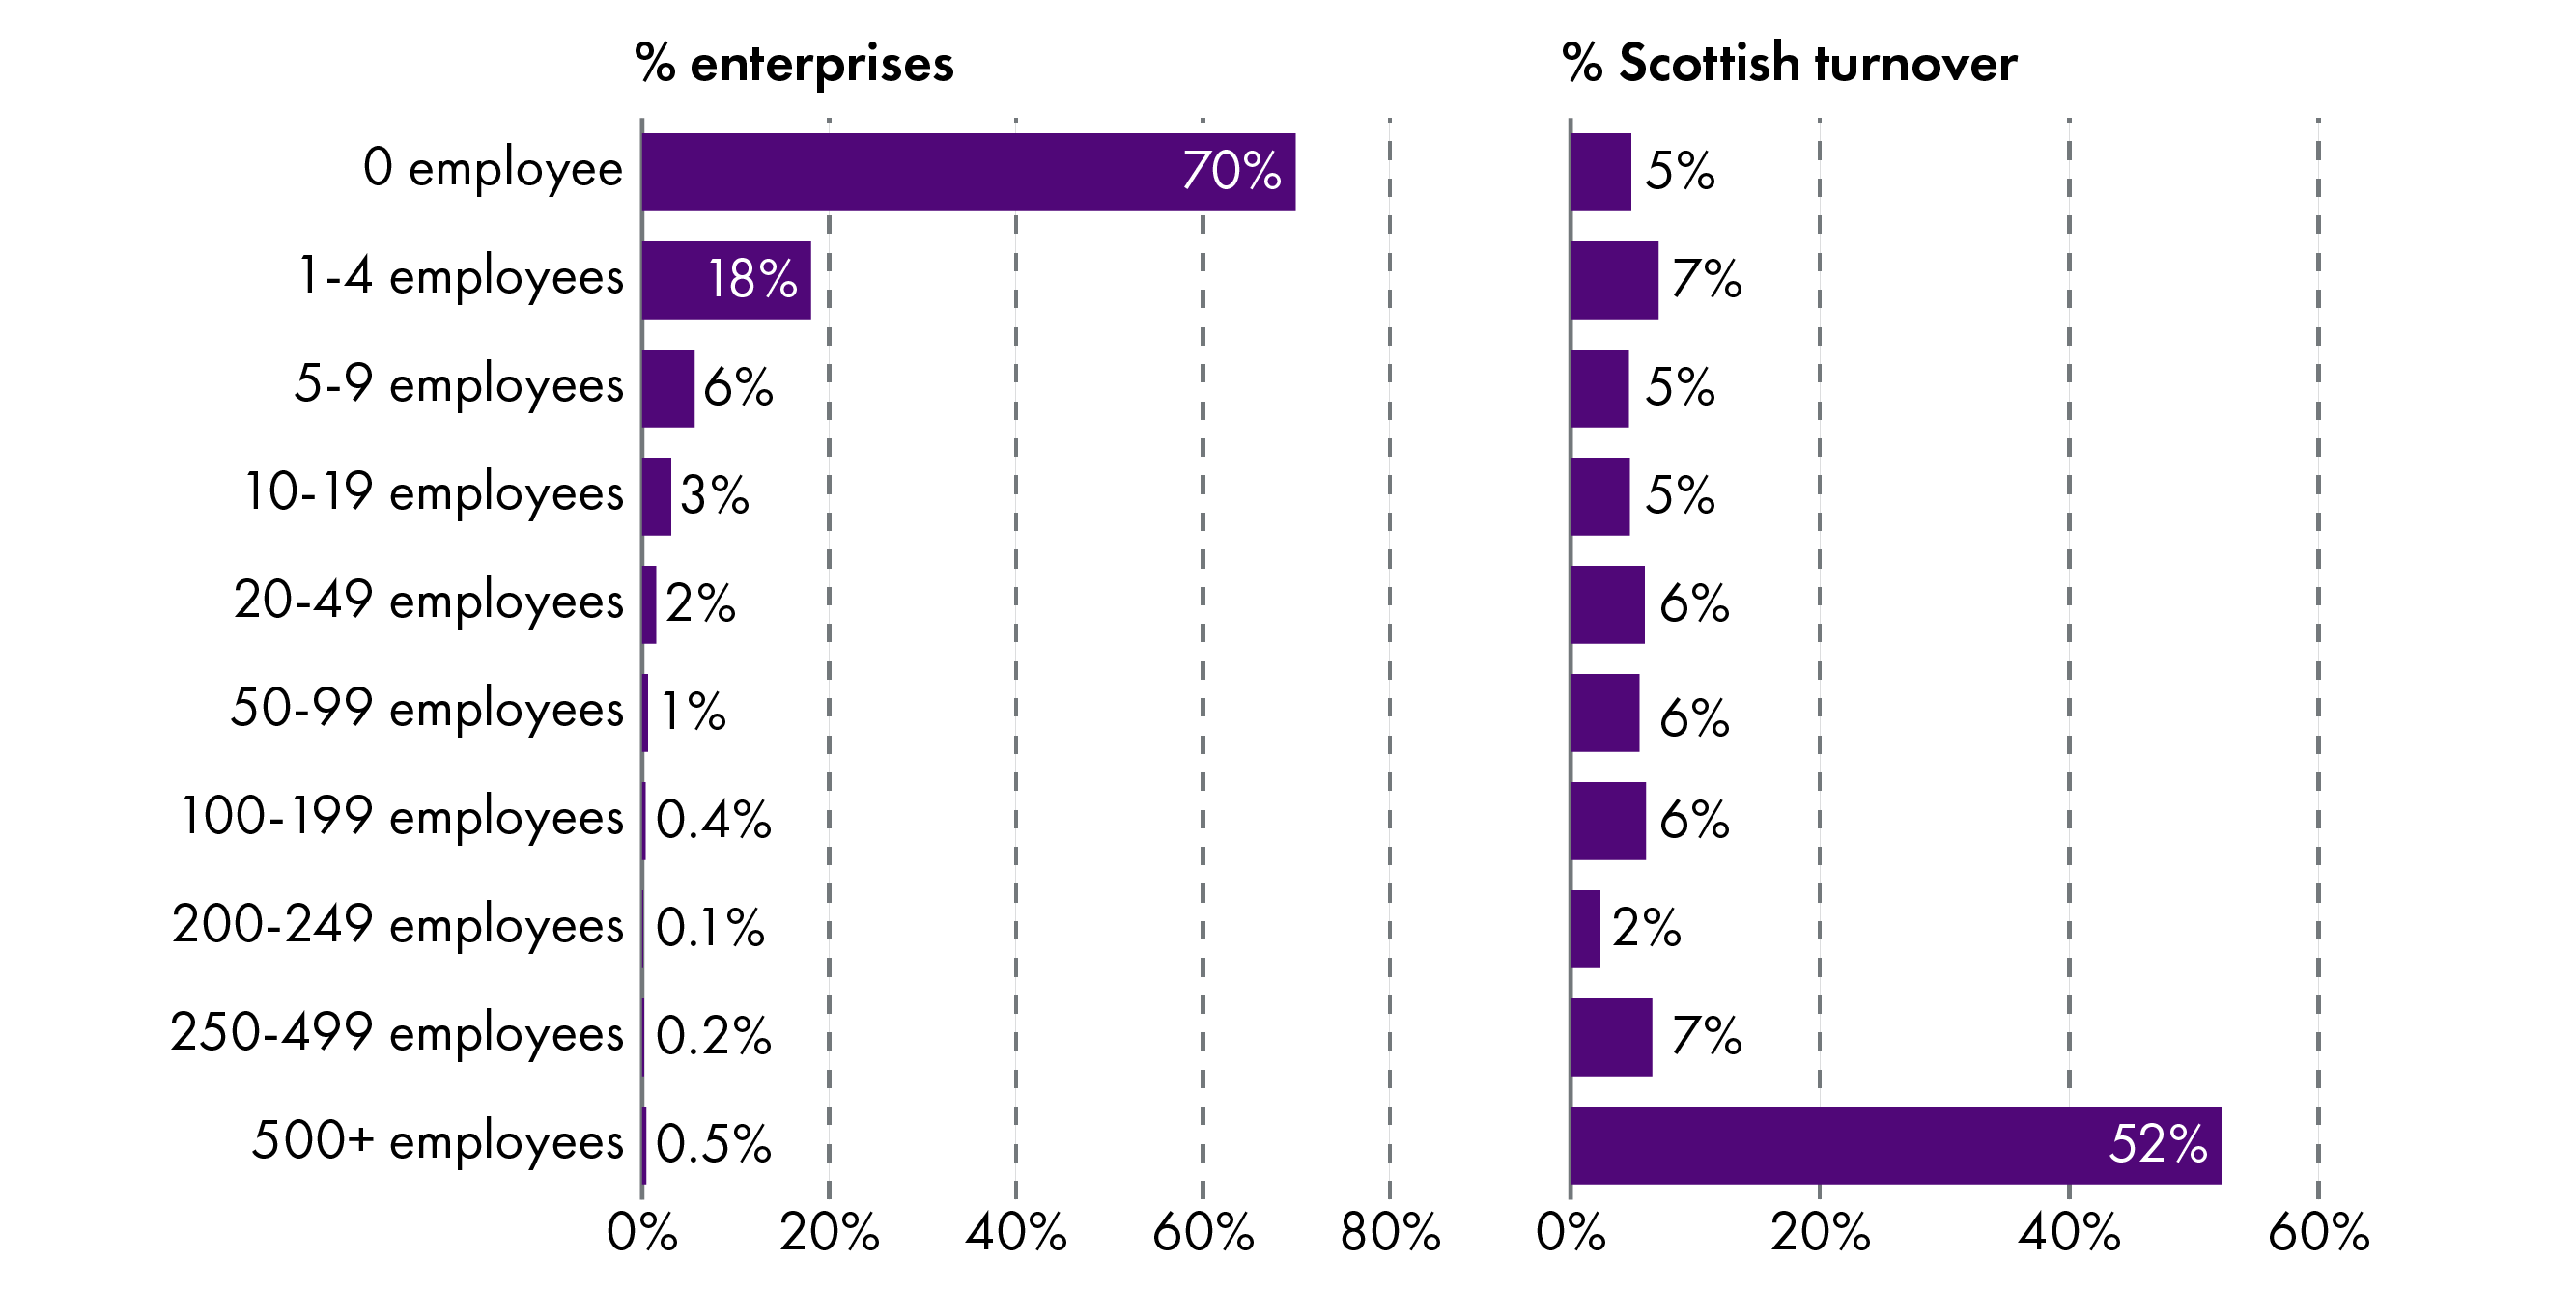
Scottish Government. (2020, November 11). Businesses in Scotland: 2020. Retrieved from https://www.gov.scot/publications/businesses-in-scotland-2020/ [accessed 16 August 2021]
Average business turnover in Scotland was £615,800. Of the UK nations and regions, London had the highest business turnover ratio, followed by the South East and West Midlands (see Table 7). Scotland was ranked eighth highest of the nations and regions.
| Region | Average turnover ratio per business |
|---|---|
| London | £1,103,000 |
| South East | £813,900 |
| England | £752,500 |
| United Kingdom | £726,900 |
| West Midlands | £721,300 |
| East of England | £687,600 |
| North West | £634,800 |
| Yorkshire and the Humber | £624,000 |
| East Midlands | £622,100 |
| Scotland | £615,800 |
| North East | £524,000 |
| Northern Ireland | £480,400 |
| Wales | £452,800 |
| South West | £412,900 |
Department for Business, Energy & Industrial Strategy (BEIS), UK Government . (2020, October 8). Business population estimates 2020. Retrieved from https://www.gov.uk/government/statistics/business-population-estimates-2020 [accessed 16 August 2021]
Investment
Business investment is net capital expenditure by private and public corporations. These include investments in transport equipment, information and communication technology (ICT) equipment, other machinery and equipment, cultivated assets, intellectual property products (IPP, which includes investment in software, research and development, artistic originals and mineral exploration), and other buildings and structures. Business investment is a component of gross fixed capital formation (GFCF).
| Definitions | |
|---|---|
| Net capital expenditure | This is the value of acquisitions (purchases) less disposals (sales) of fixed capital assets and is valued without adjusting for depreciation. It helps give a sense of how much money a company is spending on capital items such as property, plants and equipment. |
| GFCF (gross fixed capital formation) | Gross fixed capital formation is defined as the acquisition (including purchases of new or second-hand assets) and creation of assets by producers for their own use, minus disposals of produced fixed assets. |
Business investment does not include investment by central or local government, investment in dwellings, or the costs associated with the transfer of non-produced assets (such as land).
Scotland's business investment totalled £14.6 billion in 2019. Scotland's share of business investment represented 7% of total UK investment. Scotland's 2019 total represented an increase of 0.5% on the previous year. There has been a sustained period of growth since 2011 (see Figure 15). At a UK level, business investment followed a similar trajectory although has been more volatile since 2016.
Scottish Government . (2021, February 17). GDP quarterly national accounts: 2020 quarter 3. Retrieved from https://www.gov.scot/publications/gdp-quarterly-national-accounts-2020-q3/ [accessed 17 March 2021]
Companies by ownership
Information on the ownership of enterprises operating in Scotland is only available for the 179,455 enterprises registered for VAT and/or PAYE. Within the Scottish Government's ‘Businesses in Scotland1’ publication, enterprises can be either ‘Scotland based’, ‘Rest of the UK (RUK) based’ or 'Abroad-owned'. For example, 'Scotland based' businesses are enterprises that are UK-owned and that have their registered office in Scotland.
Ownership overview
The majority of Scotland's private sector enterprises were Scotland-owned (97%). These indigenous enterprises contributed 65% of employment and 47% of turnover. Total non Scottish owned enterprises (RUK-owned and Abroad-owned) represented 3% of enterprises, but accounted for 35% of employment and 53% of turnover.
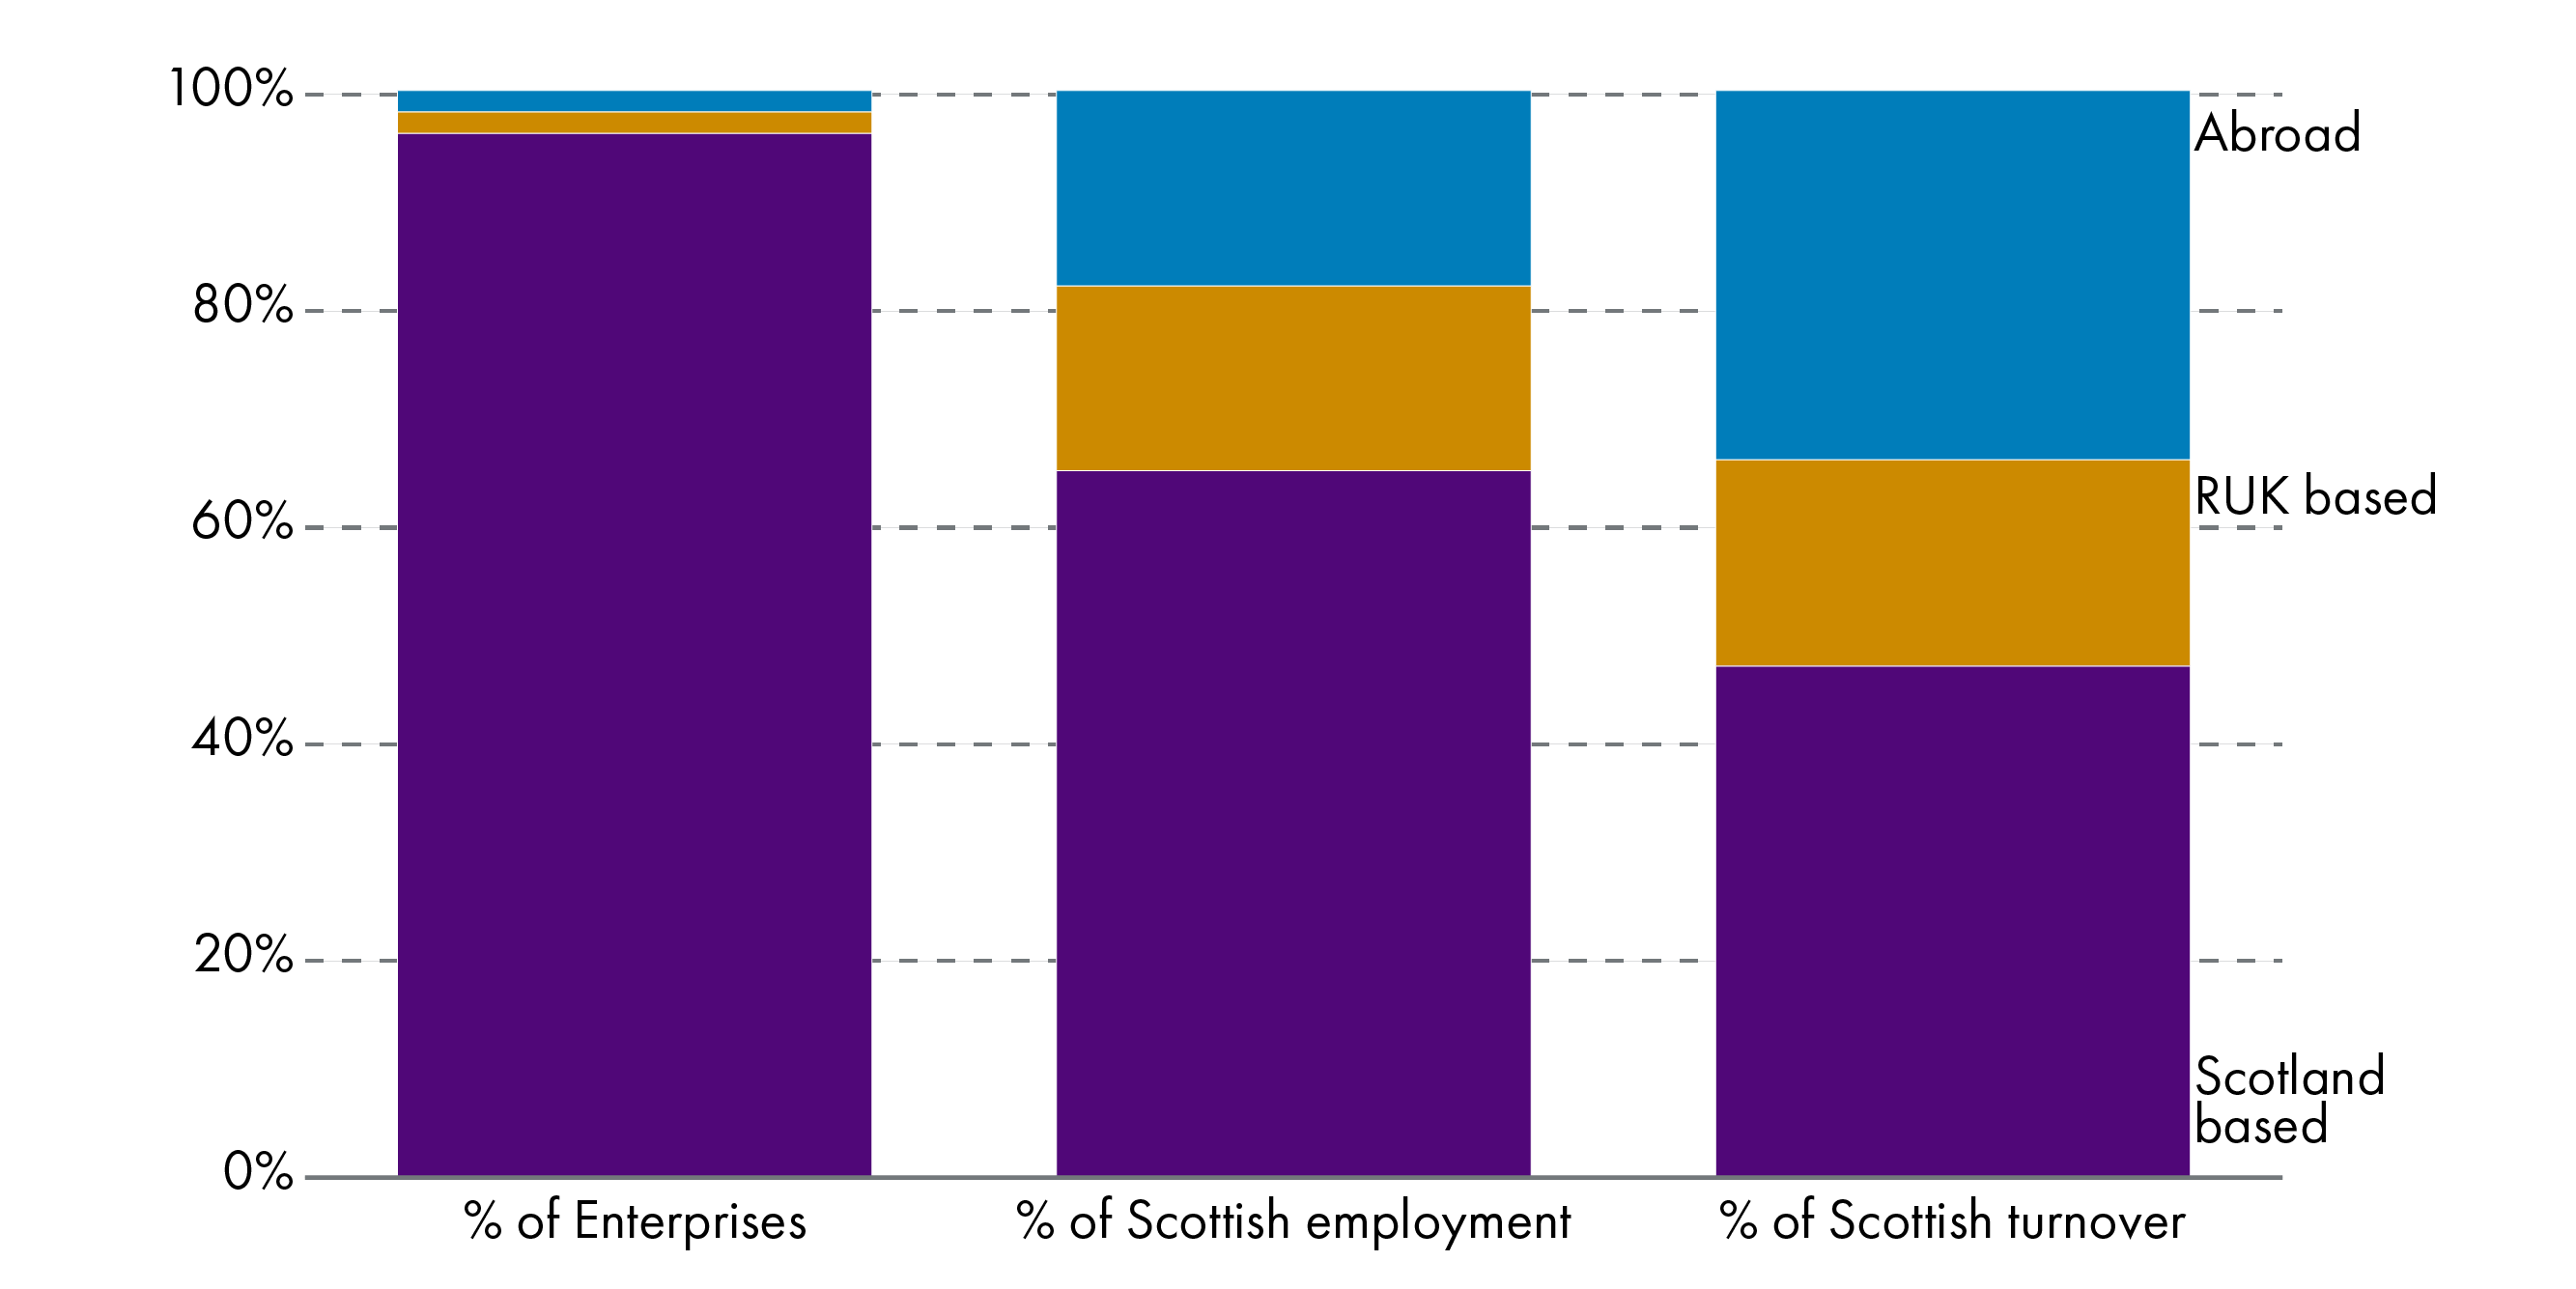
Scottish Government. (2020, November 11). Businesses in Scotland: 2020. Retrieved from https://www.gov.scot/publications/businesses-in-scotland-2020/ [accessed 16 August 2021]
Figure 17 examines ownership by size. The metrics (enterprises, employment, turnover) related to small enterprises (0-49 employees) were very much dominated by indigenous Scottish-owned firms. Whereas large enterprises (250+ employees) were more likely to be non-Scottish owned (RUK-owned and Abroad-owned).
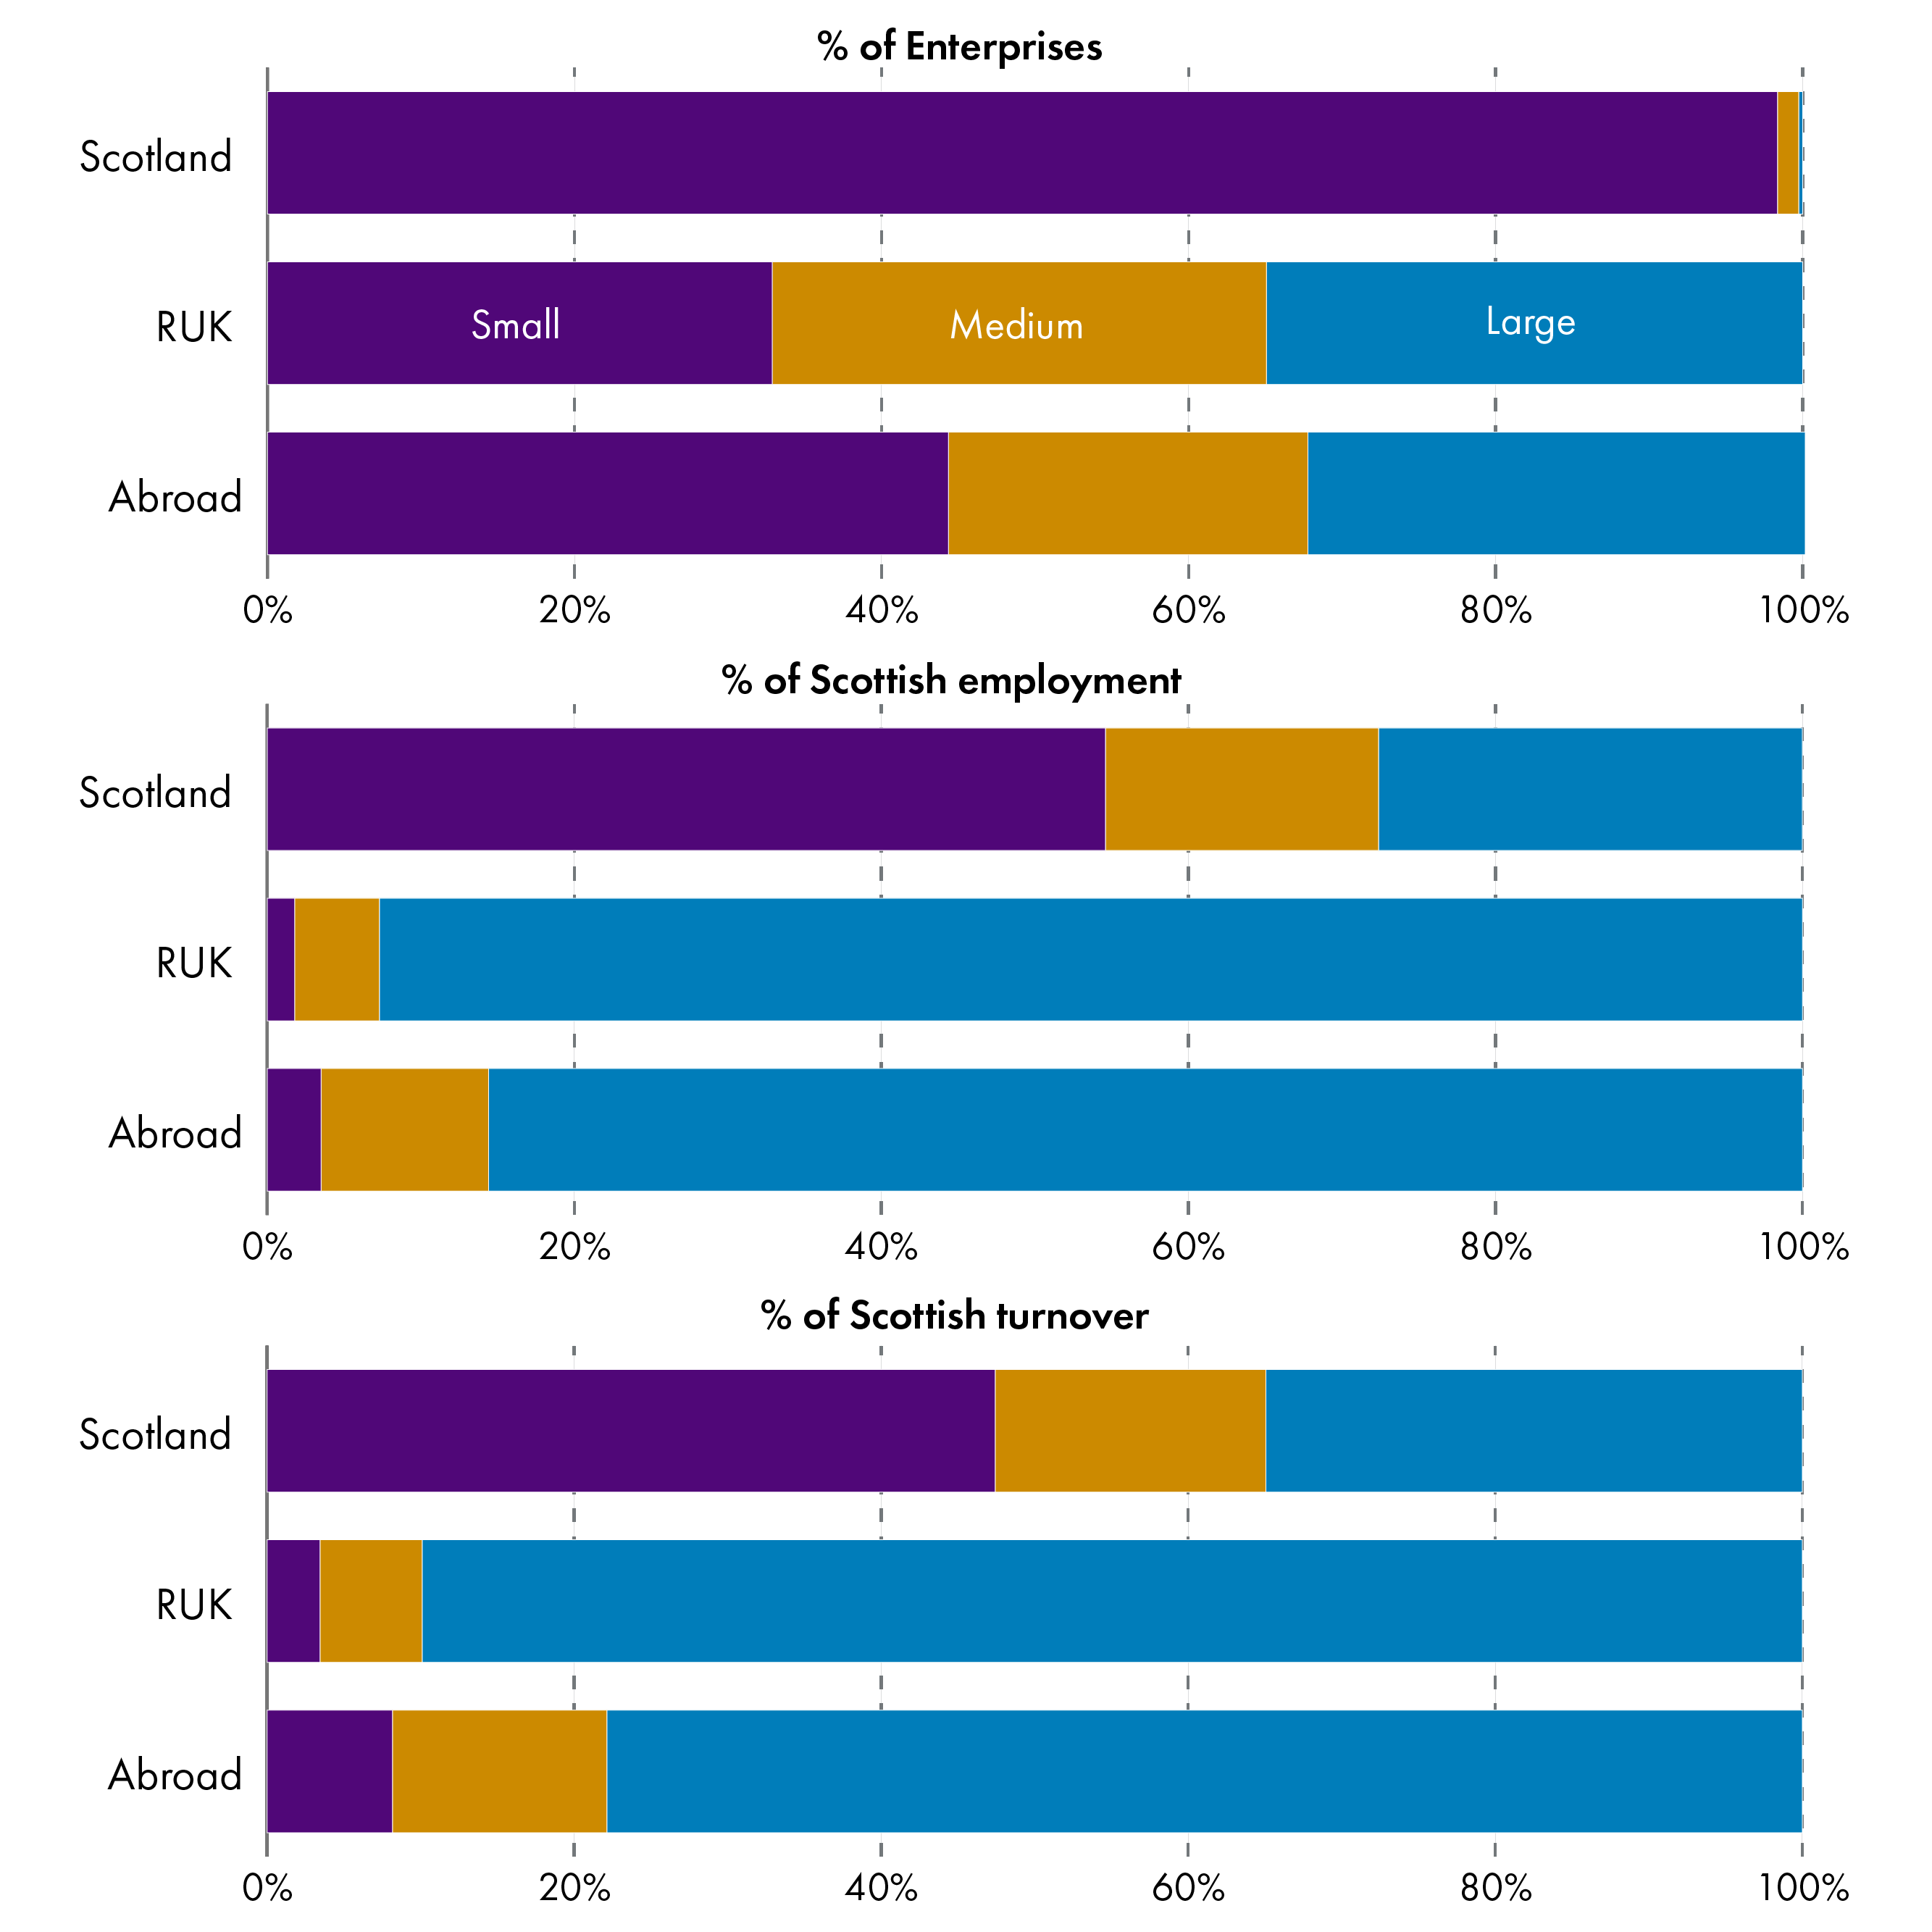
Scottish Government. (2020, November 11). Businesses in Scotland: 2020. Retrieved from https://www.gov.scot/publications/businesses-in-scotland-2020/ [accessed 16 August 2021]
Ownership by sector
The majority of industry sectors were in line with the overall Scottish average, where 97% of firms are Scottish owned (see Figure 18). The main areas of variation were financial and insurance activities (12% non-Scottish owned), manufacturing (7% non-Scottish owned), transport & storage (6% non-Scottish owned), and wholesale & retail trade (5% non-Scottish owned). However, when share of employment by industry sector is examined by ownership, much more disparity is evident (Figure 19).
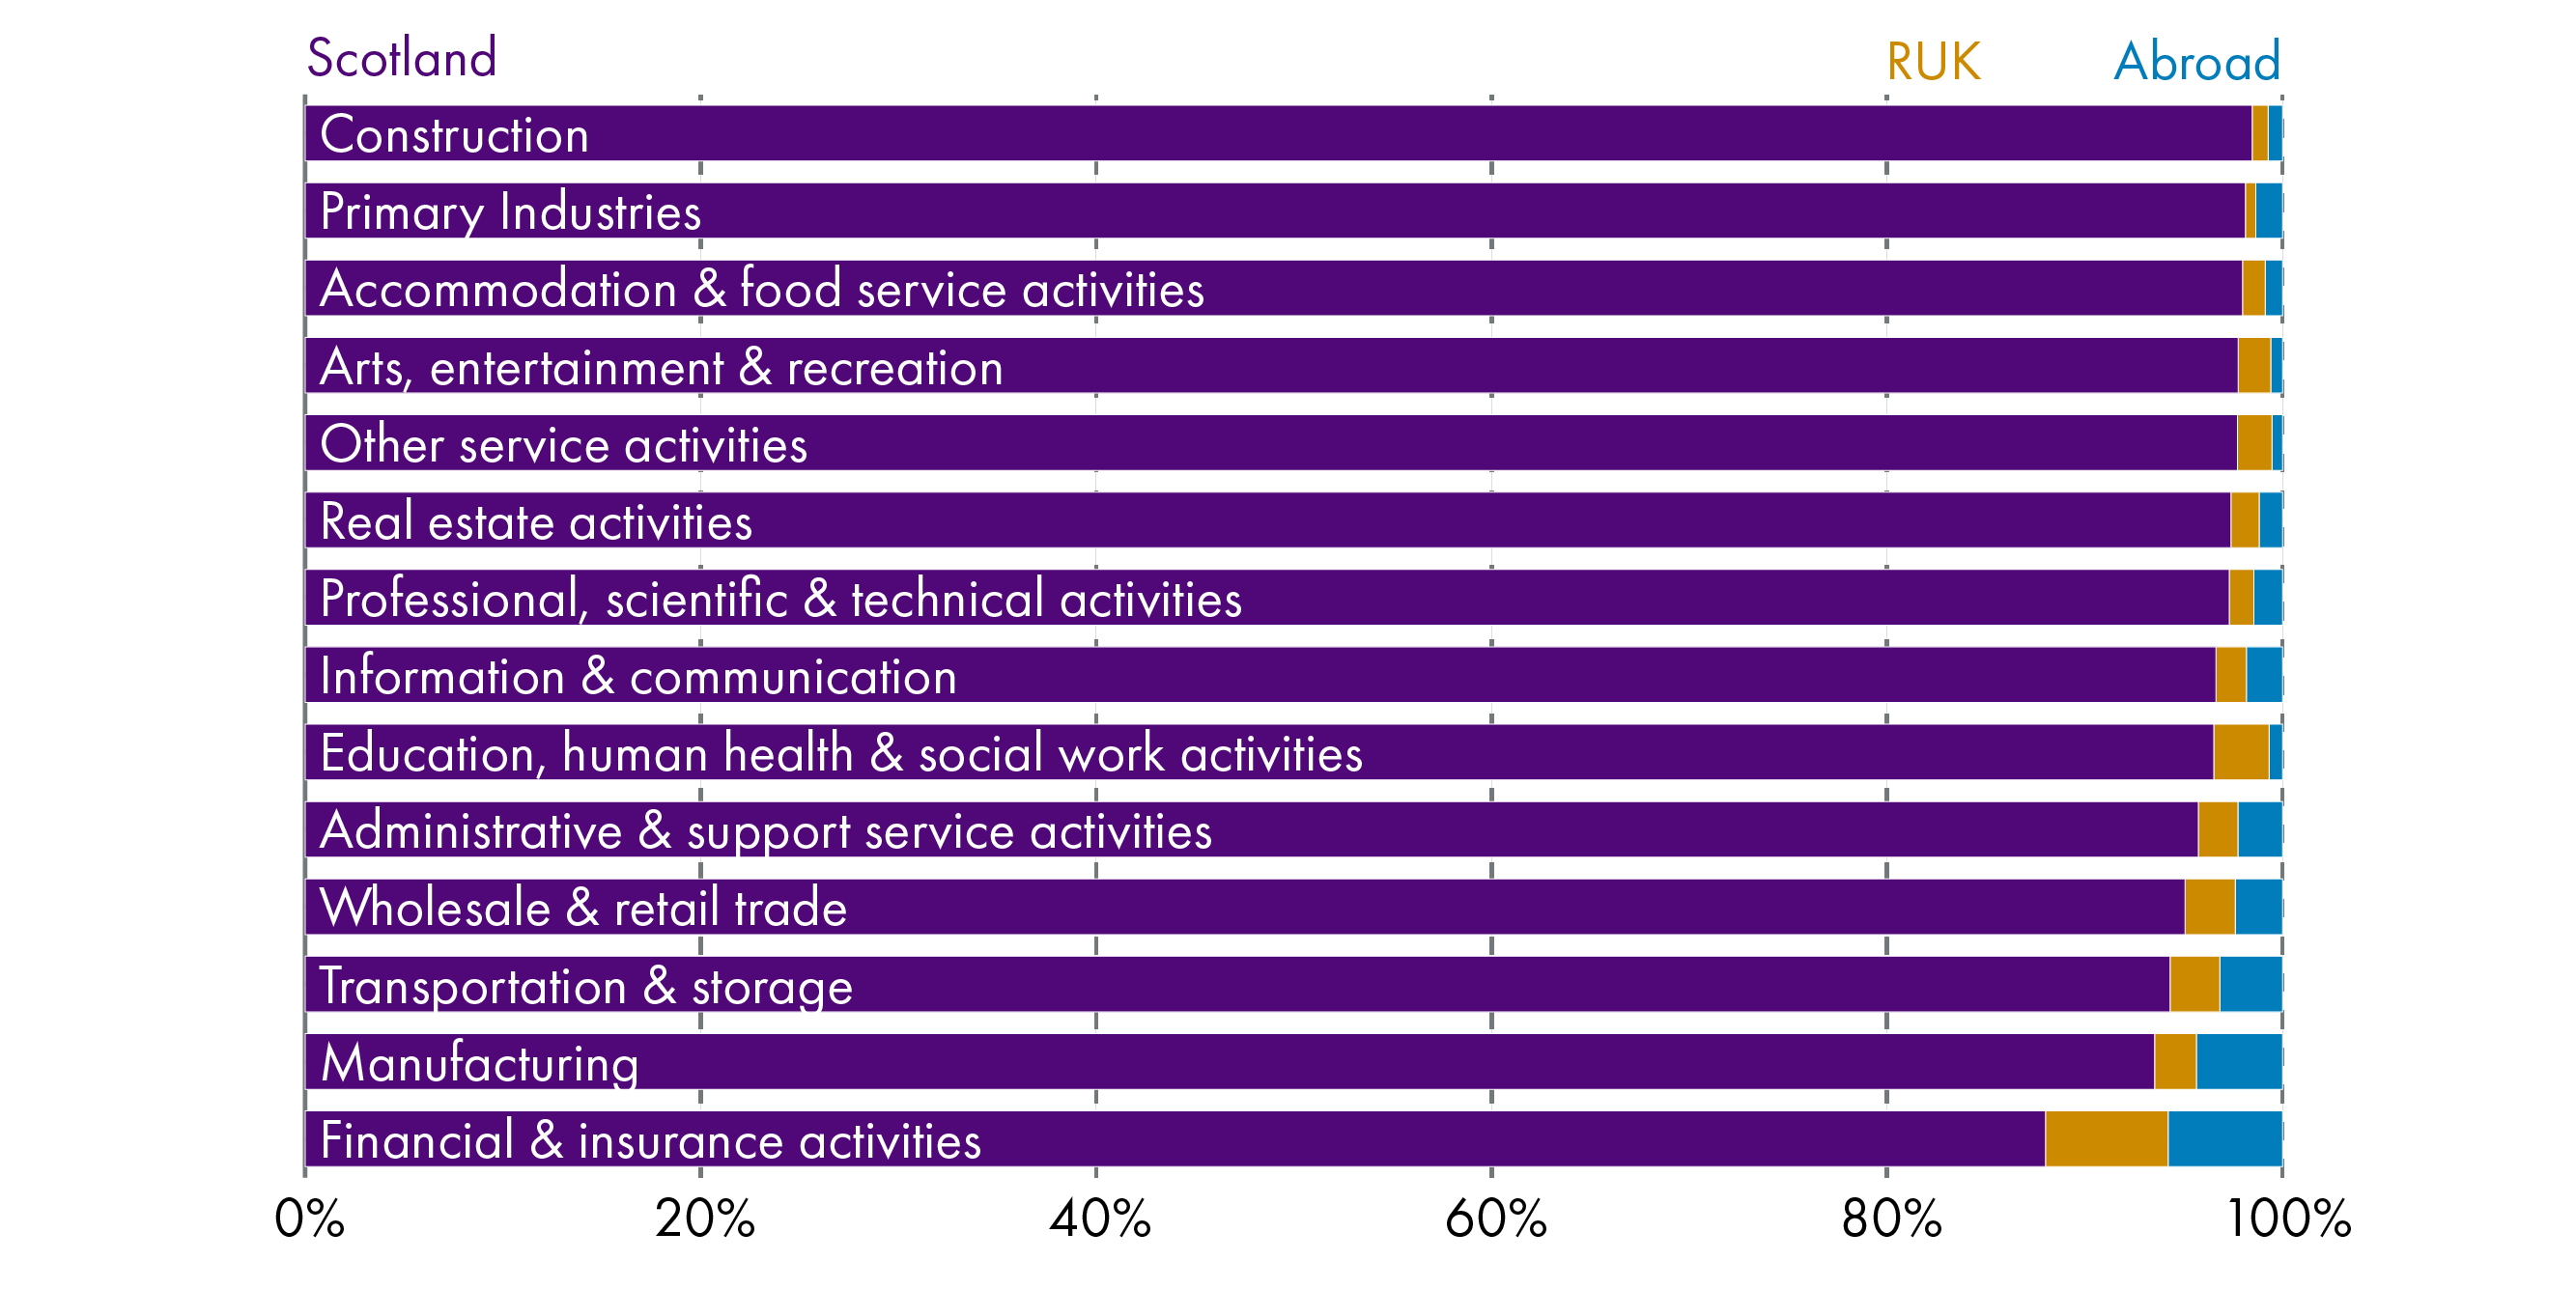
Scottish Government. (2020, November 11). Businesses in Scotland: 2020. Retrieved from https://www.gov.scot/publications/businesses-in-scotland-2020/ [accessed 16 August 2021]
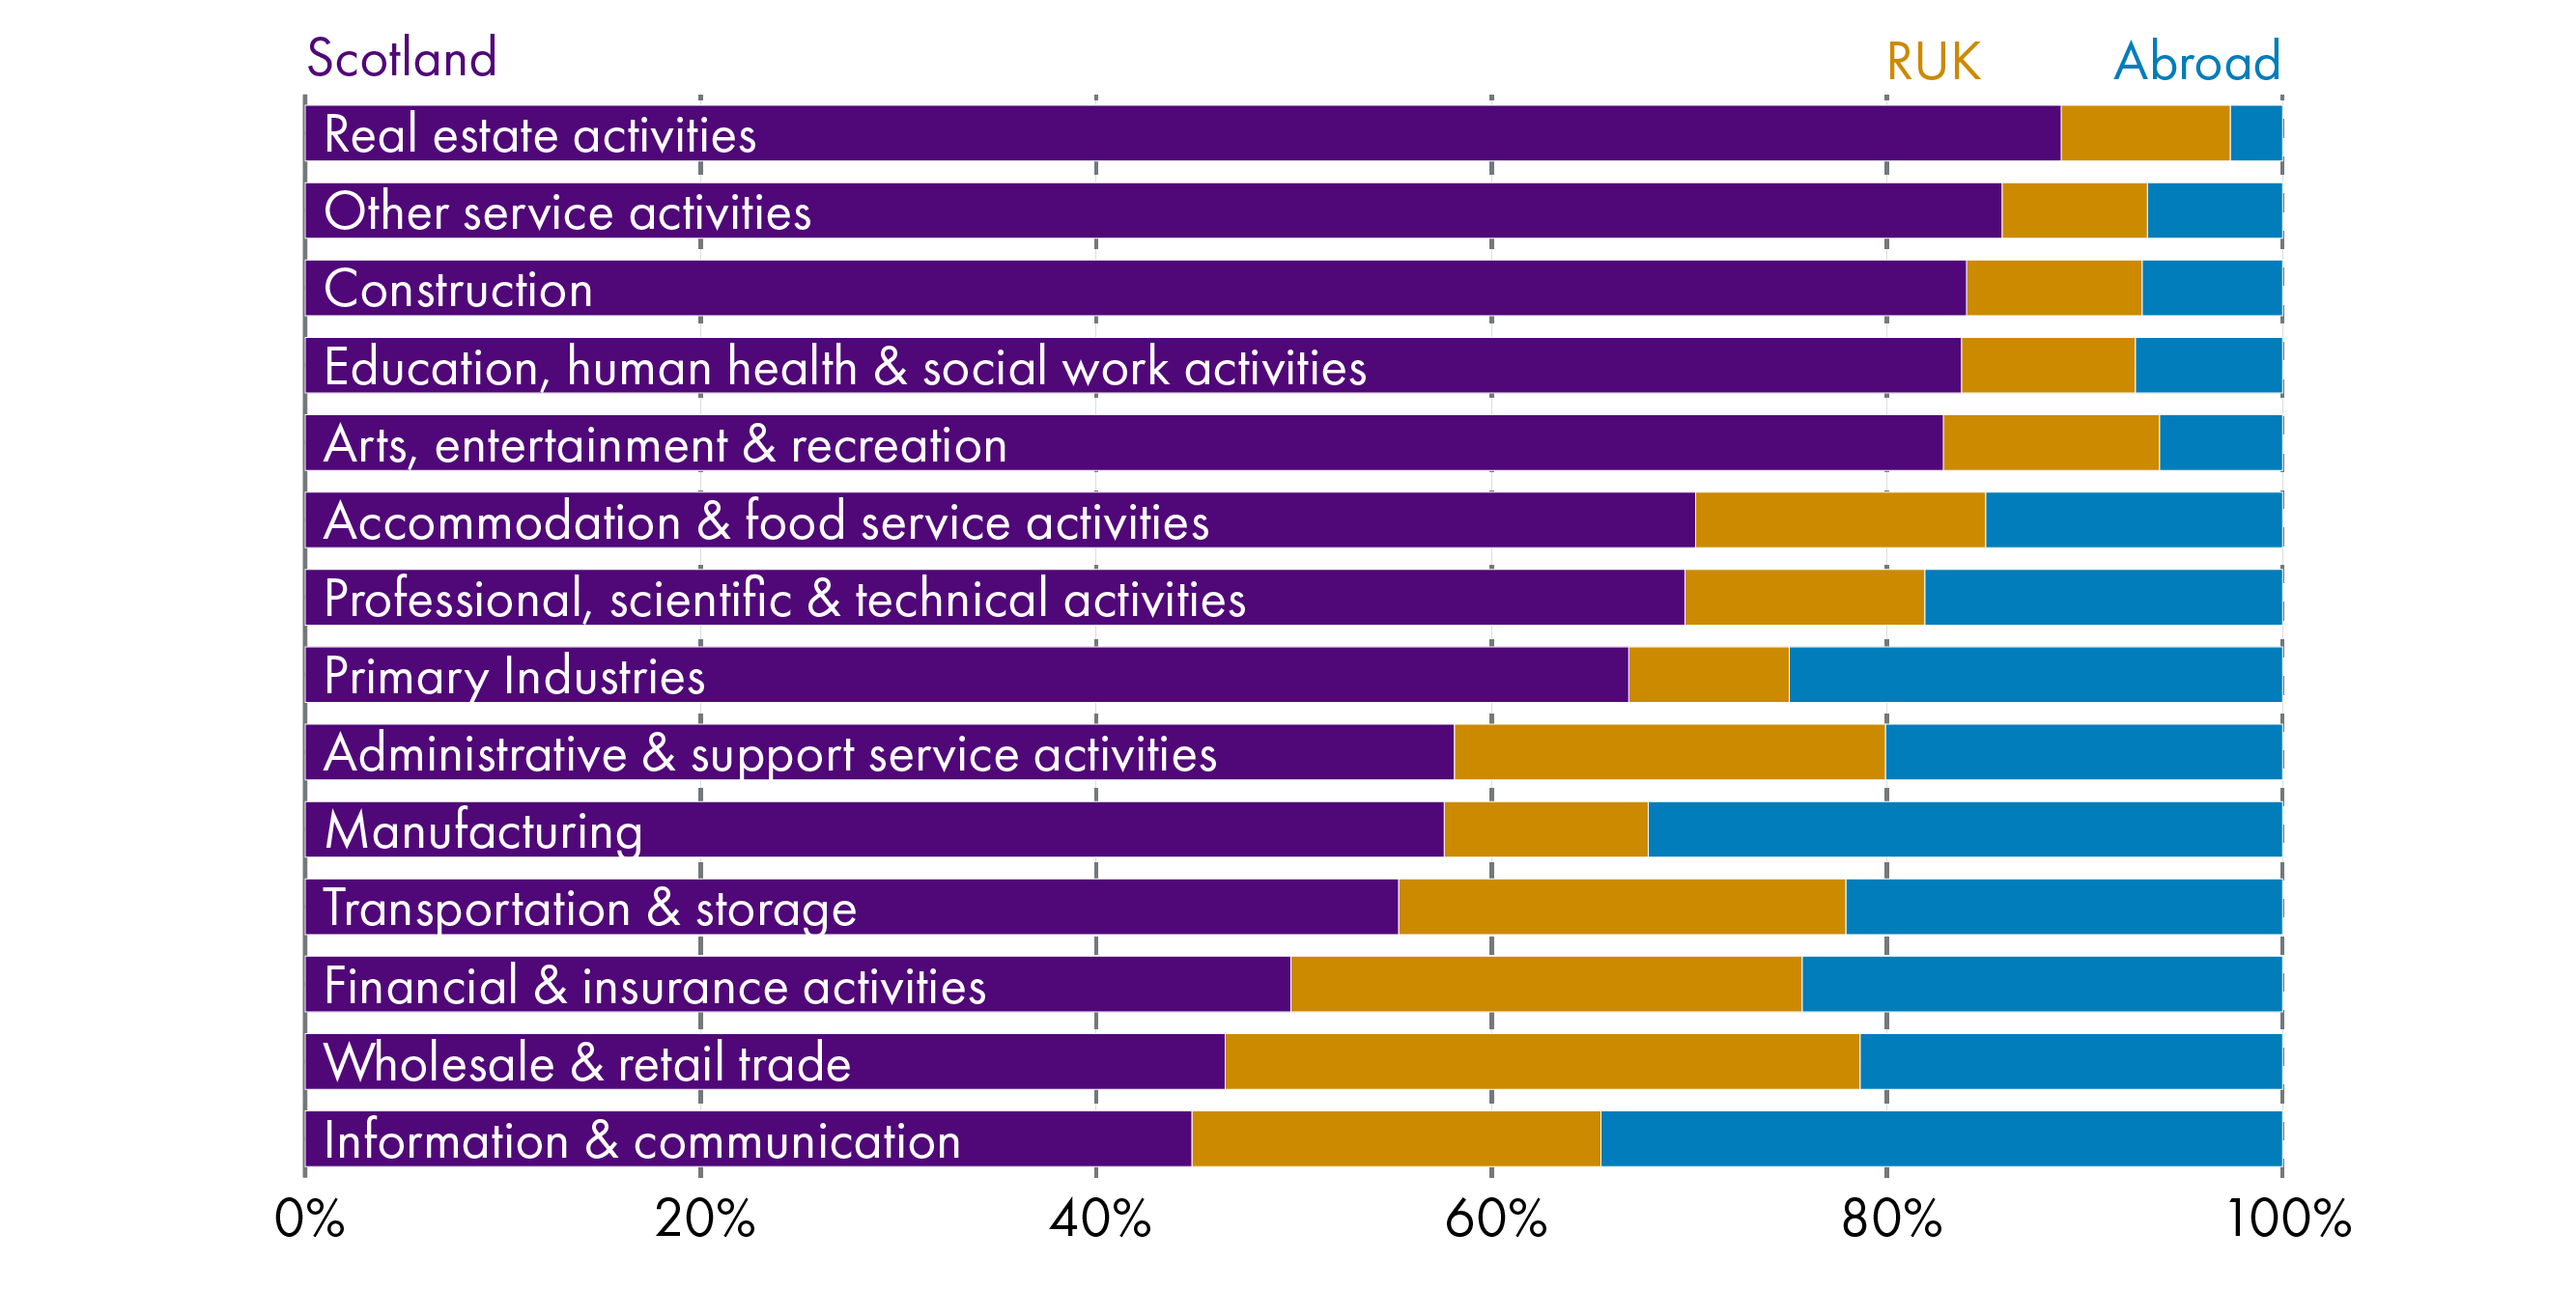
The share of employment provided by Abroad-owned enterprises was significantly greater than the proportion of Abroad-owned enterprises (see Figure 19). This illustrates the importance of international investment in job creation, although this dataset doesn't clarify the quality of the jobs created.
Only 2% of primary industry enterprises were Abroad-owned, yet these provided 25% of employment in the sector.
Four percent of manufacturing enterprises were Abroad-owned, providing 32% of employment in the sector.
Information and communication (35%), wholesale and retail (21%), transport and storage (22%), finance and insurance (24%) all had high shares of employment provided by Abroad-owned enterprises, relative to their total share of Abroad-owned firms.
The industry sectors other service activities (86%), real estate activities (89%), and construction (84%) all provided a high share of Scottish-owned employment.
Scottish Government. (2020, November 11). Businesses in Scotland: 2020. Retrieved from https://www.gov.scot/publications/businesses-in-scotland-2020/ [accessed 16 August 2021]
Abroad-owned insights
Figure 16 showed that 2% of all registered enterprises in Scotland were Abroad-owned. This represented 3,010 of Scottish registered enterprises. Of these, the largest proportions originated from the European Union (EU) and USA:
1,265 were EU Abroad-owned (42%) enterprises operating in Scotland – employing 128,780 people and generating a turnover of £35 billion (12% of all turnover from registered businesses in Scotland or 36% of all turnover from abroad-owned registered businesses in Scotland)
660 were USA Abroad-owned (22%) enterprises operating in Scotland – employing 112,740 people and generating a turnover of £31 billion (11% of all turnover from registered businesses in Scotland or 32% of all turnover from abroad-owned registered businesses in Scotland).
The remainder of Abroad-owned enterprises originated from a multitude of geographies, including Japan (105 enterprises), Canada (60), and Cayman Islands (60), and Australia (45) to name but a few .
Business by local geography
This section provides an overview of Scotland's business base by local authority, parliamentary constituency, and urban-rural split. The data source used begins in 2010, thus this analysis has focussed on 1-year and 10-year growth rates.
Volume and trends by local authority
Table 8 provides a breakdown of the business base by local authority.
The top five local authority areas for business volumes in descending order were: Glasgow City (11% of all registered Scottish businesses), City of Edinburgh (10.8%), Aberdeenshire (7.4%), Highland (6%), and Fife (5.4%).
On the other end of the scale both Na h-Eileanan Siar (0.7%) and Clackmannanshire (0.7%) had the lowest number of enterprises, followed by the Orkney Islands (0.8%), Shetland Islands (0.8%), and Inverclyde (0.9%).
However, when business volumes are viewed as a ratio of adult population in an area – illustrating business density in an area – the top five picture is quite different (again in descending order): Shetland Islands, Orkney Islands, Aberdeenshire, Highland, and Na h-Eileanan Siar. For more details see the Business Density Section.
Between 2019 and 2020, 12 local authority areas saw an increase in the number of registered enterprises and there was no change in nine areas. However, 11 of Scotland’s 32 local authority areas experienced a falling registered business count between 2019 and 2020.
The highest declines were: Highland (-125), Aberdeenshire (-70), Aberdeen (-60), East Dunbartonshire (-55), and Perth and Kinross (-50).
Glasgow City local authority area experienced the greatest increase, with a rise of 460 enterprises between 2019 and 2020, followed by the City of Edinburgh local authority area with an increase of 215 enterprises.
The 2010 to 2020 growth rate for local authority business stock was positive in all but three local authorities:
Dumfries & Galloway saw business stock decrease by 2% and Argyll & Bute a decrease of 1%
there was zero percent growth on the Orkney Islands, where stock rates plateaued
Edinburgh (30%), Glasgow (27%), Midlothian (25%), and North Lanarkshire (24%) had the highest stock growth rates over the period.
| No. Registered Enterprises | % of Scottish Total | % Change 2019 to 2020 | % Change 2010-2020 | |
|---|---|---|---|---|
| Aberdeen City | 9,555 | 5% | -1% | 14% |
| Aberdeenshire | 14,200 | 7% | 0% | 11% |
| Angus | 4,155 | 2% | 0% | 9% |
| Argyll and Bute | 4,040 | 2% | 0% | -1% |
| City of Edinburgh | 20,715 | 11% | 1% | 30% |
| Clackmannanshire | 1,250 | 1% | -1% | 6% |
| Dumfries and Galloway | 6,685 | 3% | -1% | -2% |
| Dundee City | 3,925 | 2% | 2% | 15% |
| East Ayrshire | 3,550 | 2% | 2% | 13% |
| East Dunbartonshire | 3,145 | 2% | -2% | 15% |
| East Lothian | 3,410 | 2% | 0% | 21% |
| East Renfrewshire | 2,790 | 1% | -1% | 21% |
| Falkirk | 4,215 | 2% | 0% | 15% |
| Fife | 10,460 | 5% | 1% | 18% |
| Glasgow City | 20,965 | 11% | 2% | 27% |
| Highland | 11,480 | 6% | -1% | 7% |
| Inverclyde | 1,805 | 1% | -1% | 7% |
| Midlothian | 2,720 | 1% | 3% | 25% |
| Moray | 3,565 | 2% | 0% | 8% |
| Na h-Eileanan Siar | 1,250 | 1% | 0% | 10% |
| North Ayrshire | 3,570 | 2% | 1% | 10% |
| North Lanarkshire | 8,390 | 4% | 1% | 24% |
| Orkney Islands | 1,535 | 1% | -3% | 0% |
| Perth and Kinross | 6,585 | 3% | -1% | 6% |
| Renfrewshire | 5,255 | 3% | 1% | 15% |
| Scottish Borders | 5,275 | 3% | 0% | 2% |
| Shetland Islands | 1,580 | 1% | 1% | 17% |
| South Ayrshire | 3,840 | 2% | -2% | 4% |
| South Lanarkshire | 9,645 | 5% | 0% | 15% |
| Stirling | 4,305 | 2% | 1% | 10% |
| West Dunbartonshire | 2,185 | 1% | 7% | 22% |
| West Lothian | 5,300 | 3% | -1% | 20% |
Scottish Government. (2020, November 11). Businesses in Scotland: 2020. Retrieved from https://www.gov.scot/publications/businesses-in-scotland-2020/ [accessed 16 August 2021]Totals may not equal the sum of the constituent parts due to rounding.
Local authority business density
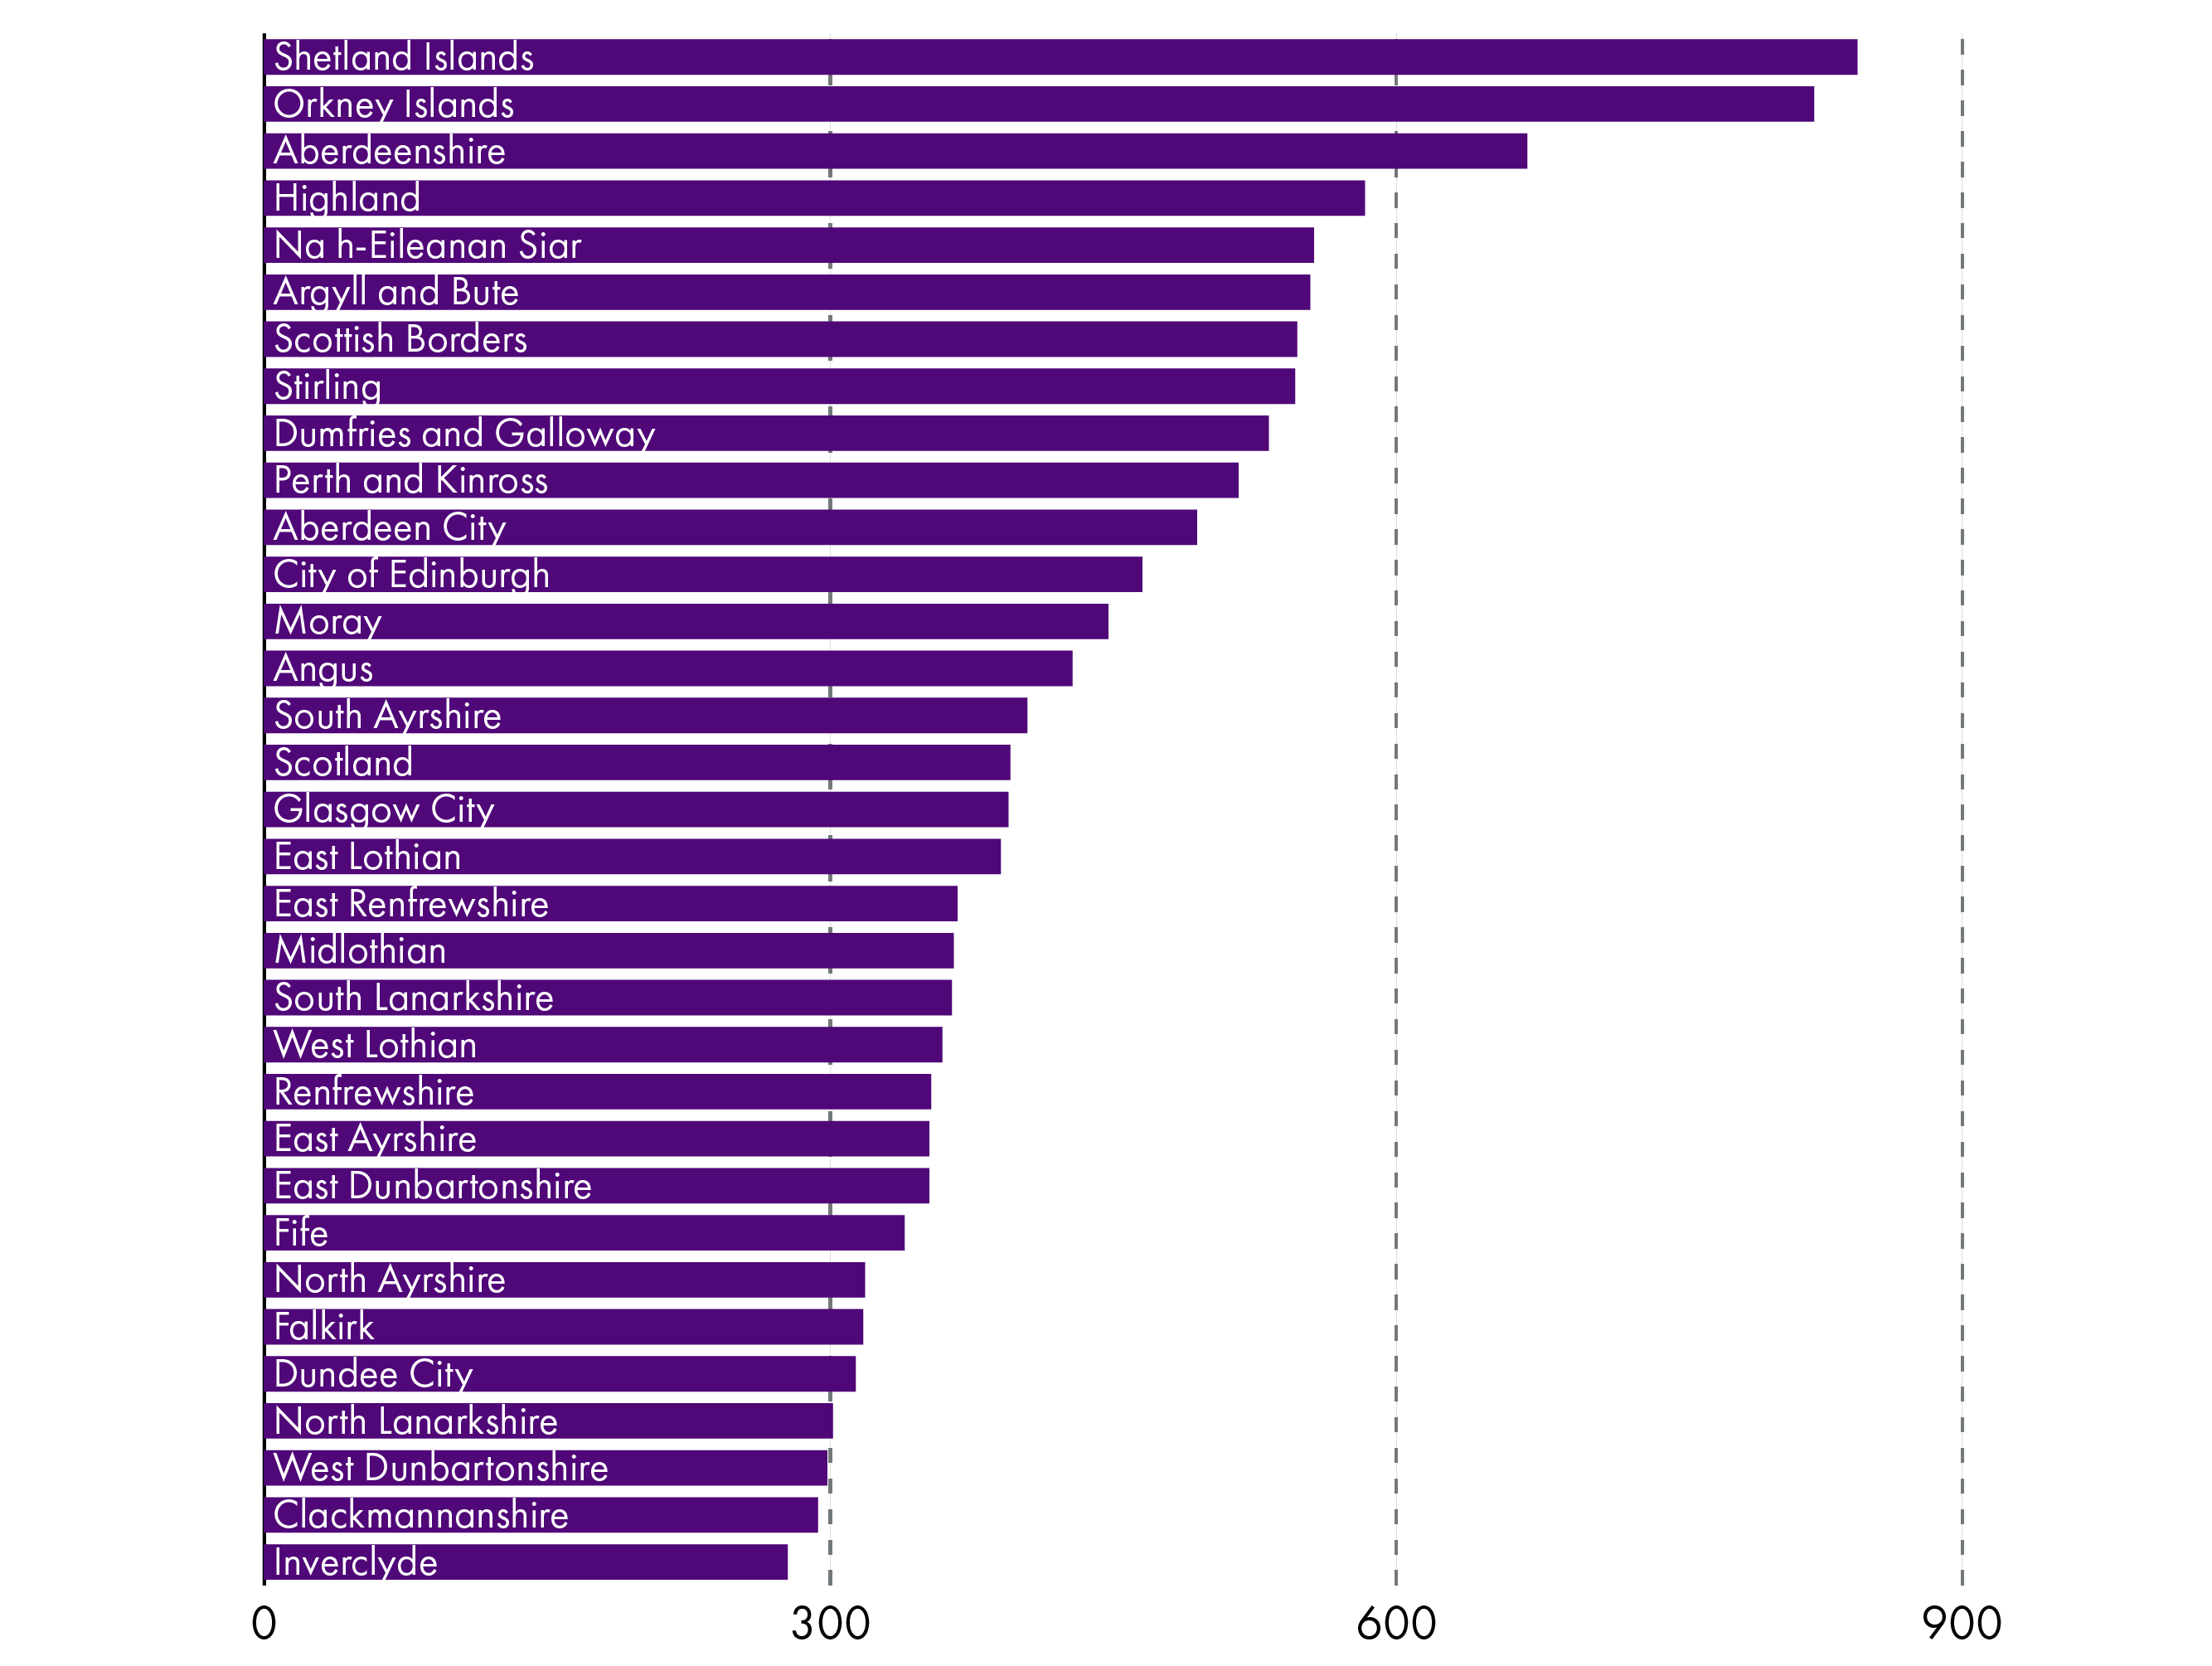
The average number of businesses (registered) in Scotland per 10,000 resident adults was 395 in 2020.
The Shetland Islands have the highest business density ratio in Scotland. Many of the areas with high ranking business density rates were rural.
Inverclyde had the lowest business density rate. A characteristic of the lower ranking areas was that many contained commuter towns and villages, or were within city suburbs.
Scottish Government. (2020, November 11). Businesses in Scotland: 2020. Retrieved from https://www.gov.scot/publications/businesses-in-scotland-2020/ [accessed 16 August 2021]
Business base by constituency
Table 9 provides a breakdown of the business base by parliamentary constituency.
The top five constituencies for business stock in 2020 were: Edinburgh Central (4.5% of registered local units), Glasgow Kelvin (4.5%), Aberdeen Central (2.5%), Aberdeenshire West (2.3%), and Skye, Lochaber and Badenoch (2.2%). In contrast, the areas with the lowest volume of business stock were: Na hEileanan an Iar (0.7%), Glasgow Anniesland (0.8%), Glasgow Provan (0.8%), Orkney islands (0.8%), and Glasgow Cathcart (0.8%).
In the year to 2020, there was mixed performance in terms of business stock growth across constituencies.
Eighteen constituencies saw business stock levels grow, with Glasgow Southside and Kirkcaldy having the most significant rates of growth.
Four constituencies maintained the same levels (Dunfermline, Eastwood, Na h-Eileanan an Iar, Airdrie and Shotts
Thirty-two constituencies experienced declines in their business base. Cowdenbeath and Ayr had the most significant declines.
All but two constituencies have seen business stock increase since 2010. The two constituencies with long-term declines in business stock were Ettrick, Roxburgh and Berwickshire and Galloway and West Dumfries. Generally, rural constituencies have had relatively moderate growth , whereas urban areas, particularly cities, have seen significant growth.
| Scottish Parliament Constituency | Local Units 2020 | % of total | 1-year % change (2019 to 2020) | % change 2010 to 2020 |
|---|---|---|---|---|
| Aberdeen Central | 5,785 | 2.6% | -0.8% | 19% |
| Aberdeen Donside | 2,960 | 1.3% | -0.3% | 18% |
| Aberdeen South and North Kincardine | 3,765 | 1.7% | 0.1% | 21% |
| Aberdeenshire East | 4,575 | 2.0% | -0.8% | 11% |
| Aberdeenshire West | 5,140 | 2.3% | -1.0% | 11% |
| Airdrie and Shotts | 1,950 | 0.9% | 0.0% | 6% |
| Almond Valley | 2,925 | 1.3% | -0.2% | 27% |
| Angus North and Mearns | 3,595 | 1.6% | -0.1% | 5% |
| Angus South | 2,655 | 1.2% | -0.6% | 14% |
| Argyll and Bute | 3,895 | 1.7% | 0.3% | 3% |
| Ayr | 2,880 | 1.3% | -3.2% | 6% |
| Banffshire and Buchan Coast | 4,180 | 1.9% | 0.1% | 12% |
| Caithness, Sutherland and Ross | 4,715 | 2.1% | -1.5% | 12% |
| Carrick, Cumnock and Doon Valley | 2,840 | 1.3% | 1.6% | 10% |
| Clackmannanshire and Dunblane | 2,100 | 0.9% | -1.2% | 9% |
| Clydebank and Milngavie | 2,170 | 1.0% | 0.2% | 18% |
| Clydesdale | 3,130 | 1.4% | -1.1% | 8% |
| Coatbridge and Chryston | 2,010 | 0.9% | -0.5% | 8% |
| Cowdenbeath | 2,305 | 1.0% | -5.1% | 37% |
| Cumbernauld and Kilsyth | 2,025 | 0.9% | 0.2% | 16% |
| Cunninghame North | 2,395 | 1.1% | -1.0% | 7% |
| Cunninghame South | 1,815 | 0.8% | 2.3% | 6% |
| Dumbarton | 2,280 | 1.0% | 5.3% | 15% |
| Dumfriesshire | 4,120 | 1.8% | -0.4% | 3% |
| Dundee City East | 1,975 | 0.9% | 1.3% | 14% |
| Dundee City West | 2,835 | 1.3% | 2.3% | 13% |
| Dunfermline | 2,565 | 1.1% | 0.0% | 20% |
| East Kilbride | 2,490 | 1.1% | -1.0% | 19% |
| East Lothian | 3,040 | 1.4% | -0.7% | 26% |
| Eastwood | 2,450 | 1.1% | 0.0% | 25% |
| Edinburgh Central | 10,075 | 4.5% | 0.9% | 22% |
| Edinburgh Eastern | 2,270 | 1.0% | 0.2% | 45% |
| Edinburgh Northern and Leith | 3,980 | 1.8% | 0.5% | 31% |
| Edinburgh Pentlands | 2,290 | 1.0% | 3.9% | 59% |
| Edinburgh Southern | 2,915 | 1.3% | 1.2% | 24% |
| Edinburgh Western | 3,130 | 1.4% | 0.8% | 26% |
| Ettrick, Roxburgh and Berwickshire | 3,620 | 1.6% | -0.8% | -1% |
| Falkirk East | 2,140 | 1.0% | 2.4% | 14% |
| Falkirk West | 2,655 | 1.2% | -1.5% | 17% |
| Galloway and West Dumfries | 3,505 | 1.6% | -1.3% | -1% |
| Glasgow Anniesland | 1,685 | 0.8% | 0.6% | 28% |
| Glasgow Cathcart | 1,765 | 0.8% | -0.3% | 24% |
| Glasgow Kelvin | 10,050 | 4.5% | 0.7% | 17% |
| Glasgow Maryhill and Springburn | 1,920 | 0.9% | 3.5% | 33% |
| Glasgow Pollok | 2,010 | 0.9% | 3.1% | 28% |
| Glasgow Provan | 1,685 | 0.8% | 2.4% | 44% |
| Glasgow Shettleston | 2,900 | 1.3% | 2.3% | 31% |
| Glasgow Southside | 3,755 | 1.7% | 12.1% | 41% |
| Greenock and Inverclyde | 1,810 | 0.8% | -0.3% | 6% |
| Hamilton, Larkhall and Stonehouse | 2,590 | 1.2% | 1.0% | 32% |
| Inverness and Nairn | 4,255 | 1.9% | -0.8% | 10% |
| Kilmarnock and Irvine Valley | 2,860 | 1.3% | -0.9% | 9% |
| Kirkcaldy | 2,445 | 1.1% | 10.4% | 19% |
| Linlithgow | 3,095 | 1.4% | -1.1% | 18% |
| Mid Fife and Glenrothes | 2,130 | 1.0% | -0.5% | 6% |
| Midlothian North and Musselburgh | 2,905 | 1.3% | 2.3% | 25% |
| Midlothian South, Tweeddale and Lauderdale | 3,235 | 1.4% | 0.6% | 18% |
| Moray | 3,445 | 1.5% | 0.1% | 12% |
| Motherwell and Wishaw | 2,275 | 1.0% | 0.9% | 11% |
| Na h-Eileanan an Iar | 1,505 | 0.7% | 0.0% | 11% |
| North East Fife | 2,870 | 1.3% | 0.7% | 6% |
| Orkney Islands | 1,740 | 0.8% | -2.0% | 5% |
| Paisley | 2,675 | 1.2% | -0.2% | 8% |
| Perthshire North | 3,955 | 1.8% | -1.7% | 8% |
| Perthshire South and Kinrossshire | 3,355 | 1.5% | 0.1% | 10% |
| Renfrewshire North and West | 2,700 | 1.2% | 0.7% | 32% |
| Renfrewshire South | 1,780 | 0.8% | -1.7% | 21% |
| Rutherglen | 2,225 | 1.0% | 0.5% | 18% |
| Shetland Islands | 1,845 | 0.8% | 0.3% | 15% |
| Skye, Lochaber and Badenoch | 4,910 | 2.2% | -0.2% | 9% |
| Stirling | 4,150 | 1.9% | 2.0% | 14% |
| Strathkelvin and Bearsden | 2,520 | 1.1% | -1.8% | 23% |
| Uddingston and Bellshill | 2,795 | 1.2% | 1.6% | 12% |
Office of National Statistics (ONS) Nomis. (2020, October). UK Business Counts - local units. Retrieved from https://www.nomisweb.co.uk/query/construct/summary.asp?mode=construct&version=0&dataset=141 [accessed 2 September 2021]
Urban-rural dimension
Analysis using the Scottish Government's six fold Urban Rural Classification illustrated the regional distribution of Scottish business stock.
Large urban areas have the highest proportion of enterprises (34%), which is relatively in line with population share (35%).
Rural areas over preform in terms of the ratio of enterprises (27%) to population (17%). Though employment in rural areas was in line with population.
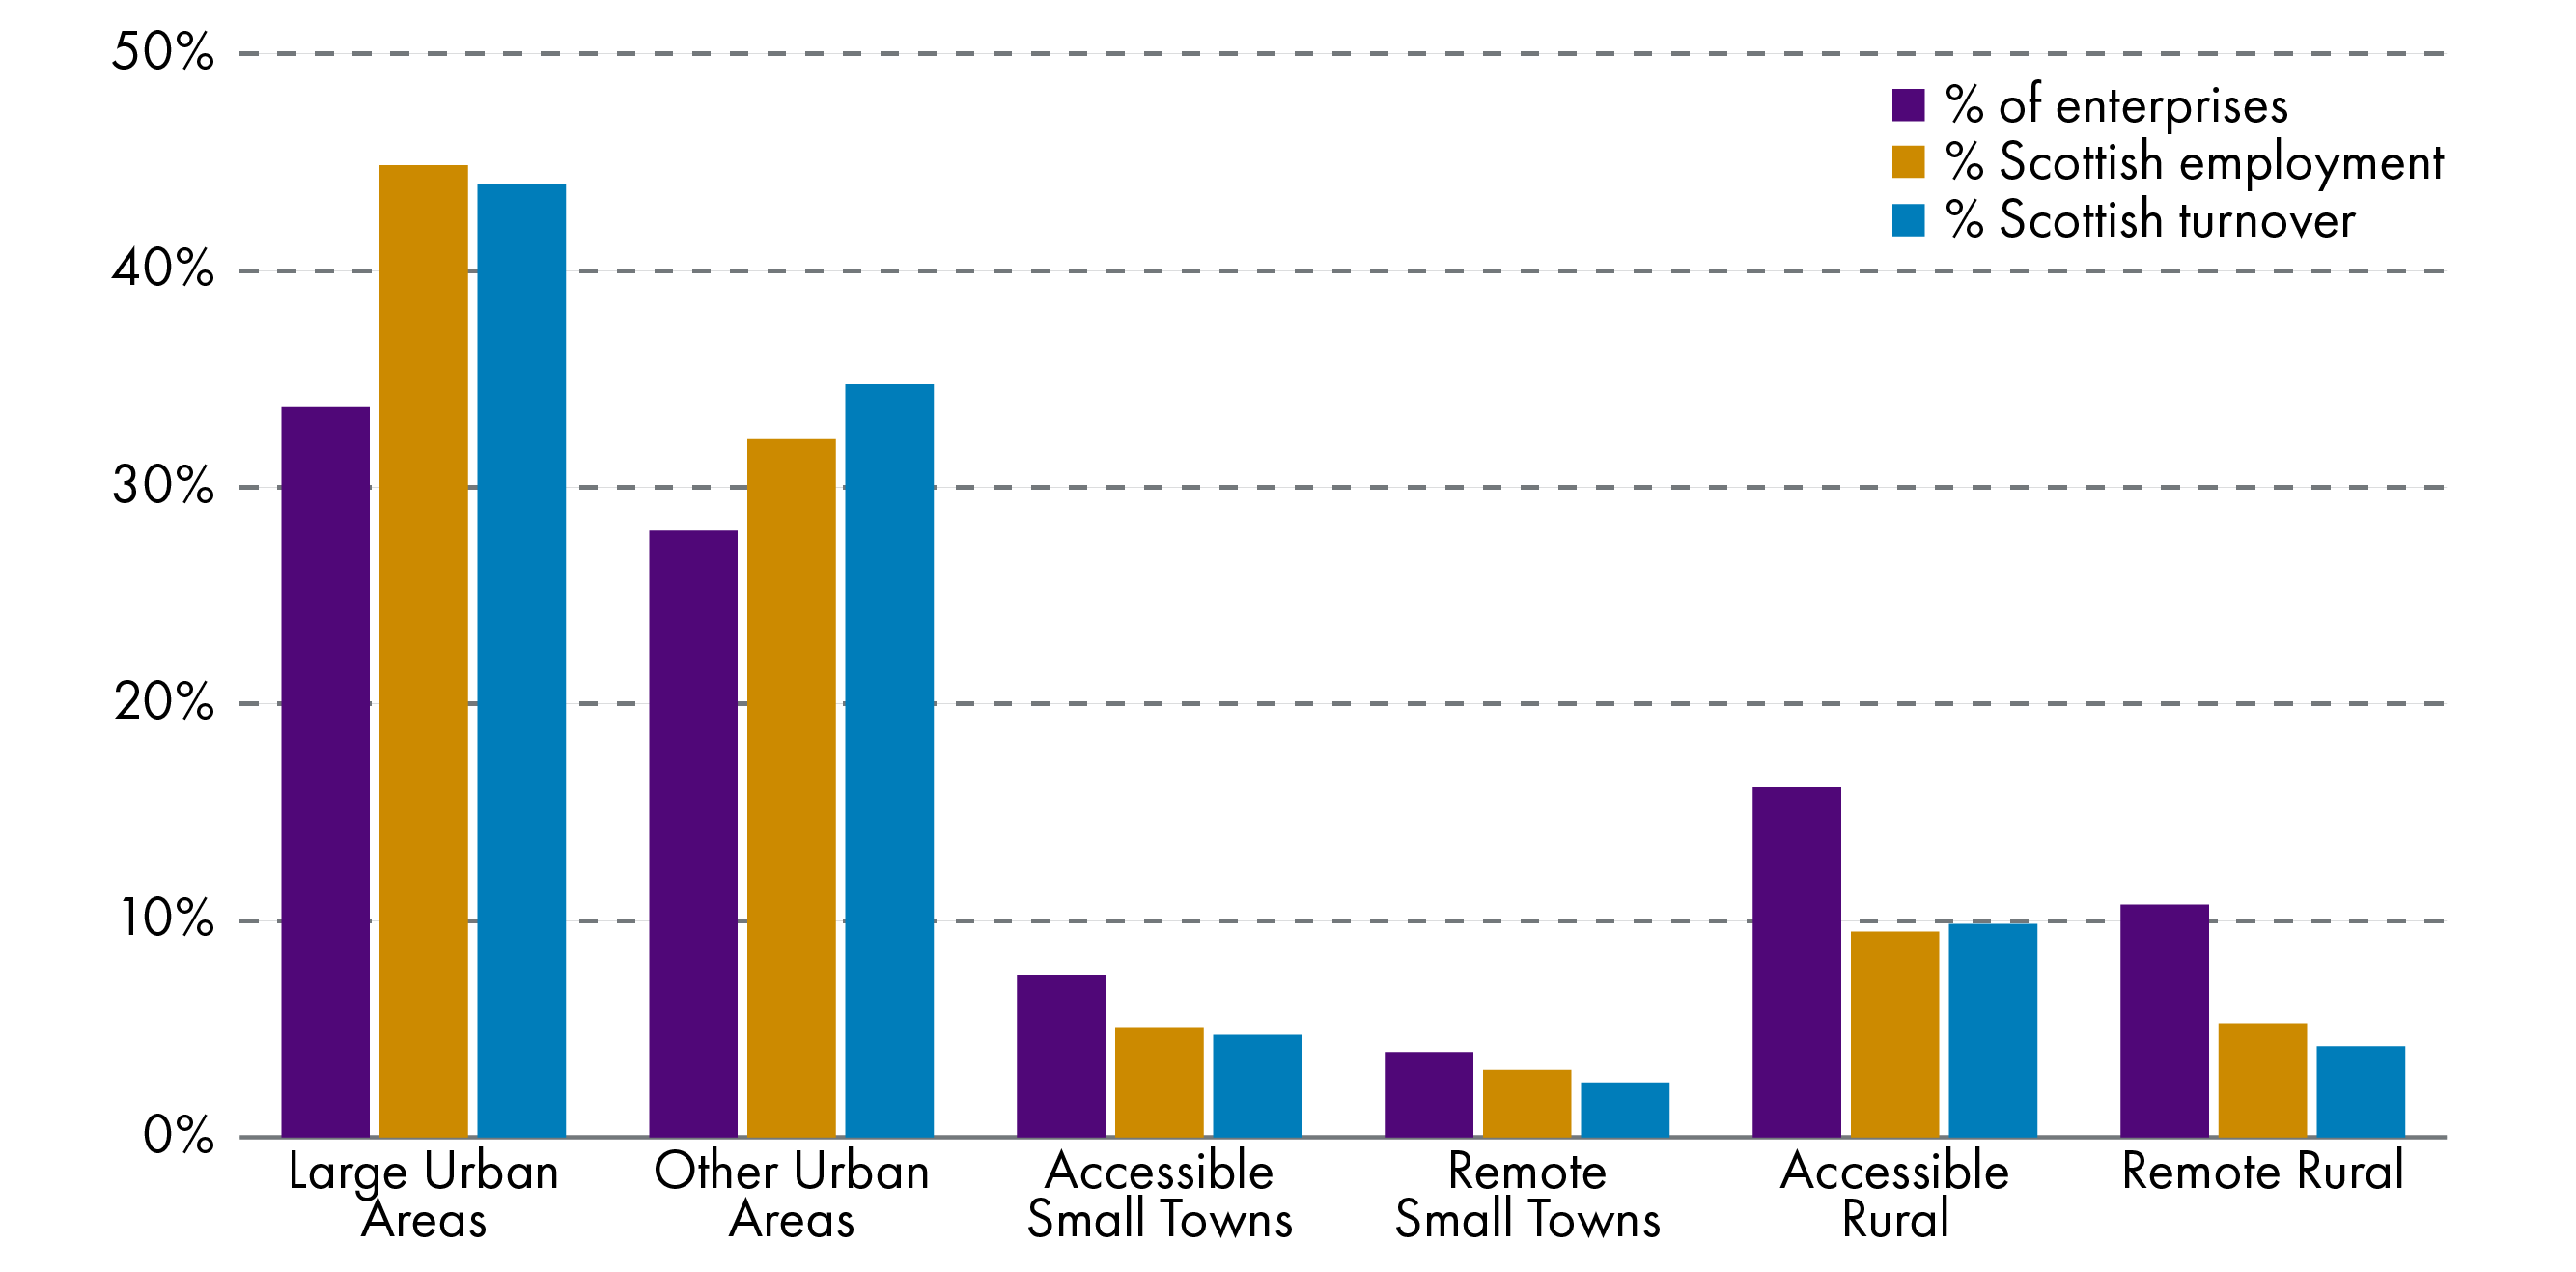
Scottish Government. (2020, November 11). Businesses in Scotland: 2020. Retrieved from https://www.gov.scot/publications/businesses-in-scotland-2020/ [accessed 16 August 2021]
In terms of size and sector, the Businesses in Scotland publicationstated the following:
SMEs accounted for a larger share of private sector employment in rural areas, compared to urban areas. As at March 2020, SMEs accounted for 79.5% of private sector employment in remote rural areas compared to 69.2% in accessible rural areas and 46.8% in the rest of Scotland.
Sources
Scottish Government. (2020, November 11). Businesses in Scotland: 2020. Retrieved from <a href="https://www.gov.scot/publications/businesses-in-scotland-2020/" target="_blank">https://www.gov.scot/publications/businesses-in-scotland-2020/</a> [accessed 16 August 2021]
Department for Business, Energy & Industrial Strategy (BEIS), UK Government . (2020, October 8). Business population estimates 2020. Retrieved from <a href="https://www.gov.uk/government/statistics/business-population-estimates-2020" target="_blank">https://www.gov.uk/government/statistics/business-population-estimates-2020</a> [accessed 16 August 2021]
Scottish Government . (2021, June 30). Growth sector statistics. Retrieved from <a href="https://www.gov.scot/publications/growth-sector-statistics/" target="_blank">https://www.gov.scot/publications/growth-sector-statistics/</a> [accessed 16 July 2021]
Office for National Statistics (ONS). (2020, November 17). Business demography, UK. Retrieved from <a href="https://www.ons.gov.uk/businessindustryandtrade/business/activitysizeandlocation/datasets/businessdemographyreferencetable" target="_blank">https://www.ons.gov.uk/businessindustryandtrade/business/activitysizeandlocation/datasets/businessdemographyreferencetable</a> [accessed 16 August 2021]
Scottish Government . (2021, February 17). GDP quarterly national accounts: 2020 quarter 3. Retrieved from <a href="https://www.gov.scot/publications/gdp-quarterly-national-accounts-2020-q3/" target="_blank">https://www.gov.scot/publications/gdp-quarterly-national-accounts-2020-q3/</a> [accessed 17 March 2021]
Office of National Statistics (ONS) Nomis. (2020, October). UK Business Counts - local units. Retrieved from <a href="https://www.nomisweb.co.uk/query/construct/summary.asp?mode=construct&version=0&dataset=141" target="_blank">https://www.nomisweb.co.uk/query/construct/summary.asp?mode=construct&version=0&dataset=141</a> [accessed 2 September 2021]