Local Government Finance: Facts and Figures 2013-14 to 2020-21
This briefing provides a range of factual information and analysis on local government finance, including the profile of the local government budget over time, as well as Council Tax and Non-Domestic Rates income, from 2013-14 to 2020-21. This briefing also includes a look at how COVID-19 affects the balance of Local Government funding in 2020-21. This briefing does not aim to give a comprehensive overview of Local Government finance. Rather, it focuses on the most common questions asked of SPICe by MSPs.
Executive Summary
During the Scottish Budget process in recent years, local government finance has often taken the spotlight, at least on the spending side. Comparing changes to this complex area over time can be challenging because of the frequent changes made to the powers and financing of local government, and the need to ensure that like-for-like data is being compared. To remove some of these challenges, this annual briefing series looks primarily at the local government finance settlement from 2013-14 onwards.
This briefing, when looking at trends over time,does not take into account the allocation of additional funding for local authorities in 2020-21 due to the Coronavirus (COVID-19) outbreak. This is in part because, at the time of publication, the full funding picture is unclear, but also because including these funds would make comparing full 2020-21 figures to other years inaccurate. For that reason, when looking at local government finance over the long-term, SPICe has chosen to disregard any funds which are directly allocated as part of the COVID-19 response.
That said, in 2020-21, COVID-19 has had a marked impact on the structure of the local government finance settlement. Most significantly, because of 100% rates relief provided to all retail, hospitality and tourism businesses, Non-Domestic Rates Income has reduced dramatically, leading to a consequential increase in the General Resource Grant, so this briefing does look at how COVID-19 funding helps to demonstrate the local government funding formula in action. It also looks at the impact of Barnett consequentials arising from UK Government spending decisions on the Scottish Government budget, and gives an early look at how this has impacted the local government revenue settlement to date.
Key messages
This briefing presents a range of factual information around local government finance, including the following:
At the time of publication, the impacts and full funding picture relating to the COVID-19 response are still unfolding. It is likely that there may be some impact on the final funding settlement for 2020-21, and on future settlements, which may affect how we look at historical data moving forward.
Before the total revenue settlement amounts to local authorities had altered as a result of additional COVID-19 funding, the structure of these settlements had changed. This reflects a marked reduction in Non-Domestic Rates Income following the Scottish Government's decision to offer a package of business rates reliefs. These changes help to demonstrate how the local government funding formula flexes to accommodate different circumstances.
The local government revenue settlement fell quite steeply in 2016-17, with a much smaller fall in 2017-18 and a marginal fall in 2018-19. This trend reversed sharply in 2019-20. Local Government Finance Order figures for 2020-21 would suggest that this will again be the case for this year.
Comparison to Scottish Government
The real terms change outturn figures show that between 2013-14 and 2019-20, the local government revenue settlement decreased at a faster rate (-4.7% or -£517.7 million) than the Scottish Government revenue budget (-2.2% or -£684.9 million) in real terms. Non-Domestic Rates Income is included in both local government and Scottish Government figures.
However, the trend is reversed when looking at the Local Government Finance Order figures for 2019-20 to 2020-21 - here the revenue settlement for local government increases by 3.8% in real terms, but the Scottish Government's revenue budget increases by 0.9%.
From 2013-14 onwards the gap between changes to the Scottish Government revenue budget and the local government revenue budget became increasingly wide, reaching a peak in 2017-18 (6.4 percentage points). Over the last two years of outturn figures, this gap has narrowed, but overall the local government revenue budget has still fallen at a steeper rate than the Scottish Government revenue budget (2.5 percentage points difference between 2013-14 and 2019-20). This is due in part because of increased protection of the Health budget.
Share of the Scottish Government budget
The local government revenue settlement as a proportion of the Scottish Government revenue budget decreased by 2.6 percentage points between 2013-14 and 2019-20. Local Government Finance Order figures show Local Government revenue as a proportion of Scottish Government revenue increasing between 2018-19 and 2019-20.
Looking at both revenue and capital outturn figures combined, local government's share of the Scottish Government's budget decreased by 1.7 percentage points between 2013-14 and 2019-20. Local Government Finance Order figures suggest that this will decrease again, by 1.8 percentage points, between 2019-20 and 2020-21, though this figure is heavily skewed by the re-profiling of capital funds which can make capital figures artificially high or low, and can mask a decrease or small increase in revenue funding. In this case, 2019-20 was boosted by £150m as a result of re-profiling, with no re-profiling taking place in 2020-21.
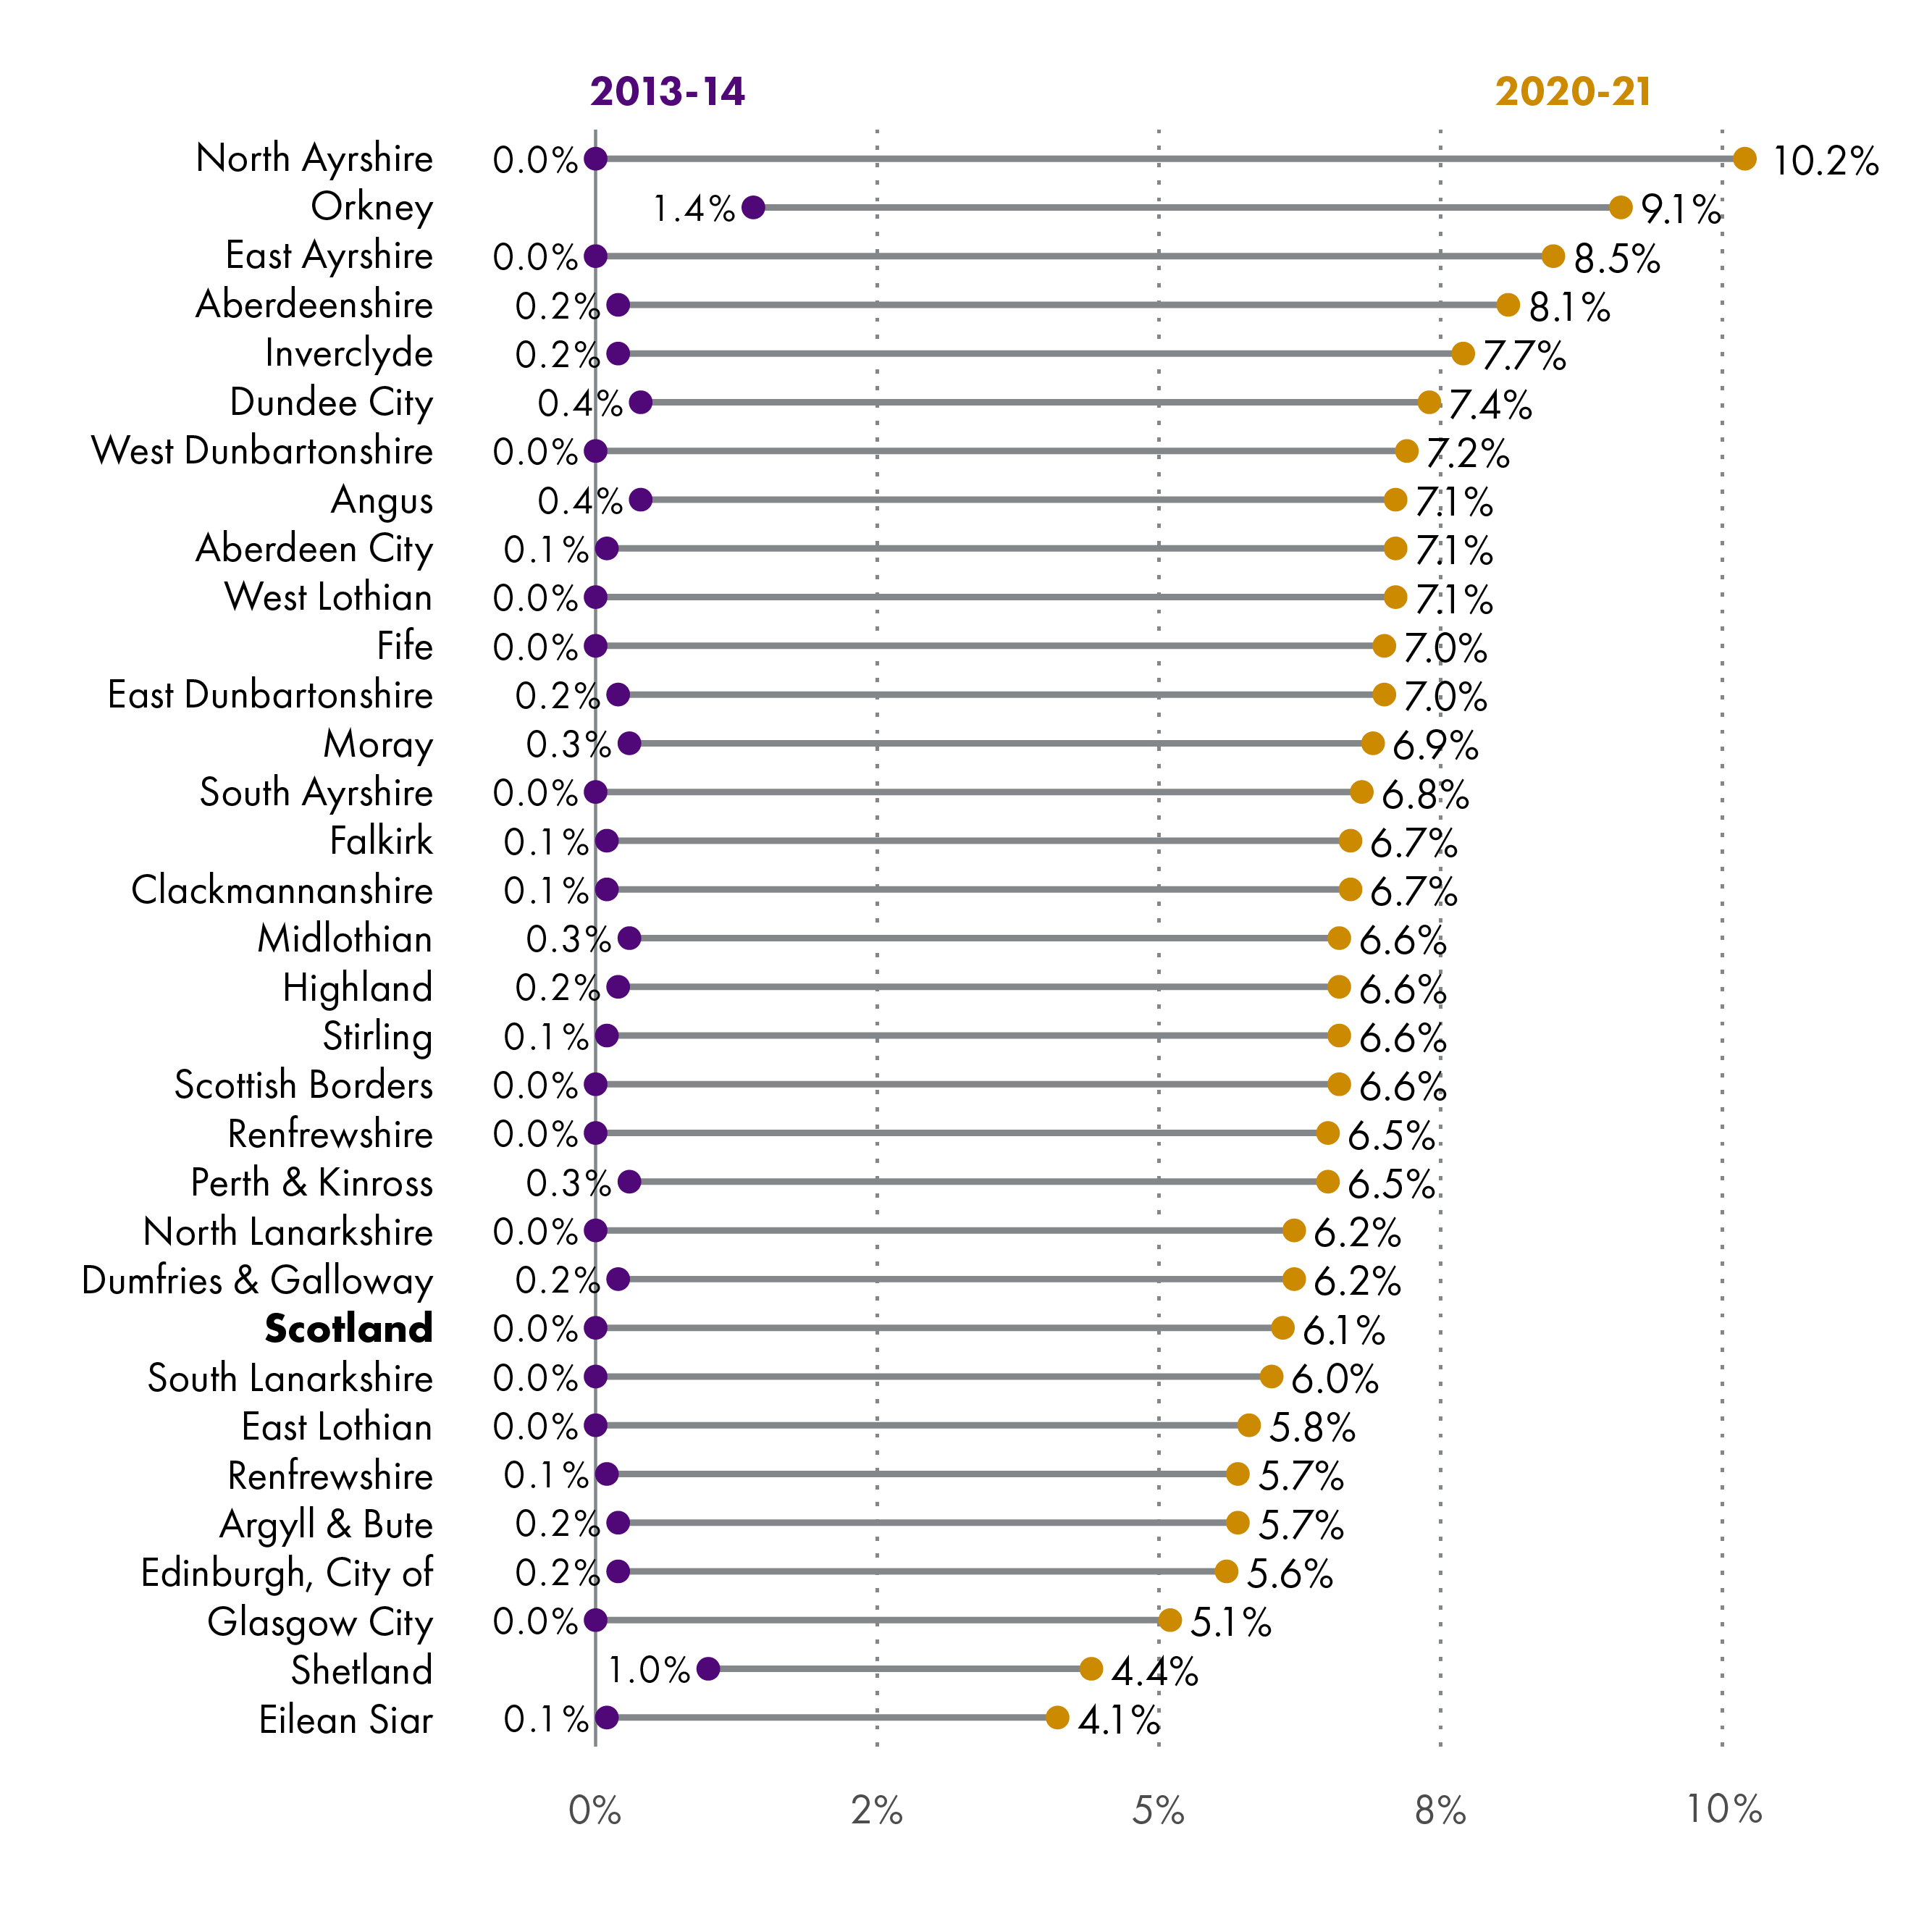
To provide some longer-term context, this briefing sets out ring-fenced funds as a proportion of the total revenue settlement, between 2013-14 and 2020-21. There are increases shown across all local authorities, ranging from 3.4 percentage points to 10.2 percentage points.
Local Government funding per head
The greatest reduction in real terms revenue funding per head between 2013-14 and 2020-21 has been for Eilean Siar, at £522. In the context of wholly island authorities, Orkney has seen the smallest change to real terms revenue funding per head between 2013-14 and 2020-21, at -£59.
The greatest reduction in real terms revenue funding per head between 2013-14 and 2020-21 for a wholly mainland authority has been for Glasgow City, which has seen its real terms revenue funding per head reduce by £250.
Of the mainland authorities, both East Ayrshire and Aberdeenshire have seen a very slight increase in revenue funding per head between 2013-14 and 2020-21 (£6 and £2 respectively).
North Ayrshire (which has some islands) has seen the greatest increase to its real terms revenue funding per head, with a £41 increase between 2013-14 and 2020-21.
Following Council Tax reform in 2017-18, the Scottish Government capped Council Tax increases at 3% in 2017-18 and 2018-19. In 2019-20 this cap increased to 3% in real terms (4.79%), and in 2020-21 the same 3% cap translated to 4.84% in real terms. The implementation of changes has been varied, and as a result those councils with a higher proportion of high-band properties have remained at the higher end of the income range, and those with the lower proportion have remained at the lower end, but there are some exceptions to this as a result of councils making the most of the opportunities to increase income.
Introduction
This briefing presents a range of statistical information on local government finance, to help inform parliamentary debate and answer regular questions that SPICe receives. It is focussed on those areas most commonly covered during parliamentary business, primarily the local government finance settlement as set out in the Scottish Government's local government finance circulars. It is therefore not a comprehensive survey of local government finance, like the Scottish Government's Local Government Finance Statistics, or the Accounts Commission's Overview and Financial Overview reports.
This briefing updates an annual series. Please see the related briefings list for past iterations of this briefing and information on other SPICe work in this area.
Early in this briefing series, data stretched back to 1999, however, in the 2017 briefing1, the decision was taken to look at data from 2010-11 onwards only due to the increasing complexity of comparing local government finance over time. To further improve the time series and remove comparability issues relating to the removal of police and fire services from the local government settlement, the 2018 iteration of this briefing2 focused on local government finance from 2013-14 onwards. This approach has since also been adopted by the Accounts Commission. The exception to this is the section on Council Tax and Non-Domestic Rates income (NDRI).
The data are drawn from a number of publicly available Scottish Government and local government publications. In most cases, data goes to 2020-21, but in some cases data (generally outturn data) is only available to 2018-19.
This briefing presents a number of figures in "real terms" to allow more meaningful year on year comparisons taking account of inflation. In most cases, real terms figures are in 2020-21 prices, using the latest HM Treasury deflators, as published in April 2020. Figures relating to Council Tax (and associated NDRI figures) are shown in cash terms.
A number of abbreviations are used in this briefing - a full list is available at the end of the briefing.
The impact of COVID-19 on Local Government funding
This briefing does not take into account the allocation of additional funding for local authorities in 2020-21 due to the Coronavirus (COVID-19) outbreak. This is in part because, at the time of publication, the full funding picture is unclear, but also because including these funds would make comparing full 2020-21 figures to other years inaccurate. For that reason, when looking at local government finance over the long-term, SPICe has chosen to disregard any funds which are directly allocated as part of the COVID-19 response.
It is, however, important to highlight that COVID-19 has already changed the structure of the local government settlement, and that there is likely to be some level of impact on future settlements, in some form, if, as could reasonably be expected, COVID-19 has a long term financial impact on councils.
Because the COVID-19 mitigation effort is both fast-paced and ongoing at the time of publication, this briefing does not go into great detail. Rather it seeks to highlight relevant and regularly updated blog publications that readers may find useful, and explore a snapshot of how the structure of local government allocations have been affected.
Barnett formula and additional funding for the Scottish Government
Under the Barnett formula, the devolved administrations of the UK are given funding allocations as a consequence of spending decisions made by the UK Government on areas that are devolved. This provides devolved administrations with a population share of the relevant spending which can be spent as the devolved administration chooses.
The Scottish Government has, at the time of publication, been allocated an additional £3.8 billion in Barnett consequentials for COVID-19 so far, the majority of this to be spent on business support measures. [Note that where UK Government support applies across the whole of the UK – for example, the furlough scheme, or increased benefit levels – there will be no Barnett consequentials.]
Local Government is one aspect of devolved authority for which the Scottish Government receives funding through Barnett consequentials. The Scottish Government can use this funding as they choose – and not necessarily on the policy area from which the additional funding derived.
As noted, COVID-19 is a fast-moving subject area, but SPICe has been responding by publishing (and regularly updating) a series of blogs across a wide range of subject areas. A full and up to date list of blogs published is available in a dedicated post on SPICe Spotlight.
On the Barnett formula in particular, at the time of publishing this briefing, three blogs had set out useful detail, giving some context to the changes that might come down the line to local government budgets. These, in order of publication date with the oldest blog at the top, are:
The Barnett formula – is it working for Scotland’s businesses?
Funding for coronavirus (COVID-19) support: the evolving picture
What is the Scottish Government spending on coronavirus (COVID-19) support?
To give an idea of how this has been passed on, as of 3 June, the Scottish Government had been allocated £3.8 billion in Barnett consequentials, with much of this being routed through councils (for example, for business support schemes), but not being allocated for the provision of council services. Of this, £155 million in Barnett consequentials resulted from UK funding for local authorities.
A total of £80 million was passed on to local authorities to help fund the work they do to support communities (the £50 million Hardship Fund, and £30m Food Fund). COSLA, writing to the Local Government and Communities Committee on 5 May said:
Although early release of some funding is welcomed, it will not cover the full financial impact on Local Government.
...
We call on Scottish Government to pass on the £155m consequentials in full, whilst recognising that this will not be enough to tackle the immediate costs facing Councils.
COSLA Update to Local Government and Communities Committee: COVID-19 Current Work and Emerging Challenges, 5 May 2020
During evidence to the Local Government and Communities Committee on 15 May, the Cabinet Secretary for Communities and Local Government confirmed that -
To date, more than £300 million has been committed to local authorities. Although £175.6 million of that has been identified, none of it has been ring fenced. Local authorities have also been passed the £155 million in consequentials. As I said earlier, we are still waiting for the leaders to agree how they will work through the distribution of that. We passed the £50 million hardship fund directly to local authorities as part of the £350 million that was outlined to Parliament back in March. Again, that is for local authorities to spend as they see fit.
There is also the £45 million Scottish welfare top-up; £22 million of that has been allocated and we are working with local authorities to see where there might be additional needs. It also includes the £15 million for free schools meals and the food fund.
Local Government and Communities Committee 15 May 2020 [Draft], Aileen Campbell, contrib. 9, http://www.scottish.parliament.uk/parliamentarybusiness/report.aspx?r=12644&c=2256210
Additional allocations to local authorities
COSLA leaders agreed on 15 May that the allocation of additional funds to local authorities would be based on the the distribution methodology used to allocate existing Scottish Government funding for local government, i.e. on the funding formula.
On 20 May the additional allocations to individual local authorities were agreed between the Scottish Government and COSLA. These covered the allocation of the £155m of Barnett consequentials for local government, as well as the distribution of various specific grants related to COVID-19. This was finalised in The Local Government Finance (Coronavirus) (Scotland) Amendment Order 2020, which passed on 23 June 2020. In advance of payments being made, the Scottish Government committed to front-loading local authorities’ weekly grant payments by £150 million in May, £100 million in June, and by £50 million in July to assist local authority cash flow problems.
Full details of additional funding is set out in Annex Table 1. It should be noted that these figures have not been set out in a local government finance circular, and as such should be treated with caution and are not part of the historical data set explored in this briefing.
This information is correct at the time of publication, however it is possible that increases and changes to Barnett consequentials will mean that these are not the final increases that local government can expect to the 2020-21 settlement as a result of COVID-19.
Flexing the funding formula
In 2020-21, COVID-19 had a marked impact on the structure of the local government finance settlement, even before the allocation of additional funding. Most significantly, because of 100% rates relief provided to all retail, hospitality and tourism businesses, anticipated Non-Domestic Rates Income has reduced dramatically, leading to a consequential increase in the General Resource Grant, so this briefing looks at how COVID-19 funding helps to demonstrate the local government funding formula in action.
In the section on Council Tax and Non-Domestic Rates, we explain the funding formula and look at how the revenue funding for councils is made up, with a breakdown of how much comes from Council Tax, how much comes from NDR, and how much comes from the revenue grant from the Scottish Government. This looks at the breakdown for the 2020-21 settlement as agreed during the Budget process, which is what is being used in this briefing for long-term comparisons.
On 14 March 2020, four days after the publication of the Local Government Finance Order and final settlement, the Scottish Government announced that it would be offering a number of NDR reliefs to businesses to mitigate the impacts of closure during the COVID-19 outbreak. SPICe published a blog detailing both the measures, and the timeline of announcements, which will be updated should additional measures be announced.
As set out in the 2020-21 Summer budget revision, NDR reliefs introduced in response to COVID-19 are expected to result in a reduction in NDR income of £972 million. The Scottish Government guarantees to provide funding to local government equivalent to the combined total of General Revenue Grant (GRG) plus NDR income, so any reduction in NDR income requires the Scottish Government to increase the level of GRG by an equivalent amount. The actual total revenue settlements for local authorities did not change as a result of the fall in NDR income, just the proportions of NDR and revenue grant that in part make up the final settlements. This was set out in a revised finance circular on 30 March (N.B. that this circular is expected to be superseded following the allocation of additional funds to local authorities).
Figure 1 gives a snapshot of how this flex of the funding formula affects the proportions set out in figure 9.
The local government settlement
Real terms change
A common way of assessing and analysing the total local government budget is to look at the real terms change over time. Using the methodology outlined in the 2018 iteration of this briefing1, long-term comparisons up to 2019-20 are made using outturn figures (with 2013-14 as the baseline year), and Local Government Finance Order (LGFO) figures are used to explore the trend between 2019-20 and 2020-21. This is because a number of additional allocations are typically made in -year, so outturn and provisional figures are not comparable to one another.
In our briefing looking at the 2020-21 Budget and allocations to local authorities, we took a slightly different approach, looking at LGFO figures for each year, so figures here will not appear the same as in that briefing. Both methods are valid ways of comparing historical data, but are used to cover different aims:
In the Budget briefing, we were looking at what the predicted scenario would be, so we use the most up to date figures for planned spend.
In Facts and Figures we are looking at historical data and exploring what actually happened, so the final outturn data is used.
The Scottish Government takes a different view on this approach, explaining that:
The Scottish Government compares budget to budget figures in all circumstances as this provides a true like-with-like comparison. There can be significant in year funding variations which reduces the comparability between outturn and budget and even outturn to outturn information.
SPICe correspondence with the Scottish Government, June 2020
Figures in this section are presented in percentage terms, allowing for easy comparability between different years. Full figures can be found in the annex tables to this briefing.
As revenue figures represent the funding available for the delivery of services, and capital figures can vary widely year-on-year, there is a focus on revenue figures in these sections.
Figure 2 shows the annual real terms change in the local government revenue settlement, and demonstrates the difference between LGFO and outturn figures. Figures can be found in Annex Table 3.
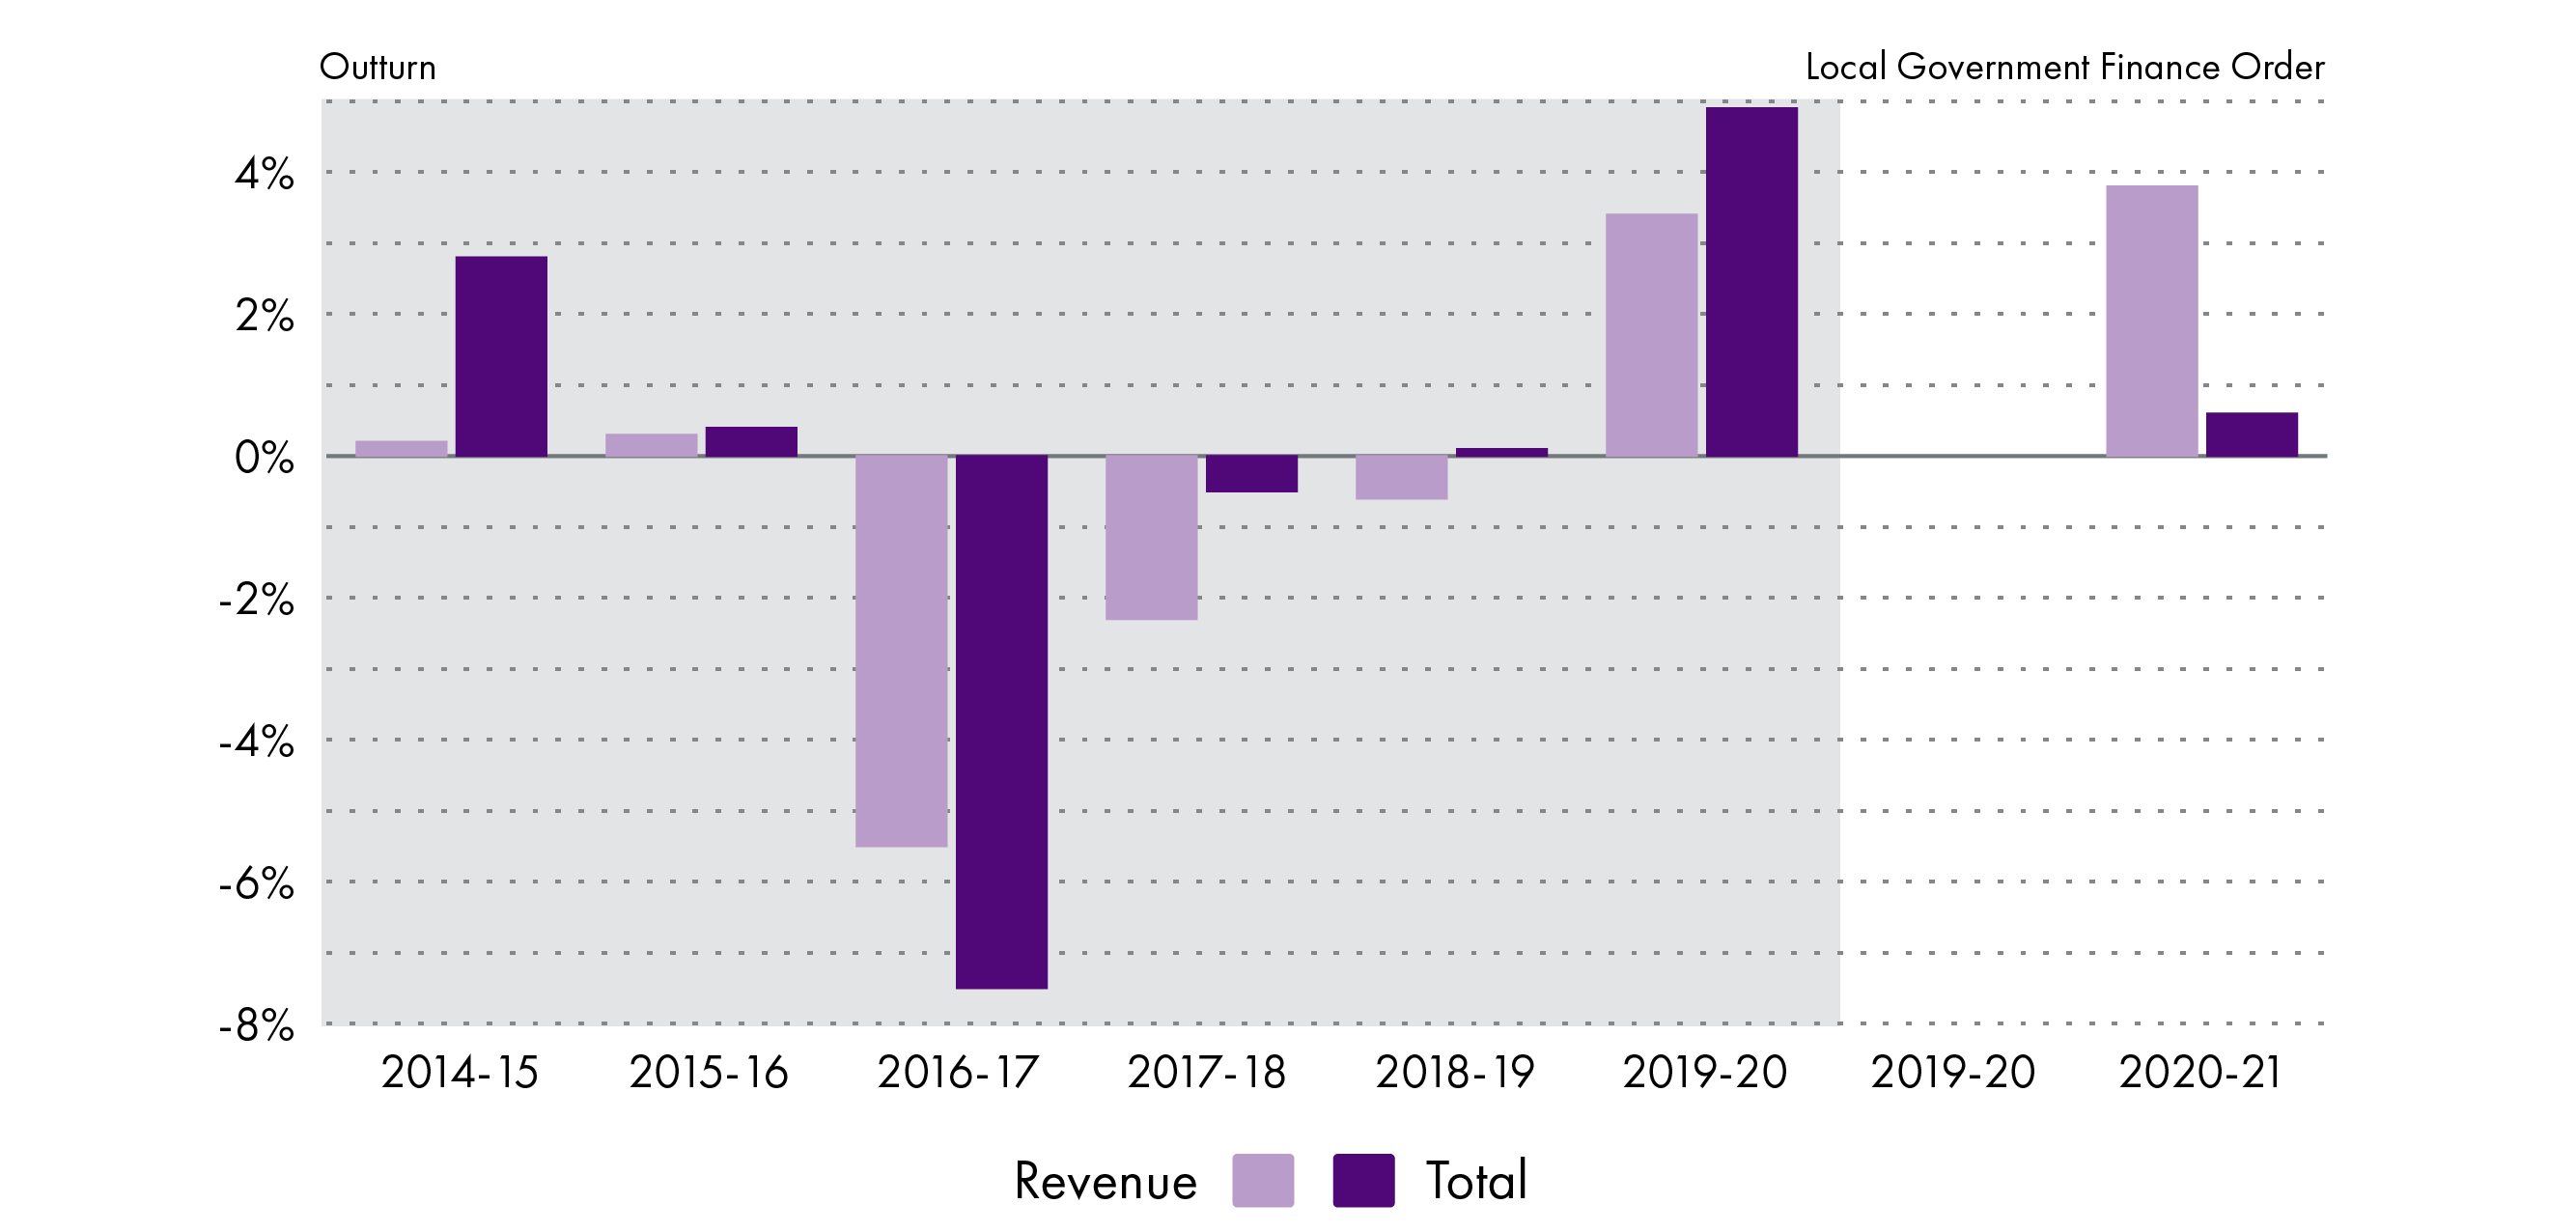
Figure 2 shows that the local government revenue settlement fell quite steeply in 2016-17, with a much smaller fall in 2017-18 and a marginal fall in 2018-19. This reversed sharply in 2019-20, and Local Government Finance Order figures for 2020-21 would suggest that this will again be the case. Outturn figures from 2019-20 are notably higher than allocations published at the Local Government Finance Order stage for that year, which suggests that figures for 2020-21 will also be higher than currently suggested.
Local government and Scottish Government comparison
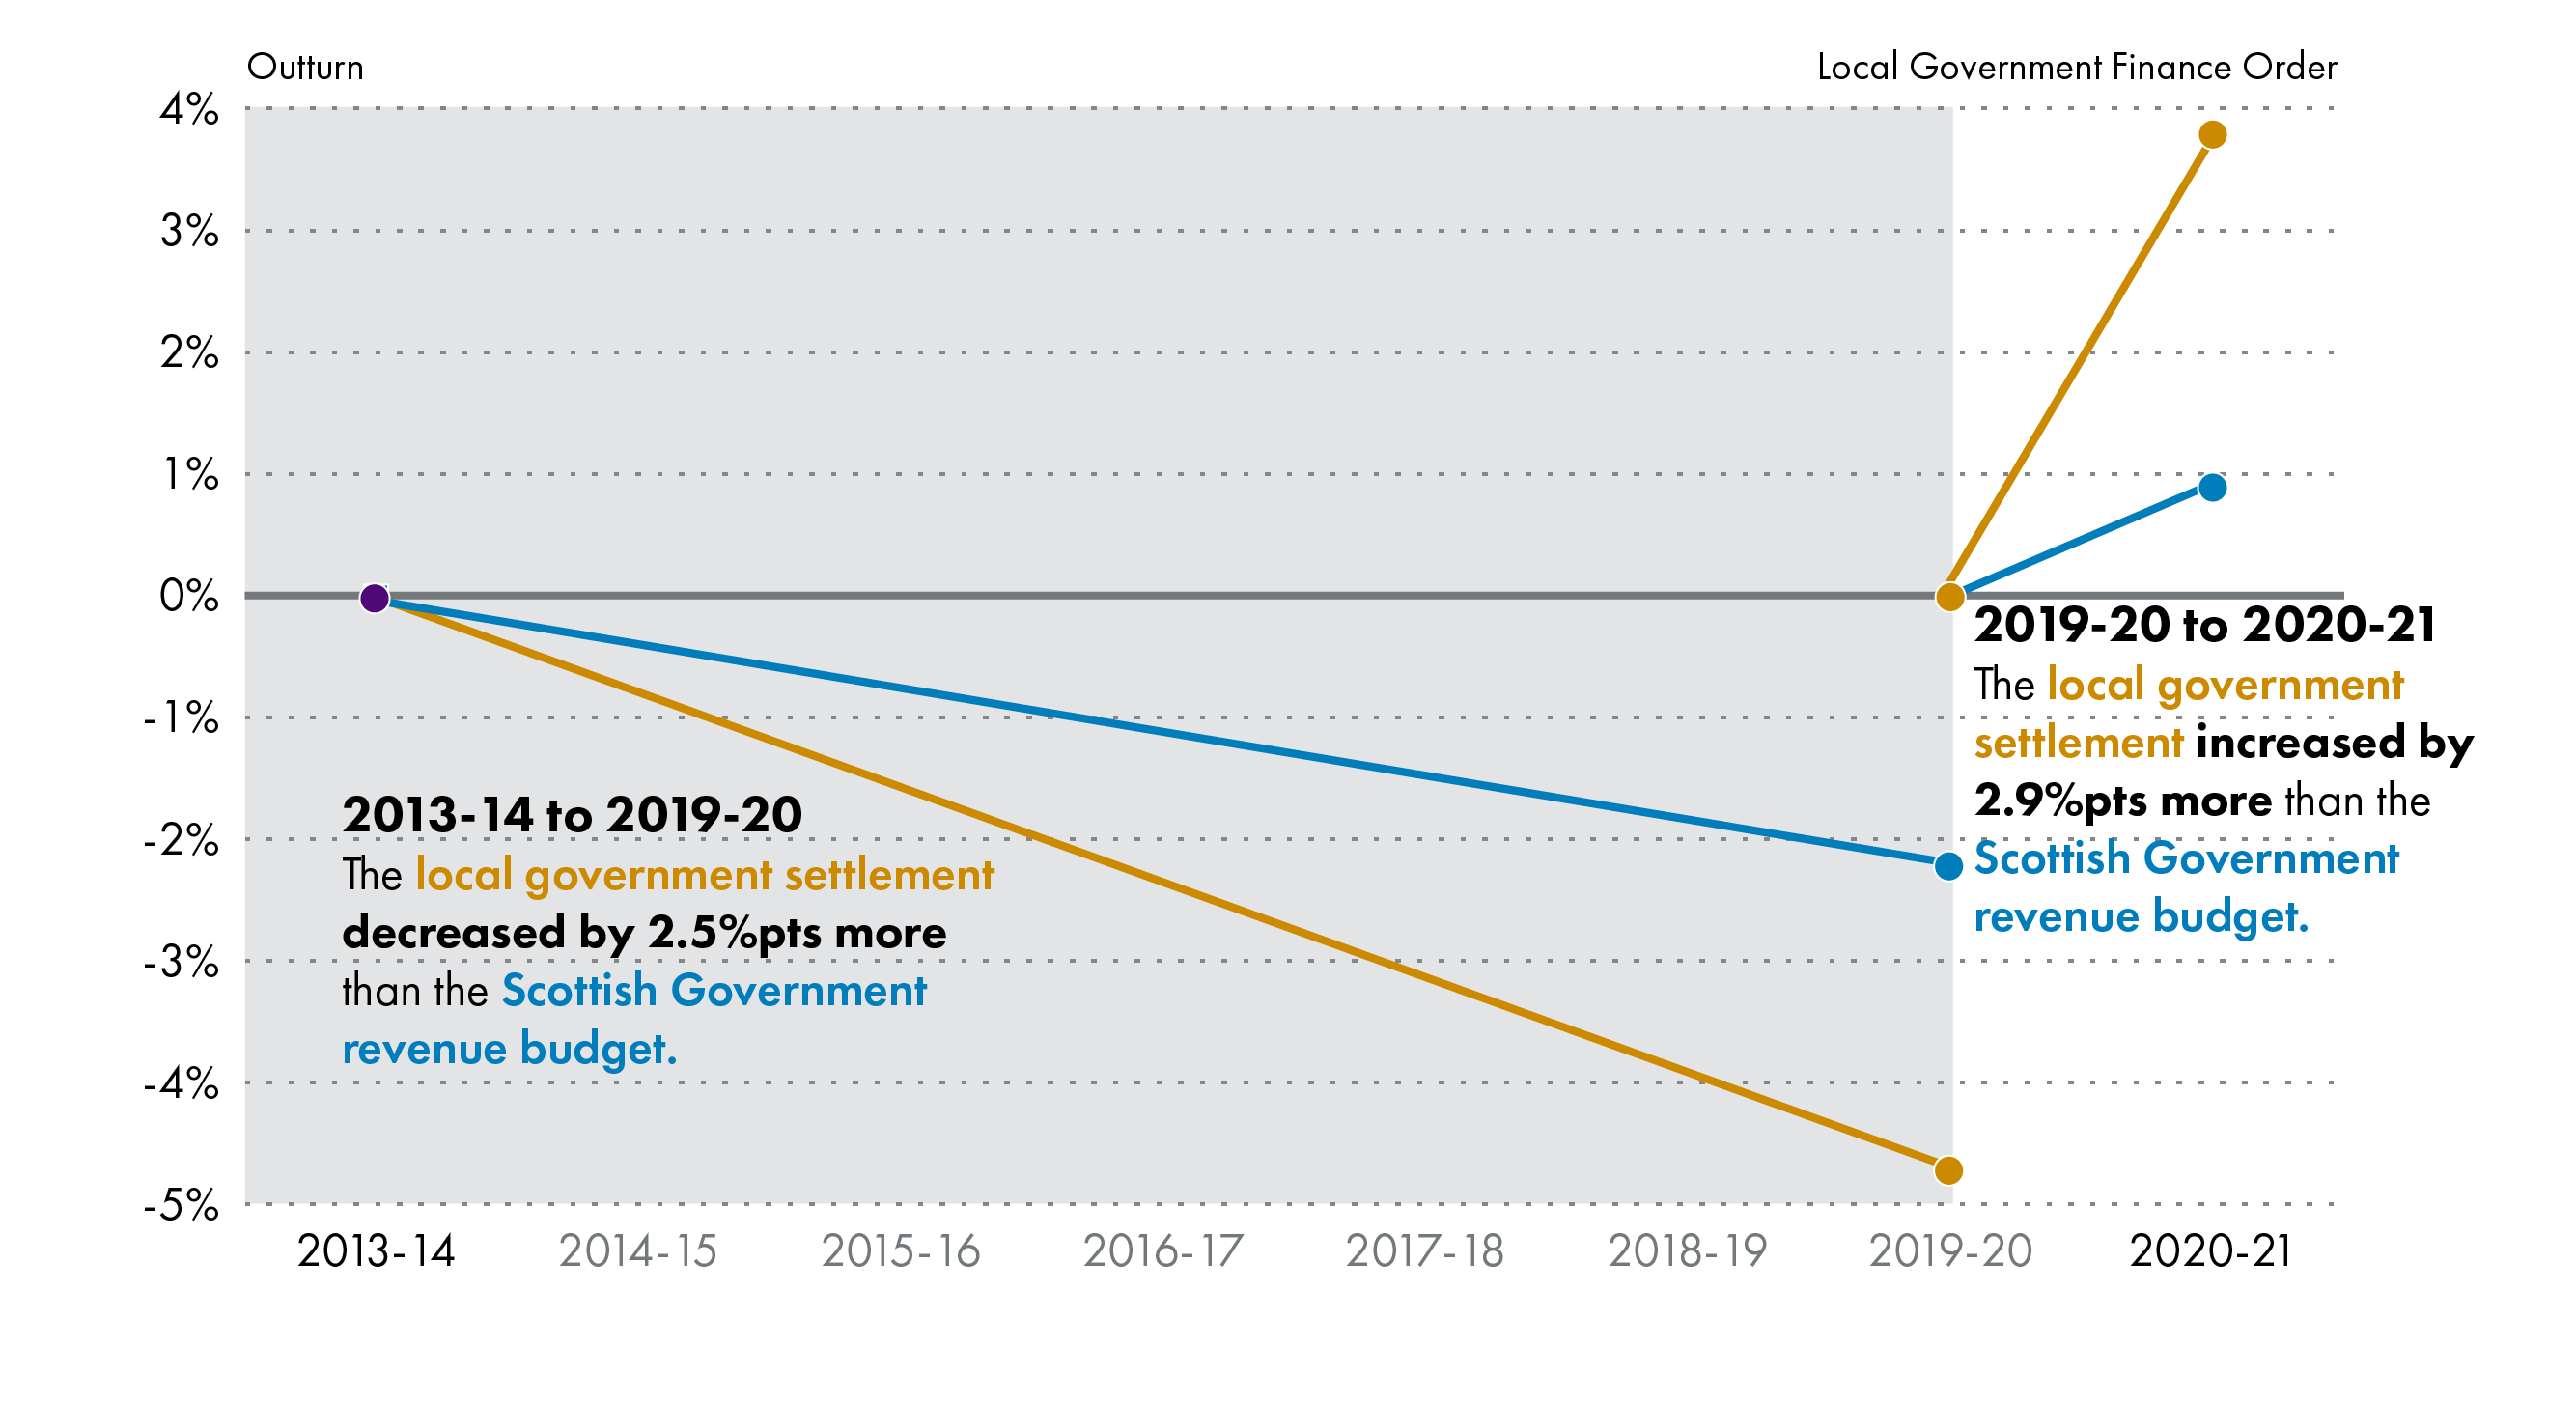
Figure 3 compares long-term changes to the local government revenue settlement to those in the Scottish Government revenue budget.
The real terms change outturn figures show that between 2013-14 and 2019-20, the local government revenue settlement decreased at a faster rate (-4.7% or -£517.7 million) than the Scottish Government revenue budget (-2.2% or -£684.9 million). Non-Domestic Rates Income is included in both local government and Scottish Government figures.
However, the trend is reversed when looking at the LGFO figures for 2019-20 to 2020-21 - here the revenue settlement for local government increases by 3.8%, and the Scottish Government's revenue budget increases by 0.9%.
These figures confirm the prediction in last year's briefing that the gap between funding changes for local government and the Scottish Government was beginning to narrow, and suggest that this narrowing will continue once outturn figures for 2020-21 are available.
Over the years compared, by comparison, there has been a protection and growth of the Health and Sport portfolio budget, which has had a knock-on effect on local government budgets. Health and Sport is the largest portfolio, comprising 38% of the discretionary spending power (Resource and Capital) of the Scottish budget in 2020-21. Between 2019-20 and 2020-21, the health budget grew by 7.1% in cash terms (5.3% in real terms, whereas the local government budget grew by only 2.9% in cash terms (1% in real terms)1.
How the trend has changed over time
In the 2017 iteration of this briefing, for the first time we visualised the difference in the rate at which the revenue budgets of local government and the Scottish Government had changed. We have continued to explore this each year, which gives an indication of how the trend is changing.
In order to give a full picture of the trends, this data looks at the real terms change in revenue funding for both the Scottish Government and local government from 2013-14 to each subsequent year that we have outturn data available for.
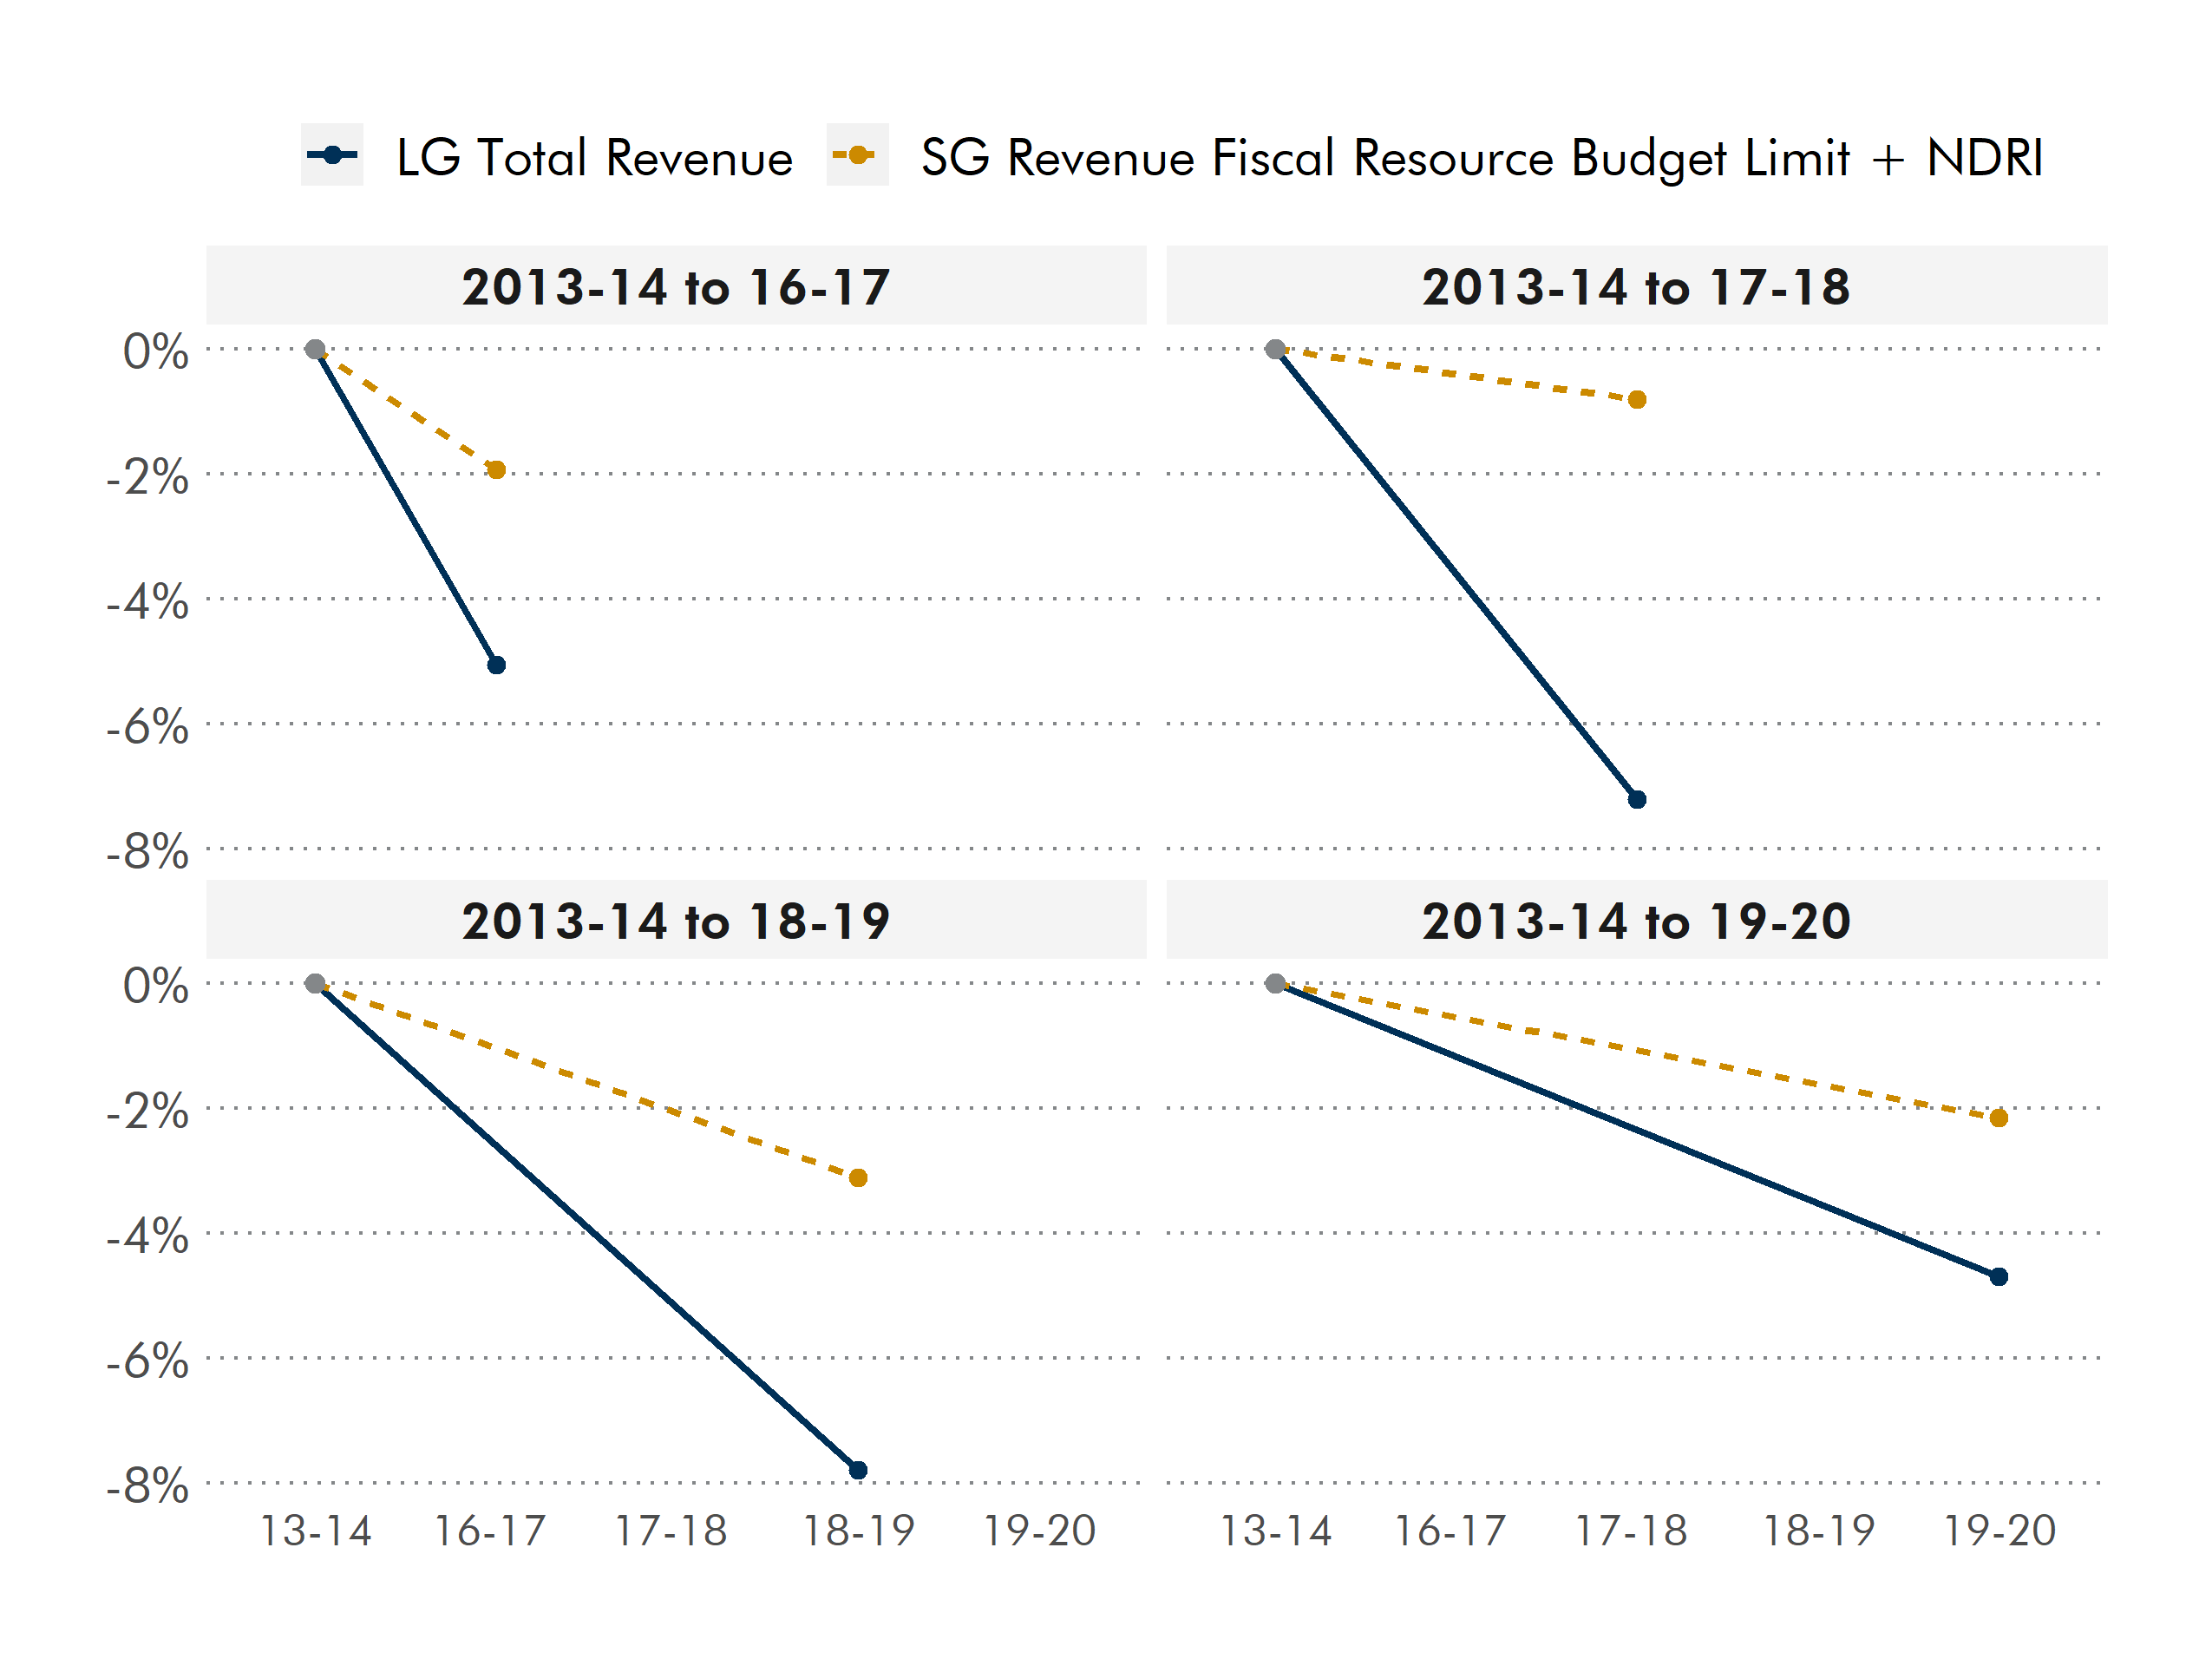
Figure 4 is based on making that comparison to 2013-14 to each year in turn, from 2016-17 to 2019-20 (i.e. the years that we have looked at this trend in Facts and Figures publications. This shows that for a number of years, the gap in funding increased, before narrowing again. Figures going back to 2014-15, including annual changes, can be found in table 6 of the Annex.
From 2016-17, the trend showed the gap growing sharply as the local government budget fell at a much steeper rate than the Scottish Government revenue budget.
The Scottish Government revenue budget has fluctuated between annual growth, and annual reduction.
In 2017-18 both budgets fell, making the overall gap between the two narrower, but local government was still falling at a steeper rate.
The trend has begun to reverse somewhat over the last two years:
In 2018-19 the fall in the local government revenue budget was less than that of the Scottish Government. This was the first time that local government fared better than the Scottish Government since 2015-16.
In 2019-20, both budgets increased, with local government seeing a greater rise in its revenue budget than the Scottish Government
Share of the Scottish Government Budget
In this section, local government's percentage share of the Scottish Government's budget since 2013-14 is presented.
In these calculations, the revenue and capital figures are presented separately, along with the total for the local government settlement. Therefore, to make the figures comparable, the Scottish Government figures include all fiscal revenue DEL (more recently titled Fiscal Resource Budget Limit in Budget documents) and NDRI.
Figure 5 looks at the local government revenue, capital and total settlement as a proportion respectively of the Scottish Government's revenue, capital and total budget.
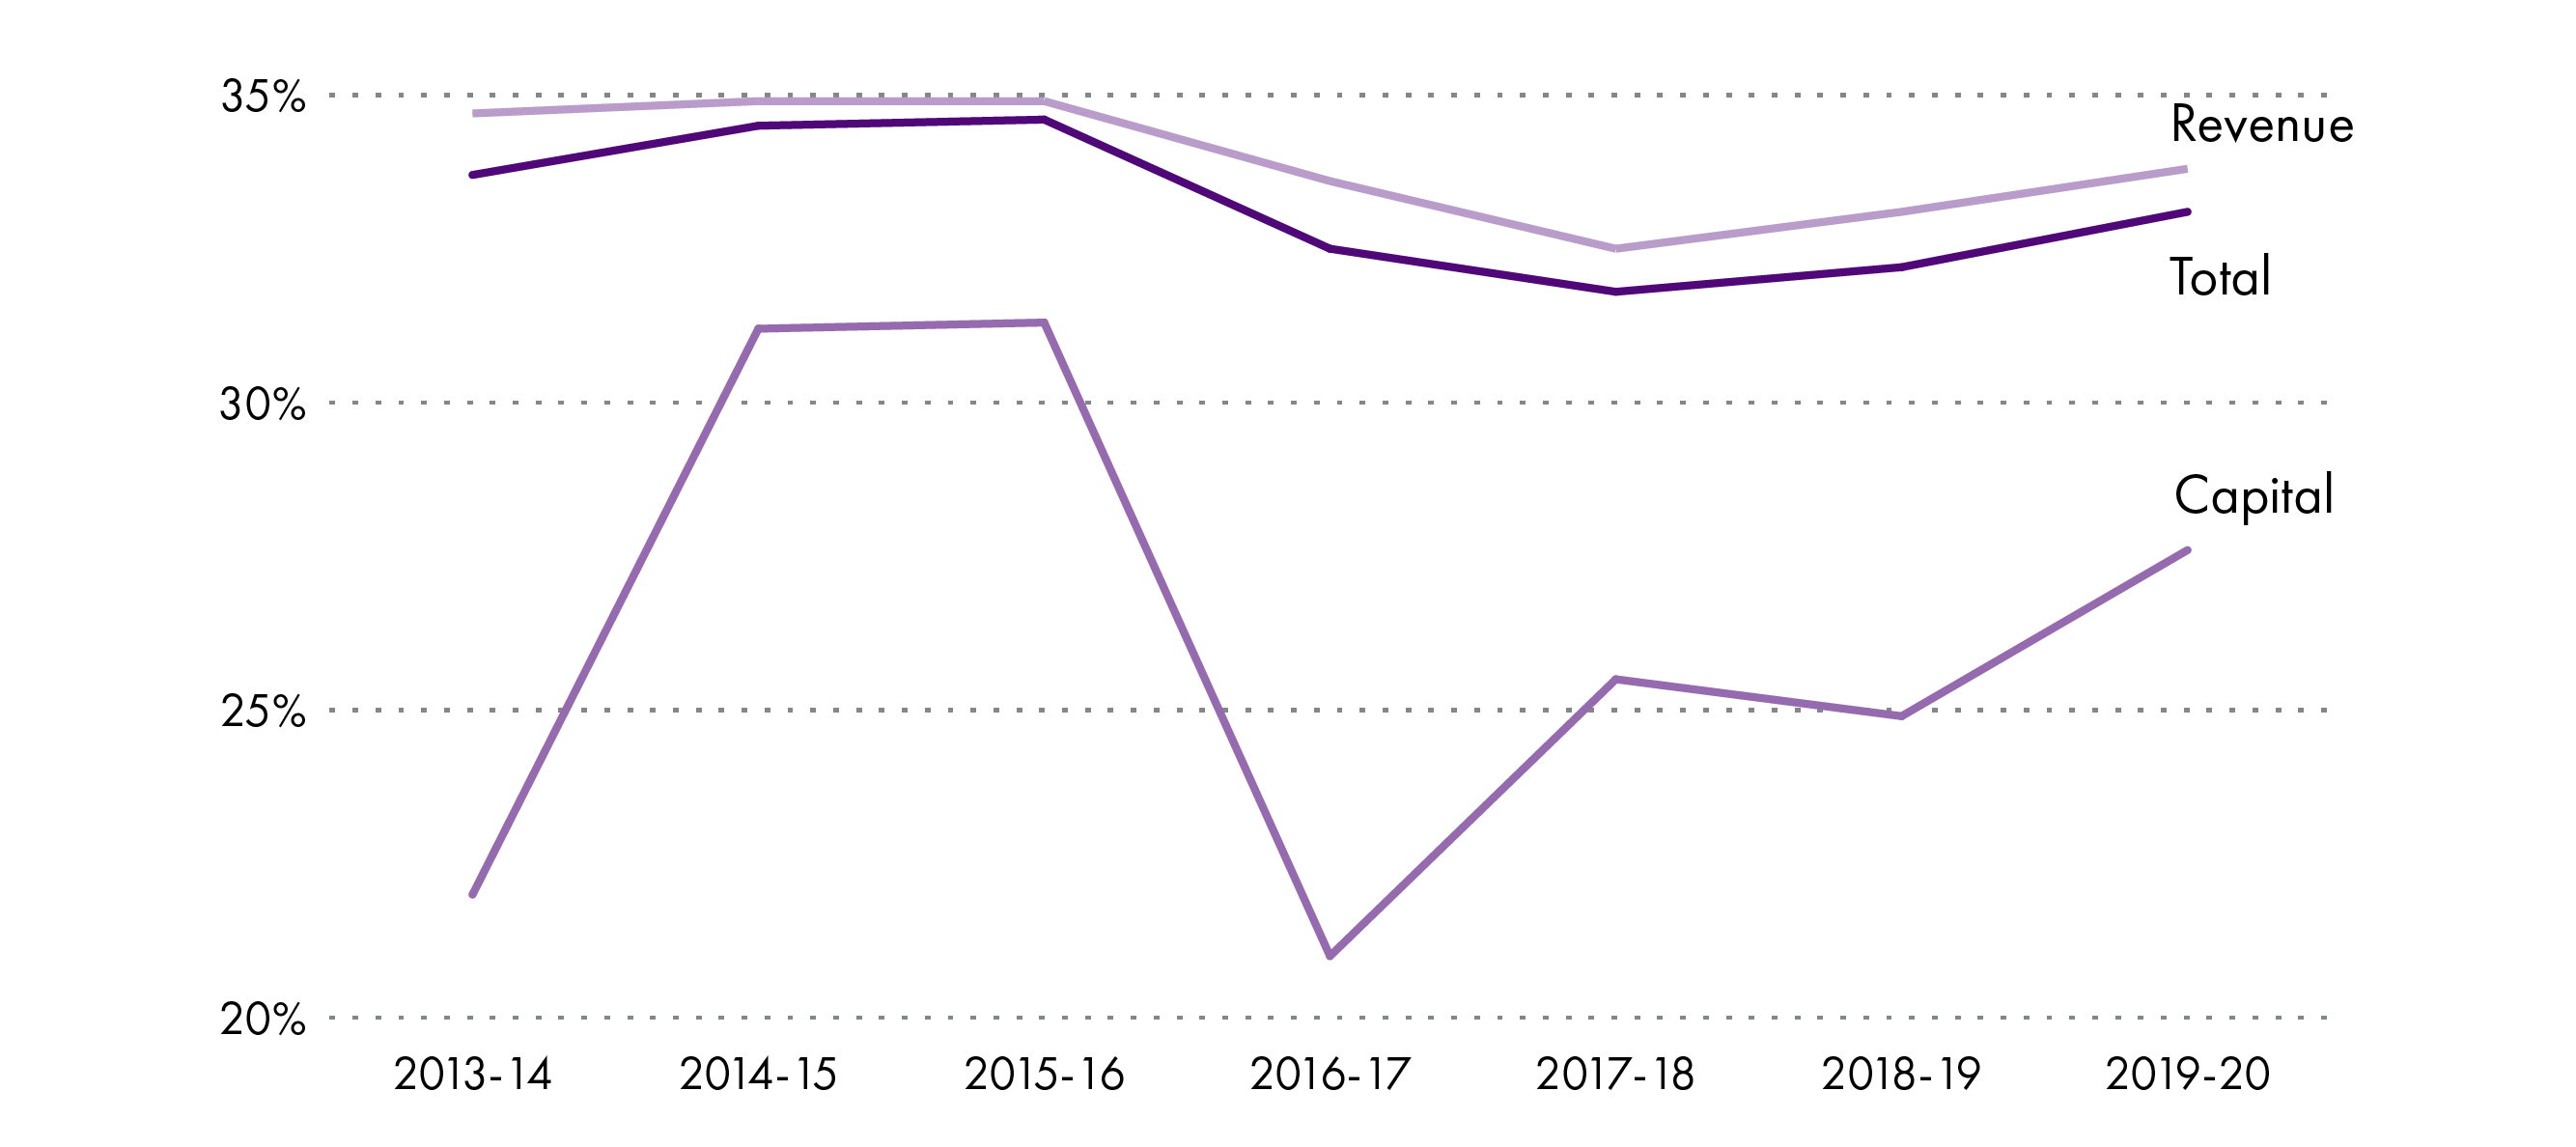
As noted, it is important to look at revenue and capital figures separately, as revenue funding alone represents the funding available for local authorities to deliver services. It should also be noted that capital figures can vary widely year-on-year.
Revenue figures:
The local government revenue settlement as a proportion of the Scottish Government revenue budget decreased by 2.6 percentage points between 2013-14 and 2019-20.
LGFO figures show Local Government revenue as a proportion of Scottish Government revenue increasing between 2018-19 and 2019-20.
Capital figures:
As noted, capital figures, by comparison, vary much more widely than revenue figures, which can be seen from the chart. This is mainly because the capital grant was re-profiled over a number of years. The re-profiling was as follows:
-£100 million in 2013-14
+£120 million in 2014-15
+£94.2 million in 2015-16
-£150 million in 2016-17
+£150 million in 2019-20.
This is important particularly for the reduction in total funding in 2016-17 as 2015-16 was boosted by £94.2 million as a result of re-profiling, and 2016-17 was reduced by £150 million.
In 2020-21, there has been no re-profiling of capital grant funding.
Total settlement:
Looking at both revenue and capital figures combined, local government's share of the Scottish Government's budget decreased by 1.7 percentage points between 2013-14 and 2019-20.
LGFO figures suggest that this will decrease again, by 1.8 percentage points, between 2019-20 and 2020-21, though as noted this is largely due to capital re-profiling skewing the total figure, masking a predicted increasing proportionate share of revenue funding.
Ring-fenced funds
There has been much debate over ring-fencing and what constitutes a "protected" area of the budget during recent Budget rounds, which SPICe explored as part of its 2019 Facts and Figures publication.
As we suggested may happen in last year's publication, the Local Government and Communities Committee and other stakeholders have continued to take interest in this discussion. We discussed COSLA's standpoint on the 2020-21 settlement and ring-fencing, along with the Scottish Government's response, as part of our briefing on Budget 2020-21 and provisional allocations to local authorities, and the matter was discussed in evidence sessions throughout the Committee's pre-Budget scrutiny 2020-21.
Exploring ring-fenced funds
To add a level of complication, there are a number of different viewpoints on ring-fencing, and what can be classed as such,:
SPICe looks at 'specific revenue grants' only, as per our analysis below, which is in line with our approach of focusing on the settlement as set out in local government finance circulars. In 2019-20, our analysis suggested that 5.1% (£508 million) of total revenue funding was ring-fenced in 2019-20.
The Accounts Commission looks at both specific revenue grants and funding for other national policy initiatives that is set out in the annual settlement but not formally ring-fenced. They reported that 12.1% (£1.2 billion) of total revenue funding in 2019-20 was ring-fenced, with 7.1% of this being for policy initiatives (predominantly for education and social care services)1.
COSLA takes an approach which is broader yet, which focuses on estimated expenditure and explores areas that have been ring-fenced or are protected through obligations created by current and past Scottish Government policy initiatives, demand pressures, or fixed obligations such as loans charges. In correspondence to the Local Government and Communities Committee, COSLA said that 60% of the 2019-20 Budget was protected, meaning that any savings would have to come from the remaining 40%2. COSLA have also highlighted in news releases relating to the 2020-21 Budget that no additional funding was made available for changes to inflation or to address the impacts of past budget cuts3.
The Scottish Government does not agree with approaches which aim to quantify the impact of ring-fenced or protected spend. The former Cabinet Secretary for Finance, Economy and Fair Work clarified that:
On the question of “protected” or “non-discretionary” funding that is a matter for each individual local authority to decide upon but what we have, and will continue to do, is set out a description of the funding elements of the overall funding package that are linked to identifiable policy initiatives that we expect those elements of funding to be spent on.
Having said that it is for individual local authorities to determine how they achieve those policy initiatives and how much of the available funding that they need to spend to achieve the required outcome. As a result it is not possible for the Scottish Government to separate out those elements of the overall funding total that can be described as “protected” or “discretionary” other than the specific grant funding which is already clearly identified.
Scottish Government. (2019, February 8). Correspondence from the Cabinet Secretary for Finance, Economy and Fair Work and the Cabinet Secretary for Communities and Local Government to the Convener. Retrieved from https://www.parliament.scot/S5_Local_Gov/Inquiries/20190208_Budget_CabSecFEFW_CabSecLGCToConvener.pdf [accessed 19 May 2020]
Ring-fenced funds 2013-14 to 2020-21
Updating our longer-term look at ring-fencing, figure 6 explores, based on Local Government Finance Order figures, ring-fenced funds (that is, "specific revenue grants") as a proportion of Total Revenue settlement, between 2013-14 and 2020-21.
Local Government settlement per head
One way of looking at changes in the local government settlement over time is to explore the impact on funding for local authorities per head. The SPICe Briefing Local Government Finance: Budget 2020-21 and provisional allocations to local authorities1 explores the 2020-21 Budget figures, but not the longer term trends.
In order to provide a comparable trend over time, up to the current year, all figures in this section have been taken from the Local Government Finance Order stage of the budget process as opposed to using final outturn figures. Real terms figures are detailed in Annex Table 8, and full tables are available from SPICe on request. Population figures for 2020-21 are taken from the most recent available data, from mid-2019, and previous years are taken from an equivalent point (i.e. 2019 figures for 2020-21 and so forth).
Because of adjustments made to the settlement package for island authorities, the narrative differentiates between island and mainland authorities.
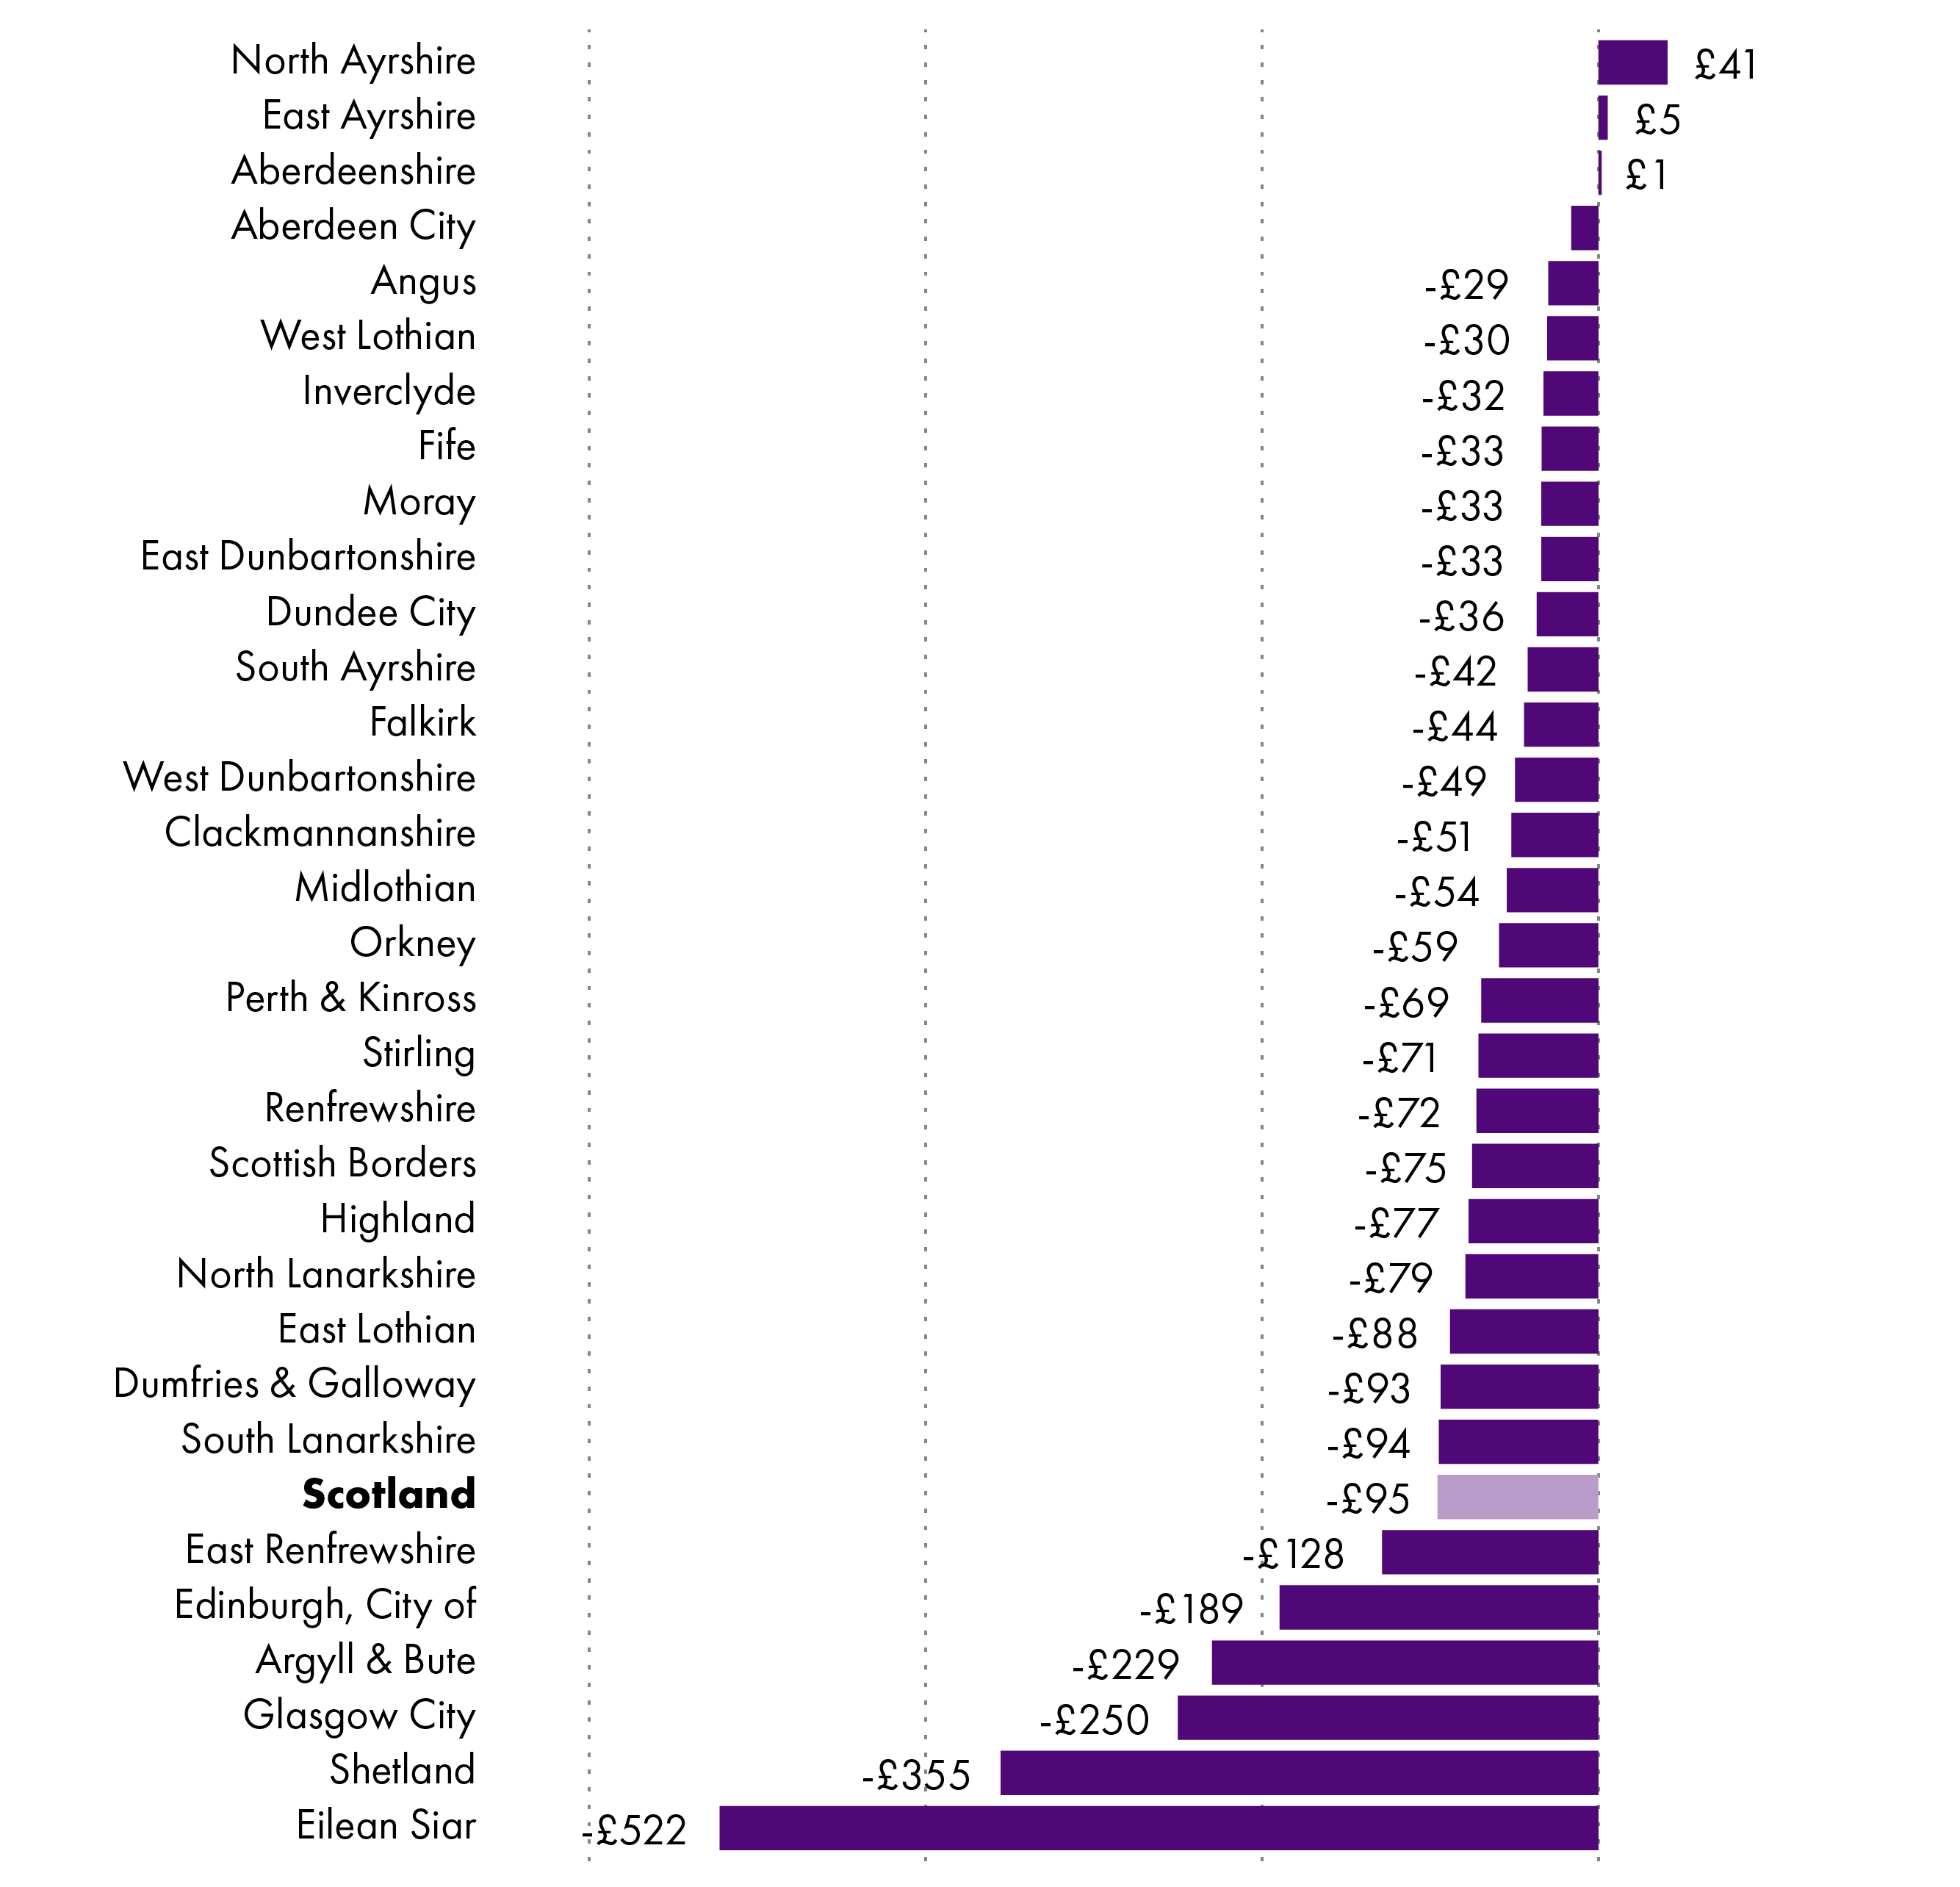
Figure 7 shows the change in £ funding per head across all local authorities.
The greatest reduction in real terms revenue funding per head between 2013-14 and 2020-21 has been for Eilean Siar, at £522. In the context of wholly island authorities, Orkney has seen the smallest change to real terms revenue funding per head between 2013-14 and 2020-21, at -£59.
The greatest reduction in real terms revenue funding per head between 2013-14 and 2020-21 for a wholly mainland authority has been for Glasgow City, which has seen its real terms revenue funding per head reduce by £250.
Of the mainland authorities, both East Ayrshire and Aberdeenshire have seen a very slight increase in revenue funding per head between 2013-14 and 2020-21 (£6 and £2 respectively).
North Ayrshire (which has some islands) has seen the greatest increase to its real terms revenue funding per head, with a £41 increase between 2013-14 and 2020-21.
As discussed when looking at the long-term trend as a whole, the picture has improved somewhat from the figures shown in last years' iteration of this briefing, and we would expect this to again be the case when it comes to looking at the same figures in a year's time.
Per head funding as a % of the Scottish average
Figure 8 shows changes to the percentage of the Scottish average per head funding by local authority. It's worth noting that the high populations of Edinburgh and Glasgow, and falling per head figures in those local authorities, have skewed the Scottish per head average.
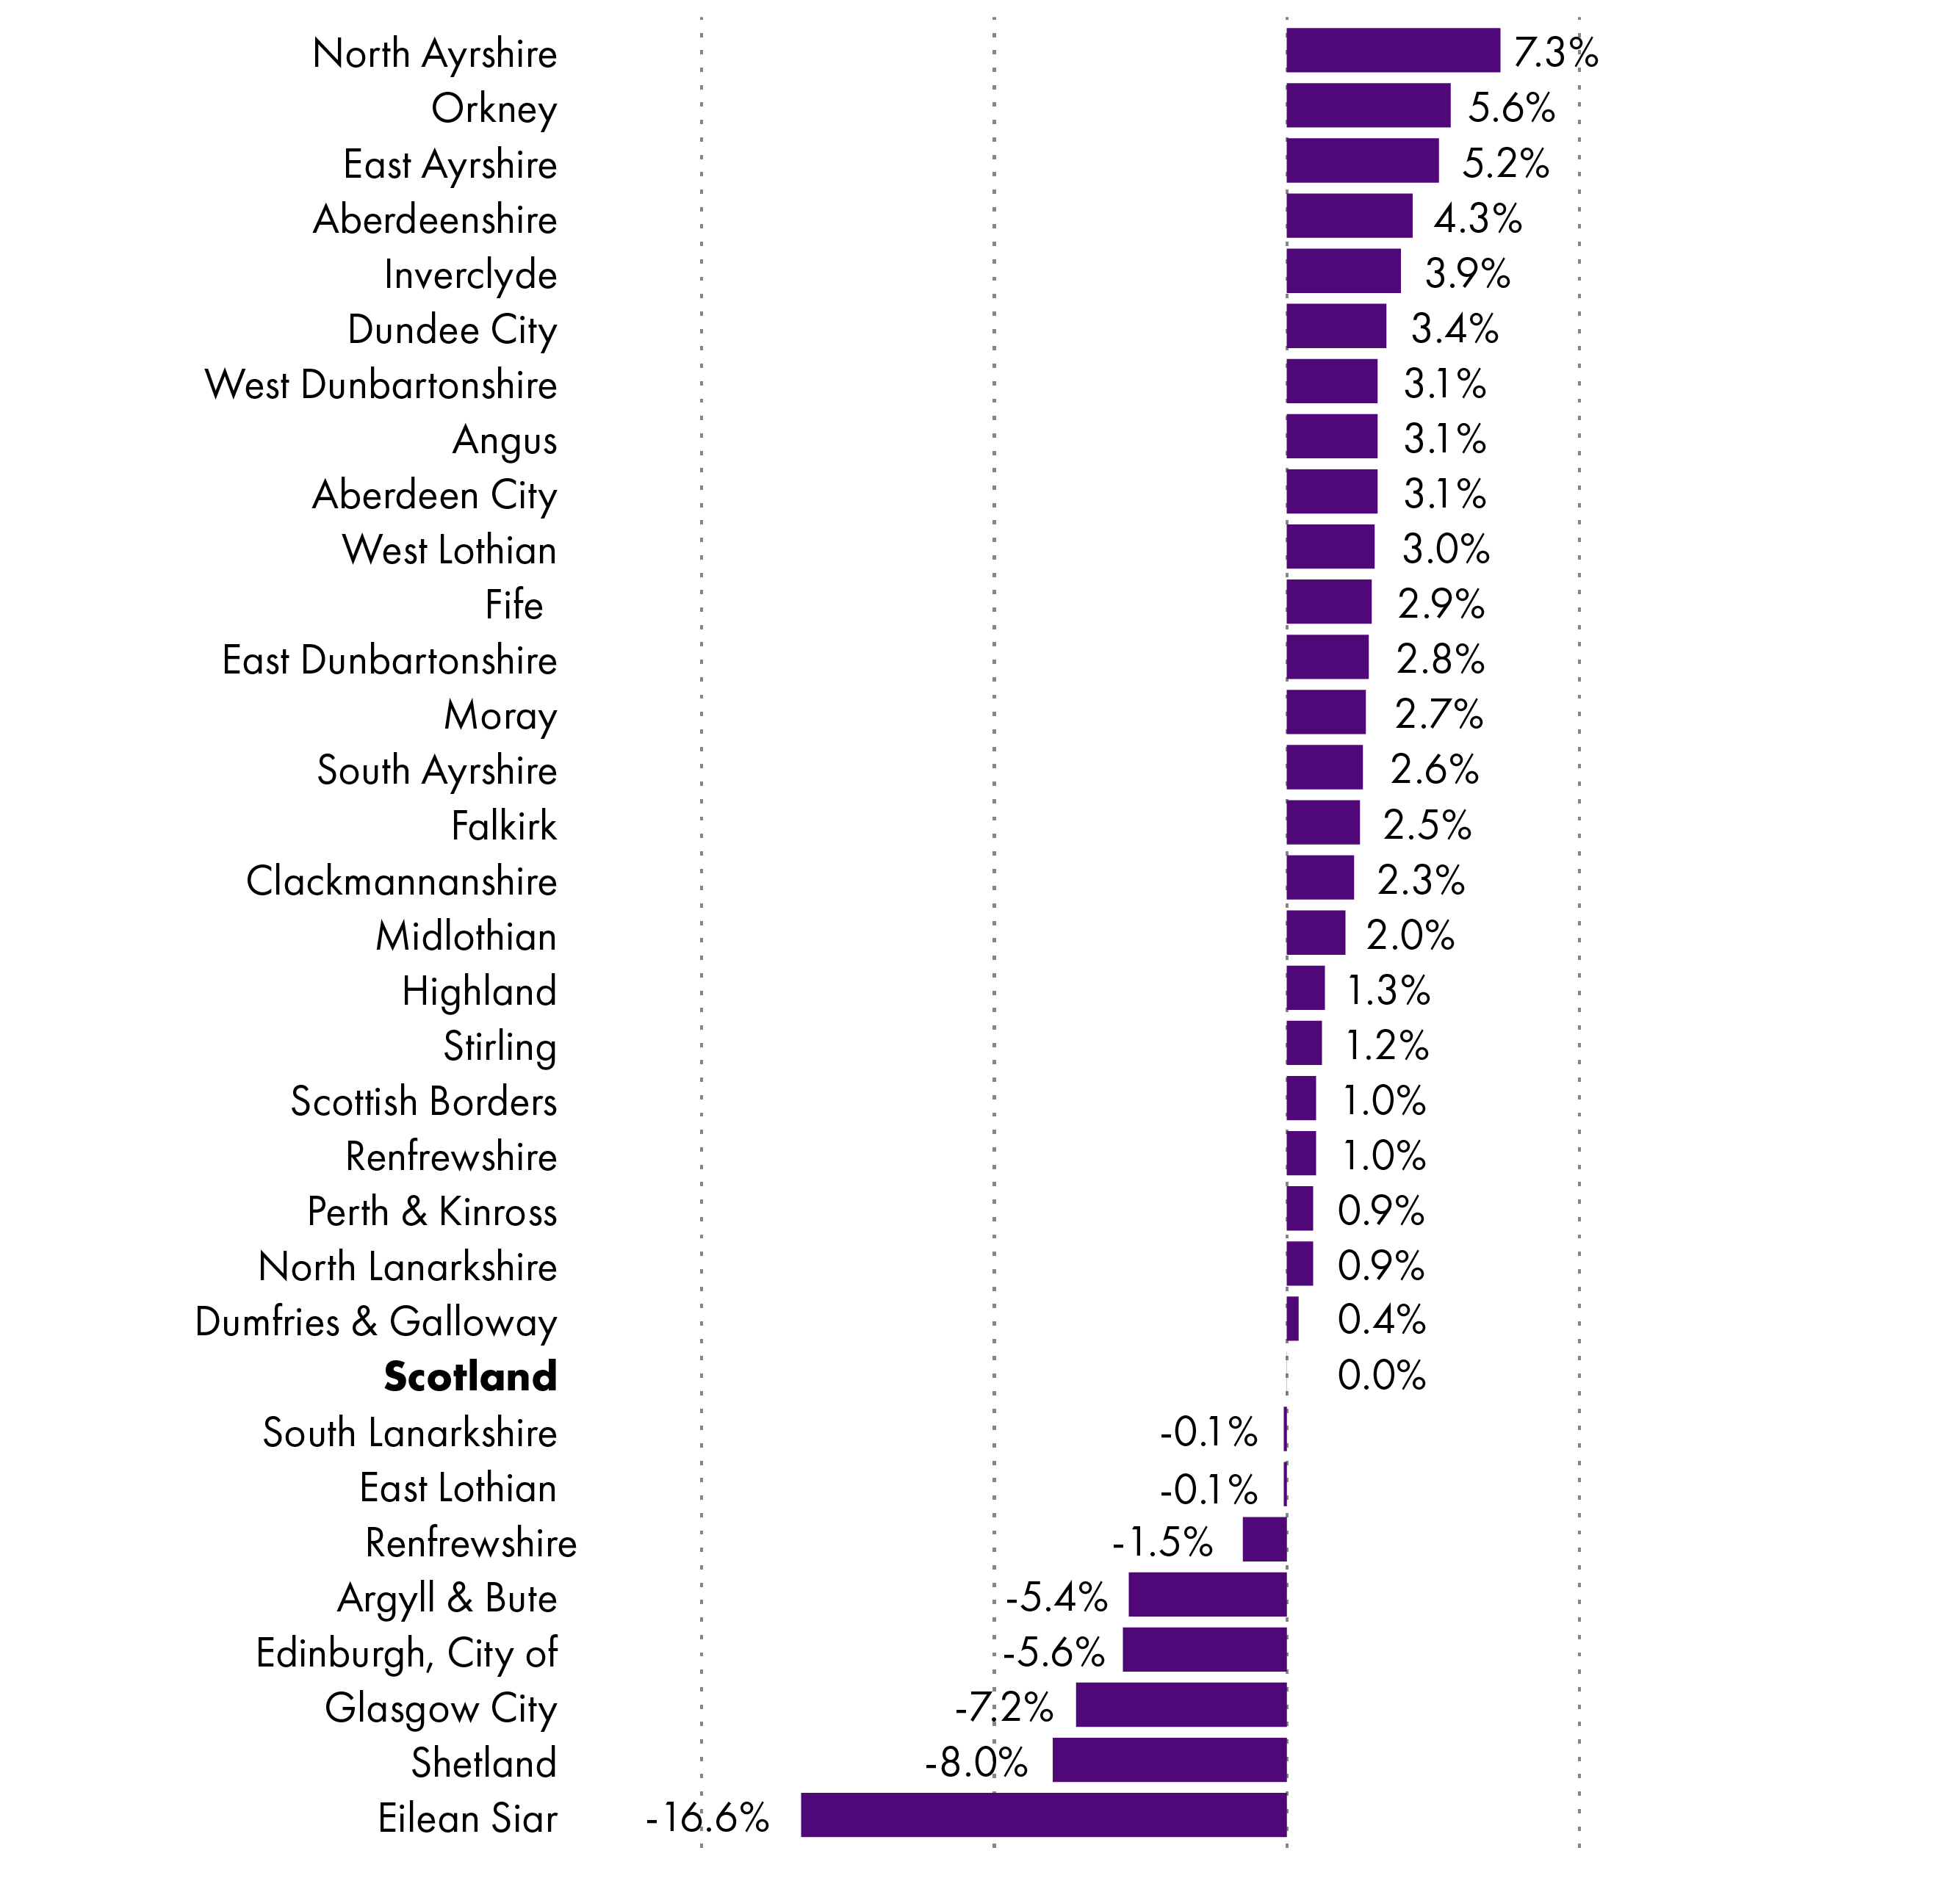
Amongst the mainland authorities, Glasgow City has seen its funding per head, as a percentage of the Scottish average, fall by 7.2 percentage points between 2013-14 and 2020-21. Edinburgh has seen the second highest fall, at 5.6 percentage points.
Of the wholly mainland authorities, at 5.2 percentage points, East Ayrshire has seen the greatest increase to its its funding per head as a percentage of the Scottish Average.
North Ayrshire has seen the greatest increase of all authorities to its funding per head as a percentage of the Scottish Average, with a 7.3 percentage point uplift.
The island authority with the greatest percentage point change is Eilean Siar, with a 16.6 percentage point decrease between 2013-14 and 2019-20. Orkney has seen, by comparison, a 5.6 percentage point increase.
Council Tax and Non Domestic Rates
Non-domestic Rates (NDR) are collected by individual councils and pooled by the Scottish Government, who then redistribute it to councils as part of the overall annual local government revenue funding settlement. This is an accounting exercise and local authorities do not actually transfer all their NDR income (NDRI) to Government. Rather, an adjustment is made at the end of the year dependent on what each local authority has collected and what its share of the distributable amount is. Council Tax is, by comparison, collected directly by local authorities and retained. The ratios between Council Tax bands are set out in legislation. Following the end of the Council Tax freeze (which applied from 2007-08 to 2016-17), recent Local Government Finance settlements have included agreement between the Scottish Government and local government for locally determined Council Tax increases to be capped at 3 per cent in cash terms (in 2017-18 and 2018-19). In 2019-20 increases were capped at 3 per cent in real terms, which was 4.79 per cent in cash terms. Council Tax reform was implemented in 2017-18 - detail on these reforms and the impact can be found in the 2018 iteration1 of this briefing.
The Scottish Government guarantees the combined General Resource Grant and distributable NDRI figure, approved by Parliament, to each local authority. If NDRI is lower than forecast, this is compensated for by an increase in GRG and vice versa. Therefore, to calculate Local Government's revenue settlement, the combined GRG + NDRI figure is used.
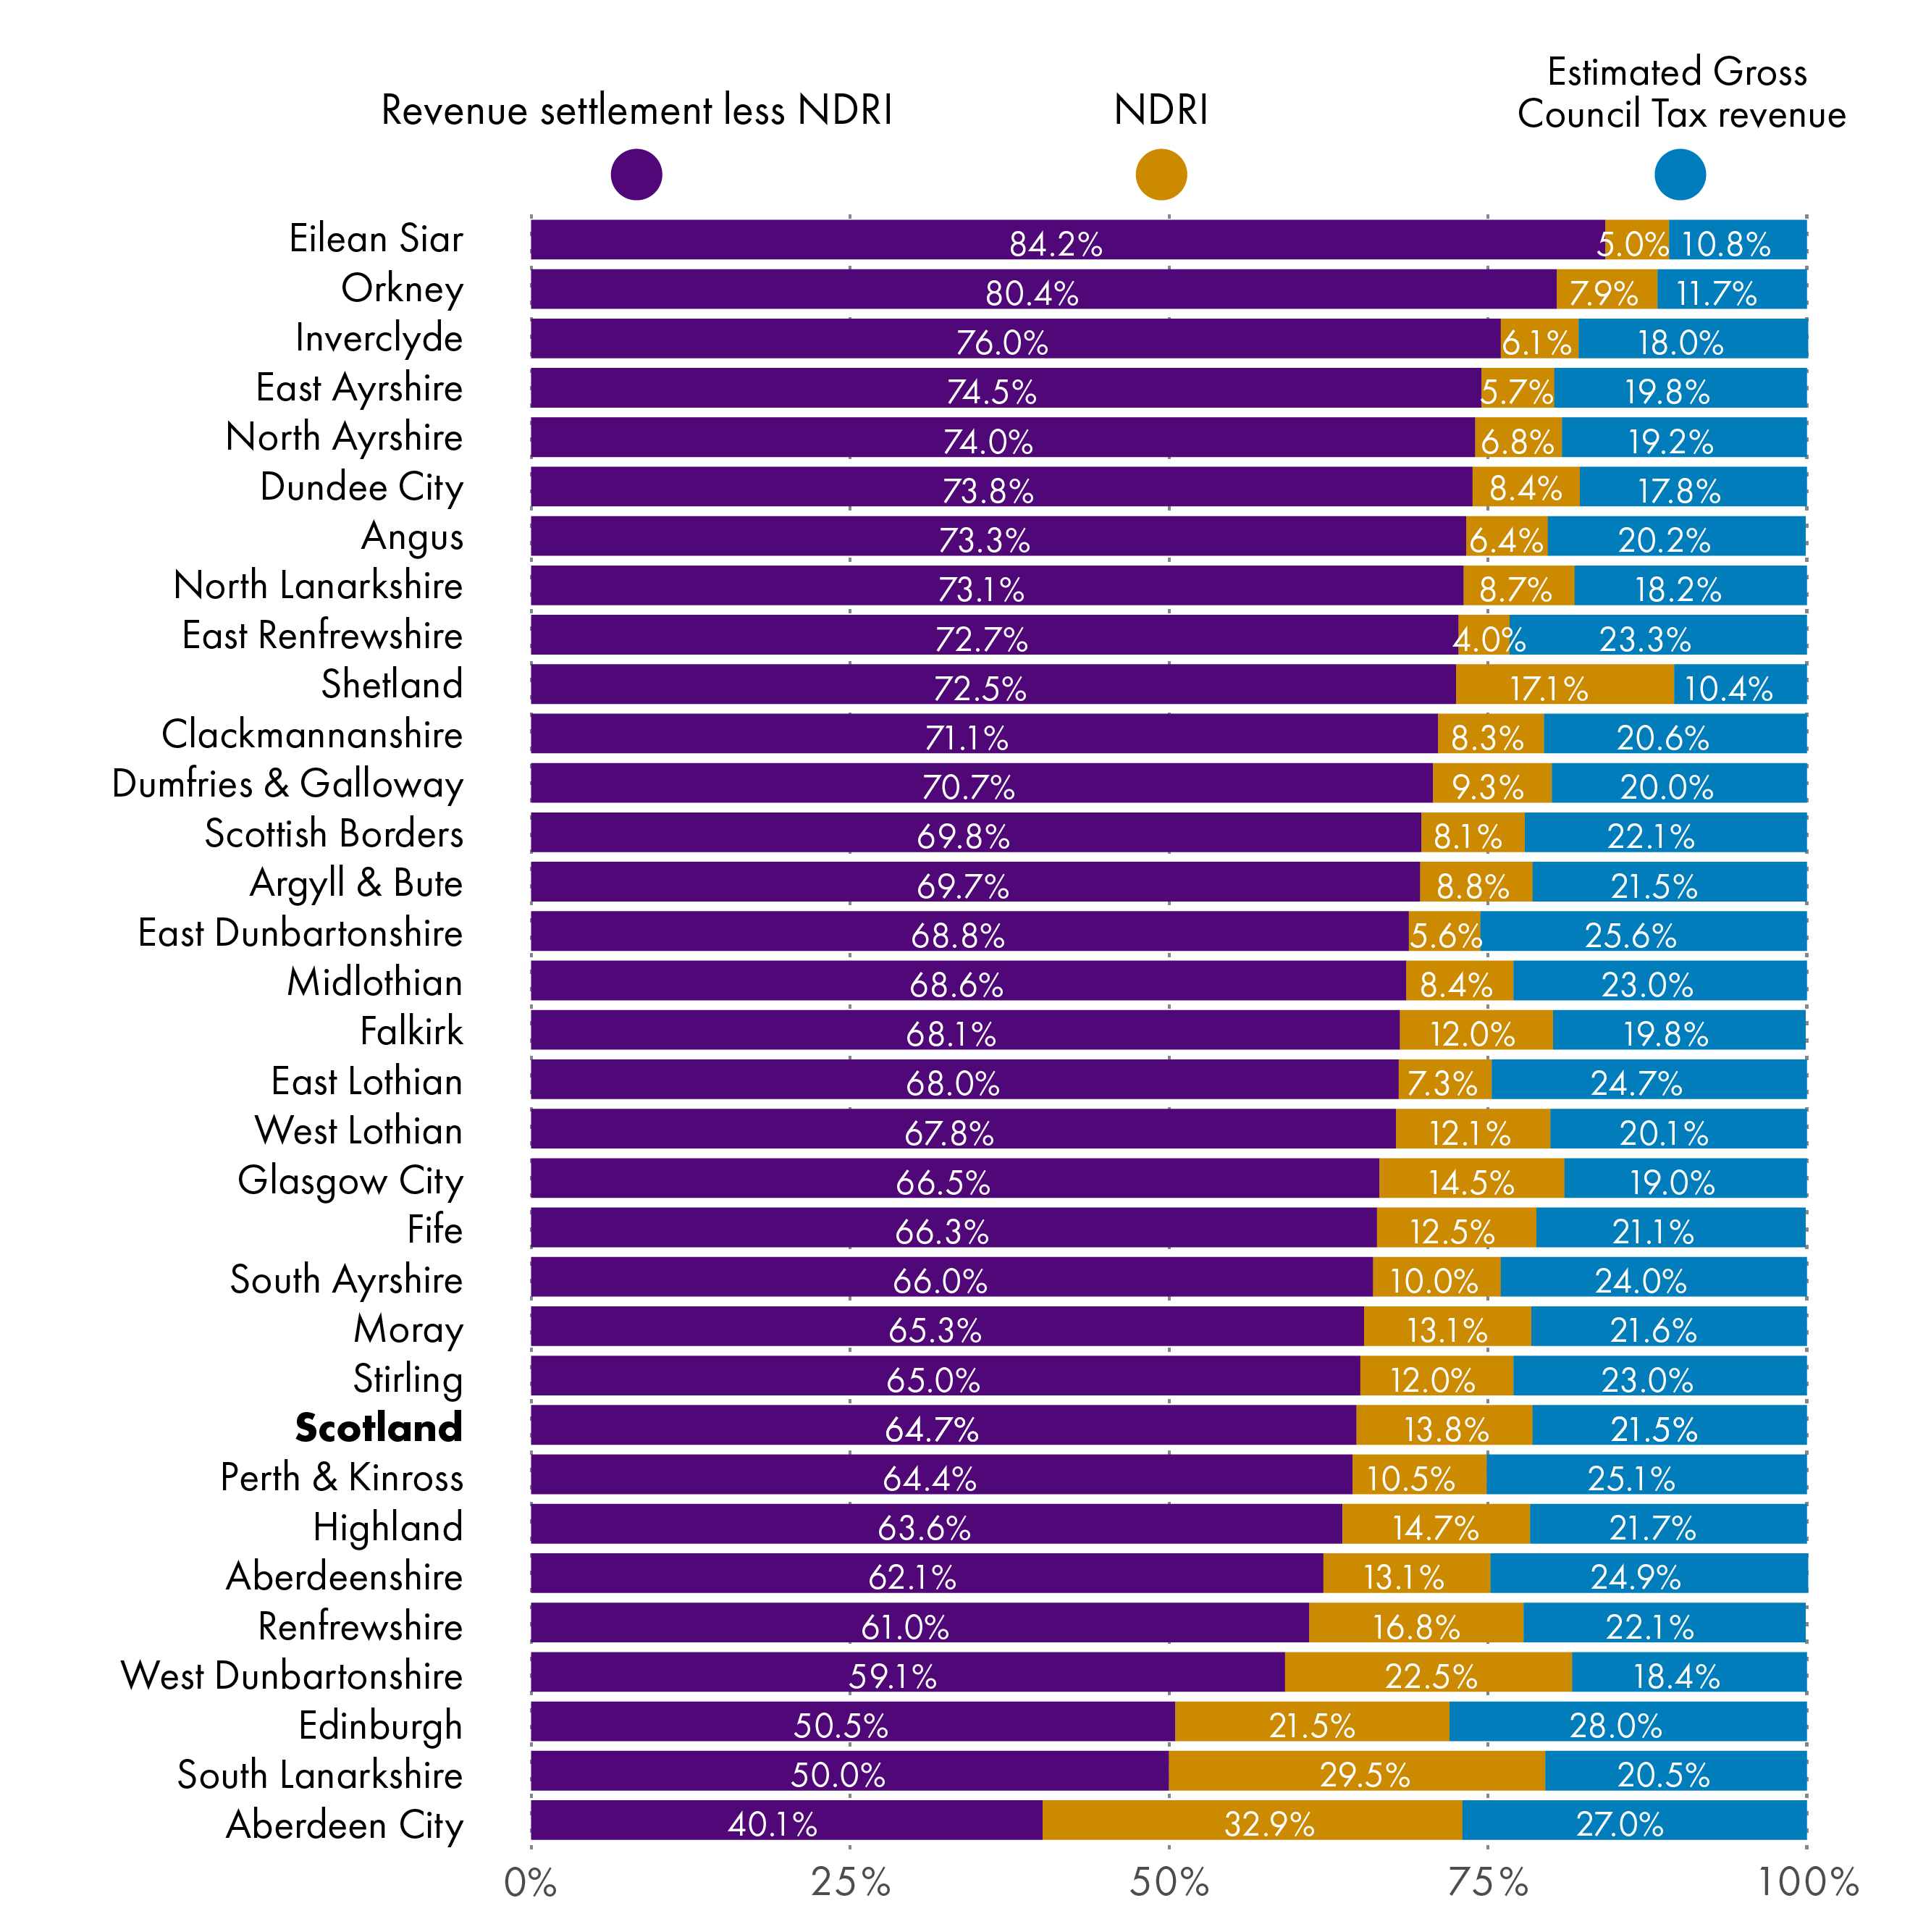
Figure 9 looks at the relative proportion of total funding that revenue grants provided by the Scottish Government, NDRI and Council Tax income represent - in this case NDRI and GRG have been separated out to give an indication of expected proportions. Figures can be found in the Annex. It's important to note that this does not represent the total amount of funding available for local authorities - it does not include, for instance, income collected directly by councils through fees and charges for services, any funding delivered to councils which is not set out in the Local Government Finance Circulars (for instance funding for Health and Social Care Integration), or capital funding.
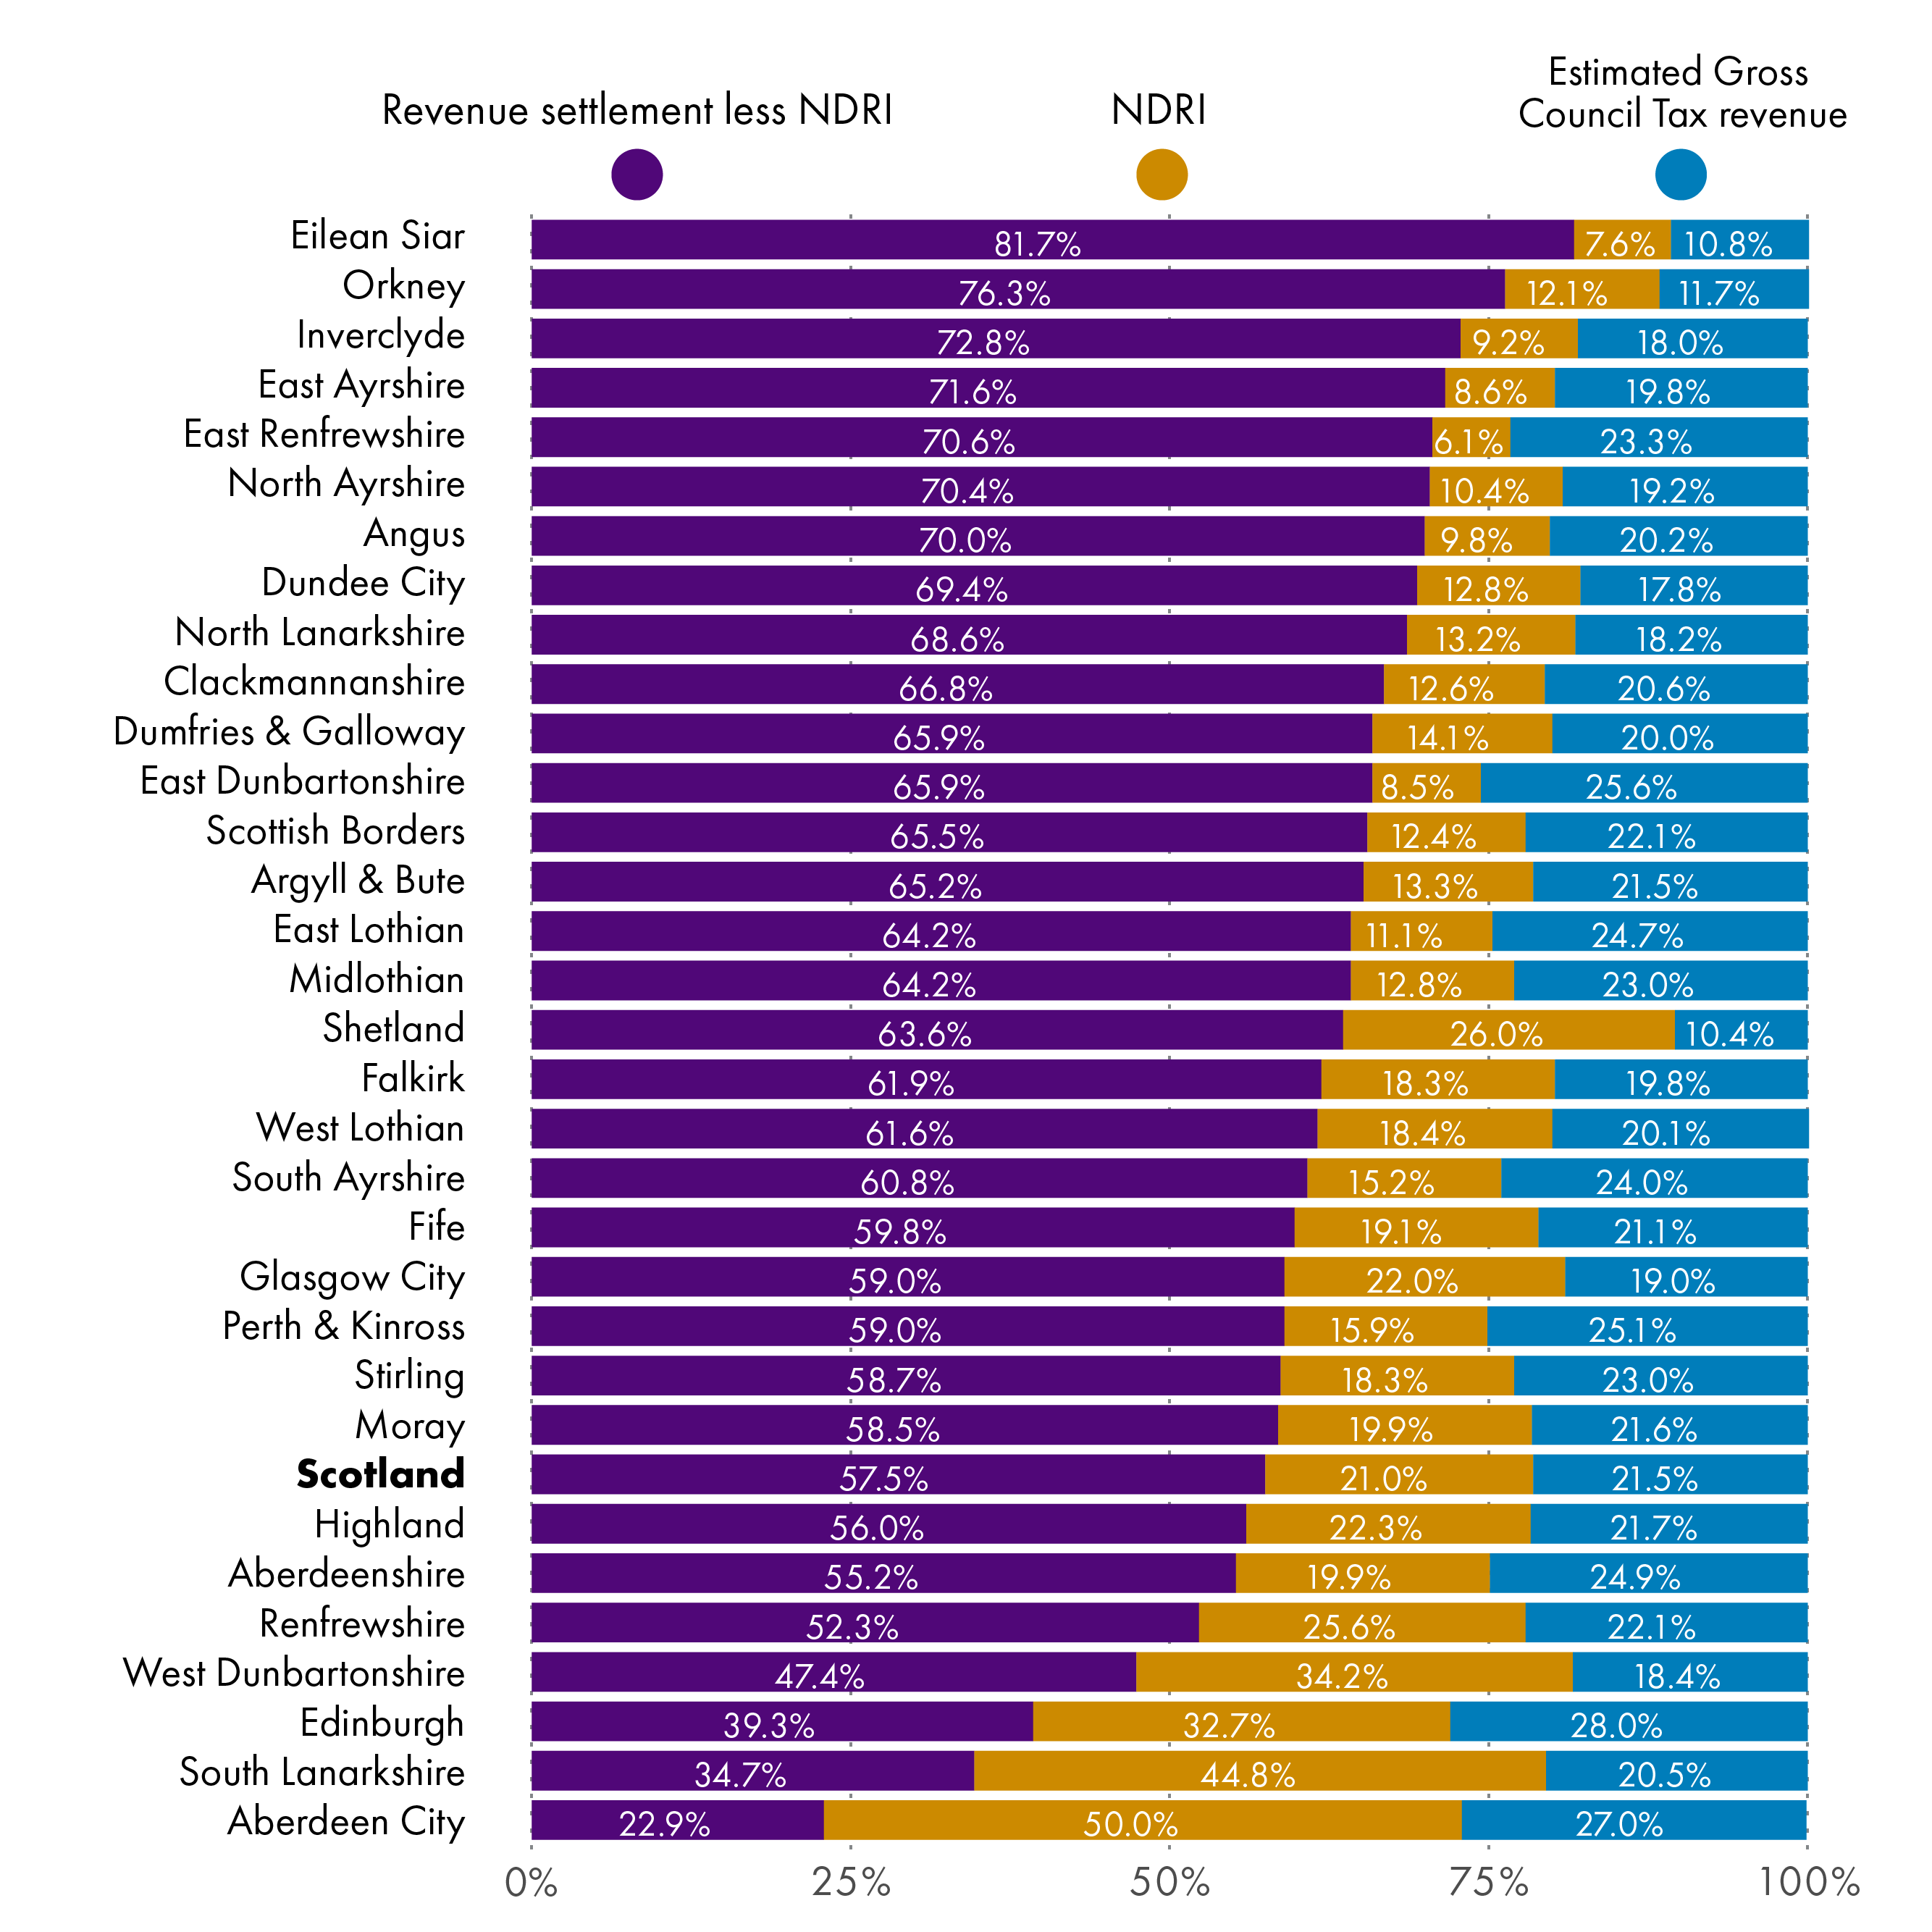
These figures serve to highlight the varying structure of local government revenue funding across local authorities. Some local authorities rely far more heavily on the revenue grant provided by the Scottish Government and have relatively limited ability to raise funding through taxation, and others see the majority of their funding coming from Council Tax and NDR Income.
Council Tax and NDR income levels
With NDR, the Scottish Government sets an annual "distributable amount" (DA), based on forecast collected revenue and on policy choice. The distributable amount of NDR is distributed to councils on the basis of their share of the previous year's mid-year estimated income. The NDR Account may be in surplus or in deficit as a result.
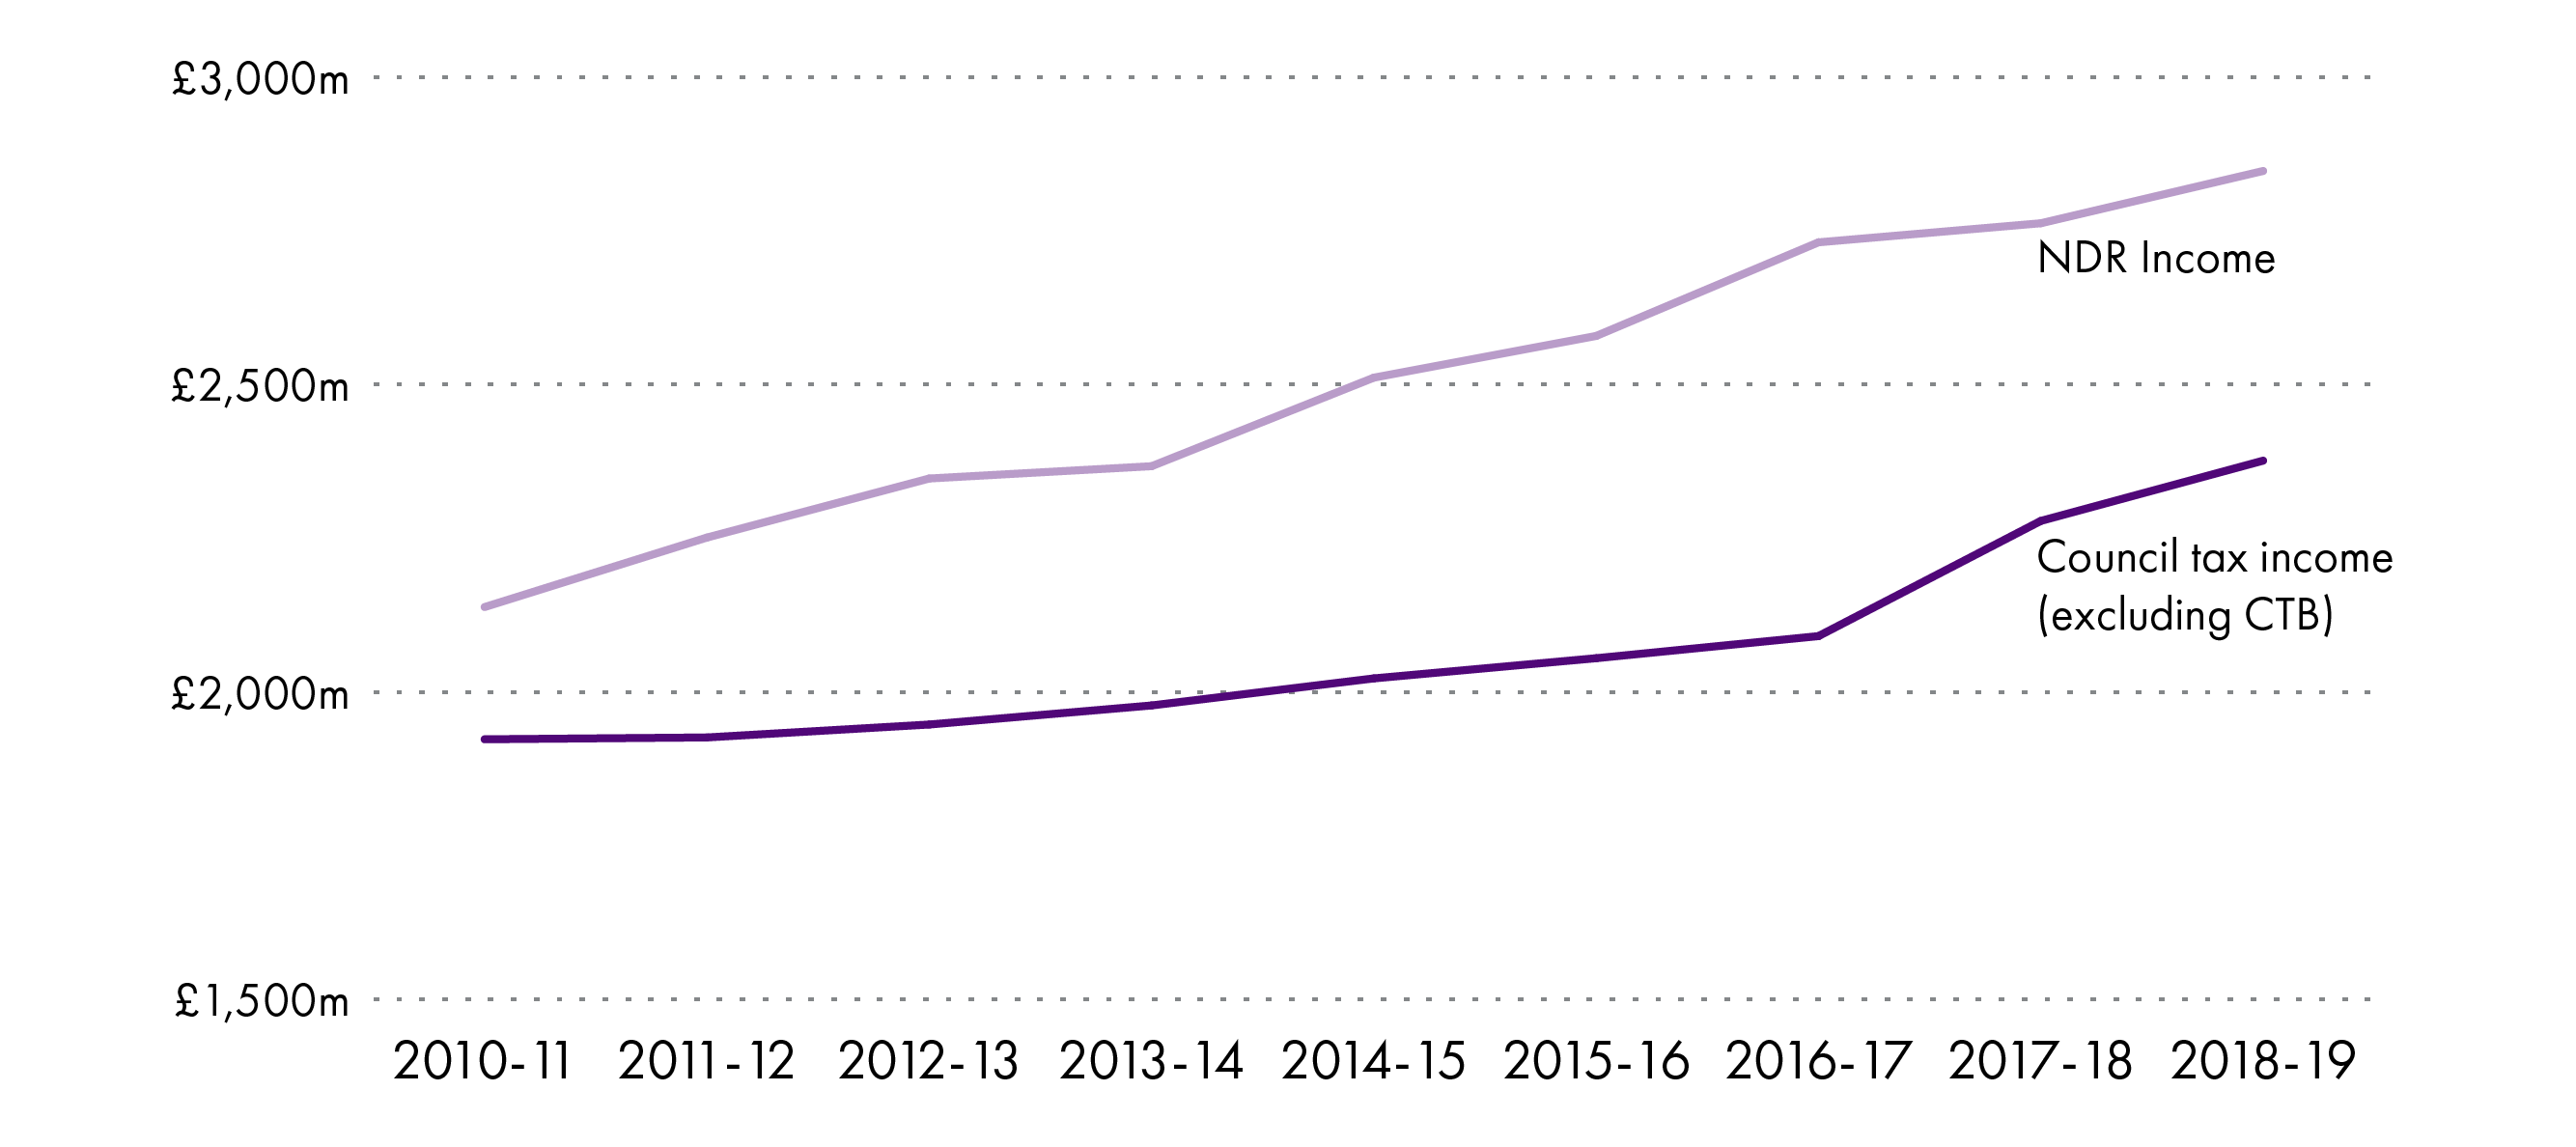
Figure 10 shows the impact of recent changes to NDR and Council Tax policy. As can be expected, Council Tax income has increased as a result of policy changes in 2016-17 and Council Tax increases in April 2017 and April 2018. N.B. Council Tax figures here are excluding Council Tax Benefit, and ignoring income foregone due to Council Tax Reduction.
NDR Income, i.e. the amount collected by local authorities and paid to the Scottish Government, has increased. The Distributable Amount has reduced in recent years, despite the income increasing, illustrating the discrepancy between what is collected and what is distributed, giving some idea of what the NDR Account might look like.
Future years data will likely show a varying picture, which we explore in the following section on the NDR pool.
The NDR pool
In 2018-19 the Scottish Government set a DA that would have brought the NDR Account back into balance had the collected amount equalled the forecast1. In 2019-20, the amount of NDR distributed to local authorities saw a dramatic increase, of 8.2% (£217 million) in cash terms, or 6.3% (£166.8 million) in real terms. £100 million of this increase comes from a decision to include forecast funds from future years to the 2019-20 Budget2.
However in the 2020-21 Budget, the Government states that:
This decision to bring forward some of the forecast growth in NDR receipts from 2020‑21 and 2021‑22 was intended to support continued investment in local government and stimulate the economy. In the event the latest SFC NDR income estimates confirm that the NDR pool will actually show a surplus of £25 million for 2019‑20. Since we did not utilise this facility in 2019‑20, our budget plans therefore propose to bring forward some of the forecast growth from 2021‑22 and 2022‑23 and allocate £100 million more in 2020‑21 than is forecast to be collected in the pool.
So, having not in fact needed to use this additional money in 2019-20 as originally planned, the Government now says it intends to do the same in 2020-21, and that it intends to bring the pool back into balance in 2022-23.
We explored the Scottish Fiscal Commission (SFC) forecasts for NDR in our main Budget 2020-21 briefing, setting out that:
The SFC forecast for NDR in 2020-21 is £2,749 million, £86 million lower in real terms than in 2019-20 (a real terms decrease of 3.2%). Between 2020-21 and 2024-25 this is forecast to rise to £3,590 million.Compared to the SFC’s previous forecast, NDR revenue is forecast to be £137 million lower in 2020-21, £74 million lower in 2021-22, £50 million higher in 2022-23 and £90 million higher in 2023-24. There are two reasons main drivers of this change since the last forecast – updated data in the form of audited local authority returns and on appeal losses which reduces expected revenues in every year of the forecast, and forecasts of the impact of the NDR Bill which is expected to increase revenues by around £150 million in 2022-23 and 2023-24.
Scottish Parliament Information Centre. (2020, February 10). SPICe Briefing 20-12: Scottish Budget 2020-21. Retrieved from https://digitalpublications.parliament.scot/ResearchBriefings/Report/2020/2/10/Scottish-Budget-2020-21 [accessed 12 February 2020]
In the section on COVID-19 we look at the impact on Non-Domestic Rates Income in 2020-21 - it is not clear at the time of publication what the longer-term impact of this will be on the SFC's forecasts, and consequently on the Scottish Government's stated intentions on bringing the NDR account back in to balance in 2022-23, but our understanding at the time of publication is that as these changes were agreed in advance by the Local Government Finance Order, the NDR pool does not see the full impact from the reliefs package. There will still be an impact on the pool if NDR income turns out to be higher or lower than the revised NDR income amount (£1,868 million), but this will not be finalised until later in the financial year.
That said, as noted in a recent blog on the Summer budget revision, the cost of the NDR relief package has already been revised downwards from £972 million to £875 million. If there were no other changes, this difference of £97 million would be result in an addition to the pool of an equivalent amount (because the costs of the relief scheme are lower than originally estimated, NDR income will be correspondingly higher than allowed for in the Local Government Finance Order).
In summary, the reduction of £972 million as a result of reduced NDR income will not be reflected by a reduction of this scale in the NDR pool. Rather, additions or deductions to the NDR pool will only reflect the extent to which the final NDR figure differs from the lower revised NDR estimate of £1,868 million.
Council Tax income post-reform
Figure 11 shows the impact of Council Tax reform in recent years on each local authority. These figures represent gross Council Tax revenue. They are calculated taking account of all discounts and exemptions, and the collection rate, but do not take account of Council Tax Reduction (CTR). They are therefore on the basis used in the assumed Council Tax income element of the Local Government Finance settlement (rather than being the figures that are used in the calculation of the Local Government Finance settlement).
Note that:
Local authorities are funded separately for the Council Tax income they forego due to CTR.
As noted, and unlike other sections of this briefing, figures here are given in cash terms and do not take into account inflation.
These figures are gross figures which fall in line with the figures in the Local Government Finance settlement, as opposed to net figures which show the actual revenue from Council Tax received by local authorities, with the actual increases local authorities made in 2019-20 taken in to account.
Figures explored do not take into account any changes related to aspects such as population change and changes to housing infrastructure.
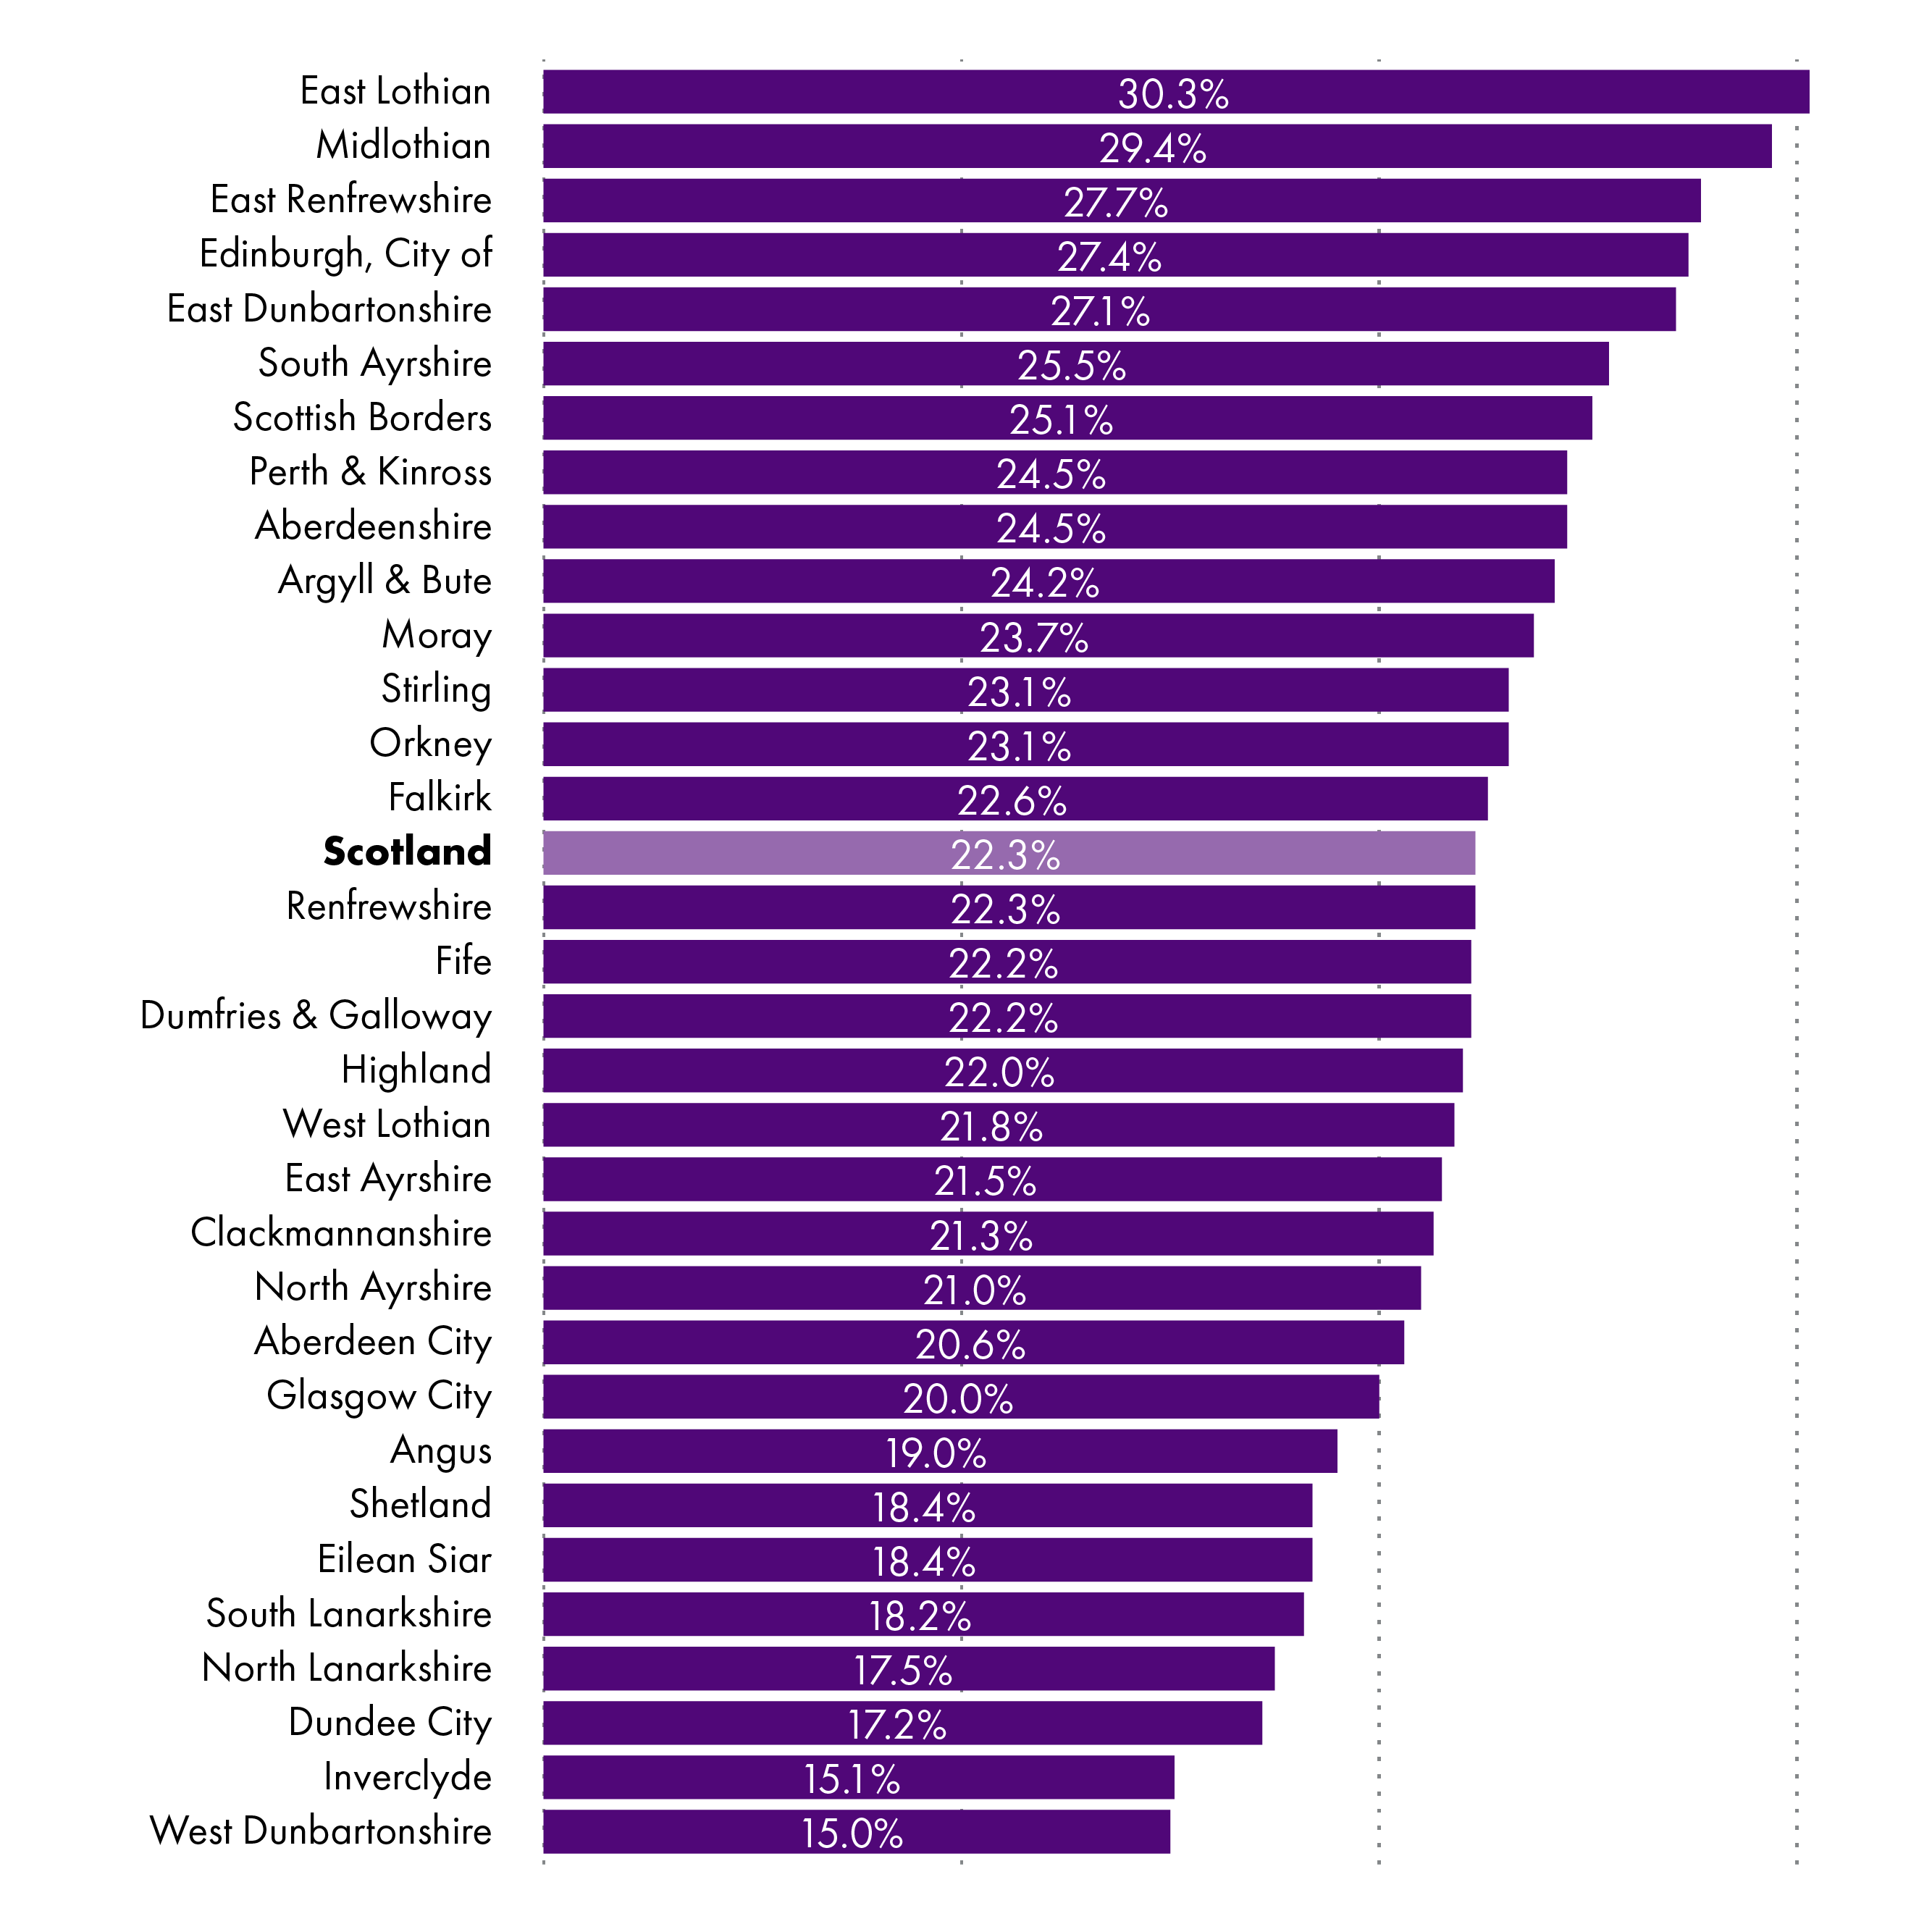
The variations illustrate the relative Council Tax base of each authority - some local authorities have higher proportions of low-band properties, whilst others tend to have higher levels of Band E-H properties. The Scottish Government and local authorities agreed to cap Council Tax increases at 3% in cash terms 2017-18 and 2018-19. In 2019-20 this cap increased to 3% in real terms (4.79%), and in 2020-21 a similar rule was applied, with the real terms cap being 4.84%. The implementation of changes has been varied:
In 2017-18, 21 councils opted to increase the Band D rate of Council Tax (against which all other Bands are set) by the full 3%. Three councils chose increases of 2% or 2.5%, and eight councils opted to apply no increase.
In 2018-19 all 32 local authorities chose to apply the maximum increase of 3%.
In 2019-20, 13 councils applied a 3% increase, one council chose a 3.95% increase, five councils opted for a 4% increase, one council went with 4.5%, and 12 councils chose to apply the maximum 4.79% increase.
In 2020-21, 20 councils chose to apply the maximum 4.84% increase, and two were close at 4.79%. Six councils chose unique figures between 3.95% and 4.64%, and only four councils applied a 3% increase.
The varying practice in applying Council Tax increases means that there has been a compounding effect to the increases in certain local authorities, and, as a result, some change in the landscape of Council Tax revenue since 2016-17 compared to what was shown in Figure 8 of the 2017 Facts and Figures briefing1.
Those councils with a higher proportion of high-band properties have remained at the higher end of the income range, and those with the lower proportion have remained at the lower end.
Unlike East Lothian, East Renfrewshire, East Dunbartonshire and Edinburgh, Midlothian was not one of the councils impacted the most by multiplier changes in 2017-18, but because of its decisions around Council Tax increases it has seen one of the highest increases to Council Tax revenue since 2016-17.
Some other councils with a lower impact from multiplier increases have also climbed up the income scale, suggesting they have made the most of the opportunities to increase income. These include Orkney, Clackmannanshire, and Moray.
Annex: Data
Table 1 - Additional allocations to local authorities as a result of COVID-19
| £m | 2020-21 Circular Final (Annexe B) | COVID 19 Barnett consequentials for local government | Local Authority Hardship Fund | Scottish Welfare Fund Top Up | Food Fund | Registrars of Death | Total additional CV-19 funding | Revised total funding , 2020-21 |
|---|---|---|---|---|---|---|---|---|
| Aberdeen City | 364.6 | 5.4 | 1.8 | 0.6 | 0.8 | 0.03 | 8.6 | 373.2 |
| Aberdeenshire | 460.2 | 7.5 | 2.4 | 0.5 | 1.0 | 0.03 | 11.4 | 471.6 |
| Angus | 220.2 | 3.4 | 1.1 | 0.4 | 0.6 | 0.01 | 5.5 | 225.6 |
| Argyll & Bute | 208.8 | 2.8 | 0.9 | 0.3 | 0.4 | 0.01 | 4.4 | 213.2 |
| Clackmannanshire | 103.0 | 1.4 | 0.5 | 0.2 | 0.3 | 0.01 | 2.5 | 105.5 |
| Dumfries & Galloway | 306.8 | 4.6 | 1.5 | 0.6 | 0.9 | 0.02 | 7.6 | 314.3 |
| Dundee City | 320.1 | 4.3 | 1.4 | 0.8 | 1.2 | 0.02 | 7.7 | 327.8 |
| East Ayrshire | 249.9 | 3.5 | 1.1 | 0.6 | 0.8 | 0.01 | 6.2 | 256.1 |
| East Dunbartonshire | 202.1 | 3.2 | 1.0 | 0.3 | 0.4 | 0.01 | 5.0 | 207.1 |
| East Lothian | 189.2 | 3.0 | 1.0 | 0.3 | 0.4 | 0.01 | 4.8 | 194.0 |
| East Renfrewshire | 191.3 | 3.1 | 1.0 | 0.2 | 0.3 | 0.01 | 4.6 | 195.9 |
| Edinburgh, City of | 799.6 | 12.1 | 3.9 | 1.5 | 1.7 | 0.06 | 19.3 | 818.8 |
| Eilean Siar | 99.8 | 1.2 | 0.4 | 0.1 | 0.1 | 0.00 | 1.8 | 101.6 |
| Falkirk | 308.2 | 4.5 | 1.4 | 0.6 | 0.9 | 0.02 | 7.4 | 315.7 |
| Fife | 702.4 | 10.6 | 3.4 | 1.5 | 2.3 | 0.04 | 17.8 | 720.2 |
| Glasgow City | 1,333.1 | 17.3 | 5.6 | 4.1 | 4.8 | 0.07 | 31.9 | 1,365.0 |
| Highland | 493.0 | 7.4 | 2.4 | 0.7 | 1.2 | 0.03 | 11.7 | 504.7 |
| Inverclyde | 177.6 | 2.3 | 0.7 | 0.4 | 0.6 | 0.01 | 4.1 | 181.7 |
| Midlothian | 178.9 | 2.6 | 0.8 | 0.3 | 0.4 | 0.01 | 4.2 | 183.1 |
| Moray | 173.6 | 2.6 | 0.9 | 0.3 | 0.4 | 0.01 | 4.2 | 177.8 |
| North Ayrshire | 296.7 | 4.1 | 1.3 | 0.8 | 1.0 | 0.02 | 7.3 | 304.0 |
| North Lanarkshire | 673.1 | 9.9 | 3.2 | 1.7 | 2.1 | 0.04 | 16.9 | 690.0 |
| Orkney | 78.2 | 1.1 | 0.4 | 0.0 | 0.1 | 0.00 | 1.6 | 79.8 |
| Perth & Kinross | 271.0 | 4.3 | 1.4 | 0.4 | 0.6 | 0.02 | 6.7 | 277.7 |
| Renfrewshire | 341.9 | 5.1 | 1.6 | 0.8 | 1.1 | 0.02 | 8.6 | 350.4 |
| Scottish Borders | 224.0 | 3.4 | 1.1 | 0.4 | 0.6 | 0.01 | 5.5 | 229.5 |
| Shetland | 90.0 | 1.2 | 0.4 | 0.0 | 0.1 | 0.00 | 1.7 | 91.7 |
| South Ayrshire | 217.4 | 3.3 | 1.1 | 0.5 | 0.6 | 0.01 | 5.4 | 222.8 |
| South Lanarkshire | 610.4 | 9.2 | 3.0 | 1.4 | 1.9 | 0.04 | 15.6 | 625.9 |
| Stirling | 183.5 | 2.7 | 0.9 | 0.3 | 0.4 | 0.01 | 4.3 | 187.8 |
| West Dunbartonshire | 203.0 | 2.7 | 0.9 | 0.5 | 0.7 | 0.01 | 4.8 | 207.8 |
| West Lothian | 344.5 | 5.2 | 1.7 | 0.7 | 1.0 | 0.02 | 8.7 | 353.2 |
| Scotland | 10,615.9 | 155.0 | 50.0 | 22.0 | 30.0 | 0.60 | 257.6 | 10,873.5 |
Table 2 - Council Tax, NDRI and Scottish Government Grant funding for local government, 2020-21, cash, after COVID-19 NDR adjustments
| £m, Cash | 2020-21 revenue funding less NDRI | 2020-21 NDRI* | 2020-21 Est Gross CT revenue | Total |
|---|---|---|---|---|
| Aberdeen City | 200.16 | 164.42 | 135.13 | 499.70 |
| Aberdeenshire | 380.08 | 80.11 | 152.32 | 612.51 |
| Angus | 202.42 | 17.77 | 55.79 | 275.97 |
| Argyll & Bute | 185.49 | 23.28 | 57.20 | 265.98 |
| Clackmannanshire | 92.25 | 10.76 | 26.80 | 129.80 |
| Dumfries & Galloway | 271.10 | 35.66 | 76.58 | 383.34 |
| Dundee City | 287.20 | 32.89 | 69.12 | 389.21 |
| East Ayrshire | 232.28 | 17.65 | 61.68 | 311.61 |
| East Dunbartonshire | 186.91 | 15.24 | 69.55 | 271.70 |
| East Lothian | 170.97 | 18.27 | 62.06 | 251.30 |
| East Renfrewshire | 181.32 | 9.96 | 58.21 | 249.49 |
| Edinburgh, City of | 560.65 | 238.92 | 310.40 | 1109.98 |
| Eilean Siar | 94.25 | 5.56 | 12.07 | 111.88 |
| Falkirk | 261.94 | 46.28 | 76.28 | 384.50 |
| Fife | 590.68 | 111.71 | 188.05 | 890.44 |
| Glasgow City | 1094.66 | 238.45 | 312.42 | 1645.53 |
| Highland | 400.71 | 92.30 | 136.71 | 629.72 |
| Inverclyde | 164.48 | 13.12 | 38.91 | 216.51 |
| Midlothian | 159.33 | 19.59 | 53.33 | 232.25 |
| Moray | 144.56 | 29.01 | 47.73 | 221.30 |
| North Ayrshire | 271.68 | 25.02 | 70.58 | 367.29 |
| North Lanarkshire | 601.73 | 71.36 | 150.13 | 823.22 |
| Orkney Islands | 71.16 | 7.02 | 10.31 | 88.49 |
| Perth & Kinross | 233.13 | 37.88 | 90.87 | 361.88 |
| Renfrewshire | 268.04 | 73.84 | 97.18 | 439.06 |
| Scottish Borders | 200.64 | 23.39 | 63.57 | 287.60 |
| Shetland Islands | 72.78 | 17.18 | 10.46 | 100.42 |
| South Ayrshire | 188.80 | 28.60 | 68.55 | 285.95 |
| South Lanarkshire | 384.18 | 226.18 | 157.33 | 767.68 |
| Stirling | 154.83 | 28.63 | 54.83 | 238.28 |
| West Dunbartonshire | 147.04 | 55.96 | 45.73 | 248.74 |
| West Lothian | 292.44 | 52.04 | 86.61 | 431.09 |
| Scotland | 8,747.89 | 1,868.03 | 2,906.52 | 13,522.43 |
Local Government Finance Circular 4/2020
Table 3 - Local Government funding from Scottish Government (real terms, 2020-21 prices) - annual change
| £m | Total revenue | Total capital | Total revenue + capital | LG Revenue annual % change | LG Total % annual change |
|---|---|---|---|---|---|
| 2013-14 | 11,040.1 | 624.2 | 11,664.3 | - | - |
| 2014-15 | 11,060.0 | 935.4 | 11,995.4 | 0.2% | 2.8% |
| 2015-16 | 11,096.8 | 946.5 | 12,043.3 | 0.3% | 0.4% |
| 2016-17 | 10,482.3 | 655.3 | 11,137.6 | -5.5% | -7.5% |
| 2017-18 | 10,243.5 | 834.8 | 11,078.3 | -2.3% | -0.5% |
| 2018-19 | 10,179.4 | 911.2 | 11,090.6 | -0.6% | 0.1% |
| 2019-20 | 10,522.4 | 1,113.7 | 11,636.1 | 3.4% | 4.9% |
| 2019-20 LGFO | 10,276.9 | 1,105.6 | 11,382.5 | - | - |
| 2020-21 LGFO | 10,667.8 | 778.1 | 11,446.0 | 3.8% | 0.6% |
Draft Budget 2017-18 (Table 1.01), Draft Budget 2018-19 (Table 1.02), Budget 2019-20 (Table 1.02), Budget 2020-21 (Table 1.02) Local Government Finance Circulars
Table 4 - Local Government funding from Scottish Government (cash terms) and percentage share
| Revenue | Capital | Total | ||||
|---|---|---|---|---|---|---|
| £m | LG total revenue | SG revenue Fiscal Resource Budget Limit + NDRI | LG total capital** | SG Capital Budget Limit | LG total | SG total |
| 2013-14 | 9,766.4 | 28,106.0 | 552.2 | 2,508.0 | 10,318.6 | 30,614.0 |
| 2014-15 | 9,920.6 | 28,457.5 | 839.0 | 2,690.0 | 10,759.7 | 31,147.5 |
| 2015-16 | 10,039.4 | 28,779.5 | 856.3 | 2,734.0 | 10,895.7 | 31,513.5 |
| 2016-17 | 9,707.9 | 28,856.5 | 606.9 | 2,891.0 | 10,314.8 | 31,747.5 |
| 2017-18 | 9,650.7 | 29,692.8 | 786.5 | 3,087.0 | 10,437.2 | 32,779.8 |
| 2018-19 | 9,795.0 | 29,619.0 | 876.8 | 3,520.0 | 10,671.8 | 33,139.0 |
| 2019-20 | 10,319.1 | 30,486.0 | 1,092.2 | 3,956.0 | 11,411.3 | 34,442.0 |
| 2019-20 LGFO | 10,078.4 | 31,623.0 | 1,084.2 | 3,956.0 | 11,162.6 | 35,579.0 |
| 2020-21 LGFO | 10,667.8 | 32,551.0 | 778.1 | 4,734.0 | 11,446.0 | 37,285.0 |
| % Change 2013-14 to 2019-20 | 5.7% | 8.5% | 97.8% | 57.7% | 10.6% | 12.5% |
| % Change 2019-21 to 2020-21 | 5.8% | 2.9% | -28.2% | 19.7% | 2.5% | 4.8% |
Draft Budget 2017-18 (Table 1.01), Draft Budget 2018-19 (Table 1.02), Budget 2019-20 (Table 1.02), Budget 2020-21 (Table 1.02) Local Government Finance Circulars
Table 5 - Local Government funding from Scottish Government (real terms, 2020-21 prices) and percentage share
| Revenue | Capital | Total | |||||
|---|---|---|---|---|---|---|---|
| £m | LG total revenue | SG Fiscal Resource Budget Limit | SG revenue Fiscal Resource Budget Limit + NDRI | LG total capital** | SG Capital Budget Limit | LG total | SG total |
| 2013-14 | 11,040.1 | 29,018.9 | 31,771.5 | 624.2 | 2,835.1 | 11,664.3 | 34,606.6 |
| 2014-15 | 11,060.0 | 28,772.1 | 31,725.8 | 935.4 | 2,998.9 | 11,995.4 | 34,724.8 |
| 2015-16 | 11,096.8 | 28,728.6 | 31,810.9 | 946.5 | 3,022.0 | 12,043.3 | 34,832.8 |
| 2016-17 | 10,482.3 | 28,168.9 | 31,158.2 | 655.3 | 3,121.6 | 11,137.6 | 34,279.8 |
| 2017-18 | 10,243.5 | 28,687.2 | 31,516.8 | 834.8 | 3,276.6 | 11,078.3 | 34,793.4 |
| 2018-19 | 10,179.4 | 28,042.0 | 30,781.5 | 911.2 | 3,658.2 | 11,090.6 | 34,439.6 |
| 2019-20 | 10,522.4 | 28,177.4 | 31,086.6 | 1,113.7 | 4,033.9 | 11,636.1 | 35,120.5 |
| 2019-20 LGFO | 10,276.9 | 29,336.8 | 32,246.0 | 1,105.6 | 4,033.9 | 11,382.5 | 36,279.9 |
| 2020-21 LGFO | 10,667.8 | 29,711.0 | 32,551.0 | 778.1 | 4,734.0 | 11,446.0 | 37,285.0 |
| % Change 2013-14 to 2019-20 | -4.7% | -2.9% | -2.2% | 78.4% | 42.3% | -0.2% | 1.5% |
| % Change 2019-20 to 2020-21 | 3.8% | 1.3% | 0.9% | -29.6% | 17.4% | 0.6% | 2.8% |
Draft Budget 2017-18 (Table 1.01), Draft Budget 2018-19 (Table 1.02), Budget 2019-20 (Table 1.02), Budget 2020-21 (Table 1.02) Local Government Finance Circulars. HM Treasury Deflators April 2020.
Table 6 - Local government and Scottish Government revenue budgets, real terms (2020-21) changes over time
| SG, compared to 2013-14 | Annual change against previous year | LG, compared to 2013-14 | Annual change against previous year | Percentage points difference since 2013-14 | |
|---|---|---|---|---|---|
| 2014-15 | -0.1% | -0.1% | 0.2% | 0.2% | 0.3% |
| 2015-16 | 0.1% | 0.3% | 0.5% | 0.3% | 0.4% |
| 2016-17 | -1.9% | -2.1% | -5.1% | -5.5% | -3.1% |
| 2017-18 | -0.8% | 1.2% | -7.2% | -2.3% | -6.4% |
| 2018-19 | -3.1% | -2.3% | -7.8% | -0.6% | -4.7% |
| 2019-20 | -2.2% | 1.0% | -4.7% | 3.4% | -2.5% |
Draft Budget 2017-18 (Table 1.01), Draft Budget 2018-19 (Table 1.02), Budget 2019-20 (Table 1.02), Budget 2020-21 (Table 1.02) Local Government Finance Circulars. HM Treasury Deflators April 2020.
Table 7 - Local government, % of funds ring-fenced, 2013-14 and 2020-21
| 2013-14 | 2020-21 | |||||
|---|---|---|---|---|---|---|
| £m | Total Revenue | Ring-fenced funds | % of funding ring-fenced | Total Revenue | Ring-fenced funds | % of funding ring-fenced |
| Aberdeen City | 320.4 | 0.6 | 0.2% | 364.6 | 29.7 | 8.1% |
| Aberdeenshire | 397.9 | 0.1 | 0.0% | 460.2 | 31.3 | 6.8% |
| Angus | 197.9 | 0.0 | 0.0% | 220.2 | 12.7 | 5.8% |
| Argyll & Bute | 204.6 | 0.4 | 0.2% | 208.8 | 11.7 | 5.6% |
| Clackmannanshire | 93.0 | - | 0.0% | 103.0 | 6.8 | 6.6% |
| Dumfries & Galloway | 287.5 | 0.1 | 0.0% | 306.8 | 15.7 | 5.1% |
| Dundee City | 285.0 | 0.1 | 0.0% | 320.1 | 23.0 | 7.2% |
| East Ayrshire | 221.8 | 0.5 | 0.2% | 249.9 | 17.5 | 7.0% |
| East Dunbartonshire | 177.5 | 0.1 | 0.0% | 202.1 | 12.1 | 6.0% |
| East Lothian | 165.5 | - | 0.0% | 189.2 | 13.5 | 7.1% |
| East Renfrewshire | 171.6 | 0.2 | 0.1% | 191.3 | 7.8 | 4.1% |
| Edinburgh, City of | 731.2 | 0.5 | 0.1% | 799.6 | 57.0 | 7.1% |
| Eilean Siar | 103.8 | 1.0 | 1.0% | 99.8 | 4.3 | 4.4% |
| Falkirk | 271.9 | 1.1 | 0.4% | 308.2 | 23.0 | 7.4% |
| Fife | 620.1 | 0.5 | 0.1% | 702.4 | 47.4 | 6.7% |
| Glasgow City | 1,240.0 | 1.0 | 0.1% | 1,333.1 | 88.1 | 6.6% |
| Highland | 446.6 | 1.0 | 0.2% | 493.0 | 30.7 | 6.2% |
| Inverclyde | 165.3 | 0.5 | 0.3% | 177.6 | 11.5 | 6.5% |
| Midlothian | 148.3 | - | 0.0% | 178.9 | 15.1 | 8.5% |
| Moray | 151.7 | 0.5 | 0.3% | 173.6 | 11.9 | 6.9% |
| North Ayrshire | 263.0 | 0.5 | 0.2% | 296.7 | 19.6 | 6.6% |
| North Lanarkshire | 613.0 | 0.3 | 0.0% | 673.1 | 47.4 | 7.0% |
| Orkney Islands | 68.0 | - | 0.0% | 78.2 | 8.0 | 10.2% |
| Perth & Kinross | 242.2 | 0.4 | 0.2% | 271.0 | 15.5 | 5.7% |
| Renfrewshire | 305.5 | 0.5 | 0.2% | 341.9 | 26.5 | 7.7% |
| Scottish Borders | 202.7 | 0.0 | 0.0% | 224.0 | 13.9 | 6.2% |
| Shetland Islands | 87.9 | 1.3 | 1.4% | 90.0 | 8.2 | 9.1% |
| South Ayrshire | 197.0 | 0.2 | 0.1% | 217.4 | 12.4 | 5.7% |
| South Lanarkshire | 555.9 | 1.5 | 0.3% | 610.4 | 40.1 | 6.6% |
| Stirling | 162.5 | 0.6 | 0.4% | 183.5 | 13.0 | 7.1% |
| West Dunbartonshire | 186.4 | 0.0 | 0.0% | 203.0 | 13.1 | 6.5% |
| West Lothian | 297.7 | - | 0.0% | 344.5 | 21.1 | 6.1% |
| Scotland | 9,583.1 | 13.5 | 0.1% | 10,615.9 | 709.7 | 6.7% |
Local Government Finance Circular 2/2013, Annex B, Columns 7 and 13, and Local Government Finance Circular 2/2020, Annex B, Columns 7 and 12.
Table 8 - Local government funding per head; changes 2013-14 to 2020-21, real terms (2020-21 prices)
| Total Revenue Per Head | Funding change, £m | Funding change, % | Population change | Population change, % | Per head change, £ | Scottish average, percentage points change |
|---|---|---|---|---|---|---|
| Aberdeen City | 2.4 | 1% | 3,760 | 1.7% | -16 | 3.1% |
| Aberdeenshire | 10.5 | 2% | 5,650 | 2.2% | 2 | 4.3% |
| Angus | -3.5 | -2% | - 20 | 0.0% | -30 | 3.1% |
| Argyll & Bute | -22.5 | -10% | - 1,040 | -1.2% | -230 | -5.4% |
| Clackmannanshire | -2.1 | -2% | 260 | 0.5% | -52 | 2.3% |
| Dumfries & Galloway | -18.2 | -6% | - 1,980 | -1.3% | -94 | 0.4% |
| Dundee City | -2.1 | -1% | 1,540 | 1.0% | -37 | 3.4% |
| East Ayrshire | -0.8 | 0% | - 720 | -0.6% | 6 | 5.2% |
| East Dunbartonshire | 1.5 | 1% | 2,760 | 2.6% | -34 | 2.8% |
| East Lothian | 2.1 | 1% | 6,230 | 6.2% | -88 | -0.1% |
| East Renfrewshire | -2.7 | -1% | 4,490 | 4.9% | -129 | -1.5% |
| Edinburgh, City of | -27.0 | -3% | 42,300 | 8.8% | -190 | -5.6% |
| Eilean Siar | -17.5 | -15% | - 840 | -3.0% | -522 | -16.6% |
| Falkirk | 0.9 | 0% | 4,090 | 2.6% | -44 | 2.5% |
| Fife | 1.5 | 0% | 7,340 | 2.0% | -34 | 2.9% |
| Glasgow City | -68.6 | -5% | 38,050 | 6.4% | -250 | -7.2% |
| Highland | -11.8 | -2% | 2,940 | 1.3% | -77 | 1.3% |
| Inverclyde | -9.2 | -5% | - 2,890 | -3.6% | -33 | 3.9% |
| Midlothian | 11.3 | 7% | 8,220 | 9.8% | -54 | 2.0% |
| Moray | 2.1 | 1% | 2,890 | 3.1% | -34 | 2.7% |
| North Ayrshire | -0.6 | 0% | - 2,830 | -2.1% | 41 | 7.3% |
| North Lanarkshire | -19.8 | -3% | 3,480 | 1.0% | -79 | 0.9% |
| Orkney | 1.3 | 2% | 740 | 3.4% | -59 | 5.6% |
| Perth & Kinross | -2.8 | -1% | 4,210 | 2.8% | -70 | 0.9% |
| Renfrewshire | -3.5 | -1% | 4,800 | 2.8% | -73 | 1.0% |
| Scottish Borders | -5.1 | -2% | 1,790 | 1.6% | -75 | 1.0% |
| Shetland | -9.4 | -9% | - 290 | -1.2% | -355 | -8.0% |
| South Ayrshire | -5.3 | -2% | - 310 | -0.3% | -42 | 2.6% |
| South Lanarkshire | -18.0 | -3% | 6,200 | 2.0% | -95 | -0.1% |
| Stirling | -0.3 | 0% | 3,200 | 3.5% | -71 | 1.2% |
| West Dunbartonshire | -7.7 | -4% | - 1,410 | -1.6% | -49 | 3.1% |
| West Lothian | 8.0 | 2% | 7,090 | 4.0% | -30 | 3.0% |
| Scotland | -217.0 | -2% | 149,700 | 2.8% | -96 | 0.0% |
Local Government Finance Circulars, NRS Mid-Year Population Estimates, HM Treasury deflators April 2020
Table 9 - Council Tax income and Non-Domestic Rates income
| Year | Council tax income (excluding CTB, and ignoring income foregone due to CTR) (£m) | NDR income |
|---|---|---|
| 2010-11 | 1,923 | 2,138 |
| 2011-12 | 1,926 | 2,251 |
| 2012-13 | 1,947 | 2,347 |
| 2013-14 | 1,978 | 2,367 |
| 2014-15 | 2,022 | 2,511 |
| 2015-16 | 2,055 | 2,579 |
| 2016-17 | 2,091 | 2,731 |
| 2017-18 | 2,278 | 2,762 |
| 2018-19 | 2,376 | 2,847 |
Scottish Government Local Government Finance Statistics.
All NDR income figures, including 2018-19, are the final audited income collected by councils, and paid to SG. These figures are net of reliefs awarded by the SG, but gross of any local reliefs, or top-ups to discretionary reliefs that the councils award themselves. Council Tax figures are also final audited figures.
Table 10 - Council Tax, NDRI and Scottish Government Grant funding for local government, 2020-21, cash
| £m, Cash | 2020-21 revenue funding less NDRI | 2020-21 NDRI* | 2020-21 Est gross CT revenue | Total |
|---|---|---|---|---|
| Aberdeen City | 114.61 | 249.96 | 135.13 | 499.70 |
| Aberdeenshire | 338.39 | 121.80 | 152.32 | 612.51 |
| Angus | 193.17 | 27.01 | 55.79 | 275.97 |
| Argyll & Bute | 173.38 | 35.40 | 57.20 | 265.98 |
| Clackmannanshire | 86.65 | 16.36 | 26.80 | 129.80 |
| Dumfries & Galloway | 252.55 | 54.21 | 76.58 | 383.34 |
| Dundee City | 270.09 | 50.00 | 69.12 | 389.21 |
| East Ayrshire | 223.09 | 26.84 | 61.68 | 311.61 |
| East Dunbartonshire | 178.98 | 23.17 | 69.55 | 271.70 |
| East Lothian | 161.46 | 27.78 | 62.06 | 251.30 |
| East Renfrewshire | 176.14 | 15.14 | 58.21 | 249.49 |
| Edinburgh, City of | 436.34 | 363.24 | 310.40 | 1109.98 |
| Eilean Siar | 91.35 | 8.46 | 12.07 | 111.88 |
| Falkirk | 237.86 | 70.36 | 76.28 | 384.50 |
| Fife | 532.56 | 169.83 | 188.05 | 890.44 |
| Glasgow City | 970.59 | 362.51 | 312.42 | 1645.53 |
| Highland | 352.69 | 140.32 | 136.71 | 629.72 |
| Inverclyde | 157.66 | 19.94 | 38.91 | 216.51 |
| Midlothian | 149.14 | 29.78 | 53.33 | 232.25 |
| Moray | 129.47 | 44.10 | 47.73 | 221.30 |
| North Ayrshire | 258.67 | 38.03 | 70.58 | 367.29 |
| North Lanarkshire | 564.60 | 108.49 | 150.13 | 823.22 |
| Orkney Islands | 67.51 | 10.67 | 10.31 | 88.49 |
| Perth & Kinross | 213.42 | 57.58 | 90.87 | 361.88 |
| Renfrewshire | 229.62 | 112.26 | 97.18 | 439.06 |
| Scottish Borders | 188.47 | 35.56 | 63.57 | 287.60 |
| Shetland Islands | 63.84 | 26.12 | 10.46 | 100.42 |
| South Ayrshire | 173.91 | 43.48 | 68.55 | 285.95 |
| South Lanarkshire | 266.49 | 343.86 | 157.33 | 767.68 |
| Stirling | 139.94 | 43.52 | 54.83 | 238.28 |
| West Dunbartonshire | 117.92 | 85.08 | 45.73 | 248.74 |
| West Lothian | 265.36 | 79.12 | 86.61 | 431.09 |
| Scotland | 7,775.92 | 2,840.00 | 2,906.52 | 13,522.43 |
Local Government Finance Circular 2/2020
*Distribution figures as set out in Local Government Finance Circular
** Based on Est. 2019-20 Gross revenue (provided by Scottish Government from CTAXBASE) with individual % increased made by local authorities in 2020-21 applied
Table 11- Changes to Council Tax revenue, 2016-17 to 2020-21
| £m | Gross CT revenue 2016/17 (Sep 16 est) | Est gross CT revenue 2020-21 | Difference 2016-17 to 2020-21 | % Difference 2016-2017 to 2020-21 |
|---|---|---|---|---|
| Aberdeen City | 112.1 | 135.13 | 23.0 | 20.6% |
| Aberdeenshire | 122.4 | 152.32 | 29.9 | 24.5% |
| Angus | 46.9 | 55.79 | 8.9 | 19.0% |
| Argyll & Bute | 46.1 | 57.20 | 11.2 | 24.2% |
| Clackmannanshire | 22.1 | 26.80 | 4.7 | 21.3% |
| Dumfries & Galloway | 62.7 | 76.58 | 13.9 | 22.2% |
| Dundee City | 59.0 | 69.12 | 10.1 | 17.2% |
| East Ayrshire | 50.8 | 61.68 | 10.9 | 21.5% |
| East Dunbartonshire | 54.7 | 69.55 | 14.8 | 27.1% |
| East Lothian | 47.6 | 62.06 | 14.4 | 30.3% |
| East Renfrewshire | 45.6 | 58.21 | 12.6 | 27.7% |
| Edinburgh, City of | 243.7 | 310.40 | 66.7 | 27.4% |
| Eilean Siar | 10.2 | 12.07 | 1.9 | 18.4% |
| Falkirk | 62.2 | 76.28 | 14.1 | 22.6% |
| Fife | 153.9 | 188.05 | 34.2 | 22.2% |
| Glasgow City | 260.4 | 312.42 | 52.0 | 20.0% |
| Highland | 112.0 | 136.71 | 24.7 | 22.0% |
| Inverclyde | 33.8 | 38.91 | 5.1 | 15.1% |
| Midlothian | 41.2 | 53.33 | 12.1 | 29.4% |
| Moray | 38.6 | 47.73 | 9.1 | 23.7% |
| North Ayrshire | 58.4 | 70.58 | 12.2 | 21.0% |
| North Lanarkshire | 127.8 | 150.13 | 22.4 | 17.5% |
| Orkney Islands | 8.4 | 10.31 | 1.9 | 23.1% |
| Perth & Kinross | 73.0 | 90.87 | 17.9 | 24.5% |
| Renfrewshire | 79.5 | 97.18 | 17.7 | 22.3% |
| Scottish Borders | 50.8 | 63.57 | 12.8 | 25.1% |
| Shetland Islands | 8.8 | 10.46 | 1.6 | 18.4% |
| South Ayrshire | 54.6 | 68.55 | 13.9 | 25.5% |
| South Lanarkshire | 133.1 | 157.33 | 24.2 | 18.2% |
| Stirling | 44.5 | 54.83 | 10.3 | 23.1% |
| West Dunbartonshire | 39.8 | 45.73 | 6.0 | 15.0% |
| West Lothian | 71.1 | 86.61 | 15.5 | 21.8% |
| Scotland | 2,375.6 | 2,906.52 | 530.9 | 22.3% |
CTAXBASE September 2016, September 2019
Abbreviations and Glossary
Various abbreviations are used throughout this briefing. A key is set out below.
CT - Council Tax
CTB - Council Tax Benefits
CTR - Council Tax Reduction
DEL - Departmental Expenditure Limit
LG - Local Government
LGFO - Local Government Finance Order
NDR - Non-Domestic Rates
NDRI - Non-Domestic Rates Income
OT - Outturn
SFC - Scottish Fiscal Commission
SG - Scottish Government
Local Government Glossary
CAPITAL EXPENDITURE
Spending which creates longer-term assets, whose benefits will last over a period of years such as spending on the purchase, construction or improvement of land or buildings. Local authorities‘ receive a capital grant from the Scottish Government whilst local authorities wider capital expenditure is governed by the prudential borrowing code.
COUNCIL TAX
System of local taxation introduced in April 1993. It is a property tax levied on homes by local authorities. The amount levied is determined by placement of residences within 8 valuation bands (A-H). There are exemptions for specific types of property and discounts for people in certain circumstances. Council Tax exemptions are applied according to a property's circumstances rather than its type e.g. empty, under repair, occupied by students, occupier is detained. Council tax status discounts are applied to household liability depending on the status and number of adult residents.
NON-DOMESTIC RATES (NDR) AND NON-DOMESTIC RATES INCOME (NDRI)
Non-Domestic Rates are collected by all 32 authorities on the basis of a national poundage rate set by the Scottish Government, paid into a central pool and with effect from 1 April 2012, redistributed to councils based on how much each local authority is expected to collect. The amounts estimated to be available for distribution from the pool each year depends on forecasts of gross rate yield losses from appeals and adjustments from previous years. Adjustments are made, either up or down, to the level of General Revenue Grant to reflect variations between the estimated Non Domestic Rates Income and the actual amount collected, so the amount collected by an individual authority has no direct impact on its revenue funding allocations.
REVENUE EXPENDITURE
Recurring expenditure that is financed from current income (i.e. not through borrowing). It consists of the day to day running costs of a local authority including staff wages and salaries. Loan charges, repaying money borrowed for capital expenditure, are also part of revenue expenditure.
GENERAL REVENUE GRANT (GRG)
The largest element of Scottish Government support for local authority revenue expenditure. The level of GRG is determined by Scottish Ministers following consultation with local authorities through COSLA, and after taking advice from the Settlement and Distribution Group (which consists of Scottish Government and COSLA officials). The Local Government Finance (Scotland) Order, specifying levels of GRG, is laid before the Parliament annually for approval.
SPECIFIC GRANTS
Part of the Scottish Government‘s support to local authorities. These grants provide the funding for specific services including the police, some mental health services and the education excellence fund. Specific grants‘ are monies that are allocated to local authorities for specific policy purposes. Since the introduction of the Concordat in November 2007, and the consequent more away from ring-fencing, the amount of monies paid out as specific grants has reduced considerably. At present, over 97% of these specific grants support local authority expenditure on police.
TOTAL REVENUE SUPPORT
Total Revenue Support, previously termed ‗Aggregate External Finance, is the Scottish Government grant distributed to local authorities. Government. It comprises General Revenue Grant, previously termed Revenue Support Grant (RSG), distribution of non-domestic rate income (NDRI) and specific grants which fund part of the current expenditure on a specific service or activity.
Related Briefings
SB 16/28 - Scottish Government proposals for Council Tax reform
SB 18/60 - Local Government Finance: The Funding Formula and local taxation income
SB 18/82 - Pro-poor or pro-rich? The social impact of local government budgets, 2016 to 2019
SB 19/45 - Local Government Finance: Facts and Figures 2013-14 to 2019-20
SB 20/12 - Scottish Budget 2020-21
SB 20/16 - Local Government Finance: Budget 2020-21 and provisional allocations to local authorities
Sources
Burn-Murdoch, A. (2017, June 21). Local Government finance: facts and figures 2011-12 to 2017-18. Retrieved from <a href="https://digitalpublications.parliament.scot/ResearchBriefings/Report/2017/6/21/Local-Government-Finance--facts-and-figures-2010-11-to-2017-18#" target="_blank">https://digitalpublications.parliament.scot/ResearchBriefings/Report/2017/6/21/Local-Government-Finance--facts-and-figures-2010-11-to-2017-18#</a> [accessed 23 November 2017]
Burn-Murdoch, A. (2018, May 21). Local government finance: facts and figures 2013-14 to 2018-19. Retrieved from <a href="https://digitalpublications.parliament.scot/ResearchBriefings/Report/2018/5/21/Local-Government-Finance--facts-and-figures-2013-14-to-2018-19#" target="_blank">https://digitalpublications.parliament.scot/ResearchBriefings/Report/2018/5/21/Local-Government-Finance--facts-and-figures-2013-14-to-2018-19#</a> [accessed 11 June 2018]
Local Government and Communities Committee 15 May 2020 [Draft], Aileen Campbell, contrib. 9, <a href="http://www.scottish.parliament.uk/parliamentarybusiness/report.aspx?r=12644&c=2256210" target="_blank">http://www.scottish.parliament.uk/parliamentarybusiness/report.aspx?r=12644&c=2256210</a>
Scottish Parliament Information Centre. (2020, February 10). SPICe Briefing 20-12: Scottish Budget 2020-21. Retrieved from <a href="https://digitalpublications.parliament.scot/ResearchBriefings/Report/2020/2/10/Scottish-Budget-2020-21" target="_blank">https://digitalpublications.parliament.scot/ResearchBriefings/Report/2020/2/10/Scottish-Budget-2020-21</a> [accessed 12 February 2020]
Accounts Commission. (2019, March 21). Local government in Scotland: Challenges and performance 2019. Retrieved from <a href="http://www.cosla.gov.uk/system/files/private/fairfundingforessentialservices2019-20.pdf" target="_blank">http://www.cosla.gov.uk/system/files/private/fairfundingforessentialservices2019-20.pdf</a> [accessed 21 June 2019]
COSLA. (2019, March 28). Correspondence from the COSLA Resources Spokesperson to the Convener. Retrieved from <a href="https://www.parliament.scot/S5_Local_Gov/Inquiries/20190328_Budget_COSLAToConvener.pdf" target="_blank">https://www.parliament.scot/S5_Local_Gov/Inquiries/20190328_Budget_COSLAToConvener.pdf</a> [accessed 19 May 2020]
COSLA. (2020, February 6). The budget reality is that a crisis still remains. Retrieved from <a href="https://www.cosla.gov.uk/news/february-2020/the-budget-reality-is-that-a-crisis-remains" target="_blank">https://www.cosla.gov.uk/news/february-2020/the-budget-reality-is-that-a-crisis-remains</a> [accessed 19 May 2020]
Scottish Government. (2019, February 8). Correspondence from the Cabinet Secretary for Finance, Economy and Fair Work and the Cabinet Secretary for Communities and Local Government to the Convener. Retrieved from <a href="https://www.parliament.scot/S5_Local_Gov/Inquiries/20190208_Budget_CabSecFEFW_CabSecLGCToConvener.pdf" target="_blank">https://www.parliament.scot/S5_Local_Gov/Inquiries/20190208_Budget_CabSecFEFW_CabSecLGCToConvener.pdf</a> [accessed 19 May 2020]
Campbell, A., Burn-Murdoch, A., & Finnigan, K. (2020, February 14). LOCAL GOVERNMENT FINANCE: BUDGET 2020-21 AND PROVISIONAL ALLOCATIONS TO LOCAL AUTHORITIES. Retrieved from <a href="https://digitalpublications.parliament.scot/ResearchBriefings/Report/2020/2/14/Local-Government-Finance--Budget-2020-21-and-provisional-allocations-to-local-authorities" target="_blank">https://digitalpublications.parliament.scot/ResearchBriefings/Report/2020/2/14/Local-Government-Finance--Budget-2020-21-and-provisional-allocations-to-local-authorities</a> [accessed 12 May 2020]
Berthier, A., Burn-Murdoch, A., Aiton, A., & Finnigan, K. (2018, November 9). Local Government Finance: The funding formula and local taxation income. Retrieved from <a href="https://digitalpublications.parliament.scot/ResearchBriefings/Report/2018/11/9/Local-Government-finance--the-Funding-Formula-and-local-taxation-income#" target="_blank">https://digitalpublications.parliament.scot/ResearchBriefings/Report/2018/11/9/Local-Government-finance--the-Funding-Formula-and-local-taxation-income#</a> [accessed 28 November 2018]
Burn-Murdoch, A., Campbell, A., Aiton, A., & Finnigan, K. (2018, December 19). Local Government Finance: Budget 2019-20 and provisional allocations to local authorities. Retrieved from <a href="https://digitalpublications.parliament.scot/ResearchBriefings/Report/2018/12/19/Local-Government-Finance--Budget-2019-20-and-provisional-allocations-to-local-authorities#Real-terms-change--2018-19-to-2019-20--excluding-ring-fenced-grants" target="_blank">https://digitalpublications.parliament.scot/ResearchBriefings/Report/2018/12/19/Local-Government-Finance--Budget-2019-20-and-provisional-allocations-to-local-authorities#Real-terms-change--2018-19-to-2019-20--excluding-ring-fenced-grants</a> [accessed 26 June 2019]